the Creative Commons Attribution 4.0 License.
the Creative Commons Attribution 4.0 License.
 | 20 Sep 2024
Exploring non-soluble particles in hailstones through innovative confocal laser and scanning electron microscopy techniques
Angela K. Rowe
Lucia E. Arena
William O. Nachlas
Maria L. Asar
This paper introduces an innovative microscopy analysis methodology to preserve in situ non-soluble particles within hailstones using a protective porous plastic coating, overcoming previous limitations related to melting the hailstone sample. The method is composed of two techniques: trapping non-soluble particles beneath a plastic coat using the adapted sublimation technique and then analyzing the particles individually with confocal laser scanning microscopy (CLSM) and scanning electron microscopy with energy-dispersive spectroscopy (SEM–EDS). CLSM provides insights into physical attributes like particle size and surface topography, enhancing our understanding of ice nucleation. SEM–EDS complement CLSM by offering detailed information on individual particle elemental chemistry, enabling classification based on composition. Strategies to reduce background noise from glass substrates during EDS spectral analysis are proposed. By combining powerful, high-resolution microscopy techniques, this methodology provides valuable data on hailstone composition and properties. This information can give insights into hail developmental processes by enhancing our understanding of the role of atmospheric particles.
- Article
(15372 KB) - Full-text XML
- BibTeX
- EndNote


The analysis of hailstone samples has been a subject of increasing interest owing to its potential to provide valuable insights into microphysics and the development of hailstorms (Jeong et al., 2020; Soderholm and Kumjian, 2023; Wang et al., 2023). Consider a hailstone a miniature chronicle of time that preserves a rich history of its formation and growth within its crystalline structure. Understanding hailstones' microphysics and developmental processes is crucial for improving weather forecasting, mitigation strategies, and climate change modeling (Cintineo et al., 2020; Malečić et al., 2022; Wu et al., 2022; Jiang et al., 2023). Atmospheric particles play a crucial role in hailstone microphysics. Particles may be ingested into convective-cloud updrafts, serving as cloud condensation nuclei (CCN) or ice-nucleating particles (INPs), which are necessary to form hydrometeors like cloud droplets and ice crystals that are essential for hail formation. Furthermore, hailstones can accumulate particles from the surrounding environment in the cloud during their growth, which could have sizes larger than those that serve as CCN and INPs and would provide information about the source environments involved in hail formation. Particle size and chemical composition are essential to quantify because they influence the nucleation efficiency and growth rate within hailstones. Characterizing these particles allows us to reconstruct their potential influence on hailstone properties, such as fall speed rates and growth regimes, furthering our understanding of hail formation and its complex interplay with atmospheric conditions.
Previous studies have investigated hailstone composition and properties using various techniques to determine their chemical constituents. For example, Šantl-Temkiv et al. (2013) analyzed hailstones from a thunderstorm in Slovenia, focusing on determining dissolved organic carbon and total dissolved nitrogen in hailstones with a total nitrogen module. They also characterized dissolved organic matter through ultrahigh-resolution mass spectrometry that looked into the molecular complexity of hailstones. Overall, they noted a strong link to the local environment, particularly the hailstones' bacterial content, emphasizing a soil-driven origin for aerosol particles. More recently, Kozjek et al. (2023) expanded the analysis of hail in Slovenia by identifying fibrous and abiotic particles within melted hailstones.
Similarly, Li et al. (2018) examined constituents in melted hailstones. In their study, concentrations of 10 ions and 6 environmental pollutants were compared with the aerosol optical depth retrieved from the Moderate Resolution Imaging Spectroradiometer (MODIS) for 15 hailstorm events in China. They found that particulate matter with an aerodynamic diameter <10 µm (PM10) was the most likely source of the water-soluble ions, although with considerable variability between hailstones. These PM10 particles are usually condensed below the cloud base and lifted higher through the updraft, highlighting a link to a terrestrial source. The concentration of water-soluble ions, metals, and metalloids in hailstones was investigated for the first time in South America by Beal et al. (2021), who analyzed hailstone samples from the triple border of Paraná, Brazil, and Argentina using ion chromatography and inductively coupled plasma mass spectrometry. That study's cleaning procedure efficiently removed potential chemical contaminants from hailstones by following procedures defined by Christner et al. (2005). They found that Ca2+ was the most abundant ion in their samples and interpreted it to be related to agricultural activities of non-local regions through long-distance transport. However, in their work, as in the aforementioned studies, these approaches rely on the melting of the hailstones, which obscures the spatial distribution of non-soluble particles within the hailstone.
Michaud et al. (2014) took an approach that constrained their analysis to the hailstone's embryo, focusing on three hail-producing storms in the Rocky Mountains of the USA. They utilized stable-isotope analysis to estimate in situ temperatures during freezing and examined particle elemental compositions collected from hailstone embryos through scanning electron microscopy. Similar to Beal et al. (2021), their study followed hailstone cleaning procedures defined by Christner et al. (2005), scraping the outermost layer with a sterile razor blade rinse with 95 % ethanol and then melting it so that it could be filtered onto a 13 mm diameter 0.2 µm polytetrafluorethylene membrane filter for elemental analysis. Their study focused on melting and filtering hailstone particles larger than 0.2 µm because of their interest in studying ice nucleation by immersion. They found that their hailstone embryos contained biological INPs that can freeze water at relatively warm subzero temperatures, suggesting that biological particles have the potential to serve as nucleation sites for hailstone formation.
In the literature discussed previously, hailstones were melted to study soluble compounds or particles, and in the case of Michaud et al. (2014), they used filters to separate the particles. A new method, derived from particle separation by adapted sublimation (Arena, 2024), is described here to remove the need to melt the hailstone for microscopy analysis while retaining the particle's position within the hailstone. This new method, therefore, allows the analysis of non-soluble particles within the hailstone sample, preserving all biological and non-biological particles without a maximum size restriction to provide a representative particle distribution in the hailstone. This approach allows microscopy techniques to be employed, as detailed below, enabling the characterization of non-soluble particles physically (particle size and surface topography) and chemically (inferred from elements within the individual particles). This information can be used to improve our understanding of the distribution of particles within hailstones as a factor that influences the growth during the cloud droplets' initial stages of ice nucleation and subsequent hail growth.
2.1 Confocal laser scanning microscope (CLSM)
Confocal microscopy is a high-resolution optical imaging technique that uses a diffraction-limited spot to produce a point source of light and reject out-of-focus light, allowing for imaging of deep tissues and 3-D reconstructions of imaged samples (Mercer, 2005; Turner et al., 2001; Liu et al., 2011; Anderson, 2014; Wang and Larina, 2017; Elliott, 2020; Claxton et al., 2006). A modern confocal microscope includes pinholes, objective lenses, low-noise detectors, fast-scanning mirrors, filters for wavelength selection, and laser illumination (Elliott, 2020). Confocal microscopy has been extensively utilized in various disciplines, including supramolecular chemistry (e.g., Kubota et al., 2020), biology (e.g., Claxton et al., 2006), and materials science (e.g., Schnell et al., 2019), due to its high-resolution imaging capabilities. In particular, it is extensively used for studying the intricate structures and functions of biological specimens (O'Connor, 1996; Kaye et al., 2015; Fu et al., 2021). This technique offers several advantages over conventional widefield optical microscopy, including the ability to control the depth of field, elimination of or reduction in the background signal away from the focal plane, and the capacity to collect serial optical sections from thick specimens (Mercer, 2005; Turner et al., 2001; Liu et al., 2011; Anderson, 2014; Wang and Larina, 2017; Elliott, 2020; Claxton et al., 2006). CLSM is, therefore, a powerful tool for analyzing non-soluble particles due to its capacity to acquire three-dimensional images to determine the particle size distribution and particle surface information.
2.2 Scanning electron microscopy (SEM) and energy-dispersive X-ray spectroscopy (EDS)
Scanning electron microscopy (SEM) and energy-dispersive X-ray spectroscopy (EDS) are techniques often used together to analyze the surface of a sample. Both techniques and principles are based on the interaction of electrons with different types of matter. SEM works by scanning a focused beam of electrons onto a sample, inducing the emission of secondary electrons and backscattered electrons. These electrons can be detected and used to create a high-resolution image of a surface. SEM has extensive applications across various scientific disciplines, such as materials science (e.g., Zhang et al., 2020), geology and planetary science (e.g., Gu et al., 2020), and biology (e.g., Koga et al., 2021). Renowned for its capability to provide high-resolution imaging (e.g., Fig. 1) at scales as fine as 50 nm (e.g., Vander Wood, 2017), SEM has proven invaluable in diverse fields, including hailstone analysis (Michaud et al., 2014). Its imaging capabilities make SEM particularly well suited for investigating the morphology and texture of solid materials, allowing for a detailed analysis of surface features. EDS, on the other hand, is a technique that allows the analysis of the elemental composition of a sample. It works by detecting characteristic X-rays emitted from the sample when bombarded with a beam of electrons. Each element has a unique set of peaks on its electromagnetic emission spectrum, which allows the identification of the chemical elements present in the sample (e.g., Goldstein et al., 2017; Raja and Barron, 2016). Both techniques have been widely used in materials science, particle analysis (e.g., ice-nucleating, in-snow, and dust particles), and other fields to study the surface of samples and analyze their chemical composition (e.g., Krueger et al., 2004; Bern et al., 2009; Ketterer, 2010; Nam and Lee, 2013; Farber, 2019; Raval et al., 2019; Wagner et al., 2019; Brostrøm et al., 2020; Sanchez-Marroquin et al., 2020; Rausch et al., 2022).
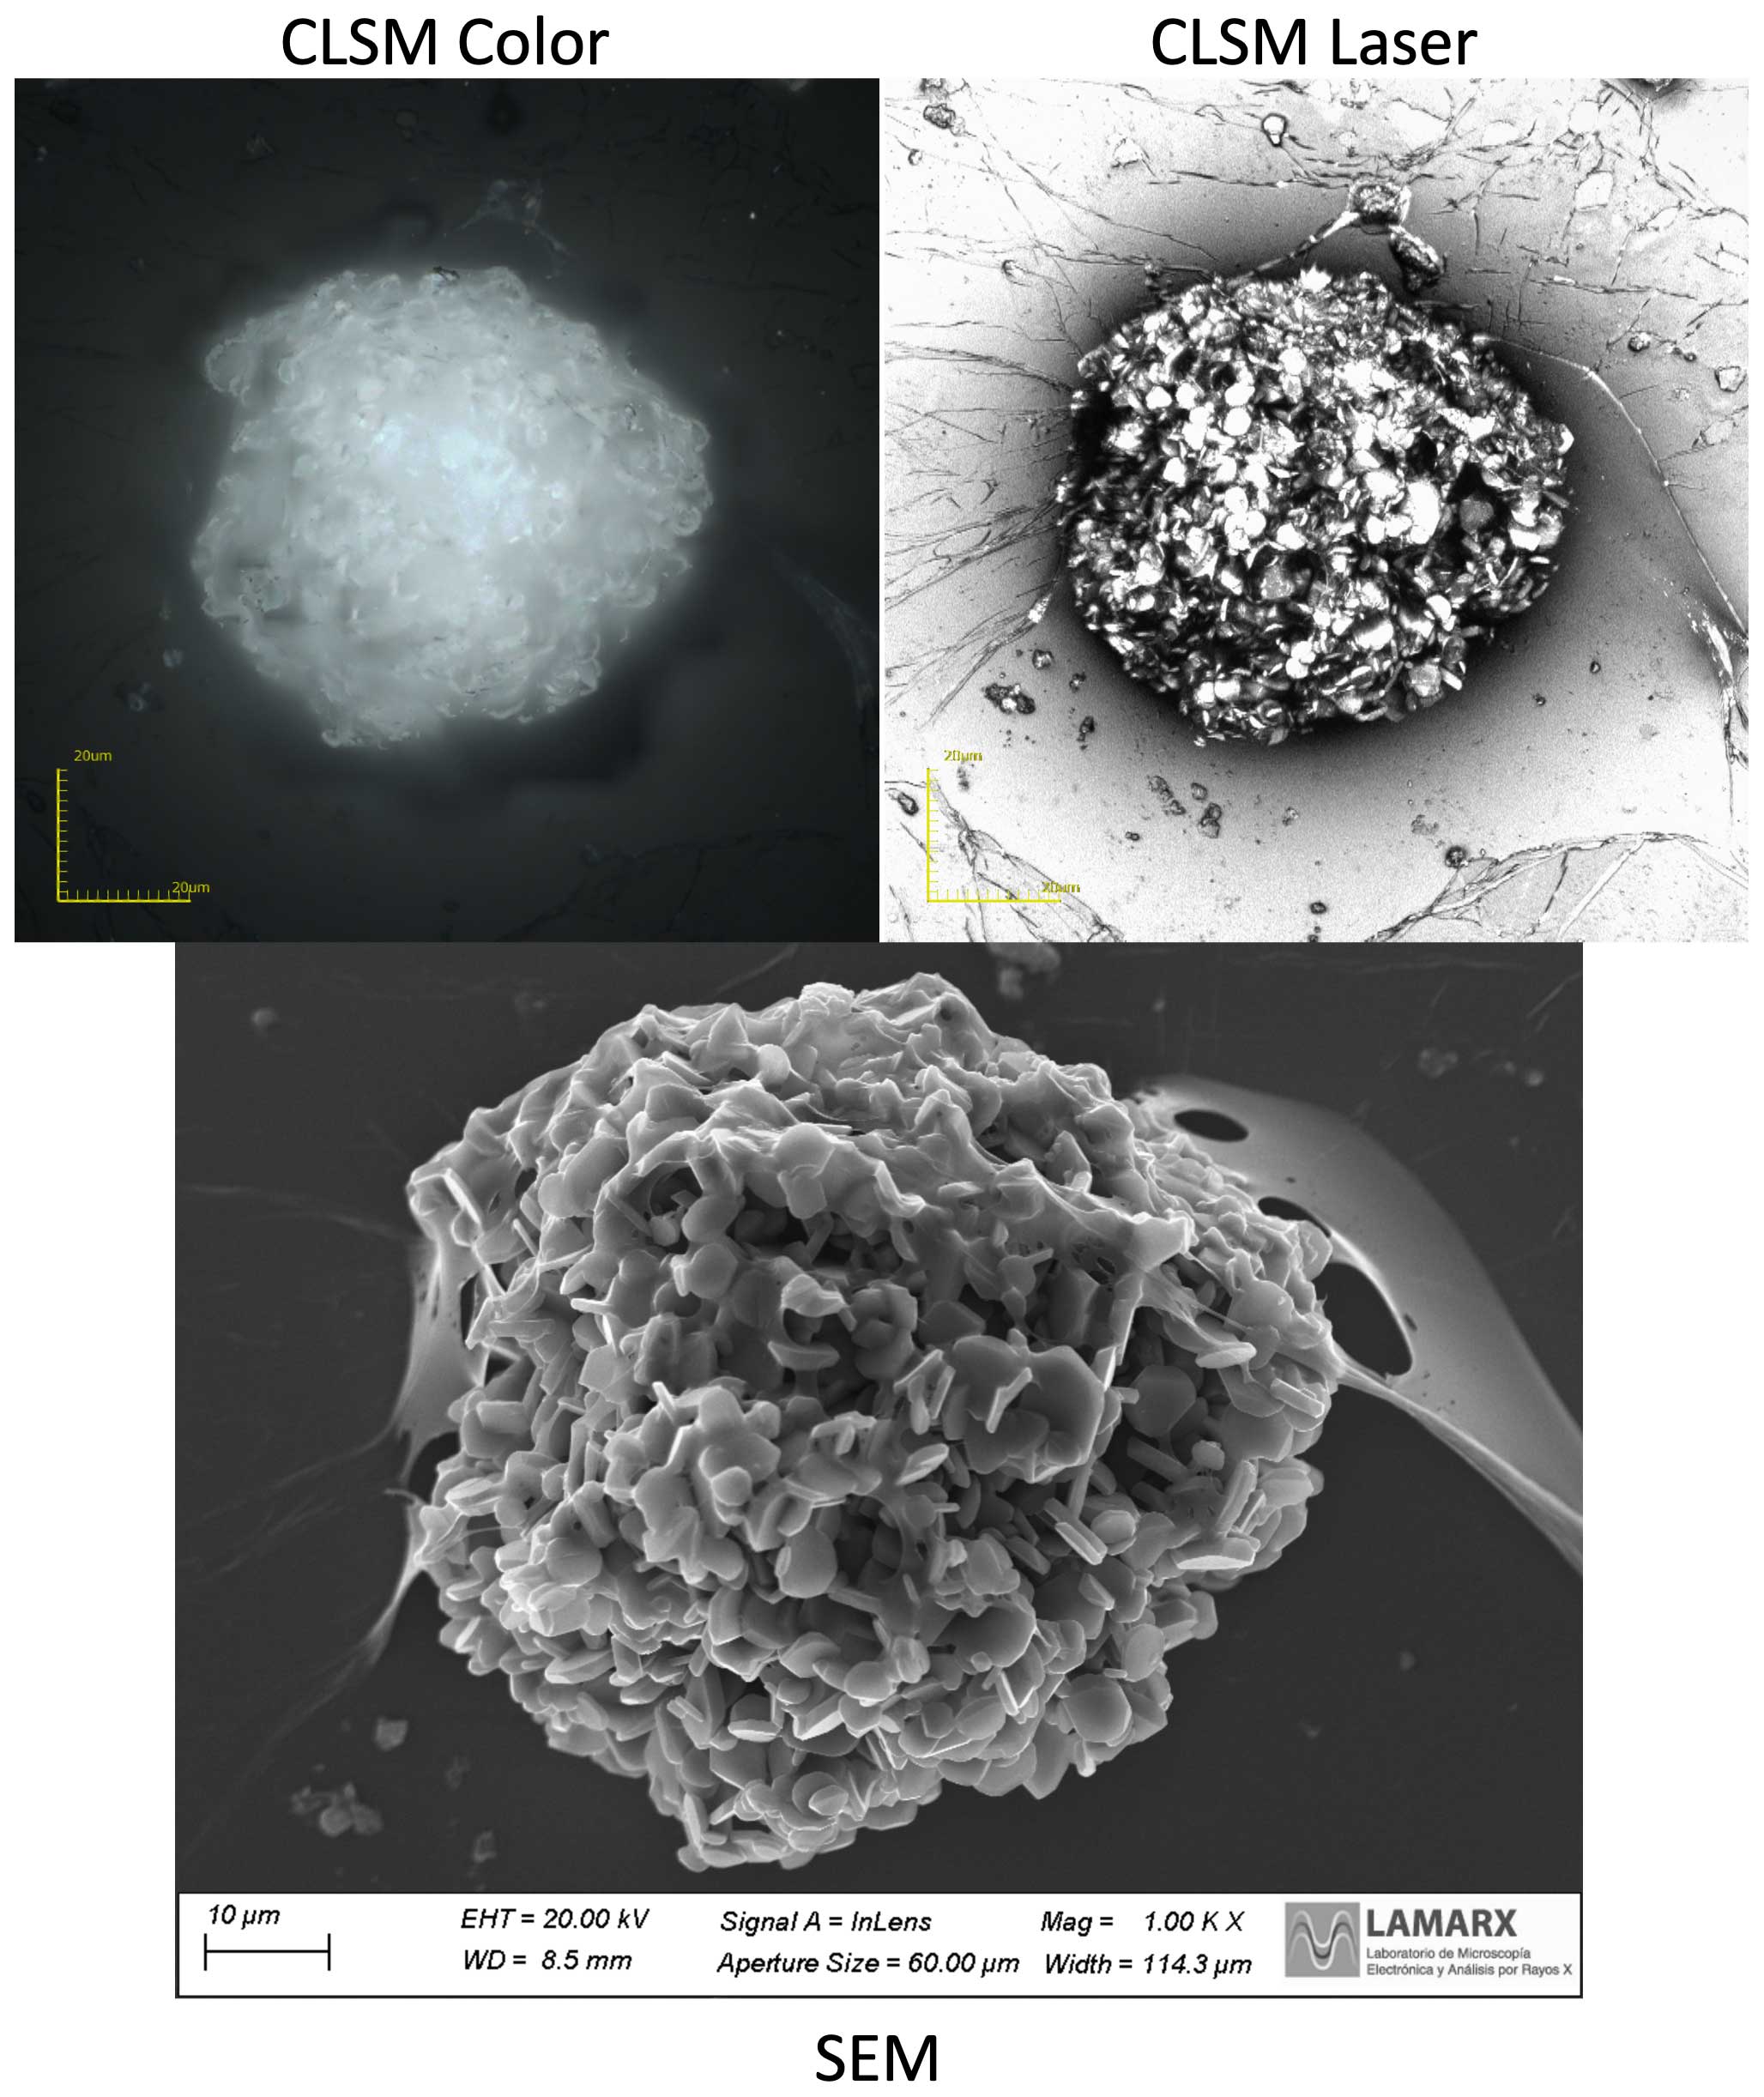
Figure 1A particle trapped in a hailstone as observed by CLSM and SEM for the 1 % Formvar coating.
2.3 Protected particle deposit in hailstone samples for CLSM and SEM–EDS analysis
CLSM and SEM–EDS microscopes were not designed for analyzing hailstone composition in subzero conditions. While it is common to find cryogenic stages on SEMs that facilitate subzero investigations and heating and/or cooling stages on optical scopes for handling frozen samples, issues especially arise when trying to preserve the location of particles within the stone. A specific relevant example of such limitations is that the vacuum in the SEM chamber used to remove air to prevent electron scattering and produce a clear image would result in the sublimation of the hailstone and the movement of particles from their original location within the stone. Prior hail-focused studies (e.g., Mandrioli et al., 1973; Michaud et al., 2014) have avoided these obstacles by melting and filtering the hailstone's liquid water to determine the distribution of viable microorganisms within the hailstone, which limited the analysis to a specific subset of particles. Therefore, a new technique must be applied to hailstones to preserve their in situ particle distribution, including non-soluble particles, before taking advantage of these powerful microscopy techniques.
Ice exhibits a sublimation point close to its melting point, making it feasible to separate out particles via sublimation. A particularly effective sublimation procedure, as described in Arena (2024), involves placing a thin section of an ice sample on a substrate within a dry environment, allowing the ice to sublimate gradually while ensuring minimal contamination during and after the sublimation process. Over time, the particles remain deposited on the substrate, facilitating their examination through microscopy techniques. By first coating the ice with an ultrathin layer of porous plastic, thus slowing the sublimation process, any potential drag or contamination of the trapped particles while handling the sample is prevented.
This coating technique was pioneered by Schaefer (1941) and subsequently refined by Higuchi (see Higuchi, 1958; Higuchi and Muguruma, 1958) for the creation of plastic replicas of ice surfaces. Both Higuchi and Muguruma applied thin layers of a coating made of polyvinyl formal (Formvar) dissolved in ethylene dichloride to the sample surface to facilitate ice sublimation through the formation of small pores in the plastic. Relatively shorter sublimation times within these pores led to the formation of thermal attack imprints (pits), enabling the examination of the sample's texture. This approach eliminates all water molecules while preserving the original spatial distribution of all particles, regardless of their size or composition. Consequently, the particles separated and trapped by the plastic coating can be examined using microscopic techniques such as CLSM or SEM–EDS at room temperature. This coating and sublimation technique serves as the basis for this present study. The following sections describe the novel application and expansion of this approach from hail collection to microscopy analysis and toward investigating the particle's (now including non-soluble) physicochemical characteristics and distributions within hailstones.
3.1 Hailstone collection
The hail collection procedure was an effort between the Universidad Nacional de Córdoba (UNC) and Argentinian citizens around the Córdoba Province. When Argentinian citizens collected hail, they took pictures with their hands or some other object as a scale reference and stored them in their fridges (commonly at −13 °C). Argentinian citizens then contacted the Facultad de Matemática, Astronomía, Física y Computación (FAMAF) at UNC or Lucia E. Arena directly through the Cosecheros application or via telephone or WhatsApp to report the hail they collected. Once the hail report was made, a visit was scheduled with the person who collected the hailstone. During the visit, the location coordinates, the time of collection, the home freezer temperature, and information on whether it rained before, during, or after the hail is noted. The name of the person who collected the sample is recorded, and a document is signed that states that the individual is transferring the hail sample ownership to FAMAF for analysis.
The hailstone sample was transferred and kept in a nylon bag in a thermally reinforced cooler in which the temperature was controlled at −15 °C. This temperature is chosen because the crystallographic structure changes are prolonged (significant changes in the crystallographic structure at this temperature may not start to happen after a year or more). This timeline, however, is not important for the type of analysis described in this paper because it is focused on particle composition, which is neither affected by the storage time nor the crystallographic properties of the hailstone. Each sample was designated an alphanumeric identifier that included the name of the person who collected the sample. Once it reaches the laboratory, the hailstone surface is brushed (to remove contamination) and transferred to a cold chamber with a controlled temperature of −15 °C. No additional cleaning procedure is considered since the hailstone has not melted, and the risk of further contamination is minimal. This hail collection and conservation procedure became the Argentine provincial citizen science program, Cosecheros de Granizo, which started in October 2018 (Arena and Crespo, 2019; Crespo, 2020).
3.2 Hailstone preparation with an adapted sublimation method
After cleaning the subzero facilities (refer to Appendix A), hail samples were processed in the subzero facility, the Laura Levi Atmospheric Physics Laboratory of FAMAF-UNC, which is one of the few facilities in the world with the equipment to process hail. Upon the chamber reaching a temperature of −12 ± 2 °C, the chamber should be quickly entered to minimize heat exchange and maintain this required operating temperature for hailstone processing. After entering the chamber, the following hailstone measurements should be made first before the cutting of the hailstone (if needed) for additional physical analysis of the stone with respect to the lengths of the lobes, the height and width, the symmetry, and the weight.
The overall objective of the hailstone preparation process is to expose the embryo by cutting the hailstone. However, due to the coating machine's limited size, smaller thin-section glasses are needed to fit the coating chamber. This strategic preparation ultimately serves the larger goal of entrapping the hailstone particles within a Formvar layer, a crucial step for subsequent microscopic analysis. For this reason, a glass substrate is needed to affix the hailstone before cutting it into sections for analysis. Towards this goal, several thin glass sections, assembled in a mosaic pattern (Fig. 2), were affixed to a larger piece of glass using ultrapure liquid water. Glass was selected as the substrate for particle deposition due to its transparency to visible light, enabling the examination of particles using transmitted light microscopes (i.e., CLSM). The hailstone was then attached to the glass by applying heat to the bottom of the hailstone to slightly melt the bottom surface, positioning it on the glass, and then allowing it to freeze once more (within minutes) until it firmly bonded to the glass surface. The glass is too thin to firmly grab when cutting the stone, so the hailstone, now firmly attached to the glass, is further affixed to a thick metal section plate using the same ultrapure liquid water (Fig. 3a). The hailstone sample was then cut over the equatorial symmetric plane using a diamond-encrusted cutting disk with 12 cm diameter and a cutting width of 2 mm to expose the embryo (Fig. 3b). While alternatives to the abovementioned disk are plausible (different sizes and cutting widths), they must adhere to specific criteria to achieve the best hailstone cutting performance: (1) the blade has to be as thin as possible to minimize removing hailstone mass during cutting, and (2) its edge must be adequately broad to facilitate cutting larger hailstones. After cutting, the sample is evenly polished with a microtome (Fig. 4a) to provide a thin, even ice layer over the embryo (Fig. 4b).
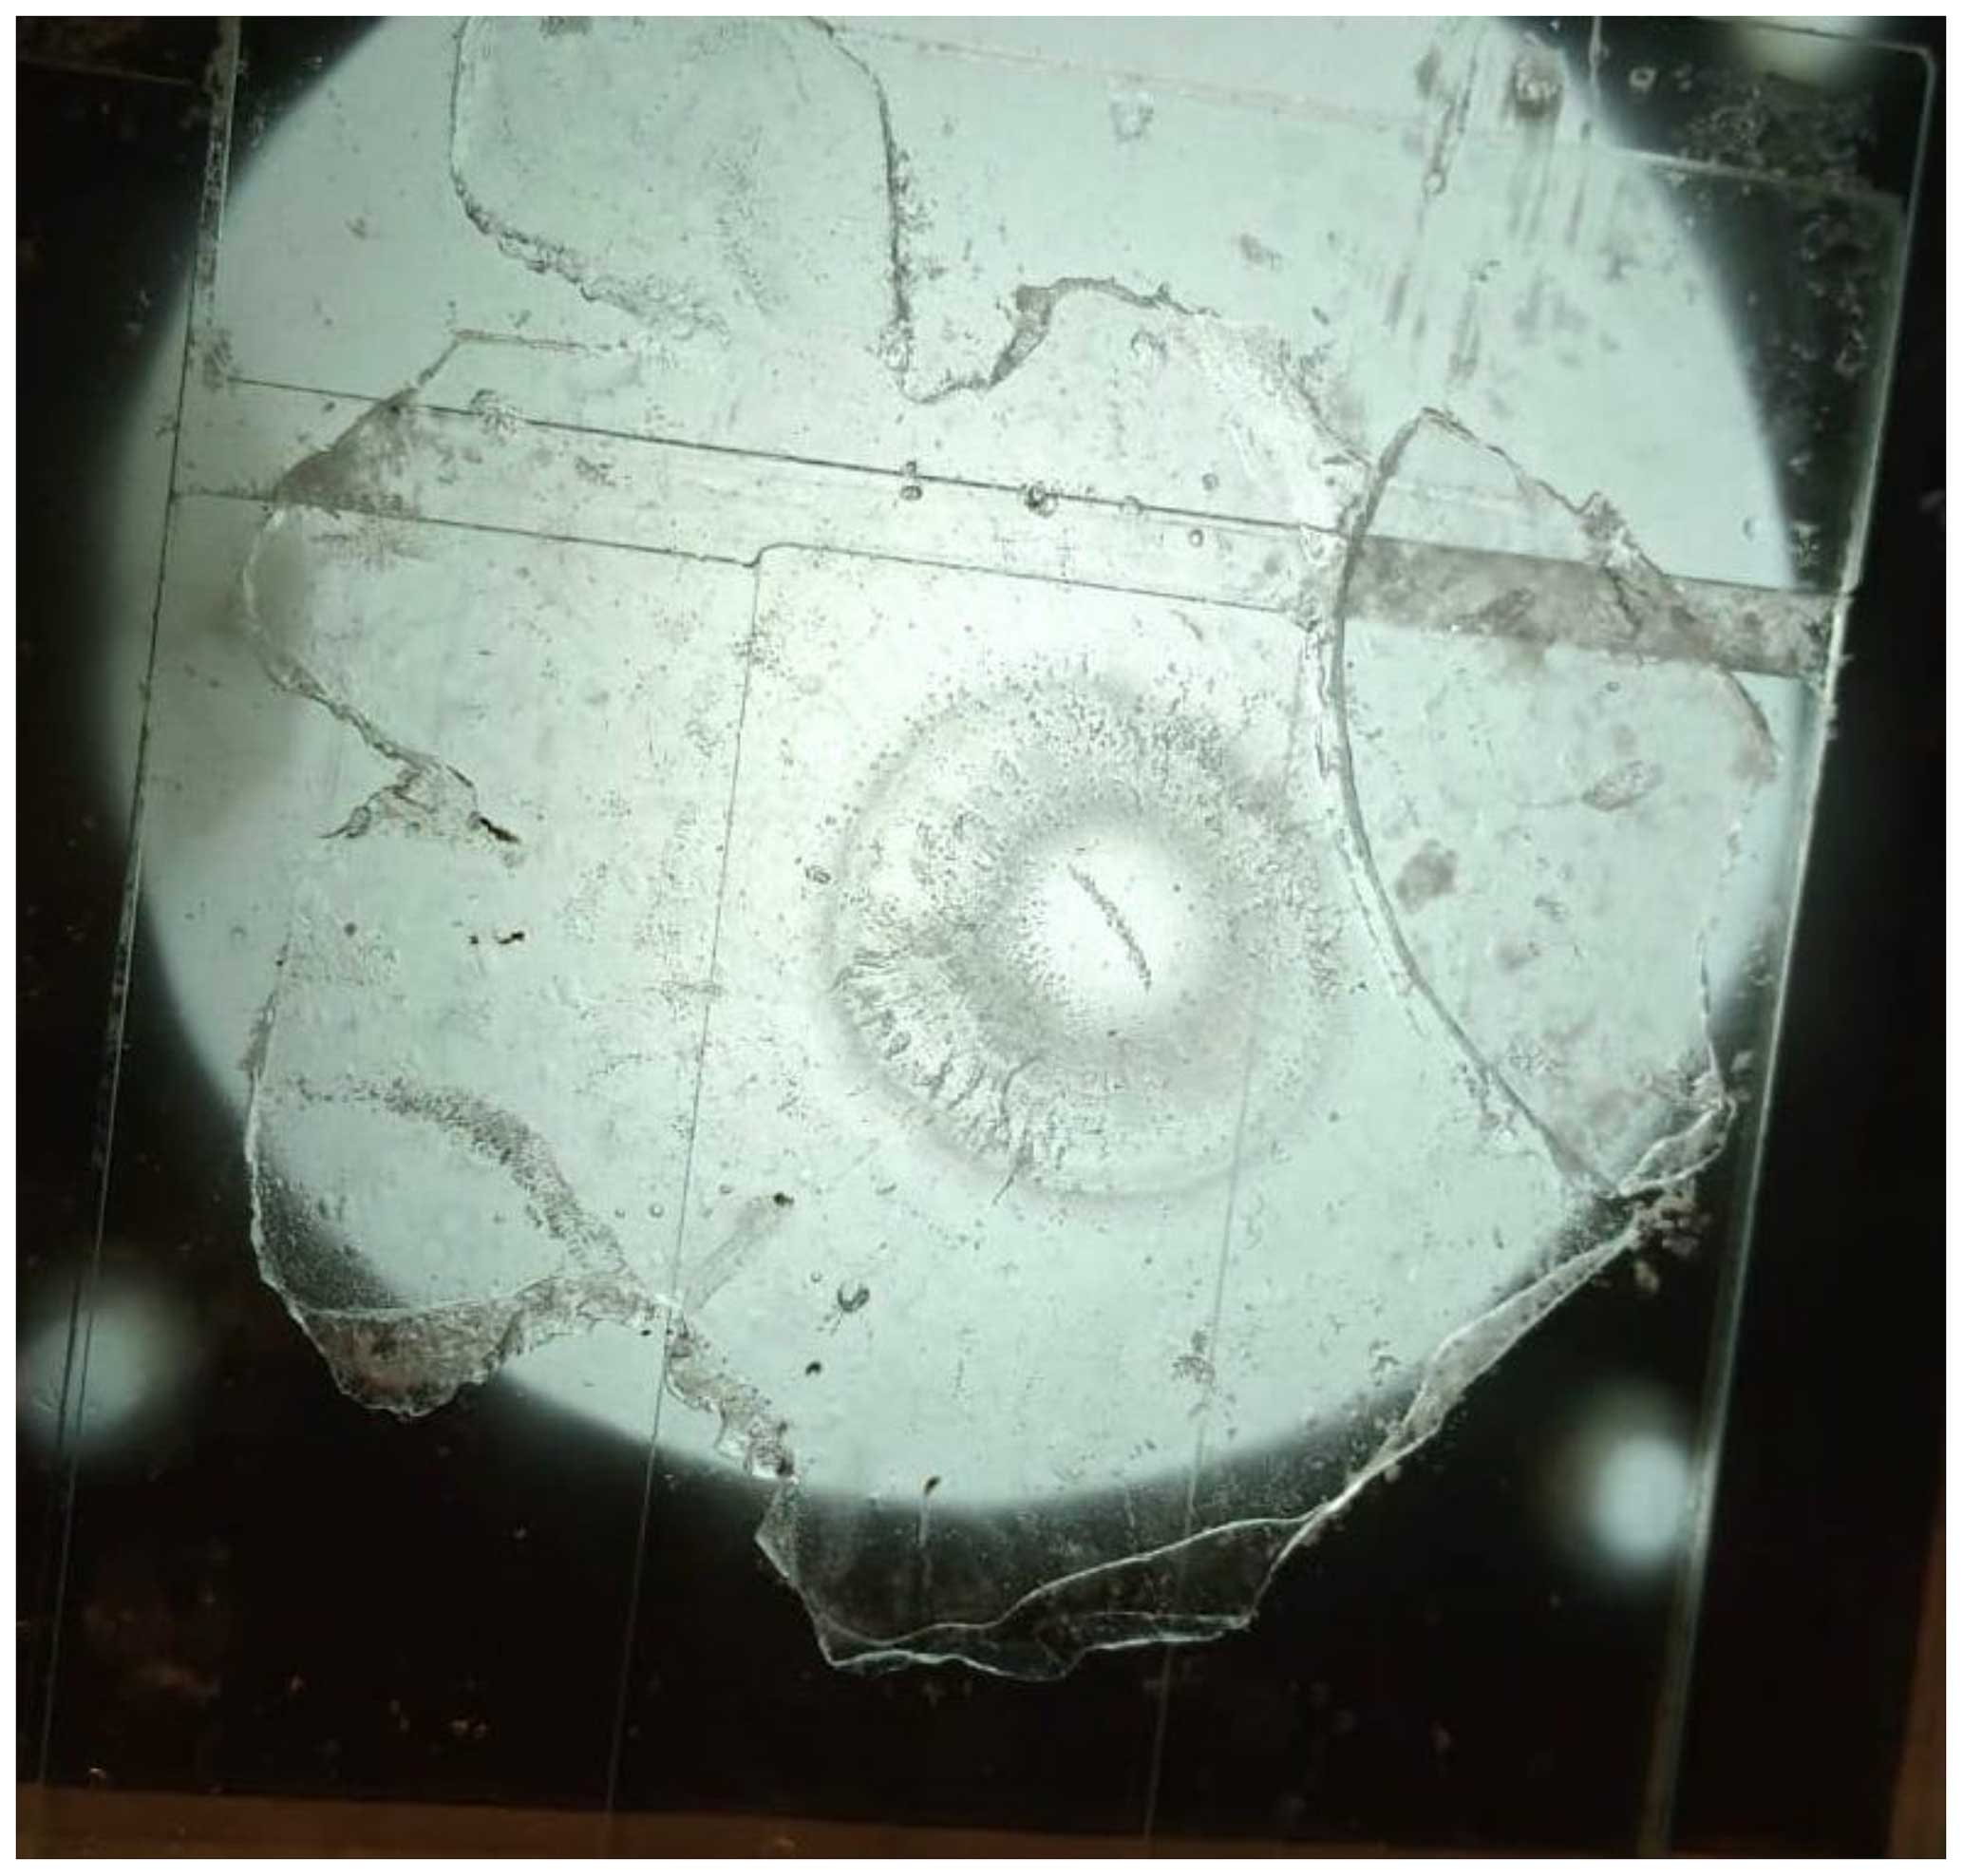
Figure 2An example of a thin cross section of a hailstone sectioned through its equatorial plane. It is affixed to several thin glass sections arranged in a mosaic pattern on a thin glass slide with dimensions of 25 × 75 mm.
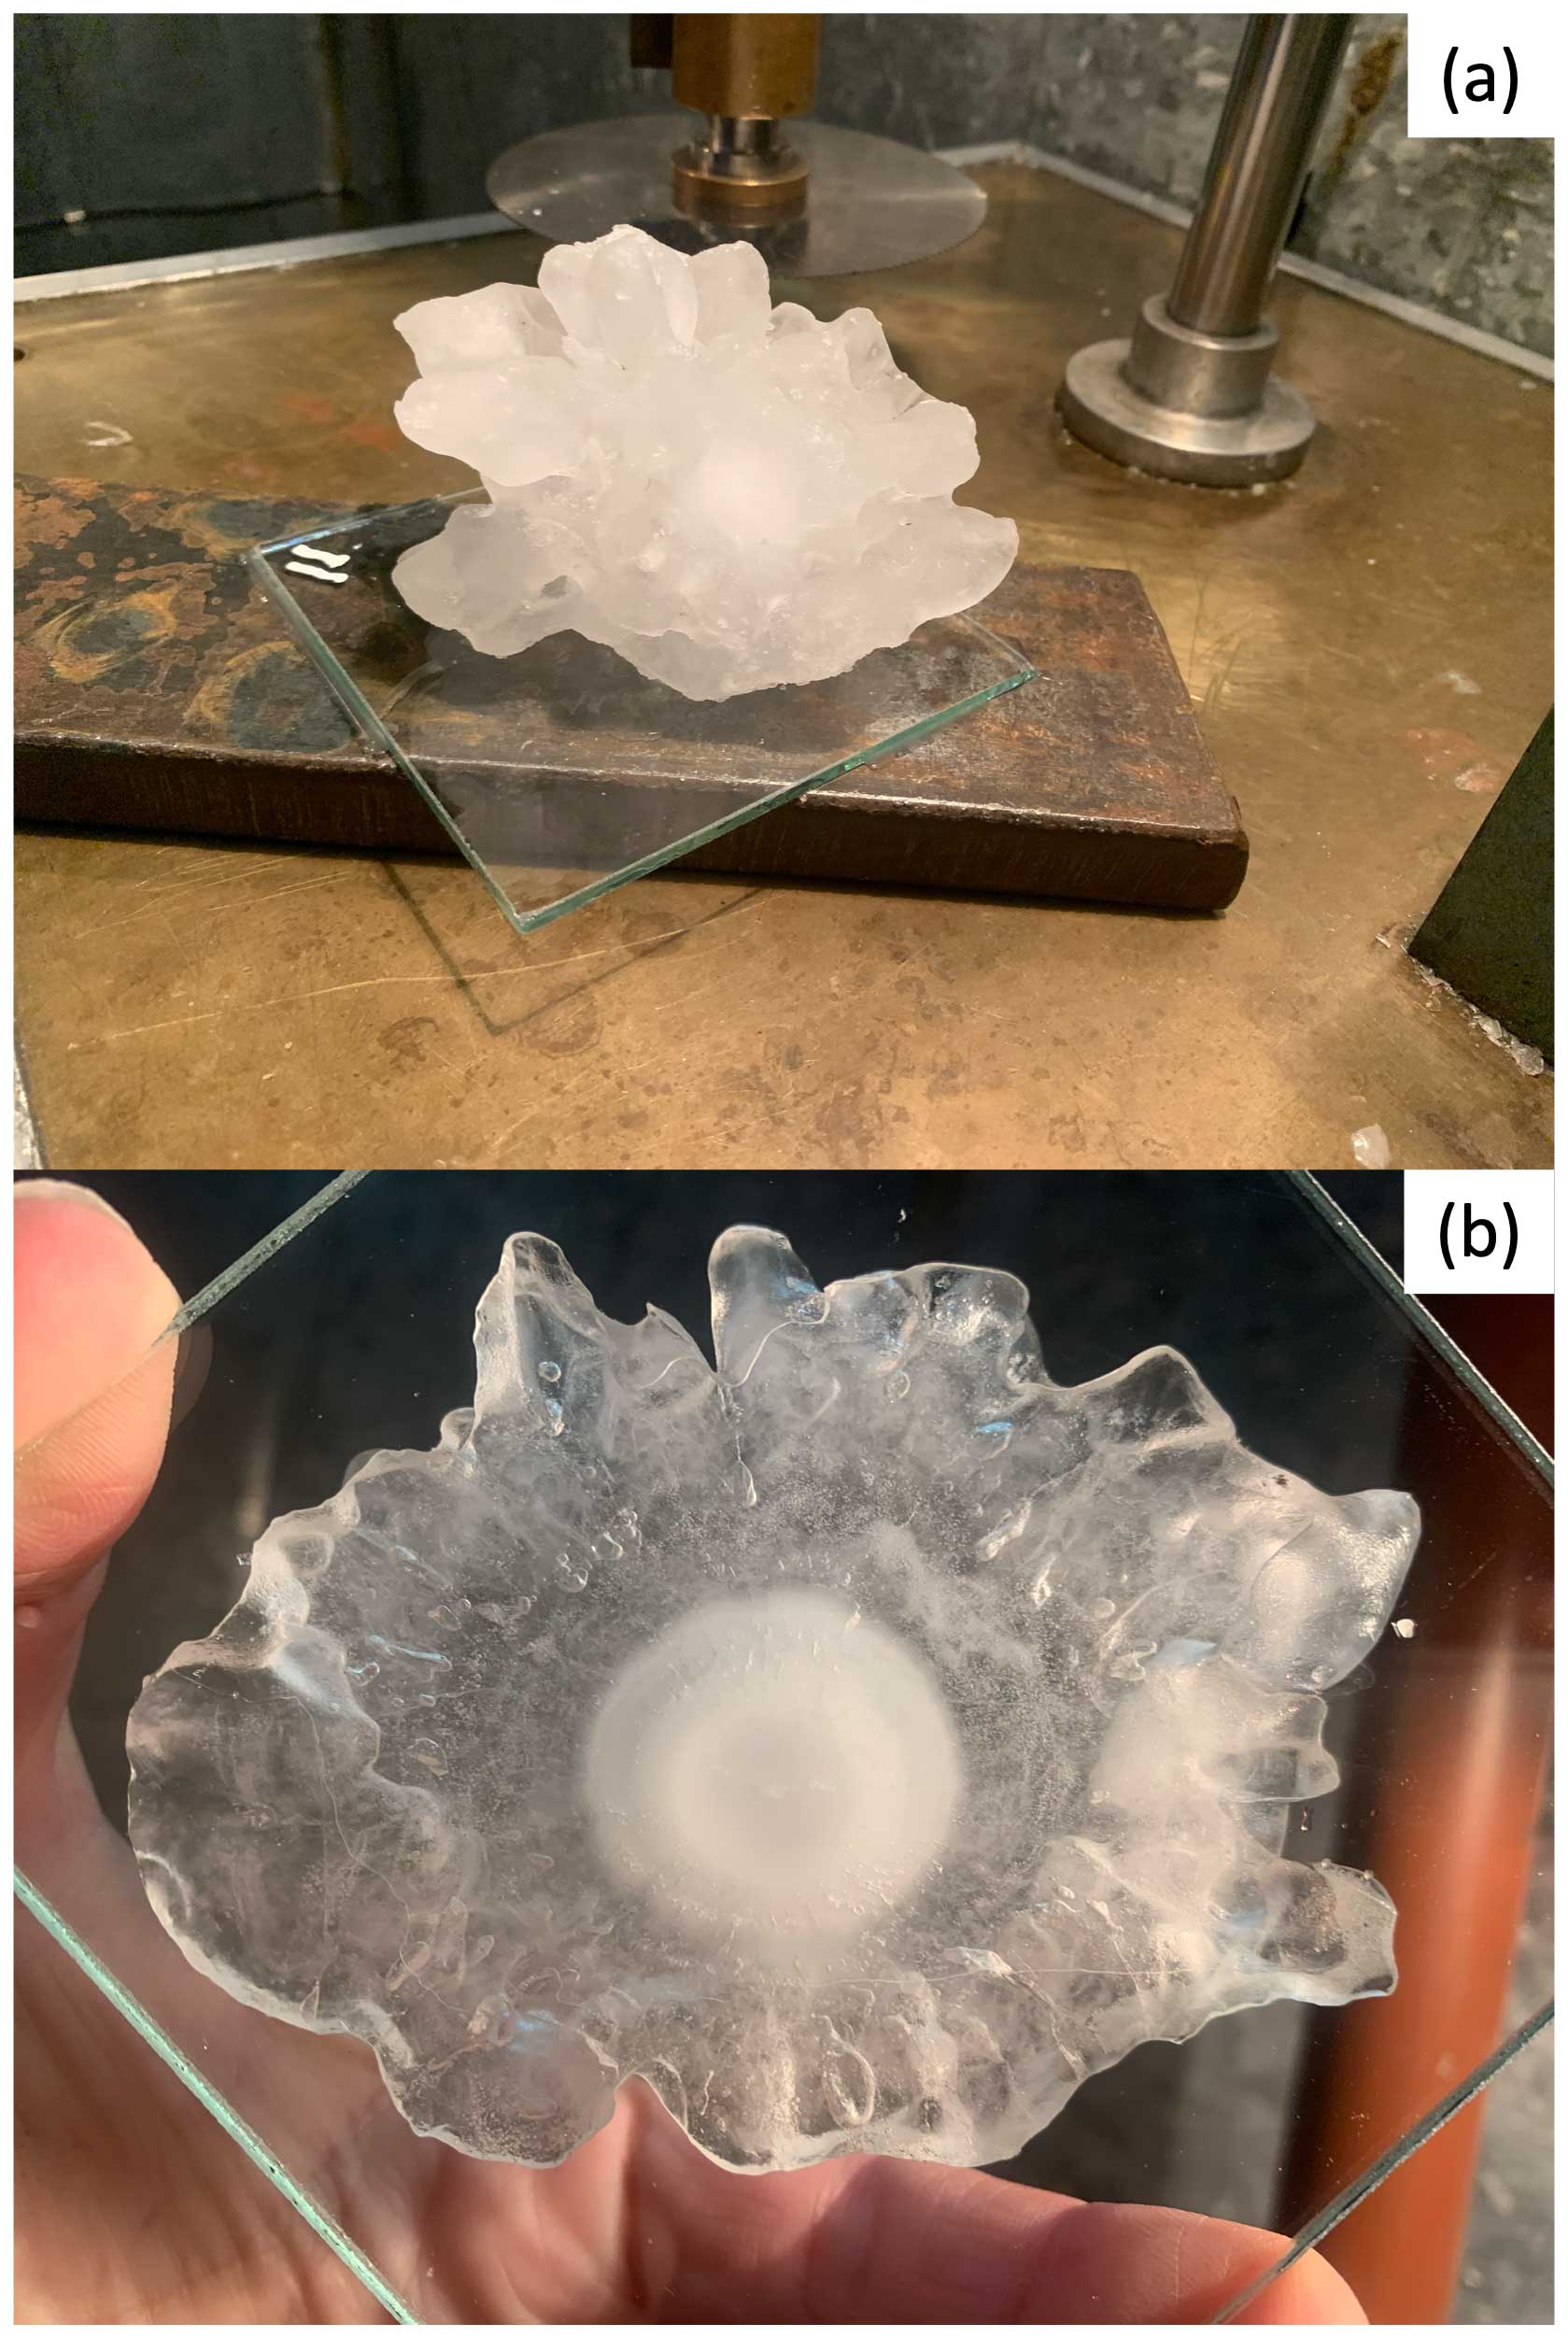
Figure 3The figure shows the preparation stages of a hailstone. (a) The hailstone is attached to a glass section and then to a metal section plate with ultrapure liquid water. (b) The hailstone is cut in the equatorial symmetric plane to provide a view of the hailstone's embryo.
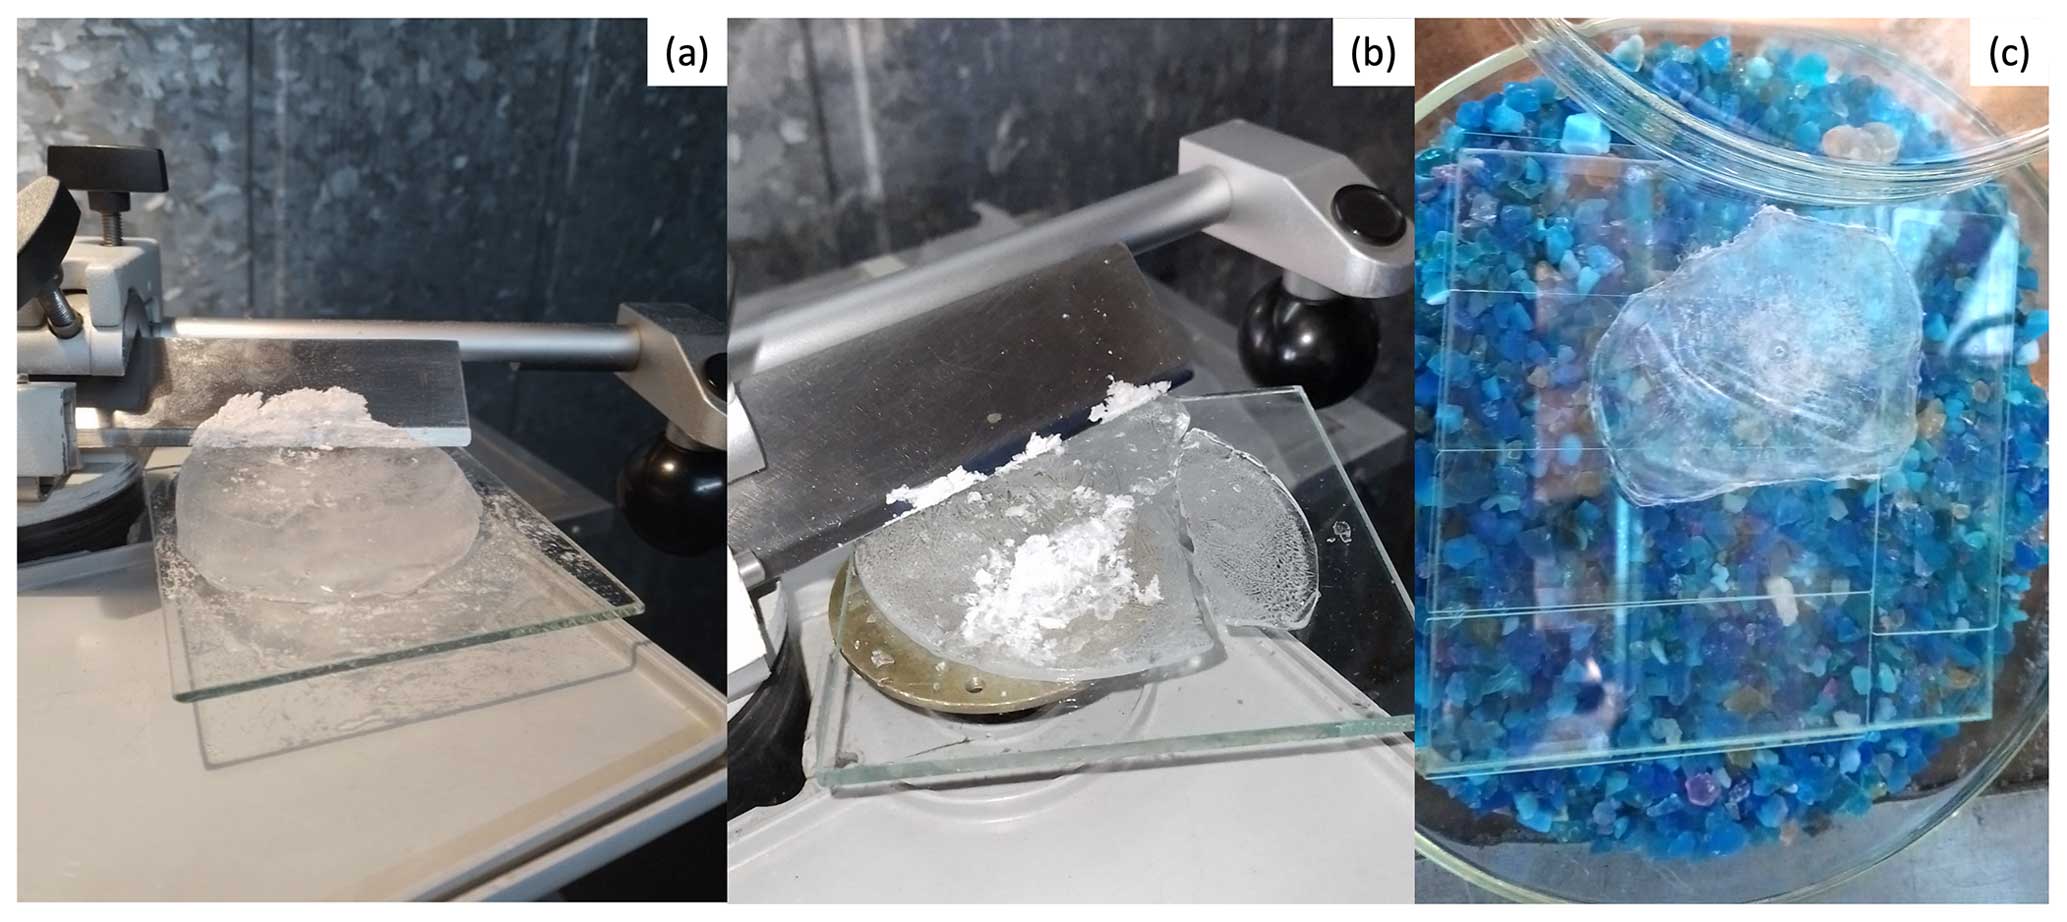
Figure 4Images showing before (a) and after (b) a hailstone is evenly polished to the desired thickness with a microtome to obtain a top view of the embryo. (c) The hailstone is then left to sublimate in a humidity-controlled container with silica gel.
At this stage, pictures were taken to record the location of the growth rings relative to the embryo. Hence, we know where particles will be located relative to the embryo, allowing for future crystallographic and ice growth analysis. After taking pictures of the polished hailstone sample, a layer of 1 % Formvar solution diluted in ethylene dichloride (refer to Appendix B) is applied to the sample's flat polished surface using a clean glass rod. This application is done in two ways, either (1) by dipping one side of the rod into the Formvar solution and spreading a small amount over the surface or (2) by pouring small amounts of the solution onto the surface and evenly spreading it across the polished hailstone. Once the entire surface is covered with the Formvar solution, the sample is left to curate for a few minutes, and then it is ready for sublimation. The hailstone is left in a sealed low-humidity container with silica gel (Fig. 4c) at the −12 °C operating temperature to sublimate it. This process enabled the gradual sublimation of ice over a 24 to 48 h period, with daily sample monitoring, while also capturing non-soluble particles beneath the layer of the Formvar solution. During sublimation, dissolved components may undergo precipitation. For instance, in cases where the original hailstone possessed a brine-like composition, the sublimation process could result in the precipitation of once-soluble salt particles. However, in convective systems, the behavior of soluble components such as sodium chloride and other crystalline inorganic salts is influenced by multiple factors, such as solution properties and convective transport processes (e.g., updraft speed). When these get injected into an updraft, they have the potential to remain undissolved, acting as INPs under certain conditions (Patnaude et al., 2021). Consequently, discerning between particles that were initially non-soluble and those that became non-soluble post-sublimation poses a challenge and is not the primary focus of this paper. However, it is known to a certain degree that some particles were not originally precipitated from the sublimation process, owing to their specific composition determined by the SEM–EDS technique described in the next section.
3.3 Microscopy analysis
3.3.1 CLSM analysis
Once the sample is completely sublimated, and once particles are trapped in Formvar, it is ready for microscopy analysis. An Olympus LEXT OLS4000 confocal laser scanning microscope (CLSM) is used to create a 2-D cross section of the sublimated hailstone (centered on the embryo location) along an axis in the equatorial plane using the lowest available magnification (108 ×) to locate the non-soluble particles trapped in Formvar. Within this cross section (Fig. 5a), subsectors are selected with respect to the embryo center for higher magnification (Fig. 5b), with the color image (Fig. 5c) providing high-resolution 3-D particle surface topography and, therefore, the size (Fig. 5e) of individual particles within all subsectors of the scanned 2-D cross section. The magnification is dependent on the size of the particle to be analyzed. It is estimated that using the modified sublimation technique, particles trapped in Formvar can be observed using the CLSM as small as 1 µm, thus requiring magnification of 2132 ×. Each particle is individually labeled for further analysis. CLSM files undergo processing using ProfilmOnline software (e.g., as displayed in Fig. 5e), facilitating the extraction of essential particle information. During this stage, the particle size is determined by assessing the maximum length along the x and y axes. The obtained data on particle size, coupled with the spatial distribution of each particle, lay the foundation for the subsequent SEM–EDS analysis, as detailed in the following section.
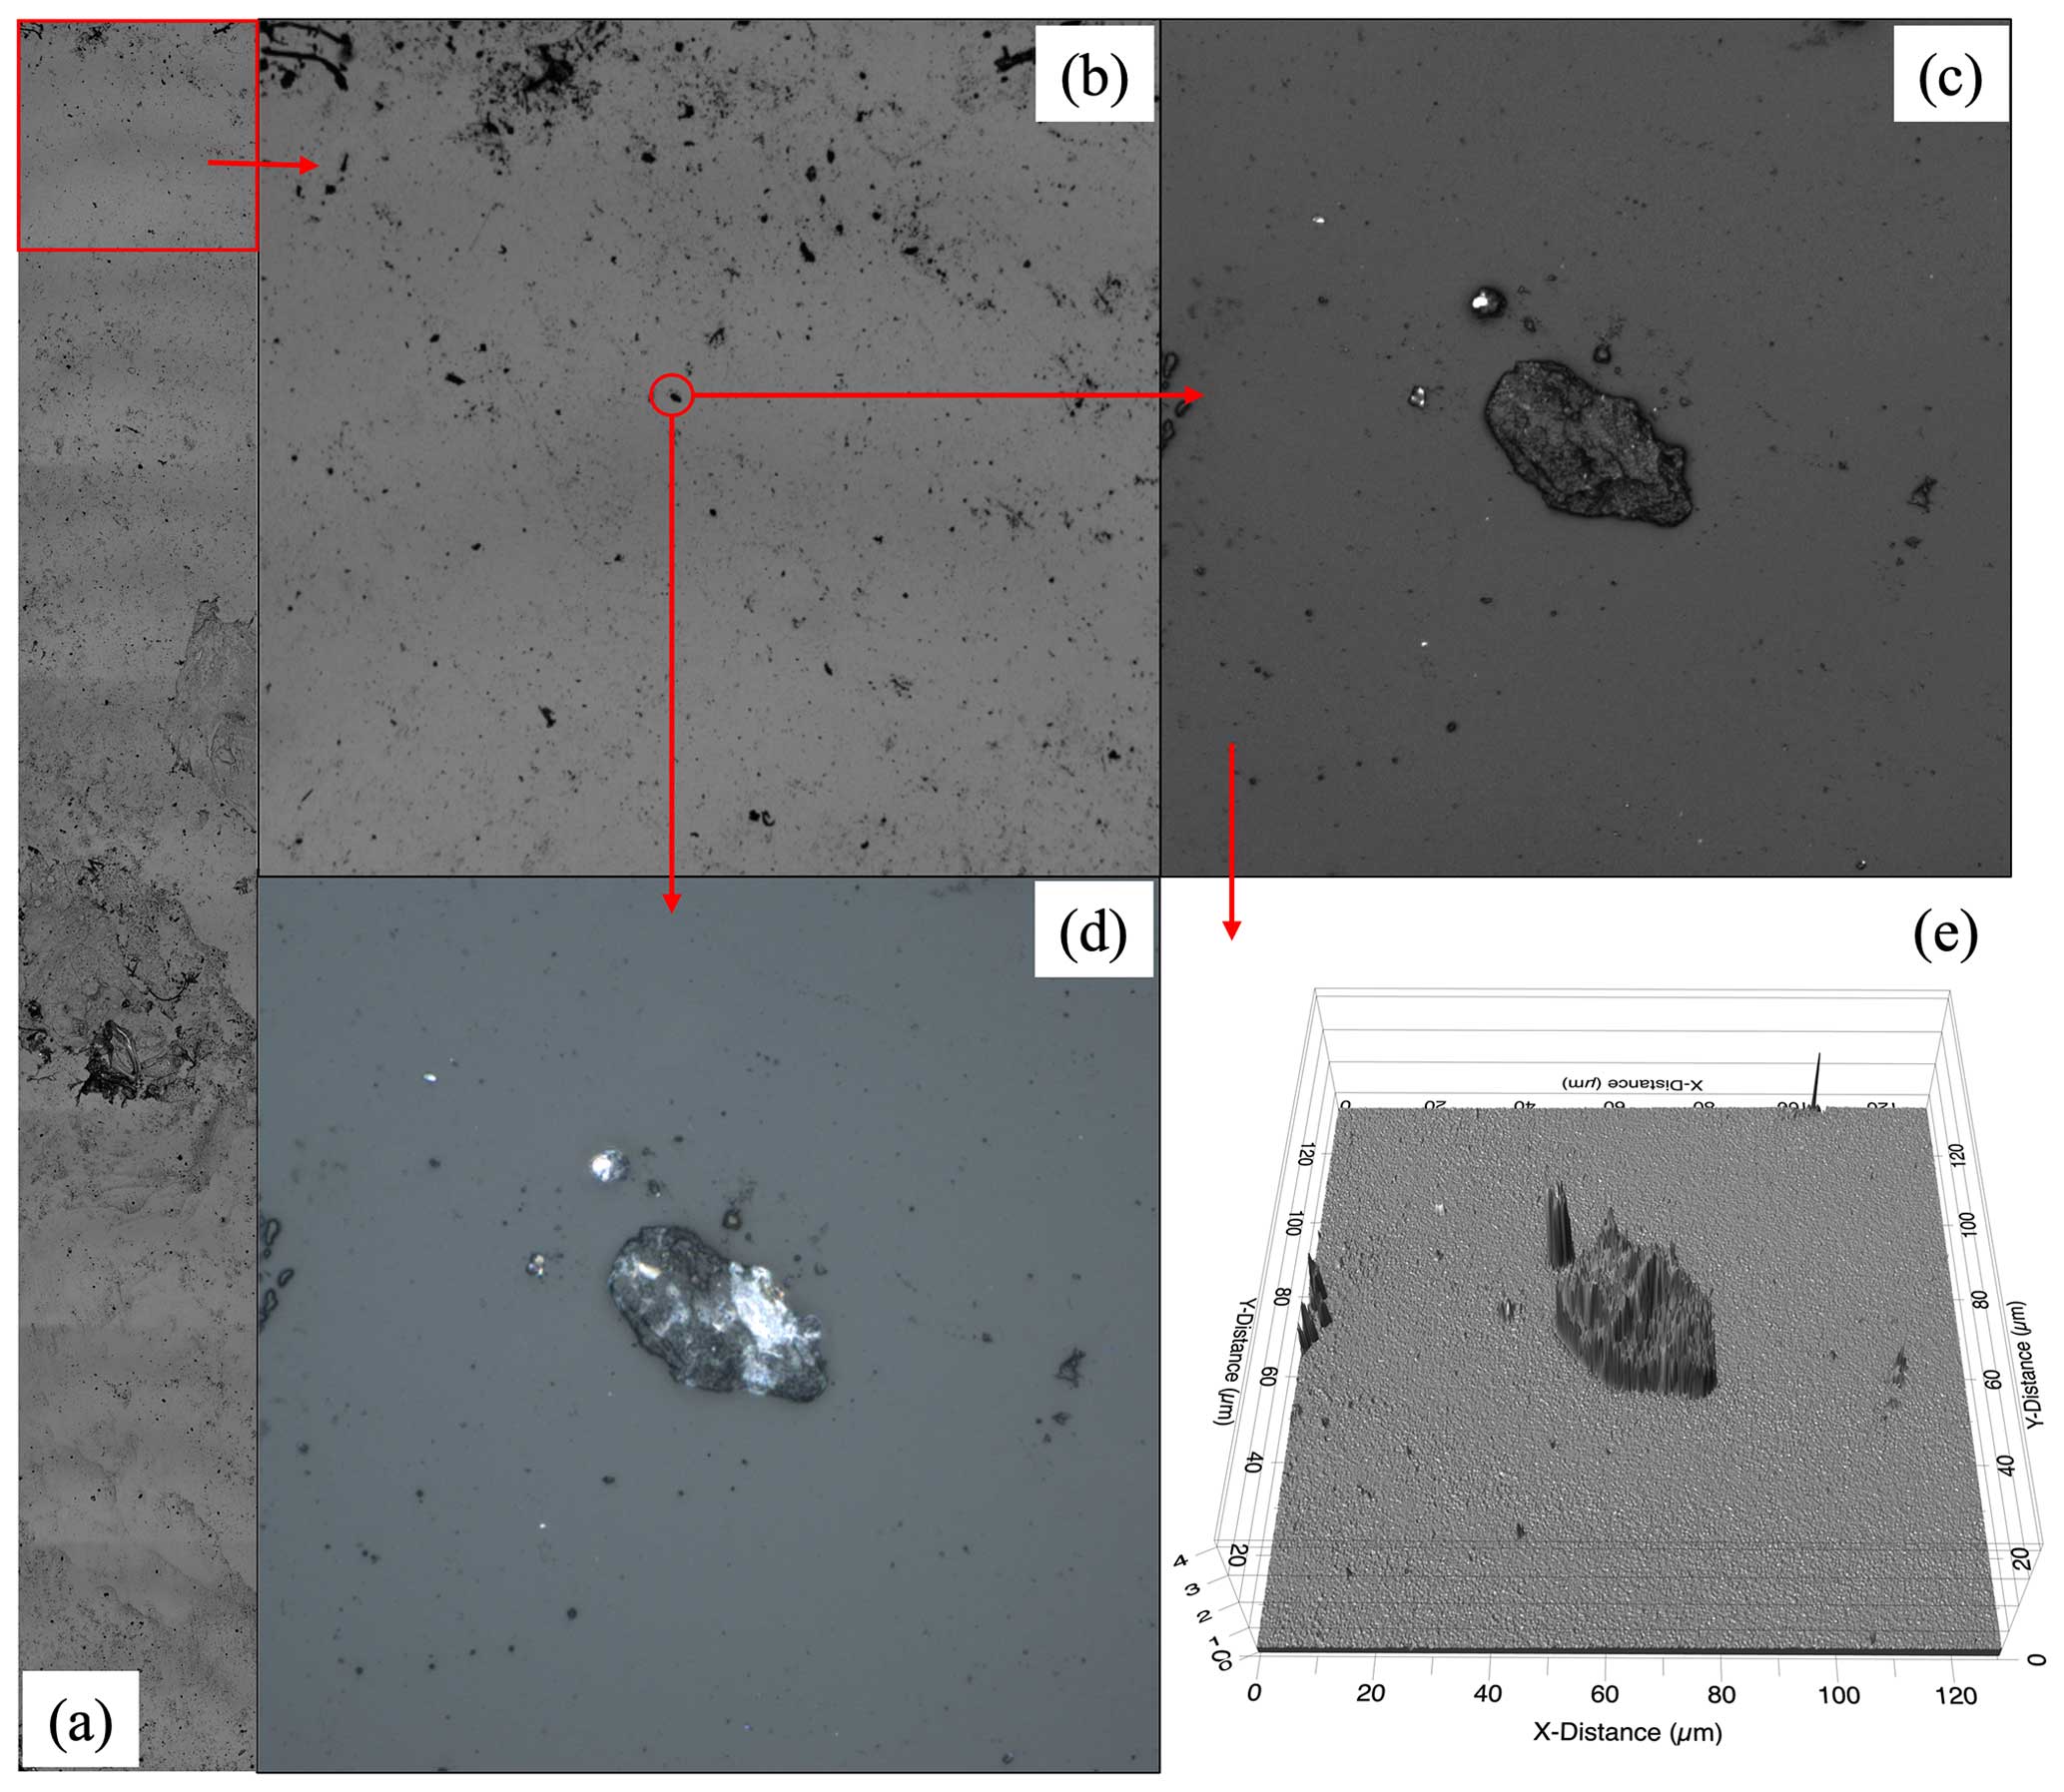
Figure 5Example CLSM imagery from the coated, sublimated hailstone shows (a) a 2-D cross section along an axis in the equatorial plane at 108 × magnification and (b) a subsector scanned at higher magnification for creating (c) visible and (d) laser images for individual particles. (e) 3-D particle surface topography from the visible imagery is analyzed with ProfilmOnline software.
3.3.2 SEM–EDS analysis
The 2-D cross section created with the CLSM (Fig. 5a) is used as a reference point to investigate the elemental composition of the individual particles. Elemental analysis with SEM–EDS was conducted on electrically conductive samples under high-vacuum conditions to enhance the imaging quality and the accuracy of chemical measurements. This decision was influenced by the absence of a variable pressure mode (50 Pa) in the SEM instrument used in the development of this method. Even if such an instrument were available, a high-vacuum environment would still be preferred. SEMs equipped for low-vacuum analysis introduce a controlled gas, such as nitrogen, or allow some oxygen from the surrounding air to enter the chamber, potentially leading to aerial contamination. Without a dedicated oxygen source or air filtration system, SEM chambers risk contamination from atmospheric impurities. This is because SEMs do not have built-in air filtration systems. These impurities can settle on the Formvar coat. Without proper references from CLSM or SEM, they could be mistakenly included in the particulate selection analyzed with this method.
Moreover, under low-vacuum conditions, beam-skirting can occur (Goldstein et al., 2017), wherein the gaseous environment alters the profile of the primary electron beam. This alteration typically divides the electron beam into two fractions: an unscattered beam with the original distribution profile and diameter and a scattered beam forming a “beam-skirting” around it. This modification occurs prior to reaching the particle surface, affecting the resolution of high-resolution imaging and spectral analysis through EDS. Consequently, a high-vacuum environment is recommended due to concerns regarding contamination, the lack of beam trajectory control, and the impact on resolution and spectral analysis.
To produce a fully conductive surface for the most accurate X-ray chemical analysis, the glass slides with hailstone particles were coated with 25 nm Au and analyzed at 10−4 Pa chamber pressure. Gold coating was selected over other common coating materials (Au, Au–Pd alloy, Pd, Pt, Ir, C, and Ag) to enable the characterization of C-bearing non-soluble particles without X-ray interferences at the C–Ka position or with other elements that may exist in hailstone particles. The sample was analyzed with a Zeiss Sigma field emission gun (FEG) SEM with an EDS X-Max 80 mm2 detector at the Laboratorio de Análisis de Materiales por Espectrometría de Rayos X (Lamarx) facilities at UNC.
Analysis of micron-scale non-soluble particles involves optimizing both the spatial resolution of the electron imaging and the activation volume of X-ray analysis. Selecting the accelerating voltage is critical to the determination of the ultimate resolution of the imaging and X-ray analysis. The accelerating voltage of the primary beam determines the wavelength of the electrons, and higher voltages are generally advised for enhanced spatial resolution in electron imaging (Goldstein et al., 2017). However, it is important to consider that this principle may not universally apply to all materials. In some cases, excessively high voltages could result in electron expansion or penetration into the materials, potentially diminishing resolution. Therefore, it is essential to determine the optimal voltage, potentially opting for a lower one, when analyzing specific samples to ensure an optimal imaging resolution. By balancing the energy of the incident beam, it is possible to excite all of the X-ray lines of interest from the smallest possible volume. Additionally, depending on the object being analyzed, increasing the voltage increases the risk of beam damage to the particle (e.g., Fig. 6), thereby jeopardizing the sample's integrity and subsequently influencing the conclusive outcomes of this method. On the other hand, the working distance can affect the depth of the field and beam diameter, which will also affect the clarity and resolution of the image of an object. Optimizing the accelerating voltage and working distance will define the clarity, detail, and accuracy of the imagery obtained from an SEM.
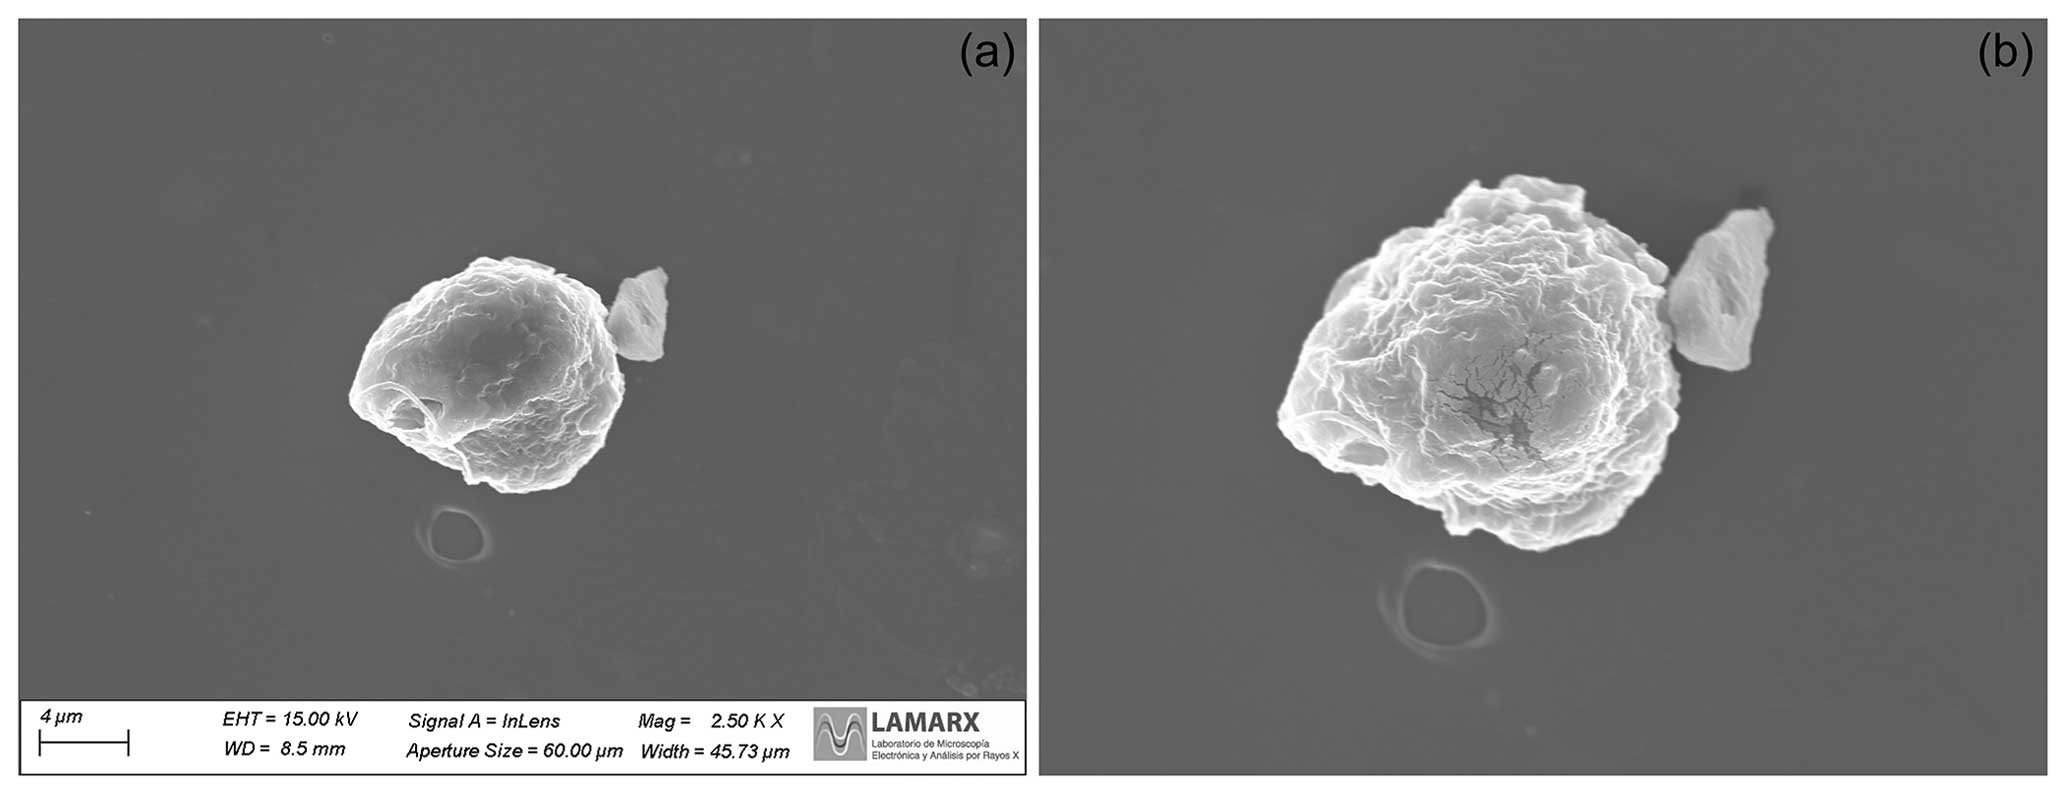
Figure 6Panel (a) displays the particle prior to undergoing EDS analysis, while panel (b) illustrates the particle's post-EDS analysis, revealing subtle breakage and disintegration concentrated at the center of the particle where the SEM laser was centered.
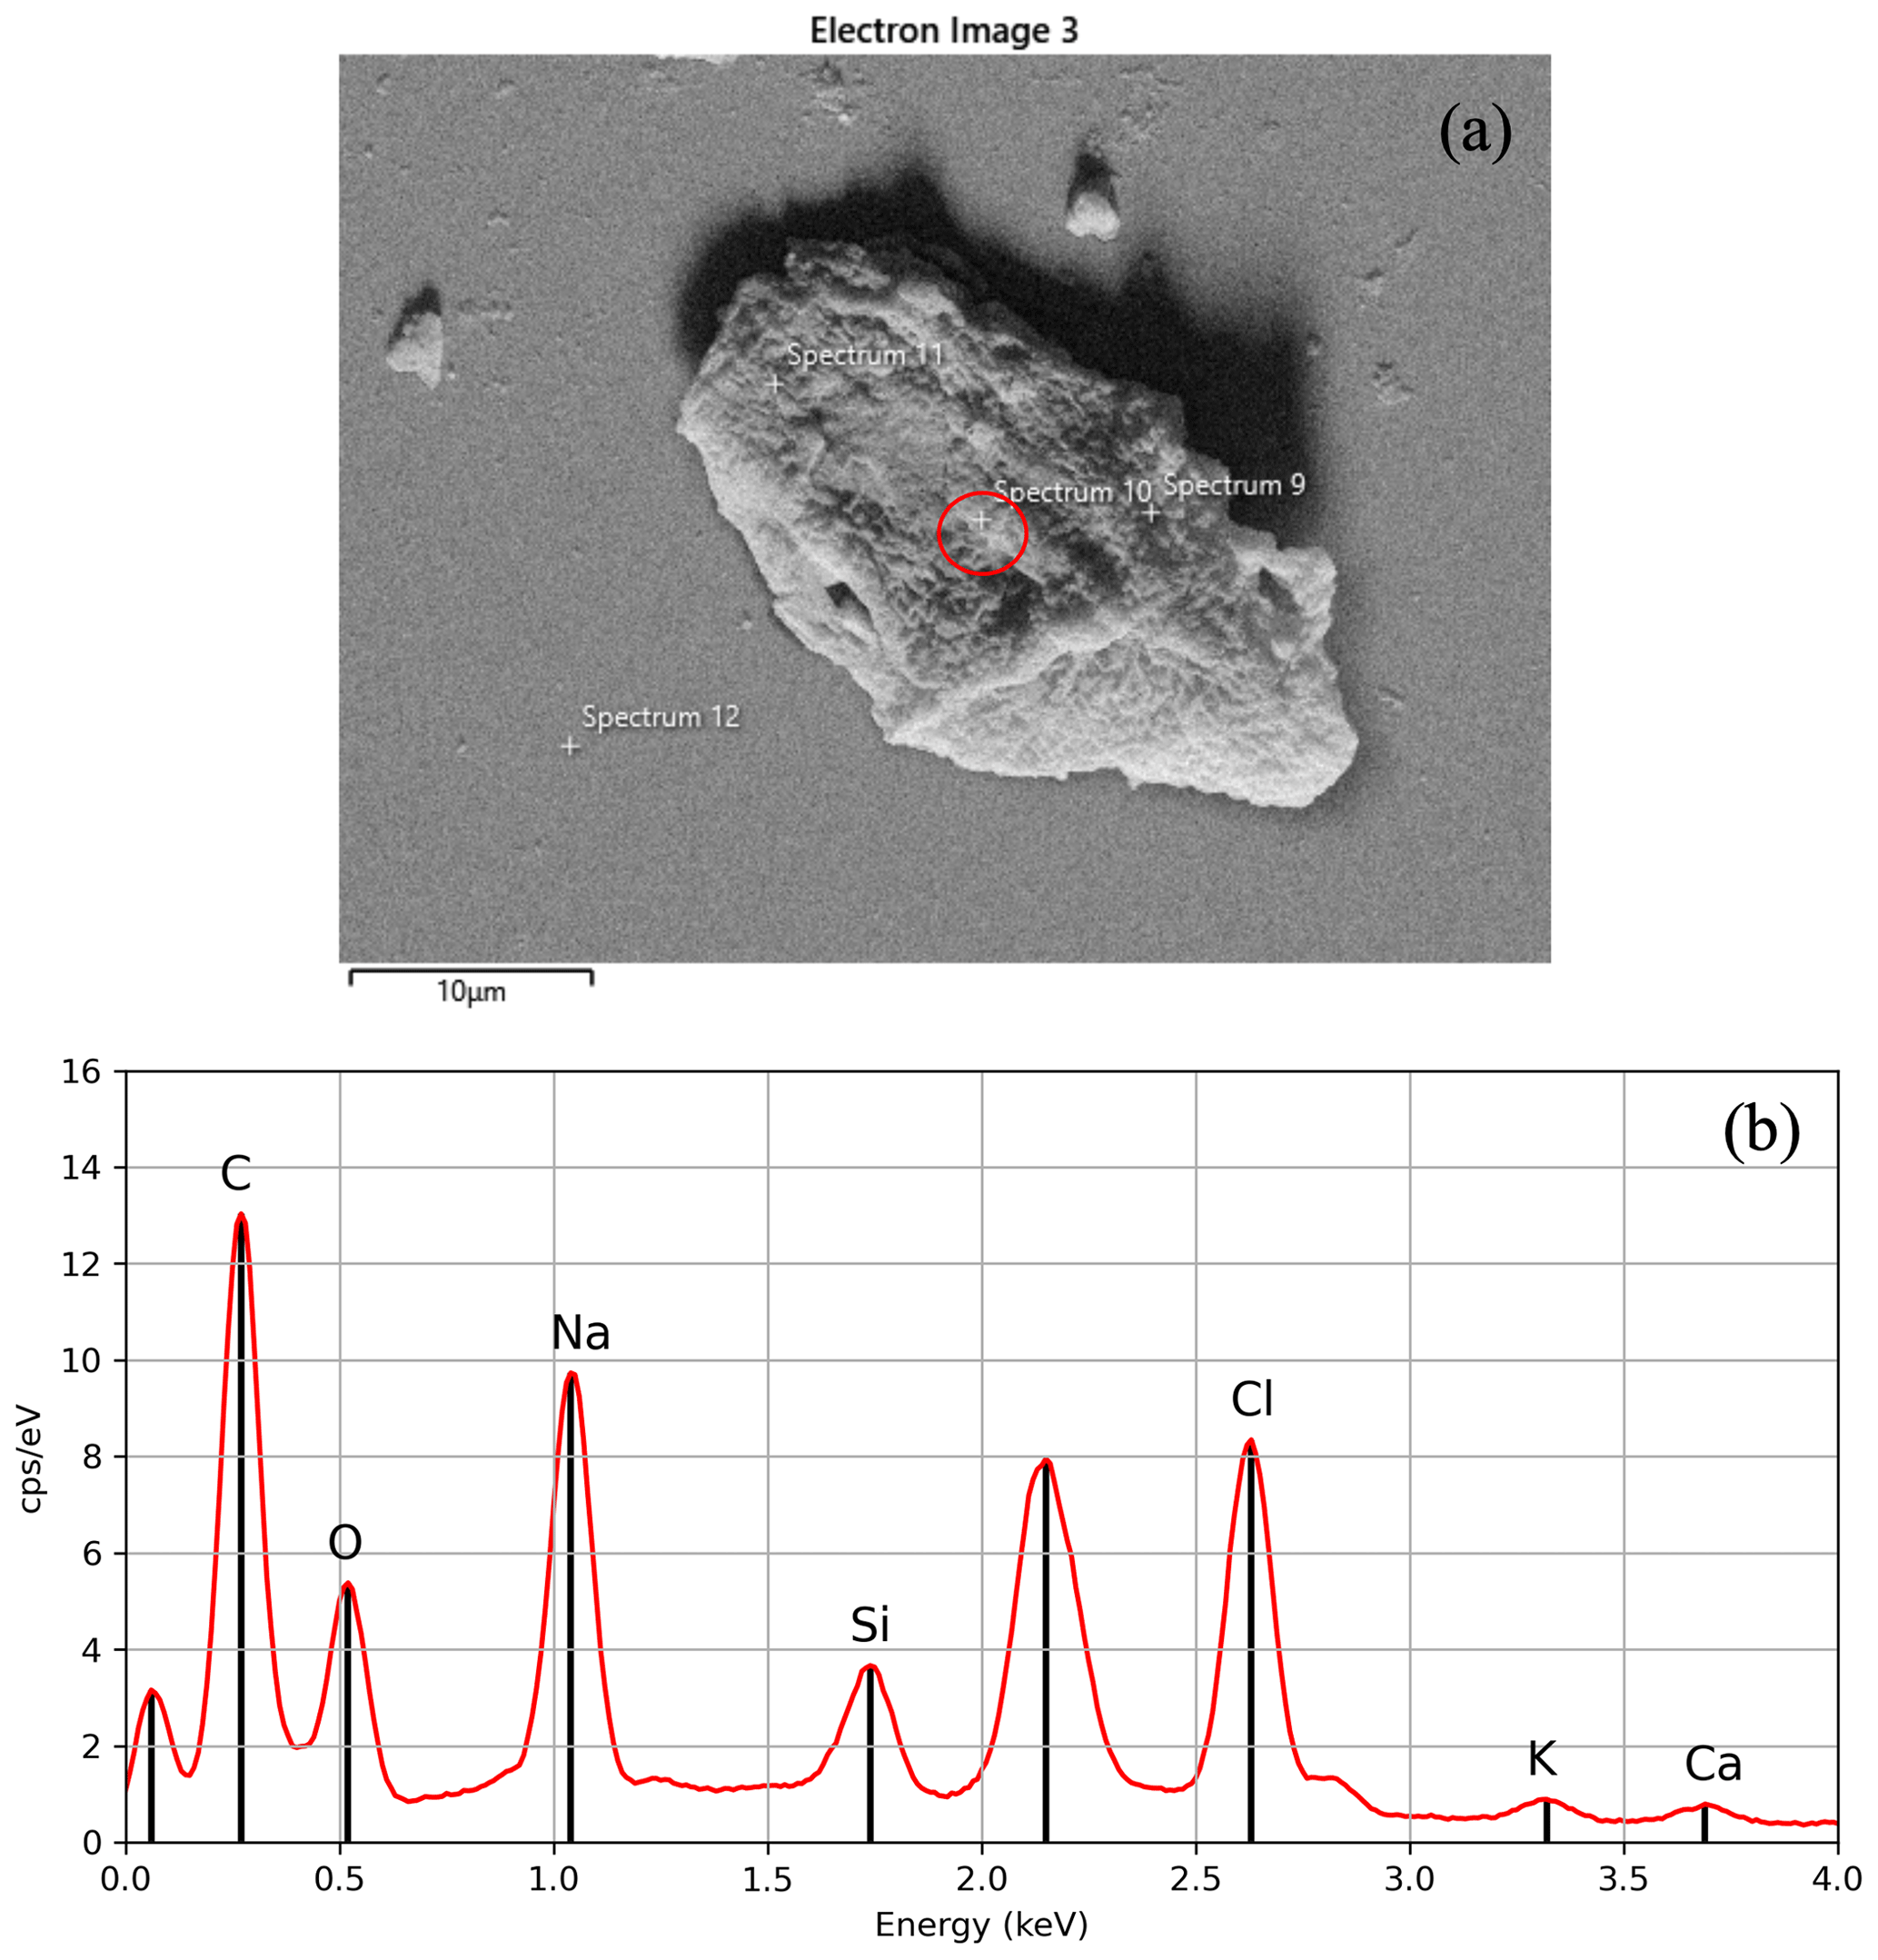
Figure 7(a) A SEM backscattered-electron image for an individual particle categorized as carbon-based with (b) the corresponding EDS elemental composition for that particle. The first peak, closest to 0 keV, is caused by noise from the EDS detector and can be ignored when analyzing the elemental composition of a particle, as it does not represent any actual element. The second spectral peak corresponds to gold (2.12 keV) and was excluded from the analysis since it was used for coating the sample.
The working conditions of the accelerating voltage of 15 kV and working distance of 8.5 mm were set for creating the secondary electron image (also referred to as a micrograph) shown in Fig. 7a. For these conditions, at a magnification of 1.14 k×, particles as small as 1 µm trapped in the Formvar solution are observed in the SEM. These SEM-identified particles are then compared to CLSM image locations to ensure that the same particle from the CLSM imagery is the one being targeted in the SEM (e.g., Figs. 6c and 7a) for EDS spectrum analysis.
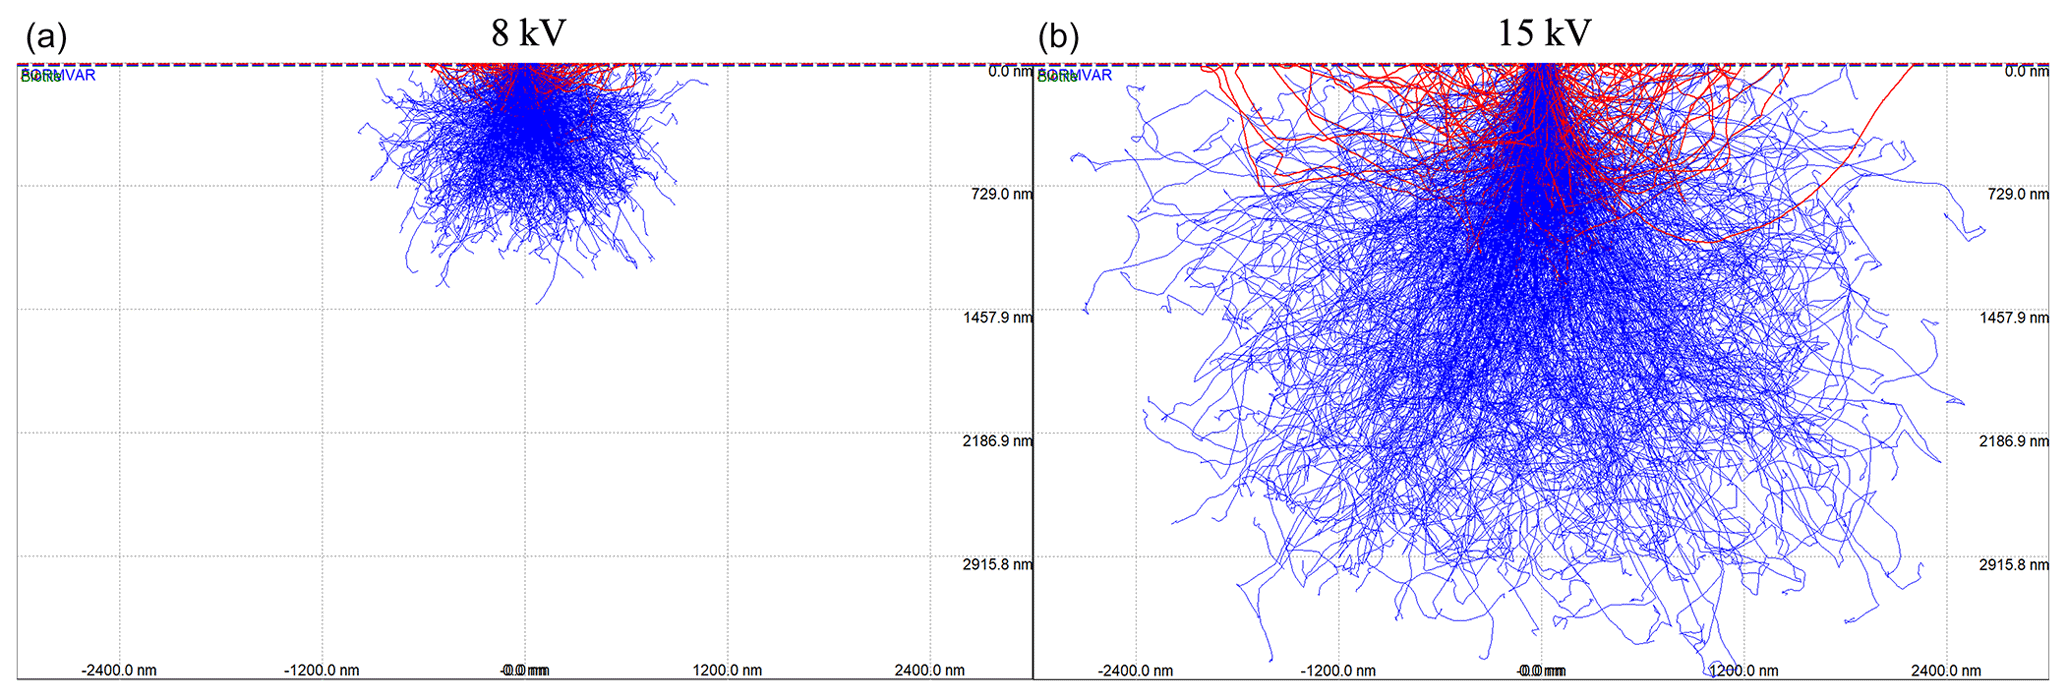
Figure 8Activation volume producing Fe X-rays within the soda–lime glass for 8 kV (a) and 15 kV (b) accelerating voltage from the Monte Carlo simulations. Lines indicate the pathways of individual electrons backscattered from within the sample (blue) and from the sample surface (red) as a function of the particle size (in nm).
EDS analysis is conducted for every particle identified in the SEM imagery to determine the major and minor element composition of the non-soluble particles trapped in the hailstone sample (Fig. 7b) using the same voltage defined for electron imaging. The choice of 15 kV ensures that heavier elements are included in the EDS analysis by exciting the K lines of elements such as Fe. However, owing to attaching the hailstone to a glass substrate, a lower voltage may reduce background noise. Specific to soda–lime glass, elements such as Si, Na, Ca, Mg, K, and Al may be introduced into the EDS spectral analysis from the glass. To evaluate this effect, Monte Carlo simulations of electron trajectories in solids (CASINO; Drouin et al., 2007) were conducted for 15 and 8 kV with 0.25 µm beam (Fig. 8). Results indicate that for a small grain of biotite particle with a 7 nm layer of Formvar, some X-rays are emitted from the glass substrate for particles smaller than 1.5 µm at 15 kV that can be minimized using the 8 kV accelerating voltage. While this suggests that the soda–lime glass can exert minimal impact on the spectral readings for particles down to 1 µm minimum size at 8 kV, a single-point analysis approach can further reduce the potential spectral contamination.
An example of the single-point technique is highlighted in Fig. 7a, where the EDS measurement is first taken at a point within the red circle where no glass substrate is present (i.e., focused entirely on a section of the particle). Multiple single-point measurements made at least 10 µm apart prevent overlap and capture the composition variability through the particle. Multiple EDS point measurements are essential for assuring the representative particle composition for particles showing varying optical properties in the CLSM color imagery (e.g., Fig. 5d). Figure 7b shows the corresponding output from the SEM–EDS analysis of the particle in Fig. 7a. Micrographs of individual particles (e.g., Fig. 7a) and EDS data are crucial in particle classification (e.g., carbonaceous [biological, organic, or inorganic], silicates) based on elemental composition. Additionally, the high-resolution geometry information of each individual particle can be compared to universally known standards to increase the confidence of the particle classification. Micrographs are also complementary in ensuring that EDS spectra are accurately attributed to the same particle analyzed using the CLSM.
The outcomes of the methodology are first applied to a 4 cm hailstone (Fig. 9) and are introduced here to gain insights into the physicochemical properties of non-soluble particles. This hailstone originated from a supercell storm in Villa Carlos Paz, Argentina, on 8 February 2018 (Kumjian et al., 2020; Bernal Ayala et al., 2022). Using our method, we uniquely determine the non-soluble particles' sizes and elemental composition relative to their location in the hailstone. For this methodology, randomly selected particles with a diameter larger than 1 µm were analyzed. As shown in Fig. 9, different cross sections of the same hailstone were selected to measure the particle size distribution, using CLSM and elemental composition via SEM–EDS, preserving the in situ location relative to the embryo.
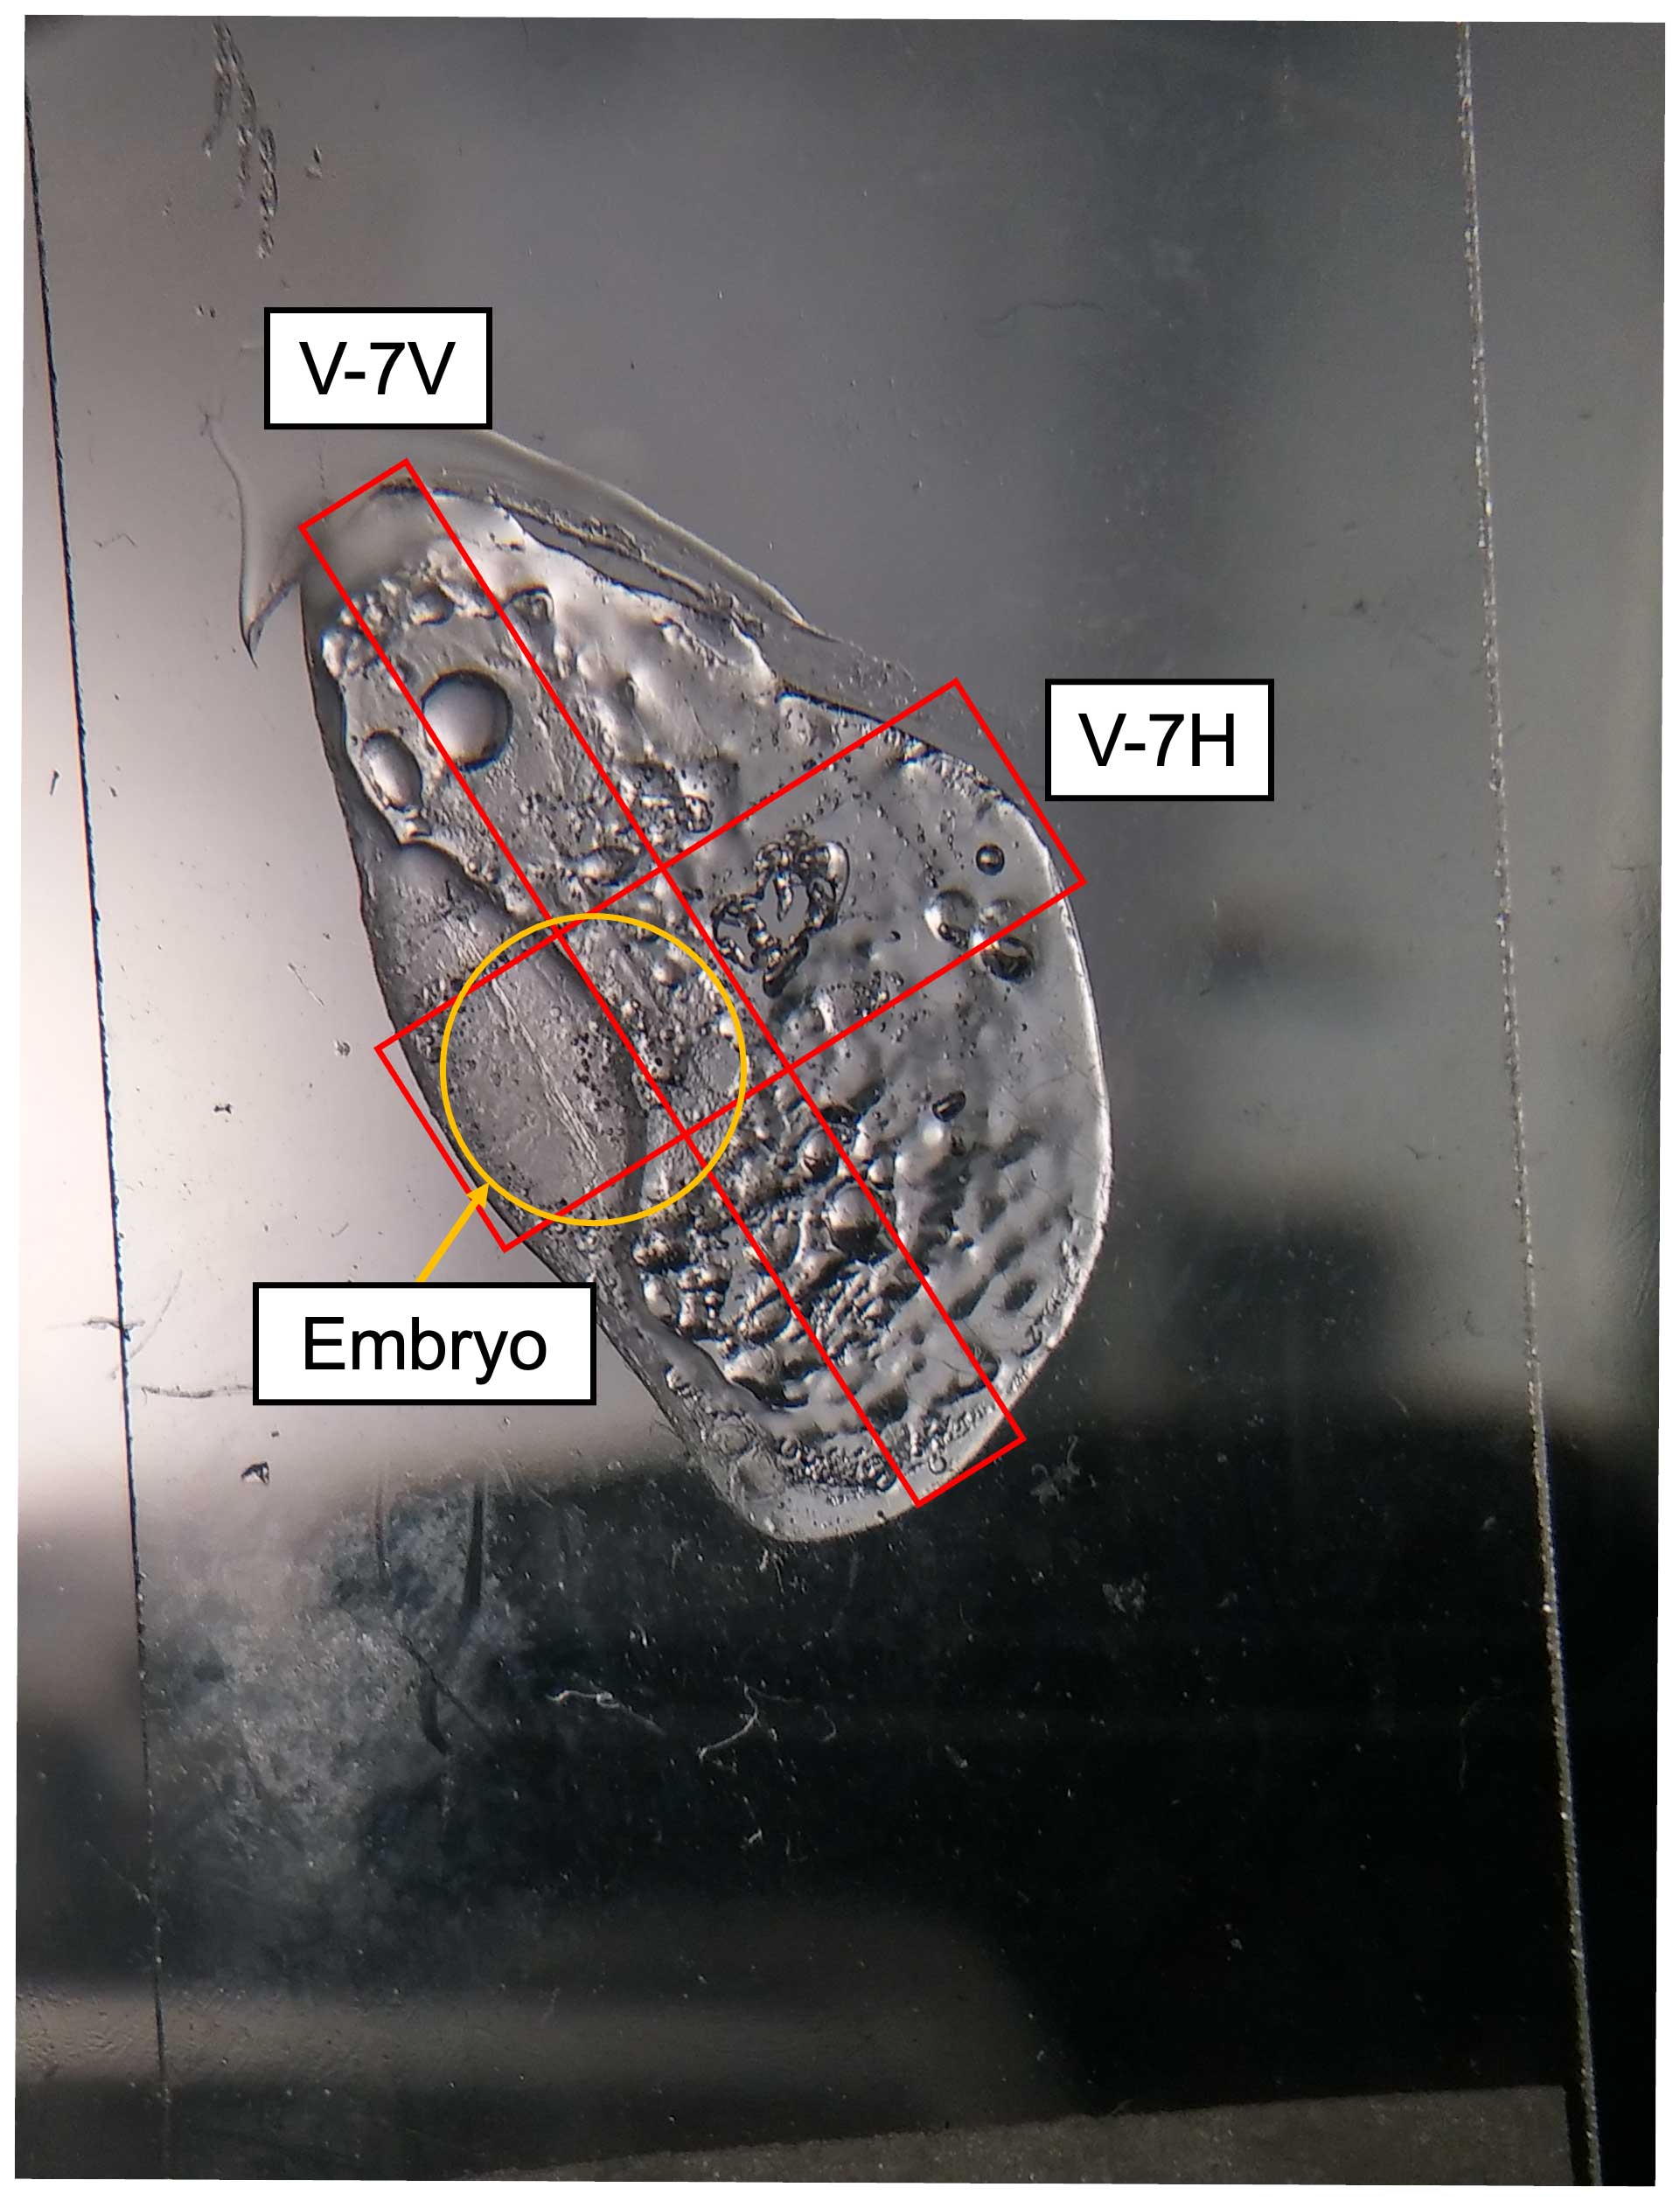
Figure 9An example of an analyzed hailstone (V-7) for which the areas highlighted by red rectangles indicate where particles were randomly selected to measure the particle size distribution, using CLSM and elemental composition via SEM–EDS. The orange circle marks the location of the embryo.
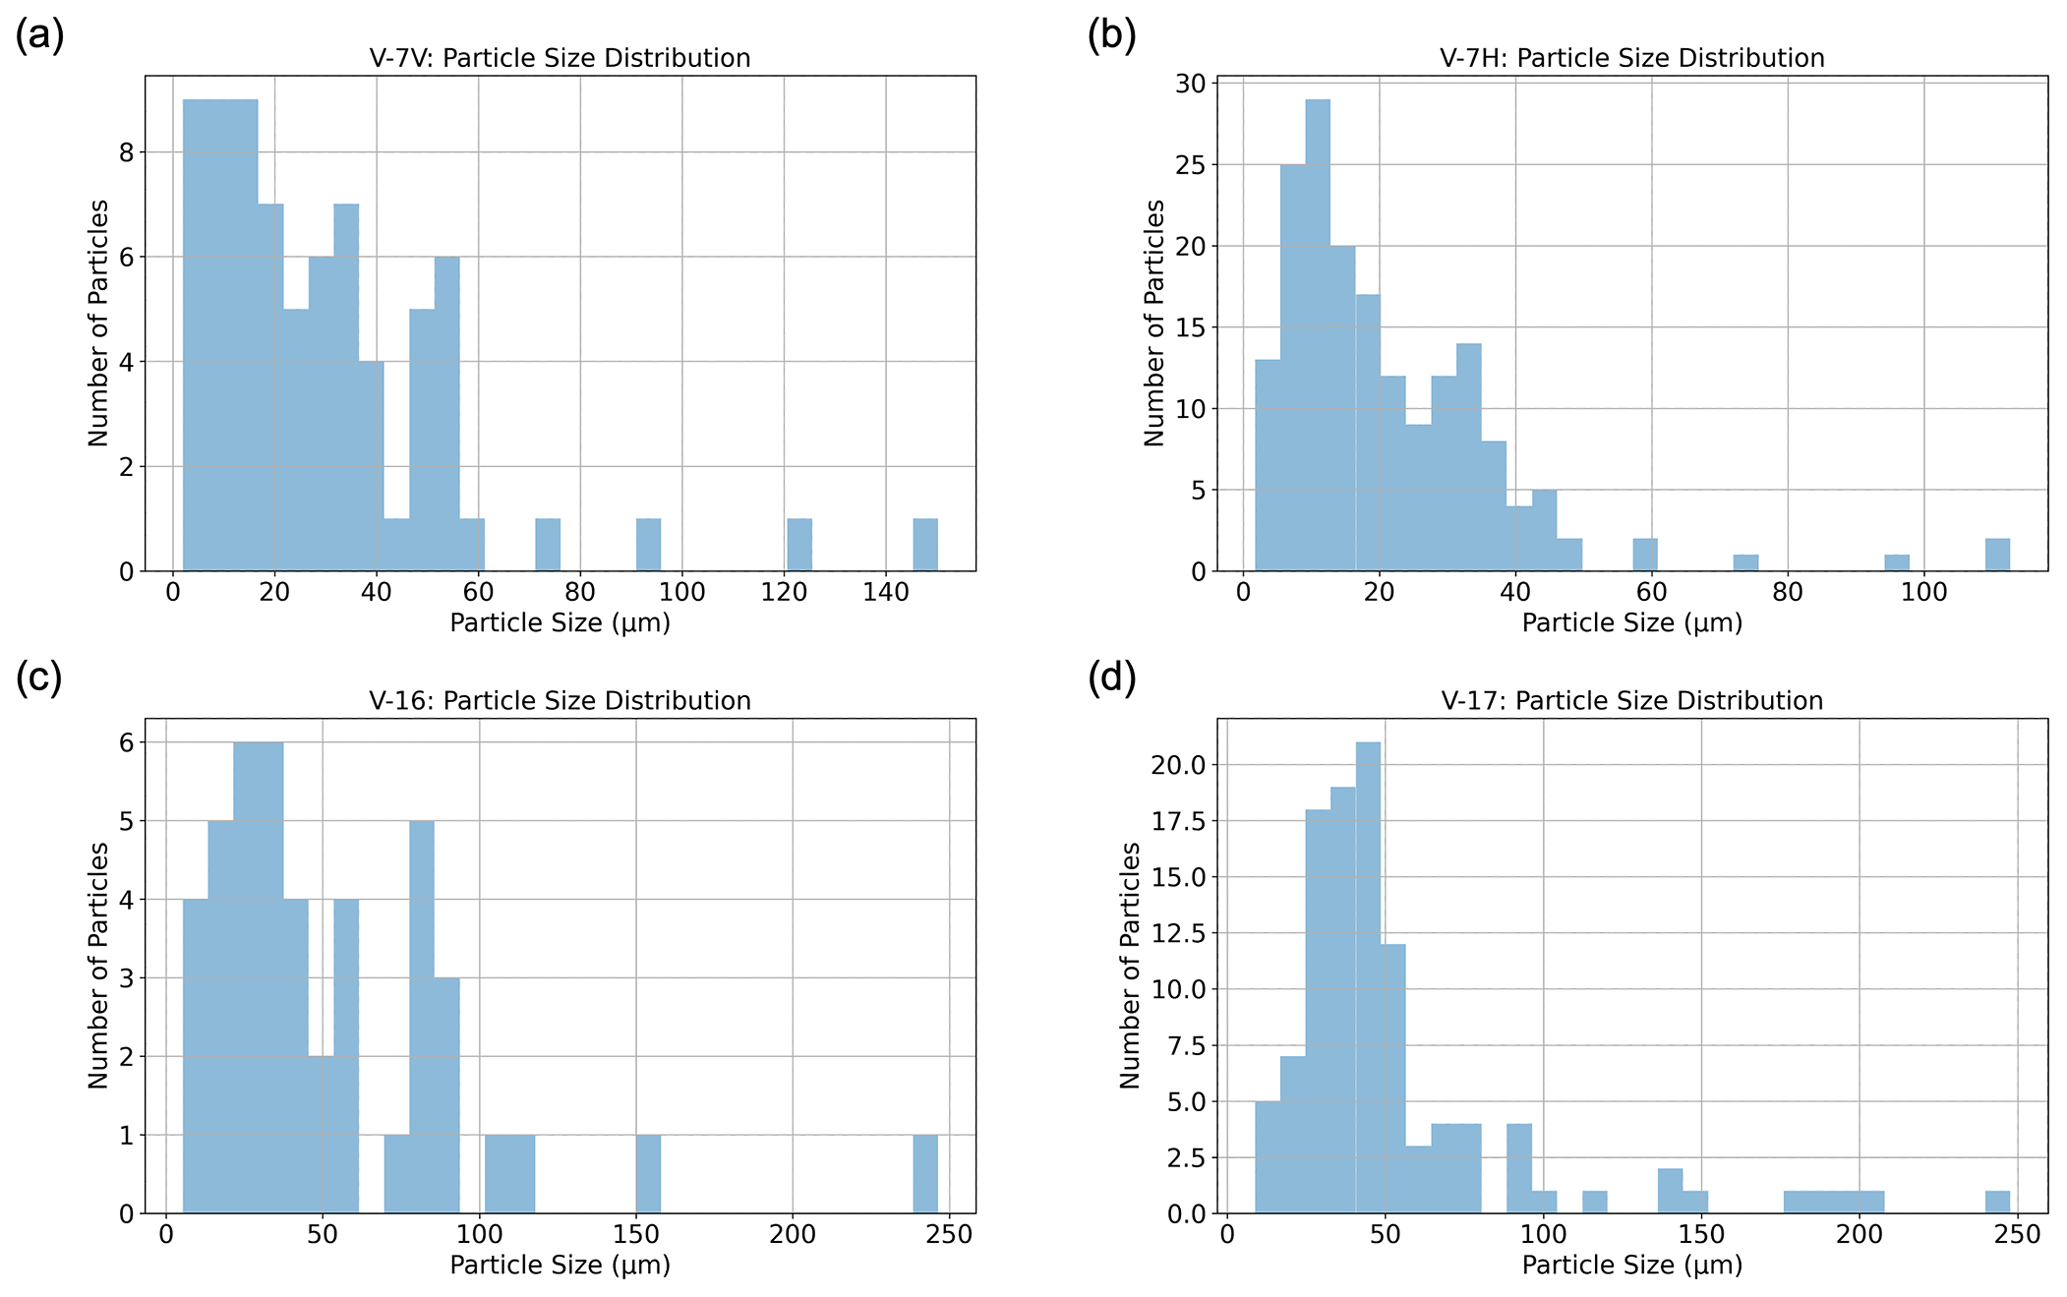
Figure 10Particle size distributions for hailstone samples collected during the event on 8 February 2018. Panels (a) and (b) display particle sizes for two different cross sections from sample V-7, while panels (c) and (d) show particle sizes for samples V-16 and V-17, respectively.
As seen in Fig. 10a–b, the CLSM particle size distribution for V-7 reveals that particles range from 2 to 150 µm. In the V-7V cross section (Fig. 10a), most particles have major axis lengths between 2 and 60 µm, whereas in the V-7H cross section (Fig. 10b), most particles are relatively smaller, falling between 2 and 45 µm. Two additional hailstones of 8 cm each (V-16 and V-17), collected from the same storm, were also analyzed and compared to V-7. The different axis ranges in this figure represent the varying number of particles analyzed and differences in the size range from these differently sized hailstones and, consequently, their analyzed cross sections. Particles in both V-16 (Fig. 10c) and V-17 (Fig. 10d) tend to be larger compared to those in V-7. However, particles larger than 100 µm were identified in all three hailstones collected from the same supercell.
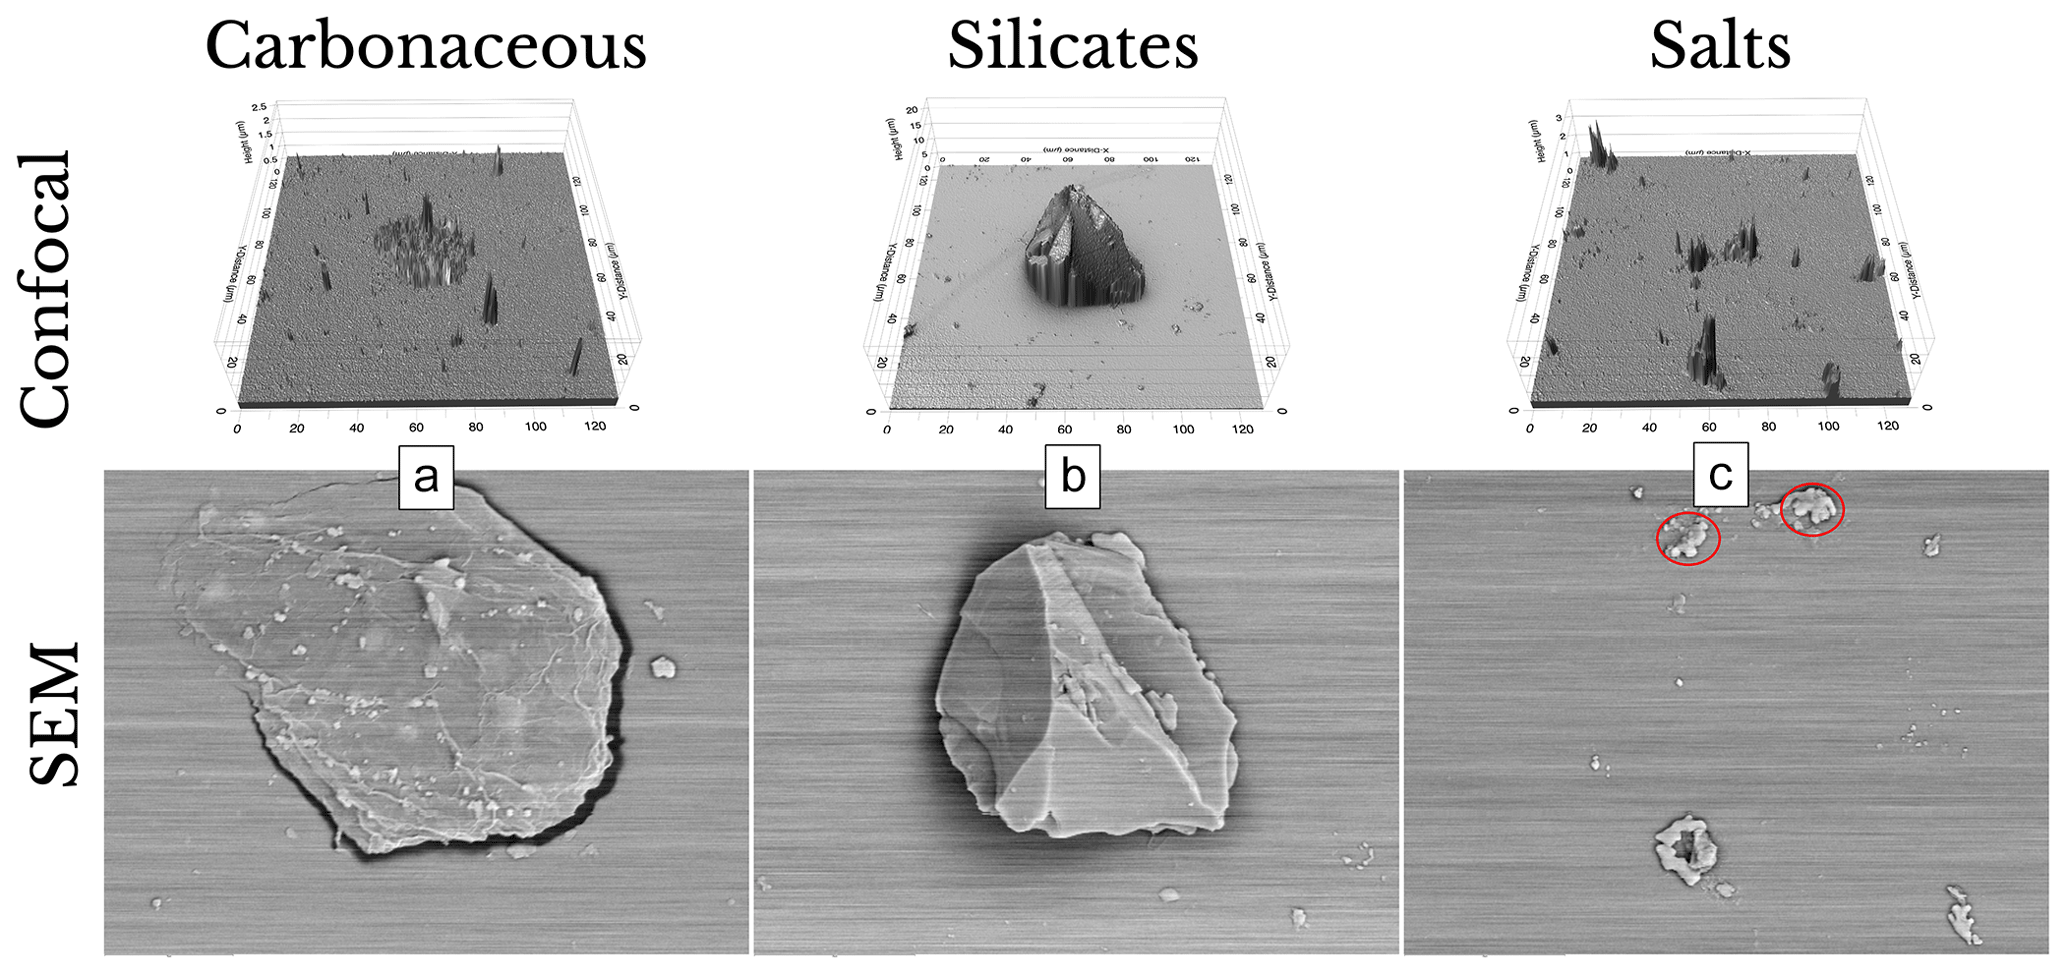
Figure 11Examples from each of the primary particle categories are presented, along with their ProfilmOnline topographical output obtained through a confocal laser scanning microscope (CLSM; top), and accompanied by their corresponding scanning electron microscopy (SEM; bottom) image.
CLSM also provides topographical and shape information about the analyzed particles, as shown in Fig. 11, which is crucial for understanding ice nucleation processes in clouds; however, a detailed analysis of the topography and shape of the particles is reserved for a future publication focusing on the applications of this method. Surface topography is an active site for ice nucleation, influencing nucleation modes and the energy barrier for ice formation. This aligns with findings from Holden et al. (2021), suggesting that surface topography plays a significant role in ice nucleation. Additionally, other laboratory studies (e.g., Gao et al., 2022) have demonstrated that the particle shape, size, and coating can impact the ice nucleation ability of particles, including soot. The paper by Gao et al. (2022) shows that coatings or internal mixing have resulted in different ice nucleation abilities compared to bare particles. Importantly, these studies emphasize that the particle size is not the sole determinant, highlighting the critical role of surface topography and particle shape in influencing atmospheric ice nucleation.
To characterize the elemental composition of the non-soluble particles from the SEM–EDS analysis (e.g., Fig. 7b), a statistically based clustering method was applied based on elemental weight percentages (e.g., Laskin et al., 2012). Prior to the analysis, the types of particles present in the hailstone were unknown, motivating the use of cluster analysis to identify the dominant element within each particle. The Orange k-means clustering algorithm (Demšar et al., 2013) was used, providing silhouette scores of clustering results for various k values, where higher scores indicate better clustering. This approach enabled the identification of particle similarities based on statistical clustering. Subsequently, the predominant element within each category was determined, based on the knowledge of each particle's cluster. This approach resulted in five unique categories: carbon-based (C-based), carbon-based with heavier metals (C-heavy), silicon-based (Si-based), silicon-based with heavier metals (Si-heavy), and chloride-based (Cl-based), as illustrated in Fig. 11 for the three most common categories.
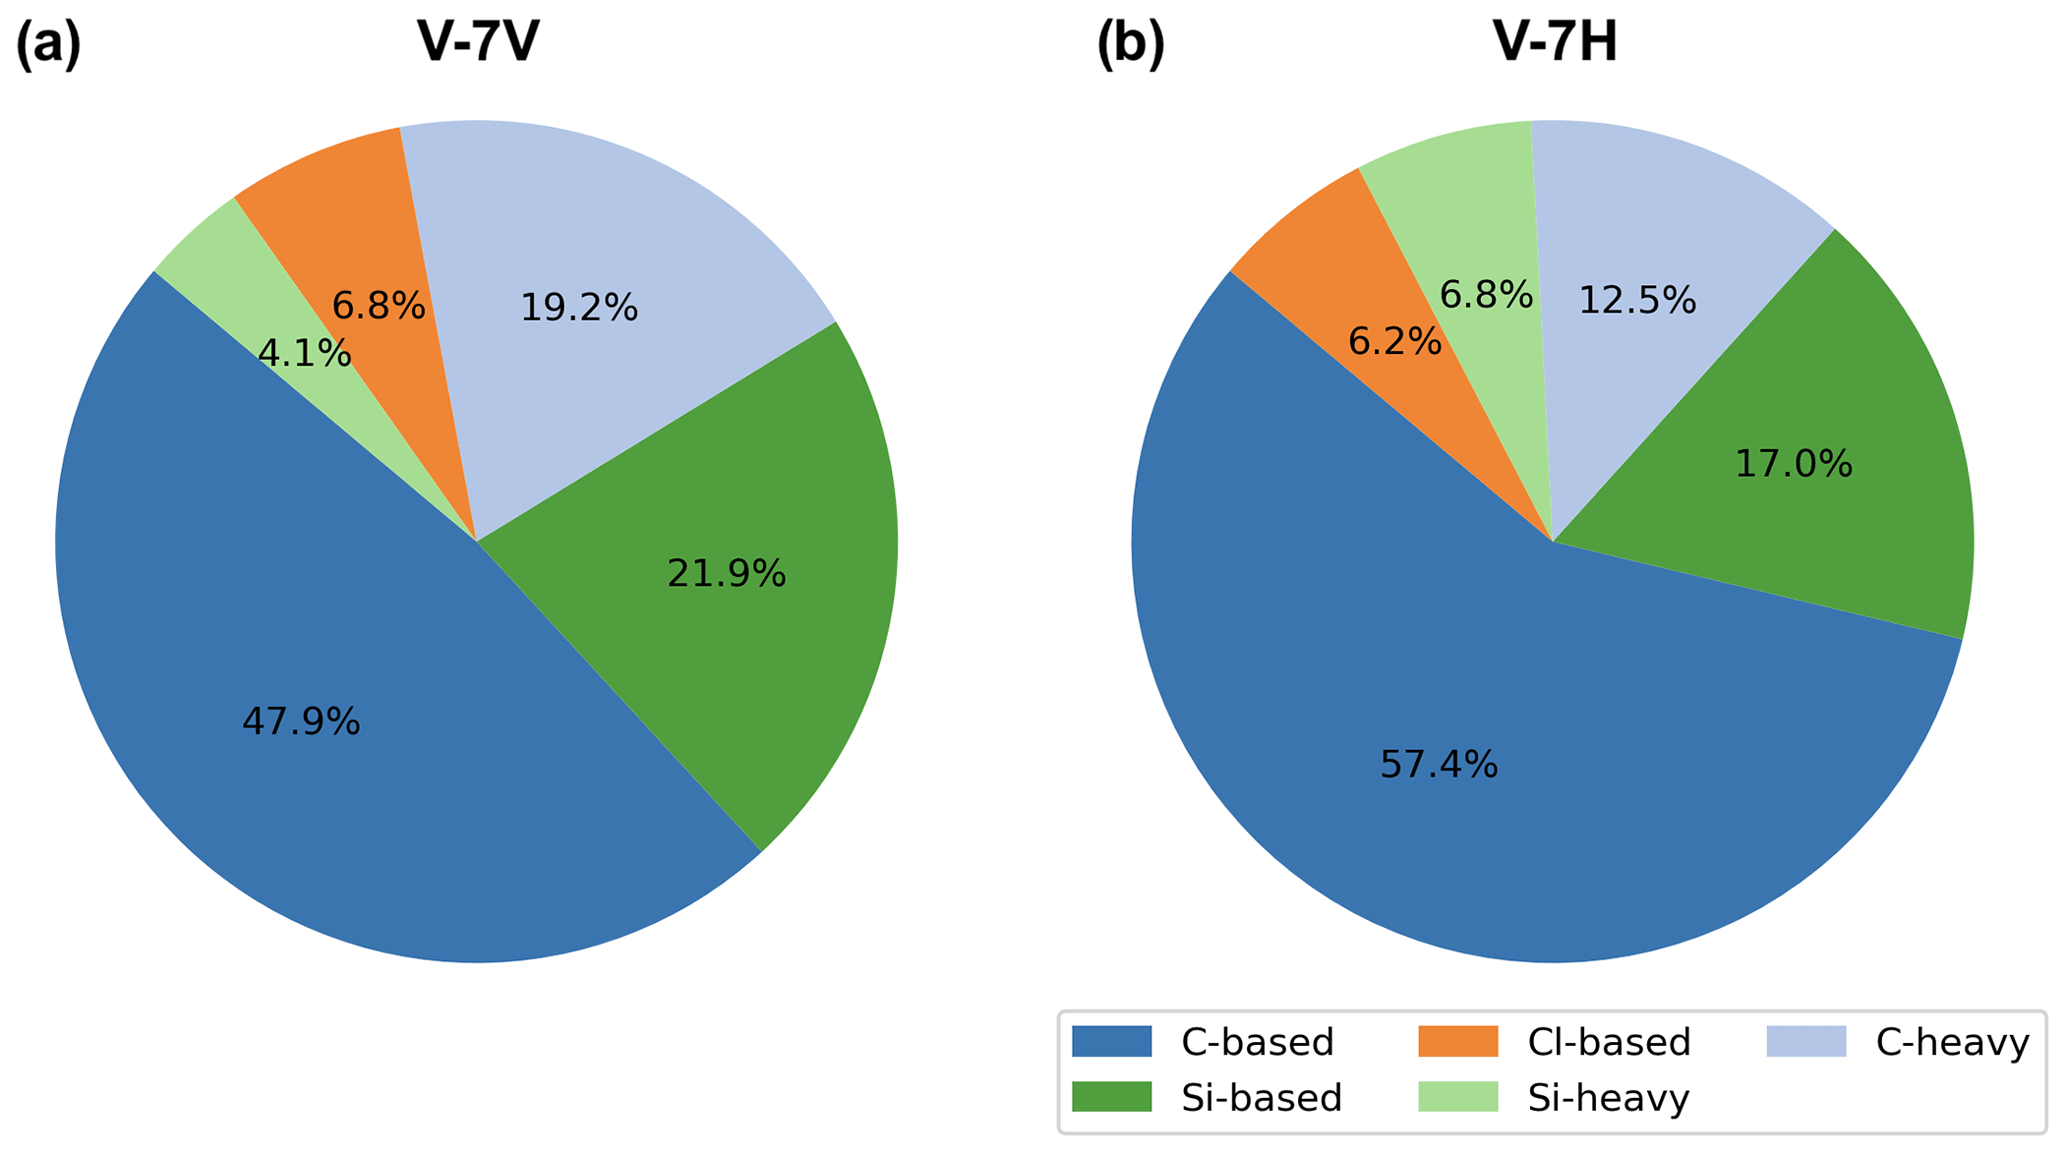
Figure 12EDS-based elemental composition distribution of particles for (a) V-7V and (b) V-7H cross sections, as seen in Fig. 9.
Particles included in the C-based group had a C abundance greater than 10 % weight, with this abundance being higher than that of Cl and Si. Those categorized in the C-heavy group met the same criteria as the C-based group but also had an abundance greater than 1 % weight of heavier metals such as Ti, Cr, Fe, Ni, Zn, Br, and Mo. Particles categorized in the Si-based group had a Si abundance greater than 10 % weight, with this abundance being higher than that of C and Cl. The Si-heavy group met the same criteria but had an abundance greater than 1 % weight of heavier metals such as Ti, Cr, Fe, Ni, Zn, Br, and Mo. Finally, particles with a Cl abundance greater than 10 % weight, with this abundance being higher than that of C or Si, were categorized in the Cl-based group. Using this characterization framework, it was found that most particles in both cross sections of V-7 were carbonaceous (C-based and C-heavy), followed by silicates (Si-based and Si-heavy) and salts (Cl-based), as shown in Fig. 12.
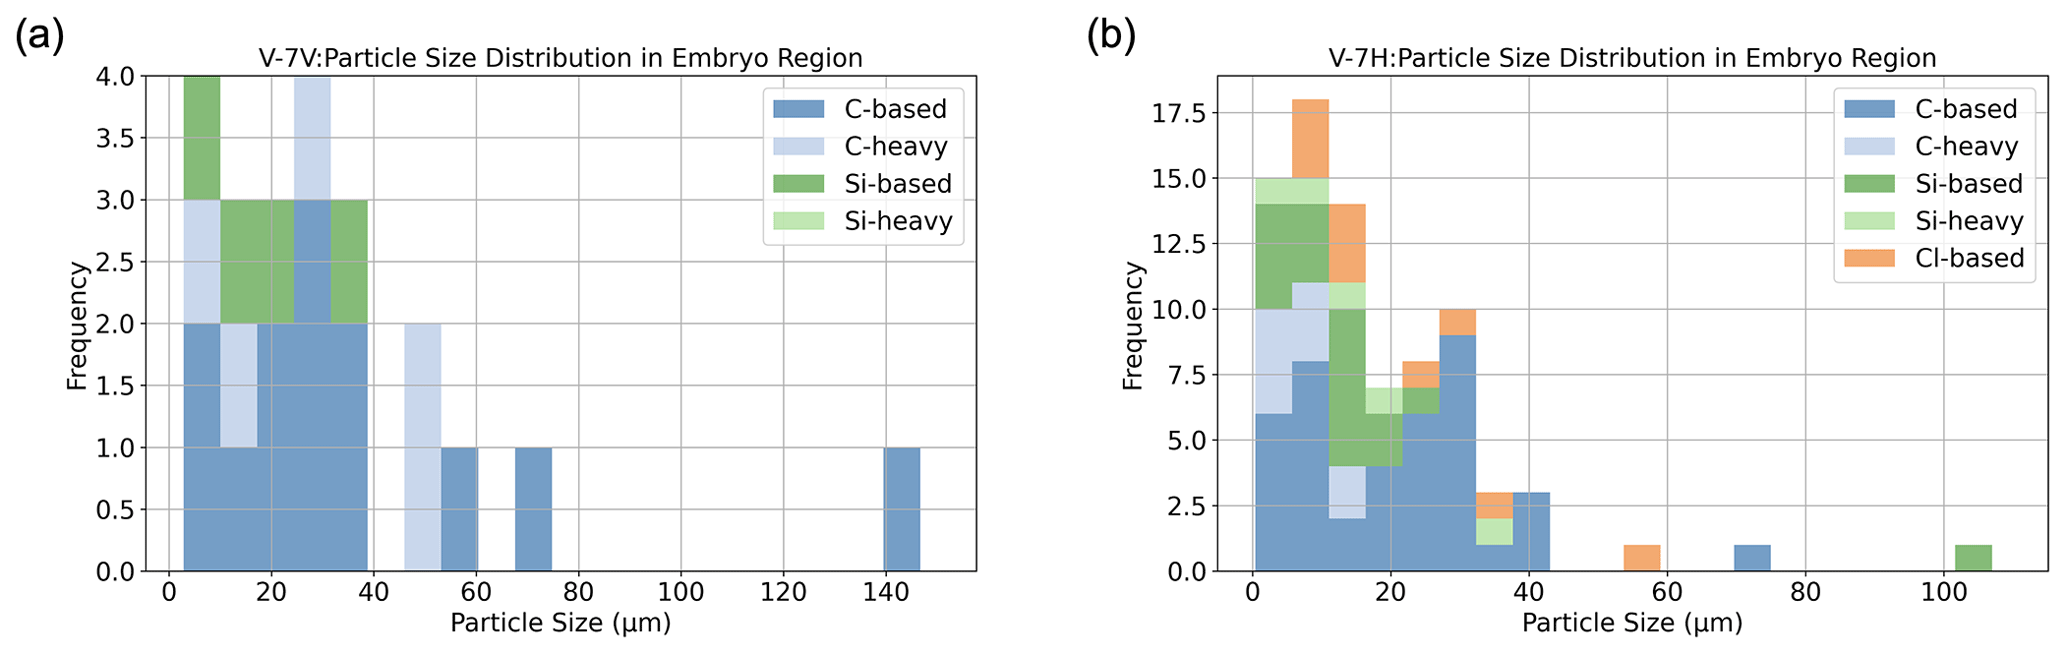
Figure 13EDS-based elemental composition distribution of particles found in the embryo for sample V-7 for (a) V-7V and (b) V-7H.
A benefit of this method is the ability to isolate particles within the embryo compared to the outer layers. This allows the description of both the sizes and elemental compositions of particles that may have served in the nucleation process of the hailstone, similar to Michaud et al. (2014). Figure 13 isolates particles in the embryo regions of the V-7 cross sections, as V-7V and V-7H cross through the embryo (see Fig. 9 for reference). In the embryo region, salts were not identified in the initial analysis of V-7V (as seen in Fig. 13a). However, they were present in the additional horizontal cross section (Fig. 13b; V-7H), along with heavier metals. Different particles were selected within the embryo sample to better elucidate the range of particle characteristics observed within this hailstone's embryo.
In summary, these findings highlight the robustness of our approach, revealing consistent overall messages while emphasizing the benefits of examining multiple cross sections in a single stone. This method is particularly valuable for identifying a diverse range of elemental components. Within hailstones from the same storm, there appears to be a noticeable shift in the particle size corresponding to the hailstone's increasing size, which is an interesting result to explore further. This unique method preserves the particle size and elemental composition relative to the embryo, offering insights into the correlation between the particle size, elemental distribution, and their origins in different cloud regions during hail formation. Such insights will contribute to a deeper understanding of nucleation properties and the source regions influencing hail formation and growth with the application of this technique to additional hailstones from various storm types and environments.
This section discusses some limitations of the microscopy analysis technique, offering suggestions to mitigate these constraints and enhance the analysis by incorporating complementary techniques. A unique aspect of this work is the characterization of individual particles. While beneficial, it is also a time-consuming process. For instance, the analysis examined 176 particles using 9 h of CLSM and 20 h of SEM–EDS. There are pathways to consider when optimizing SEM–EDS analysis. Studies like those conducted by Lata et al. (2021) and Diep et al. (2022) have utilized a computer-controlled SEM–EDS (CCSEM) microscope for elemental chemical composition analyses, enabling the analysis of a larger number of particles, while emphasizing interpretation. A computer-controlled (CC) SEM–EDS system incorporates additional software facilitating automated analysis, including automated sample loading, stage movement, focusing, imaging, and elemental analysis. CCSEM–EDS software can be programmed to autonomously analyze multiple particles consecutively without human intervention (Vander Wood, 1994). Utilizing CCSEM–EDS streamlines the analysis process and optimizes the funds allocated for this instrumentation.
Second, Sect. 3.3.2 noted the potential introduction of elements into the EDS spectral analysis from the substrate, which is glass in this case. As previously mentioned, higher voltages provide a more accurate analysis of heavier elements but can introduce more contamination from the glass. The single-point measurement technique described in Sect. 3.3.2 provides a solution, while introducing more labor-intensive steps to the process. Two recommendations, therefore, emerge: (1) measuring particle-free areas of the glass using the EDS to obtain a control elemental spectrum from the glass or (2) decreasing the accelerating voltage to 8 kV to reduce the background interference and then rerunning the EDS analysis with a higher (e.g., 15 kV) voltage only on those particles showing the presence of heavier elements to increase accuracy in those composition measurements. Varying the voltages in the EDS analysis in the context of this type of particle analysis is uncommon in the literature and may provide more confidence when characterizing non-soluble particles. Furthermore, to validate an individual particle's EDS spectrum result, spectrum mathematical operations were performed using the National Institute of Standards and Technology (NIST) DTSA-II program (Ritchie, 2010) to mitigate potential contamination originating from the glass substrate associated with a specific particle, as illustrated in Fig. 14. The analysis revealed that it is possible to eliminate potential glass-related spectrum contaminants from the particle's spectral results (Fig. 14c) by subtracting the glass-related spectrum (Fig. 14b) from the particle-related spectrum (Fig. 14a). Spectral subtraction of particles from the underlying substrate enables more confident interpretations of element identity and abundance from non-soluble particles mounted on a glass substrate.
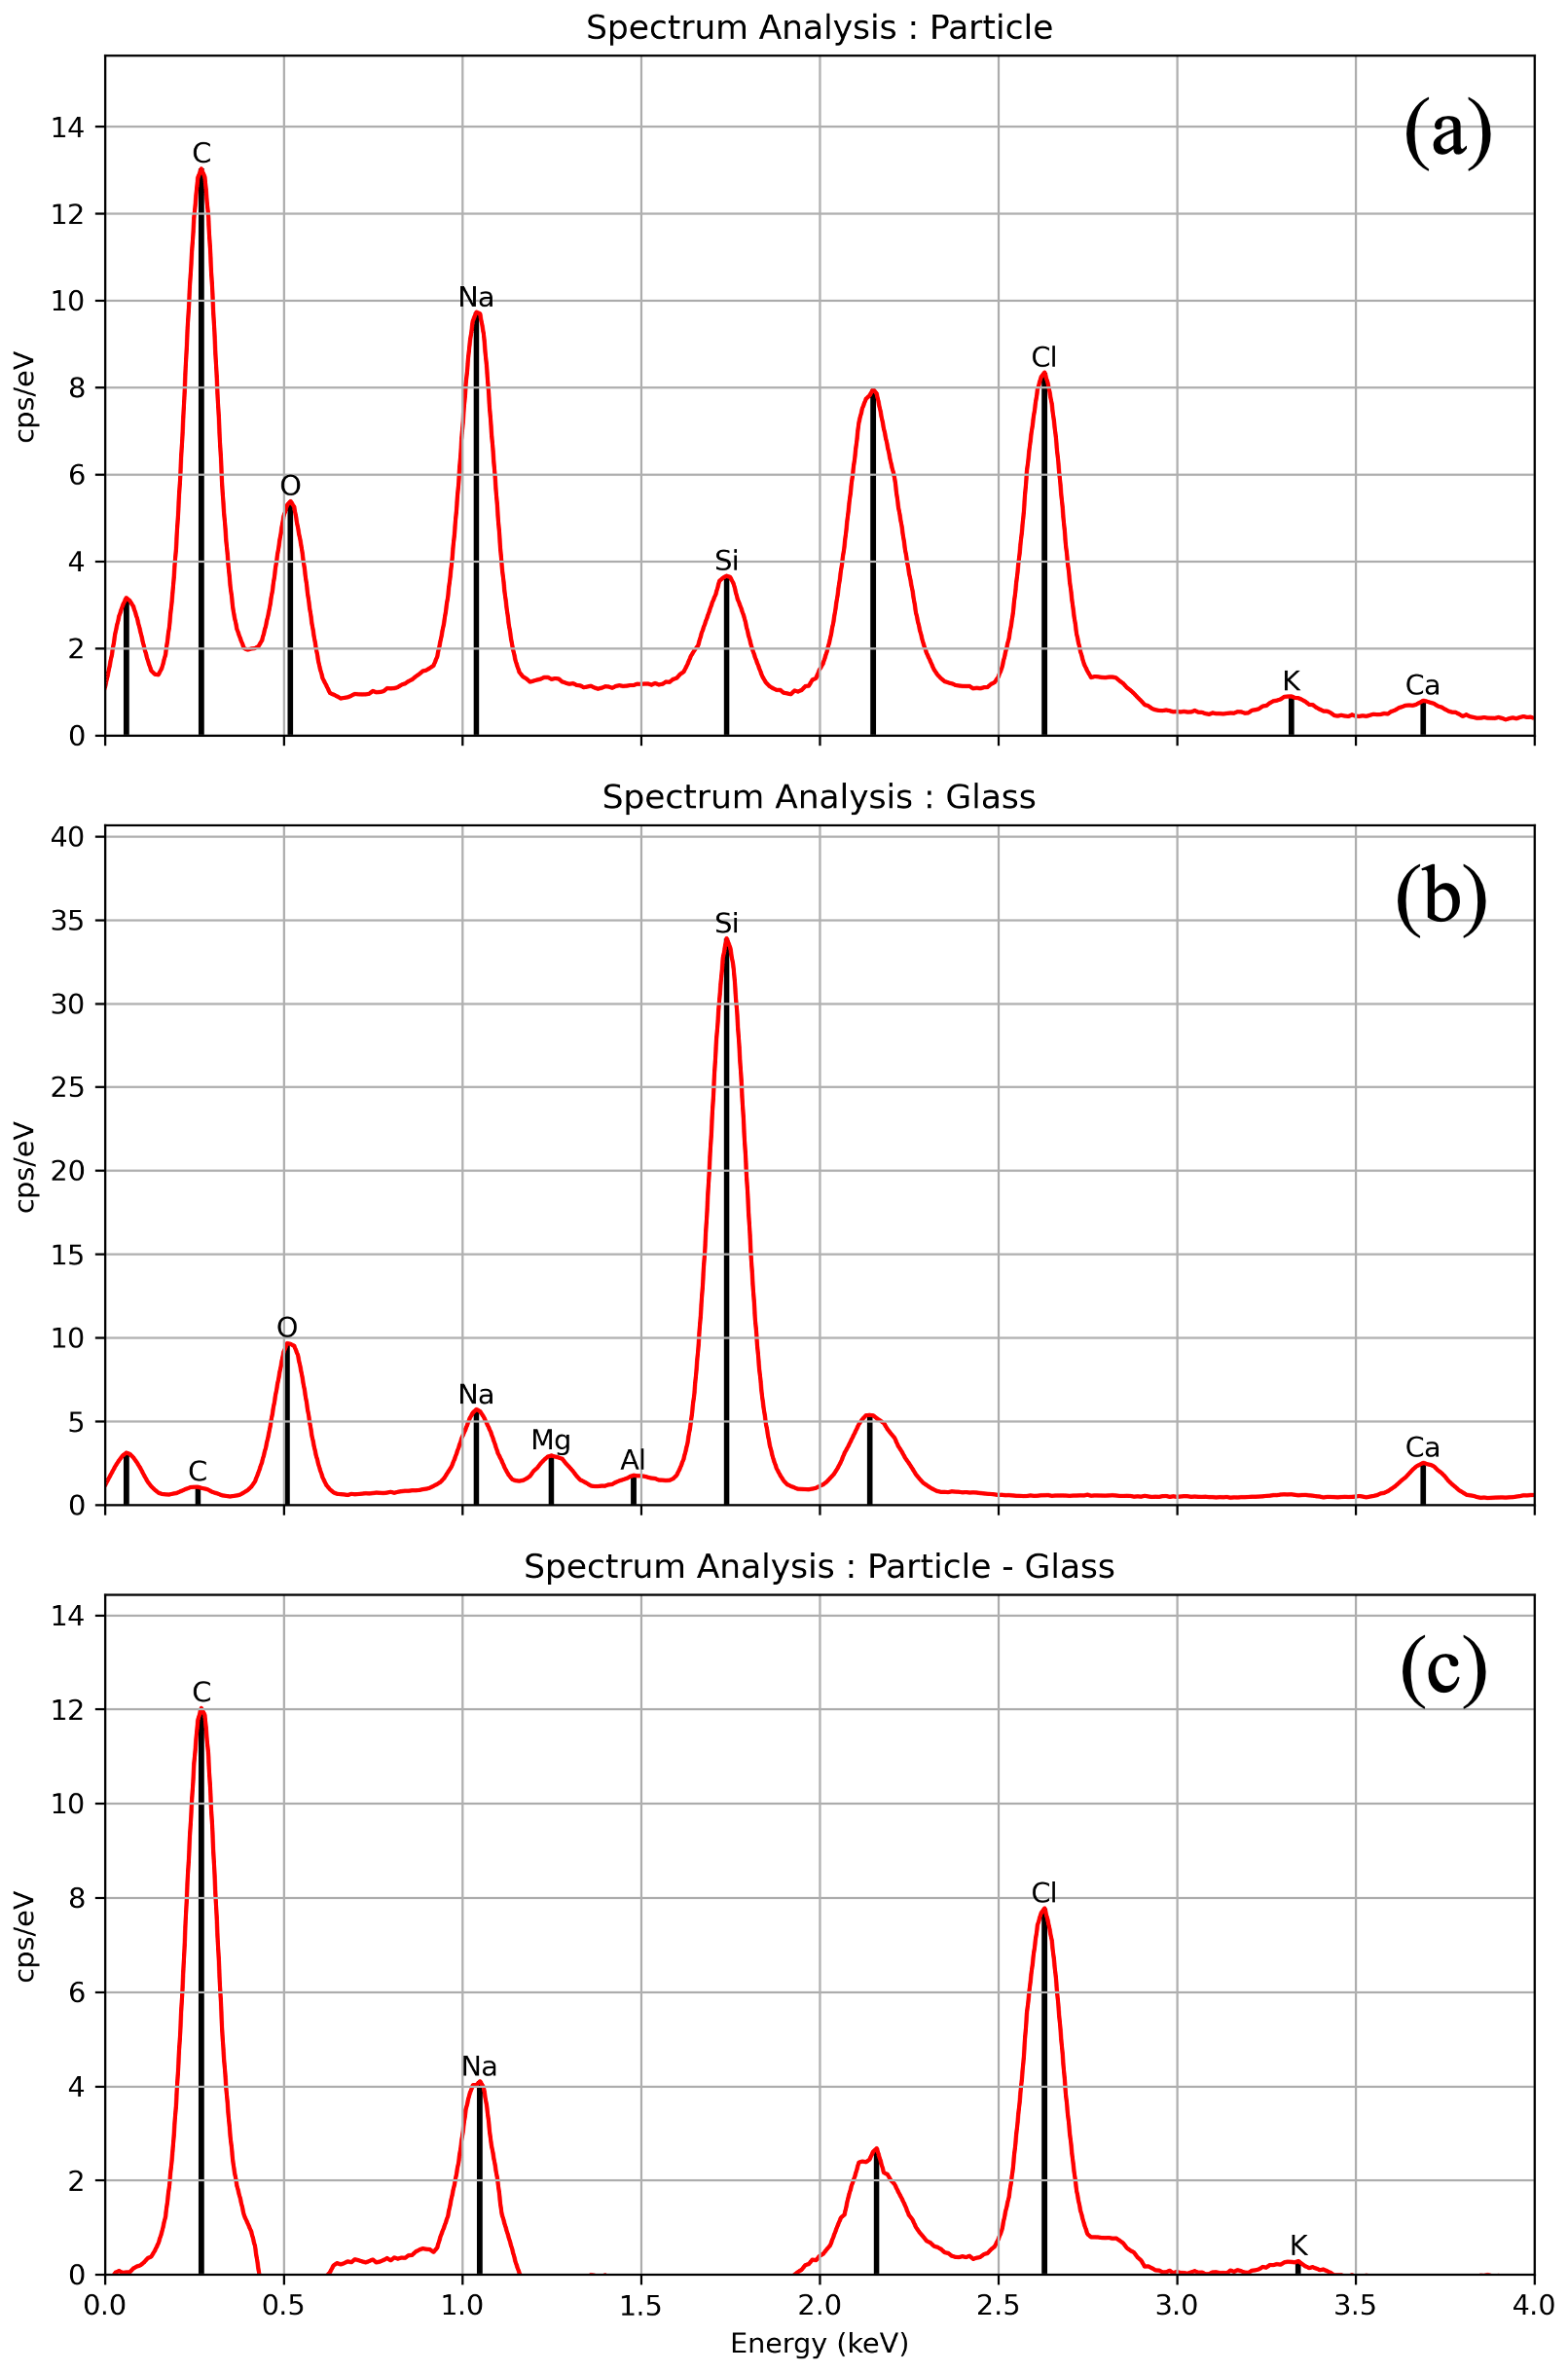
Figure 14Mathematical operations on the spectrum using DTSA-II were done to analyze the EDS spectrum data and differentiate a particle's spectrum from the glass substrate. Panel (a) depicts the spectrum of the particle presented in Fig. 7b. Panel (b) illustrates the spectrum of the glass. Panel (c) demonstrates the outcome of the subtraction, revealing the presence of elements C, Na, Cl, and K in the particle. The first peak, closest to 0 keV, is caused by noise from the EDS detector and can be ignored when analyzing the elemental composition of a particle, as it does not represent any actual element. The second spectral peak corresponds to gold (2.12 keV) and was excluded from the analysis since it was used for coating the sample.
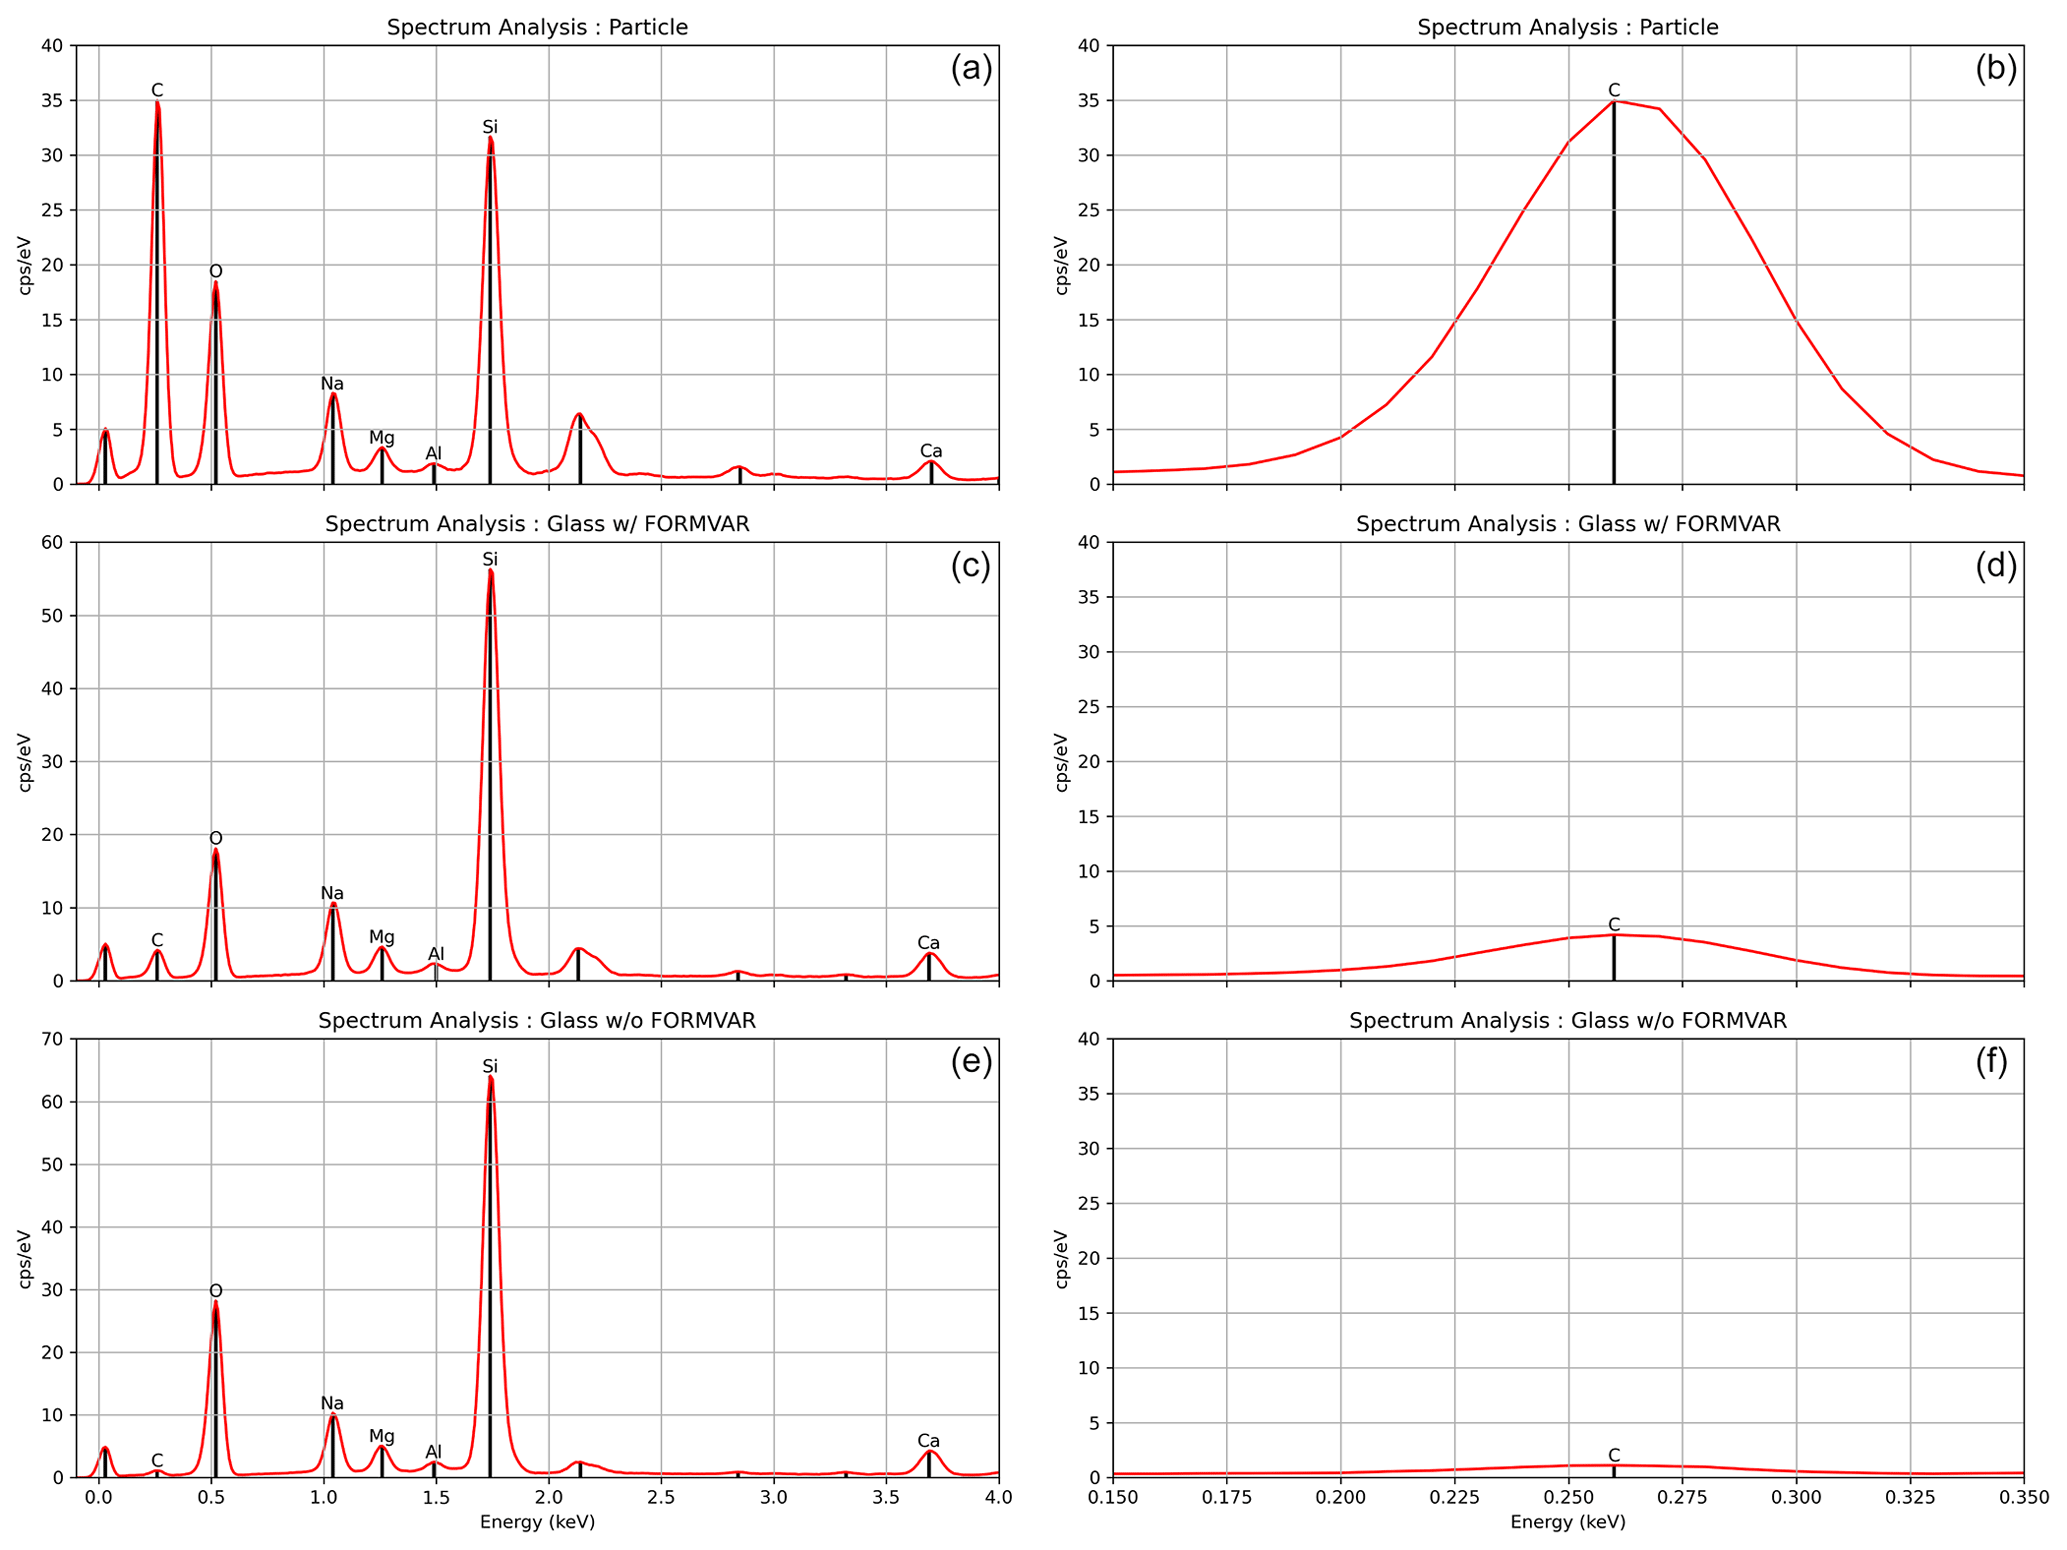
Figure 15Panels (a), (c), and (e) display a single-point spectral analysis of a C-based particle with Formvar (a), a clear area with Formvar (c), and a clear area without Formvar (e). Each panel in the figure to the right (b, d, f) is the corresponding panel providing a closer view of the C peak. Due to Formvar's thickness and the results in this figure, the Formvar layer's impact on the C peak is considered negligible. The first peak, closest to 0 keV, is caused by noise from the EDS detector and can be ignored when analyzing the elemental composition of a particle, as it does not represent any actual element. The second spectral peak corresponds to gold (2.12 keV) and was excluded from the analysis since it was used for coating the sample.
Due to the chemical composition of Formvar, the decision was made to quantify the contribution of C to the EDS spectral results when analyzing C-based particles using this technique. Potential C signals were compared in clear glass sections (i.e., not containing visible particles) with and without Formvar. Additionally, C signals associated with particles categorized as carbonaceous were examined to discern any significant differences in the presence of C. Results confirm minor contributions of C from Formvar, as illustrated in Fig. 15. Due to its minimal thickness, the impact of the Formvar layer on the C signal is deemed negligible.
Further analysis using different microscopy techniques should be explored to more precisely categorize carbon-based particles into biological, organic, and inorganic categories. For example, Raman spectroscopy could aid the particle characterization by complementing the SEM–EDS analysis, which does not provide enough information to discriminate different forms of Carbon in the sample. Raman spectroscopy is a non-destructive chemical analysis technique that provides insights into a material's chemical structure, phase, polymorphy, crystallinity, and molecular interactions (Orlando et al., 2021). This technique yields unique chemical fingerprints, enabling swift identification and differentiation from other substances (Dahal, 2022). By combining Raman spectroscopy with complementary imaging methods, like the SEM–EDS analysis used in this study, researchers could compare Raman distribution maps with topographical or morphological images, correlating Raman spectra with complementary SEM–EDS elemental information.
Additionally, scanning transmission X-ray microscopy (STXM) coupled with near-edge X-ray absorption fine-structure (NEXAFS) spectroscopy can be explored to distinguish between organic and inorganic carbon (Lehmann et al., 2005; Moffet et al., 2011; Fallica et al., 2018; Lata et al., 2021). NEXAFS spectroscopy exploits the photoexcitation of electrons from a core level to unoccupied molecular orbitals to probe the specific chemical environment of a given element (Fallica et al., 2018). Mapping the distribution of organic carbon at the K-absorption edge of carbon could aid in further distinguishing between organic and inorganic carbon, since STXM and/or NEXAFS applications have been used in atmospheric aerosol research (Moffet et al., 2011; Lata et al., 2021) and soil mapping research (Lehmann et al., 2005) to improve organic and inorganic carbon characterization.
Analyzing hailstone samples through the proposed methodology offers a promising avenue for gaining deeper insights into hailstones' composition, structure, and properties. This method has addressed and resolved several limitations observed in previous studies of collected hailstones by shifting the focus from melting to sublimating the hailstone, thus preserving the in situ particle distribution of all non-soluble particles within hailstones. This approach enables the identification of individual particles across each layer of the hailstone, including the embryo and air bubble rings. This approach, therefore, provides a precise representation of the particle distribution and allows for the correlation of these data with the corresponding rings associated with specific growth zones within the cloud.
The integration of CLSM and SEM–EDS combines two powerful analytical techniques contributing to a comprehensive understanding of hailstones' microphysics and developmental processes. CLSM enables the characterization of non-soluble particles, revealing insights into particle size, surface topography, and early-ice-nucleation stages. SEM–EDS complements this by providing detailed elemental compositions, facilitating particle classification based on composition. Using a protective porous plastic coating preserves the sample integrity, ensuring comprehensive analysis of particle spectra. These findings underscore the method's robustness in identifying diverse elements and revealing correlations between particle size, elemental distribution, and their origins in different cloud regions during hail formation. Applying these methods to hailstones from the same storm allowed us to isolate the particle characteristics within the embryo, highlighting a noticeable shift in particle size with increasing hailstone size and providing opportunities for new insights into our understanding of nucleation properties and factors influencing hail growth.
While this proposed method offers significant advantages in providing more comprehensive data on the individual non-soluble particles trapped in a hailstone, it has some limitations. The optimization of human resources could be achieved by incorporating a CCSEM–EDS microscope, allowing for a more efficient allocation of time toward the interpretation of each individual particle's species. Additionally, while efforts have been made to minimize the impact of the glass substrate background noise on EDS spectral analysis, caution should still be exercised when interpreting spectral results, especially for particles near the lower particle size limit.
The innovative approach outlined in this paper presents a valuable contribution to the field of hailstone analysis. By combining powerful and high-resolution microscopy techniques and meticulous sample preparation, researchers can better uncover the intricate details of hailstone composition and properties, which can give insights into hail developmental processes. When applied to additional hailstones from different storm types and environments, this method will enhance our understanding of atmospheric particles' role in hailstone microphysics and contribute to advancements in weather forecasting, mitigation strategies, and climate change modeling.
There are risks involved throughout the acquisition process and subsequent handling, leading to potential contamination and particle loss. Possible contamination sources during the processing of a hailstone may include the ultrapure water used, laboratory air, air from the dry container (silica gel dish), and the Formvar solution. The adapted sublimation particle separation procedure (described in Sect. 2.4) reduces these contamination sources compared to traditional methods that melt hailstones because the hailstone never transitions to the liquid phase; the diffusion coefficients of contaminants for the liquid phase (at 0 °C; m2 s−1; Pruppacher, 1972) are at least 1 order of magnitude higher than in the solid phase (ice; m2 s−1; Petrenko and Whitworth, 1999). Nevertheless, a systematic approach is needed to identify and manage potential contamination sources, including the operator, the working environment, and the materials and tools employed in processing the sample until the particle deposit is completed and the sample is ready for further microscopy analyses.
The subzero facility used for the development of the microcopy method is composed of two rooms, namely a pre-chamber (entry chamber) and a working chamber; this approach is to minimize the introduction of possible contaminants when processing samples. Metal walls and floors were first cleaned with a detergent solution, rinsed with tap water, and disinfected with sodium hypochlorite (commonly used as a disinfectant and bleaching agent); this was done using water with low-lint mops without typical cleaning chemicals, rinsing for a second time with clean water, and later rinsing for the last time with ultrapure water. The rooms do not have an air-filter system. Due to the absence of a filtration system, given that the hailstone consists of ultrapure water, it is particularly susceptible to absorbing airborne impurities, which could compromise sample integrity. However, due to the objectives of this method, this was not a concern at this time, since this procedure is only meant to prevent contamination as much as possible without having to spend significant funds on chemical decontamination services – hence only achieving a quasi-clean room for hailstone preparation. All the equipment used to process thin sheets of ice was also washed with ultrapure water. The glass slides were degreased with a non-ionic detergent and then rinsed multiple times with ultrapure water. The slides were then dried in a clean, quasi-closed container at room temperature without a paper towel. Every operator used protective suits for the cold with an external waterproof fabric. The suits were washed using traditional detergent and rinsed multiple times using water alone. Each operator wore two gloves: the base was made of wool for protection from the cold, and a second latex glove was on top. Common plastic glasses for eye protection were used.
Beyond the risk of introducing contaminants into the substrate, certain particles might move from their original location during handling or in coating procedures affected by vacuum pressures needed for SEM–EDS analyses. As previously mentioned, a way to address this limitation is to apply a Formvar solution film over the sample. Determining the ideal plastic coating layer thickness is essential to using the adapted sublimation method effectively described in Sect. 2.3. Achieving the right mixture of Formvar and ethylene dichloride is essential; the layer must be sufficiently thick to trap particles in the hailstone, while remaining thin enough to reduce the sublimation duration (24 to 48 h and not weeks). Additionally, it must be thin enough to allow the SEM electron beam to penetrate the plastic coating to analyze particles, as seen in Fig. 1.
Because Formvar is transparent, the plastic layer thickness presents no major limitations to analyzing particles in a sublimated hailstone sample with the CLSM. However, the thickness limitation is of greater concern when preparing the sample for SEM–EDS analysis to determine the elemental chemical composition of particles. For samples to be analyzed using the SEM, they must be coated with a layer of electrically conductive material, typically with a layer of a metal coating, with thickness of the order of 25 nm, in a vacuum environment of mbar. Additionally, after coating, the sample is inserted into a chamber in the SEM instrumentation that undergoes a vacuum of mbar or greater. If no plastic coating was applied to the sublimated hailstone sample, then the vacuum process in both previously described scenarios could remove particles, which makes it essential that the sample is covered with a protective film that keeps the particles trapped.
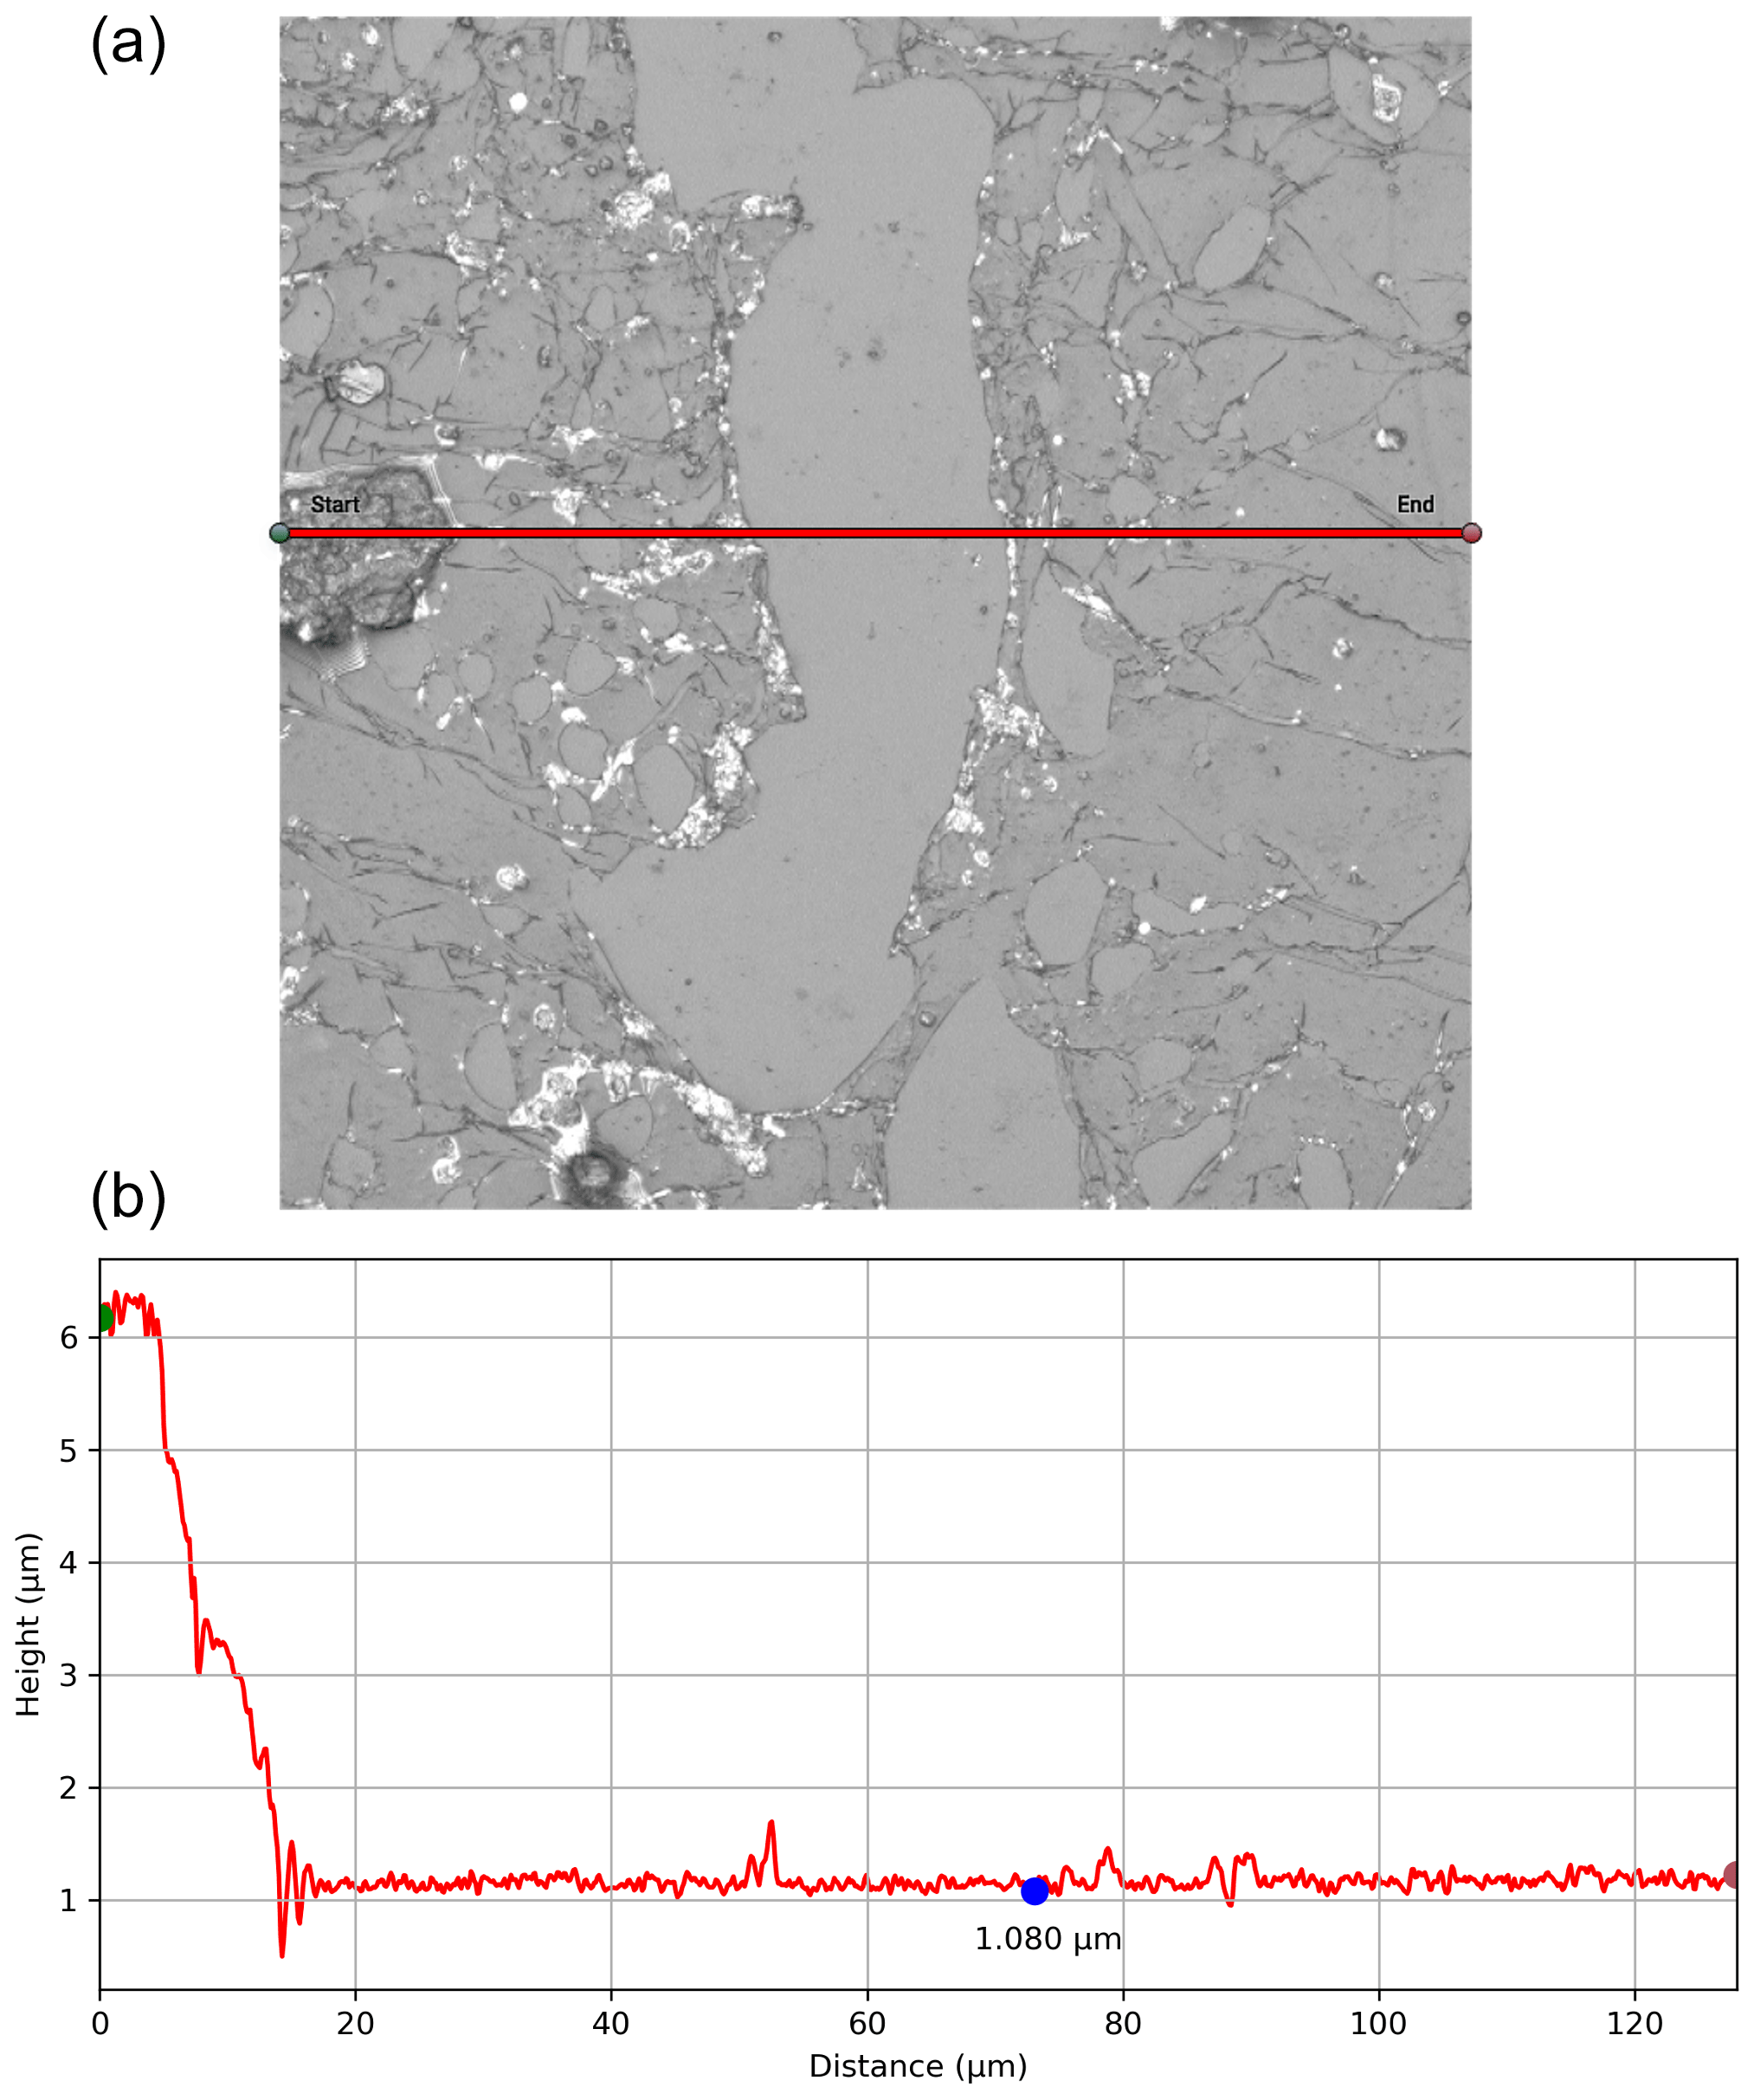
Figure B1A snapshot from the Olympus LEXT Analysis software of a sublimated ice sample with a Formvar coating. Panel (a) shows the 2-D CLSM laser imagery, with the red line indicating the transect through an area with and without the coating. Panel (b) shows the height (y axis in µm) across that transect (x axis in µm) for calculating the Formvar thickness (as seen along the blue segment), plotting the height used for Formvar's thickness calculation shown with the blue dot.
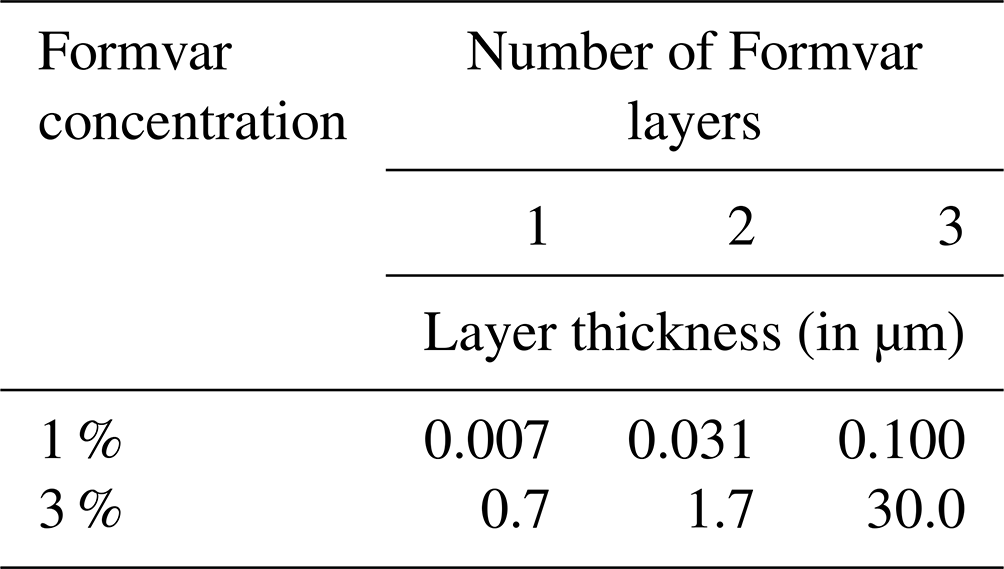
Multiple lab-grown ice samples were prepared and coated with one to three layers of the Formvar solution at 1 % and 3 % concentrations to address the thickness considerations and minimize particle displacement. This procedure consists of sweeping the polished surface of the ice sample with a rod dipped in the Formvar solution. The sample is then analyzed with CLSM, where an area exhibiting a distinct Formvar relief pattern is identified within the sample, as seen in Fig. B1 (top). Then, a transect across this pattern is used to measure the height of the relief (Fig. B1, bottom) and thus determine the thickness of the Formvar layer. Thicknesses measured for multiple Formvar coatings are shown in Table B1. This approach determined that one layer of coating at 1 % Formvar thickness optimally addressed the aforementioned tradeoffs of the plastic coating, i.e., preserving particles while being able to see particles with the SEM (e.g., Fig. 1).
The analysis in this study utilized several publicly available software tools. ProfilmOnline, an open-source software (https://www.profilmonline.com, Filmetrics, 2023), was used to process Olympus LEXT files obtained from the CLSM instrument. CASINO (Drouin et al., 2007, https://doi.org/10.1002/sca.20000), an open-source software package, was used for a Monte Carlo simulation of electron trajectories in solids. Additionally, NIST DTSA-II (Ritchie, 2010, https://doi.org/10.1017/S1431927610000243), a publicly accessible software package, was utilized for performing mathematical operations on the EDS spectral data. All software mentioned is openly accessible and can be obtained from their respective repositories or official websites.
The physical (CLSM) and chemical (EDS) data of hailstones are stored in an Excel sheet, which has been uploaded and is accessible through Zenodo at https://doi.org/10.5281/zenodo.13686466 (Bernal Ayala et al., 2024).
Conceptualization: ACBA and LEA. Methodology: ACBA, AKR, LEA, and MLA. Validation and supervision: AKR, LEA, and WON. Formal analysis: ACBA and LEA. Investigation: ACBA, AKR, and LEA. Resources: AKR and LEA. Data curation: LEA. Writing(original draft preparation) and visualization: ACBA. Writing (review and editing): ACBA, AKR, LEA, WON, and MLA. Funding acquisition: AKR. All authors have read and agreed to the published version of the paper.
The contact author has declared that none of the authors has any competing interests.
Publisher's note: Copernicus Publications remains neutral with regard to jurisdictional claims made in the text, published maps, institutional affiliations, or any other geographical representation in this paper. While Copernicus Publications makes every effort to include appropriate place names, the final responsibility lies with the authors.
This research has been funded by the National Science Foundation (grant nos. AGS-1640452 and AGS-1661768). We thank Sebastian García at the Laboratorio de Análisis de Materiales por Espectrometría de Rayos X (Lamarx) facilities at the Universidad Nacional de Córdoba for his technical assistance in the microscopy analysis phase. We also extend our gratitude to the reviewers, whose insightful comments have significantly improved the quality of this paper.
This research has been supported by the Division of Atmospheric and Geospace Sciences (grant nos. AGS-2146708 and AGS-1661768).
This paper was edited by Jessie Creamean and reviewed by three anonymous referees.
Anderson, S. I.: Characterisation of Cells on Biomaterial Surfaces and Tissue-Engineered Constructs Using Microscopy Techniques, in: Tissue Engineering Using Ceramics and Polymers, 2nd edn., edited by: Boccaccini, A. R. and Ma, P. X., Woodhead Publishing, 196–223, https://doi.org/10.1533/9780857097163.2.196, ISBN 978-0-85709-712-5, 2014. a, b
Arena, L. and Crespo, A.: Recopilación de estudios primarios de caracterización cristalográfica de granizos y de las tormentas que los originan, Repositorio Digital of the Universidad Nacional de Córdoba (RDU), http://hdl.handle.net/11086/14055 (last access: 6 September 2024), 2019 (in Spanish). a
Arena, L. E.: Separación de partículas incluidas en hielos naturales por sublimación adaptada (Separation of particles included in natural ice by adapted sublimation), Annals of AFA, 35, 25–27, 2024 (in Spanish with English abstract). a, b
Beal, A., Martins, L. D., Martins, J. A., Rudke, A. P., de Almeida, D. S., Costa, L. M., and Tarley, C. R. T.: Evaluation of the Chemical Composition of Hailstones from Triple Border Paraná, Santa Catarina (Brazil) and Argentina, Atmos. Pollut. Res., 12, 184–192, https://doi.org/10.1016/j.apr.2021.01.009, 2021. a, b
Bern, A. M., Lowers, H. A., Meeker, G. P., and Rosati, J. A.: Method Development for Analysis of Urban Dust Using Scanning Electron Microscopy with Energy Dispersive X-ray Spectrometry to Detect the Possible Presence of World Trade Center Dust Constituents, Environ. Sci. Technol., 43, 1449–1454, https://doi.org/10.1021/es800865n, 2009. a
Bernal Ayala, A. C., Rowe, A. K., Arena, L. E., and Desai, A. R.: Evaluation of Satellite-Derived Signatures for Three Verified Hailstorms in Central Argentina, Meteorology, 1, 183–210, https://doi.org/10.3390/meteorology1020013, 2022. a
Bernal Ayala, A. C., Rowe, A., Arena, L. E., and Nachlas, W. O.: Individual Particle Dataset: Physical-chemical properties of non-soluble particles in a hailstone collected in Argentina, Zenodo [data set], https://doi.org/10.5281/zenodo.13686466, 2024. a
Brostrøm, A., Kling, K. I., Hougaard, K. S., and Mølhave, K.: Complex Aerosol Characterization by Scanning Electron Microscopy Coupled with Energy Dispersive X-ray Spectroscopy, Sci. Rep., 10, 9150, https://doi.org/10.1038/s41598-020-65383-5, 2020. a
Christner, B. C., Mikucki, J. A., Foreman, C. M., Denson, J., and Priscu, J. C.: Glacial Ice Cores: A Model System for Developing Extraterrestrial Decontamination Protocols, Icarus, 174, 572–584, https://doi.org/10.1016/j.icarus.2004.10.027, 2005. a, b
Cintineo, J. L., Pavolonis, M. J., Sieglaff, J. M., Cronce, L., and Brunner, J.: NOAA ProbSevere v2.0 – ProbHail, ProbWind, and ProbTor, Weather Forecast., 35, 1523–1543, https://doi.org/10.1175/WAF-D-19-0242.1, 2020. a
Claxton, N. S., Fellers, T. J., and Davidson, M. W.: Microscopy, Confocal, in: Encyclopedia of Medical Devices and Instrumentation, John Wiley & Sons, Ltd, https://doi.org/10.1002/0471732877.emd291, 2006. a, b, c
Crespo, A.: Characterization of Two Hailstorms in Argentina, PhD thesis, University of Wisconsin-Madison, Madison, Wisconsin, https://minds.wisconsin.edu/handle/1793/80494 (last access: 6 September 2024), 2020. a
Dahal, S.: The Essential Guide to Raman Microscopy, ThermoFisher Scientific, https://www.thermofisher.com/blog/materials/guide-to-raman-microscopy-raman-spectroscopy/ (last access: 16 August 2023), 2022. a
Demšar, J., Curk, T., Erjavec, A., Gorup, Č., Hočevar, T., Milutinovič, M., Možina, M., Polajnar, M., Toplak, M., Starič, A., Štajdohar, M., Umek, L., Žagar, L., Žbontar, J., Žitnik, M., and Zupan, B.: Orange: Data Mining Toolbox in Python, J. Mach. Learn. Res., 14, 2349–2353, 2013. a
Diep, T., Lata, N. N., Cheng, Z., Mazzola, M., Gilardoni, S., Wilbourn, E., Hurst, J., Ogle, H., Hiranuma, N., and China, S.: Chemical Composition and Immersion Freezing Activities of Aerosol Articles in the European Arctic, in: AGU Fall Meeting 2022, Chicago, IL, 12–16 December 2022, id. A12P-1305, https://agu.confex.com/agu/fm22/meetingapp.cgi/Paper/1095808 (last access: 6 September 2024), 2022. a
Drouin, D., Couture, A. R., Joly, D., Tastet, X., Aimez, V., and Gauvin, R.: CASINO V2.42: A Fast and Easy-to-Use Modeling Tool for Scanning Electron Microscopy and Microanalysis Users, Scanning, 29, 92–101, https://doi.org/10.1002/sca.20000, 2007. a, b
Elliott, A. D.: Confocal Microscopy: Principles and Modern Practices, Curr. Protoc. Cytom., 92, e68, https://doi.org/10.1002/cpcy.68, 2020. a, b, c
Fallica, R., Watts, B., Rösner, B., Giustina, G. D., Brigo, L., Brusatin, G., and Ekinci, Y.: Changes in the near Edge X-Ray Absorption Fine Structure of Hybrid Organic–Inorganic Resists upon Exposure, Nanotechnology, 29, 36LT03, https://doi.org/10.1088/1361-6528/aaccd4, 2018. a, b
Farber, L.: Microstructure and Mechanical Properties of Granules Formed in High Shear Wet Granulation, in: Handbook of Pharmaceutical Wet Granulation, edited by: Narang, A. S. and Badawy, S. I. F., Academic Press, ISBN 978-0-12-810460-6, 37–88, https://doi.org/10.1016/B978-0-12-810460-6.00003-8, 2019. a
Filmetrics: Profilmonline, https://www.profilmonline.com/, last access: 5 October 2023. a
Fu, Y.-Z., Li, Y.-D., Su, Y.-T., Cai, C.-Y., and Huang, D.-Y.: Application of Confocal Laser Scanning Microscopy to the Study of Amber Bioinclusions, Palaeoentomology, 4, 266–278, https://doi.org/10.11646/palaeoentomology.4.3.14, 2021. a
Gao, K., Zhou, C.-W., Meier, E. J. B., and Kanji, Z. A.: Laboratory studies of ice nucleation onto bare and internally mixed soot–sulfuric acid particles, Atmos. Chem. Phys., 22, 5331–5364, https://doi.org/10.5194/acp-22-5331-2022, 2022. a, b
Goldstein, J. I., Newbury, D. E., Michael, J. R., Ritchie, N. W. M., Scott, J. H. J., and Joy, D. C.: Scanning Electron Microscopy and X-Ray Microanalysis, Springer, ISBN 978-1-4939-6676-9, 2017. a, b, c
Gu, L., Wang, N., Tang, X., and Changela, H. G.: Application of FIB-SEM Techniques for the Advanced Characterization of Earth and Planetary Materials, Scanning, 2020, 8406917, https://doi.org/10.1155/2020/8406917, 2020. a
Higuchi, K.: The Etching of Ice Crystals, Acta Metall. Mater., 6, 636–642, https://doi.org/10.1016/0001-6160(58)90157-3, 1958. a
Higuchi, K. and Muguruma, J.: Etching of Ice Crystals by the Use of Plastic Replica Film, Journal of the Faculty of Science, Hokkaido University, Ser. 7, 1, 81–91, 1958. a
Holden, M. A., Campbell, J. M., Meldrum, F. C., Murray, B. J., and Christenson, H. K.: Active Sites for Ice Nucleation Differ Depending on Nucleation Mode, P. Natl. Acad. Sci. USA, 118, e2022859118, https://doi.org/10.1073/pnas.2022859118, 2021. a
Jeong, J.-H., Fan, J., Homeyer, C. R., and Hou, Z.: Understanding Hailstone Temporal Variability and Contributing Factors over the U.S. Southern Great Plains, J. Climate, 33, 3947–3966, https://doi.org/10.1175/JCLI-D-19-0606.1, 2020. a
Jiang, F., Chen, B., Qiao, F., Wang, R., Wei, C., and Liu, Q.: Effects of Microphysics Parameterizations on Forecasting a Severe Hailstorm of 30 April 2021 in Eastern China, Atmosphere, 14, 526, https://doi.org/10.3390/atmos14030526, 2023. a
Kaye, T. G., Falk, A. R., Pittman, M., Sereno, P. C., Martin, L. D., Burnham, D. A., Gong, E., Xu, X., and Wang, Y.: Laser-Stimulated Fluorescence in Paleontology, PLoS One, 10, e0125923, https://doi.org/10.1371/journal.pone.0125923, 2015. a
Ketterer, M. E.: Geology and Mineralogy Applications of Atomic Spectroscopy, in: Encyclopedia of Spectroscopy and Spectrometry, 2nd edn., edited by: Lindon, J. C., Academic Press, Oxford, ISBN 978-0-12-374413-5, 757–761, https://doi.org/10.1016/B978-0-12-374413-5.00004-X, 2010. a
Koga, D., Kusumi, S., Shibata, M., and Watanabe, T.: Applications of Scanning Electron Microscopy Using Secondary and Backscattered Electron Signals in Neural Structure, Front. Neuroanat., 15, 759804, https://doi.org/10.3389/fnana.2021.759804, 2021. a
Kozjek, M., Vengust, D., Radošević, T., Žitko, G., Koren, S., Toplak, N., Jerman, I., Butala, M., Podlogar, M., and Viršek, M. K.: Dissecting Giant Hailstones: A Glimpse into the Troposphere with Its Diverse Bacterial Communities and Fibrous Microplastics, Sci. Total Environ., 856, 158786, https://doi.org/10.1016/j.scitotenv.2022.158786, 2023. a
Krueger, B. J., Grassian, V. H., Cowin, J. P., and Laskin, A.: Heterogeneous Chemistry of Individual Mineral Dust Particles from Different Dust Source Regions: The Importance of Particle Mineralogy, Atmos. Environ., 38, 6253–6261, https://doi.org/10.1016/j.atmosenv.2004.07.010, 2004. a
Kubota, R., Nakamura, K., Torigoe, S., and Hamachi, I.: The Power of Confocal Laser Scanning Microscopy in Supramolecular Chemistry: In Situ Real-time Imaging of Stimuli-Responsive Multicomponent Supramolecular Hydrogels, ChemistryOpen, 9, 67–79, https://doi.org/10.1002/open.201900328, 2020. a
Kumjian, M. R., Gutierrez, R., Soderholm, J. S., Nesbitt, S. W., Maldonado, P., Luna, L. M., Marquis, J., Bowley, K. A., Imaz, M. A., and Salio, P.: Gargantuan Hail in Argentina, B. Am. Meteorol. Soc., 101, E1241–E1258, https://doi.org/10.1175/BAMS-D-19-0012.1, 2020. a
Laskin, A., Moffet, R. C., Gilles, M. K., Fast, J. D., Zaveri, R. A., Wang, B., Nigge, P., and Shutthanandan, J.: Tropospheric Chemistry of Internally Mixed Sea Salt and Organic Particles: Surprising Reactivity of NaCl with Weak Organic Acids, J. Geophys. Res.-Atmos., 117, D15302, https://doi.org/10.1029/2012JD017743, 2012. a
Lata, N. N., Zhang, B., Schum, S., Mazzoleni, L., Brimberry, R., Marcus, M. A., Cantrell, W. H., Fialho, P., Mazzoleni, C., and China, S.: Aerosol Composition, Mixing State, and Phase State of Free Tropospheric Particles and Their Role in Ice Cloud Formation, ACS Earth Space Chem., 5, 3499–3510, https://doi.org/10.1021/acsearthspacechem.1c00315, 2021. a, b, c
Lehmann, J., Liang, B., Solomon, D., Lerotic, M., Luizão, F., Kinyangi, J., Schäfer, T., Wirick, S., and Jacobsen, C.: Near-Edge X-ray Absorption Fine Structure (NEXAFS) Spectroscopy for Mapping Nano-Scale Distribution of Organic Carbon Forms in Soil: Application to Black Carbon Particles, Global Biogeochem. Cy., 19, GB1013, https://doi.org/10.1029/2004GB002435, 2005. a, b
Li, X., Zhang, Q., Zhu, T., Li, Z., Lin, J., and Zou, T.: Water-Soluble Ions in Hailstones in Northern and Southwestern China, Sci. Bull. (Beijing), 63, 1177–1179, https://doi.org/10.1016/j.scib.2018.07.021, 2018. a
Liu, E., Vega, S., Treiser, M. D., Sung, H. J., and Moghe, P. V.: Fluorescence Imaging of Cell–Biomaterial Interactions, in: Comprehensive Biomaterials, edited by: Ducheyne, P., Elsevier, Oxford, ISBN 978-0-08-055294-1, 291–303, https://doi.org/10.1016/B978-0-08-055294-1.00101-X, 2011. a, b
Malečić, B., Telišman Prtenjak, M., Horvath, K., Jelić, D., Mikuš Jurković, P., Ćorko, K., and Mahović, N. S.: Performance of HAILCAST and the Lightning Potential Index in Simulating Hailstorms in Croatia in a Mesoscale Model – Sensitivity to the PBL and Microphysics Parameterization Schemes, Atmos. Res., 272, 106143, https://doi.org/10.1016/j.atmosres.2022.106143, 2022. a
Mandrioli, P., Puppi, G. L., Bagni, N., and Prodi, F.: Distribution of Microorganisms in Hailstones, Nature, 246, 416–417, https://doi.org/10.1038/246416a0, 1973. a
Mercer, I. P.: PHYSICAL APPLICATIONS OF LASERS, Industrial Applications, in: Encyclopedia of Modern Optics, edited by: Guenther, R. D., Elsevier, Oxford, 169–184, https://doi.org/10.1016/B0-12-369395-0/00947-7, 2005. a, b
Michaud, A. B., Dore, J. E., Leslie, D., Lyons, W. B., Sands, D. C., and Priscu, J. C.: Biological Ice Nucleation Initiates Hailstone Formation, J. Geophys. Res.-Atmos., 119, 12186–12197, https://doi.org/10.1002/2014JD022004, 2014. a, b, c, d, e
Moffet, R. C., Tivanski, A. V., and Gilles, M. K.: Scanning Transmission X-ray Microscopy: Applications in Atmospheric Aerosol Research, Tech. Rep. LBNL-4245E, Lawrence Berkeley National Lab. (LBNL), Berkeley, CA (United States), 2011. a, b
Nam, K. Y. and Lee, C. J.: Characterization of Silver Nanoparticles Incorporated Acrylic-Based Tissue Conditioner with Antimicrobial Effect and Cytocompatibility, in: Nanobiomaterials in Clinical Dentistry, edited by: Subramani, K., Ahmed, W., and Hartsfield, J. K., William Andrew Publishing, 283–295, https://doi.org/10.1016/B978-1-4557-3127-5.00014-3, 2013. a
O'Connor, B.: Confocal Laser Scanning Microscopy; a New Technique for Investigating and Illustrating Fossil Radiolaria, Micropaleontology, 42, 395–401, 1996. a
Orlando, A., Franceschini, F., Muscas, C., Pidkova, S., Bartoli, M., Rovere, M., and Tagliaferro, A.: A Comprehensive Review on Raman Spectroscopy Applications, Chemosensors, 9, 262, https://doi.org/10.3390/chemosensors9090262, 2021. a
Patnaude, R. J., Perkins, R. J., Kreidenweis, S. M., and DeMott, P. J.: Is Ice Formation by Sea Spray Particles at Cirrus Temperatures Controlled by Crystalline Salts?, ACS Earth Space Chem., 5, 2196–2211, https://doi.org/10.1021/acsearthspacechem.1c00228, 2021. a
Petrenko, V. F. and Whitworth, R. W.: Physics of Ice, OUP Oxford, ISBN 978-0-19-158134-2, 1999. a
Pruppacher, H. R.: Self-Diffusion Coefficient of Supercooled Water, J. Chem. Phys., 56, 101–107, https://doi.org/10.1063/1.1676831, 1972. a
Raja, P. M. V. and Barron, A. R.: An Introduction to Energy Dispersive X-ray Spectroscopy, OpenStax CNX, https://chem.libretexts.org/Bookshelves/Analytical_Chemistry/Physical_Methods_in_Chemistry_and_Nano_Science_(Barron)/01:_Elemental_Analysis/1.12:_An_Introduction_to_Energy_Dispersive_X-ray_Spectroscopy (last access: 3 August 2023), 2016. a
Rausch, J., Jaramillo-Vogel, D., Perseguers, S., Schnidrig, N., Grobéty, B., and Yajan, P.: Automated Identification and Quantification of Tire Wear Particles (TWP) in Airborne Dust: SEM/EDX Single Particle Analysis Coupled to a Machine Learning Classifier, Sci. Total Environ., 803, 149832, https://doi.org/10.1016/j.scitotenv.2021.149832, 2022. a
Raval, N., Maheshwari, R., Kalyane, D., Youngren-Ortiz, S. R., Chougule, M. B., and Tekade, R. K.: Importance of Physicochemical Characterization of Nanoparticles in Pharmaceutical Product Development, in: Basic Fundamentals of Drug Delivery, edited by: Tekade, R. K., Advances in Pharmaceutical Product Development and Research, Academic Press, 369–400, https://doi.org/10.1016/B978-0-12-817909-3.00010-8, 2019. a
Ritchie, N. W. M.: Using DTSA-II to Simulate and Interpret Energy Dispersive Spectra from Particles, Microsc. Microanal., 16, 248–258, https://doi.org/10.1017/S1431927610000243, 2010. a, b
Sanchez-Marroquin, A., Arnalds, O., Baustian-Dorsi, K. J., Browse, J., Dagsson-Waldhauserova, P., Harrison, A. D., Maters, E. C., Pringle, K. J., Vergara-Temprado, J., Burke, I. T., McQuaid, J. B., Carslaw, K. S., and Murray, B. J.: Iceland Is an Episodic Source of Atmospheric Ice-Nucleating Particles Relevant for Mixed-Phase Clouds, Science Advances, 6, eaba8137, https://doi.org/10.1126/sciadv.aba8137, 2020. a
Šantl-Temkiv, T., Finster, K., Dittmar, T., Hansen, B. M., Thyrhaug, R., Nielsen, N. W., and Karlson, U. G.: Hailstones: A Window into the Microbial and Chemical Inventory of a Storm Cloud, PLOS ONE, 8, 1–7, https://doi.org/10.1371/journal.pone.0053550, 2013. a
Schaefer, V. J.: A Method for Making Snowflake Replicas, Science, 93, 239–240, https://doi.org/10.1126/science.93.2410.239, 1941. a
Schnell, G., Staehlke, S., Duenow, U., Nebe, J. B., and Seitz, H.: Femtosecond Laser Nano/Micro Textured Ti6Al4V Surfaces – Effect on Wetting and MG-63 Cell Adhesion, Materials, 12, 2210, https://doi.org/10.3390/ma12132210, 2019. a
Soderholm, J. S. and Kumjian, M. R.: Automating the analysis of hailstone layers, Atmos. Meas. Tech., 16, 695–706, https://doi.org/10.5194/amt-16-695-2023, 2023. a
Turner, J. N., Lasek, S., and Szarowski, D. H.: Confocal Optical Microscopy, in: Encyclopedia of Materials: Science and Technology, edited by: Buschow, K. H. J., Cahn, R. W., Flemings, M. C., Ilschner, B., Kramer, E. J., Mahajan, S., and Veyssière, P., Elsevier, Oxford, ISBN 978-0-08-043152-9, 1504–1509, https://doi.org/10.1016/B0-08-043152-6/00271-0, 2001. a, b
Vander Wood, T. B.: Automated Particle Analysis by Microscopy, A Primer, Microscopy Today, 2, 13–17, https://doi.org/10.1017/S1551929500063008, 1994. a
Vander Wood, T. B.: Particle Sizing in Emissions Samples by Scanning Electron Microscopy, POWER, https://www.powermag.com/particle-sizing-in-emissions-samples-by-scanning-electron-microscopy/ (last access: 17 August 2023), 2017. a
Wagner, J., Wang, Z.-M., Ghosal, S., and Wall, S.: Source Identification on High PM2.5 Days Using SEM/EDS, XRF, Raman, and Windblown Dust Modeling, Aerosol Air Qual. Res., 19, 2578–2530, https://doi.org/10.4209/aaqr.2019.05.0276, 2019. a
Wang, S. and Larina, I. V.: High-Resolution Imaging Techniques in Tissue Engineering, in: Monitoring and Evaluation of Biomaterials and Their Performance In Vivo, edited by: Narayan, R. J., Woodhead Publishing, 151–180, https://doi.org/10.1016/B978-0-08-100603-0.00008-0, 2017. a, b
Wang, X., Ran, L., Qi, Y., Jiang, Z., Yun, T., and Jiao, B.: Analysis of Gravity Wave Characteristics during a Hailstone Event in the Cold Vortex of Northeast China, Atmosphere, 14, 412, https://doi.org/10.3390/atmos14020412, 2023. a
Wu, W., Huang, W., Deng, L., and Wu, C.: Investigation of Maximum Hail-Size Forecasting Using Bulk Microphysics Schemes, Mon. Weather Rev., 150, 2503–2525, https://doi.org/10.1175/MWR-D-21-0312.1, 2022. a
Zhang, Z., Zhou, Y., Zhu, X., Fei, L., Huang, H., and Wang, Y.: Applications of ESEM on Materials Science: Recent Updates and a Look Forward, Small Methods, 4, 1900588, https://doi.org/10.1002/smtd.201900588, 2020. a
- Abstract
- Introduction
- Principles of scanning microscopy techniques as applied to particle analysis
- Materials and methods
- Application of the microscopy technique to hailstones
- Limitations and recommendations
- Conclusions
- Appendix A: Cleaning protocol for quasi-clean subzero facilities
- Appendix B: Optimum thickness of the porous plastic coating layer
- Code availability
- Data availability
- Author contributions
- Competing interests
- Disclaimer
- Acknowledgements
- Financial support
- Review statement
- References