the Creative Commons Attribution 4.0 License.
the Creative Commons Attribution 4.0 License.
 | 26 Sep 2024
Merging TEMPEST microwave and GOES-16 geostationary IR soundings for improved water vapor profiles
Chia-Pang Kuo
Christian Kummerow
The Temporal Experiment for Storms and Tropical Systems Demonstration (TEMPEST-D) demonstrated the capability of CubeSat satellites to provide high-quality, stable microwave signals for estimating water vapor, clouds, and precipitation from space. Unlike the operational NOAA and MetOp series satellites, which combine microwave and hyperspectral infrared sensors on the same platforms to optimize retrievals, CubeSat radiometers such as TEMPEST do not carry additional sensors. In such cases, the high-temporal- and spatial-resolution and multi-channel measurements from the Advanced Baseline Imager (ABI) on the next-generation series of Geostationary Operational Environmental Satellites (GOES-R) are ideal for assisting these smaller, stand-alone radiometers. Based on sensitivity tests, the water vapor retrievals from TEMPEST are improved by adding water-vapor-sounding, window, and CO2 channels at 6.2, 6.9, 7.3, 8.4, 10.3, 11.2, 12.3, and 13.3 µm from ABI, which help to increase the vertical resolution of soundings and reduce retrieval errors. Adding three ABI water-vapor-sounding channels, under clear-sky conditions, retrieval biases and root mean square errors improve by approximately 10 %, while under cloudy skies, biases remain unchanged, but root mean square errors still decrease by 5 %; meanwhile, retrieval biases and root mean square errors are substantially reduced by adding more information from eight ABI bands in both clear and cloudy skies. Humidity soundings are also validated using coastal radiosonde data from the Integrated Global Radiosonde Archive (IGRA) from 2019 to 2020. When ABI indicates clear skies, water vapor retrievals improve somewhat by decreasing the overall bias in the microwave-only estimate by roughly 10 %, although layer root mean square errors remain roughly unchanged at 1 g kg−1 when three or eight ABI channels are added. When ABI indicates cloudy conditions, there is little change in the results. The small number of matched radiosondes may limit the observed improvement.
- Article
(6239 KB) - Full-text XML
- BibTeX
- EndNote


The Temporal Experiment for Storms and Tropical Systems Demonstration (TEMPEST-D; Reising et al., 2018) mission was designed to demonstrate the capability of a small radiometer on board a 6U CubeSat satellite for deriving clouds, water vapor, and precipitation. The CubeSat, including the flight system and the TEMPEST-D radiometer, is 10 cm × 20 cm × 34 cm and weighs 11.2 kg. Although the size of the TEMPEST-D is much smaller than instruments such as the operational Microwave Humidity Sounders (MHS on NOAA-18/19 and MetOp-A/B/C), which weigh about 63 kg, the TEMPEST-D radiometer demonstrated the capability to provide comparable well-calibrated microwave (MW) measurements (Berg et al., 2021; Brown et al., 2023). In addition, Schulte et al. (2020) introduced the bias correction of Earth incidence angle (EIA) (Schulte and Kummerow, 2019) in the optimal estimation (OE; Rodgers, 2000) framework with TEMPEST-D and demonstrated the potential to get consistent retrievals from a fleet of TEMPEST sensors observing the same spot with different EIAs. Radhakrishnan et al. (2022) estimated surface rainfall with machine-learning methods and showed that retrieved rainfall using TEMPEST-D channels was consistent with the multi-radar, multi-sensor system (MRMS) rainfall products over the continental United States. The success of TEMPEST-D led to flying a second TEMPEST unit in conjunction with the Compact Ocean Wind Vector Radiometer (COWVR; https://podaac.jpl.nasa.gov/COWVR-TEMPEST, last access: 10 September 2024) currently in orbit aboard the International Space Station.
Several studies have shown the capability to retrieve surface and atmospheric variables over the ocean under non-raining conditions using optimal estimation (OE) techniques. Elsaesser and Kummerow (2008) retrieved total precipitable water (TPW), surface wind, and cloud liquid water path (CLWP) using observations from the Advanced Microwave Scanning Radiometer-Earth Observing System (AMSR-E), the Special Sensor Microwave/Imager (SSM/I), and the Tropical Rainfall Measuring Mission (TRMM) Microwave Imager (TMI) using the same OE configurations. This was later expanded to the Global Precipitation Measurement (GPM) Microwave Imager (GMI) (Duncan and Kummerow, 2016). The Colorado State University 1D variational inversion algorithm (CSU 1DVAR) has been validated by comparing results with other independent products, showing that CSU 1DVAR can provide consistent results across a broad spectrum of sensors (Elsaesser and Kummerow, 2008; Duncan and Kummerow, 2016; Schulte and Kummerow, 2019; Schulte et al., 2020). A conceptually similar OE method is employed in the Microwave Integrated Retrieval System (MiRS; Boukabara et al., 2011, 2013, 2018) designed to provide various atmospheric and surface parameters (skin temperature, surface emissivity, and profiles of temperature, water vapor, non-precipitating clouds, and precipitation) under all-sky conditions over ocean and land surfaces. Due to its flexible structure, MiRS is used operationally at NOAA and supports measurements from multiple MW instruments, including the TMI, GMI, MHS, Atmospheric Microwave Sounding Unit (AMSU), SSM/I, Special Sensor Microwave Imager/Sounder (SSMI/S), and Advanced Technology Microwave Sounder (ATMS).
Infrared (IR) sounders, especially hyperspectral IR sounders, while limited to clear-sky conditions, have distinct advantages for deriving temperature and moisture profiles due to their sharper weighting functions, particularly in the upper troposphere when no clouds are present. Using MW measurements from AMSU-A and MHS plus IR observations from the Infrared Atmospheric Sounding Interferometer (IASI) on board the MetOp platforms, Aires (2011) and Aires et al. (2011, 2012) significantly reduced the errors of retrieving temperature and water vapor profiles under clear-sky conditions over the ocean by comparing with retrievals using individual MW or IR instruments alone. Under the European Space Agency Water Vapour Climate Change Initiative project (Siddans et al., 2015; Siddans, 2019), Trent et al. (2023) validated 9.5 years of atmospheric profiles retrieved from MetOp MW and IR observations and showed that global biases of temperature and water vapor are within 0.5 K and 10 %, respectively, making the retrieval products an important climate data record.
In addition to MW and IR measurements on the MetOp platforms, Milstein and Blackwell (2016) also showed the advantages of using MW and IR spectral bands from the Atmospheric Infrared Sounder (AIRS) and AMSU on the Aqua satellite as well as from the Cross-Track Infrared Sounder (CrIS) and ATMS on the Suomi National Polar-orbiting Partnership satellite (Suomi NPP) for temperature and water vapor retrievals. The NOAA Unique CrIS/ATMS Processing System (NUCAPS; Gambacorta et al., 2012) was built specifically to retrieve global atmospheric profiles using MW sensors (AMSU, ATMS, and MHS) and hyperspectral IR instruments (AIRS, CrIS, or IASI) under non-precipitating conditions with up to 80 % effective cloud fraction. Sun et al. (2017) used radiosonde data to assess the sounding products from NUCAPS, indicating small biases in the lower atmosphere for temperature profiles of less than 0.5 K and less than 20 % for water vapor profiles. These profiles have been further improved by Ma et al. (2021), who applied a neural network technique to enhance the retrieved atmospheric profiles in NUCAPS products by using IR channels on the next-generation series of Geostationary Operational Environmental Satellites (GOES-R; Schmit et al., 2008). The root mean square error of retrieved temperature and humidity profiles in that study decreased by more than 30 % from the surface up to 700 hPa. Thus, while it seems clear from these previous studies that merging IR and MW soundings from the same platforms is beneficial, CubeSat sounders such as TEMPEST or the Time-Resolved Observations of Precipitation structure and storm Intensity with a Constellation of Smallsats (TROPICS; Blackwell et al., 2018) do not generally fly in tandem with hyperspectral IR sounders. In this case, it is useful to examine if there are benefits to merging the stand-alone passive MW sensors with geostationary IR sounding channels.
The Advanced Baseline Imager (ABI), on board the GOES-R satellite series, observes the full disk of the Earth every 10 min (15 min prior to April 2019), measuring in the visible (Vis), near-IR, and IR spectral bands with spatial resolutions from 0.5 to 2 km. Except for the ozone absorption band at 9.6 µm (ABI channel 12), ABI channels 8 to 16 (6.2 to 13.3 µm) have different degrees of humidity sensitivities and are suitable for deriving water vapor profiles with similar vertical resolution to the operational MW sensors (Schmit et al., 2008; Goodman et al., 2019; Li et al., 2019). Due to the high spatial and temporal resolutions from GOES-R ABI observations over large regions, the ABI sensor can always be matched with stand-alone MW radiometers over the sensed hemisphere, as illustrated by Ma et al. (2021). This study thus focuses on the enhancement of water vapor retrievals that may be achieved when ABI IR sounding channels are added to the TEMPEST-D MW channels.
The TEMPEST-D satellite (Reising et al., 2018) was deployed from the International Space Station on 13 July 2018 into a low-Earth orbit. The initial orbit height was 400 km with a 51.6° inclination, observing an 825 km wide swath from the initial height. The mission successfully demonstrated the maneuverability of CubeSats to fly in closely maintained formations as well as the calibration stability of the MW radiometer (Berg et al., 2021). The TEMPEST-D passive MW radiometer scanned Earth in a cross-track mode and measured five channels at 87, 164, 174, 178, and 181 GHz with quasi-horizontal polarization, except for 87 GHz, which measured quasi-vertical polarization. The spatial resolutions of TEMPEST-D at the nadir were 14 km at 164 to 181 GHz and 28 km at 87 GHz. While the data are not complete due to difficulties with the data receiving station at Wallops Island, Virginia, USA, all available TEMPEST-D datasets can be requested through the website https://tempest.colostate.edu (last access: 10 September 2024). TEMPEST-D was deorbited on 22 June 2021. A second copy of TEMPEST was launched on 21 December 2021 and is operating on the International Space Station in conjunction with COWVR. Data are available from the National Aeronautics and Space Administration (NASA) Physical Oceanography Distributed Active Archive Center (PODAAC) housed at NASA's Jet Propulsion Laboratory. Because the instruments and orbits are identical, the results presented here apply to both sensors.
The GOES-16 (Schmit et al., 2008; Li et al., 2019) is the first of the GOES-R series satellites and was launched on 19 November 2016, carrying several instruments, including ABI. GOES-16 replaces GOES-13 and is located at longitude 75.2° W in a geostationary orbit (35 786 km altitude), observing from latitude 81.32° N to 81.32° S and from longitude 156.30° W to 6.30° E. This covers North and South America, the eastern Pacific Ocean, and the Atlantic Ocean to the west coast of Africa. The ABI sensor measures 16 spectral channels from Vis to IR bands (0.47 to 13.3 µm) with spatial resolutions ranging from 0.5 km at 0.64 µm to 2.0 km in the IR. The eight ABI water-vapor-sensitive channels at 6.2, 6.9, 7.3, 8.4, 10.3, 11.2, 12.3, and 13.3 µm are used to enhance the TEMPEST-D-retrieved water vapor profiles. While the ABI window and CO2 channels (8.4, 10.3, 11.2, 12.3, and 13.3 µm) have information that is similar to the TEMPEST window channels, more measurements provide more information content to help constrain retrievals in a way used in the hyperspectral IR retrievals (Aires, 2011; Aires et al., 2011, 2012; Gambacorta et al., 2012; Siddans et al., 2015). To ensure spatial and temporal consistency between TEMPEST-D and the GOES-16, the nearest geolocated ABI full-disk pixels from ABI radiance (RadF), clear-sky mask (ACMF), cloud-top phase (ACTPF), and cloud-top pressure (CTPF) products are averaged to match the geolocated TEMPEST-D pixels in space and time. The GOES-16 products can be downloaded through the Comprehensive Large Array Data Stewardship System (CLASS). Although GOES-17 also covers parts of the TEMPEST-D operational period, its products are not used to avoid all issues related to the cooling system, as described at https://www.goes-r.gov/users/GOES-17-ABI-Performance.html (last access: 10 September 2024).
Except for satellite observations and products mentioned above, auxiliary data, including surface wind speed and direction, surface pressure, surface skin temperature, and temperature profiles, are also used to constrain the retrievals. These are taken from ERA5 (Hersbach et al., 2020), accessed through the website https://www.ecmwf.int/en/forecasts/dataset/ecmwf-reanalysis-v5 (last access: 10 September 2024). The hourly ERA5 data used in the study are 0.5° × 0.5° with 27 pressure levels from 1000 to 100 hPa. The vertical resolution (in pressure coordinates) consists of 25 hPa intervals from 1000 to 750 hPa, 50 hPa intervals from 750 to 250 hPa, and 25 hPa intervals from 250 to 100 hPa. A 1 h temporal resolution and 0.5° spatial resolution from ERA5 are used to define unobserved surface conditions as well as the temperature profiles. The auxiliary surface parameters and temperature profiles are linearly interpolated in space and time to match the TEMPEST-D observations. The interpolated ERA5 auxiliary data may not reflect the actual conditions at the satellite overpass location and time, so when compared with in situ measurements, retrievals may be degraded by using the non-representative auxiliary data.
In satellite remote sensing, OE is a widely utilized technique to retrieve atmospheric components (Rodgers, 2000; Elsaesser and Kummerow, 2008; Boukabara et al., 2011; Siddans et al., 2015; Duncan and Kummerow, 2016; Schulte and Kummerow, 2019; Schulte et al., 2020). In OE, the state parameters and measurement errors are all assumed to follow a Gaussian distribution, and the atmospheric states being retrieved, x, are optimally estimated by minimizing the cost function J,
where xa is the a priori information about the state vector x, y is the measurement vector, f(x) is a forward model simulating measurements for a given state x, Sa is the covariance matrix a priori, and Sy is the covariance matrix of measurement errors (Rodgers, 2000). The minimization of J is achieved by iteratively solving for the state vector x using the Gauss–Newton method. Following Eq. (5.29) in Rodgers (2000), the convergence criteria are achieved when
where d measures the change in the state vector between the ith and ith + 1 iteration, and n is the number of retrieved variables (levels of water vapor and/or layers of clouds in this study). The solution is said to have converged when the residual is the number of the retrieved variables in the study. This is consistent with the definition from Eq. (2) that the error-weighted increment is much less than the number of retrieved variables. The a priori state vector xa is used as the initial guess at the beginning of the iteration. The a priori information xa and its uncertainty Sa are derived from monthly ERA5 humidity and cloud profiles over the ocean; xa describes the mean state of the profiles, and Sa accounts for the variation of the states. If sky conditions are known from GOES-16 cloud masks, xa and Sa obtained from clear or cloudy conditions will be used in the retrievals; otherwise, a priori values computed from all-sky conditions will be used.
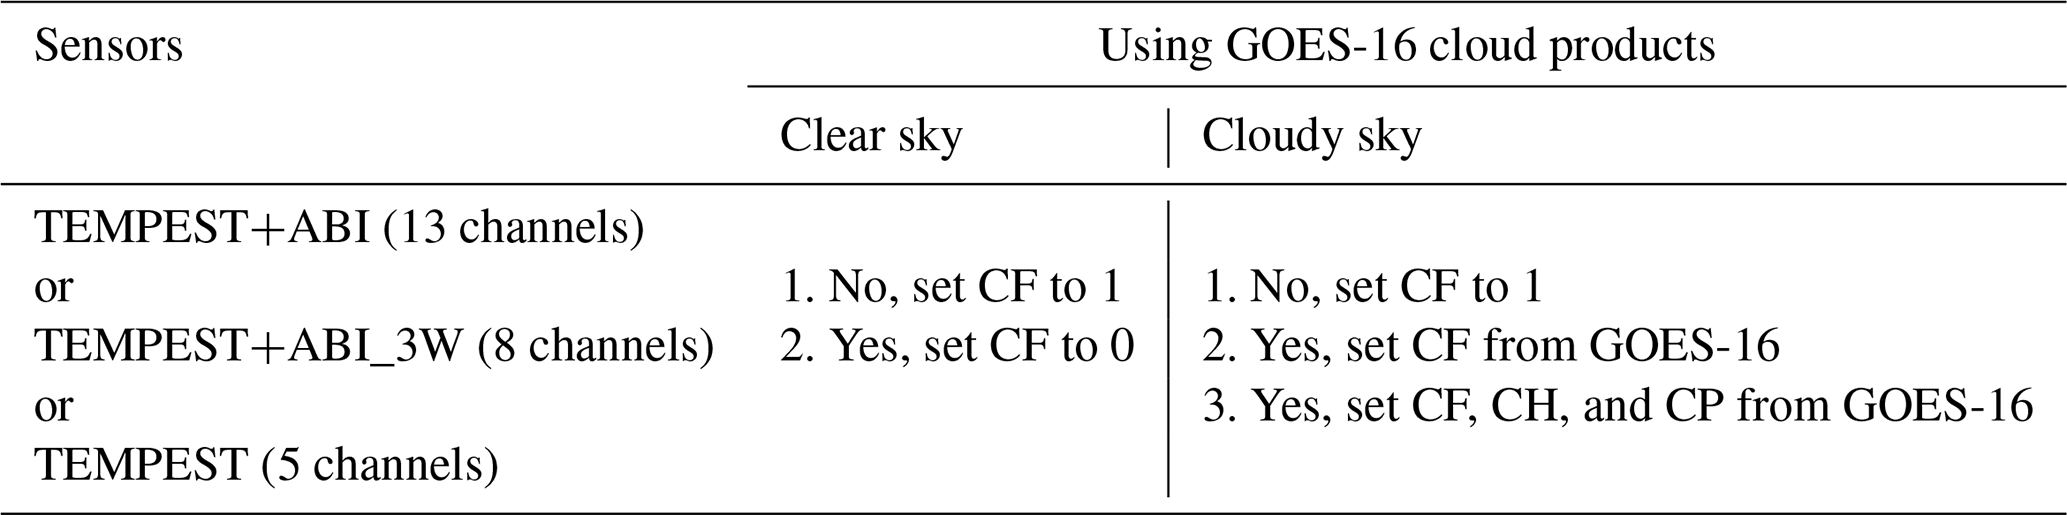
The state vector x comprises the water vapor mixing ratio at different pressure levels and/or clouds. The number of selected water vapor levels depends on the number of channels and the assumptions of clouds. The selected water vapor levels are evenly distributed in pressure levels at 1000, 900, 800, 600, and 400 hPa for TEMPEST only and 1000, 950, 875, 800, 700, 600, 450, and 350 hPa when both TEMPEST and ABI channels are used. The remaining water vapor levels are linearly interpolated. Following previous studies (Schulte and Kummerow, 2019; Schulte et al., 2020), clouds are inserted into single layers containing liquid and/or ice clouds in the profiles. Since passive MW sensors do not have information about cloud-top height, if clouds are assumed to be present, the state vector will contain one layer of liquid and one layer of ice clouds with liquid cloud top at 900 hPa and ice cloud top at 300 hPa. If cloud information is available from GOES-16 products, liquid clouds and/or ice clouds can also be inserted following GOES-16 cloud information as listed in Table 1. The table allows for experiments where the GOES-16 is used simply to determine if there are clouds in the field of view (FOV) or the actual cloud properties. If GOES-16 is only used to make the clear or cloudy determination, then the cloud fraction is set to 0 or 1, respectively. TEMPEST-D, by itself, has no ability to retrieve the cloud fraction. If details of the cloud field are used, the cloud fraction is set accordingly.
Table 1The retrieval configurations under clear and cloudy conditions with and without GOES-16 cloud information. ABI means using eight ABI channels: 8, 9, 10, 11, 13, 14, 15, and 16 (6.2, 6.9, 7.3, 8.4, 10.3, 11.2, 12.3, and 13.3 µm). ABI_3W means using three ABI water-vapor-sounding channels: 8, 9, and 10 (6.2, 6.9, and 7.3 µm). CF, CH, and CP represent cloud fraction, cloud height, and cloud phase, respectively.

The measurement error covariance matrix Sy is derived from two uncertainty sources: the radiometer and the forward model (Elsaesser and Kummerow, 2008; Duncan and Kummerow, 2016; Schulte and Kummerow, 2019; Schulte et al., 2020). The noise equivalent differential temperature (NEDT) values are represented as the radiometer measurement errors for each sensor channel. For TEMPEST from 87 to 181 GHz, the NEDT values are 0.20, 0.35, 0.55, 0.55, and 0.75 K, respectively, which are evaluated between 275 and 315 K (Berg et al., 2021; Padmanabhan et al., 2021). The NEDT values of ABI are 0.1 K for all ABI IR channels, except for band 16, which is 0.3 K, and are evaluated at 300 K (Goodman et al., 2019; GOES-R Series, 2022). The forward model uncertainties are approximated by comparing simulated satellite observations using full ERA5 profiles to degraded simulated measurements using the assumptions made in the OE retrievals, as described above. While the radiative transfer model is assumed to contain no errors, errors are introduced when complex water vapor profiles are replaced by simplified water vapor profiles at the previous prescribed retrieval levels and complex cloud vertical profiles are replaced by single liquid and ice cloud layers containing the equivalent cloud water path. The measurement error covariance matrix Sy is then derived from the NEDT values and the estimated forward model errors. Figure 1a–c show the Sy estimated from all, cloudy, and clear skies, respectively, based on oceanic ERA5 profiles. Since ERA5 profiles most often contain some degree of clouds, Fig. 1a and b have similar patterns, and channels having similar water vapor sensitivity are more correlated with each other. On the other hand, due to much lower atmospheric absorption in the clear skies, the surface-sensitive TEMPEST channels (87 and 164 GHz) have higher correlations among themselves as in Fig. 1c, although with smaller overall Sy values than in Fig. 1a and b.
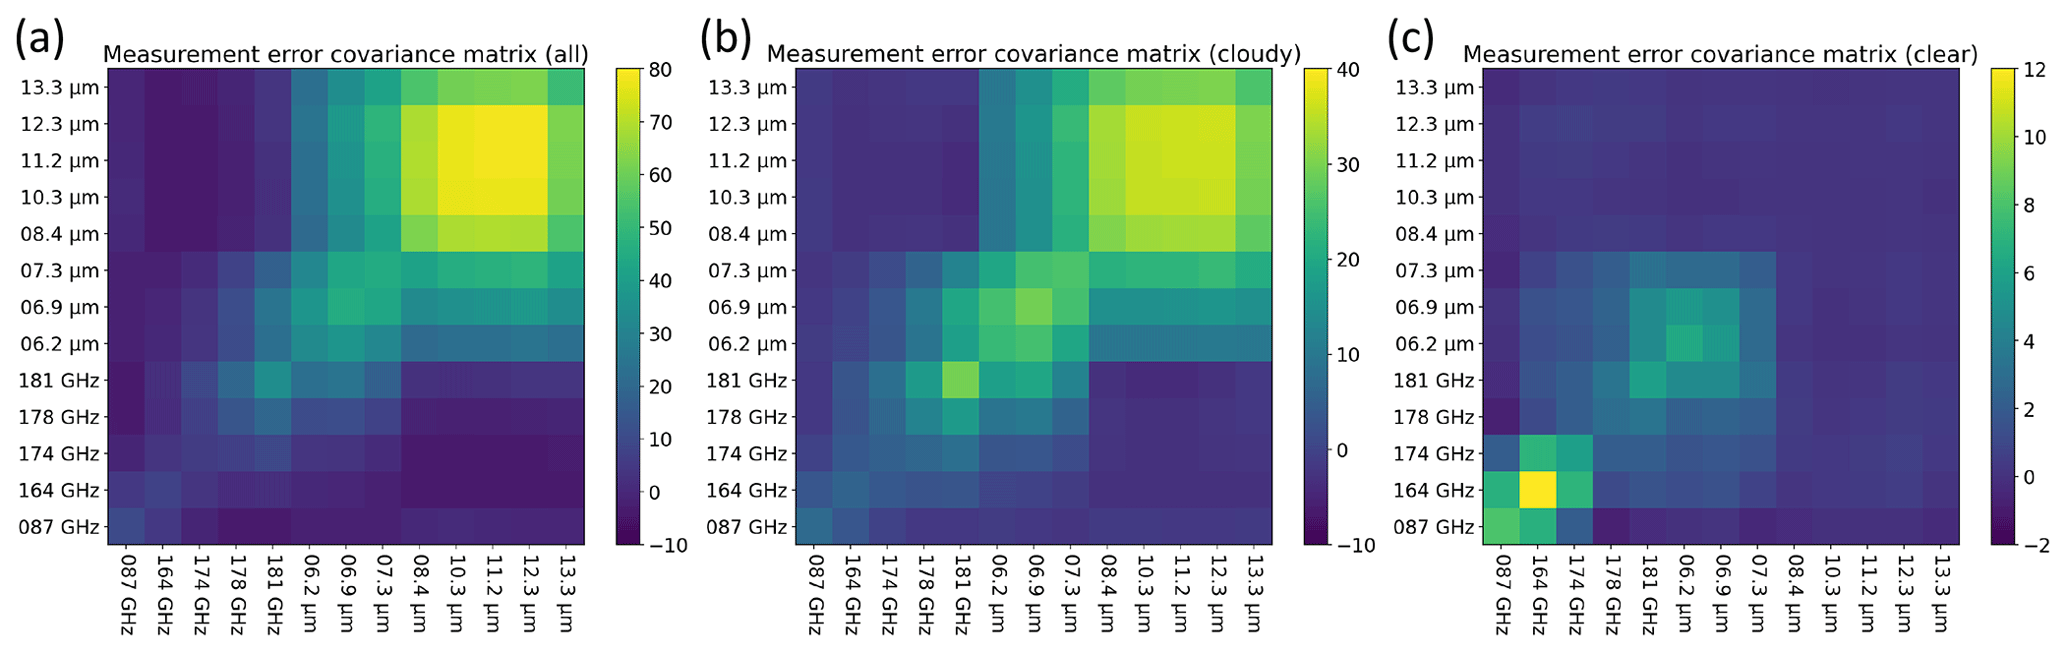
Figure 1Measurement error covariance matrix Sy for five TEMPEST-D MW and eight ABI IR channels derived from ERA5 profiles under (a) all-sky, (b) cloudy-sky, and (c) clear-sky conditions over the ocean. The unit of the color is K2.
The forward model is composed of two radiative transfer models: one simulates MW observations, and the other computes IR measurements. In the study, the Community Radiative Transfer Model (CRTM; Liu et al., 2012; Johnson et al., 2023) version 2.3.0 is used to calculate the observed brightness temperature for the ABI IR channels. The model can be downloaded through the website https://github.com/JCSDA/crtm (last access: 10 September 2024). To simulate TEMPEST MW observations, an Eddington approximation, as described in Schulte and Kummerow (2019) and Schulte et al. (2020), is used. The Monochromatic Radiative Transfer Model (MonoRTM; https://github.com/AER-RC/monoRTM, last access: 10 September 2024; Clough et al., 2005) is used to generate the atmospheric absorption, while the ocean surface MW emissivity is computed using the FAST microwave Emissivity Model version 6 (FASTEM-6; Kazumori and English, 2015).
In the forward model, clouds are assumed to be homogeneously distributed in single layers. The cloud-top pressure is 900 hPa for liquid clouds and 300 hPa for ice clouds if no cloud-top heights are assigned from GOES-16 products, as described earlier. The CRTM default liquid and ice cloud optical properties are used to simulate IR brightness temperature with 12 and 30 µm effective radius for liquid and ice clouds, respectively. The MW optical properties of liquid clouds are generated by Lorenz–Mie theory (van de Hulst, 1957; Bohren and Huffman, 1998), assuming the droplet is spherical with a radius of 12 µm and is monodisperse in particle size distribution (PSD). The radiative properties of ice clouds in the MW spectrum are computed using the single-scattering property databases for non-spherical ice particles from Liu (2008) and Nowell et al. (2013) following the analysis of Schulte and Kummerow (2019). The databases are derived by the discrete-dipole approximation method (Draine and Flatau, 1994). The microphysical properties of ice clouds used to derive the scattering properties are assumed to have the PSD from Field et al. (2007) with a constant density of 100 g cm−3 and have the following ice habits: six bullet rosettes (crystal size < 800 µm) and aggregates of 400 µm rosettes (crystal size ≥ 800 µm). The spectral inconsistency of cloud optical properties and misrepresenting ice clouds can be two of the major error sources in radiative transfer simulations (Kulie et al., 2010; Yang et al., 2018; Ringerud et al., 2019; Schulte and Kummerow, 2019; Yi et al., 2020), but these are not considered here.
The monthly means and variability of water vapor mixing ratios from ERA5 above 200 hPa are extremely small, as shown in Fig. 2. The sensor responses to these small amounts of stratospheric water vapor are less than the noise of 0.2 to 0.75 K for TEMPEST and 0.1 to 0.3 K for ABI. Therefore, the water vapor mixing ratio was set to the monthly mean climatology above 200 hPa and is not retrieved explicitly with the available channels.
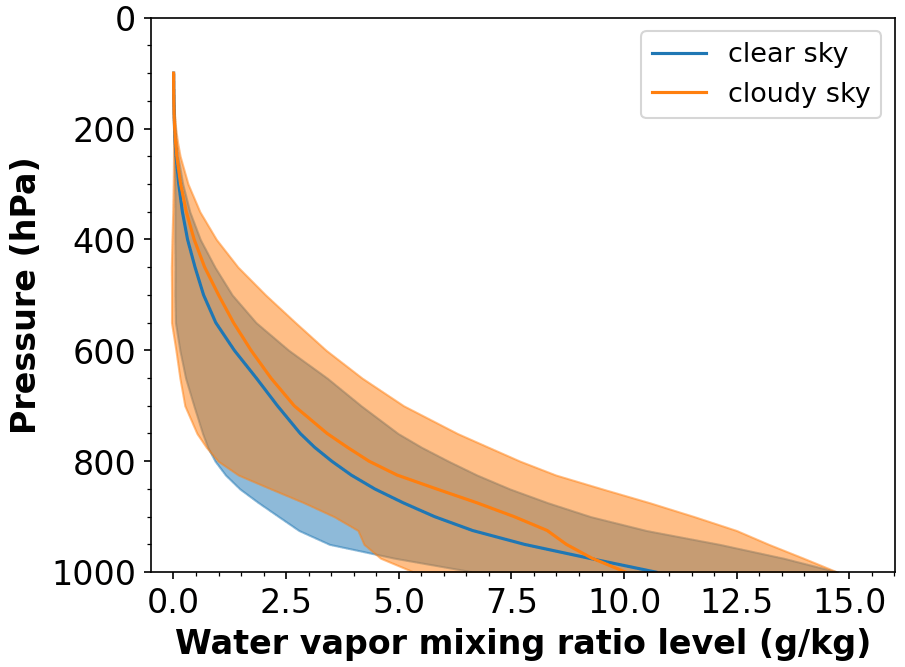
Figure 2Monthly mean and standard deviation (σ) of water vapor profiles under clear and cloudy conditions over the ocean at ± 60° latitude from ERA5 in May 2020. Blue represents water vapor in clear skies, while orange shows water vapor in cloudy skies. Solid lines are mean water vapor profiles, and shaded areas are standard deviations.
With the model configuration described above and a priori atmospheric temperature and water vapor profiles from ERA5 shown in Fig. 3a and b, the sensitivity of water vapor to five TEMPEST-D MW channels and eight ABI IR bands is represented by the clear-sky Jacobians shown in Fig. 3c; the cloudy sky in Fig. 3d presents the Jacobians of water vapor and clouds. For humidity, all TEMPEST MW and ABI IR channels have different degrees of sensitivity along the altitude axis. In clear or cloudy skies, three ABI water-vapor-sounding channels (6.2 to 7.3 µm) only provide signals for the upper atmosphere. However, signals of water vapor are sensed from the surface to the top of the atmosphere by the TEMPEST MW bands under both clear and cloudy conditions and by ABI window and CO2 bands (8.4 to 13.3 µm) in the clear sky. Although the water vapor sensitivity is substantially reduced under liquid clouds in ABI window and CO2 bands, TEMPEST 87 and 164 GHz window bands have significant sensitivity to water vapor and liquid clouds through the entire lower atmosphere. Except for the TEMPEST 87 GHz band, all remaining TEMPEST channels have sensitivity to ice clouds. Overall, as also shown in the studies mentioned in the Introduction (Aires, 2011; Milstein and Blackwell, 2016; Sun et al., 2017; Ma et al., 2021; Trent et al., 2023), Fig. 3c and d demonstrate the advantage of merging IR and MW spectral bands in soundings: MW channels have humidity signals under cloudy conditions, IR water-vapor-sounding bands provide extra information about the upper atmosphere, and IR window and CO2 channels have humidity sensitivity in the clear sky.
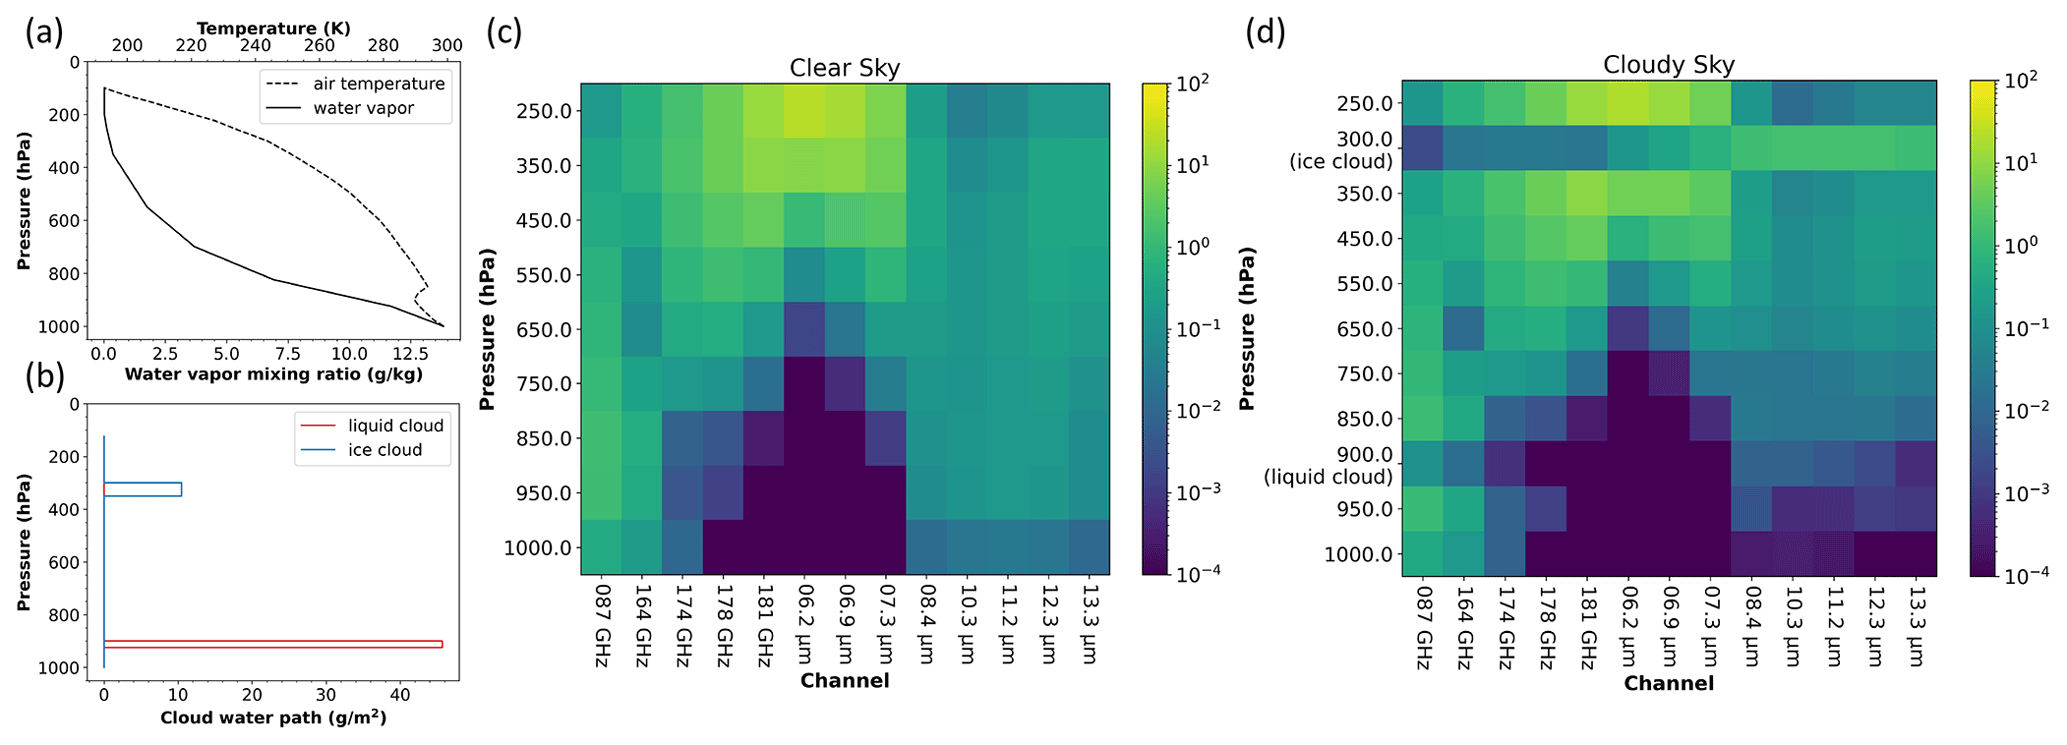
Figure 3An example of water vapor and cloud Jacobians as well as the ERA5 profiles over the ocean used to compute the Jacobians. (a) Profiles of air temperature and water vapor mixing ratio. (b) Liquid and ice cloud layers. (c) Water vapor Jacobians from 250 to 1000 hPa in the clear sky as a function of sensor channels (TEMPEST-D from 87 to 181 GHz and ABI from 6.2 to 13.3 µm). (d) The same as panel (c) but for water vapor Jacobians from 250 to 1000 hPa and Jacobians of liquid (cloud top at 900 hPa) and ice (cloud top at 300 hPa) clouds in the cloudy sky. The unit of the color for water vapor Jacobians is K kg g−1, and for liquid and ice cloud Jacobians it is K m2 g−1.
Given the frequent observations from GOES-R ABI, the data can be readily merged with TEMPEST-D. Figure 4 shows the overlap of the two sensors over the ocean. Gaps between MW orbits, as well as cloudy regions where ABI detects clouds, are evident in both images. Even though ABI cannot be used for sounding in cloudy atmospheres, using the ABI cloud products can still provide retrievals with some prior knowledge about clouds (cloud fraction, phase, and height), which will be shown to positively impact the TEMPEST-D MW retrievals. The next section will explore retrieval sensitivities under clear and cloudy conditions using synthetic TEMPEST-D and ABI observations simulated from ERA5 profiles. Retrieved water vapor profiles are then validated against in situ radiosonde humidity measurements under different retrieval assumptions, as listed in Table 1.
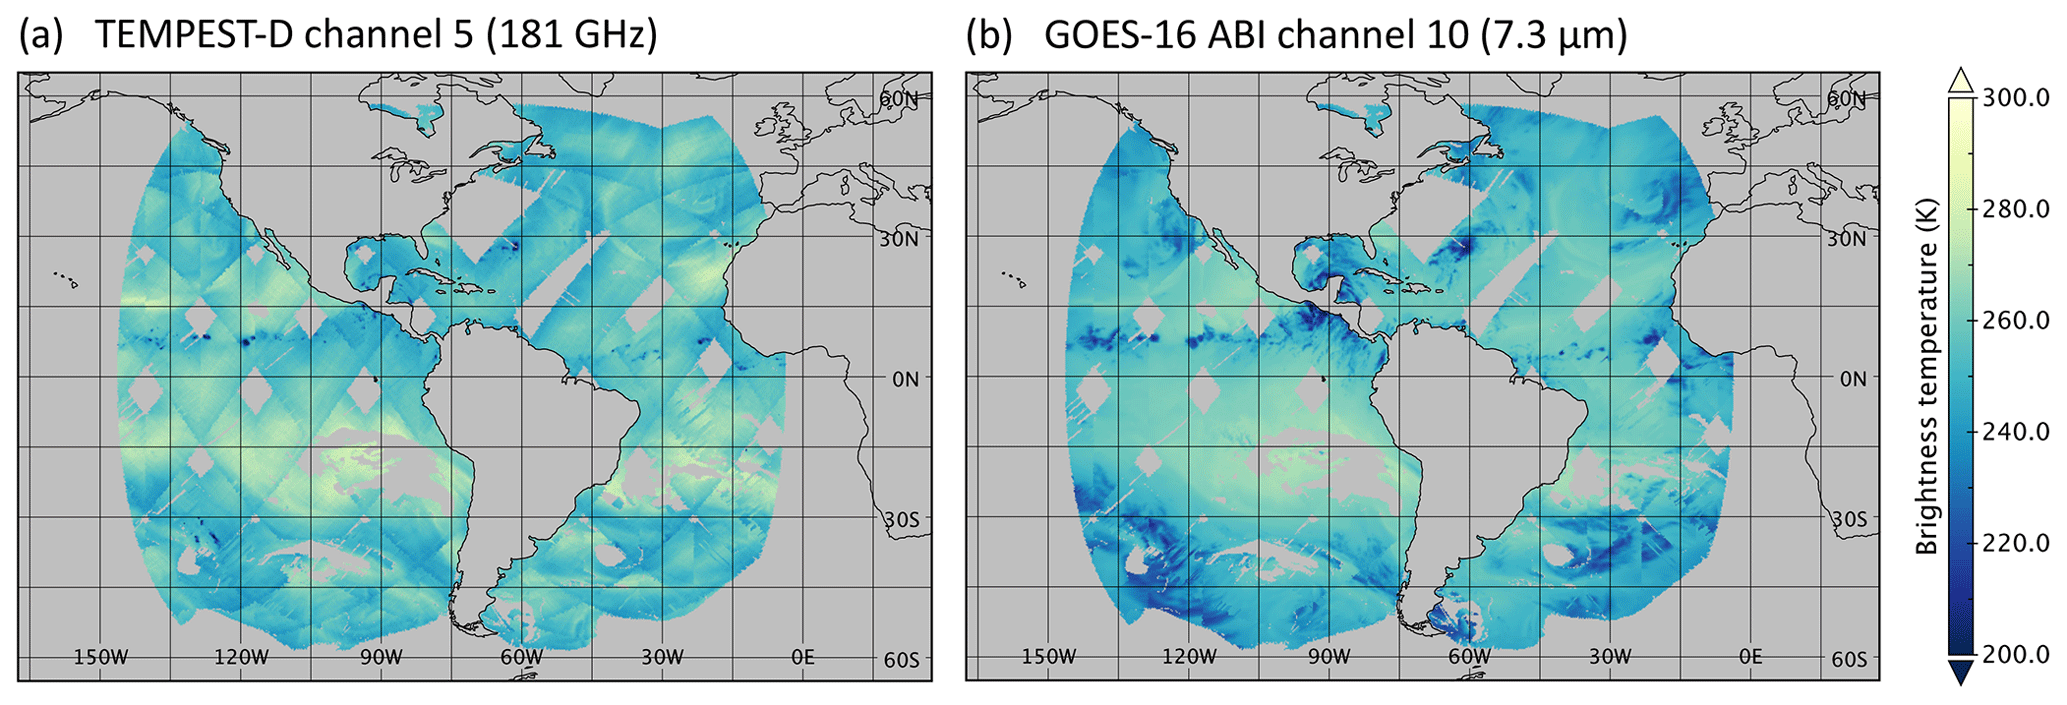
Figure 4Collocated TEMPEST-D and GOES-16 ABI observations over the ocean on 1 June 2020 for (a) TEMPEST-D channel 5 (181 GHz) and for (b) ABI channel 10 (7.3 µm).
4.1 Sensitivity tests
Observations for the five TEMPEST (87, 164, 174, 178, and 181 GHz) and eight ABI (6.2, 6.9, 7.3, 8.4. 10.3, 11.2, 12.3, and 13.3 µm) channels are simulated using temperature, humidity, cloud profiles, surface temperature, and surface wind speed and direction from ERA5 over the ocean with viewing angles corresponding to TEMPEST and ABI instruments, respectively. All data correspond to 27 May 2020. Since the true states from the ERA5 data are known, the retrieval accuracy can be evaluated using the computed observed brightness temperature under different scenarios.
4.1.1 Case studies
Two cases are used to illustrate the humidity retrievals, first using only the TEMPEST sensor, then adding three ABI water-vapor-sounding channels, and then using eight ABI bands in clear- and cloudy-sky scenes. These are shown in Fig. 5. While the retrieved profiles do not change dramatically, the additional ABI channels can be seen to improve the mid-tropospheric biases, as shown in Fig. 5b and d, especially using eight ABI bands in Fig. 5b and adding three ABI water vapor channels in Fig. 5d. Although the retrieved water vapor profiles are overestimated and underestimated along the height when compared to the true ERA5 values, Fig. 5a and b reveal that the retrievals using eight extra ABI IR channels improve significantly with respect to both bias and standard deviation under clear conditions where five ABI window and CO2 bands provide an additional signal from the lower atmosphere in addition to three ABI water vapor channels giving upper-atmosphere information shown in Fig. 3c. In the cloudy scene, since ABI window and CO2 channels are heavily affected by clouds as Figs. 3d and 5c–d show, water vapor retrievals are slightly more degraded by using eight ABI channels than by adding three ABI water vapor bands, which improve retrievals above the 800 hPa level where the ABI water-vapor-sounding channels are expected to add the most information. While overall biases and standard deviations also decrease for both examples, it is apparent that ABI has little influence over the low-level water vapor and that most of the improvement actually comes from the middle to upper troposphere.
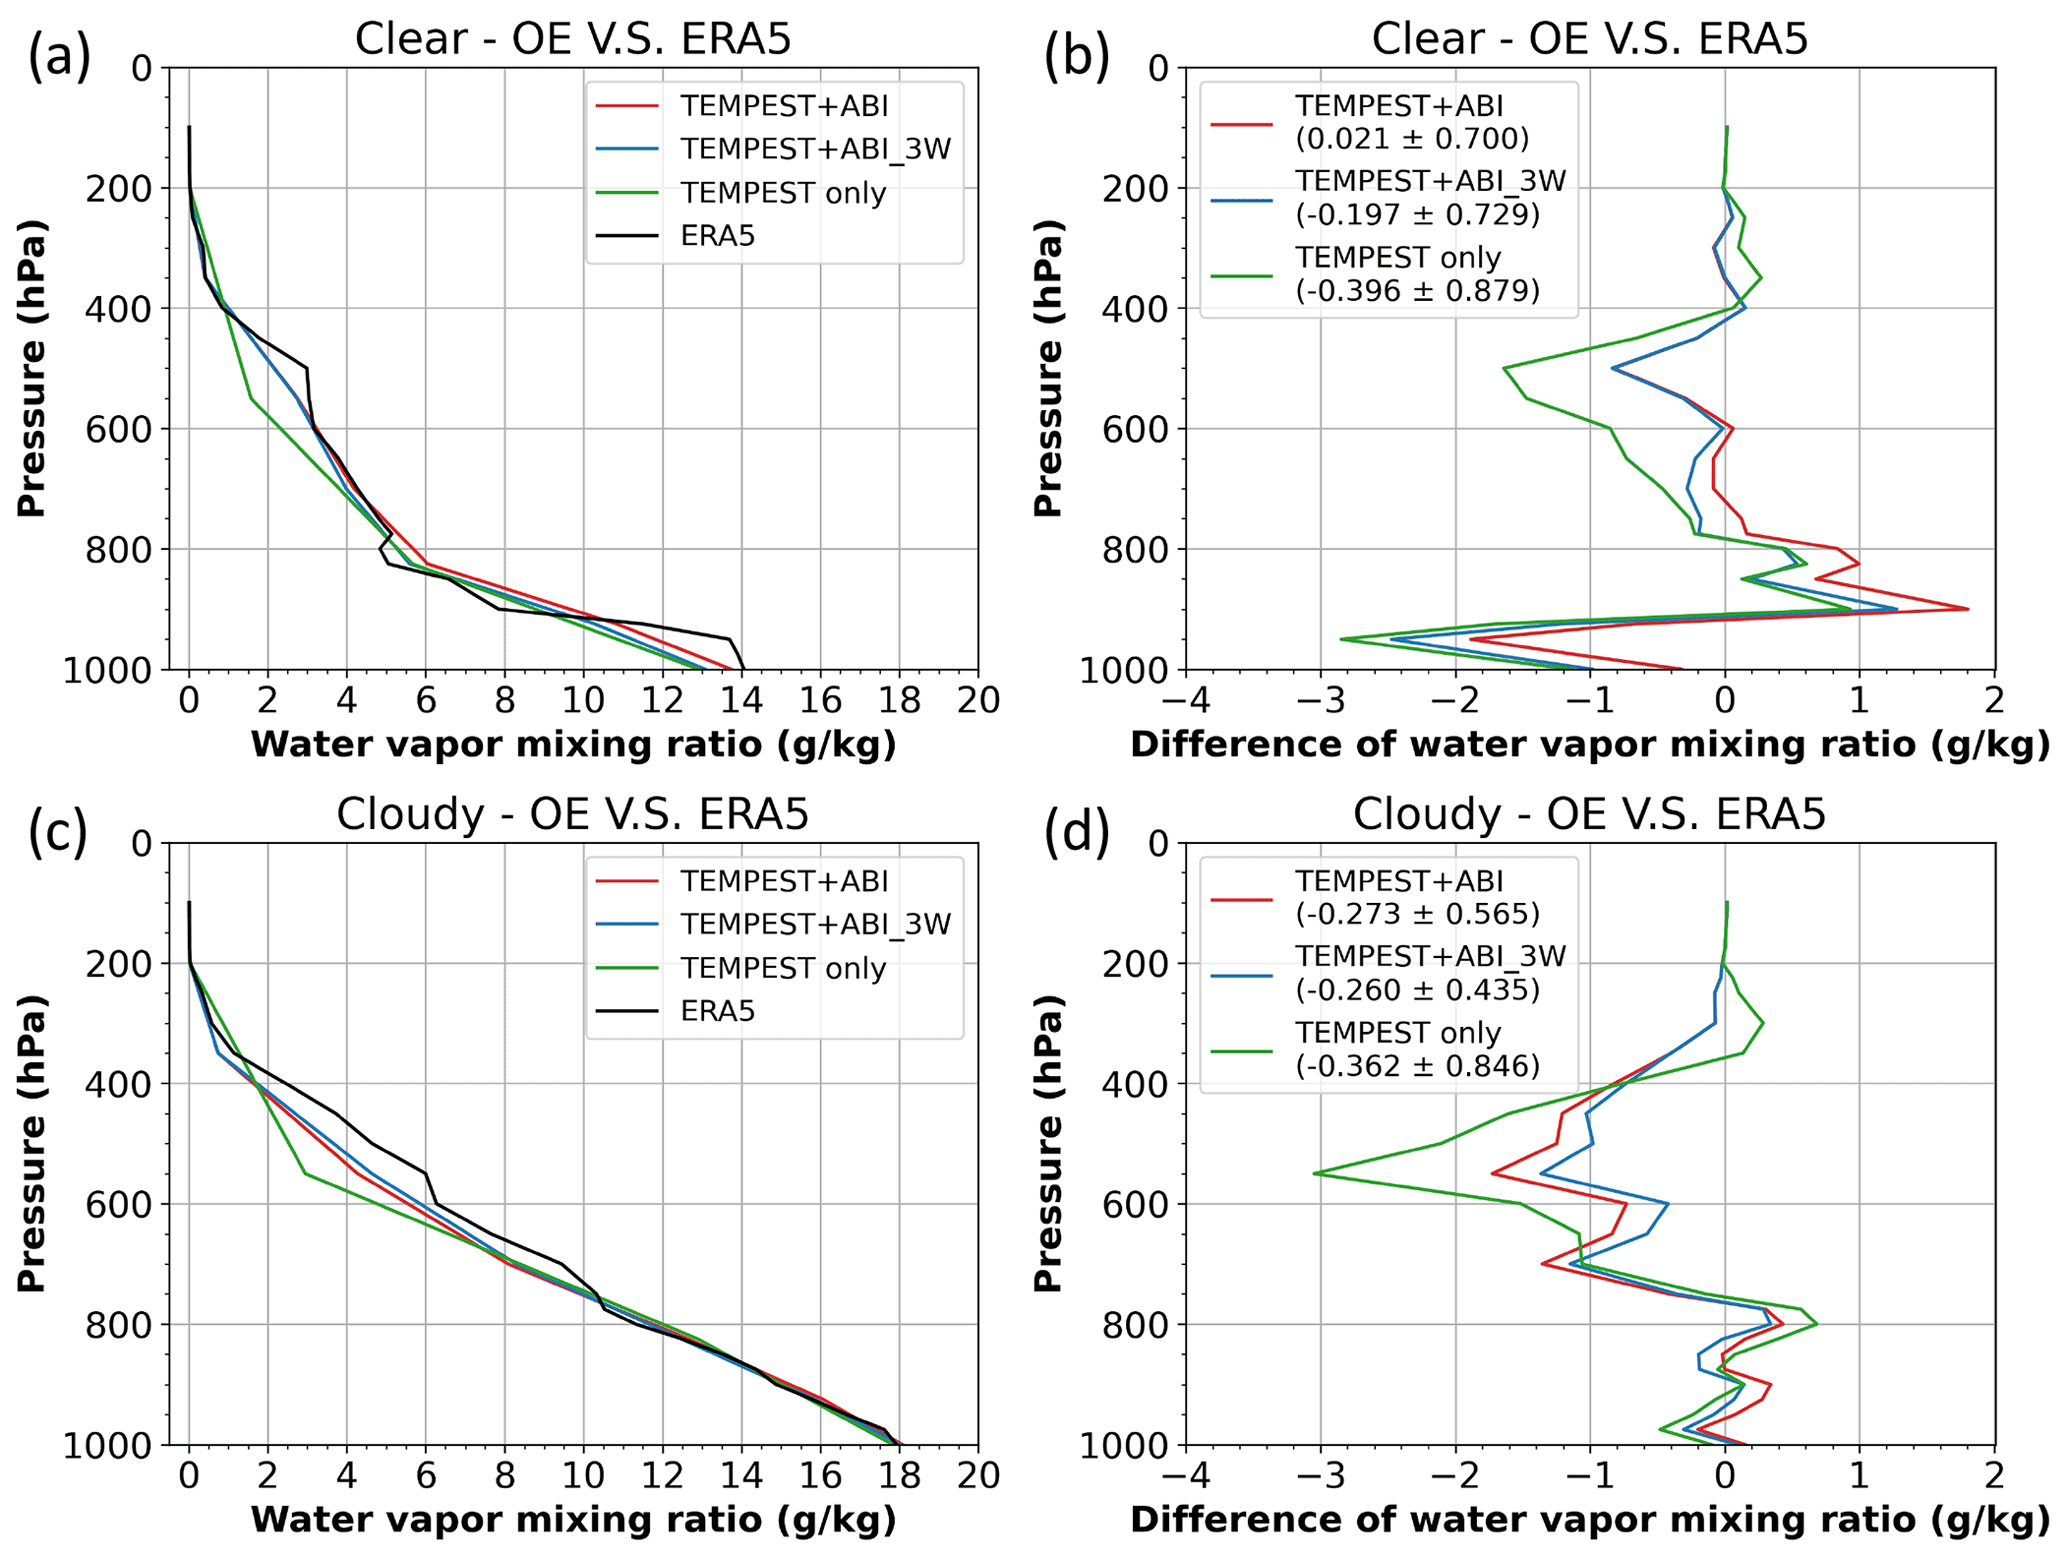
Figure 5Two selected cases of retrieved water vapor profiles using the synthetic observations from ERA5 over the ocean on 27 May 2020 and using all-sky a priori. Panels (a) and (b) show retrievals under clear conditions, while cloudy retrievals are presented in panels (c) and (d). Panels (a) and (c) show the retrieved and ERA5 humidity profiles, and the corresponding comparisons between retrievals and ERA5 (retrievals minus ERA5) are presented in panels (b) and (d). The solid black lines are water vapor profiles from ERA5. The solid red lines are water vapor retrievals using five TEMPEST and eight ABI combined channels, and retrievals using TEMPEST and three ABI water vapor bands are the solid blue lines. The solid green lines are retrievals using the TEMPEST sensor. The number in parentheses is the bias ± standard deviation of the whole profile.
4.1.2 Statistics
Comparisons of humidity retrievals using five merged TEMPEST MW bands and three or eight ABI sounding channels (6.2 to 13.3 µm) versus using only the TEMPEST sensor are performed for 1000 randomly selected clear- or cloudy-sky cases. Based on the GOES-16 ABI cloud mask, there are about 1200 clear-sky and 8400 cloudy pixels successfully collocated with TEMPEST on 27 May 2020. Randomly selecting 1000 samples from both clear and cloudy pixels allows fair statistical comparisons between clear and cloudy regions. The statistics are found independently of how the 1000 samples are randomly selected. Results in clear skies are shown in Fig. 6. As with the case studies, adding ABI channels clearly reduces layer biases and random errors in the retrieved water vapor profiles. Errors in the retrieved water vapor above 800 hPa are significantly smaller when using the five MW bands from TEMPEST in combination with the ABI channels. Particularly, among these three retrieval configurations, with the additional information provided by five ABI window and CO2 channels (8.4 to 13.3 µm), using eight ABI bands in the water vapor retrievals has the lowest overall biases and standard deviations and improves retrievals around the surface, where the biases are less than 1 g kg−1 when using eight ABI and five TEMPEST bands in Fig. 6a and are about 1.2 to 1.4 g kg−1 when using five TEMPEST bands with and without the three ABI water vapor channels in Fig. 6b and c. While the overall water vapor biases and standard deviations under clear conditions are reduced only slightly from −0.149 ± 1.127 g kg−1 for TEMPEST only to −0.128 ± 1.022 g kg−1 for TEMPEST+ABI_3W, much larger reductions can be seen in the TEMPEST+ABI retrievals (−0.014 ± 0.944 g kg−1) and in the layer values shown in Fig. 6 – starting at 900 hPa and extending all the way to 300 hPa.
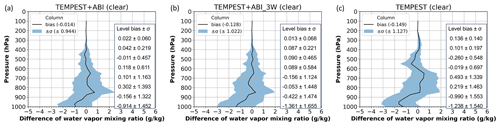
Figure 6Sensitivity tests of retrieving water vapor profiles using synthetic measurement from ERA5 under clear conditions over the ocean on 27 May 2020 and using all-sky a priori. Panel (a) shows retrievals using 13 TEMPEST and ABI combined channels. Panel (b) presents retrievals using five TEMPEST and three ABI water vapor channels, and retrievals using only TEMPEST channels are in panel (c). Panels (a) to (c) show the difference in water vapor mixing ratio from 1000 randomly selected profiles between retrievals and ERA5 (retrievals minus ERA5) along the height. The solid black lines are the bias value, and the blue shaded area is the standard deviation (σ). The included table quantifies the retrieval performance from 300 to 1000 hPa for every 100 hPa.
Similarly, the accuracy of humidity retrievals from 1000 randomly selected cloudy cases using three different sensor configurations is shown in Fig. 7a to c. Consistent with the case study and clear-sky cases shown in Fig. 6, adding ABI IR channels to the retrievals also reduces biases in the mid-tropospheric layers for cloudy scenes. Due to the lack of sensitivity of ABI channels to the lower atmosphere, as shown in Fig. 3d, the performance of water vapor retrievals around the surface shows only a negligible improvement in cloudy skies. While the column metrics show unbiased results with or without ABI, the standard deviation of retrieval errors is larger when using TEMPEST-only retrievals (1.022 g kg−1) than using merged TEMPEST and three or eight ABI channels (0.949 or 0.898 g kg−1). Quantitative comparisons of the vertical profiles in Fig. 7a–c again reveal that the layer biases are significantly reduced in the TEMPEST+ABI and TEMPEST+ABI_3W retrievals relative to TEMPEST alone, reducing the individual layer biases by approximately 50 % (although not uniformly in all layers). The overall biases are smaller than in the clear case. The latter is explained by the fact that the all-sky a priori guess comes from the climatology of ERA5 profiles for the month, and these profiles overwhelmingly contain clouds. The cloudy retrieval is thus less biased in the initial iteration, while the clear retrievals must adjust the first guess to correspond to drier conditions when the atmosphere is cloud-free. Standard deviations are slightly larger for cloudy scenes, as should be expected from a more complex retrieval.
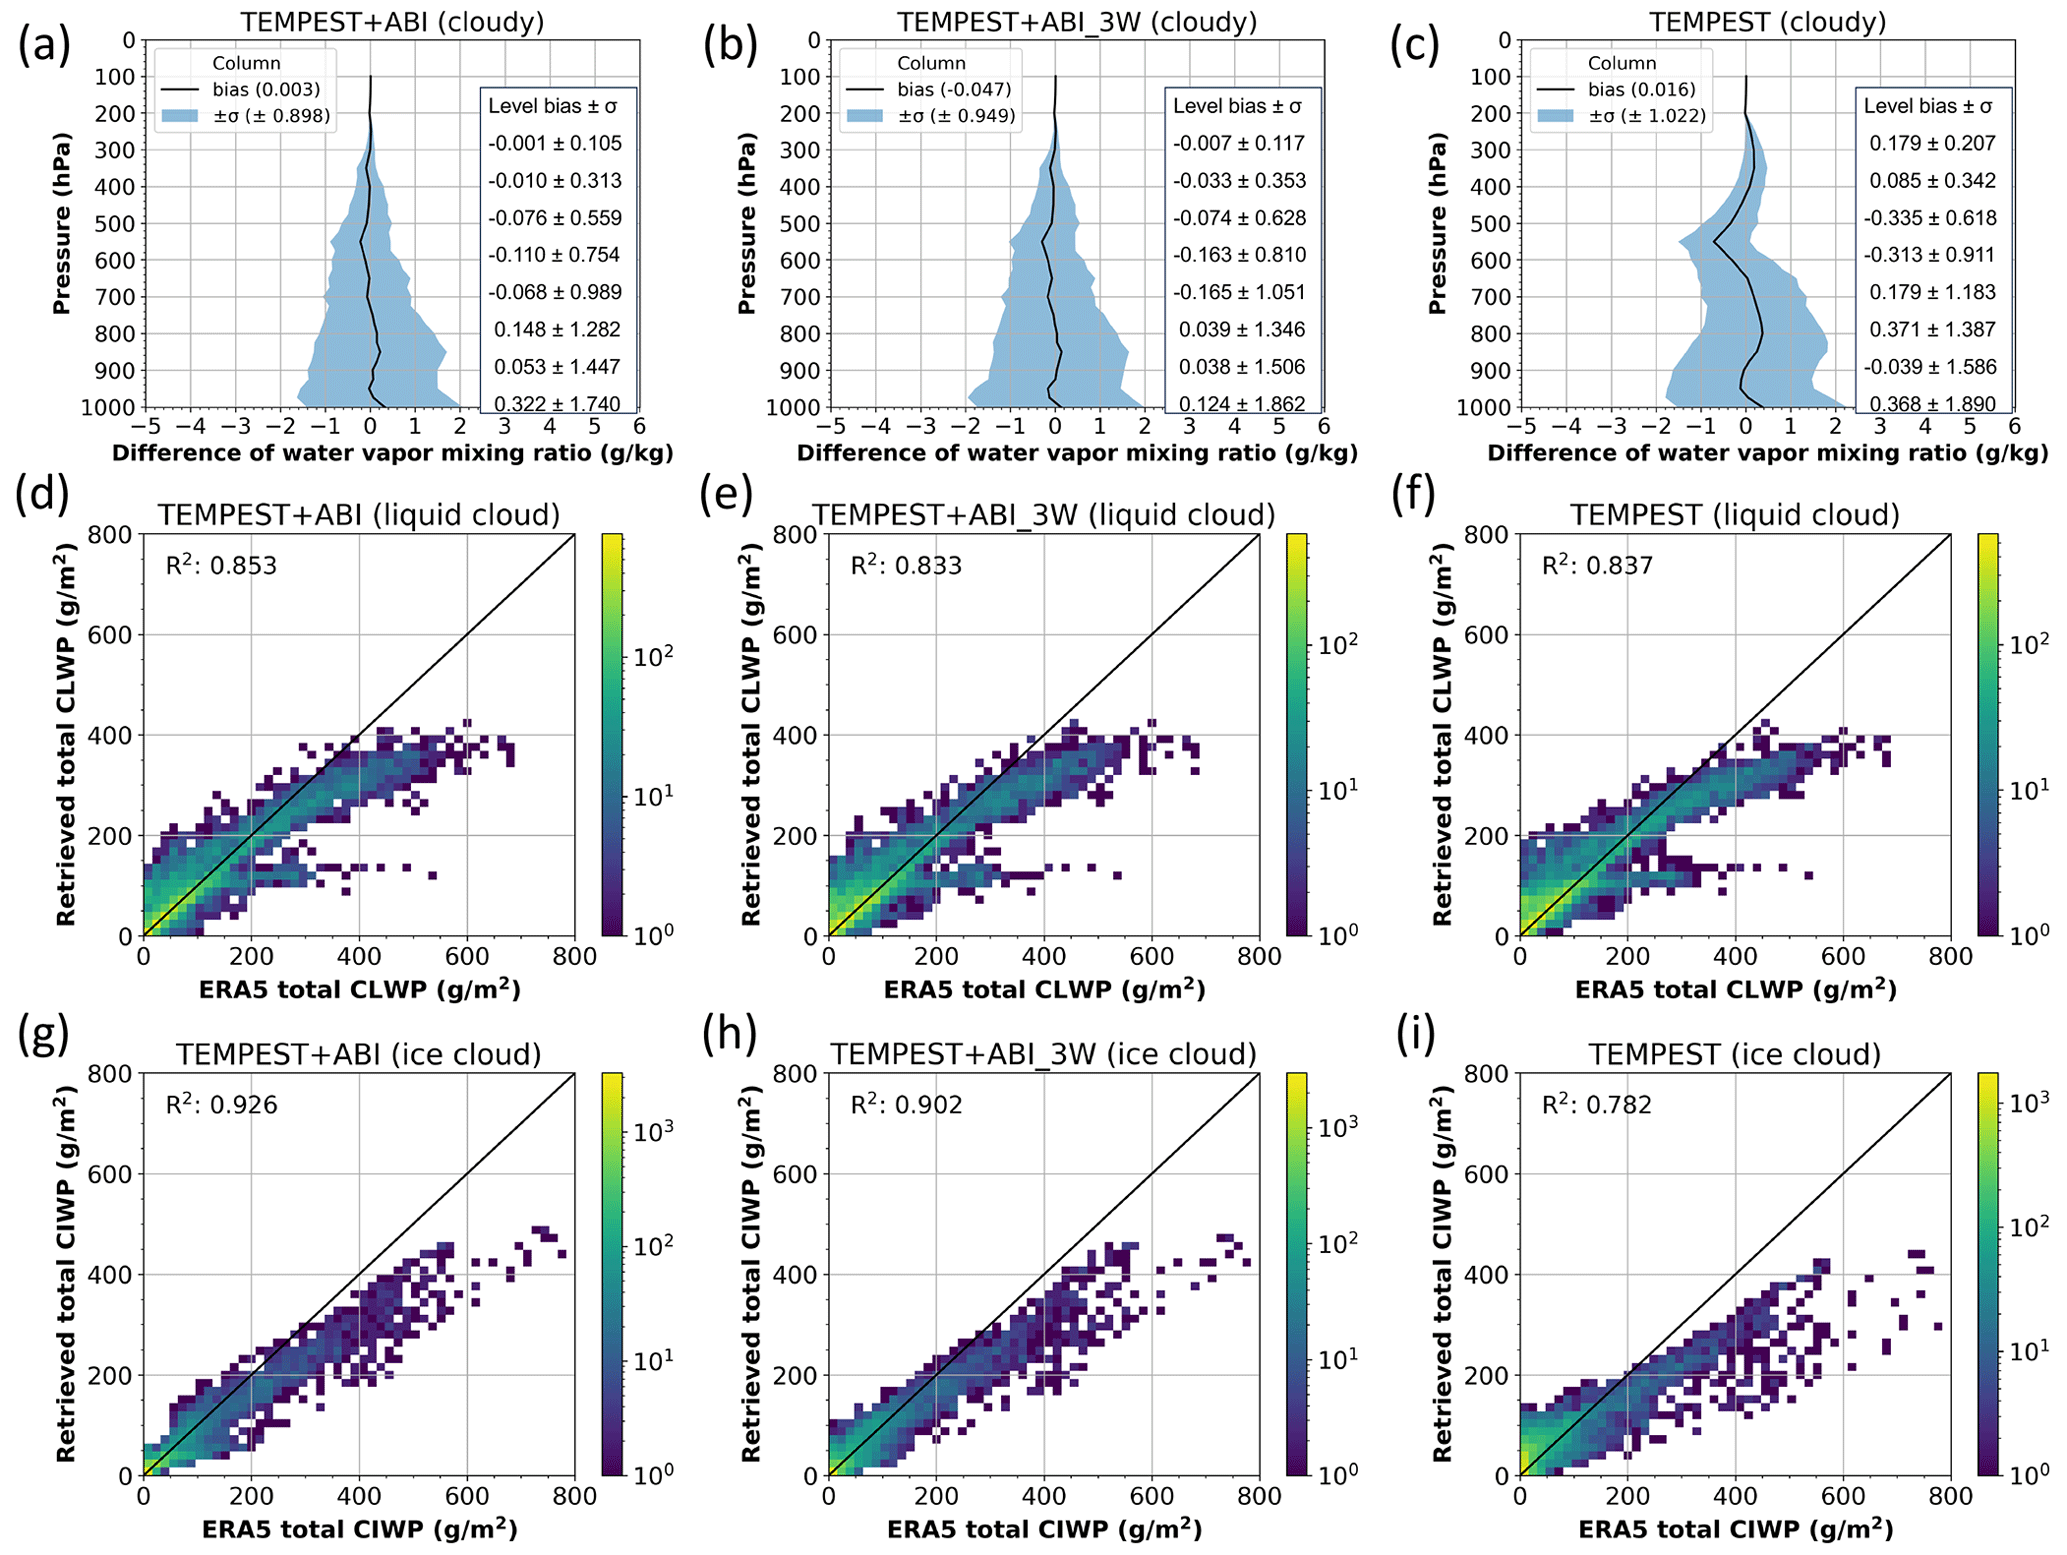
Figure 7Sensitivity tests of retrievals of water vapor, liquid clouds, and ice clouds using synthetic observations from ERA5 under cloudy conditions over the ocean on 27 May 2020 and using all-sky a priori. Panels (a), (d), and (g) show retrievals using TEMPEST and eight ABI combined channels. Panels (b), (e), and (h) present retrievals using merged TEMPEST and three ABI water vapor channels, and retrievals using only TEMPEST channels are in panels (c), (f), and (i). Panels (a) to (c) show the difference in water vapor mixing ratio from 1000 randomly selected profiles between retrievals and ERA5 (retrievals minus ERA5) along the height. The solid black lines are the bias value, and the blue shaded area is the standard deviation (σ). The included table quantifies the retrieval performance from 300 to 1000 hPa for every 100 hPa. Panels (d) to (f) are two-dimensional histograms of retrieved and ERA5 total cloud liquid water path from 8000 randomly selected cases (total number of cloudy pixels is about 8400). R2 is the coefficient of determination. The color indicates the number of samples; the solid black lines are the one-to-one lines. Panels (g) to (i) are the same as panels (d) to (f) but for the total cloud ice water path.
The performance of liquid and ice cloud retrievals is shown in Fig. 7d–i. Compared with the cloud liquid water path from ERA5, the liquid cloud retrievals do not improve after incorporating three more ABI water-vapor-sounding channels, shown in Fig. 7e and f, as the cloud liquid water path signal is confined almost entirely to the 87 and 164 GHz channels of TEMPEST-D. The sensitivity to liquid clouds with and without three ABI channels is similar, with R2 values of about 0.83. However, given additional cloud-sensitive channels from five ABI window and CO2 bands, liquid cloud retrievals are slightly improved by using TEMPEST+ABI, as the R2 values increase from about 0.83 to 0.85. Since ice clouds are at a higher altitude and interact with window and CO2 channels as well as the water-vapor-sounding channels, the 164 to 181 GHz TEMPEST and 6.2 to 13.3 µm ABI channels have different degrees of sensitivity, as shown in Fig. 3d. Adding ABI channels has larger impacts on the retrieved ice clouds, as the R2 values increase from 0.782 using only TEMPEST bands to over 0.9 using eight or three combined channels from TEMPEST and ABI. Due to strong sensitivity from ABI channels 8.4 to 13.3 µm, merging five TEMPEST and eight ABI channels gives the best ice cloud retrievals (R2 value is about 0.93) among three retrieval configurations and significantly constrains retrieved ice water path with less than 50 g m−2. Overall, the retrieved liquid and ice clouds are all underestimated compared with the ERA5 profiles. For liquid clouds, this is simply due to the saturation of the cloud water emission signal at roughly 300 to 400 g m−2 with the available channels. For ice clouds, the primary signal is a brightness temperature depression due to scattering. While this signal does not saturate, thicker ice clouds (> 300 to 400 g m−2) are often found in conjunction with liquid clouds in ERA5, leading to brightness temperature signatures that are more difficult to untangle.
4.2 Independent validation
While the preceding section focused on synthetic brightness temperatures generated from ERA5 profiles, this section uses radiosonde data to validate retrievals from actual observations. The Integrated Global Radiosonde Archive (IGRA) has collected and quality-controlled in situ observations from over 2800 global stations since 1905, providing vertical profiles of pressure, temperature, humidity, and wind speed and direction. The IGRA dataset can be accessed at https://www.ncei.noaa.gov/products/weather-balloon/integrated-global-radiosonde-archive (last access: 10 September 2024). The IGRA dataset used in the study is version 2.2 and is collocated with TEMPEST-D and GOES-16 ABI observations from 2019 to 2020. To ensure consistency in collocated cases, the observations from these three datasets are all within 1 h and 1° latitude–longitude. Because the OE retrieval discussed here is limited to oceans, the radiosondes used in this study are limited to coastal regions. To avoid surface contamination, the collocated TEMPEST-D measurements are moved over the ocean to ensure that ∼ 30 km (the sensor FOV) in all directions of the TEMPEST-D pixel is free of land. The displaced footprints must have the same cloud conditions (clear sky or cloudy) as determined by GOES-16 cloud products at the radiosonde location to ensure these locations are under similar atmospheric conditions. There are 19 collocated coastal IGRA stations in the GOES-16 FOV, as shown in Fig. 8. The collocated IGRA sites are around North America and the Caribbean Sea. Given GOES-16 cloud information, there are 104 collocated cases, of which 10 cases are cloud-free and 94 cases are under different degrees of cloudy skies, as shown in Fig. 9. The limited number of coincident samples is due to infrequent TEMPEST-D overpasses coupled with infrequent (twice daily) radiosonde launches and frequent data downlink problems of TEMPEST-D, leaving only this limited set of radiosondes to compare to.
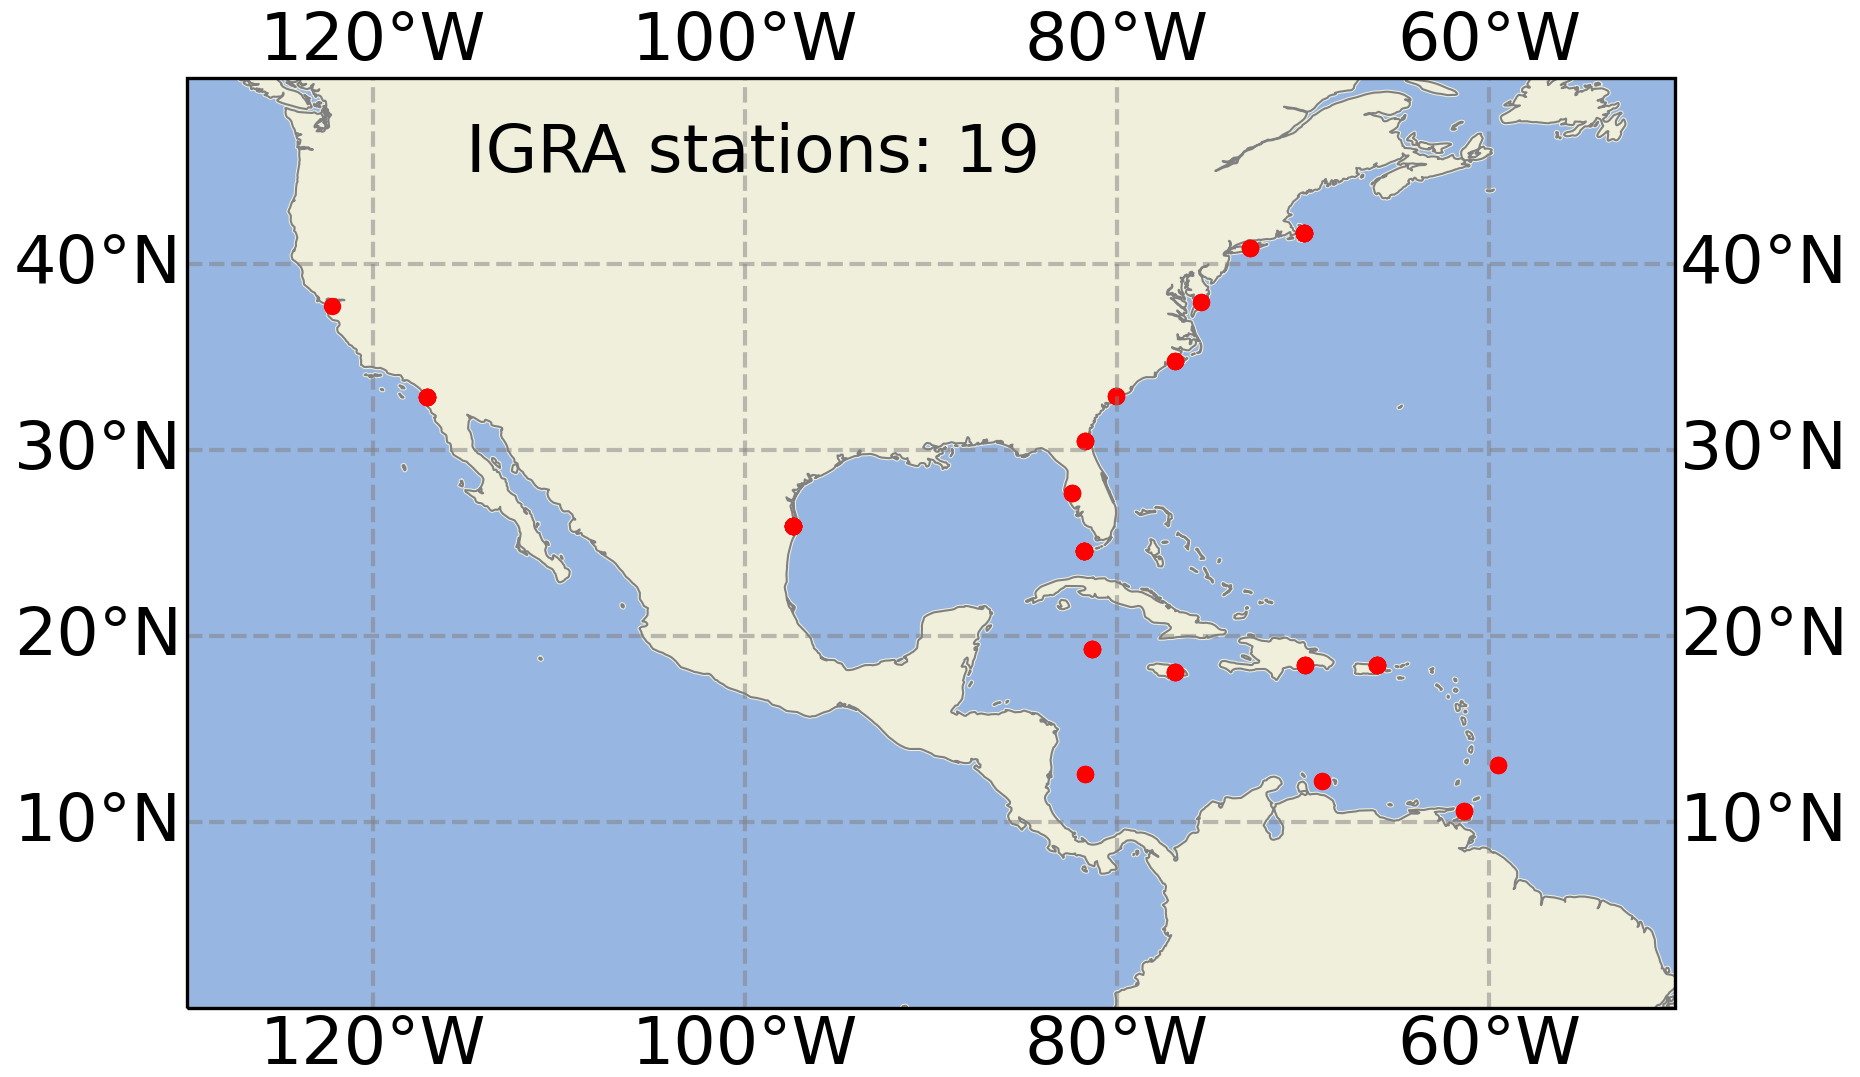
Figure 8Map of collocated IGRA stations. The total number of collocated sites is 19, as marked by the red dots.
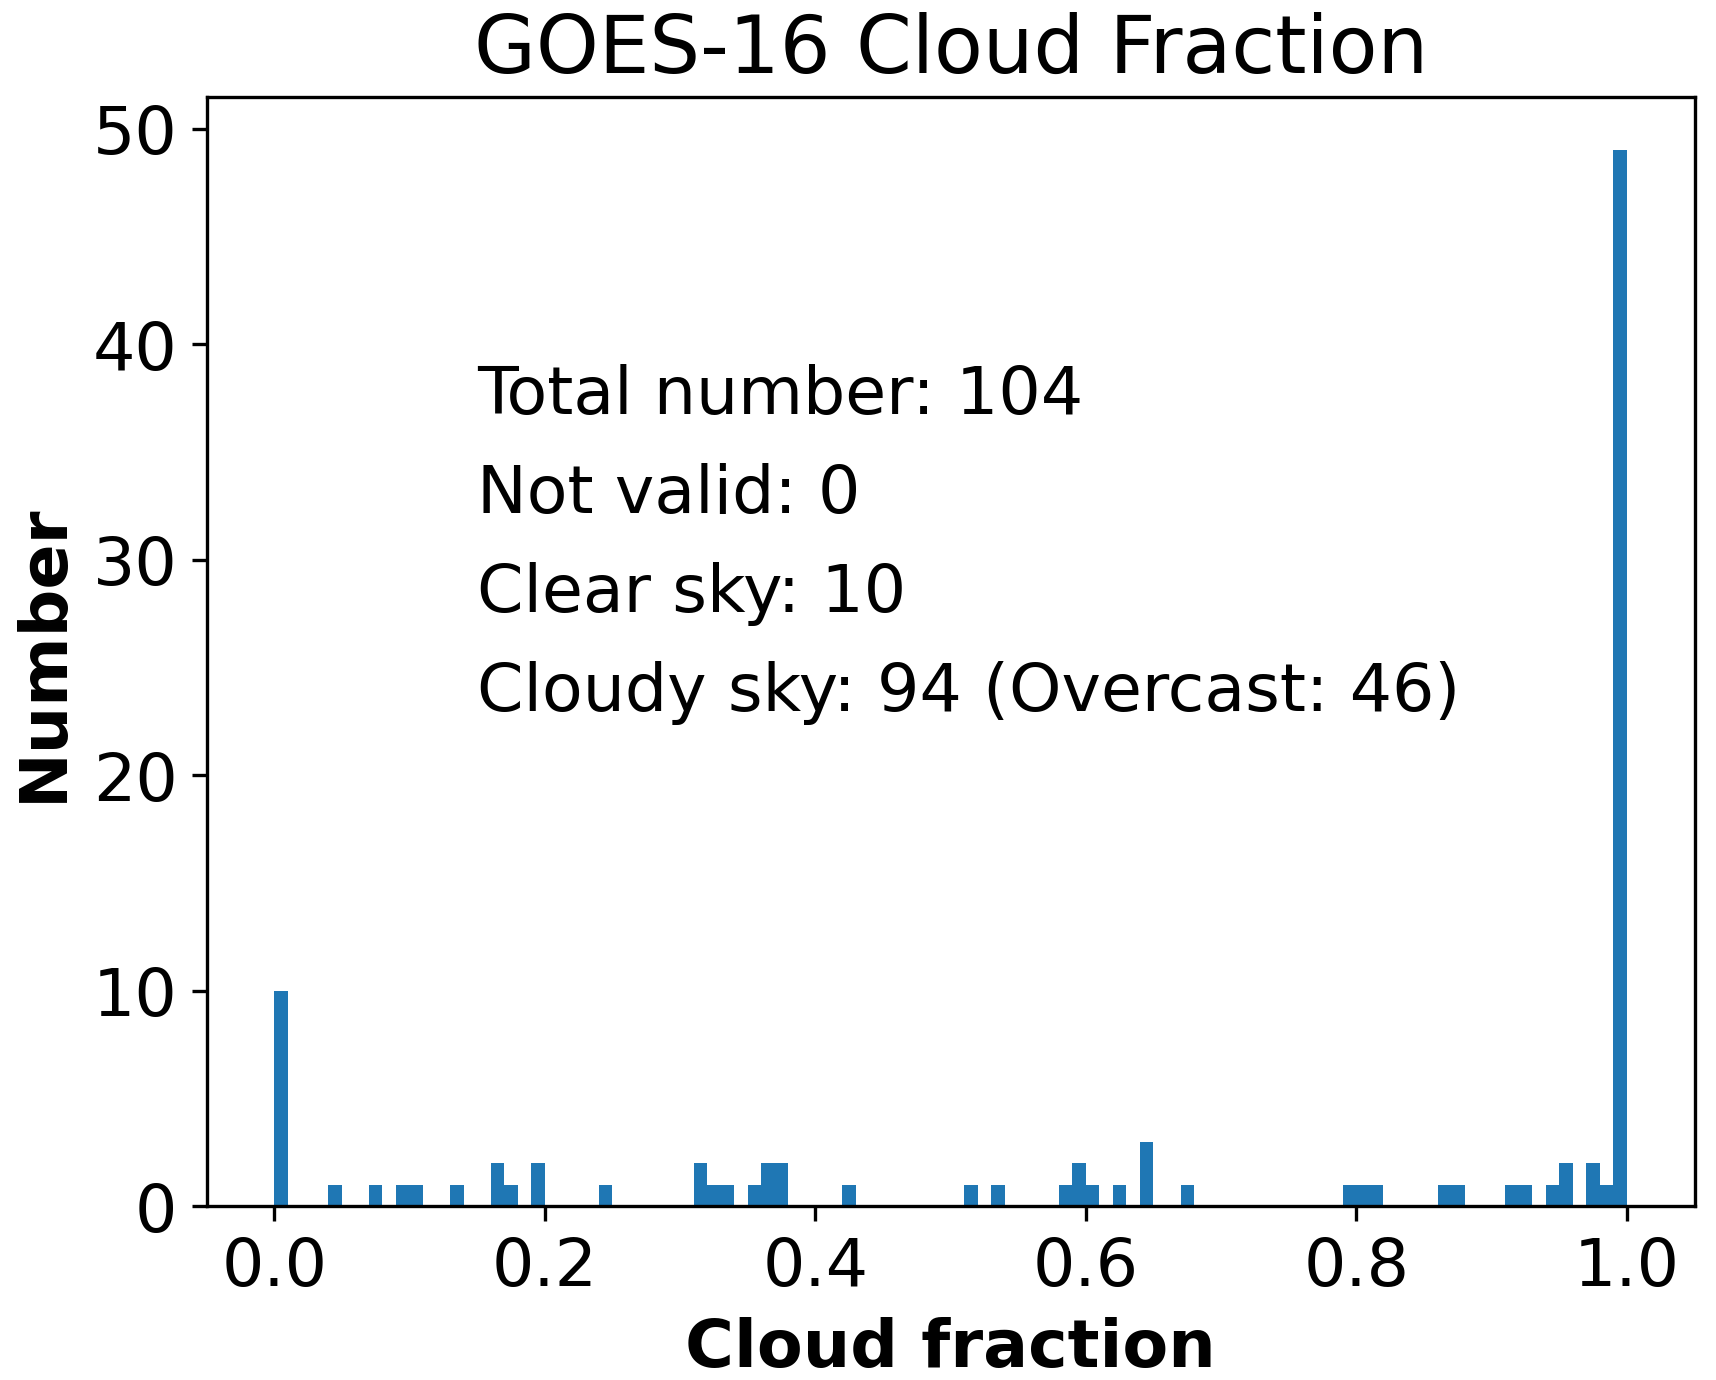
Figure 9The histogram of GOES-16-derived cloud fraction at the collocated locations. The total number of collocated cases is 104, including 10 clear and 94 cloudy cases.
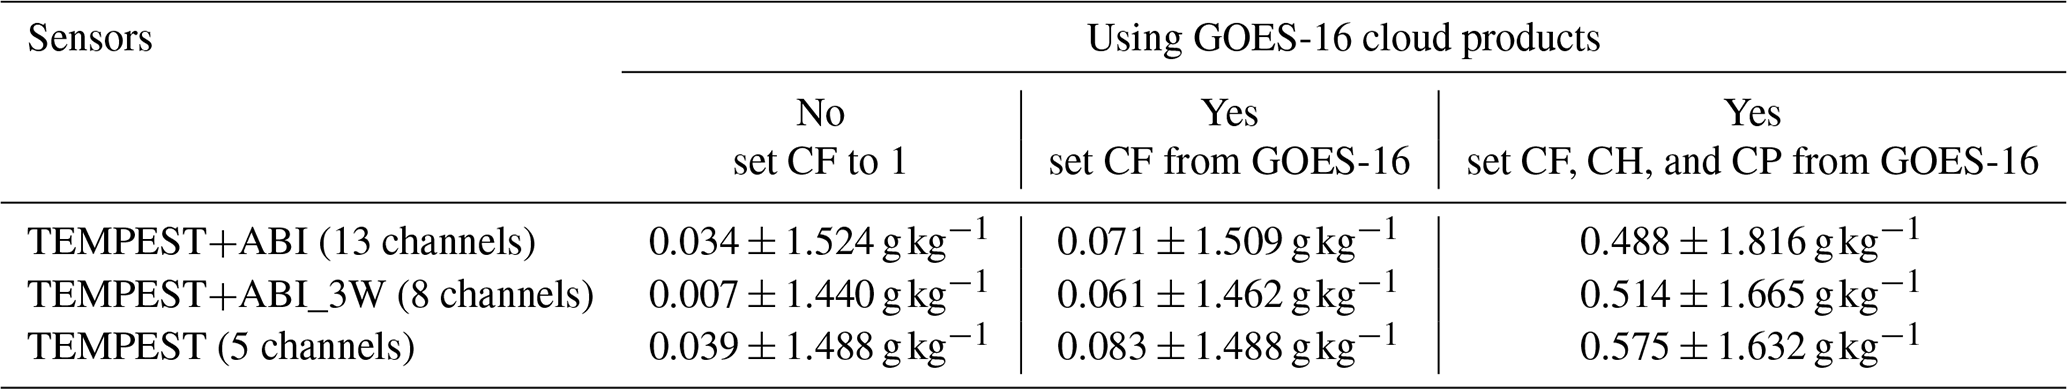
With additional cloud information from GOES-16 products, water vapor retrievals are validated with various levels of cloud information from the geostationary observations, as described in Table 1. The most significant difference is that the algorithm does not retrieve clouds when the area is cloud-free (as determined by ABI's cloud mask) and uses observations from all channels to retrieve water vapor profiles only. Figure 10 shows the error in the retrieved water vapor profiles in clear skies, with biases and standard deviations of column errors listed in Table 2. Only 9 cases converged among 10 clear-sky cases under four different retrieval settings using only TEMPEST bands and merged TEMPEST and three ABI water vapor channels; using five TEMPEST and eight ABI bands slightly reduced the retrieval rate, which is 8 out of 10 cases. Experiments are performed with and without GOES-16 information. If GOES-16 cloud products are not used, the cloud fraction is set to 1.0, implying that clouds covering the FOV are possible, although the retrieval can set the cloud water path to zero. The convergence criteria from Eq. (2) are set to 0.8 for retrievals using TEMPEST-D and three or eight ABI channels and are 0.5 using five TEMPEST-D bands, as mentioned in Sect. 3 (either five or eight layers of clouds and water vapor in this case).
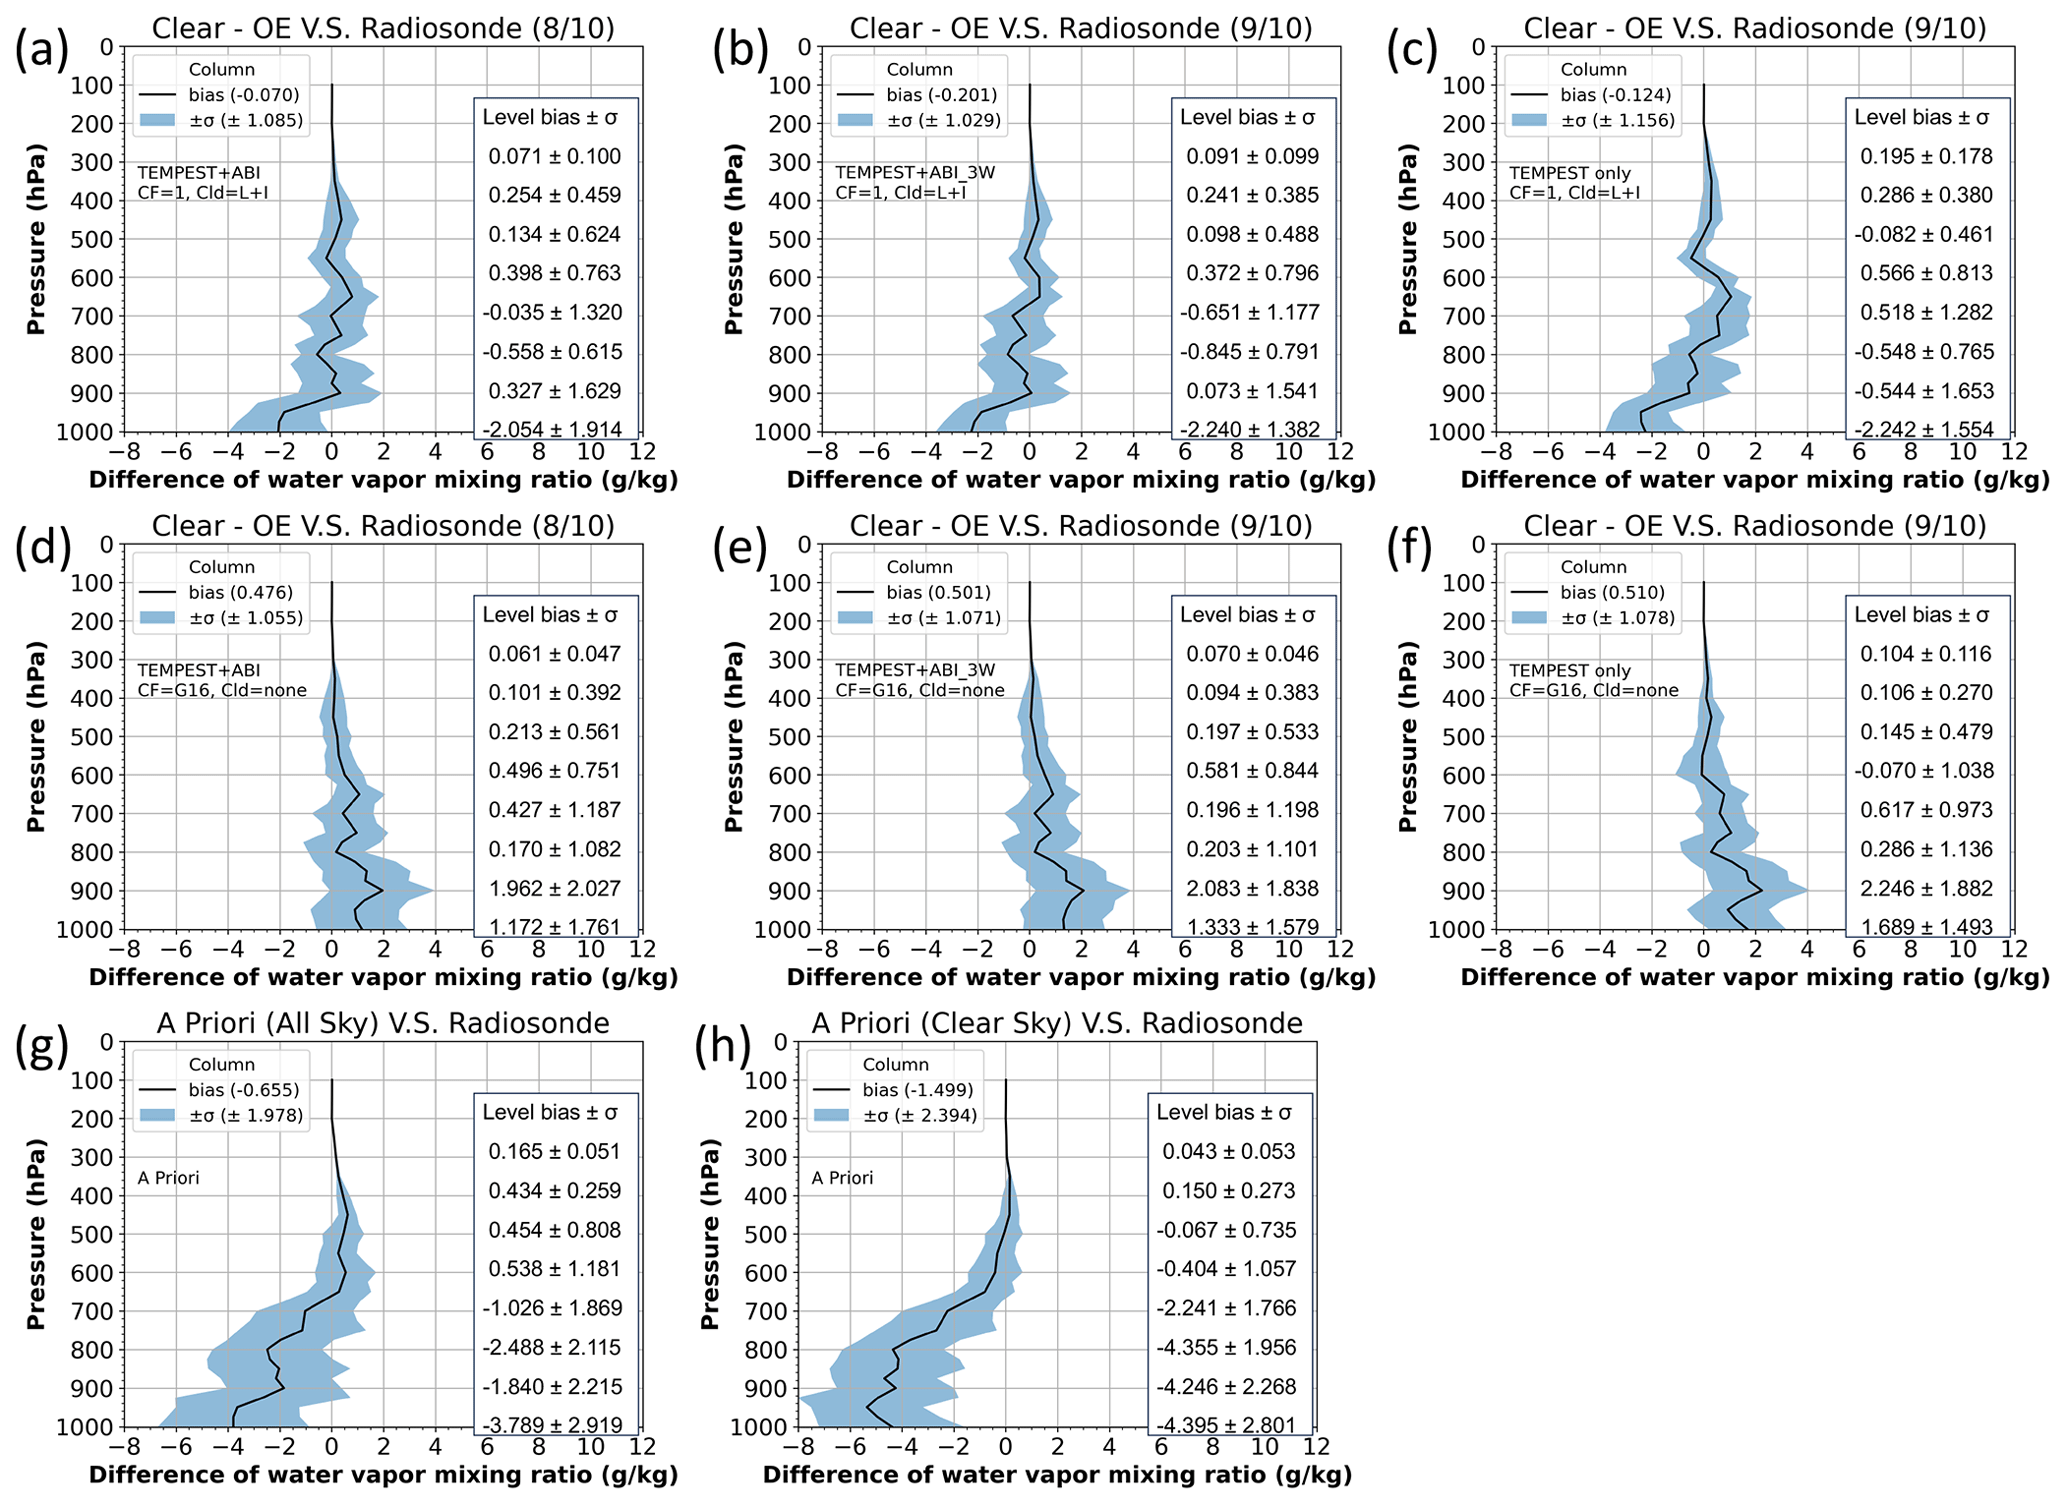
Figure 10The water vapor mixing ratio difference between retrievals and radiosonde measurements (retrievals minus IGRA) in the GOES-16-observed clear skies. Retrievals use 13 bands from TEMPEST-D and GOES-16 ABI in panels (a) and (d). They use five TEMPEST-D and three ABI water-vapor-sounding channels in panels (b) and (e), and they use only TEMPEST-D channels in panels (c) and (f). Retrievals in panels (a) to (c) assume existing liquid and ice clouds with a cloud fraction of 1 and use all-sky a priori, and retrievals in panels (d) to (f) set no clouds with a cloud fraction of 0 and use clear-sky a priori. In the retrievals, the biases of the water vapor a priori information derived from all-sky conditions are shown in panel (g), and those obtained from clear skies are presented in panel (h). The solid black lines are the bias value, and the blue shaded regions indicate the standard deviation (σ). The included table quantifies the retrieval performance from 300 to 1000 hPa for every 100 hPa. The number in parentheses indicates the number of all converged cases out of all clear-sky cases. G16 means GOES-16 products, and L + I indicates liquid and ice clouds.
Table 2Compared with IGRA radiosonde observations, the column bias and standard deviation of retrieved water vapor mixing ratio under clear-sky conditions. The statistical values are evaluated based on all eight converged clear-sky cases for the TEMPEST+ABI sensor configuration and nine clear-sky cases using TEMPEST and TEMPEST+ABI_3W channels. CF means cloud fraction.
The additional eight (6.2 to 13.3 µm) and three (6.2 to 7.3 µm) channels from ABI help to constrain water vapor profiles, as shown in the reduced column error standard deviations as well as the layer biases and standard deviations, although the differences are smaller than they were with the simulated results. Compared with TEMPEST only (Fig. 10c and f), the retrieved water vapor profiles above 800 hPa are visibly less biased after including eight (Fig. 10a and d) or three (Fig. 10b and e) ABI channels. The overall statistics are not as impressive because much of the water vapor is in the 1000 to 800 hPa layer, which is not improved by three additional ABI water-vapor-sounding channels. However, with extra information from five ABI window and CO2 bands, water vapor retrievals have slight improvement around the surface, leading to smaller overall retrieval biases and standard deviations among these three sensor configurations. Figure 11a–c present the erroneous retrieved liquid and ice clouds under clear conditions corresponding to Fig. 10a–c, respectively. No clouds are estimated in retrievals in Fig. 10d–f, as this information is taken from the IR channels. Because parts of the water vapor signals are falsely attributed to clouds, retrieved water vapor profiles are underestimated when clouds are derived, as in Figs. 10a–c and 11. On the other hand, retrieved water vapor profiles are overestimated in Fig. 10d–f when the scene is forced to be cloud-free based on ABI information. We speculate that, as with the synthetic retrievals, the bias from ERA5 information in Fig. 10h under clear-sky assumptions is even larger than if the all-sky ERA5 a priori in Fig. 10g is used. This leads to even larger biases in the initial iteration, which the retrievals can only partially correct without adding small amounts of cloud water to the scene. Conversely, it is also possible that the small number of cases (eight or nine) is simply not representative.
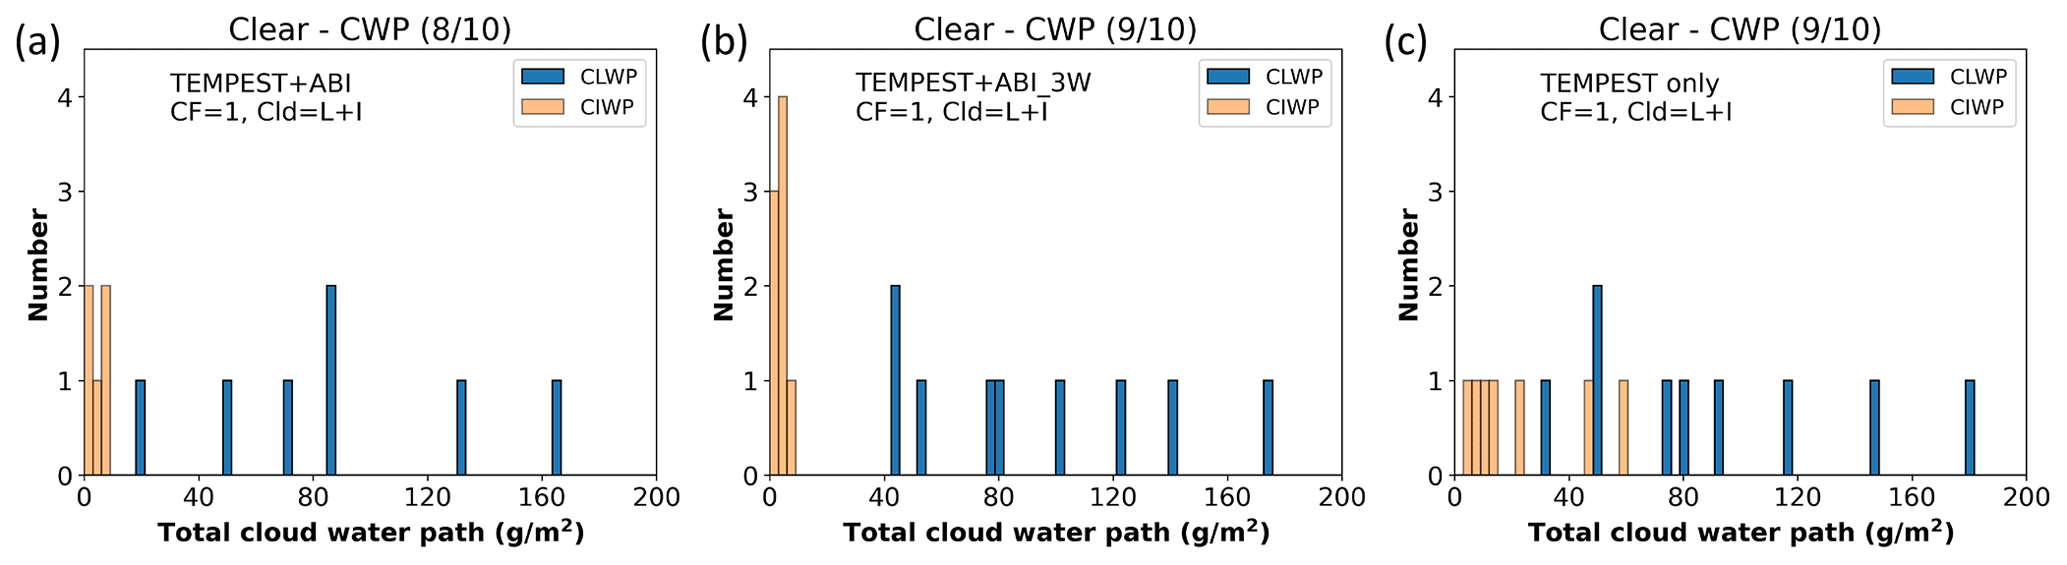
Figure 11Retrieved total cloud water path for liquid and ice clouds in the clear-sky cases with no cloud information from GOES-16. Retrievals in panels (a) and (b), in addition to five TEMPEST channels, use eight ABI channels and three ABI water vapor bands, respectively, and use only TEMPEST-D channels for panel (c). The number in parentheses indicates the number of all converged cases among all clear-sky cases. L + I indicates liquid and ice clouds.
Water vapor retrieval errors under cloudy conditions for various assumptions of cloud knowledge are presented in Fig. 12, with the corresponding bias and standard deviation of column errors listed in Table 3. Although cases used in Table 3 and Fig. 12 have all ABI and TEMPEST-D observations and all cloud information, this is not the case for all other pixels. Therefore, Table 3 and Fig. 12 show the possible results from nine different retrieval configurations using different degrees of cloud status and using TEMPEST only or with measurements from eight or three ABI channels. The retrieval configurations in cloudy cases are listed in Table 1. Due to lack of humidity sensitivity of ABI window and CO2 bands below clouds as in Fig. 3d, in comparisons adding three ABI water-vapor-sounding channels, using eight ABI bands does not improve water vapor retrievals and has a much lower retrieval rate. Retrievals in Fig. 12a–c have no information about clouds. In contrast, Fig. 12d–i show results with different degrees of knowledge about clouds from ABI. Figure 12d–f use only cloud fractions. In the scenarios of no cloud information from ABI in Fig. 12a–c, water vapor retrievals using TEMPEST+ABI and TEMPEST+ABI_3W have improvement above 500 hPa, between 700 and 800 hPa, and around the surface. When only cloud fraction is available from GOES-16 cloud products, Fig. 12d–f show that adding eight or three ABI bands improves overall water vapor retrievals except for around 900 hPa. If the cloud fraction, cloud height, and cloud phase are all available from the cloud products as in Fig. 12g–i, water vapor retrievals using different degrees of ABI measurements have improvement around 300, 400, and 600 hPa and have minor or no improvement at the other levels. In general, when retrievals use the same cloud status, column-average water vapor retrieval biases using TEMPEST and ABI observations are smaller than using TEMPEST-only measurements, as in comparisons among Fig. 12a–c, d–f, and g–i. While column-average water vapor retrievals do not improve significantly by adding cloud fraction information, when cloud fractions are specified, quantitative comparisons show some improvements between 500 and 700 hPa and around the surface for TEMPEST+ABI retrievals in Fig. 12a and d and for TEMPEST+ABI_3W retrievals in Fig. 12b and e, and they present some improvements above 400 hPa and around 600 hPa as well as the surface for TEMPEST-only retrievals in Fig. 12c and f.
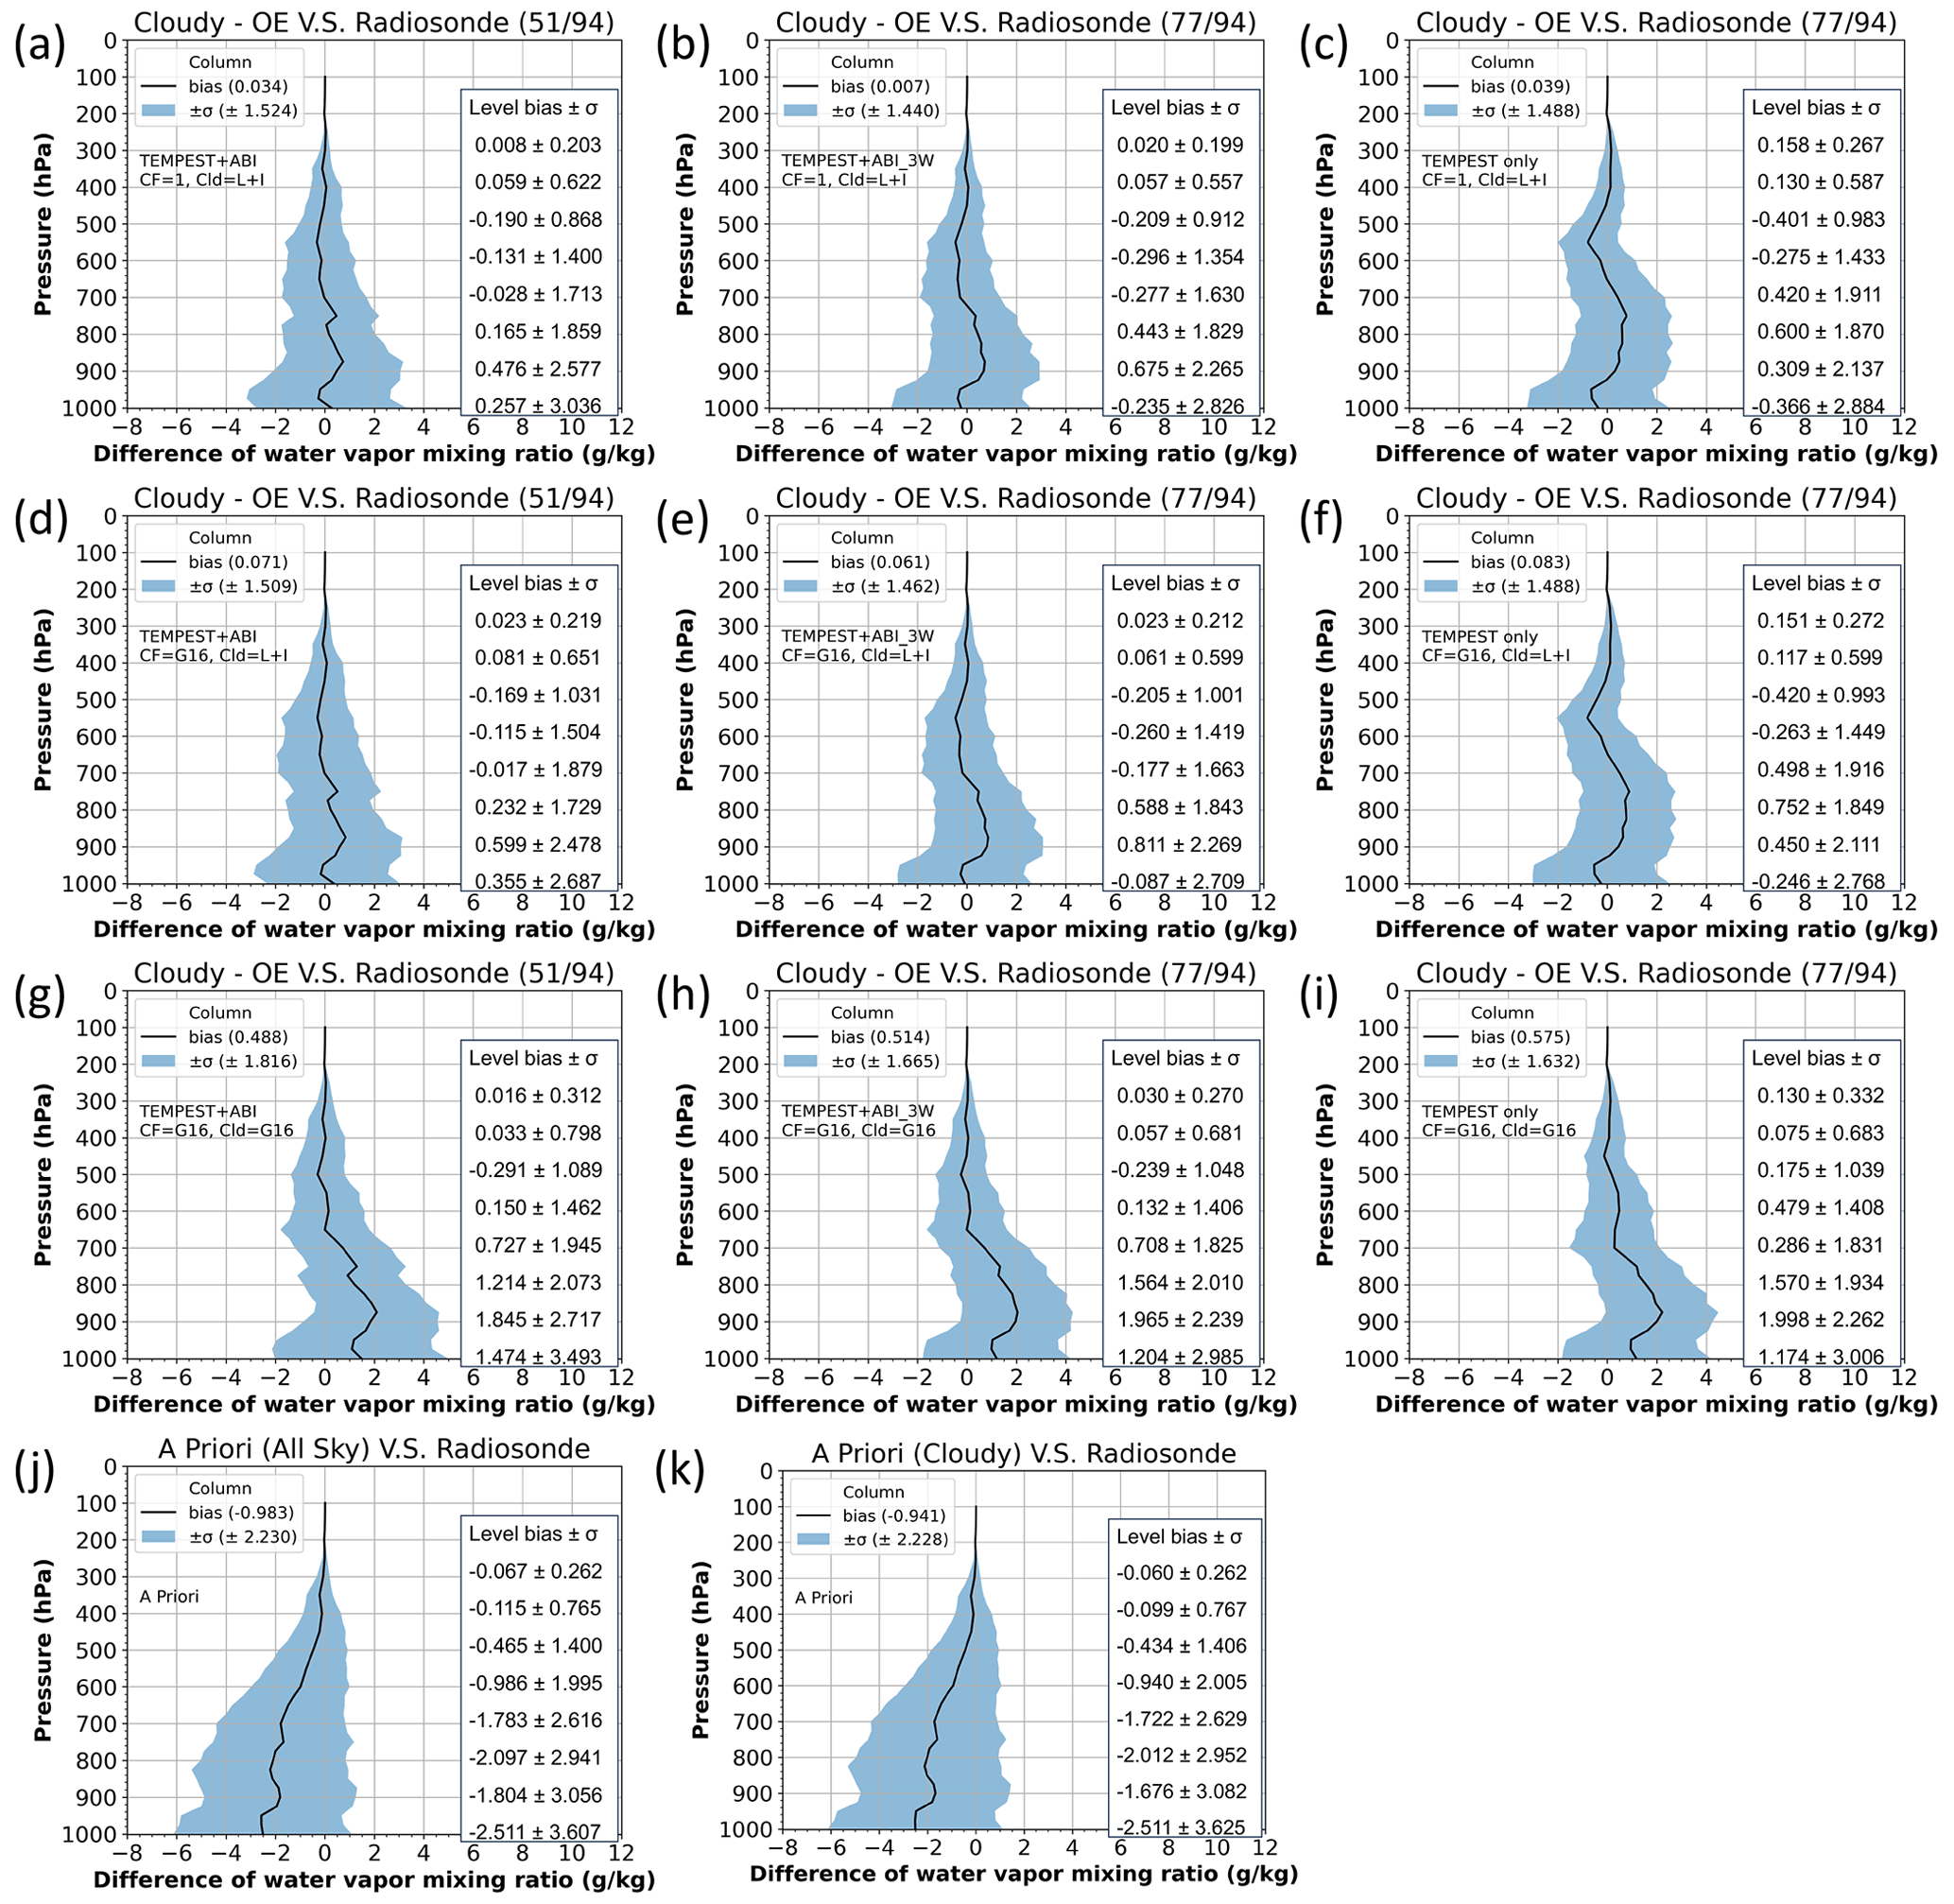
Figure 12The water vapor mixing ratio difference between retrievals and radiosonde measurements (retrievals minus IGRA) with GOES-16-observed cloudy conditions. Retrievals use five TEMPEST channels with eight ABI bands in panels (a), (d), and (g) and three ABI water vapor channels in panels (b), (e), and (h). They use only TEMPEST channels in panels (c), (f), and (i). Panels (a) to (f) show retrievals assuming liquid and ice clouds with a cloud fraction of 1 for panels (a) to (c) and with the cloud fraction from the GOES-16 cloud mask for panels (d) to (f). Retrievals in panels (g) to (i) use cloud fraction, height, and phase from GOES-16 products to define cloud layers. Panels (a) to (c) use all-sky a priori, and panels (d) to (i) use cloudy-sky a priori. In the retrievals, the biases of the water vapor a priori information derived from all-sky conditions are shown in panel (j), and those obtained from cloudy skies are presented in panel (k). The solid black lines are the bias value, and the blue shaded regions indicate the standard deviation (σ). The included table quantifies the retrieval performance from 300 to 1000 hPa for every 100 hPa. The number in parentheses means the number of all converged cases out of all cloudy-sky cases. G16 means GOES-16 products, and L + I indicates liquid and ice clouds.
Table 3Column bias and standard deviation of retrieved water vapor mixing ratio in cloudy skies when compared to IGRA radiosonde observations. Statistics are evaluated based on all 51 converged cloudy-sky cases for TEMPEST+ABI sensor configurations and 77 cloudy-sky cases using TEMPEST and TEMPEST+ABI_3W channels.
Additional cloud information in the form of cloud fraction, cloud height, and cloud phase from GOES-16 products is shown in Fig. 12g–i. When retrievals use more cloud information from GOES-16 (cloud fraction, height, and phase), water vapor retrieval biases shown in Fig. 12h are about half of the biases in Fig. 12b and e around 600 hPa; those shown in Fig. 12i are improved above 700 hPa except for around 600 hPa compared with Fig. 12c and f, but retrievals have no or minor improvements above 700 hPa in Fig. 12g compared with Fig. 12a and d. Water vapor retrievals around lower layers in Fig. 12g–i show larger biases and little difference when using only TEMPEST, TEMPEST+ABI_3W, or TEMPEST+ABI. In cloudy conditions, the only channels with sensitivity to the low-level water vapor are the TEMPEST 87 and 164 GHz channels, as shown in Fig. 3d. However, some overfitting appears to be taking place between 700 and 1000 hPa. The authors speculate that the ice-scattering properties assumed in the retrieval's forward model may cause excess depression at the 87 and 164 GHz channels, which in turn requires the algorithm to increase the cloud water and water vapor to match the brightness temperatures in those channels. Meanwhile, since MW and IR have different sensitivity to the clouds, the cloud properties obtained from ABI cloud products that are derived from Vis–IR bands (Goodman et al., 2019) may not be representative of more cloud-transparent MW channels, adding more uncertainties to retrievals.
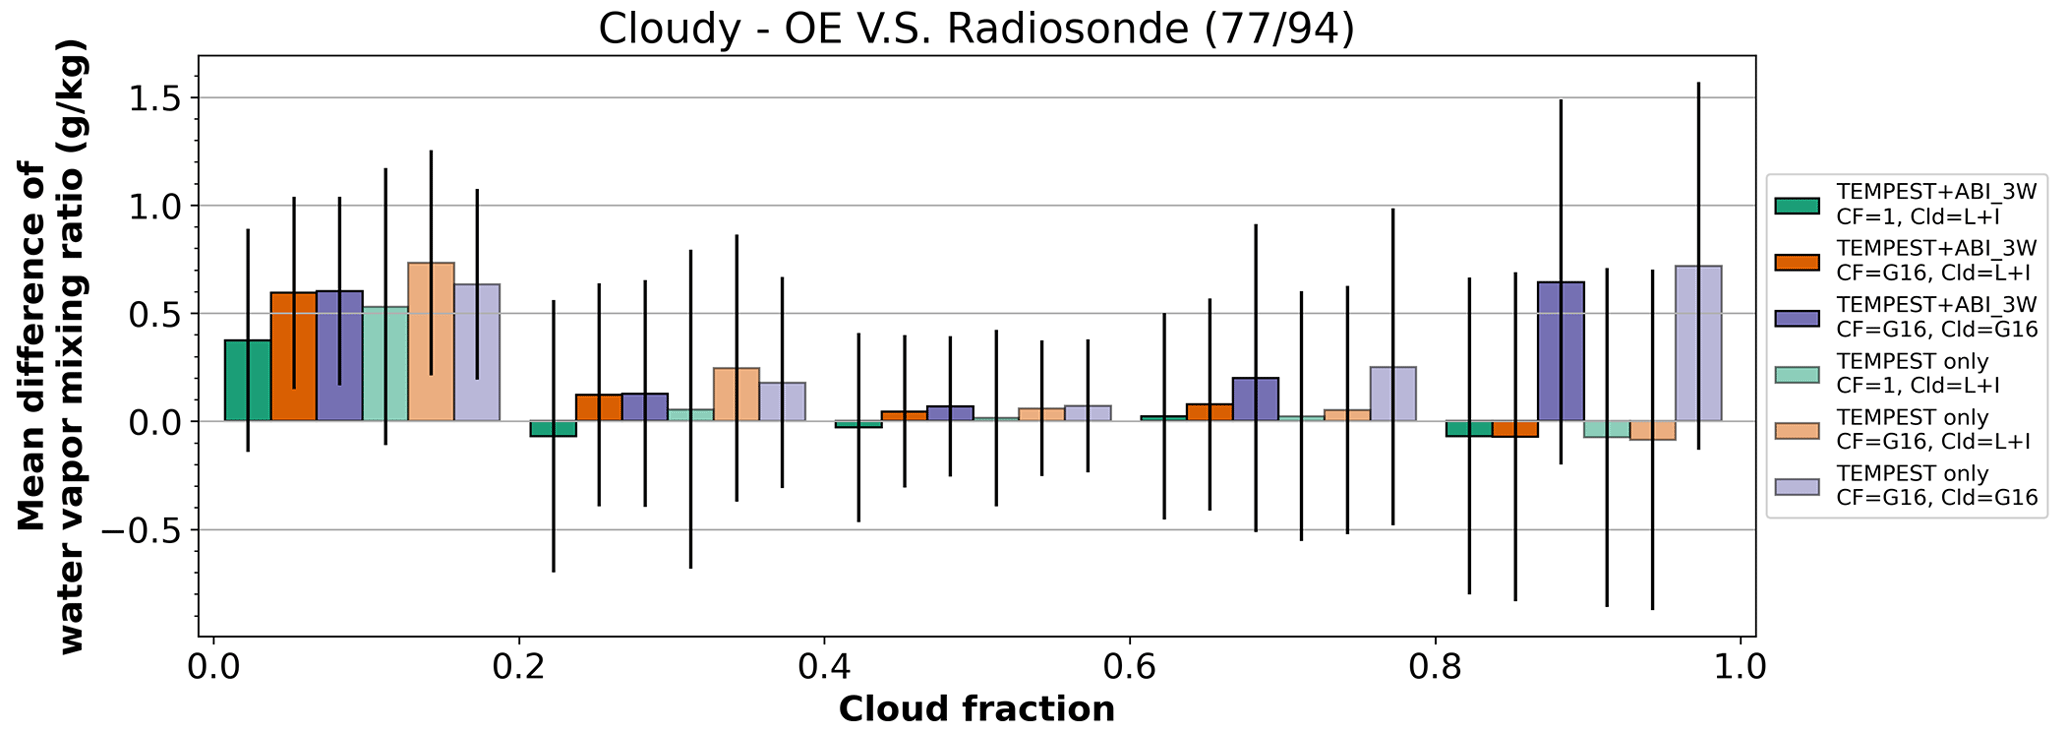
Figure 13The mean difference between retrieved and radiosonde-observed water vapor profiles (retrievals minus IGRA) within different GOES-16 cloud fraction intervals. Assuming both liquid and ice clouds exist, the green bars indicate that retrievals use a cloud fraction of 1, and the orange bars mean that retrievals use only the cloud fraction from GOES-16 products. The purple bars show retrievals using cloud fraction, height, and phase from GOES-16 products. Lighter colors mean retrievals only use TEMPEST-D, and darker colors show retrievals using both TEMPEST-D and three GOES-16 ABI water vapor channels. Solid black lines are the range ±standard deviation. The number in parentheses means the number of all converged cases among all cloudy-sky cases. G16 means GOES-16 products, and L + I indicates liquid and ice clouds.
The water vapor retrieval errors are further decomposed by cloud fraction from GOES-16, shown in Fig. 13, using various retrieval configurations shown in Table 1 under cloudy conditions. Since not enough retrievals are obtained by TEMPEST+ABI configurations, Fig. 13 only presents errors from retrievals using TEMPEST+ABI_3W and TEMPEST-only sensors. Among six retrieval settings, the estimated water vapor profiles are nearly unbiased when the cloud fraction is between 0.4 and 0.6 with about 0.5 g kg−1 of error standard deviation, as these quantities of clouds provide enough signals and do not entirely obscure signals underneath. For low cloud fractions, assigning the cloud fraction from GOES-16 ABI leads to a bias, although the standard deviation is roughly the same as if a cloud fraction of 1 is assigned. This can be attributed to the nonlinear response of the MW radiances at 87 and 164 GHz to cloud water content. When the assigned cloud fraction is small, the retrieval must assign all the necessary cloud liquid water to a small cloud fraction, saturating the radiance signals and generally causing poorer retrievals. As was seen in the synthetic retrievals, saturation will cause the cloud water to be underestimated, which will in turn lead to an overestimation in water vapor as the OE tries to balance all radiance terms. If the scene is truly overcast (observed cloud fraction near 1.0), there can be no difference in assigning a cloud fraction of 1.0 as the default assumption or 1.0 as an observed parameter, and this is reflected in the results as well.
TEMPEST-D successfully demonstrated the capability of CubeSats radiometers to maintain well-calibrated MW signals in five channels from 87 to 181 GHz over a period of almost 3 years. Although TEMPEST-D and the TEMPEST instrument currently flying with COWVR on the International Space Station are economical and functional, these small MW radiometers fly without an accompanying hyperspectral IR sensor typical on operational platforms. GOES-R ABI sensors provide observations of the Earth every 1 to 10 min depending on the modes and measure 16 spectral bands from Vis to IR with 0.5 to 2.0 km ground resolution. Given such unique ABI observations with high spatial and temporal resolution, supplemental information from ABI enhances the ability of TEMPEST as well as other similar CubeSats to infer the states of the atmosphere.
Along with five TEMPEST MW bands, this study presented improvements in humidity profiles that are possible when TEMPEST retrievals are supplemented with three IR water-vapor-sounding channels and five IR window and CO2 bands available from GOES ABI. A number of positive outcomes were shown in this paper. In the sensitivity tests comparing the combined MW–IR retrievals to MW-only capabilities, the effective vertical resolution increases, as seen by smaller layer errors, under both clear and cloudy conditions. The retrieved water vapor profiles were validated using independent IGRA humidity sounding data from 2019 to 2020. During these 2 years of routine TEMPEST-D operations, only 104 IGRA cases (10 cases are clear scenes, with 94 under different cloudy conditions) exist. Consistent with the sensitivity tests, the validation also showed the advantages of using GOES-16 cloud products and additional ABI IR channels in water vapor sounding under different sky conditions.
In clear-sky regions, with ABI's ability to unambiguously characterize these scenes as cloud-free, retrievals are improved merely by forcing the scene to be cloud-free and by gaining more information around the lower part of the atmosphere from ABI window and CO2 bands. While statistics in Figs. 10 and 11 indicate that column-average biases grow slightly when the ABI cloud mask is used to identify the scene as cloud-free, the profiles themselves show clear improvement above the boundary layer. Near the surface, retrievals are sensitive to the large biases in the prior data in these comparisons, and it is difficult to draw conclusions. Nonetheless, adding three ABI channels slightly decreased overall biases from 0.510 to 0.501 g kg−1, and biases are further reduced to 0.476 g kg−1 using five extra ABI window and CO2 channels with about the same error standard deviation of 1 g kg−1.
Under cloudy conditions, water vapor retrievals have different degrees of improvements when adding ABI, as shown in Figs. 12 and 13, and results are generally improved when cloud fraction information is added to the retrieval, except for very small cloud fractions where saturation in the cloudy portion of the footprint becomes an issue. Adding cloud-top and cloud-phase information causes errors larger than 0.5 g kg−1. This is likely due to incorrect assumptions about the ice cloud scattering properties.
This study explored the advantages of merging TEMPEST-D with ABI observations from GOES-16 to improve water vapor soundings. However, ABI-like sensors, whether on the Himawari series satellites (Bessho et al., 2016) or other platforms, cover the entire globe, providing multi-spectral, high-spatial-resolution, and high-temporal-resolution observations. While we can only speculate, we assume that hyperspectral IR (Li et al., 2022) planned for the next generation of geostationary satellites will significantly improve the sounding capabilities in clear-sky regions. This should lead to better overall retrievals in cloudy skies as well if one can extrapolate results from Figs. 6 and 7, which show improvements to the passive MW retrievals when more information is added to the retrievals. With more and more CubeSats being launched, including COWVR and TEMPEST on Space Test Program-Houston 8 (https://podaac.jpl.nasa.gov/COWVR-TEMPEST 10 September 2024), TROPICS (Blackwell et al., 2018; https://tropics.ll.mit.edu/CMS/tropics 10 September 2024), and the INvestigation of Convective UpdraftS (INCUS; van den Heever et al., 2022; https://incus.colostate.edu 10 September 2024), these missions will all benefit from more sounding and cloud information from ABI-like sensors or even from geostationary hyperspectral IR sensors, enhancing the capability of CubeSats.
CRTM (Liu et al., 2012; Johnson et al., 2023) is available through the website https://github.com/JCSDA/crtm (last access: 10 September 2024). MonoRTM (Clough et al., 2005) can be assessed at the website https://github.com/AER-RC/monoRTM (last access: 10 September 2024).
The TEMPEST-D datasets can be downloaded through the website https://tempest.colostate.edu (Colorado State University, 2024) after registration. The GOES-16 products are archived at CLASS (https://www.aev.class.noaa.gov, National Oceanic and Atmospheric Administration, 2024). The IGRA dataset is available at https://www.ncei.noaa.gov/products/weather-balloon/integrated-global-radiosonde-archive (National Centers for Environmental Information, 2024). The ERA5 dataset can be accessed from the website https://www.ecmwf.int/en/forecasts/dataset/ecmwf-reanalysis-v5 (Copernicus Climate Change Service, 2024).
CPK and CK designed and improved the experiments. CPK is responsible for collecting and processing data. CPK prepared the manuscript. CPK and CK discussed the results and revised the manuscript.
The contact author has declared that neither of the authors has any competing interests.
Publisher's note: Copernicus Publications remains neutral with regard to jurisdictional claims made in the text, published maps, institutional affiliations, or any other geographical representation in this paper. While Copernicus Publications makes every effort to include appropriate place names, the final responsibility lies with the authors.
This study was supported by NASA grant no. 80NM0078F0617 as part of an effort to improve water vapor soundings from the TEMPEST CubeSat radiometer on Space Test Program-Houston 8. The authors appreciate the reviewers' thorough comments, which greatly improved the paper.
This research has been supported by the National Aeronautics and Space Administration (grant no. 80NM0078F0617).
This paper was edited by Joanna Joiner and reviewed by two anonymous referees.
Aires, F.: Measure and exploitation of multisensor and multiwavelength synergy for remote sensing: 1. Theoretical considerations, J. Geophys. Res., 116, D02301, https://doi.org/10.1029/2010JD014701, 2011.
Aires, F., Paul, M., Prigent, C., Rommen, B., and Bouvet, M.: Measure and exploitation of multisensor and multiwavelength synergy for remote sensing: 2. Application to the retrieval of atmospheric temperature and water vapor from MetOp, J. Geophys. Res., 116, D02302, https://doi.org/10.1029/2010JD014702, 2011.
Aires, F., Aznay, O., Prigent, C., Paul, M., and Bernardo, F.: Synergistic multi-wavelength remote sensing versus a posteriori combination of retrieved products: Application for the retrieval of atmospheric profiles using MetOp-A, J. Geophys. Res., 117, D18304, https://doi.org/10.1029/2011JD017188, 2012.
Berg, W., Brown, S. T., Lim, B. H., Reising, S. C., Goncharenko, Y., Kummerow, C. D., Gaier, T. C., and Padmanabhan, S.: Calibration and validation of the TEMPEST-D CubeSat radiometer, IEEE T. Geosci. Remote, 59, 4904–4914, https://doi.org/10.1109/TGRS.2020.3018999, 2021.
Bessho, K., Date, K., Hayashi, M., Ikeda, A., Imai, T., Inoue, H., Kumagai, Y., Miyakawa, T., Murata, H., Ohno, T., Okuyama, A., Oyama, R., Sasaki, Y., Shimazu, Y., Shimoji, K., Sumida, Y., Suzuki, M., Taniguchi, H., Tsuchiyama, H., Uesawa, D., Yokota, H., and Yoshida, R.: An introduction to Himawari-8/9 – Japan's new-generation geostationary meteorological satellites, J. Meteorol. Soc. Jpn., 94, 151–183, https://doi.org/10.2151/jmsj.2016-009, 2016.
Blackwell, W. J., Braun, S., Bennartz, R., Velden, C., DeMaria, M., Atlas, R., Dunion, J., Marks, F., Rogers, R., Annane, B., and Leslie, R. V.: An overview of the TROPICS NASA Earth Venture Mission, Q. J. Roy. Meteor. Soc., 144, 16–26, https://doi.org/10.1002/qj.3290, 2018.
Bohren, C. F. and Huffman, D. R.: Absorption and Scattering of Light by Small Particles, Wiley, New York, 530 pp., https://doi.org/10.1002/9783527618156, 1998.
Boukabara, S.-A., Garrett, K., Chen, W., Iturbide-Sanchez, F., Grassotti, C., Kongoli, C., Chen, R., Liu, Q., Yan, B., Weng, F., Ferraro, R., Kleespies, T. J., and Meng, H.: MiRS: An all-weather 1DVAR satellite data assimilation and retrieval system, IEEE T. Geosci. Remote, 49, 3249–3272, https://doi.org/10.1109/TGRS.2011.2158438, 2011.
Boukabara, S.-A., Garrett, K., Grassotti, C., Iturbide-Sanchez, F., Chen, W., Jiang, Z., Clough, S. A., Zhan, X., Liang, P., Liu, Q., Islam, T., Zubko, V., and Mims, A.: A physical approach for a simultaneous retrieval of sounding, surface, hydrometeor, and cryospheric parameters from SNPP/ATMS, J. Geophys. Res.-Atmos., 118, 12600–12619, https://doi.org/10.1002/2013JD020448, 2013.
Boukabara, S.-A., Garrett, K., and Grassotti, C.: Dynamic inversion of global surface microwave emissivity using a 1DVAR approach, Remote Sens.-Basel, 10, 679, https://doi.org/10.3390/rs10050679, 2018.
Brown, S. T., Tanner, A., Reising, S. C., and Berg, W.: Single-point calibration for microwave sounders: Application to TEMPEST-D, J. Atmos. Ocean. Tech., 40, 669–676, https://doi.org/10.1175/JTECH-D-22-0063.1, 2023.
Clough, S. A., Shephard, M. W., Mlawer, E. J., Delamere, J. S., Iacono, M. J., Cady-Pereira, K., Boukabara, S., and Brown, P. D.: Atmospheric radiative transfer modeling: A summary of the AER codes, J. Quant. Spectrosc. Ra., 91, 233–244, https://doi.org/10.1016/j.jqsrt.2004.05.058, 2005 (code available at: https://github.com/AER-RC/monoRTM, last access: 10 September 2024).
Colorado State University: Temporal Experiment for Storms and Tropical Systems (TEMPEST), https://tempest.colostate.edu, last access: 10 September 2024.
Copernicus Climate Change Service (C3S): ECMWF Reanalysis v5 (ERA5), https://www.ecmwf.int/en/forecasts/dataset/ecmwf-reanalysis-v5, last access: 10 September 2024.
Draine, B. T. and Flatau, P. J.: Discrete-dipole approximation for scattering calculations, J. Opt. Soc. Am. A, 11, 1491, https://doi.org/10.1364/JOSAA.11.001491, 1994.
Duncan, D. I. and Kummerow, C. D.: A 1DVAR retrieval applied to GMI: Algorithm description, validation, and sensitivities, J. Geophys. Res.-Atmos., 121, 7415–7429, https://doi.org/10.1002/2016JD024808, 2016.
Elsaesser, G. S. and Kummerow, C. D.: Toward a fully parametric retrieval of the nonraining parameters over the global oceans, J. Appl. Meteorol. Clim., 47, 1599–1618, https://doi.org/10.1175/2007JAMC1712.1, 2008.
Field, P. R., Heymsfield, A. J., and Bansemer, A.: Snow size distribution parameterization for midlatitude and tropical ice clouds, J. Atmos. Sci., 64, 4346–4365, https://doi.org/10.1175/2007JAS2344.1, 2007.
Gambacorta, A., Barnet, C., Wolf, W., Goldberg, M., King, T., Ziong, X., Nalli, N., Maddy, E., and Divakarla, M.: The NOAA Unique CrIS/ATMS Processing System (NUCAPS): First light retrieval results, in: Proceedings of the ITWG meeting, ITWG, Toulouse, France, 20 March 2012.
GOES-R Series: Mission Requirements Document (MRD) 28 July 2022, GOES-R Program/Code 410, 2022.
Goodman, S. J., Schmit, T. J., Daniels, J., and Redmon, R. J. (Eds.): The GOES-R Series: A New Generation of Geostationary Environmental Satellites, Elsevier, https://doi.org/10.1016/C2015-0-06249-9, 2019.
Hersbach, H., Bell, B., Berrisford, P., Hirahara, S., Horányi, A., Muñoz-Sabater, J., Nicolas, J., Peubey, C., Radu, R., Schepers, D., Simmons, A., Soci, C., Abdalla, S., Abellan, X., Balsamo, G., Bechtold, P., Biavati, G., Bidlot, J., Bonavita, M., Chiara, G., Dahlgren, P., Dee, D., Diamantakis, M., Dragani, R., Flemming, J., Forbes, R., Fuentes, M., Geer, A., Haimberger, L., Healy, S., Hogan, R. J., Hólm, E., Janisková, M., Keeley, S., Laloyaux, P., Lopez, P., Lupu, C., Radnoti, G., Rosnay, P., Rozum, I., Vamborg, F., Villaume, S., and Thépaut, J.: The ERA5 global reanalysis, Q. J. Roy. Meteor. Soc., 146, 1999–2049, https://doi.org/10.1002/qj.3803, 2020.
Johnson, B. T., Dang, C., Stegmann, P., Liu, Q., Moradi, I., and Auligne, T.: The Community Radiative Transfer Model (CRTM): Community-focused collaborative model development accelerating research to operations, B. Am. Meteorol. Soc., 104, E1817–E1830, https://doi.org/10.1175/BAMS-D-22-0015.1, 2023 (code available at: https://github.com/JCSDA/crtm, last access: 10 September 2024).
Kazumori, M. and English, S. J.: Use of the ocean surface wind direction signal in microwave radiance assimilation, Q. J. Roy. Meteor. Soc., 141, 1354–1375, https://doi.org/10.1002/qj.2445, 2015.
Kulie, M. S., Bennartz, R., Greenwald, T. J., Chen, Y., and Weng, F.: Uncertainties in microwave properties of frozen precipitation: Implications for remote sensing and data assimilation, J. Atmos. Sci., 67, 3471–3487, https://doi.org/10.1175/2010JAS3520.1, 2010.
Li, J., Schmit, T. J., Jin, X., Martin, G., and Li, Z.: GOES-R Advanced Baseline Imager (ABI) Algorithm Theoretical Basis Document for Legacy Atmospheric Moisture Profile, Legacy Atmospheric Temperature Profile, Total Precipitable Water, and Derived Atmospheric Stability Indices, Version 3.1, NOAA NESDIS, Center for Satellite Applications and Research, 2019.
Li, J., Menzel, W. P., Schmit, T. J., and Schmetz, J.: Applications of geostationary hyperspectral infrared sounder observations: Progress, challenges, and future perspectives, B. Am. Meteorol. Soc., 103, E2733–E2755, https://doi.org/10.1175/BAMS-D-21-0328.1, 2022.
Liu, G.: A database of microwave single-scattering properties for nonspherical ice particles, B. Am. Meteorol. Soc., 89, 1563–1570, https://doi.org/10.1175/2008BAMS2486.1, 2008.
Liu, Q., van Delst, P., Chen, Y., Groff, D., Han, Y., Collard, A., Weng, F., Boukabara, S.-A., and Derber, J.: Community Radiative Transfer Model for radiance assimilation and applications, in: IGARSS 2012 – 2012 IEEE International Geoscience and Remote Sensing Symposium, Munich, Germany, 22–27 July 2012, https://doi.org/10.1109/IGARSS.2012.6350612, 3700–3703, 2012 (code available at: https://github.com/JCSDA/crtm, last access: 10 September 2024).
Ma, Z., Li, Z., Li, J., Schmit, T. J., Cucurull, L., Atlas, R., and Sun, B.: Enhance low level temperature and moisture profiles through combining NUCAPS, ABI observations, and RTMA analysis, Earth Space Sci., 8, e2020EA001402, https://doi.org/10.1029/2020EA001402, 2021.
Milstein, A. B. and Blackwell, W. J.: Neural network temperature and moisture retrieval algorithm validation for AIRS/AMSU and CrIS/ATMS, J. Geophys. Res.-Atmos., 121, 1414–1430, https://doi.org/10.1002/2015JD024008, 2016.
National Centers for Environmental Information (NCEI): IGRA, https://www.ncei.noaa.gov/products/weather-balloon/integrated- global-radiosonde-archive, last access: 10 September 2024.
National Oceanic and Atmospheric Administration (NOAA): GOES-16 products, Comprehensive Large Array-data Stewardship System (CLASS), https://www.aev.class.noaa.gov, last access: 10 September 2024.
Nowell, H., Liu, G., and Honeyager, R.: Modeling the microwave single-scattering properties of aggregate snowflakes, J. Geophys. Res.-Atmos., 118, 7873–7885, https://doi.org/10.1002/jgrd.50620, 2013.
Padmanabhan, S., Gaier, T. C., Tanner, A. B., Brown, S. T., Lim, B. H., Reising, S. C., Stachnik, R., Bendig, R., and Cofield, R.: TEMPEST-D radiometer: Instrument description and prelaunch calibration, IEEE T. Geosci. Remote, 59, 10213–10226, https://doi.org/10.1109/TGRS.2020.3041455, 2021.
Radhakrishnan, C., Chandrasekar, V., Reising, S. C., and Berg, W.: Rainfall estimation from TEMPEST-D CubeSat observations: A machine-learning approach, IEEE J. Sel. Top. Appl., 15, 3626–3636, https://doi.org/10.1109/JSTARS.2022.3170835, 2022.
Reising, S. C., Gaier, T. C., Padmanabhan, S., Lim, B. H., Heneghan, C., Kummerow, C. D., Berg, W., Chandrasekar, V., Radhakrishnan, C., Brown, S. T., Carvo, J., and Pallas, M.: An earth venture in-space Technology Demonstration Mission for Temporal Experiment for Storms and Tropical Systems (TEMPEST), in: IGARSS 2018 – 2018 IEEE International Geoscience and Remote Sensing Symposium, Valencia, 22–27 July 2018, https://doi.org/10.1109/IGARSS.2018.8517330, 6301–6303, 2018.
Ringerud, S., Kulie, M. S., Randel, D. L., Skofronick-Jackson, G. M., and Kummerow, C. D.: Effects of ice particle representation on passive microwave precipitation retrieval in a Bayesian scheme, IEEE T. Geosci. Remote, 57, 3619–3632, https://doi.org/10.1109/TGRS.2018.2886063, 2019.
Rodgers, C. D.: Inverse Methods for Atmospheric Sounding: Theory and Practice, World Scientific, Singapore; River Edge, NJ, 256 pp., https://doi.org/10.1142/3171, 2000.
Schmit, T. J., Li, J., Gurka, J. J., Goldberg, M. D., Schrab, K. J., Li, J., and Feltz, W. F.: The GOES-R Advanced Baseline Imager and the continuation of current sounder products, J. Appl. Meteorol. Clim., 47, 2696–2711, https://doi.org/10.1175/2008JAMC1858.1, 2008.
Schulte, R. M. and Kummerow, C. D.: An optimal estimation retrieval algorithm for microwave humidity sounding channels with minimal scan position bias, J. Atmos. Ocean. Tech., 36, 409–425, https://doi.org/10.1175/JTECH-D-18-0133.1, 2019.
Schulte, R. M., Kummerow, C. D., Berg, W., Reising, S. C., Brown, S. T., Gaier, T. C., Lim, B. H., and Padmanabhan, S.: A passive microwave retrieval algorithm with minimal view-angle bias: Application to the TEMPEST-D CubeSat mission, J. Atmos. Ocean. Tech., 37, 197–210, https://doi.org/10.1175/JTECH-D-19-0163.1, 2020.
Siddans, R.: Water Vapour Climate Change Initiative (WV_cci) – Phase One, Deliverable 2.2; Version 1.0, RAL Space Remote Sensing Group-Technical Report, 2019.
Siddans, R., Gerber, D., and Miles, G.: Optimal Estimation Method retrievals with IASI, AMSU and MHS measurements: Final Report, RAL Space Remote Sensing Group-Technical Report, https://doi.org/10.5281/zenodo.7357125, 2015.
Sun, B., Reale, A., Tilley, F. H., Pettey, M. E., Nalli, N. R., and Barnet, C. D.: Assessment of NUCAPS S-NPP CrIS/ATMS sounding products using reference and conventional radiosonde observations, IEEE J. Sel. Top. Appl., 10, 2499–2509, https://doi.org/10.1109/JSTARS.2017.2670504, 2017.
Trent, T., Siddans, R., Kerridge, B., Schröder, M., Scott, N. A., and Remedios, J.: Evaluation of tropospheric water vapour and temperature profiles retrieved from MetOp-A by the Infrared and Microwave Sounding scheme, Atmos. Meas. Tech., 16, 1503–1526, https://doi.org/10.5194/amt-16-1503-2023, 2023.
van de Hulst, H. C.: Light Scattering by Small Particles, Wiley, New York, 470 pp., 1957.
van den Heever, S., Haddad, Z., Tanelli, S., Stephens, G., Posselt, D., Kim, Y., Brown, S., Braun, S., Grant, L., Kollias, P., Luo, Z. J., Mace, G., Marinescu, P., Padmanabhan, S., Partain, P., Petersent, W., Prasanth, S., Rasmussen, K., Reising, S., and Schumacher, C. and the INCUS Mission team: The INCUS Mission, EGU General Assembly 2022, Vienna, Austria, 23–27 May 2022, EGU22-9021, https://doi.org/10.5194/egusphere-egu22-9021, 2022.
Yang, P., Hioki, S., Saito, M., Kuo, C.-P., Baum, B., and Liou, K.-N.: A Review of Ice Cloud Optical Property Models for Passive Satellite Remote Sensing, Atmosphere, 9, 499–499, https://doi.org/10.3390/atmos9120499, 2018.
Yi, B., Ding, S., and Bi, L.: Impacts of cloud scattering properties on FY-3D HIRAS simulations, J. Quant. Spectrosc. Ra., 246, 106902, https://doi.org/10.1016/j.jqsrt.2020.106902, 2020.