the Creative Commons Attribution 4.0 License.
the Creative Commons Attribution 4.0 License.
 | 08 Oct 2024
A portable nitrogen dioxide instrument using cavity-enhanced absorption spectroscopy
Steven A. Bailey
Reem A. Hannun
Andrew K. Swanson
Thomas F. Hanisco
The Portable (2.7 kg) Cavity-enhanced Absorption of Nitrogen Dioxide (PCAND) instrument for measuring in situ nitrogen dioxide (NO2) was developed using incoherent broadband cavity-enhanced absorption spectroscopy (IBBCEAS). An LED light source centered at 408 nm was coupled to a cavity 15 cm in length, achieving an effective optical pathlength of ∼520 m. Precision was measured as 94 pptv (1 s). To date, we have flown this instrument on three balloon test flights. This instrument records data on an SD card and outputs data (via an RS232 port) to external devices including a commercial radiosonde (iMet) for real-time data downlink.
- Article
(4397 KB) - Full-text XML
- BibTeX
- EndNote


Nitrogen dioxide (NO2) is a major contributor to air pollution in the Earth's troposphere. Its main source is as a byproduct of combustion from the burning of fossil fuels (Spinei et al., 2014). NO2 has been monitored from satellite instruments (like OMI, TROPOMI, and GEMS) for a decade (Miyazaki et al., 2017; Duncan et al., 2016; Martin et al., 2003; Cooper et al., 2020b), providing a global understanding of emissions and air quality. However, satellite retrievals of total-column NO2 rely on estimates of the vertical distribution of NO2 based on models or climatology (Cersosimo et al., 2020). These a priori estimates are a major source of uncertainty in making retrievals of NO2 columns from satellite measurements (Cooper et al., 2020a; Dang et al., 2023).
Direct measurement of the vertical profile can verify and improve these a priori estimates. Aircraft instruments cannot typically make a continuous vertical profile of the atmospheric column. Therefore, an instrument with adequate precision that is small enough to fly on a balloon is needed. Typical concentrations of NO2 range from a part per billion by volume (ppbv) in clean environments to several tens of ppbv in polluted environments. A typical balloon ascent rate is 5 m s−1, so a time response on the order of 10 s would give a 50 m resolution. An instrument sensitivity of less than a ppbv in 1 s integration is adequate to resolve the vertical distribution of NO2 in a clean environment.
Existing compact sensors do not meet our requirements. Electrochemical sensors are widely used in low-cost sensor networks. These sensors meet the size and weight requirements to fly on a balloon, but they do not have the precision and accuracy needed for determining the vertical profile of NO2. In addition, these electrochemical sensors do not have a fast time response and are not well-suited to changing environments (Kim et al., 2022). Previously, a small NO2 instrument was developed by the Royal Netherlands Meteorological Institute (Dutch: Koninklijk Nederlands Meteorologisch Instituut, KNMI) (Sluis et al., 2010). That instrument uses chemiluminescence in a liquid solution to measure NO2, with a reported precision of 7.7 ppbv s−1. Although this chemiluminescence instrument fits our size and weight criteria, it requires a lengthy calibration procedure before every flight, and it does not have adequate sensitivity for our purposes.
Techniques for measuring in situ NO2 with high precision in the atmosphere include laser-induced fluorescence (LIF) (Thornton et al., 2000); optical absorption methods, like incoherent broadband cavity-enhanced absorption spectroscopy (IBBCEAS; Womack et al., 2022; Min et al., 2016); and chemical techniques, like chemiluminescence (Ryerson et al., 2000). Although all these techniques have their pros and cons for use, we chose to focus on optical absorption methods for several reasons. First, we have successful experience using IBBCEAS in a previous ozone (O3)-based instrument (Hannun et al., 2020). Second, stability and ease of calibration are desirable, which we found to be the case with the O3 instrument. Third, this technique (IBBCEAS) can be scaled to a small enough size and weight to fly (via balloon) into the free troposphere. An instrument using LIF to measure NO2 would (in our experience) not be suitable for our purposes. Its size and weight would be too great to work with a small weather balloon, despite LIF having greater sensitivity than IBBCEAS.
A description of the Portable (2.7 kg) Cavity-enhanced Absorption of Nitrogen Dioxide (PCAND) instrument follows. Performance metrics will show that PCAND meets the uncontrolled, maximum allowable weight (∼2.7 kg) set by the Federal Aviation Administration (FAA) for a balloon payload. In addition, PCAND sensitivity to NO2 exceeds that of the KNMI sonde by more than an order of magnitude. A description of the PCAND calibration procedure is detailed, showing its simplicity. An atmospheric vertical profile measurement from one of our balloon flights is shown. Finally, a ground-based validation of PCAND with another established NO2 instrument is made.
IBBCEAS is an established technique for the detection of trace gases (Fiedler et al., 2003; Ball et al., 2004; Washenfelder et al., 2008) including NO2 (Min et al., 2016). PCAND uses an LED as the incoherent broadband light source centered at 408 nm. This is coupled to an optical cavity with highly reflective mirrors on either end. IBBCEAS leverages the mirror reflectivity to turn a physically short path length (15 cm) of the cavity into an effective optical pathlength of ∼520 m. This effective pathlength increases the probability of NO2 absorption in the cavity, thereby increasing the sensitivity (94 pptv @ 1 s) of the instrument.
Shown in Fig. 1, output from an LED is collimated into the gas sample cell (cavity) where it first passes through the leftmost mirror. Both mirrors have highly reflective coatings (99.97 %) on curved surfaces (r=250 mm) facing towards each other. Only a small fraction of light enters the cell, but the light (photons) bounces back and forth between both mirrors thousands of times on average before exiting the rightmost mirror. Photons that exit are then detected by a silicon photomultiplier (SiPM). A transconductance amplifier is then used to convert small amounts of current from the SiPM into measurable voltage levels. A microcontroller with a 12-bit analog to digital convertor digitizes this voltage. The microcontroller is both a data acquisition system and a controller of the LED and three-way valve. A digital lock-in scheme is used to remove background light by modulating the LED at 100 Hz with a large duty cycle (70 %).
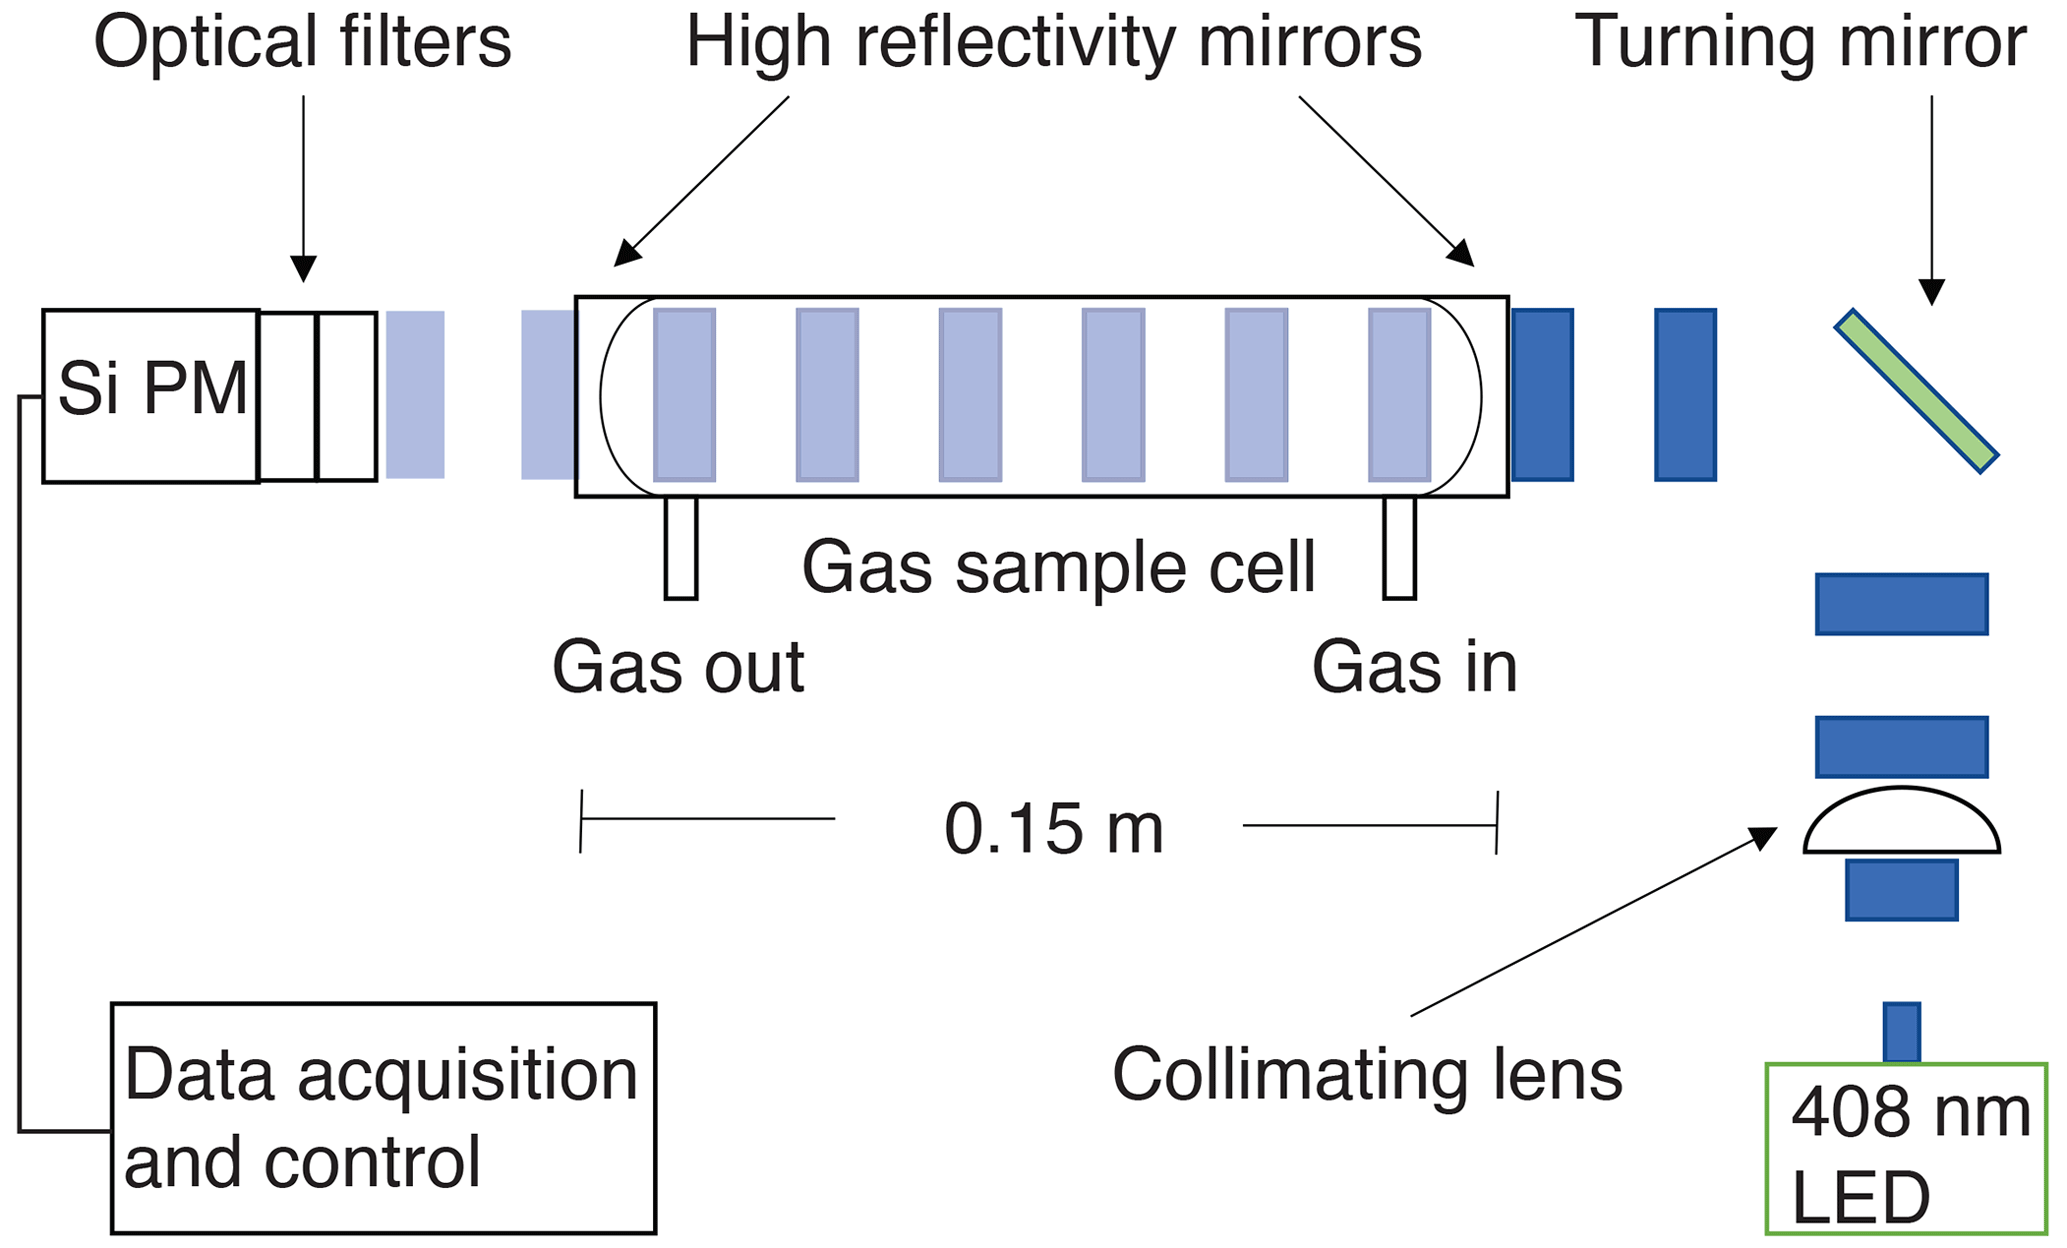
Figure 1Incoherent broadband cavity-enhanced detection technique for NO2. An LED at 408 nm is collimated and coupled into the detection cell via high-reflectivity mirrors (R=99.97 %), creating a long optical pathlength. The light attenuated by the sample is then detected using a silicon photomultiplier (SiPM).
Trace gas absorption (using IBBCEAS) is a measurement of light attenuation. As light is absorbed and scattered (via Rayleigh), an attenuation of light is seen at the SiPM. The Beer–Lambert absorption coefficient, αabs, is directly related to the light intensity exiting the cavity (Washenfelder et al., 2008; Hannun et al., 2020) through the following equations:
Here, I0 is the intensity of light in the absence of any absorbing molecules, I is the intensity of light including absorbing molecules, R is the mirror reflectivity, d is the physical distance between cavity mirrors, and αRay is the extinction due to Rayleigh scatter. The term is the theoretical cavity loss, αcav. Leff represents the maximum effective pathlength. In the case of mirrors with R=99.97 %, the maximum theoretical Leff for our 15 cm cell would be 450 m.
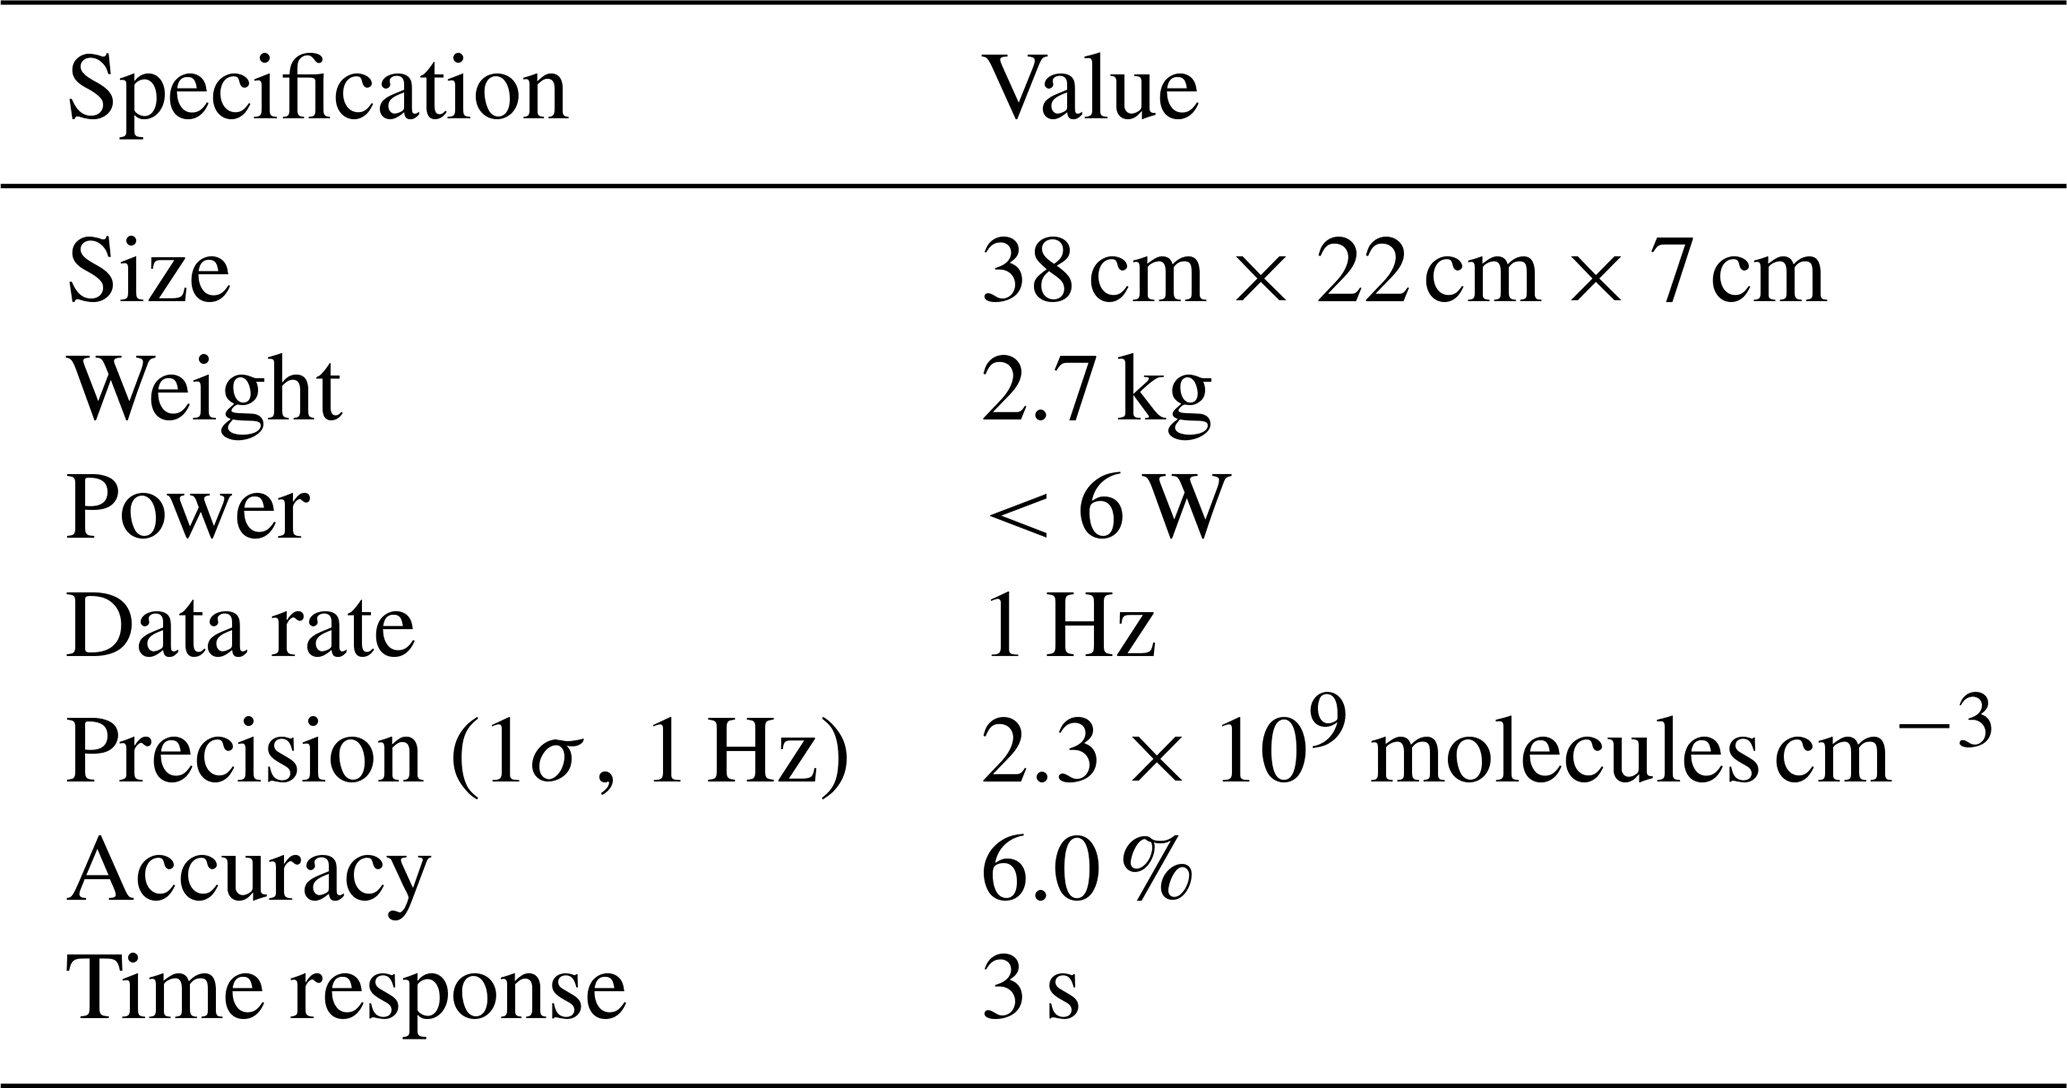
PCAND is housed in a small aluminum box measuring 38 cm length × 22 cm width × 7 cm height, with a total weight of 2.7 kg. Inside the box (Fig. 2) is an optical plate where all the instrument components are mounted. Power comes from an 11.1 V lithium ion rechargeable battery with 2200 mAh (24 W) of storage. Table 1 summarizes the PCAND design and performance characteristics.

Figure 2A top view of the NO2 instrument. Major components include the optical plate, which consists of the LED assembly, the light shield, the turning mirror (under the light shield), the optical cell, end mirrors, the collimating lens, and the SiPM detector, and the electronics motherboard with a detector preamp, a heater controller, a pressure sensor, a balloon release circuit, and a data acquisition system (CPU). Not shown is the Nafion tubing used to dry the air before it enters the instrument.
3.1 Optical components
3.1.1 LED assembly
A UV LED (λmax=408 nm, full width at half maximum (FWHM) =30 nm) (Thorlabs M310D1) is mounted to a custom heat sink and temperature controlled to 25 °C with a thermo-electric cooler controller (Thorlabs MTD415T). A constant current to the LED is supplied by a low-noise controller (Thorlabs MLD203CLN). The LED assembly includes a 15 mm focal length collimating lens (Thorlabs LA1074-A) followed by a turning mirror (Thorlabs PF10-03-F01) to direct light into the sample cell.
3.1.2 Sample cell
The sample cell is manufactured from an aluminum alloy tube measuring 15 cm in length with a 1.4 cm inner diameter. The cell mirrors (Layertec 103654) have a reflectivity of R=99.97 % over the detected spectral range (Fig. 3) and a 250 mm radius of curvature. Mirrors are held to the cell ends with bezel mounts on flanges with face seal o-ring glands. Although the mounts themselves are non-adjustable, they are fabricated to hold the mirrors in a way that maximizes their centricity to the cell ends. Furthermore, the incoherent light source negates the need for rigid mirror alignment. A pressure transducer (Honeywell ASDXACX015PAAA5) measures the cell pressure from a port near the cell inlet.

Figure 3Normalized LED spectral response × NO2 cross-section vs. mirror reflectivity (99.97 % @ 408 nm). The LED (λmax=408 nm, FWHM=30 nm) response was measured using a grating spectrometer with the instrument SiPM and associated detector optics. The absorption cross-section of NO2 (for this instrument) is the integration of the above product (with a resolution of 0.0005 nm), which yields cm2 per molecule.
3.1.3 SiPM assembly
Following its exit from the sample cell, light enters an optical bandpass filter (Semrock FF01-405/10-25), and then a lens (Thorlabs LA1252-A) focuses the beam onto a silicon photomultiplier (SiPM; Onsemi 30035) detector. The detector is biased by ∼29 V DC via a LT3494A boost converter. This voltage sets the gain of this device. Signal from the SiPM is amplified through a transimpedance amplifier based on a low noise, ADA4625-2 op-amp. The SiPM assembly is thermally stabilized by heating it to a 35 °C set point using a Minco CT335 heater controller. The temperature of the SiPM is monitored with a 10 K thermistor mounted adjacent to the heater. The temperature of the detector is held to within 0.1 °C of the set point using the Minco controller.
3.2 Flow system
The PCAND instrument uses a small, 12 V diaphragm pump (Parker E134-11-120) to achieve a 1.4 slpm (standard liters per minute) flow rate. Flush time is approximately 3 s, as evident from Fig. 4. A three-way valve (ASCO 411L3212HV) is used to switch the flow between sample air and scrubbed air (via an inline charcoal filter). The charcoal filter removes any NO2 from the flow and gives the I0 (reference) measurement every 30 s for 5 s, leaving sample air measurements 50 s out of every minute.
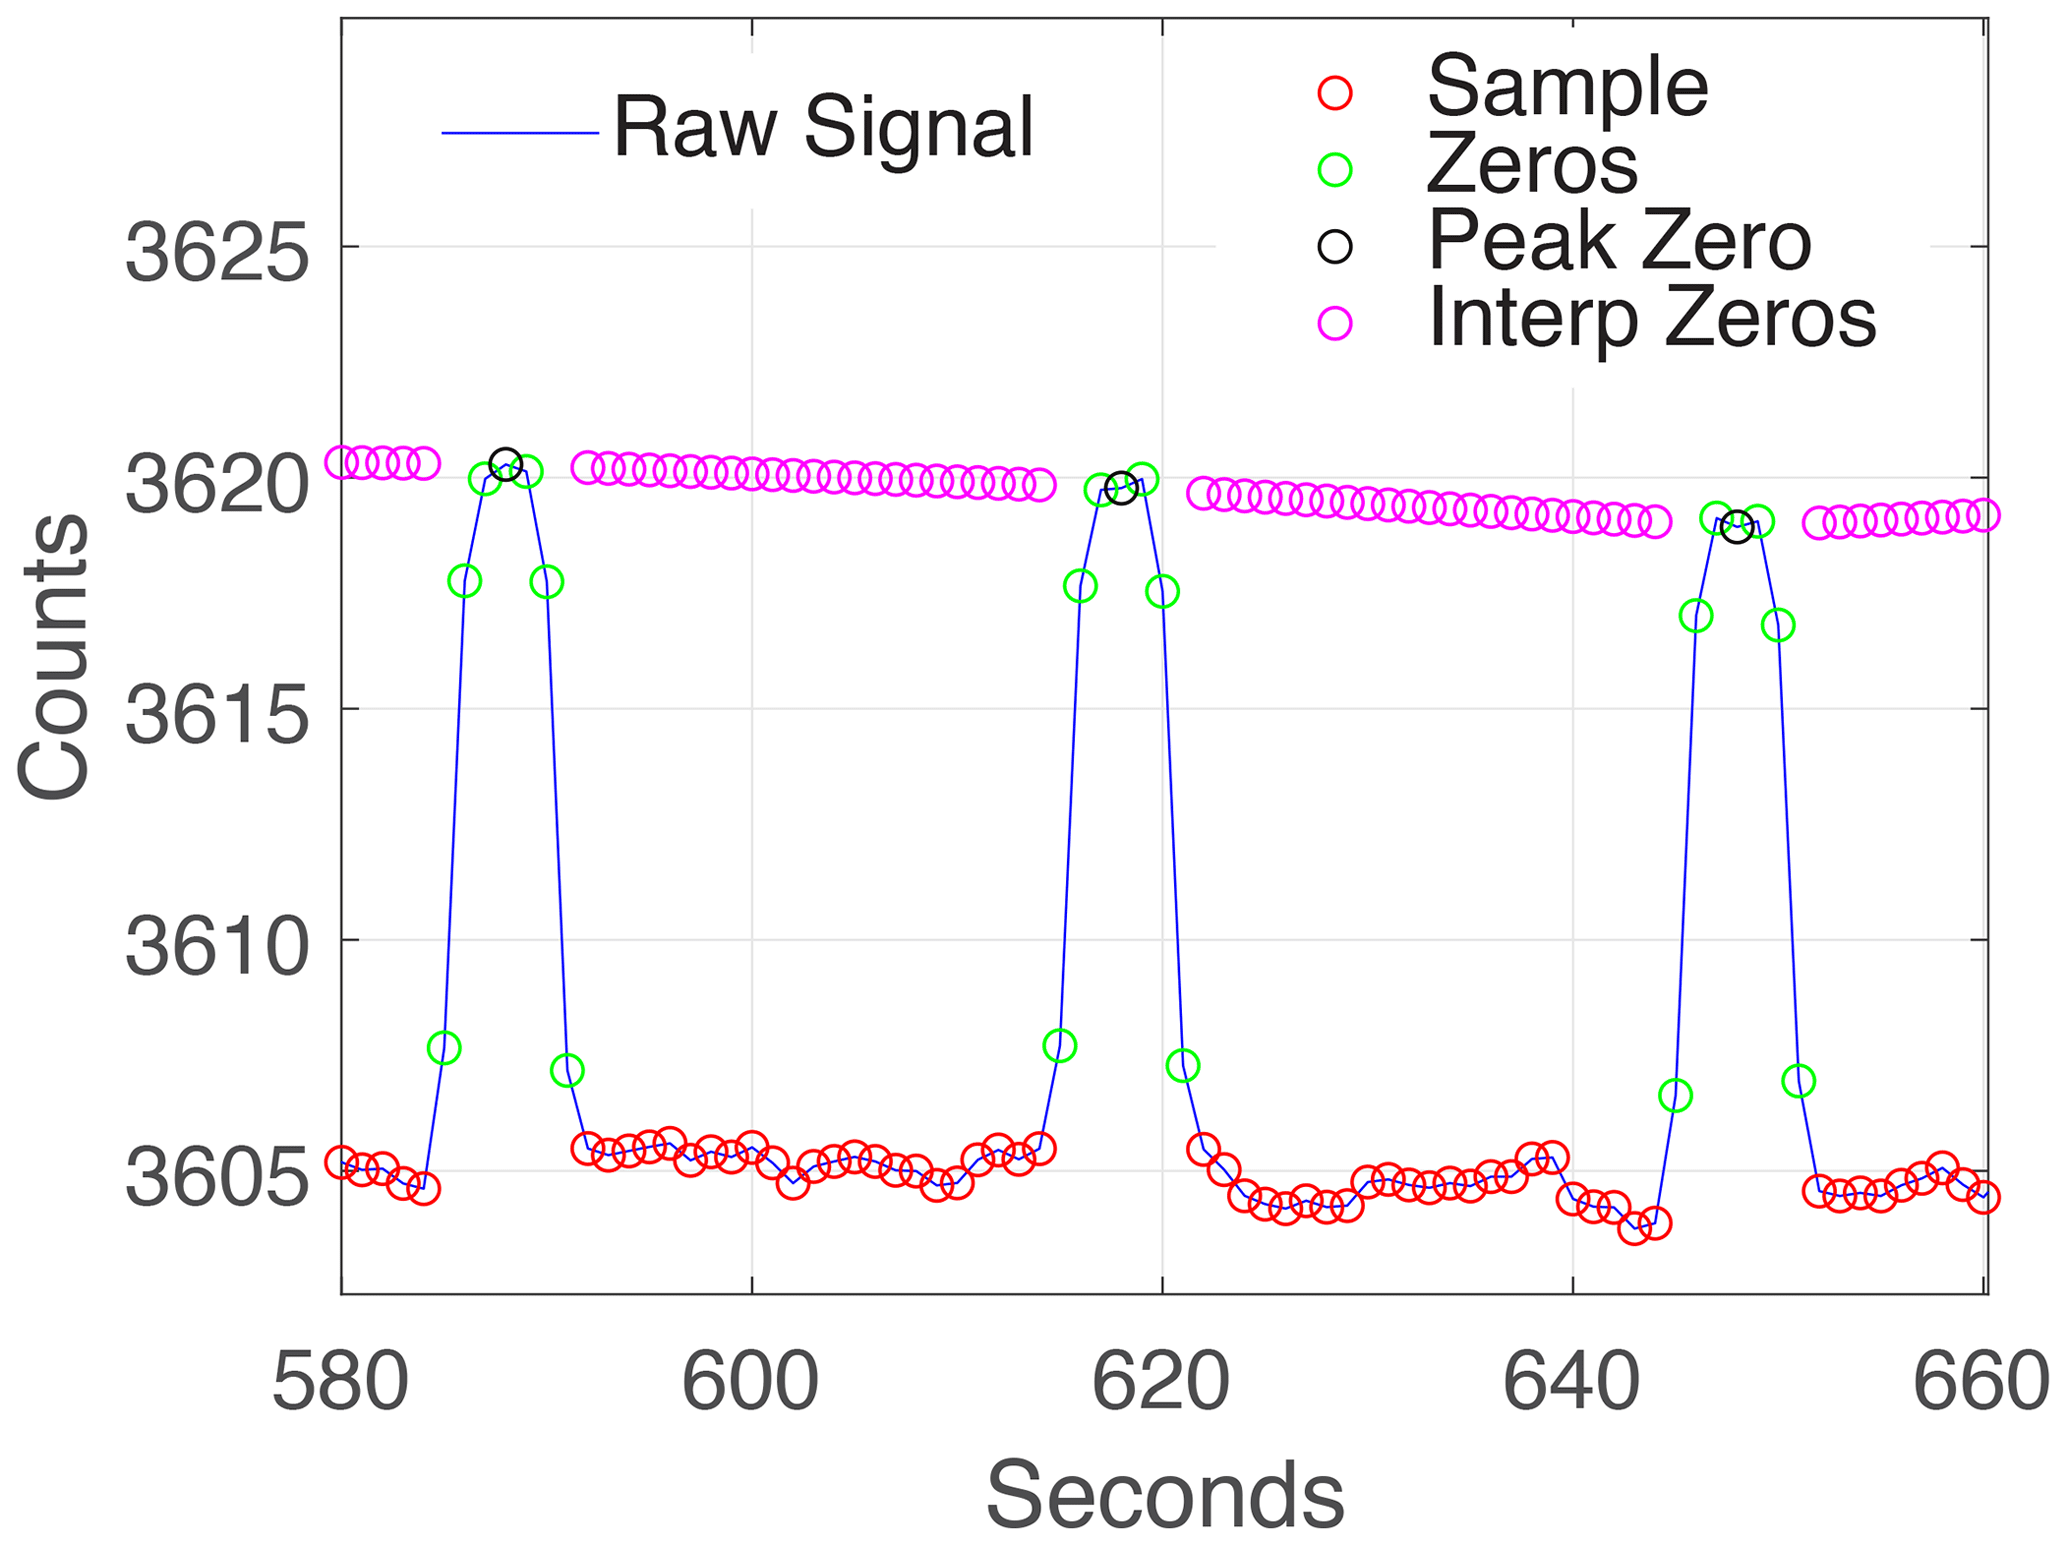
Figure 4Cadence used to make real-time measurements of IZ (signal with no absorbers) vs. I (signal with absorbers) is 7 s for IZ and 23 s for I. We found this was a good cadence, allowing 3 s to achieve peak IZ and 3 s to return to I. A charcoal filter is switched into the airflow to achieve the IZ measurement.
We expect a small interference from water vapor. H2O vapor has a cross-section of cm2 per molecule at 408 nm (Lampel et al., 2015, 2017). An atmospheric abundance of H2O=1 % contributes the same absorption as 50 pptv of NO2. In addition, we notice stronger attenuation that is not consistent with gas-phase absorption like that reported in ozone instruments using UV absorption (Wilson and Birks, 2006). In principle, the presence of water vapor should not affect the measurement if the abundance is constant between the sample and the scrubbed air. However, the scrubber material (activated charcoal) can add or remove water vapor to the sampled air depending on the prior humidity. Because of this interference, water vapor is removed using two 30 cm lengths of 0.3 cm diameter DewLine Nafion tubing held in an enclosure with Drierite. The dry-air sample eliminates any contribution of water vapor in the measurement.
PCAND uses fluorinated ethylene propylene (FEP)-lined thermoplastic tubing for all internal plumbing, and nylon fittings are used for connections. A 2 µm Teflon membrane filter is positioned immediately before the cell inlet to keep small particles from entering the cell and potentially dirtying the mirrors. The loss of NO2 on the surfaces of the tubing, valve, filter, Nafion, and cell was measured to be less than 0.1 ppb.
3.3 Data acquisition
PCAND uses an Arduino MKR Zero microcontroller for three-way valve control, LED modulation, and data acquisition. Arduino actuation of the valve is generated through a CoolCube R valve controller, which reduces the holding current needed to keep the valve in its open state. LED modulation is produced by the Arduino through the LED controller at a 100 Hz rate. This modulation has a 70 % duty cycle used to achieve a digital lock-in to remove any background light from the absorption measurement. We oversample the absorption signal at 42 000 samples s−1 to increase the native Arduino internal 12-bit measurement to an effective (averaged over a second) ∼21-bit measurement. Data are both recorded on an SD card and sent to an RS-232 port. The latter is useful both for instrument testing and for connecting to an external iMet radiosonde where the data are merged for radio frequency (RF) data downlink by the radiosonde.
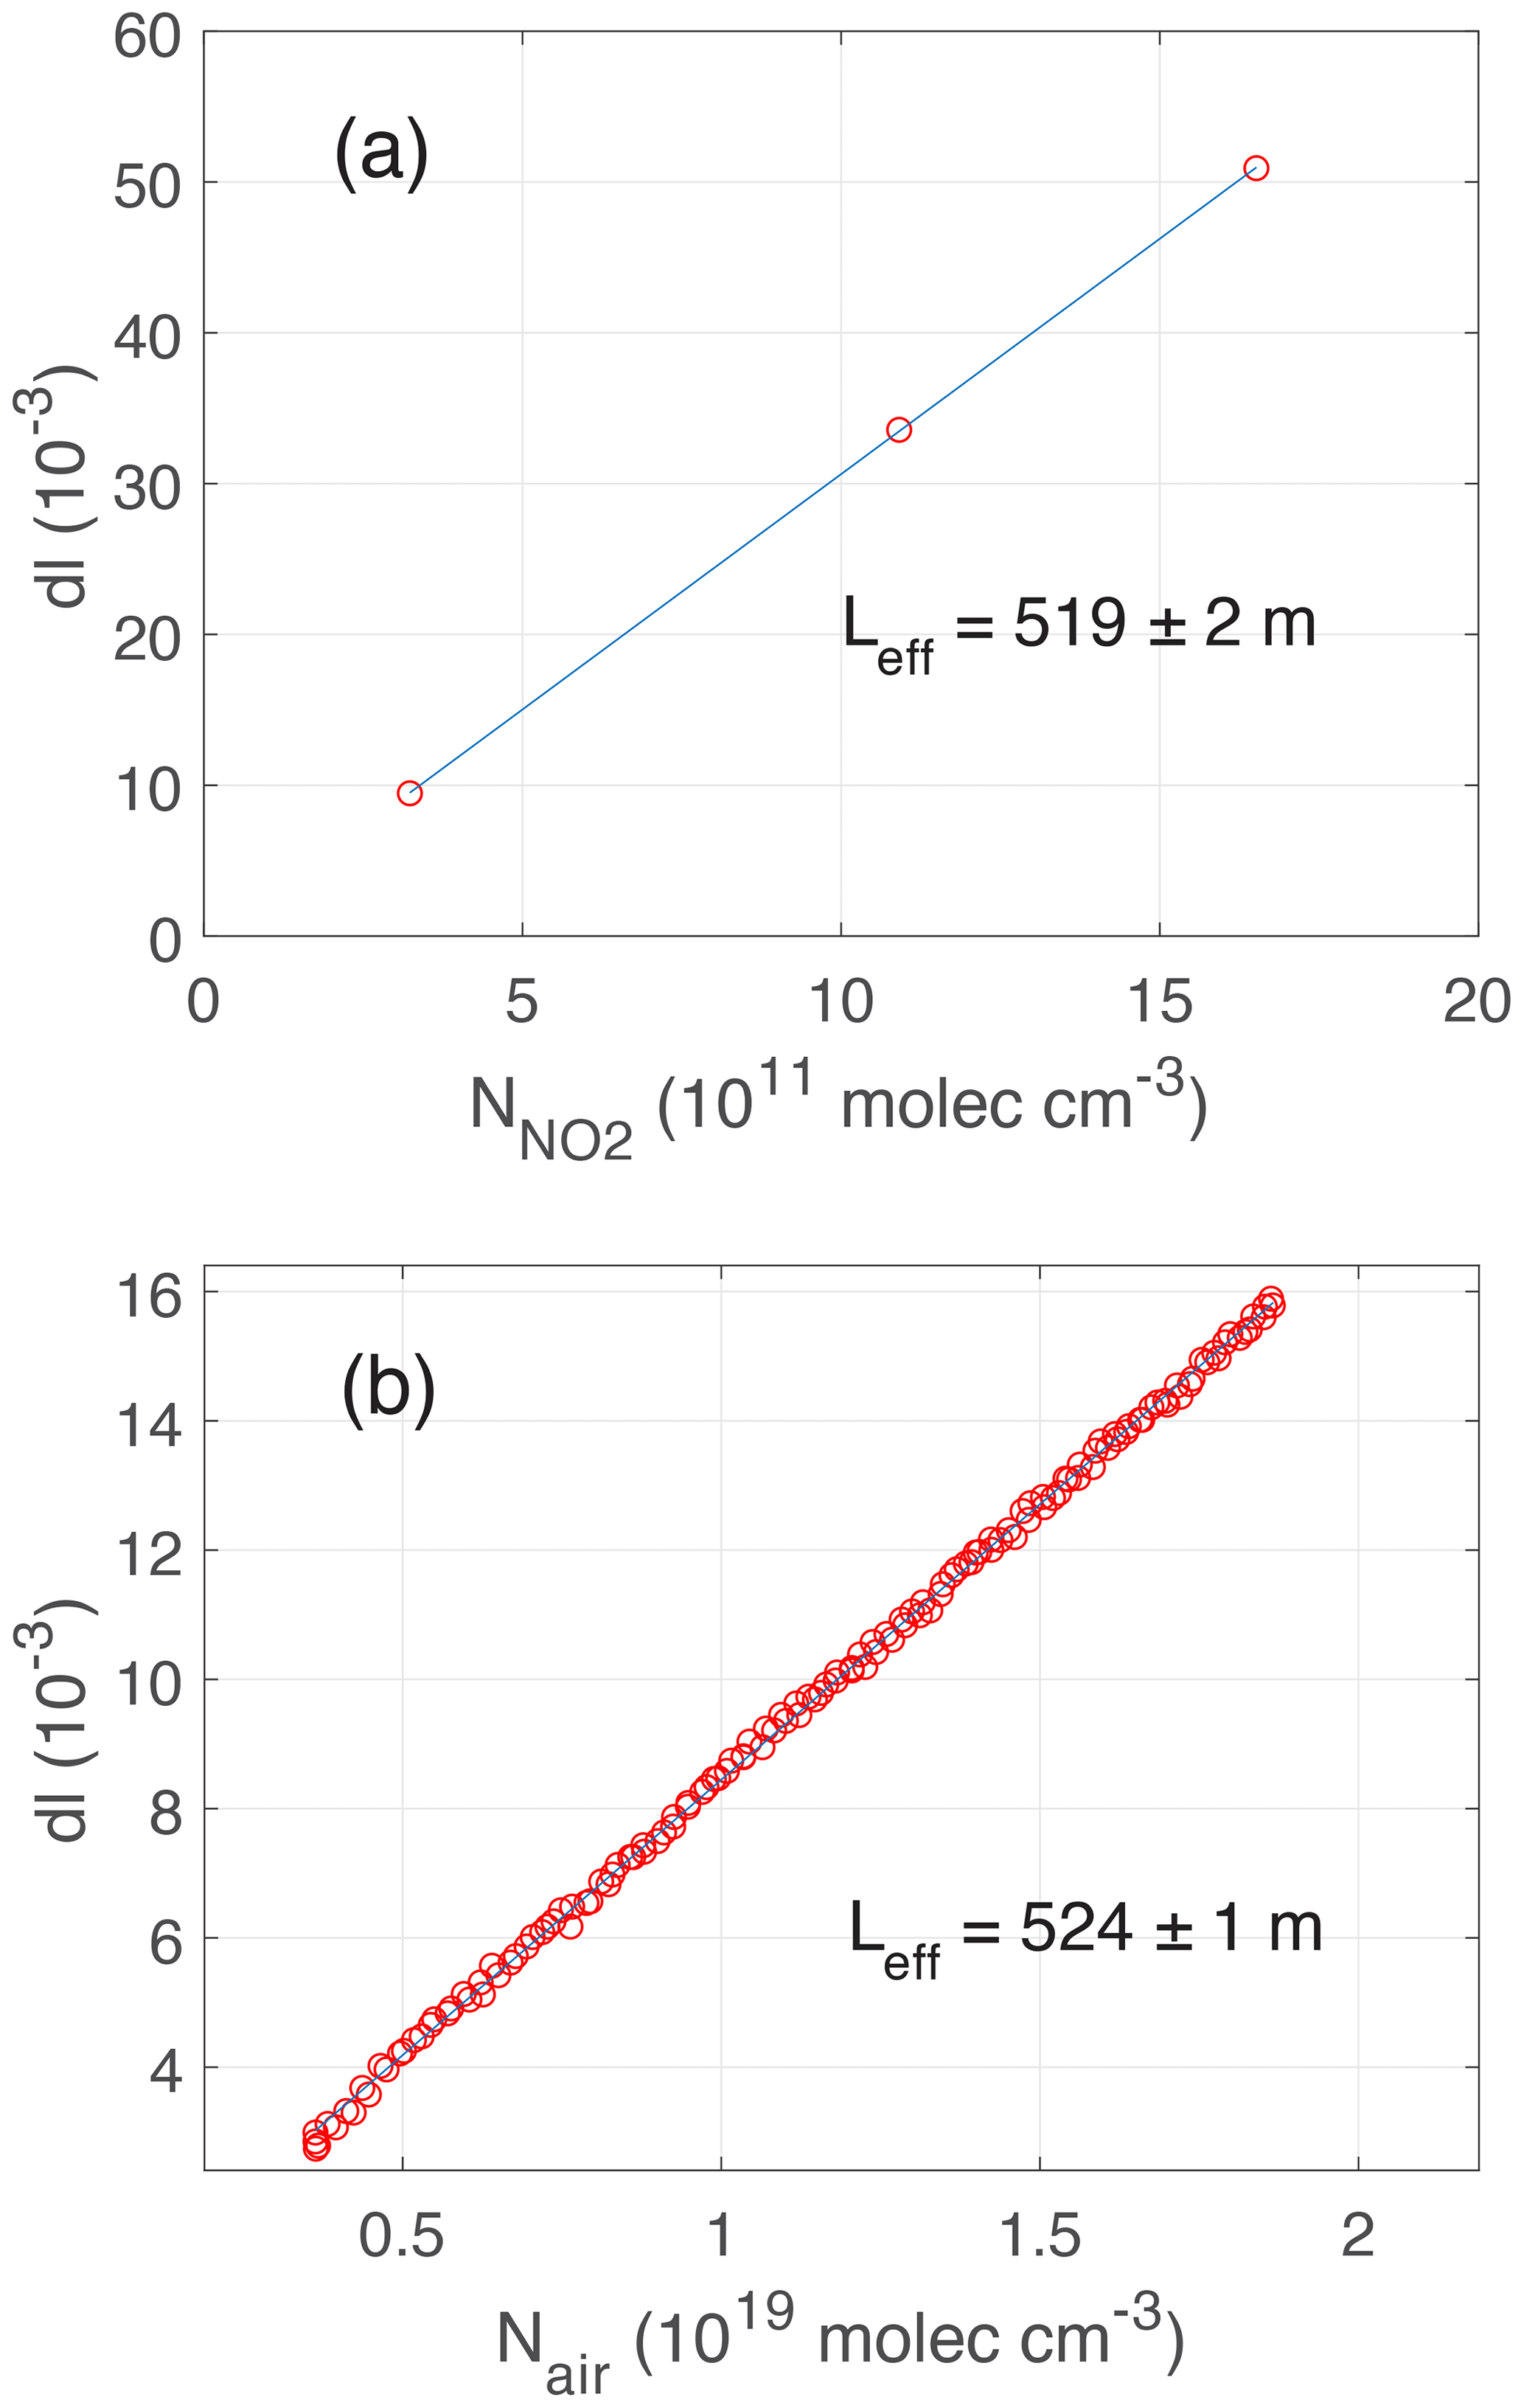
Figure 5PCAND calibration: (a) the effective pathlength (Leff) as determined by attenuation (Attn) due to known additions of NO2 from a reference tank of NO2 mixed with zero air. The slope yields the effective pathlength as determined from Eq. (1) in the text using the known NO2 absorption cross-section. (b) Attenuation due to Rayleigh scatter over a range of cell pressures. The slope of attenuation as a function of number density gives the pathlength using the known Rayleigh scattering cross-section for zero air. The pathlength from each calibration agreed to within 2σ uncertainty for each fit.
3.4 Data processing
The PCAND absorbance calculation uses Eq. (1) but accounts for the differential cell pressure between the sample flow and the zero flow, which is restricted by the scrubber. Including the Rayleigh scattering for both zero air and sample air, Eq. (1) is rewritten as Eq. (4) (Min et al., 2016; Hannun et al., 2020):
Zero air is NO2 scrubbed air where I0 (from Eq. 1) is substituted for IZ. Rayleigh cavity extinction is broken into two parts (αRay,Z and αRay,S) describing zero air and sample air cavity extinction respectively. In both cases, the Rayleigh scattering cross-section (σRay), weighted by the SiPM response curve (Fig. 3), is used (Bucholtz, 1995). The NO2 number density (concentration) is found by knowing the absorption cross-section of NO2 () (Vandaele et al., 1998).
By varying the pressure of the cell with zero air, we can extrapolate a value for I0. Substituting I0 for IZ in Eq. (4), we arrive at Eq. (8). At vacuum (I0), both αRay,Z terms go to zero. The term also goes to zero with no NO2 in zero air.

Figure 6Allan deviation plot for 2 h of sampling zero air at constant pressure (940 mbar). The Allan deviation is expressed in pptv equivalents of NO2 as a function of the integration time τ. The curve shows a precision of 94 pptv at 1 s integration time.
4.1 Sensitivity and calibration
The PCAND effective pathlength of the optical cavity determines the instrument's sensitivity to NO2. Highly reflective mirrors on either end of the cavity are statically mounted, so no adjustment of their position is required. In practice, the alignment is stable over months of operation. After the initial alignment, calibration is needed to determine the effective pathlength given the mirror positions. Equation (4) can be used with known quantities of NO2 to determine the effective pathlength (Fig. 5a). Additionally, Rayleigh scattering alone can be used to solve for effective pathlength (Fig. 5b). This requires varying the pressure of zero air (in the absence of NO2) to generate a data set of absorption attenuation (I) vs. number density of zero air. It also requires solving for Eq. (8) after it has been reduced from Eq. (4). To do this, an assumption is made that αRay,Z is taken at vacuum, so αRay,Z goes to zero, leaving only αRay,S. Therefore, (IZ) is calculated at vacuum from the data set. Equation (8) is left to solve for effective pathlength (Eq. 3). Using known quantities of NO2 (and Eq. 4) yields a pathlength of 519 ± 2 m. Using the Rayleigh scattering method and Eq. (8) yields a pathlength of 524 ± 1 m. The two methods of calibration are within <1 % of each other, and both yield pathlengths that agree to within 2σ uncertainty for each fit. Therefore, we choose to use the Rayleigh scattering method in future calibrations (when needed) of PCAND. Note that due to the small Rayleigh cross-section of air at 408 nm, cm2 per molecule (Bucholtz, 1995), the calibration using air is susceptible to leaks and contamination. Adequate care must be taken to ensure that the system is free of leaks and that the air is pure. In practice, curvature in the Rayleigh calibration curve indicates the presence of a leak or contamination.

Figure 7PCAND flight data from 18 August 2022 balloon launch. Programmed cut-down of balloon at 7 km to achieve payload recovery. Significant concentrations of NO2 appear near the surface and again at cut-down (∼7 km) altitude.
4.2 Precision and accuracy
The PCAND precision was determined by flowing zero air (under constant pressure of 920 mbar) into the cavity for 2 h while accumulating 1 Hz data. Figure 6 is an Allan deviation plot showing a 1 Hz precision of 94 pptv and a 10 s precision of 30 pptv. The 1 Hz precision translates to 2.3×10⁹ molecules cm−3 of NO2 at 1 atmosphere.
The accuracy of PCAND measurements depends on NO2 and Rayleigh cross-section uncertainties, pressure sensor uncertainty, thermistor uncertainty, and cavity extinction uncertainty. The NO2 absorption cross-section uncertainty is reported to be 3 % (Spinei et al., 2014; Vandaele et al., 1998). A 3 % Rayleigh scattering cross-section uncertainty (Bucholtz, 1995) was used. Taken from data sheets, a conclusion was made that temperature and pressure measurements have uncertainties of 0.5 % and 2 % respectively. Cavity extinction slope uncertainty was measured at 1 %. Together, the total uncertainty (when propagated through Eq. 4) comes to 6 % when applied to the final NO2 number density.
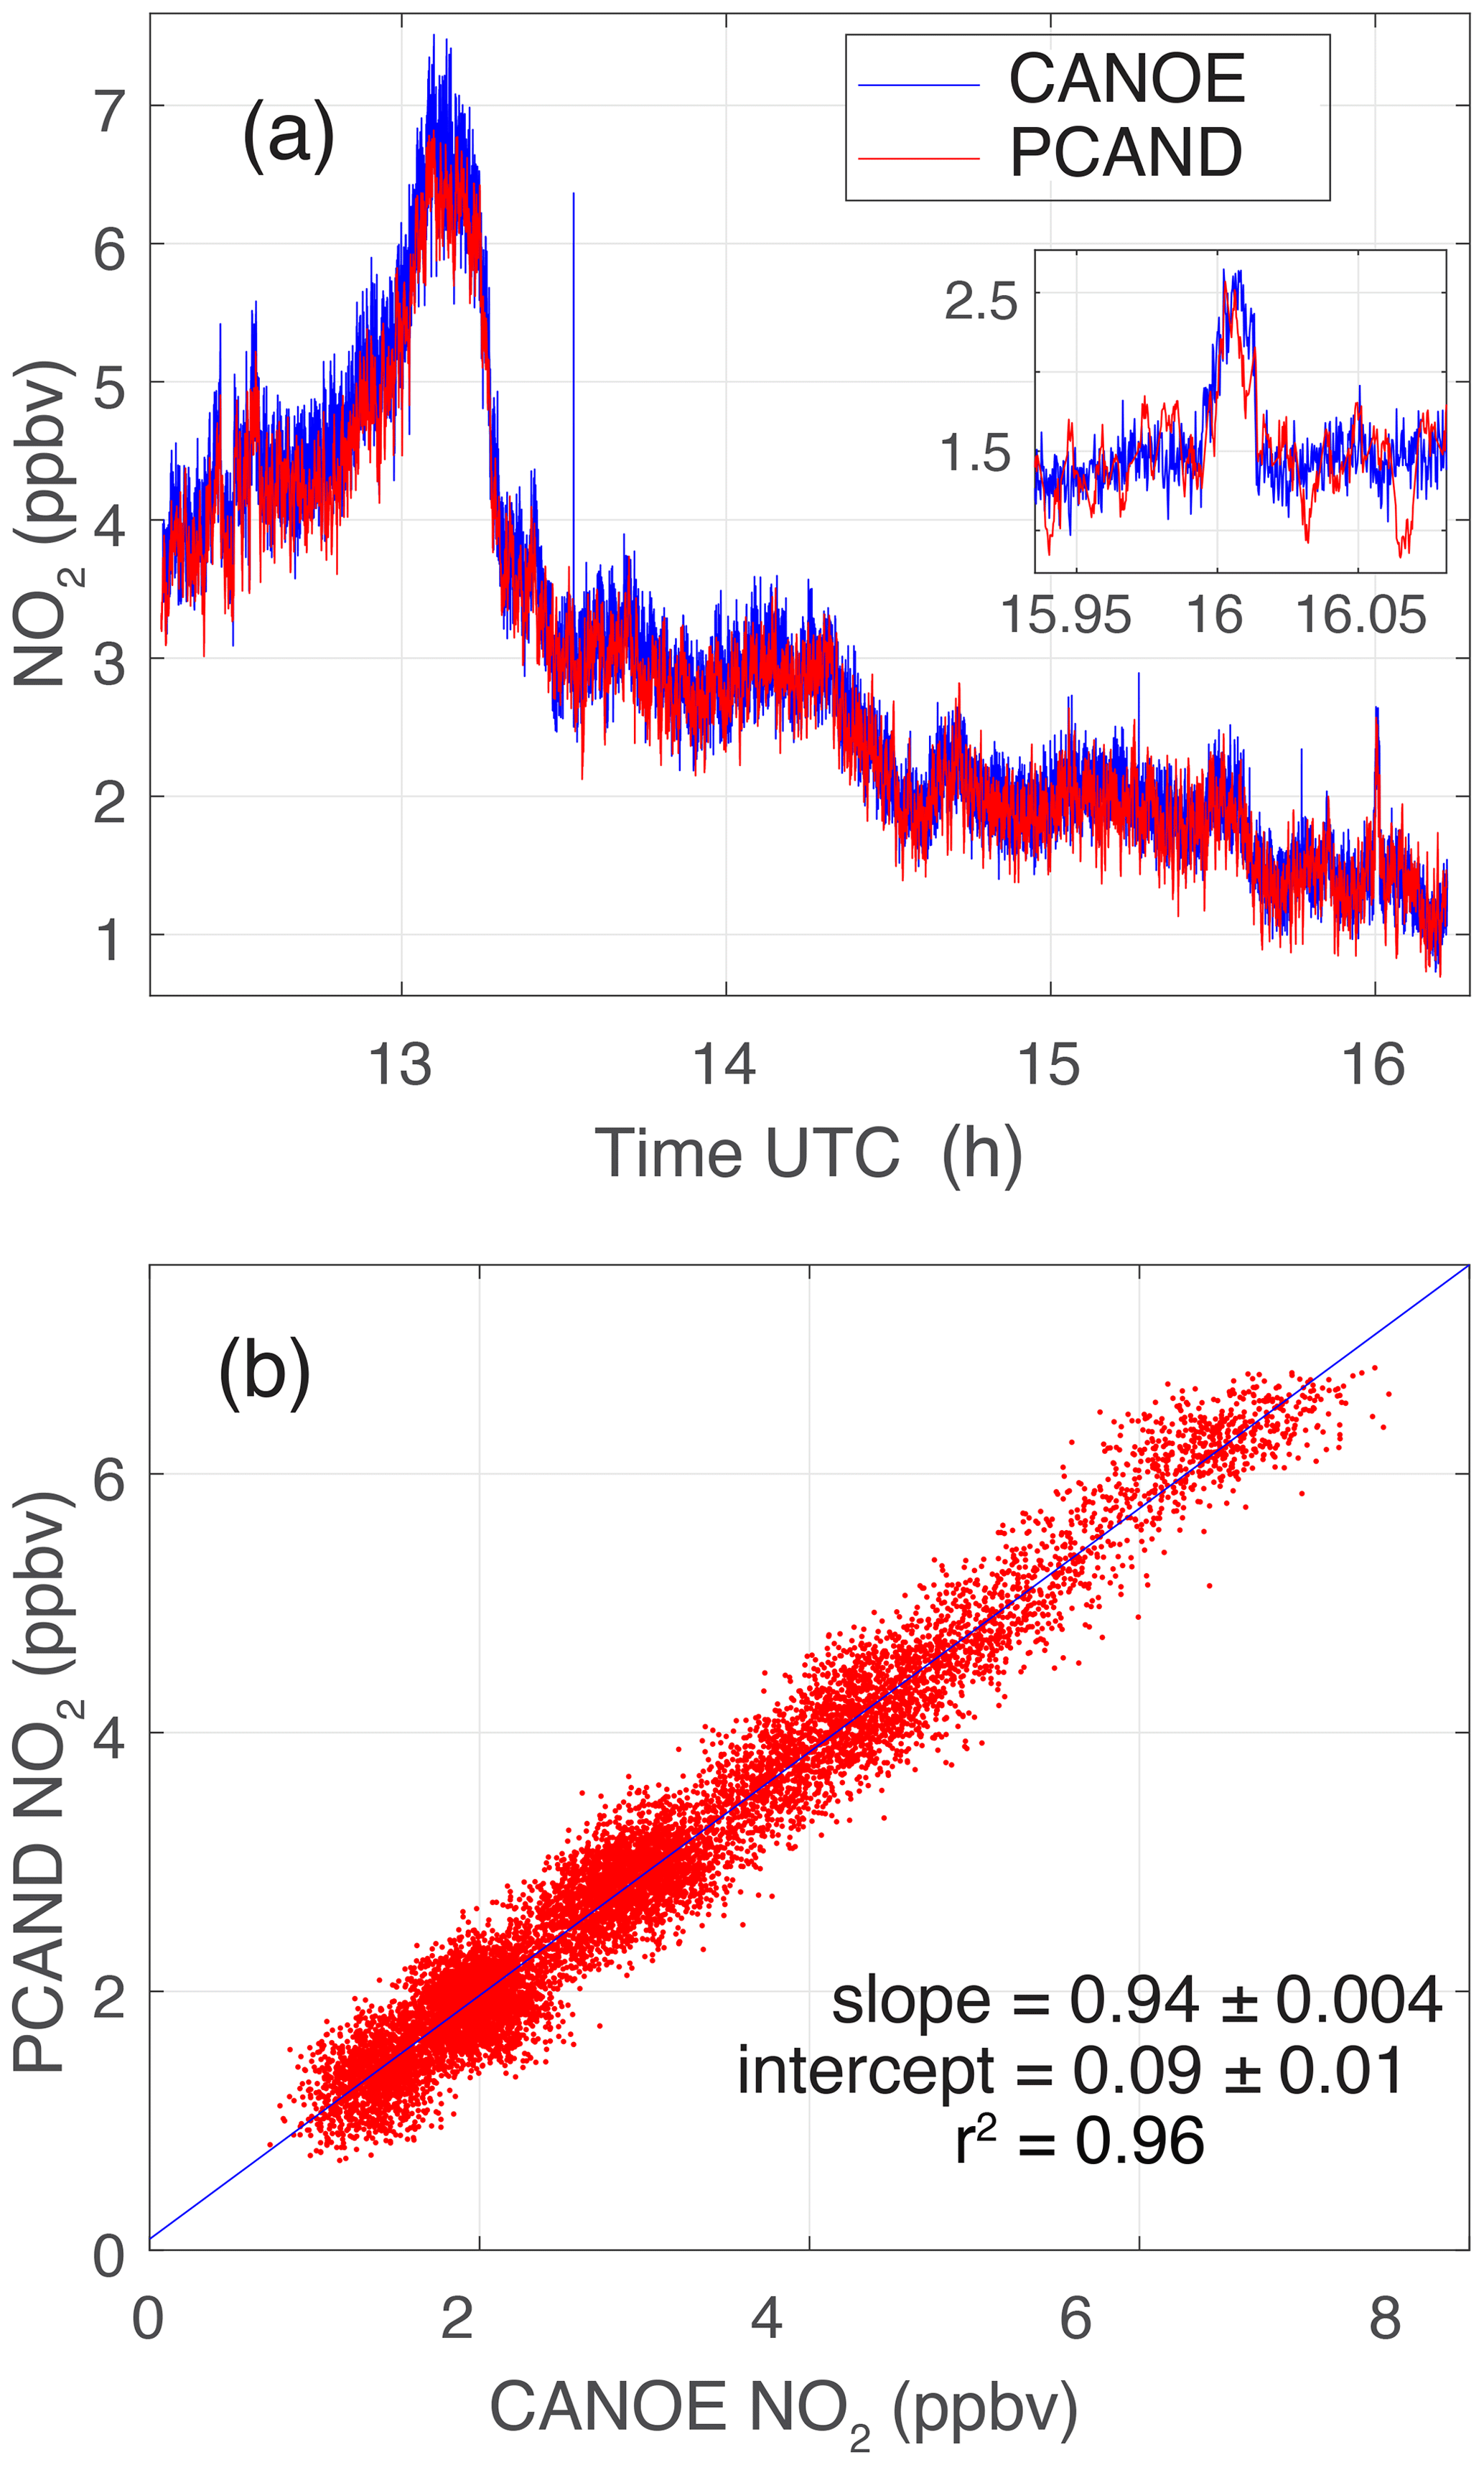
Figure 8PCAND and CANOE measurements during rush hour at GSFC on 14 July 2023. (a) Comparison over ∼4 h which clearly shows rush hour peak around ∼13:00 UTC. (b) Scatter plot of the same data showing high correlation between instrument measurements. A linear fit to the data gives a slope of 0.94 ± 0.004 and an intercept of 0.09 ± 0.012 ppbv with an r2=0.96.
4.3 Response time
Response time is a direct function of gas flush time in our cell given our small vacuum pump. A flow rate of 1.4 slpm is achieved with the pump, resulting in a response time of approximately 3 s (Fig. 4). Given a cadence of 5 s zero air followed by 25 s sample air, one can see (by eye) that it takes ∼3 s for the signal to stabilize with zero air. A larger pump could shorten this response time at the expense of more mass and power needed.
4.4 Photolysis effects
The photolysis quantum yield is 0.22 at 408 nm (Troe, 2000), so we expect some fraction of the NO2 in the cell to photolyze, . In static cells the photolysis of NO2 has been shown to be a concern (Platt and Kuhn, 2019). In the case of our detection, it is unlikely that a significant fraction of NO2 will be photolyzed because the sample flows through the cell quickly with a flush time of approximately 3 s and the number of photons available for photolysis is small.
We can estimate the number of photons in the cell from the detector signal. The SiPM has a radiant sensitivity of 4×10⁵ A W−1 and a photon detection efficiency of 50 %. Based on our detection signal of A, we estimate the optical power is roughly 10−10 W and calculate a photon flux of 2×10⁹ photons s−1. A typical absorbance with 1 ppb NO2 in the cell is 10−3; thus we expect that roughly 2×10⁶ photons s−1 are absorbed by the 1 ppb NO2 in the cell. At 900 hPa the number density of 1 ppb NO2 is roughly 2.2×10¹⁰ molecules cm−3. The absorption of 2×10⁶ photons would result in the photolysis of 4.4×10⁵ NO2 molecules or of the available NO2 molecules. While this number is quite low for our conditions, it is worth noting that with slower flows and higher photon fluxes, the photolysis could be significant, and secondary chemistry could be a concern.
PCAND was launched on three low-altitude (∼7 km) balloon flights for demonstration purposes during the summer of 2022. PCAND was physically linked (via RS232 cable) to a commercial weather sonde for real-time data downlink (via the weather sonde). Results from the flight (Fig. 7) launched on 18 August 2022 show a vertical profile of NO2 indicative of that time of year, with high concentrations of NO2 near the ground. This flight occurred at 08:00 local time when the boundary layer was still close to the ground. The temperature deviation in the instrument box during flight to 7 km was less than 1 °C.
Validation with CANOE
PCAND was validated with another NO2 instrument called CANOE (Compact Airborne Nitrogen diOxide Experiment). CANOE was based on the design of a similar instrument called CAFE (Compact Airborne Formaldehyde Experiment; St. Clair et al., 2019). The only difference between CANOE and CAFE is the laser wavelengths (532 nm for CAFE vs. 355 nm for CANOE) and photomultiplier tube (PMT) detectors used. CANOE is an LIF instrument which has been deployed on several airborne campaigns including Dynamics and Chemistry of the Summer Stratosphere (DCOTSS) and Fire Influence on Regional to Global Environments and Air Quality (FIREX-AQ). CANOE has been calibrated to known cylinders of NO2 concentration. Figure 8 shows a ∼4 h data set where PCAND and CANOE shared the same inlet port sampling the air during a morning in the DC greater metropolitan area. Clearly, a rush hour peak of NO2 is seen trailing off by noon. Figure 8b shows good agreement between the measurements with a slope of 0.94 ± 0.004 and an intercept of 0.09 ± 0.012 ppbv NO2 (r2=0.96).
PCAND provides very high sensitivity to NO2 for such a small package using broadband cavity-enhanced UV absorption at 408 nm. PCAND has a precision of ∼94 pptv s−1, with an accuracy of 6.0 %. Although PCAND was designed for portable, battery-powered operation (as needed for a balloon flight), it could easily be used for either ground- or lab-based measurements. It was successfully tested on three balloon flights. A comparison with another (calibrated) NO2 instrument (CANOE) showed strong agreement over a ∼4 h period.
All relevant data for this paper can be found at https://doi.org/10.7910/DVN/5ISIE2 (Bailey, 2024).
SAB performed the investigation, controller software, electronics design, and testing and wrote the paper. RAH wrote the signal processing code and determined the best wavelength to use for NO2 absorption. AKS did all the mechanical design including the optical plate, fixtures, and cell. TFH determined the correct mirrors to use, consulted with AKS on the optical layout, and made the scientific case for receiving funding for this work.
At least one of the (co-)authors is a member of the editorial board of Atmospheric Measurement Techniques. The peer-review process was guided by an independent editor, and the authors also have no other competing interests to declare.
Publisher's note: Copernicus Publications remains neutral with regard to jurisdictional claims made in the text, published maps, institutional affiliations, or any other geographical representation in this paper. While Copernicus Publications makes every effort to include appropriate place names, the final responsibility lies with the authors.
The balloon flights were made at the Howard University Beltsville Campus with the help of Adrian Flores. We would additionally like to thank Ryan Stauffer for his expertise in balloon flight, needed to launch and recover our instrument.
This research has been supported by the Goddard Space Flight Center (Internal Research And Development Funding grant).
This paper was edited by Jochen Stutz and reviewed by three anonymous referees.
Bailey, S.: PCAND instrument data for AMT paper, V1, Harvard Dataverse [data set], https://doi.org/10.7910/DVN/5ISIE2, 2024.
Ball, S. M., Langridge, J. M., and Jones, R. L.: Broadband cavity enhanced absorption spectroscopy using light emitting diodes, Chem. Phys. Lett., 398, 68–74, https://doi.org/10.1016/j.cplett.2004.08.144, 2004.
Bucholtz, A.: Rayleigh-scattering calculations for the terrestrial atmosphere, Appl. Optics, 34, 2765–2773, https://doi.org/10.1364/AO.34.002765, 1995.
Cersosimo, A., Serio, C., and Masiello, G.: TROPOMI NO2 Tropospheric Column Data: Regridding to 1 km Grid-Resolution and Assessment of their Consistency with In Situ Surface Observations, Remote Sens.-Basel, 12, 2212, https://doi.org/10.3390/rs12142212, 2020.
Cooper, M. J., Martin, R. V., Henze, D. K., and Jones, D. B. A.: Effects of a priori profile shape assumptions on comparisons between satellite NO2 columns and model simulations, Atmos. Chem. Phys., 20, 7231–7241, https://doi.org/10.5194/acp-20-7231-2020, 2020a.
Cooper, M. J., Martin, R. V., McLinden, C. A., and Brook, J. R.: Inferring ground-level nitrogen dioxide concentrations at fine spatial resolution applied to the TROPOMI satellite instrument, Environ. Res. Lett., 15, 104013, https://doi.org/10.1088/1748-9326/aba3a5, 2020b.
Dang, R., Jacob, D. J., Shah, V., Eastham, S. D., Fritz, T. M., Mickley, L. J., Liu, T., Wang, Y., and Wang, J.: Background nitrogen dioxide (NO2) over the United States and its implications for satellite observations and trends: effects of nitrate photolysis, aircraft, and open fires, Atmos. Chem. Phys., 23, 6271–6284, https://doi.org/10.5194/acp-23-6271-2023, 2023.
Duncan, B. N., Lamsal, L. N., Thompson, A. M., Yoshida, Y., Lu, Z., Streets, D. G., Hurwitz, M. M., and Pickering, K. E.: A space-based, high-resolution view of notable changes in urban NOx pollution around the world (2005–2014), J. Geophys. Res.-Atmos., 121, 976–996, https://doi.org/10.1002/2015JD024121, 2016.
Fiedler, S. E., Hese, A., and Ruth, A. A.: Incoherent broad-band cavity-enhanced absorption spectroscopy, Chem. Phys. Lett., 371, 284–294, https://doi.org/10.1016/S0009-2614(03)00263-X, 2003.
Hannun, R. A., Swanson, A. K., Bailey, S. A., Hanisco, T. F., Bui, T. P., Bourgeois, I., Peischl, J., and Ryerson, T. B.: A cavity-enhanced ultraviolet absorption instrument for high-precision, fast-time-response ozone measurements, Atmos. Meas. Tech., 13, 6877–6887, https://doi.org/10.5194/amt-13-6877-2020, 2020.
Kim, H., Müller, M., Henne, S., and Hüglin, C.: Long-term behavior and stability of calibration models for NO and NO2 low-cost sensors, Atmos. Meas. Tech., 15, 2979–2992, https://doi.org/10.5194/amt-15-2979-2022, 2022.
Lampel, J., Pöhler, D., Tschritter, J., Frieß, U., and Platt, U.: On the relative absorption strengths of water vapour in the blue wavelength range, Atmos. Meas. Tech., 8, 4329–4346, https://doi.org/10.5194/amt-8-4329-2015, 2015.
Lampel, J., Pöhler, D., Polyansky, O. L., Kyuberis, A. A., Zobov, N. F., Tennyson, J., Lodi, L., Frieß, U., Wang, Y., Beirle, S., Platt, U., and Wagner, T.: Detection of water vapour absorption around 363 nm in measured atmospheric absorption spectra and its effect on DOAS evaluations, Atmos. Chem. Phys., 17, 1271–1295, https://doi.org/10.5194/acp-17-1271-2017, 2017.
Martin, R. V., Jacob, D. J., Chance, K., Kurosu, T. P., Palmer, P. I., and Evans, M. J.: Global inventory of nitrogen oxide emissions constrained by space-based observations of NO2 columns, J. Geophys. Res.-Atmos., 108, 4537, https://doi.org/10.1029/2003JD003453, 2003.
Min, K.-E., Washenfelder, R. A., Dubé, W. P., Langford, A. O., Edwards, P. M., Zarzana, K. J., Stutz, J., Lu, K., Rohrer, F., Zhang, Y., and Brown, S. S.: A broadband cavity enhanced absorption spectrometer for aircraft measurements of glyoxal, methylglyoxal, nitrous acid, nitrogen dioxide, and water vapor, Atmos. Meas. Tech., 9, 423–440, https://doi.org/10.5194/amt-9-423-2016, 2016.
Miyazaki, K., Eskes, H., Sudo, K., Boersma, K. F., Bowman, K., and Kanaya, Y.: Decadal changes in global surface NOx emissions from multi-constituent satellite data assimilation, Atmos. Chem. Phys., 17, 807–837, https://doi.org/10.5194/acp-17-807-2017, 2017.
Platt, U. and Kuhn, J.: Caution with spectroscopic NO2 reference cells (cuvettes), Atmos. Meas. Tech., 12, 6259–6272, https://doi.org/10.5194/amt-12-6259-2019, 2019.
Ryerson, T. B., Williams, E. J., and Fehsenfeld, F. C.: An efficient photolysis system for fast-response NO2 measurements, J. Geophys. Res.-Atmos., 105, 26447–26461, https://doi.org/10.1029/2000JD900389, 2000.
Sluis, W. W., Allaart, M. A. F., Piters, A. J. M., and Gast, L. F. L.: The development of a nitrogen dioxide sonde, Atmos. Meas. Tech., 3, 1753–1762, https://doi.org/10.5194/amt-3-1753-2010, 2010.
Spinei, E., Cede, A., Swartz, W. H., Herman, J., and Mount, G. H.: The use of NO2 absorption cross section temperature sensitivity to derive NO2 profile temperature and stratospheric–tropospheric column partitioning from visible direct-sun DOAS measurements, Atmos. Meas. Tech., 7, 4299–4316, https://doi.org/10.5194/amt-7-4299-2014, 2014.
St. Clair, J. M., Swanson, A. K., Bailey, S. A., and Hanisco, T. F.: CAFE: a new, improved nonresonant laser-induced fluorescence instrument for airborne in situ measurement of formaldehyde, Atmos. Meas. Tech., 12, 4581–4590, https://doi.org/10.5194/amt-12-4581-2019, 2019.
Thornton, J. A., Wooldridge, P. J., and Cohen, R. C.: Atmospheric NO2: In Situ Laser-Induced Fluorescence Detection at Parts per Trillion Mixing Ratios, Anal. Chem., 72, 528–539, https://doi.org/10.1021/ac9908905, 2000.
Troe, J.: Are Primary Quantum Yields of NO2 Photolysis at λ≤398 nm Smaller than Unity?, Z. Phys. Chem., 214, 573–581, https://doi.org/10.1524/zpch.2000.214.5.573, 2000.
Vandaele, A. C., Hermans, C., Simon, P. C., Carleer, M., Colin, R., Fally, S., Mérienne, M. F., Jenouvrier, A., and Coquart, B.: Measurements of the NO2 absorption cross-section from 42 000 cm−1 to 10 000 cm−1 (238–1000 nm) at 220 K and 294 K, J. Quant. Spectrosc. Ra., 59, 171–184, https://doi.org/10.1016/S0022-4073(97)00168-4, 1998.
Washenfelder, R. A., Langford, A. O., Fuchs, H., and Brown, S. S.: Measurement of glyoxal using an incoherent broadband cavity enhanced absorption spectrometer, Atmos. Chem. Phys., 8, 7779–7793, https://doi.org/10.5194/acp-8-7779-2008, 2008.
Wilson, K. L. and Birks, J. W.: Mechanism and Elimination of a Water Vapor Interference in the Measurement of Ozone by UV Absorbance, Environ. Sci. Technol., 40, 6361–6367, https://doi.org/10.1021/es052590c, 2006.
Womack, C. C., Brown, S. S., Ciciora, S. J., Gao, R.-S., McLaughlin, R. J., Robinson, M. A., Rudich, Y., and Washenfelder, R. A.: A lightweight broadband cavity-enhanced spectrometer for NO2 measurement on uncrewed aerial vehicles, Atmos. Meas. Tech., 15, 6643–6652, https://doi.org/10.5194/amt-15-6643-2022, 2022.