the Creative Commons Attribution 4.0 License.
the Creative Commons Attribution 4.0 License.
Rapid quantitative analysis of semi-volatile organic compounds in indoor surface film using direct analysis in real time mass spectrometry: a case study on phthalates
Ying Zhou
Longkun He
Jiang Tan
Yingjun Liu
Direct analysis in real time mass spectrometry (DART-MS) has recently emerged as a promising approach for measuring semi-volatile organic compounds (SVOCs) on indoor surface films. However, its broader application in indoor environments is limited by low measurement repeatability and no separation of isomers. Herein we developed a sampling suite of indoor surface films for DART-MS analysis, optimized settings of DART to obtain higher analytical performance, and demonstrated the possibility of separating isomeric compounds using tandem mass spectrometry (MS/MS). Two pairs of isomeric phthalate esters, including di(2-ethylhexyl) phthalate (DEHP) and di-n-octyl phthalate (DnOP) and diisobutyl phthalate (DiBP) and di-n-butyl phthalate (DnBP), were used as examples for method optimization and validation. Under optimized conditions, the instrument responses for all four compounds exhibited good linearity (r>0.992) and acceptable repeatability (intraday relative standard deviation (RSD) < 11.0 %). The limits of quantification for the four phthalate esters ranged from 0.042 to 0.24 ng cm−2. The uncertainty in the separation of isomeric components using MS/MS was < 11.4 %, which is acceptable for real sample analysis. To further assess the developed method, we analyzed 10 film samples collected side by side in an occupied office. DnOP was not detected. The RSD among samples was 6.1 % for DEHP, 4.6 % for DnBP, and 10.4 % for DiBP, indicating the overall good repeatability of the collection and measurement method developed. With improved performance, the developed method increases the feasibility of the DART-MS technique for monitoring the dynamics of chemical composition of indoor surface films.
- Article
(1311 KB) - Full-text XML
-
Supplement
(803 KB) - BibTeX
- EndNote
People typically spend around 90 % of their lives indoors (Klepeis et al., 2001; Hussein et al., 2012), making indoor exposure to air pollutants a significant concern. Indoor spaces have a high surface-area-to-volume ratio, usually ranging from 2 to 4 m2 m−3 (Manuja et al., 2019), which is hundreds of times greater than that outdoors. This feature enhances the importance of indoor surfaces in determining the concentrations and composition of indoor air pollutants (Ault et al., 2020). Organic films are ubiquitous on indoor surfaces (Weschler and Nazaroff, 2017). The nanometer-thick films are formed from the partitioning of semi-volatile organic compounds (SVOCs) emitted from various indoor sources, particularly those with octanol air partition coefficient (Koa) values ranging from 1010 to 1013 (Weschler and Nazaroff, 2017; Eichler et al., 2019). Modeling analysis predicts that these surface films are important reservoirs of indoor SVOCs (Weschler and Nazaroff, 2008), and this prediction is supported by recent observations of indoor airborne SVOC dynamics under real-world conditions (Li et al., 2022; Lunderberg et al., 2020). However, this evidence is indirect, based solely on airborne concentration dynamics. Direct evidence showing concurrent changes in SVOC concentrations within the films themselves is still lacking.
A method for time-resolved monitoring of SVOCs in surface films is essential for exploring the surface-mediated dynamic behavior of SVOCs. The most common approach for quantitative analysis of SVOCs in indoor surface films involves wiping existing impermeable indoor surfaces, typically glass windows, using pre-cleaned Kimwipes (Liu et al., 2003; Huo et al., 2016; Cetin and Odabasi, 2011; Butt et al., 2004; Duigu et al., 2009) or Twillwipes (Bennett et al., 2015) wetted with organic solvents. This is followed by Soxhlet extraction or liquid–liquid extraction and gas/liquid chromatography mass spectrometry analysis. Typically, a surface area of 0.5–2 m2 is required to collect one sample, making the total area of glass windows in a specific environment the primary limiting factor of the number of samples that can be collected and, consequently, the temporal resolution of analysis. Due to this limitation, previous studies on the growth of indoor organic films often sequentially collected five to six samples over a period of 1–2 months (Huo et al., 2016; Li et al., 2010; Pan et al., 2012). The largest sample size reported to date was from a study in a university hall with glass walls, where 22 samples were collected over 80 d (Huo et al., 2016).
An alternative approach to measuring SVOCs on surface films involves the use of highly sensitive direct analysis in real time mass spectrometry (DART-MS), which is pioneered by Abbatt and colleagues (Lim and Abbatt, 2020). In their approach, SVOCs were deposited or passively collected on glass capillary tubes sealed at one end (Zhou et al., 2015; Lim and Abbatt, 2020). Subsequently, DART-MS desorbed and ionized the SVOCs on the capillary by a heated glow-discharge plasma in helium, followed by MS analysis (Cody et al., 2005; Habe and Morlock, 2015). The small size of the glass capillaries enables the deployment of tens of them in indoor experiments, allowing for the monitoring of SVOC dynamics in films at a higher time resolution (Lim and Abbatt, 2020). Moreover, using DART-MS to analyze indoor organic films enables a rapid analysis of samples without the need for extensive sample preparation or solvent use. However, in previous studies, the measurement variability in the DART-MS ranged from ±20 % to ±115 % without internal standards (Zhou et al., 2016; Morlock and Ueda, 2007), thus limiting its capability for quantitative analysis. This large uncertainty mainly stems from the fact that DART-MS analyses samples at atmospheric pressure in open laboratory environments, making the measurement results highly sensitive to instrumental conditions. For instance, the response of certain compounds could be increased by 50 % when the temperature of helium gas increased from 250 to 300 °C (Morlock and Ueda, 2007). Moreover, the distance between samples, cone voltage, moving speed of the motorized linear rail, and other parameters might also impact instrument performance. However, the discussion of these influences remains incomplete. Optimizing the instrumental conditions could potentially enhance the precision of measurements.
Moreover, due to the absence of pre-separation such as using gas/liquid chromatography, the common combination of DART and a time-of-flight mass spectrometer is unable to distinguish isomeric compounds. This limitation further restricts the applicability of DART-MS in real-world indoor conditions, particularly considering the prevalence of various isomeric SVOCs, such as phthalate esters (PAEs), polycyclic aromatic hydrocarbons (PAHs), and polybrominated diphenyl ethers (PBDEs) (Gaspar et al., 2014; Shi et al., 2018; Li et al., 2019). For example, diisobutyl phthalate (DiBP) and di-n-butyl phthalate (DnBP) are among the most commonly detected SVOCs indoors (Pelletier et al., 2017). Separation of isomeric components might be crucial in some occasions due to their varying levels of toxicity.
The present study aims to develop a DART-MS method for fast and reliable measurements of SVOCs in indoor surface films, using two pairs of isomeric PAEs – specifically DiBP/DnBP and di(2-ethylhexyl) phthalate (DEHP)/di-n-octyl phthalate (DnOP) – as examples. A sampling suite was designed, and the operating parameters of DART were optimized, to improve measurement precision. In addition, DART was coupled with a triple quadrupole mass spectrometer to distinguish the isomeric compounds. The method was further validated by analyzing the surface film samples collected from real indoor environments.
2.1 Chemicals and reagents
High-performance liquid chromatography (HPLC)-grade acetonitrile (Fisher Scientific, Ottawa, ON, Canada) and methanol (Avantor, Inc., Center Valley, PA, USA) were purchased and used without further purification. The standard solutions (100 mg L−1 in acetonitrile) of DiBP, DnBP, DEHP, and DnOP were purchased from AccuStandard, Inc. (New Haven, CT, USA) with purity equal to higher than 99.8 %. Palmitic acid was purchased from Dr. Ehrenstorfer GmbH (Augsburg, Germany). All solutions were prepared in acetonitrile or methanol in an identical manner and were stored at −4 °C. Deionized water was produced by a Milli-Q purification system (Millipore, USA). The molecular structures and physiochemical properties of four phthalates studied are shown in Table 1.
2.2 Collection of surface film
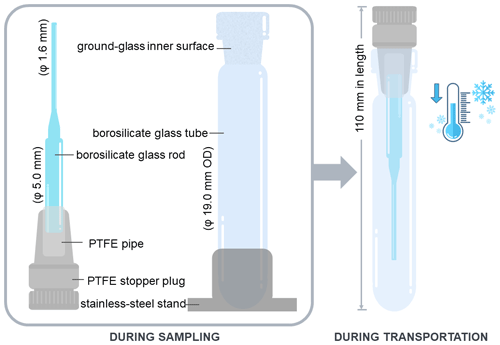
For film collection in real indoor environments, a sampling suite was designed, consisting of a Dip-it glass rod, a polytetrafluoroethylene (PTFE) stopper plug, and a glass tube. The commercial Dip-it glass rods were employed as the substrate for film analysis. The glass rods feature a tapered design, with a long, thin tip (1.6 mm in diameter), for DART analysis and a larger diameter (5 mm) at the opposite end (see Fig. 1). The larger end of the rod was inserted into the central hole of a PTFE stopper plug (14/20 inner joint) with a small piece of PFA (perfluoroalkoxy) tubing for better sealing. During sample collection, the plug was positioned on a flat surface, securely holding the rod, with the thin tip facing upward (Fig. 1, left). SVOCs deposited on the surface of the tip, gradually forming surface film. Post-sampling, the glass rod was encapsulated in a glass tube (14/20 inner joint; Synthware, China) through the plug, ensuring that the tip, loaded with samples, did not contact any other surfaces during storage and transport (Fig. 1, right). The glass tubes were placed in the sampling environment alongside the glass rod, enabling the inner surface of the glass tube to be coated with the same surface films. This approach minimizes SVOC repartitioning inside of the glass tube during storage and transport, preserving the composition of the film on the sampling tip. Prior to use, all components of the sampling suites were ultrasonically cleaned with deionized water and acetonitrile. In addition, the glass rods and the glass tubes were baked for 5.5 h at 550 °C to eliminate residual organics.
For an application of the method, surface film samples were collected in an office in Beijing, China. A total of 10 sampling suites were placed in the office for a period of 2 months (from June to August) to collect surface films. After sampling, the sampling suite was stored at 4 °C until analysis. Samples were analyzed under quality assurance protocols, including double method blanks, a field blank, double solvent blanks, and two samples for calibration.
2.3 Preparation of spiked samples for testing and calibration
To prepare spiked samples, we first applied 5 µL of a palmitic acid solution (20 µg mL−1 in methanol), a prominent component of indoor surface film (Weschler and Nazaroff, 2017), to the tip of a clean glass rod using a micro-pipette. The solution was then allowed to dry, forming a base film of palmitic acid. Next, 5 µL solutions of target PAEs in acetonitrile were applied and allowed to dry. Pre-treating the glass rods with less volatile palmitic acid provides a matrix for the more volatile phthalates to dissolve into, thereby preventing their evaporation after application. The spiked samples were analyzed immediately following the preparation.
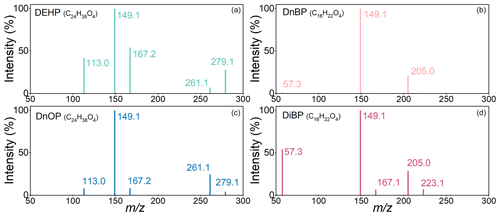
Figure 2Relative intensity of selected product ions of DEHP/DnOP at 391.3 (a, c) and DnBP/DiBP at 279.2 (b, d).
2.4 DART-MS/MS analysis
Analyses were conducted using a DART-SVP ionization source (IonSense, Saugus, MA, USA) coupled with a triple quadrupole tandem mass spectrometer (MS/MS; 5500, SCIEX, Framingham, MA, USA). The ion source was operated in a positive ion mode with high-purity helium (He, 99.999 %) as the reagent gas (at a flow rate of 3.0 SLPM). The potential applied to the gas-discharged needle was 6 kV. The grid electrode voltage was 350 V. Given that the boiling points of the studied PAEs ranged from 296.5 to 384 °C (Table 1), the He flux temperature of 150, 200, 250, and 300 °C was tested. In the interface of mass spectrometer, a ceramic tube (3.18 mm internal diameter; 79 mm in length) was used as an ion inlet. The distance between the DART source and the ceramic tube was minimized to 10 mm to favor the desorption of the target SVOCs and to enhance ions transfer to MS/MS.
During analysis, the Dip-it glass rods were placed on the Dip-it sample holder (IonSense, Saugus, MA, USA) mounted on the motorized linear rail (IonSense, Saugus, MA, USA), as shown in Fig. S1. The holder can accommodate up to 12 glass rods with 9 mm in between. The moving speed of the rail was controlled by a computer program (DART-SVP control software version 3.2.2). When the rod passed between the ceramic tube and the DART ion source, the heated plasma gas flow directly desorbed organics on glass rods toward the sampling orifice of the mass spectrometer (Cody et al., 2005). This process can lead to a discernible peak in the time series of corresponding ion signals recorded by the mass spectrometer. Herein, the resulting peak area was used to quantify sorbed organics. The desorption area for DART source was measured to be 7.4 mm in diameter by heating a piece of polymeric plate at the highest He flux temperature (Hayeck et al., 2015). When placed on the holder, the tip of the glass rod was 0.4 mm below the center of the DART source, resulting in an effective desorption area of 0.24 cm2 on the glass rod. The moving speed of the rail was tested under 0.2, 0.5, and 0.7 mm s−1.
Parameters of the triple quadrupole mass spectrometer were optimized using standard solutions of targeted species using conventional electrospray ion (ESI) source. Compared to DART, ESI produces similar product ions but provides more stable ion generation, and hence it is used for optimizing mass spectrometer performance here. The spectrum was recorded in a positive mode. PAEs exhibited distinct protonated ions [M + H]+, which were used as precursor ions for analysis. The major product ions for individual compounds were identified through triple-quadrupole scanning. The optimized conditions for individual precursor/product ion pairs, including declustering potential (DP) and collision energy (CE), are presented in Table S1 in the Supplement. Mass calibration of the MS/MS was performed daily to ensure the accuracy of the mass analysis.
3.1 Product ion pattern of PAEs in triple quadrupole mass spectrometer
Figure 2 compares the pattern of major product ions for the two pairs of isomeric PAEs. The ion intensities were normalized to that of the strongest product ion for individual compounds. For both DEHP and DnOP (precursor ions at 391.3), the strongest product ion appeared at 149.1. Product ions also appeared at 279.1, 261.1, 167.2, and 113.0, but their relative signals differed for the two compounds. For example, the fragment ion at 167.2 was a few times more abundant for DEHP than that for DnOP, while the fragment ion at 261.1 was more abundant for DnOP than that for DEHP. Similarly, for DnBP and DiBP (precursor ions at 279.2), the strongest product ion occurred at 149.1, but the relative signals of other product ions differed. In particular, the product ion at 57.3 was almost exclusively found from DiBP rather than DnBP. In the following analysis, we used the strongest product ions for the method optimization (Sect. 3.2). For the method validation and real sample analysis, the signals of multiple product ions were measured to separate isomeric PAEs (Sect. 3.3 and 3.4).
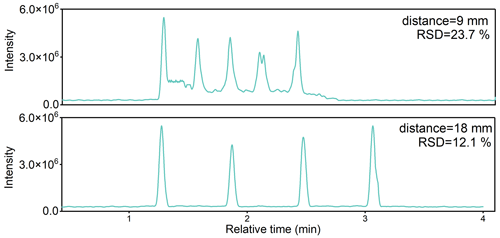
Figure 4The influence of rod distance on the total ion chromatograms (TICs) for spiked DEHP. The He flux temperature was set as 200 °C. The speed of the motorized linear rail was 0.5 mm s−1.
3.2 Optimization of DART settings
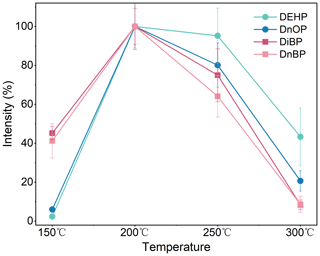
Figure 3 shows the relative peak intensities of four PAEs at He flux temperature of 150, 200, 250, and 300 °C. The intensities were quantified by integrating the peak area on the time series of respective quantitative ion pairs. As shown in Fig. 3, the strongest response occurred at 200 °C for all four PAEs studied. At 150 °C, the signals of less volatile DEHP and DnOP were only < 4.5 % of those at 200 °C. At 300 °C, the signals of more volatile DiBP and DnBP dropped to < 8.5 % of those at 200 °C. These results suggest that the transmission efficiency of SVOCs is highly sensitive to the He flux temperature. A lower temperature (e.g., 150 °C) might have led to inadequate desorption of PAEs from the glass rods, while at a higher temperature (e.g., 300 °C), the volatilization and desorption of PAEs was too rapid, so a reduced fraction of vaporized PAEs was ionized and transferred to the mass spectrometer. Additionally, as the temperature increased from 150 to 300 °C, the peaks on the time series exhibited broadening, accompanied by the emergence of small negative peaks at the tail (Fig. S2). In the following analysis, 200 °C was adopted.
The instrument performance was also influenced by the distance between adjacent glass rods and the moving speed of the metal holder. As shown in Fig. 4, using the default 9 mm distance resulted in an elevated baseline on the time series, indicating overlaps of PAE signals on adjacent glass rods. With the distance of 18 mm between adjacent glass rods, the peak shapes became symmetric, and the baseline was reduced to the background level, allowing for separation of PAE signals on adjacent rods. Given the limited length of the motorized linear rail, a further increase in the distance can reduce the number of glass rods analyzed in one batch, and thus an 18 mm distance was used herein.
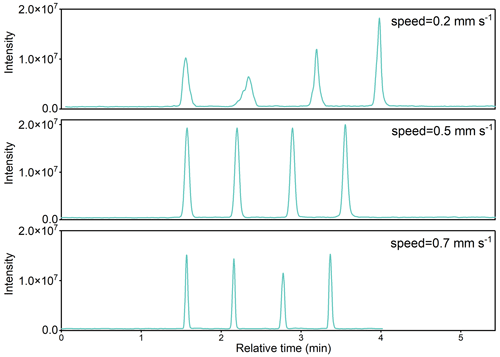
Moreover, three different moving speeds, 0.2, 0.5, and 0.7 mm s−1, were tested (Fig. 5). The best performance occurred at the speed of 0.5 mm s−1. The recoveries decreased at higher or lower speeds. Lower speed resulted in broader peaks and caused an unstable peak shape, while a higher speed induced insufficient ionization on each sample. Thus, the speed of 0.5 mm s−1 was adopted in the current analysis.
Table 2Linear range and LOD/LOQ for the four selected PAEs spiked on glass rods.

∗ The lower limit of linear ranges was elevated for DiBP due to its high background levels in the indoor air of the analytical lab.
Table 3Interday and intraday repeatability for the four investigated PAEs.
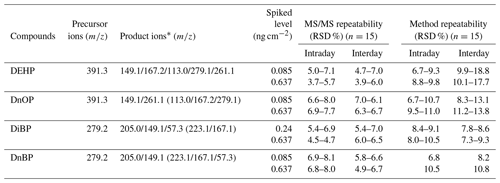
∗ The signal intensities of these product ions in the parentheses were below 8 % of the highest detected signal intensity; thus, these ions were excluded in the calculation of instrument repeatability and method repeatability.
3.3 Method evaluation using spiked samples
3.3.1 Calibration curves
As shown in Table 2, calibration curves were obtained at five surface concentrations ranging from 0 to 1.20 ng cm−2 for DEHP and DnOP and 0 to 0.85 ng cm−2 for DiBP and DnBP. Calibration curves were linear over the spiked range with the four PAEs with correlation coefficients over 0.98 (Table S2). A higher surface concentration could lead to the saturation of signals of some ion pairs such as 391.3/149.1 for DEHP and DnOP. The limits of detection (LOD) and limits of quantification (LOQ) for individual PAEs were calculated based on 3 and 10 times the signal-to-noise (peak to peak) ratio, respectively, using their quantitative ion pairs at the lowest standard concentrations. The noise levels were determined from baseline measurement taken between sample measurements during the movement of the sample holder (i.e., measurements between signal spikes, as shown in Fig. S2), and these noise levels are largely influenced by the composition of the laboratory air. As shown in Table 2, The LOQ of DEHP was 0.042 ng cm−2. Compared to the reported DEHP concentration in indoor surface film, e.g., ∼ 0.13 ng cm−2 (summer) or ∼ 0.37 ng cm−2 (winter) after the initial 7 d of growth (Huo et al., 2016), the LOQ was several times lower. The implication is that this method might allow for tracking changes in the DEHP concentration during the growth of surface film in the time resolution of 1 to several days. The LOQs of DiBP and DnBP were 0.24 and 0.085 ng cm−2, respectively. The substantially higher LOQ of DiBP compared to other tested phthalates is mainly due to elevated concentration of DiBP in the laboratory air, leading to larger baseline noise of DiBP.
3.3.2 Repeatability
To determine the instrument and the methodology repeatability, measurements at two spiked levels were repeated three times a day (n=15) and on 3 consecutive days for individual tested phthalates (n=15). Precision was calculated as the relative standard deviation (RSD, %) for intraday and interday repetitions. As shown in Table 3, for MS/MS alone, the intraday RSD ranged from 3.7 % to 8.1 % for four PAEs, while the interday RSD ranged from 3.9 % to 7.0 %. The method repeatability (using DART-MS/MS as a whole) was inferior to the MS/MS repeatability for all compounds but to a reasonable extent. The intraday RSD ranged from 6.7 % to 11.0 %, and the interday RSD ranged from 7.3 % to 18.8 %. The RSDs of MS/MS repeatability tests were around 74 % (±21 %) of those in method repeatability tests, which reveals that the method instability herein mainly rose from the fluctuations in MS/MS instead of the DART source, in particular for DnBP and DiBP. The obtained method RSD in this study is significantly lower than that in previous studies, which indicated 20 % (Zhou et al., 2016) and 115 % (Morlock and Ueda, 2007) for intraday.
3.3.3 Separation of isomeric compounds using DART-MS/MS
Herein the concentrations of isomeric PAEs were estimated based on different product ion patterns of isomeric PAEs using the following linear system of equations:
where R is a column vector of acquired responses of product ions, S is a matrix of the product ion sensitivities of isomeric PAEs which were obtained through calibration presented earlier, and C is a column vector of concentrations of isomeric PAEs. In the case that the number of product ions is greater than the number of isomeric compounds, the above linear system is overdetermined, and a least square solution for concentration vector C is obtained. Herein only product ions with intensities greater than 8 % of the strongest product ion for at least one isomer were used for quantification. Among the product ions for each set of isomeric PAEs shown in Fig. 2, all five ions were used to separate DEHP and DnOP, while three ions ( 205.0, 149.1, and 57.3) were used to separate DiBP and DnBP.
To verify the accuracy of this separation method, spiked samples with different concentration ratios of isomeric pairs (1:1, 2:1, and 1:2) for DEHP/DnOP and DnBP/DiBP were prepared and analyzed using DART-MS/MS. Table 4 shows the obtained concentrations of the spiked mixed standards of PAE isomers. The results were close to the spiked concentrations with relative errors ranged from 0.8 % to 11.4 % for the four PAEs. This result suggests that the developed method effectively separates the mixture of isomers.
3.4 Application to real indoor surface film samples
The DART-MS/MS method developed was further assessed by analyzing film samples collected in a real indoor environment. In total, 10 clean glass rods were exposed simultaneously in an office for 60 d to allow growth of films on their surfaces. Table 5 summarizes the measurement results of the four concerned PAEs. DEHP, DiBP, and DnBP were detected in all samples, whereas DnOP was not detected. This result is consistent with some previous measurements of PAEs in indoor air (Takeuchi et al., 2014, 2018; Huang et al., 2021). A possible reason might be relatively low usage of DnOP in products in the office. After 60 d of growth, the mean concentration of DEHP in the surface film was 1.045 ng cm−2, which is comparable to the concentrations of ∼ 0.46 ng cm−2 (summer) or ∼ 1.89 ng cm−2 measured in window film after 60 d of growth in a university hall in Harbin, China (Huo et al., 2016). The mean concentrations of DnBP and DiBP were similar, which were 0.739 and 0.631 ng cm−2, respectively. The RSD among samples was 6.1 % for DEHP, 4.6 % for DnBP and 10.4 % for DiBP, indicating overall good repeatability of the collection and measurement method employed.
This study presents a sensitive DART-MS/MS method for the fast and accurate quantification of SVOCs in organic films without the need for pre-treatment. Compared to previously reported DART-MS methods, the approach developed herein offers substantially improved repeatability without the use of internal standards. In addition, by utilizing MS/MS analysis, separation of isomeric components within films becomes possible. Although the optimizations were specifically tailored for phthalates, they may be effectively applied to other SVOCs with similar vapor pressures. These advancements enhance the feasibility of using the DART-MS approach to study the dynamics of SVOCs in indoor surface films. However, there are still some limitations associated with this method. Due to the small sampling area (∼ 0.24 mm2), the film mass is hard to be measured gravimetrically, unlike traditional methods using ∼ 1 m2 surface wipe samples. Consequently, surface concentrations rather than volume concentrations are obtained. Furthermore, MS/MS analysis is suitable only for targeted analysis for a limited number of compounds, and maintaining time resolution might be challenging for an extensive list of targeted compounds.
All data can be provided by the authors upon request.
The supplement related to this article is available online at: https://doi.org/10.5194/amt-17-6415-2024-supplement.
The authors YZ and LH were responsible for the sample collection of the study. Data collection, data analysis, and the methodology development were led by YZ with the help of JT, under the supervision of YL and JZ. The algorithm for separating and evaluating the data of isomeric components was written by YZ and LH. The original draft of the paper was written by YZ and edited by YL, with input from the other co-authors.
The contact author has declared that none of the authors has any competing interests.
Publisher's note: Copernicus Publications remains neutral with regard to jurisdictional claims made in the text, published maps, institutional affiliations, or any other geographical representation in this paper. While Copernicus Publications makes every effort to include appropriate place names, the final responsibility lies with the authors.
This research has been supported by the National Natural Science Foundation of China (grant nos. 22376003 and 21976005) and the National Key Research and Development Program of China (grant no. 2023YFC3710100).
This paper was edited by Haichao Wang and reviewed by two anonymous referees.
Ault, A. P., Grassian, V. H., Carslaw, N., Collins, D. B., Destaillats, H., Donaldson, D. J., Farmer, D. K., Jimenez, J. L., McNeill, V. F., Morrison, G. C., O'Brien, R. E., Shiraiwa, M., Vance, M. E., Wells, J. R., and Xiong, W.: Indoor Surface Chemistry: Developing a Molecular Picture of Reactions on Indoor Interfaces, Chem, 6, 3203–3218, https://doi.org/10.1016/j.chempr.2020.08.023, 2020.
Bennett, D. H., Moran, R. E., Wu, X. M., Tulve, N. S., Clifton, M. S., Colon, M., Weathers, W., Sjodin, A., Jones, R., and Hertz-Picciotto, I.: Polybrominated diphenyl ether (PBDE) concentrations and resulting exposure in homes in California: relationships among passive air, surface wipe and dust concentrations, and temporal variability, Indoor Air, 25, 220–229, https://doi.org/10.1111/ina.12130, 2015.
Butt, C. M., Diamond, M. L., Truong, J., Ikonomou, M. G., and Ter Schure, A. F. H.: Spatial distribution of polybrominated diphenyl ethers in southern Ontario as measured in indoor and outdoor window organic films, Environ. Sci. Technol., 38, 724–731, https://doi.org/10.1021/es034670r, 2004.
Cetin, B. and Odabasi, M.: Polybrominated diphenyl ethers (PBDEs) in indoor and outdoor window organic films in Izmir, Turkey, J. Hazard. Mater., 185, 784–791, https://doi.org/10.1016/j.jhazmat.2010.09.089, 2011.
Cody, R. B., Laramée, J. A., and Durst, H. D.: Versatile New Ion Source for the Analysis of Materials in Open Air under Ambient Conditions, Anal. Chem., 77, 2297–2302, https://doi.org/10.1021/ac050162j, 2005.
Duigu, J. R., Ayoko, G. A., and Kokot, S.: The relationship between building characteristics and the chemical composition of surface films found on glass windows in Brisbane, Australia, Build. Environ., 44, 2228–2235, https://doi.org/10.1016/j.buildenv.2009.02.019, 2009.
Eichler, C. M. A., Cao, J. P., Isaacman-VanWertz, G., and Little, J. C.: Modeling the formation and growth of organic films on indoor surfaces, Indoor Air, 29, 17–29, https://doi.org/10.1111/ina.12518, 2019.
Feng, Y.-X., Feng, N.-X., Zeng, L.-J., Chen, X., Xiang, L., Li, Y.-W., Cai, Q.-Y., and Mo, C.-H.: Occurrence and human health risks of phthalates in indoor air of laboratories, Sci. Total Environ., 707, 135609, https://doi.org/10.1016/j.scitotenv.2019, 2020.
Gaspar, F. W., Castorina, R., Maddalena, R. L., Nishioka, M. G., McKone, T. E., and Bradman, A.: Phthalate exposure and risk assessment in california child care facilities, Environ. Sci. Technol., 48, 7593–7601, https://doi.org/10.1021/es501189t, 2014.
Habe, T. T. and Morlock, G. E.: Quantitative surface scanning by Direct Analysis in Real Time mass spectrometry, Rapid Commun. Mass Spectrom., 29, 474–484, https://doi.org/10.1002/rcm.7127, 2015.
Hayeck, N., Ravier, S., Gemayel, R., Gligorovski, S., Poulet, I., Maalouly, J., and Wortham, H.: Validation of direct analysis real time source/time-of-flight mass spectrometry for organophosphate quantitation on wafer surface, Talanta, 144, 1163–1170, https://doi.org/10.1016/j.talanta.2015.07.080, 2015.
Huang, C., Zhang, Y. J., Liu, L. Y., Wang, F., and Guo, Y.: Exposure to phthalates and correlations with phthalates in dust and air in South China homes, Sci. Total Environ., 782, 146806, https://doi.org/10.1016/j.scitotenv.2021.146806, 2021.
Huo, C. Y., Liu, L. Y., Zhang, Z. F., Ma, W. L., Song, W. W., Li, H. L., Li, W. L., Kannan, K., Wu, Y. K., Han, Y. M., Peng, Z. X., and Li, Y. F.: Phthalate esters in indoor window films in a northeastern chinese urban center: film growth and implications for human exposure, Environ. Sci. Technol., 50, 7743–7751, https://doi.org/10.1021/acs.est.5b06371, 2016.
Hussein, T., Paasonen, P., and Kulmala, M.: Activity pattern of a selected group of school occupants and their family members in Helsinki – Finland, Sci. Total Environ., 425, 289–292, https://doi.org/10.1016/j.scitotenv.2012.03.002, 2012.
Klepeis, N. E., Nelson, W. C., Ott, W. R., Robinson, J. P., Tsang, A. M., Switzer, P., Behar, J. V., Hern, S. C., and Engelmann, W. H.: The National Human Activity Pattern Survey (NHAPS): a resource for assessing exposure to environmental pollutants, J. Exposure Anal. Environ. Epidemiol., 11, 231–252, https://doi.org/10.1038/sj.jea.7500165, 2001.
Li, H. L., Liu, L. Y., Zhang, Z. F., Ma, W. L., Sverko, E., Zhang, Z., Song, W. W., Sun, Y., and Li, Y. F.: Semi-volatile organic compounds in infant homes: Levels, influence factors, partitioning, and implications for human exposure, Environ. Pollut., 251, 609–618, https://doi.org/10.1016/j.envpol.2019.05.048, 2019.
Li, J., Lin, T., Pan, S.-H., Xu, Y., Liu, X., Zhang, G., and Li, X.-D.: Carbonaceous matter and PBDEs on indoor/outdoor glass window surfaces in Guangzhou and Hong Kong, South China, Atmos. Environ., 44, 3254–3260, https://doi.org/10.1016/j.atmosenv.2010.05.057, 2010.
Li, Y., He, L., Xie, D., Zhao, A., Wang, L., Kreisberg, N. M., Jayne, J., and Liu, Y.: Strong temperature influence and indiscernible ventilation effect on dynamics of some semivolatile organic compounds in the indoor air of an office, Environ. Int., 165, 107305, https://doi.org/10.1016/j.envint.2022.107305, 2022.
Lim, C. Y. and Abbatt, J. P.: Chemical composition, spatial homogeneity, and growth of indoor surface films, Environ. Sci. Technol., 54, 14372–14379, https://doi.org/10.1021/acs.est.0c04163, 2020.
Liu, Q. T., Chen, R., McCarry, B. E., Diamond, M. L., and Bahavar, B.: Characterization of polar organic compounds in the organic film on indoor and outdoor glass windows, Environ. Sci. Technol., 37, 2340–2349, https://doi.org/10.1021/es020848i, 2003.
Lunderberg, D. M., Kristensen, K., Tian, Y., Arata, C., Misztal, P. K., Liu, Y., Kreisberg, N., Katz, E. F., DeCarlo, P. F., Patel, S., Vance, M. E., Nazaroff, W. W., and Goldstein, A. H.: Surface emissions modulate indoor SVOC concentrations through volatility-dependent partitioning, Environ. Sci. Technol., 54, 6751–6760, https://doi.org/10.1021/acs.est.0c00966, 2020.
Manuja, A., Ritchie, J., Buch, K., Wu, Y., Eichler, C. M. A., Little, J. C., and Marr, L. C.: Total surface area in indoor environments, Environ. Sci. Process. Imp., 21, 1384–1392, https://doi.org/10.1039/c9em00157c, 2019.
Morlock, G. and Ueda, Y.: New coupling of planar chromatography with direct analysis in real time mass spectrometry, J. Chromatogr. A, 1143, 243–251, https://doi.org/10.1016/j.chroma.2006.12.056, 2007.
Pan, S.-H., Li, J., Lin, T., Zhang, G., Li, X.-D., and Yin, H.: Polycyclic aromatic hydrocarbons on indoor/outdoor glass window surfaces in Guangzhou and Hong Kong, south China, Environ. Pollut., 169, 190–195, https://doi.org/10.1016/j.envpol.2012.03.015, 2012.
Pelletier, M., Bonvallot, N., Ramalho, O., Mandin, C., Wei, W. J., Raffy, G., Mercier, F., Blanchard, O., Le Bot, B., and Glorennec, P.: Indoor residential exposure to semivolatile organic compounds in France, Environ. Int., 109, 81–88, https://doi.org/10.1016/j.envint.2017.08.024, 2017.
Shi, S., Cao, J., Zhang, Y., and Zhao, B.: Emissions of phthalates from indoor flat materials in Chinese residences, Environ. Sci. Technol., 52, 13166–13173, https://doi.org/10.1021/acs.est.8b03580, 2018.
Takeuchi, S., Kojima, H., Saito, I., Jin, K., Kobayashi, S., Tanaka-Kagawa, T., and Jinno, H.: Detection of 34 plasticizers and 25 flame retardants in indoor air from houses in Sapporo, Japan, Sci. Total Environ., 491–492, 28–33, https://doi.org/10.1016/j.scitotenv.2014.04.011, 2014.
Takeuchi, S., Tanaka-Kagawa, T., Saito, I., Kojima, H., Jin, K., Satoh, M., Kobayashi, S., and Jinno, H.: Differential determination of plasticizers and organophosphorus flame retardants in residential indoor air in Japan, Environ. Sci. Pollut. Res. Int., 25, 7113–7120, https://doi.org/10.1007/s11356-015-4858-z, 2018.
Wang, P., Wang, S. L., and Fan, C. Q.: Atmospheric distribution of particulate- and gas-phase phthalic esters (PAEs) in a Metropolitan City, Nanjing, East China, Chemosphere, 72, 1567–1572, https://doi.org/10.1016/j.chemosphere.2008.04.032, 2008.
Weschler, C. J. and Nazaroff, W. W.: Semivolatile organic compounds in indoor environments, Atmos. Environ., 42, 9018–9040, https://doi.org/10.1016/j.atmosenv.2008.09.052, 2008.
Weschler, C. J. and Nazaroff, W. W.: SVOC partitioning between the gas phase and settled dust indoors, Atmos. Environ., 44, 3609–3620, https://doi.org/10.1016/j.atmosenv.2010.06.029, 2010.
Weschler, C. J. and Nazaroff, W. W.: Growth of organic films on indoor surfaces, Indoor Air, 27, 1101–1112, https://doi.org/10.1111/ina.12396, 2017.
Wu, Y. X., Eichler, C. M. A., Chen, S. Y., and Little, J. C.: Simple method to measure the vapor pressure of phthalates and their alternatives, Environ. Sci. Technol., 50, 10082–10088, https://doi.org/10.1021/acs.est.6b02643, 2016.
Zhou, S., Forbes, M. W., and Abbatt, J. P.: Application of direct analysis in real time-mass spectrometry (DART-MS) to the study of gas-surface heterogeneous reactions: focus on ozone and PAHs, Anal. Chem., 87, 4733–4740, https://doi.org/10.1021/ac504722z, 2015.
Zhou, S., Forbes, M. W., Katrib, Y., and Abbatt, J. P. D.: Rapid Oxidation of Skin Oil by Ozone, Environ. Sci. Technol. Lett., 3, 170–174, https://doi.org/10.1021/acs.estlett.6b00086, 2016.


