the Creative Commons Attribution 4.0 License.
the Creative Commons Attribution 4.0 License.
Performance evaluation of an online monitor based on X-ray fluorescence for detecting elemental concentrations in ambient particulate matter
Céline Lett
Andreas Krein
Erika Matsumoto Kawaguchi
Jürgen Junk
Knowledge of the chemical composition of particulate matter (PM) is essential for understanding its source distribution, identifying potential health impacts of toxic elements, and developing efficient air pollution abatement strategies. Traditional methods for analysing PM composition, such as collection on filter substrates and subsequent offline analysis with, for example, inductively coupled plasma mass spectrometry (ICP-MS), are time-consuming and prone to measurement errors due to multiple preparation steps. Emerging near-real-time techniques based on non-destructive energy dispersive X-ray fluorescence (EDXRF) offer advantages for continuous monitoring and source apportionment.
This study characterizes the Horiba PX-375 EDXRF monitor by applying a straightforward performance evaluation including (a) limit of detection (LoD), (b) identification and quantification of uncertainty sources, and (c) investigation and comparison of measurement results from three contrasting sites in Luxembourg (urban, semi-urban, rural). We used multi-element reference materials (ME-RMs) from UC Davis for calibration and performed measurements during spring and summer 2023. The LoDs for toxic elements like Ni, Cu, Zn, and Pb were below 3 ng m−3 at 1 h time resolution. Higher LoDs were observed for lighter elements (e.g. Al, Si, S, K, Ca). Expanded uncertainties ranged between 5 % and 25 % for elemental concentrations above 20 ng m−3 and were maximal for concentrations below 10 ng m−3, reaching 60 %–85 %. Elemental analysis revealed S and mineral elements (Fe, Si, Ca, Al) as dominant contributors to PM10. Although the PM mass contribution of toxic trace elements (e.g. Zn, Cu, As) was generally very low, they were found to be enriched at the urban site Belvaux and the semi-urban site Remich compared to the more rural site Vianden. Our results explained on average 51 %–74 % of the gravimetric PM10 mass at the three sites. The study highlights the suitability and importance of the continuous PX-375 particle monitor for future air quality monitoring and source apportionment studies, particularly under changing emission scenarios and air pollution abatement strategies.
- Article
(7730 KB) - Full-text XML
- BibTeX
- EndNote
Airborne particulate matter (PM) is composed of chemical species such as sulfate, nitrate, and ammonium (SNA); sea salt; mineral compounds; trace metals; organic carbon (OC); and elemental carbon (EC). Particle chemical composition is typically determined by measuring SNA, sea salt content, OC, and EC (Lee and Allen, 2012) but often does not include trace and major elements, which are metals, metalloids, or non-metals. Some trace elements are considered toxic for humans under prevailing high exposure levels (e.g. Pb, Zn, Ni, Cr, As) (Briffa et al., 2020), although EU annual limit values only exist for Pb (0.5 µg m−3) (EU Directive 2008/50/EC, currently under revision) and annual target values only exist for Ni (20 ng m−3) and As (6 ng m−3) (EU Directive 2004/107/EC). Redox active trace metals (e.g. Cu, Zn, Ni, Fe) may be particularly harmful as they can lead to the generation of reactive oxygen species and subsequent inflammation and oxidative stress (Pant et al., 2015; Daellenbach et al., 2020; Charrier and Anastasio, 2012). Such exposures that mainly originate from tyre and brake wear of heavy exhaust and non-exhaust vehicles can cause serious health problems and ecosystem damages (Baensch-Baltruschat et al., 2020; Beddows and Harrison, 2021; Al Mamun et al., 2020). Under future emission reduction scenarios and more sustainable agricultural practices (e.g. according to the EU Zero Pollution Action Plan), a decline of the role of SNA in the particle chemical composition is expected. For instance, the European inorganic aerosol pollution load is currently dominated by NH4NO3 particles (Tang et al., 2021), which will likely decrease with the application of efficient NH3 emission reduction strategies (Guo et al., 2018). In particular, natural dust (e.g. composed of the mineral elements Al, Si, Fe, and Ca) is expected to play a key role for the non-anthropogenic PM2.5 composition and associated health effects under future air pollution abatement scenarios (Pai et al., 2022). Future prolonged drought periods and increased aridity in some regions accompanied by extremely dry soils will enhance wind-blown mineral dust emissions (Achakulwisut et al., 2019; Büntgen et al., 2021). Additionally, frequent pyrogenic emissions from wildfires, prescribed burns, and agricultural burning will contribute more strongly to the atmospheric aerosol burden (Pai et al., 2022). Resuspension from road dust contributes to the urban PM composition (Maenhaut et al., 2005).
The discontinuous collection on filters and analysis of PM samples using techniques such as inductively coupled plasma mass spectrometry (ICP-MS), inductively coupled plasma optical emission spectrometry (ICP-OES), particle-induced X-ray emission spectrometry (PIXE), and X-ray fluorescence spectrometry (XRF) suffer from several disadvantages, such as high human cost and time, delivering compositional information with a considerable time delay and at low temporal resolution (Tremper et al., 2018), and subsequent difficulties in the analysis of diurnal variations and extreme values. The most common analytical method for discontinuous sampling is ICP-MS, with the primary drawback being the requirement for sample solubilization, whose effectiveness also depends on the composition of the PM, thereby reducing the representativeness of the sample to be analysed, especially for critical elements to be dissolved, such as Ti, Cr, and Al (Celo et al., 2010). However, recent works demonstrated the capability of ICP-MS for online analysis of PM (Ji et al., 2022). Emerging real-time techniques such as laser-induced breakdown spectroscopy allow for detailed physicochemical characteristics of individual particles, providing information on formation mechanisms and fates of atmospheric particles, although mass concentrations cannot be determined with these techniques (Heikkilä et al., 2024).
Energy dispersive X-ray fluorescence (EDXRF) is a state-of-the-art and green-analytical chemistry method to perform multi-element analysis of airborne PM (Bilo et al., 2024). The method is non-destructive, does not require any sample preparation and use of toxic solvents, and is not affected by the molecular or atomic structure of the elements (Hyslop et al., 2019). The recent technical advancement of EDXRF methods and the increase in detector sensitivities nowadays allow measurements with high temporal resolution for ambient dust monitoring (Furger et al., 2017; Tremper et al., 2018; Asano et al., 2017). The importance of these near-real-time EDXRF methods is currently underrated but will increase in the future as the relevance of spatio-temporal variability assessments and source apportionment studies will likely increase due to the changing chemical particle composition. Currently, two continuous EDXRF online instruments exist, the Xact 625 ambient metal monitor (Sailbri Cooper, Inc., US) (Park et al., 2014) and the PX-375 continuous particulate monitor (Horiba, Japan) (Asano et al., 2017). Only a few studies have performed online measurements of particulate element mass concentrations up to now. For instance, the Xact 625 was tested at a rural traffic-influenced site in Switzerland for 3 weeks in summer 2015 (Furger et al., 2017). In addition, it was evaluated at three contrasting sites (traffic, urban background, and industrial) in the UK for several months in 2014, 2015, and 2017 (Tremper et al., 2018). The Horiba PX-375 monitor was deployed in Poland near a moderately inhabited rural area (∼ 1000 inhabitants) for 1 month in summer 2018 (Mach et al., 2021). Creamean et al. (2016) used the Horiba PX-375 for the characterization of particles originating from long-range transport of mineral dust and smoke from forest and grassland fires in the Pacific Northwest to Colorado, US, for 1 week in late summer 2015. Source apportionment of trace elements in PM2.5 was performed using the Horiba PX-375 between April 2014 and April 2015 at five different sites in Beijing (Li et al., 2017). However, in contrast to studies using the Xact 625 (Tremper et al., 2018; Furger et al., 2017), none of the previous studies with the Horiba PX-375 monitor include a rigorous quality control and uncertainty estimation. The detected metals, metalloids, or non-metals can be used as tracers to identify specific anthropogenic and natural pollution sources and associated health risks (Li et al., 2017; Park et al., 2014), and a reliable uncertainty estimation provides the basis for source apportionment. A major challenge for these online EDXRF methods is the availability of accurate multi-element reference materials (ME-RMs) for instrument calibration (Bilo et al., 2024). While the suitable Standard Reference Material from the National Institute of Standards and Technology (NIST) was discontinued, the UC Davis (UCD) Air Quality Research Centre now produces multi-element reference materials with mass loadings corresponding to the range of atmospheric concentrations (Yatkin et al., 2018). Motivated by the need for a detailed performance evaluation of the Horiba PX-375, the four scientific objectives of this paper are (a) to investigate the limit of detection (LoD) under real environmental conditions, (b) to identify and quantify the uncertainty sources of the PX-375, (c) to evaluate the measurement results collected during spring and summer at three contrasting locations in Luxembourg (rural, semi-urban, and urban), and (d) to assess the contribution of detected elements to the total PM10.
2.1 Measurement campaigns
With the help of the mobile air quality laboratory (environmental measurement vehicle, EMV) of LIST (Trebs et al., 2023), an elemental analysis of airborne PM10 was conducted at three different locations in Luxembourg (rural, semi-urban, and urban) in 2023 (Table 1, Fig. 1). The measurements took place next to the LIST institute building at Belvaux, which is located next to Belval – a district in the southwestern part of Luxembourg (west of Esch-sur-Alzette). The surrounding area includes a mix of residential, commercial, and industrial zones (with steel plants and open slag dump sites in distances of 1–5 km). The EMV was located at the roadside of a parking area. The second location was at the Institut Viti-Vinicole (IVV) in Remich situated in the southeastern part of Luxembourg, within the commune of Remich. The IVV is located within vineyards along the Moselle River. The third sampling location was in the northern part of Luxembourg, situated near the Vianden water reservoir in the Ardennes region, with the surroundings dominated by agriculture. Compared to permanent air quality stations the EMV offers an attractive alternative to enhance the spatial and temporal resolution of ambient measurements and identify specific pollution sources. The vehicle is equipped with an X-ray fluorescence analyser (PX-375 Horiba, Japan) (Asano et al., 2017) that was carefully tested, calibrated, and quality-controlled prior to, during, and after the field campaigns. Standard meteorological measurements such as air temperature and humidity (3 m), wind speed, and wind direction (6 m) were measured at each location. Simultaneously, PM1.0, PM2.5, and PM10 data were collected with an optical particle counter (GRIMM Aerosol Technik EDM 180-F, Ainring, Germany) with a time resolution of 1 min at a height of 3 m. These data were averaged and aggregated to match the time resolution of the PX-375.
Table 1Overview of sampling locations, periods, and site characteristics for the measurements with the Horiba PX-375 in Luxembourg.

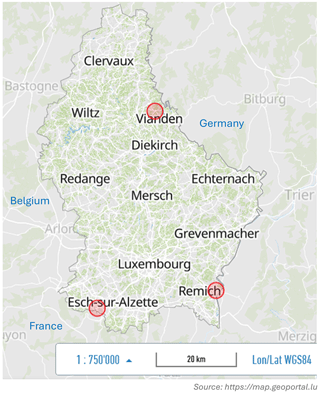
Figure 1Map of Luxembourg showing the three different sampling locations (Belvaux near Esch-sur-Alzette, Remich, and Vianden; map taken from https://map.geoportal.lu, last access: 15 October 2024).
2.2 Instrument description
The PX-375 was configured to measure ambient concentrations of 15 trace elements in particulate matter (PM10), namely Fe, Al, Si, Ca, S, Mn, Zn, K, Ti, V, Cr, Ni, Cu, Pb, and As. Air was sampled at a flow rate of 16.7 L min−1 through a PM10 inlet (manufactured by Met One Instruments, Inc.) at a height of 3 m. The inlet is always heated when ambient temperatures are below 40 °C. The time resolution can be adjusted from 30 min to 24 h and was set to 120 min (Belvaux, Remich) and 180 min (Vianden). Although the instrument can measure at a lower time resolution, these values were chosen because relatively low PM10 levels were expected and increased sampling time decreases LoDs. The online PX-375 monitor applies reel-to-reel filter tape sampling with a none-woven PTFE fabric filter, and the spot tape interval was set to 100 mm. Non-destructive EDXRF analysis is applied to determine the element concentrations. X-ray pulses are produced with an X-ray tube at two different incident photon energy levels directed at the sample (15 and 50 kV, automatic switching). Elements are quantified accounting for the conditions of the detector and its surroundings (air path and window thickness). When the energy is assigned to the horizontal axis and the pulse counts to the vertical axis, the values obtained by the multi-channel analyser are shown as a spectrum on the LCD. The constituent elements are identified by the peak positions on the spectrum and quantitatively analysed by the peak height. The analysis time was set to 500 s for each energy level. The total PM10 mass concentration of each sample is determined with beta-ray attenuation. The next sample is collected on a clean spot of the filter tape while the analyses are performed. The EDXRF unit contains a complementary metal–oxide–semiconductor (CMOS) camera for sample images, allowing the user to control the accurate alignment of the filter tape such that the particle deposition spot (diameter of 11.5 mm) is exposed to X-ray irradiation (collimator size is 7 mm). Hence, the manufacturer specifies an acceptable spot diameter tolerance of ± 2 mm.
2.3 Quality control procedures
To assure measurement quality, X-ray intensity checks, energy calibrations, and blank tests were performed after each filter tape replacement. Additionally, the EDXRF unit was initially calibrated using a blank filter tape and a traceable Standard Reference Material (SRM-2783) from NIST. However, as this SRM was outdated and the product was discontinued, we re-evaluated the NIST calibration using two freshly produced multi-element reference materials (ME-RMs) from the UC Davis Air Quality Research Centre (UCD-47-MTL-ME-233 and UCD-47-MTL-ME-234) with different element loadings (Hyslop et al., 2019; Yatkin et al., 2018). The calibration curves were derived by plotting the detected blanks and elemental loadings of the UCD standards (ME-233, ME-234) versus the instrument response (intensity x0) for each element. From the resulting scatter plots with three data points, linear regression analysis was used to obtain the equation to derive the air concentration of the samples (mass scaled with sample spot area and sampled air volume). Quality control of the calibration was performed by monthly check standard procedures using the blank filter tape and a reference material, measuring three replicates each time. Additionally, a Type A evaluation of uncertainty (GUM, 2008) was conducted by a check standard procedure including three sequential measurement series (each with n=10) of both ME-RMs from UCD and deriving the standard deviation (precision) and bias for each element.
The accurate alignment of the filter tape was checked by manual inspection of the images of the CMOS camera and ensuring that the sample spot deviation is within ±2 mm. Samples with a deviation of the deposition spot from the X-ray irradiation position larger than ±2 mm were flagged and treated independently in the uncertainty estimation (see Sect. 3.1.4).
2.4 Determination of the limit of detection (LoD)
The limit of detection (LoD) reflects the precision of the instrument response when the concentration of the analyte is zero (IUPAC, 1997). This comprises the detection capability (sensitivity and selectivity) of the detector system, and the variability of the system under realistic conditions (including filter tape background). The LoD for each element was calculated based on the conventional definition (Kellner et al., 2004; IUPAC, 1997):
with μb the arithmetic mean and σb the standard deviation of the intensity signal of the blank measurements. We measured the same blank spot 10 times, moved the filter tape, and measured the new spot 10 times (in total three sets with n=10 each). The σb is calculated from the average of 3 standard deviations (n=3), one from each set of 10 blank analyses. The concentration at the LoD (cLoD) is then calculated from the analytical sensitivity (slope) of the calibration curve:
All data points below the LoD were set to the respective LoD value for each element.
2.5 Uncertainty estimation
For the estimation of the expanded measurement uncertainty, we follow the Guide to the expression of uncertainty in measurement (GUM, 2008). The GUM procedures rely on the assumption that ideally all systematic errors (biases) have been corrected. The Type A evaluation derives the standard uncertainty by calculating the standard deviation of the mean of a series of independent observations (time-dependent sources of random error) based on check standard measurements (see Sect. 2.3). The Type B evaluation for the PX-375 includes the uncertainty of the ME-RMs provided by the UCD and possible geometry misalignments in the instrument (deviation of the particle deposition spot from the X-ray irradiation position). According to GUM (2008) the combined standard uncertainty for error sources that are independent from each other is derived by the root sum square of the Type A and Type B standard uncertainties. The coverage factor k=1.96 (95 % confidence level) is used as a multiplier of the combined standard uncertainty to obtain the expanded uncertainty for each element:
where σi is the standard uncertainty to detect the mass of the ith element (Type A uncertainty), expressed as standard deviation calculated from the average of 3 standard deviations (n=3), one from each set of 10 check standard analyses; urm is the standard uncertainty of the reference material (Type B uncertainty) (Yatkin et al., 2018); and uspot is the spot uncertainty in case of misalignment of the filter tape with the X-ray irradiation beam (Type B uncertainty). The standard uncertainty of the reference material urm is derived by dividing the expanded uncertainty in the RM certificate by the applied coverage factor of 2 (Yatkin et al., 2018). The uspot was derived by assessing whether the spot deviation is larger than ±2 mm in each CMOS picture and by calculating the erroneous crescent area (see Sect. 3.1.4). This was done by assuming that the particle deposit on the filter tape is homogenous. The uncertainty of the airflow is uQ=0.2 L min−1 (1.2 %) and can be neglected.
3.1 Instrument characterization
3.1.1 Limit of detection (LoD)
The lowest LoD values (< 3 ng m−3 at 1 h time resolution) were found for the elements Ni, Cu, Zn, and Pb (Table 2). The LoDs of the light elements measured with the lower photon energy level of 15 kV (Al, Si, S, K, Ca) were the highest, with the maximal values found for Al (100 ng m−3) and the lowest values for Ca (6.8 ng m−3). From the elements measured with the higher photon energy level of 50 kV (Table 2) Fe showed the highest LoDs (8.7 ng m−3 at 1 h time resolution). During the blank measurements, no signal was detected for As.
Table 2Limit of detection (3σ definition) of air concentrations for the 15 elements detected by the PX-375 using three different time resolutions.
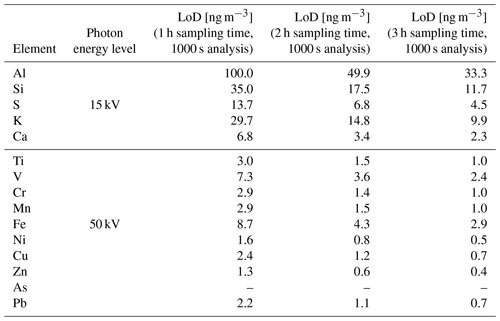
The higher LoDs for Si, K, and Fe can be explained by the presence of common contaminants in filter raw media or arising from EDXRF hardware (Hyslop et al., 2022). As some parts inside the PX-375 are made of Al, we expect that the high LoD values are due to marginal contamination during filter tape installation.
In general, the hourly LoDs for Pb, K, Ca, Fe, Zn, and Mn are comparable to those already presented for the PX-375 (Asano et al., 2017) (3σ definition), while our LoDs for Si and S are 2 to 3 times higher than in Asano et al. (2017) (see Table 2). Moreover, except for Ti and Zn, the hourly LoDs derived in this study are substantially higher than values presented in Creamean et al. (2016), which were provided by the manufacturer (Jessie M. Creamean, personal communication, 23 March 2023) and were thus not determined under real environmental conditions. In Creamean et al. (2016) the LoD values for Al were also maximal. Compared to the hourly LOD values of elements measured by the Xact 625 in Tremper et al. (2018) (3σ definition), our LoD value for Si is 2 times lower, while the LoDs of all other elements are higher than those of the Xact 625. However, it should be noted that the LoD values are not directly comparable as the concentrations of the reference material used for the calibration of the Xact 625 are very high (nearly 1000 times higher than for the PX-375) (Tremper et al., 2018).
3.1.2 Bias and accuracy
Systematic uncertainties are defined as non-random variations in the target variable that will decrease the accuracy of a measurement. Figure 2 shows the bias (relative average deviation) of the analysis result for each element for the two different UCD ME-RMs. The bias is below 5 % for the elements Ti, V, Cr, Mn, Fe, Ni, Cu, and Ca and is between 5 % and 25 % for the other elements, with largest deviations for the lighter elements (e.g. Al, Si, K). For most of the elements, the relative average deviation has a different direction for UCD #233 and UCD #234. This indicates that the observed differences are not systematic but part of the random uncertainty (Brown et al., 2010). While we consider differences below 5 % to be insignificant and captured by the random uncertainty, the large differences for Al, Si, and K are most likely related to the calibration procedure. Figure 3a illustrates the calibration curve for Fe showing a strong linear fit, while the calibration curve for K (Fig. 3b) reveals deficiency in linear fit performance. The residuals indicated by red arrows (+24 % for ME-233 and −5 % for ME-234) are comparable to the deviations found for K during the check standard procedure (Fig. 2), indicating a good reproducibility. The same was found for Al and Si, and we assume that this was related to uncertainty in element loadings of the RMs. We have included this in the Type B uncertainty (Sect. 3.1.4). Consequently, no systematic correction of the results was made.
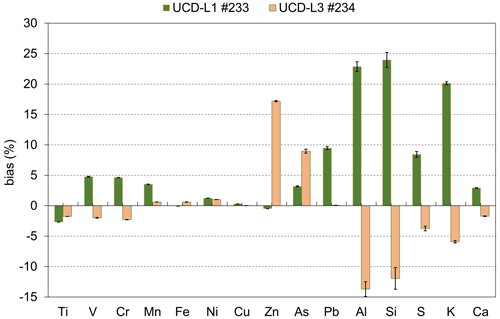
Figure 2Instrumental bias (relative average deviation) derived from 30 replicate check standard measurements using two different ME-RMs produced by UCD for 15 elements. Error bars denote the precision of the bias (see Fig. 4).
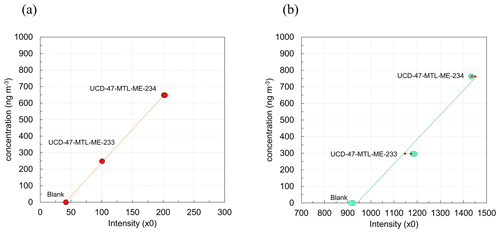
Figure 3Example calibration curves (a) for Fe showing a strong linear relationship (r2=0.99) and (b) for K indicating the deviation of the linear curve fit for the data points. Residuals in panel (b) are indicated by red arrows (+24 % for ME-233 and −5 % for ME-234); the standard error of the slope and intercept are 7 % and 10 %, respectively (r2=0.97). Instrument response data (intensity x0) are plotted on the x axis and elemental loadings (scaled with sample spot area and the sampled air volume) on the y axis because standard uncertainty of the ME-233 and ME-234 is larger than the precision (random variation) of the instrument (see text below).
In general, uncertainties are expected to be higher for elements with potential for line interferences in multi-element samples, as well as from self-absorption effects for the lightest elements (Si, S, K and Ca) (Furger et al., 2017). If a vacuum or helium purge is not used as in our case, the sensitivity of XRF decreases with lighter elements (Margui et al., 2022). Under these conditions, light elements generally have poor XRF sensitivity compared to transition metals (e.g. Cu) as they produce X-rays of lower energy. This is also revealed by their higher LoD values (Table 1).
3.1.3 Type A uncertainty (precision)
The standard uncertainty (precision as standard deviation divided by the mean of repeated measurement results) shown in Fig. 4 is below 4 % for all elements (except for Pb). The element loadings of ME-233 are about 2.6 times lower than for ME-234 and correspond to relatively low atmospheric concentrations typical for a rural or remote regions. Figure 4 reveals that analytic precision is slightly reduced with lower mass loadings (UCD-L1 #233) for several elements.
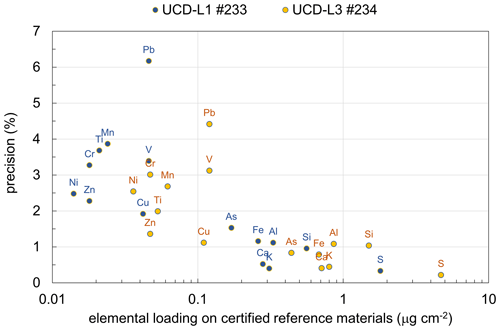
Figure 4Average relative precision (standard deviation divided by the mean) for 15 elements derived from 30 replicate check standard measurements as a function of the elemental loadings of the two different ME-RMs produced by UCD.
Relative precision for Fe, Al, Si, S, K, and Ca was highest because their absolute RM element loadings were at least a factor of 10 higher than for the other elements (Fig. 4), which is consistent with their expected higher atmospheric concentrations. As standard uncertainty σi for the Type A uncertainty estimation (Eq. 3) we have used the average absolute precision for both RMs.
3.1.4 Type B uncertainty
According to the ME-RM certificates all elements have an expanded uncertainty of 10 %, while 20 % was reported only for Ti, As, and Si. These expanded uncertainties were converted into standard uncertainties (urm) and included in Eq. (3). As we additionally found potential uncertainties of the calibration curve of around 20 % for Al and K that were identified as non-systematic (Fig. 3), we increased the Type B RM uncertainty that can also be classified as calibration uncertainty for these two elements to 20 % (see Sect. 3.1.2). The identification of samples for which the deposition spot is outside of specified limit by the manufacturer was done manually (Fig. 5).
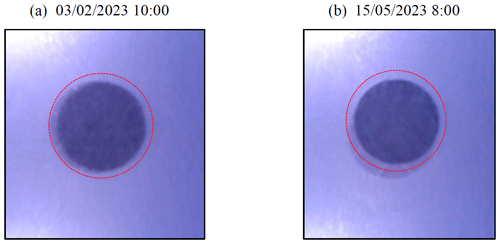
Figure 5Sample images of the CMOS camera showing the deviation of the particle deposition spot from the analysis area. The diameter of the spot is 11.5 mm. Collimator size is 7 mm and corresponds to the X-ray exposure spot size. The thin circle around the area indicates a deviation of 1 mm (2 mm is allowed by the manufacturer). Shown are the (a) deposition spot well within the specified limit and (b) deposition spot near the edge of the specified limit, indicating a deviation within the error margin of 2 mm.
Ideally, this procedure should be done with an automatic image detection and machine learning approach, which is, however, outside the scope of this paper. During all three measurement campaigns, only 1 % of the images were flagged to be outside of the manufacturer limit due to a small misalignment of the filter tape with the X-ray irradiation beam. The erroneous crescent area was calculated for each sample according to standard formulas using the erroneous distance of both circle centres. The determined Type B uncertainty (uspot) caused by this minor instrument misalignment is about 2 % and can be neglected in the expanded uncertainty calculations. This result was achieved due to the careful filter tape position adjustment after replacing the filter tape and when we noticed that the deposition spot deviated from the X-ray irradiator. In previous campaigns before making instrument adjustments the erroneous crescent area was observed to be much larger. If this quality assurance is not performed regularly, we estimate that the Type B uncertainty (uspot) can increase to 20 %.
3.2 Comparison of NIST and UCD reference materials
The PX-375 was initially calibrated with an outdated NIST SRM (Sect. 2.3). Before re-calibration with the two ME-RMs from UCD, we conducted a check standard procedure with the initial NIST SRM calibration to test the agreement between UCD and NIST standards (Table 3).
Table 3Relative differences (average of three values) between measured element loadings of the UCD ME-RMs using the initial calibration with the NIST standard.
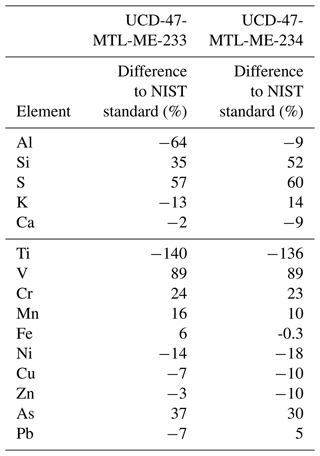
It should be noted that loadings of the NIST standard and UCD standards are different for most elements. NIST loadings were sometimes outside the range of corresponding air concentrations (and quite different to those of UCD), especially for Fe (very high) and S (very low). Although the instrument response is linear, using very low standard materials (as in the case of S for the NIST SRM), may introduce uncertainty for higher concentrations. Furthermore, standards that are much higher in concentration than air samples are a limitation (Tremper et al., 2018). We found substantial differences (30 %–140 %) between NIST and UCD standards for six elements: Ti, V, As, Al, Si, and S (Table 3). Reasonable agreement was found for all other elements (< 18 %), with best agreement for Fe, Zn, and Ca (< 10 %). Obviously, ageing of the NIST standard may have contributed to this discrepancy. However, the results show the potential drawbacks introduced by using different reference materials and underline the need for universally recognized and certified reference materials (Bilo et al., 2024).
3.3 Results of the monitoring campaigns with the EMV
The mean PM10 concentrations during our campaigns are listed in Table 4.
Table 4Mean PM10 concentrations for the three different campaigns in Luxembourg during spring and summer 2023.

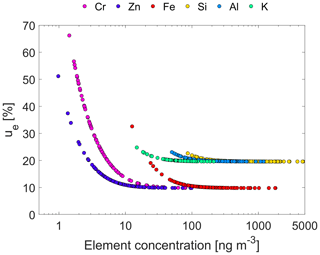
Figure 6Relative expanded uncertainty (ue) of the PX-375 exemplarily for Cr, Zn, Fe, Si, Al, and K as a function of the element concentration measured during the Remich field campaign in Luxembourg in 2023 (the scale of x axis is logarithmic; the time resolution of the instrument was 2 h).
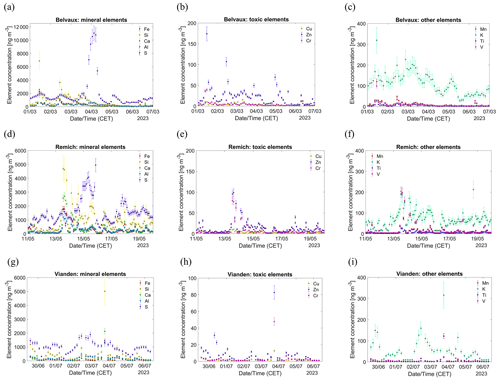
Figure 7Measured time series of MAEs, HAEs, and OEs by the PX-375 during the three field campaigns at (a–c) Belvaux, (d–f) Remich, and (g–i) Vianden in Luxembourg during spring and summer 2023. The error bars denote expanded measurement uncertainties derived for each data point.
The comparability between Grimm EDM and PX-375 is within 10 % at Remich and Vianden, but at Belvaux the difference in mean PM10 between the two instruments was nearly 40 %, with substantially higher values for the Grimm EDM. In contrast to Remich and Vianden, Belvaux was characterized by frequent fresh pollution peaks from cars passing the parking area next to the sampling location. Potentially, the contrasting temporal PM patterns between the sites have caused the different instrument performance, which will be subject to further investigation.
For consistency, the contributions to the gravimetric PM10 mass were calculated based on results from the PX-375 only. The 15 measured elements were subdivided into three different groups:
-
mineral airborne elements (MAEs) including sulfur – Fe, Si, Ca, Al, and S;
-
hazardous airborne elements (HAEs) – Cu, Zn, Cr, As, Ni, and Pb;
-
other elements (OEs) – Mn, K, Ti, and V.
The toxic elements As, Ni, and Pb were often below the LoD and will be excluded in detailed evaluations. Also, the concentrations of Ti and V were very low.
Table 6Average relative contribution of minor trace elements to the total of analysed elements by the PX-375 combined for the three sites Belvaux, Remich, and Vianden.

Table 7Enrichment of minor (mainly toxic) elements at the urban site Belvaux and the semi-urban site Remich compared to the rural site Vianden.

3.3.1 Measured time series with expanded uncertainties
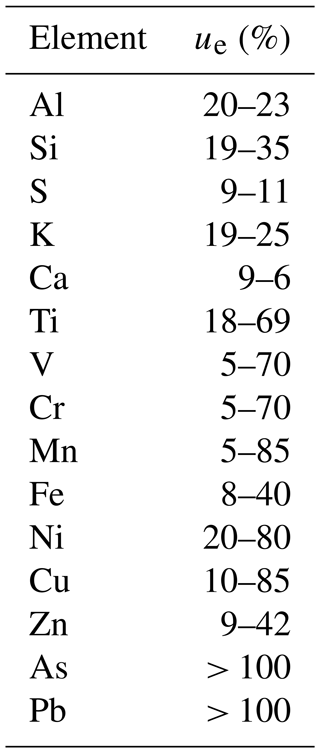
The ranges of the relative expanded uncertainties (ue) of the 15 elements are shown in Table 5. The lowest relative ue values were determined for the elements with the highest ambient concentrations and the lowest Type B uncertainty (e.g. S and Ca). Elements with a higher uncertainty of the ME-RM showed minimal ue values of 18 % (e.g. Ti, Al, Si, K) (Sect. 3.1.4). For the other elements, the lowest determined ue values were 5 % (e.g. Cr and Mn) and 9 % (e.g. Fe, Zn). The maximal relative ue values in each group were due to prevailing extremely low concentrations. Figure 6 shows the dependency of the relative ue on the measured concentration exemplarily for five elements. The ue values strongly increase towards lower concentrations (< 10 ng m−3), which is particularly obvious for Cr and Zn, reaching 50 % to 70 % when approaching the LoD. The overall ue differences for the elements also apparent at higher concentrations (e.g. for K and Si) are due to their enhanced Type B uncertainties.
Figure 7 illustrates the results of the three campaigns, including expanded measurement uncertainties during spring and summer 2023. S, Zn, and K were the most ubiquitous elements identified for MAE, HAE, and OE groups, respectively. Concentrations of the mineral elements Fe, Al, Si, and Ca were also elevated at all locations and were at least a factor of 10 higher than toxic and other elements. S was the most ubiquitous element in our study, and despite the relatively short measurement period the median PM10 concentration of S at the different sites in our study (1190 ng m−3) is in agreement with the median PM10 of 1150 ng m−3 reported for Europe (Al Mamun et al., 2020). They also report that among major metals/metalloids and MAEs, S has the highest median concentration in PM10, which is in line with our study. The increase/decrease in MAEs with wind speed is a typical pattern (Al Mamun et al., 2020; Tasdemir et al., 2006), and increased MAE values were observed under dry conditions when crustal emissions and resuspension from road dust dominate. For some elements, such as K and S, the origin can be anthropogenic (biomass, plant residues) combustion processes, fertilizer application (relevant for vineyards), and crustal erosion, which implies that the diurnal variations can be influenced by mixed source contributions. Concentrations of toxic metals/metalloids (Cu, Zn, and Cr) reveal very low concentrations at all locations (Fig. 7), and the concentration levels of As, Pb, and Ni were mostly below the LoD (not shown). A very recent study of Liu et al. (2024) analysed pan-European results of several trace elements in PM10 and found comparable concentrations for Cu, Zn, and Cr but substantially higher levels of Ti and Pb compared to our study, although the results are not directly comparable due to the different measurement periods and time resolutions.
The only study in Europe that used the PX-375 was conducted at an urban site in Poland (Mach et al., 2021), where the mean PM10 concentration (20.8 µg m−3) was comparable to the urban site Belvaux in our study. However, their results for the elements were contrasting because the concentration of minerals (Fe, Si, and Ca) originating from soil-borne or resuspended roadside dust was lower, while some of the toxic elements (As, Cu, and Ni) were substantially higher than at Belvaux.
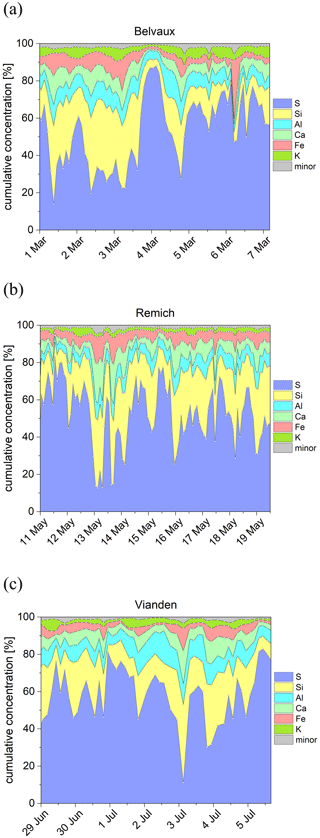
Figure 8Relative cumulative elemental concentrations (stacked) indicating the contribution of analysed elements by the PX-375 during the three field campaigns at (a) Belvaux, (b) Remich, and (c) Vianden in Luxembourg during spring and summer 2023. “Minor” refers to elements listed in Table 6.
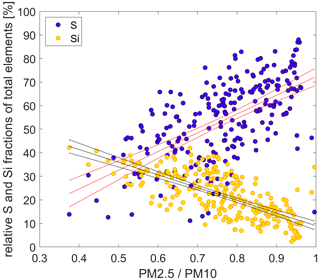
Figure 9Relative S and Si fractions of the analysed elements by the PX-375 versus the ratio (measured with the Grimm EDM 180-F) combined for the three field campaigns at Belvaux, Remich, and Vianden in Luxembourg during spring and summer 2023. Included are linear fits with 95 % confidence bounds (red lines for S and black lines for Si).
3.3.2 Relative contribution of elements
The contribution of the mean detected element concentrations was clearly dominated by S and MAEs (Fig. 8). The largest fraction of the determined mass at all three locations was attributed to S and is mostly associated with particulate sulfate. From all determined elements, S occasionally contributed 80 % (4 March, Belvaux, and 5 July, Vianden), but its contribution also sometimes decreased down to 20 % (13 May, Remich). The second largest fraction was contributed by Si, followed by Al, Ca, Fe, and K and the sum of minor (mainly toxic) elements (Table 6) (Fig. 8). Overall, the elemental contribution to the chemical particle composition was comparable at the three different sites. Some elements, such as Fe, Mn, and K, can be both of crustal origin and of anthropogenic origin (Fomba et al., 2018). For the minor (mainly toxic) elements, Table 6 shows that their sum contributed on average less than 2 % to the total of analysed elements, which indicates a low mass contribution of non-exhaust traffic emissions. V, Mn, and Zn account for the largest fraction of the analysed minor elements. Despite the low mass contribution of toxic trace elements like Zn and Cu to the overall PM mass, their role in enhancing particle oxidation potential (Molina et al., 2023) can lead to severe health effects under chronic exposure.
The element contributions represent a complex mix of the geographical origin of emission sources and meteorological conditions, and the wind direction measured at a receptor site is not necessarily representative of the air mass origin and the source distributions (Petit et al., 2017). Additionally, the chemical source profile (i.e. percentage of species with respect to total gravimetric PM mass) varies with location and depends on parameters such as traffic (volume and pattern, fleet characteristics), road surface characteristics, and the geology and climate of the region (Pant et al., 2015). Table 7 shows the enrichment of toxic trace elements at the urban site Belvaux and the semi-urban site Remich compared to the most rural site Vianden. Despite their low PM mass contribution, most minor (mainly toxic) elements had statistically significantly higher concentrations (t test, p<0.05) at Belvaux (except V, Cr, Mn) and Remich (except As) compared to Vianden. In particular, Zn, Cu, and Pb exhibited roadside enrichment at Belvaux and likely had a contribution from sources related to traffic emissions. The enrichment of As at Belvaux is probably due to emission from the steel industry. However, it should be considered that measurements at the different locations were not made simultaneously, and local meteorology and temporal traffic intensity can influence these results.
Figure 9 illustrates that the relative fraction of elemental S increased with the ratio since most S is attributed to SO in finer particles related to combustion emissions (Fang et al., 2017). In contrast, the relative fraction of Si decreased with the ratio due to the fact that mineral elements such as Si are often found in the coarse-mode particles due to their high abundance in the crust, but they may also originate from construction activities or resuspended road dust (Maenhaut et al., 2005).
The correlations in Fig. 9 are stronger for Si (r2=0.5) than for S (r2=0.36) due to the likely presence of S also in crustal dust, i.e. in coarser particles (Maenhaut et al., 2005). The mobilization of metals (e.g. Cu, Fe) by acidification due to the presence of SO is likely to remain an important factor in future aerosol oxidation potential and the health effects studies of PM (Fang et al., 2017). It was also recently found that aerosol oxidative potential was correlated with the elements S, K, Fe, As, Zn, Ca, Mn, and Cu (Molina et al., 2023). The near-real-time determination of particulate Si is gaining more attention due to its role as a tracer to estimate the secondary aerosol contribution to PM2.5 (Lu et al., 2019) and to quantify primary and secondary particle sources (Yang et al., 2020). Si quantification with conventional ICP-MS methods involves the need for laborious and complex filter extraction or microwave acid digestion procedures (Yang et al., 2002; Bilo et al., 2024). Our results demonstrate that the PX-375 instrument constitutes a valuable and effective method to detect chemical aerosol properties and element contributions in near real time, although the measurement uncertainties will impact the source distribution determination of the elements. For instance, positive matrix factorization (PMF) solutions are influenced by random uncertainties in the measurement data even when the optimal weighting coefficients and number of factors are set (Chen et al., 2010; Christensen and Schauer, 2008).
3.3.3 Contribution to the gravimetric aerosol mass (PM10)
MAEs are largely associated with crustal matter originating from soil, resuspended roadside dust, and construction activities. The total gravimetric mass of crustal matter (CM) in the PM10 samples for the three sites is estimated as (Maenhaut et al., 2005)
CM accounted for 19 % in Belvaux, 31 % in Remich, and 15 % in Vianden to the total PM10 mass, revealing the preponderance of CM at the semi-urban Remich site. On one hand, this was related to some nearby construction activities but also due to soil emissions during cultivation of the vineyards under relatively dry conditions during the measurement campaign. Although the contribution of crustal matter to the PM10 mass in Remich was exceptionally high, the overall results are comparable to other studies (Fomba et al., 2018; Maenhaut et al., 2005). The fraction of CM in Vianden was relatively high compared to typical rural background sites (Schwarz et al., 2016), revealing that this rural site was exposed to anthropogenic emissions from agriculture and road dust resuspension under dry weather conditions.
We converted the detected average concentrations to gravimetric contributions from brake wear (7.5 [Cu]) and tyre wear (35 [Zn]) (Fomba et al., 2018), resulting in values below 1 % for all three sites, with the lowest values at the rural site Vianden. The detected concentration of S was converted to sulfate (3 [S]), and its contribution to total PM10 was 31 % at Belvaux, 41 % at Remich, and 34 % at Vianden. Hence, our analyses with the PX-375 explained on average 52 %, 74 %, and 51 % of the gravimetric PM10 mass at Belvaux, Remich, and Vianden, respectively. Potential contributors to the undetermined PM10 mass are ammonium, nitrate, EC, OC, and minor fractions of sea salt depending on the origins and transport pathways of the air masses arriving at each of the sites (Hopke et al., 2020). Primary biological particles may also constitute a considerable portion of PM10 (Fröhlich-Nowoisky et al., 2016).
Although future air pollution abatement scenarios anticipate a decrease in the organic and inorganic aerosol burden due to reduction of fossil fuel emissions, substantial amounts of PM (> 5 µg m−3) from non-anthropogenic sources are expected to be present (Pai et al., 2022). Moreover, large emissions of non-exhaust PM by, for example, the abrasion of brakes, clutches, and tires of heavy electric vehicles will likely be the dominant traffic sources. Measurements made by the PX-375 cover a large fraction of these semi-natural and non-exhaust particles, mainly including natural dust (crustal elements) and toxic elements attributed with resuspended road dust.
This study presents a comprehensive performance evaluation of the Horiba PX-375 continuous particulate monitor and its application for multi-element analysis of airborne particulate matter (PM10) in Luxembourg. The PX-375 demonstrated low limits of detection (LoD) for several elements, particularly Ni, Cu, Zn, and Pb, with values below 3 ng m−3 at 1 h time resolution. Higher LoD values were observed for lighter elements such as Al and Si, likely due to marginal contamination and the inherent characteristics of the EDXRF hardware. The instrument exhibited high precision, with standard uncertainty (Type A) below 4 % for most elements, except Pb. Type B uncertainties, particularly related to the calibration with multi-element reference materials, contributed significantly to the overall measurement uncertainty. Elemental analysis during the spring and summer campaigns in Luxembourg revealed that mineral elements (Fe, Al, Si, Ca) dominated the PM10 composition, contributing significantly more than hazardous elements (Cu, Zn, Cr, As, Ni, Pb). Sulfur (S) was the most prevalent element, primarily associated with particulate sulfate, and showed significant variability depending on meteorological conditions and emission sources. The contribution of mineral elements indicated substantial inputs from crustal sources and resuspension of road dust, especially under dry conditions. Toxic trace elements accounted for less than 2 % of the total PM10 but were enriched at the urban and semi-urban site compared to the rural location.
The ability of the PX-375 to provide near-real-time data on multiple elements enhances our capability for spatio-temporal variability assessments and source apportionment studies. Despite the challenges associated with the calibration and manual control of the accurate filter tape alignment, the PX-375 offers a viable alternative to traditional discontinuous sampling methods, providing valuable insights into the composition and sources of airborne PM with high time resolution. The study underscores the need for universally recognized and certified reference materials to ensure consistency and accuracy in elemental analysis across different monitoring instruments. The application of the Horiba PX-375 in Luxembourg highlights its potential for enhancing air quality monitoring and source apportionment efforts, contributing to a better understanding and management of atmospheric pollution.
The data associated with this work are available from the corresponding author upon request.
IT: formal analysis, visualization, conceptualization, validation, writing (original draft preparation), writing (review and editing), project administration. CL: methodology, validation, data curation, formal analysis, visualization. EMK: methodology, validation, writing (review and editing). AK and JJ: funding acquisition, investigation, writing (review and editing).
The contact author has declared that none of the authors has any competing interests.
Publisher’s note: Copernicus Publications remains neutral with regard to jurisdictional claims made in the text, published maps, institutional affiliations, or any other geographical representation in this paper. While Copernicus Publications makes every effort to include appropriate place names, the final responsibility lies with the authors.
We are grateful to Patrice Moubea from HORIBA Europe GmbH for training with the PX-375. We are also indebted to the staff of the Institut Viti-Vinicole in Remich and to Nicole Neyens in Nachtmanderscheid for providing power and space for parking the EMV. ChatGPT was used to improve the closing sentences of the abstract, summary, and conclusions.
This study was funded by the framework agreement between LIST and the Luxembourg Ministry of the Environment, Climate, and Biodiversity (ACROSS project).
This paper was edited by Jessie Creamean and reviewed by two anonymous referees.
Achakulwisut, P., Anenberg, S. C., Neumann, J. E., Penn, S. L., Weiss, N., Crimmins, A., Fann, N., Martinich, J., Roman, H., and Mickley, L. J.: Effects of Increasing Aridity on Ambient Dust and Public Health in the U.S. Southwest Under Climate Change, GeoHealth, 3, 127–144, https://doi.org/10.1029/2019GH000187, 2019.
Al Mamun, A., Cheng, I., Zhang, L. M., Dabek-Zlotorzynska, E., and Charland, J. P.: Overview of size distribution, concentration, and dry deposition of airborne particulate elements measured worldwide, Environ. Rev., 28, 77–88, https://doi.org/10.1139/er-2019-0035, 2020.
Asano, H., Aoyama, T., Mizuno, Y., and Shiraishi, Y.: Highly Time-Resolved Atmospheric Observations Using a Continuous Fine Particulate Matter and Element Monitor, Acs Earth Space Chem., 1, 580–590, https://doi.org/10.1021/acsearthspacechem.7b00090, 2017.
Baensch-Baltruschat, B., Kocher, B., Stock, F., and Reifferscheid, G.: Tyre and road wear particles (TRWP) – A review of generation, properties, emissions, human health risk, ecotoxicity, and fate in the environment, Sci. Total Environ., 733, 137823, https://doi.org/10.1016/j.scitotenv.2020.137823, 2020.
Beddows, D. C. S. and Harrison, R. M.: PM10 and PM2.5 emission factors for non-exhaust particles from road vehicles: Dependence upon vehicle mass and implications for battery electric vehicles, Atmos. Environ., 244, 117886, https://doi.org/10.1016/j.atmosenv.2020.117886, 2021.
Bilo, F., Cirelli, P., and Borgese, L.: Elemental analysis of particulate matter by X-ray fluorescence methods: A green approach to air quality monitoring, TrAC-Trend. Anal. Chem., 170, 117427, https://doi.org/10.1016/j.trac.2023.117427, 2024.
Briffa, J., Sinagra, E., and Blundell, R.: Heavy metal pollution in the environment and their toxicological effects on humans, Heliyon, 6, e04691, https://doi.org/10.1016/j.heliyon.2020.e04691, 2020.
Brown, R. J. C., Jarvis, K. E., Disch, B. A., Goddard, S. L., Adriaenssens, E., and Claeys, N.: Comparison of ED-XRF and LA-ICP-MS with the European reference method of acid digestion-ICP-MS for the measurement of metals in ambient particulate matter, Accredit. Qual. Assur., 15, 493–502, https://doi.org/10.1007/s00769-010-0668-7, 2010.
Büntgen, U., Urban, O., Krusic, P. J., Rybníček, M., Kolář, T., Kyncl, T., Ač, A., Koňasová, E., Čáslavský, J., Esper, J., Wagner, S., Saurer, M., Tegel, W., Dobrovolný, P., Cherubini, P., Reinig, F., and Trnka, M.: Recent European drought extremes beyond Common Era background variability, Nat. Geosci., 14, 190–196, https://doi.org/10.1038/s41561-021-00698-0, 2021.
Celo, V., Dabek-Zlotorzynska, E., Mathieu, D., and Okonskaia, I.: Validation of a simple microwave-assisted acid digestion method using microvessels for analysis of trace elements in atmospheric PM2.5 in monitoring and fingerprinting studies, The Open Chem. Biomed. Method. J., 3, 143–152, 2010.
Charrier, J. G. and Anastasio, C.: On dithiothreitol (DTT) as a measure of oxidative potential for ambient particles: evidence for the importance of soluble transition metals, Atmos. Chem. Phys., 12, 9321–9333, https://doi.org/10.5194/acp-12-9321-2012, 2012.
Chen, L. W. A., Lowenthal, D. H., Watson, J. G., Koracin, D., Kumar, N., Knipping, E. M., Wheeler, N., Craig, K., and Reid, S.: Toward Effective Source Apportionment Using Positive Matrix Factorization: Experiments with Simulated PM2.5 Data, J. Air Waste Manage. Assoc., 60, 43–54, https://doi.org/10.3155/1047-3289.60.1.43, 2010.
Christensen, W. F. and Schauer, J. J.: Impact of species uncertainty perturbation on the solution stability of positive matrix factorization of atmospheric particulate matter data, Environ. Sci. Technol., 42, 6015–6021, https://doi.org/10.1021/es800085t, 2008.
Creamean, J. M., Neiman, P. J., Coleman, T., Senff, C. J., Kirgis, G., Alvarez, R. J., and Yamamoto, A.: Colorado air quality impacted by long-range-transported aerosol: a set of case studies during the 2015 Pacific Northwest fires, Atmos. Chem. Phys., 16, 12329–12345, https://doi.org/10.5194/acp-16-12329-2016, 2016.
Daellenbach, K. R., Uzu, G., Jiang, J. H., Cassagnes, L. E., Leni, Z., Vlachou, A., Stefenelli, G., Canonaco, F., Weber, S., Segers, A., Kuenen, J. J. P., Schaap, M., Favez, O., Albinet, A., Aksoyoglu, S., Dommen, J., Baltensperger, U., Geiser, M., El Haddad, I., Jaffrezo, J. L., and Prévôt, A. S. H.: Sources of particulate-matter air pollution and its oxidative potential in Europe, Nature, 587, 414–419, https://doi.org/10.1038/s41586-020-2902-8, 2020.
Fang, T., Guo, H. Y., Zeng, L. H., Verma, V., Nenes, A., and Weber, R. J.: Highly Acidic Ambient Particles, Soluble Metals, and Oxidative Potential: A Link between Sulfate and Aerosol Toxicity, Environ. Sci. Technol., 51, 2611–2620, https://doi.org/10.1021/acs.est.6b06151, 2017.
Fomba, K. W., van Pinxteren, D., Müller, K., Spindler, G., and Herrmann, H.: Assessment of trace metal levels in size-resolved particulate matter in the area of Leipzig, Atmos. Environ., 176, 60–70, https://doi.org/10.1016/j.atmosenv.2017.12.024, 2018.
Fröhlich-Nowoisky, J., Kampf, C. J., Weber, B., Huffman, J. A., Pöhlker, C., Andreae, M. O., Lang-Yona, N., Burrows, S. M., Gunthe, S. S., Elbert, W., Su, H., Hoor, P., Thines, E., Hoffmann, T., Després, V. R., and Pöschl, U.: Bioaerosols in the Earth system: Climate, health, and ecosystem interactions, Atmos. Res., 182, 346–376, https://doi.org/10.1016/j.atmosres.2016.07.018, 2016.
Furger, M., Minguillón, M. C., Yadav, V., Slowik, J. G., Hüglin, C., Fröhlich, R., Petterson, K., Baltensperger, U., and Prévôt, A. S. H.: Elemental composition of ambient aerosols measured with high temporal resolution using an online XRF spectrometer, Atmos. Meas. Tech., 10, 2061–2076, https://doi.org/10.5194/amt-10-2061-2017, 2017.
GUM: Joint Committee for Guides in Metrology Evaluation of measurement data, Guide to the expression of uncertainty in measurement (GUM), JCGM, 100, http://www.bipm.org/utils/common/documents/jcgm/JCGM_100_2008_E.pdf (last access: 6 February 2024), 2008.
Guo, H., Otjes, R., Schlag, P., Kiendler-Scharr, A., Nenes, A., and Weber, R. J.: Effectiveness of ammonia reduction on control of fine particle nitrate, Atmos. Chem. Phys., 18, 12241–12256, https://doi.org/10.5194/acp-18-12241-2018, 2018.
Heikkilä, P., Rostedt, A., Toivonen, J., and Keskinen, J.: Analysis and classification of individual ambient aerosol particles with field-deployable laser-induced breakdown spectroscopy platform, Aerosol Sci. Technol., 58, 1063–1078, https://doi.org/10.1080/02786826.2024.2350022, 2024.
Hopke, P. K., Dai, Q., Li, L., and Feng, Y.: Global review of recent source apportionments for airborne particulate matter, Sci. Total Environ., 740, 140091, https://doi.org/10.1016/j.scitotenv.2020.140091, 2020.
Hyslop, N. P., Liu, Y. F., Yatkin, S., and Trzepla, K.: Application of the US EPA procedure for determining method detection limits to EDXRF measurement of filter-based aerosol samples, J. Air Waste Manage. Assoc., 72, 905–913, https://doi.org/10.1080/10962247.2022.2064005, 2022.
Hyslop, N. P., Trzepla, K., Yatkin, S., White, W. H., Ancelet, T., Davy, P., Butler, O., Gerboles, M., Kohl, S., McWilliams, A., Saucedo, L., Van Der Haar, M., and Jonkers, A.: An inter-laboratory evaluation of new multi-element reference materials for atmospheric particulate matter measurements, Aerosol Sci. Technol., 53, 771–782, https://doi.org/10.1080/02786826.2019.1606413, 2019.
IUPAC: Compendium of Chemical Terminology, 2nd ed. (the “Gold Book”), Blackwell Scientific Publications, Oxford, 6414 pp., https://doi.org/10.1351/goldbook, 1997.
Ji, X., Qin, R., Shi, C., Yang, L., Yao, L., Deng, S., Qu, G., Yin, Y., Hu, L., Shi, J., and Jiang, G.: Dynamic landscape of multi-elements in PM2.5 revealed by real-time analysis, Environ. Int., 170, 107607, https://doi.org/10.1016/j.envint.2022.107607, 2022.
Kellner, R., Mermet, J.-M., Otto, M., Valcarcel, M., and Widmer, H. M.: Analytical Chemistry: A Modern Approach to Analytical Science, 2nd Edition, WILEY-VCH Verlag GmbH & Co. KgaA, Weinheim, Germany, 1209 pp., 2004.
Lee, S.-H. and Allen, H. C.: Analytical Measurements of Atmospheric Urban Aerosol, Anal. Chem., 84, 1196–1201, https://doi.org/10.1021/ac201338x, 2012.
Li, Y. Y., Chang, M. A., Ding, S. S., Wang, S. W., Ni, D., and Hu, H. T.: Monitoring and source apportionment of trace elements in PM2.5: Implications for local air quality management, J. Environ. Manage., 196, 16–25, https://doi.org/10.1016/j.jenvman.2017.02.059, 2017.
Liu, X., Zhang, X., Wang, T., Jin, B., Wu, L., Lara, R., Monge, M., Reche, C., Jaffrezo, J.-L., Uzu, G., Dominutti, P., Darfeuil, S., Favez, O., Conil, S., Marchand, N., Castillo, S., de la Rosa, J. D., Stuart, G., Eleftheriadis, K., Diapouli, E., Gini, M. I., Nava, S., Alves, C., Wang, X., Xu, Y., Green, D. C., Beddows, D. C. S., Harrison, R. M., Alastuey, A., and Querol, X.: PM10-bound trace elements in pan-European urban atmosphere, Environ. Res., 260, 119630, https://doi.org/10.1016/j.envres.2024.119630, 2024.
Lu, D., Tan, J., Yang, X., Sun, X., Liu, Q., and Jiang, G.: Unraveling the role of silicon in atmospheric aerosol secondary formation: a new conservative tracer for aerosol chemistry, Atmos. Chem. Phys., 19, 2861–2870, https://doi.org/10.5194/acp-19-2861-2019, 2019.
Mach, T., Rogula-Kozlowska, W., Bralewska, K., Majewski, G., Rogula-Kopiec, P., and Rybak, J.: Impact of Municipal, Road Traffic, and Natural Sources on PM10: The Hourly Variability at a Rural Site in Poland, Energies, 14, 2654, https://doi.org/10.3390/en14092654, 2021.
Maenhaut, W., Raes, N., Chi, X. G., Cafmeyer, J., Wang, W., and Salma, I.: Chemical composition and mass closure for fine and coarse aerosols at a kerbside in Budapest, Hungary, in spring 2002, X-Ray Spectrom., 34, 290–296, https://doi.org/10.1002/xrs.820, 2005.
Margui, E., Queralt, I., and de Almeida, E.: X-ray fluorescence spectrometry for environmental analysis: Basic principles, instrumentation, applications and recent trends, Chemosphere, 303, 135006, https://doi.org/10.1016/j.chemosphere.2022.135006, 2022.
Molina, C., Manzano, C. A., Leiva, M. A. G., and Toro, R. A.: The oxidative potential of airborne particulate matter in two urban areas of Chile: More than meets the eye, Environ. Int., 173, 107866, https://doi.org/10.1016/j.envint.2023.107866, 2023.
Pai, S. J., Carter, T. S., Heald, C. L., and Kroll, J. H.: Updated World Health Organization Air Quality Guidelines Highlight the Importance of Non-anthropogenic PM2.5, Environ. Sci. Technol. Lett., 9, 501–506, https://doi.org/10.1021/acs.estlett.2c00203, 2022.
Pant, P., Baker, S. J., Shukla, A., Maikawa, C., Pollitt, K. J. G., and Harrison, R. M.: The PM10 fraction of road dust in the UK and India: Characterization, source profiles and oxidative potential, Sci. Total Environ., 530, 445–452, https://doi.org/10.1016/j.scitotenv.2015.05.084, 2015.
Park, S. S., Cho, S. Y., Jo, M. R., Gong, B. J., Park, J. S., and Lee, S. J.: Field evaluation of a near–real time elemental monitor and identification of element sources observed at an air monitoring supersite in Korea, Atmos. Pollut. Res., 5, 119–128, https://doi.org/10.5094/APR.2014.015, 2014.
Petit, J. E., Favez, O., Albinet, A., and Canonaco, F.: A user-friendly tool for comprehensive evaluation of the geographical origins of atmospheric pollution: Wind and trajectory analyses, Environ. Modell. Softw., 88, 183–187, https://doi.org/10.1016/j.envsoft.2016.11.022, 2017.
Schwarz, J., Cusack, M., Karban, J., Chalupnícková, E., Havránek, V., Smolík, J., and Zdímal, V.: PM2.5 chemical composition at a rural background site in Central Europe, including correlation and air mass back trajectory analysis, Atmos. Res., 176, 108–120, https://doi.org/10.1016/j.atmosres.2016.02.017, 2016.
Tang, Y. S., Flechard, C. R., Dämmgen, U., Vidic, S., Djuricic, V., Mitosinkova, M., Uggerud, H. T., Sanz, M. J., Simmons, I., Dragosits, U., Nemitz, E., Twigg, M., van Dijk, N., Fauvel, Y., Sanz, F., Ferm, M., Perrino, C., Catrambone, M., Leaver, D., Braban, C. F., Cape, J. N., Heal, M. R., and Sutton, M. A.: Pan-European rural monitoring network shows dominance of NH3 gas and NH4NO3 aerosol in inorganic atmospheric pollution load, Atmos. Chem. Phys., 21, 875–914, https://doi.org/10.5194/acp-21-875-2021, 2021.
Tasdemir, Y., Kural, C., Cindoruk, S. S., and Vardar, N.: Assessment of trace element concentrations and their estimated dry deposition fluxes in an urban atmosphere, Atmos. Res., 81, 17–35, https://doi.org/10.1016/j.atmosres.2005.10.003, 2006.
Trebs, I., Lett, C., Krein, A., and Junk, J.: Air quality impacts of aviation activities at a mid-sized airport in central Europe, Atmos. Pollut. Res., 14, 101696, https://doi.org/10.1016/j.apr.2023.101696, 2023.
Tremper, A. H., Font, A., Priestman, M., Hamad, S. H., Chung, T.-C., Pribadi, A., Brown, R. J. C., Goddard, S. L., Grassineau, N., Petterson, K., Kelly, F. J., and Green, D. C.: Field and laboratory evaluation of a high time resolution x-ray fluorescence instrument for determining the elemental composition of ambient aerosols, Atmos. Meas. Tech., 11, 3541–3557, https://doi.org/10.5194/amt-11-3541-2018, 2018.
Yang, K. X., Swami, K., and Husain, L.: Determination of trace metals in atmospheric aerosols with a heavy matrix of cellulose by microwave digestion-inductively coupled plasma mass spectroscopy, Spectrochim. Acta B, 57, 73–84, https://doi.org/10.1016/S0584-8547(01)00354-8, 2002.
Yang, X. Z., Lu, D. W., Tan, J. H., Sun, X., Zhang, Q. H., Zhang, L. Y., Li, Y., Wang, W. C., Liu, Q., and Jiang, G. B.: Two-Dimensional Silicon Fingerprints Reveal Dramatic Variations in the Sources of Particulate Matter in Beijing during 2013–2017, Environ. Sci. Technol., 54, 7126–7135, https://doi.org/10.1021/acs.est.0c00984, 2020.
Yatkin, S., Trzepla, K., White, W. H., and Hyslop, N. P.: Generation of multi-element reference materials on PTFE filters mimicking ambient aerosol characteristics, Atmos. Environ., 189, 41–49, https://doi.org/10.1016/j.atmosenv.2018.06.034, 2018.


