the Creative Commons Attribution 4.0 License.
the Creative Commons Attribution 4.0 License.
Distribution characteristics of the summer precipitation raindrop spectrum on the Qinghai–Tibet Plateau
Fuzeng Wang
Yuanyu Duan
Yao Huo
Yaxi Cao
Qiusong Wang
Tong Zhang
Junqing Liu
Guangmin Cao
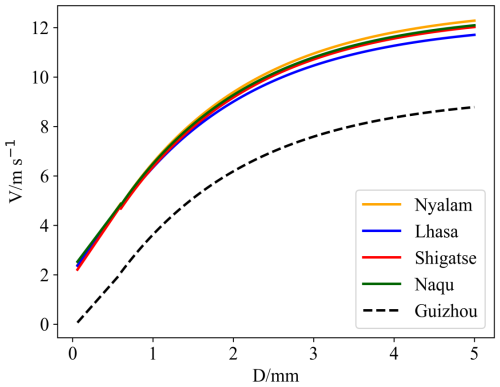
To enhance the precision of precipitation forecasting in the Qinghai–Tibet Plateau region, a comprehensive study of both macro- and micro-characteristics of local precipitation is imperative. In this study, we investigated the particle size distribution, droplet velocity, droplet number density, Z–I (radar reflectivity–rainfall intensity) relationship, and gamma distribution of precipitation droplet spectra with a single precipitation duration of at least 20 min and precipitation of 5 mm or more at four stations (Nyalam, Lhasa, Shigatse, and Naqu) in Tibet during recent years from June to August. The results are as follows: (1) in the fitting relationship curve between precipitation raindrop spectral particle size and falling speed at the four stations in Tibet, when the particle size was less than 1.5 mm, the four lines essentially coincided. When the particle size exceeded 1.5 mm, the speed in Nyalam was the highest, followed by Naqu, and the speed in Lhasa was the lowest. The falling speed of particles correlated with altitude. (2) The five microphysical characteristics (mean diameter (Dm), average volume diameter (Dv), mode diameter (Dd), dominant diameter (Dp), and median diameter (Dnd)) at the four stations have different correlation relationships with altitude under different rainfall intensities. Dm exhibits a negative correlation with altitude at the same rainfall intensity; in contrast, Dv shows a positive correlation with altitude. For microphysical parameters such as Dd and Dp, a rainfall intensity of 10 mm h−1 serves as the boundary line, and they have different correlation relationships with altitude under the same rainfall intensity level. (3) The Z–I relationships at the four stations exhibited variations. Owing to the proximity in altitude between Lhasa and Shigatse, as well as between Nyalam and Nagqu, the coefficient a and index b in the Z–I relationships of the two groups of sites were relatively similar. (4) The fitting curves of the exponential and gamma distributions of the precipitation particle size at the aforementioned four stations are largely comparable. The exponential distribution fitting exhibits a slightly better effect. The parameter μ in the gamma distribution decreases with an increase in altitude, while N0 and λ in the exponential distribution show a clear upward trend with altitude.
- Article
(2351 KB) - Full-text XML
- BibTeX
- EndNote
The microphysical processes of clouds and precipitation over the Qinghai–Tibet Plateau significantly differ from those in low-altitude regions due to the high average altitude and complex, changeable terrain, resulting in a strong ground heating effect. Due to the terrain's influence, the plateau area has a limited number of observation stations, leading to a scarcity of precipitation records. Based on three atmospheric scientific experiments conducted over the Qinghai–Tibet Plateau, convective clouds exhibit high activity, although the precipitation intensity is moderate (Li et al., 2014; Jiang and Fan, 2002; Xu and Chen, 2006; Li and De, 2001). In the central part of the plateau, convective clouds constitute 4 % to 21 % as a proportion of the cloud types, with cumulonimbus clouds representing 21 %. Additionally, the frequency of severe weather, such as thunderstorms and hail, surpasses that in other regions. In the majority of Qinghai–Tibet Plateau areas, convective cloud precipitation constitutes over 90 % of the total precipitation (Chang and Guo, 2016). Particularly during the rainy season, convective processes are frequent with smaller horizontal scales, weaker intensities, and shorter durations. Due to observational constraints, short-term tests and satellite data (e.g., TRMM, CloudSat, and Aqua) are employed to investigate Qinghai–Tibet Plateau precipitation, with a focus on liquid precipitation characteristics, including seasonal and diurnal variations and convective activity's liquid drop spectrum inversion (Ruan et al., 2015; Liu et al., 2015; Xiong et al., 2019; Zhang et al., 2018). The scarcity of observational data on cloud precipitation's physical processes over the Qinghai–Tibet Plateau results in limited studies on microscopic parameters' characteristics. The recent installation of a laser raindrop spectrometer enables comprehensive understanding of the plateau's precipitation microphysical parameters through the study of raindrop spectral parameters and distribution characteristics in various regions.
Some studies have explored the spectral characteristics of raindrops over the Qinghai–Tibet Plateau. Yu et al. (2020) and Shu et al. (2021) conducted analyses on the raindrop spectrum characteristics of various clouds in the Naqu and Yushu regions of the Qinghai–Tibet Plateau. Li et al. (2020) investigated raindrop spectral characteristics at different elevations on the eastern slope of the Qinghai–Tibet Plateau. They discovered that the average spectrum of the raindrop number concentration at various elevations conforms to the gamma function distribution. Moreover, light precipitation and heavy precipitation exhibit distinct raindrop spectral characteristics. The aforementioned research was conducted in the Naqu and Yushu areas of the Qinghai–Tibet Plateau, as well as the west Sichuan Plateau area. However, there are a limited number of studies on the spectral characteristics and distribution rules of cloud precipitation raindrops in various regions of the Qinghai–Tibet Plateau. The analysis of raindrop spectrum characteristics in the Naqu region, as mentioned earlier, was conducted only during the summer months from June to August 2014. In this study, we used raindrop spectrum data from the Naqu region spanning 2017 to 2020, building upon and extending previous research. We analyzed the temporal variation in the raindrop spectrum in convective cloud precipitation across various regions and examined differences in raindrop spectra among these regions. We conducted a systematic analysis of raindrop spectrum data associated with moderate rain from four stations with varying altitudes, longitudes, and latitudes. We compared and analyzed the differences in drop spectrum characteristics among these four stations, which is of great significance for enhancing the scientific understanding of precipitation's influence in the plateau region.
The objective of this study is to enhance our understanding of raindrop spectrum characteristics at various elevations of the Qinghai–Tibet Plateau. The findings of this study will establish a foundation for comprehending precipitation characteristics and improving precipitation forecasts at diverse elevations of the Qinghai–Tibet Plateau. This study is structured as follows: data sources and research methods are described in Sect. 2, the analysis results are presented in Sect. 3, and the conclusion and discussion are provided in Sect. 4.
2.1 Data collection
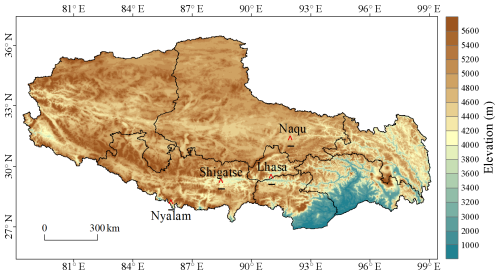
The data obtained for this study consist of raindrop spectrum data from four meteorological stations (i.e., Nyalam, Lhasa, Shigatse, and Naqu) in Tibet. Owing to the area's unique climate environment, snowfall occurs periodically from September to May. Data from June to August are selected to analyze the precipitation raindrop spectrum process in this study. The precipitation data selection criteria include a precipitation process duration exceeding 20 min and a single precipitation process with rainfall greater than 5 mm. As the frequency of convective clouds in most areas of the Qinghai–Tibet Plateau exceeds 90 %, all collected samples are categorized as convective clouds in this paper. Table 1 displays the longitude, latitude, altitude, and sample numbers of the four stations. Figure 1 illustrates the geographical distribution of the four sites. The four stations cover a broad area of central Tibet from south to north, making the results representative.
2.2 Quality assurance and quality control (QA/QC)
The Parsivel2 raindrop spectrometer features 32 particle size measurement channels and 32 particle velocity measurement channels. The particle size measurement range is 0.062–24.5 mm, and the particle velocity measurement range is 0.05–20.8 m s−1, with a sampling time of 60 s. In comparison to the previous Parsivel raindrop spectrometer model, the Parsivel2 raindrop spectrometer utilizes infrared light as its light source. This change reduces the interference of visible light, resulting in significant advancements in the measurement of raindrop size and rainfall. Following the sampling principle of the raindrop spectrometer, the instrument records the particle size and particle speed of all particles passing through the sampling surface. To mitigate the influence of sand and dust particles, it is imperative to control the quality of the fundamental data.
Atlas et al. (1973) discovered a relationship between the terminal velocity of particles and the particle diameter. In an ideal windless environment, the formula for the terminal velocity of particles is
where x represents the particle diameter in millimeters and v represents the terminal velocity of the particle in m s−1. Equation (1) is applicable near the ground. For other altitudes, considering the known effect of atmospheric air density on the terminal fall velocity, a correction factor of for the fall velocity of raindrops, accounting for air density and as given by Atlas et al. (1973) and Foote and Du Toit (1969), is multiplied on the right-hand side of Eq. (1). Here, ρ is the air density at the observation altitude and ρ0 is the air density at sea level under standard atmospheric pressure.
Kruger and Krajewski (2002) proposed a method to mitigate the dispersion of velocity over large samples, building on the study by Atlas et al. (1973). Initially, the terminal velocity was calculated based on the particle diameter and final velocity formula, and subsequently, a threshold value was set for elimination. The formula is expressed in Eq. (2).
where vmeasured represents the final velocity measured by the raindrop spectrometer and vA is the final velocity calculated using the final velocity formula. If the relative error falls within the specified threshold range, the data will be retained.
Previous studies have highlighted that the distributions of raindrop spectra exhibit distinct characteristics influenced by the geographical environment and topography. Hence, utilizing the same calculation formula across different areas for raindrop spectrum elimination is likely to introduce significant errors. Therefore, we utilized historical data from a raindrop spectrum site to localize the parameters identified in the study by Atlas et al. (1973) and to incorporate them into the formula for particle elimination. Simultaneously, due to deformation occurring in raindrops during descent, the raindrop spectrum data underwent distortion and correction after quality control.
2.3 Raindrop spectrum parameters
The number density of the precipitation raindrop spectrum is defined as the total number of particles per unit volume (Shi et al., 2008).
where N(D) is the number density parameter, in units of mm−1 m−3; nij represents the number of raindrops with the diameter of the ith particle and the velocity of the jth particle; A is the sampling base area of the raindrop spectrometer (5400 mm2); ΔT is the sampling time (60 s); and Vj is the velocity value of the sampled particle, in units of m s−1.
The average diameter is calculated as the sum of the diameters of all raindrops per unit volume divided by the total number of raindrops, and the formula is given by Eq. (4).
The weighted average diameter represents the average diameter of the weighted mass of all particles per unit volume relative to the total mass of particles, measured in millimeters. The formula is expressed in Eq. (5).
where Di represents the diameter of the ith particle and N(Di) represents the particle number density of the ith particle diameter.
Precipitation intensity refers to precipitation per unit time (per hour), measured in mm h−1. The formula is given by Eq. (6).
The radar reflectivity factor is the sum of the backscattering area of all particles per unit volume, measured in mm−6 m−3. The formula is expressed in Eq. (7).
The observed raindrop spectrum is discrete, and the double-parameter index, namely exponential distribution, can be used to simulate the raindrop particle size distribution (Marshall and Palmer, 1948). The formula is given by Eq. (8).
where N0 is a number density parameter, measured in mm−1 m−3, and λ is a size parameter, measured in mm−1.
However, this distribution pattern has some errors compared with actual observation data when describing small and large raindrops. Therefore, Ulbrich and Atlas (1984) proposed a modified raindrop particle size distribution pattern. They treated the raindrop spectrum distribution as a gamma distribution to correct the distribution pattern between small and large raindrops.
In this case, the raindrop particle size distribution follows the gamma distribution with three parameters (Carlton and David, 1984). The formula is given by Eq. (9).
where μ is a dimensionless parameter referred to as the shape factor. When μ is greater than 0, the curve exhibits an upward curvature; when μ is less than 0, the curve displays a downward curvature. When μ = 0, it corresponds to an exponential distribution.
Zhang et al. (2003) pointed out a binomial relationship between μ and λ when studying the μ–λ relationship of precipitation in Florida:
Ulbrich (1983) pointed out that the μ–λ relation under a gamma distribution can be expressed as
Equation (11) shows that there is a relationship between the ratio of μ and λ and the weighted average diameter of mass. The gamma distribution fit is typically applied to the observed raindrop distribution N(D) using the least-squares or order moment method. In this study, the least-squares method is employed to fit the exponential and gamma distributions.
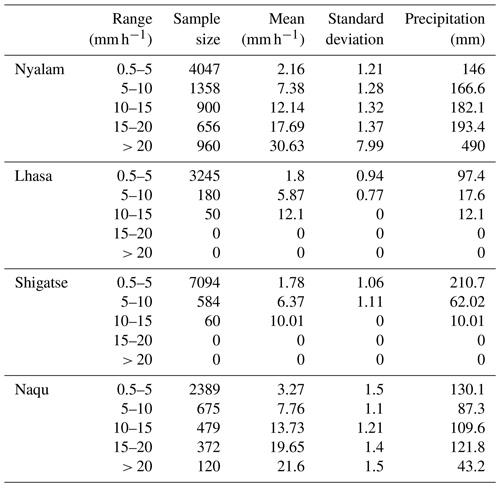
The average altitude of the Qinghai–Tibet Plateau is over 4000 m, and the terrain is complex and changeable, resulting in varying microphysical characteristics of the raindrop spectrum. Therefore, considering the unique conditions of the Qinghai–Tibet Plateau, the rain intensity calculated based on the raindrop spectrum was categorized into five grades for calculation and analysis, as presented in Table 2. The samples from the four stations in the range of 0.5–5 mm h−1 were the largest, and the obtained standard deviation values were all very small. This indicates a high consistency in the rain intensity distribution under weak rain intensity. In the interval of precipitation intensity greater than 20 mm h−1, only two stations have samples, and one of the stations exhibits a large standard deviation. This reflects a significant inversion error in the raindrop spectrum for Nyalam during short-duration heavy precipitation.
3.1 Precipitation particle size and speed and the rainfall intensity contribution rate distribution
Figure 2 represents the mean precipitation values across the four stations. The plot is divided into several rectangular areas defined by the coordinates of the horizontal and left axes, and the color code is applied to them. Each rectangular area represents a specific particle diameter and velocity. Figure 2 reveals that the fitting curves of the particle diameter distribution and terminal velocity at the four stations are approximately identical, and the terminal velocity increases with the particle diameter. Regarding particle number density, it is concentrated in the area with particle sizes less than 1 mm, and it decreases with an increase in diameter. Concerning the contribution rate of precipitation intensity, the four stations exhibit a multi-peak distribution, with peak diameters at 0.812 and 1.375 mm. In comparison with the precipitation process of convective clouds at low-altitude stations, the particle size spectrum width at the four stations on the Qinghai–Tibet Plateau in this analysis was notably reduced, and the particle number density at the four stations with particle sizes greater than 3 mm was very low.
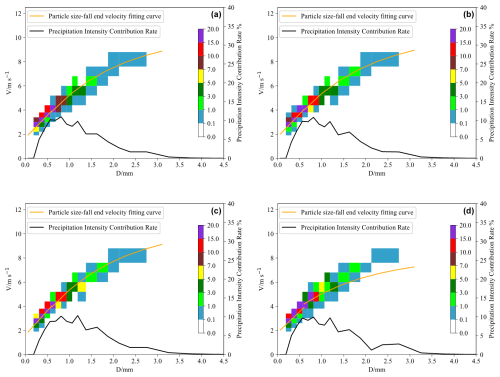
Figure 2The average spectrum of the precipitation particle size, velocity, and contribution rate distribution of precipitation intensity. The color bar represents the number density in units per m3. (a) Nyalam, (b) Lhasa, (c) Shigatse, and (d) Naqu.
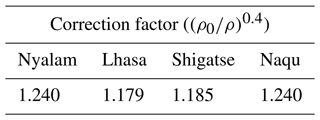
Figure 3 displays the fitting relationship between the particle size of the raindrop spectrum and the falling speed at the four stations in Tibet. For particle sizes less than 1.5 mm, the particle size at the four stations essentially aligns with the final falling speed. For particle sizes greater than 1.5 mm, the speed is largest for Nyalam, followed by Naqu, and Lhasa has the smallest speed. However, within the same size range, the final velocities of particles at the four stations are greater than those in Guizhou, exceeding 2 m s−1. This may be attributed to the higher altitude of the four stations, which are over 3000 m above sea level. This indicates that the high altitude of Tibet, due to thin air and low air pressure, results in a decreased fall speed of larger particles of the same size. However, particles at lower altitudes (Shigatse and Lhasa) exhibited slightly lower speeds than those at higher altitudes (Nyalam and Naqu). The fitting formulas for the v–D relationships at the four sites (Nyalam, Lhasa, Shigatse, and Naqu) are given by Eqs. (12), (13), (14), and (15), respectively. Considering the effect of air density on the fall velocity of raindrops as per Atlas et al. (1973), the correction factor is applied to Eqs. (12), (13), (14), and (15), resulting in the fitting relationship curves between the particle size of the raindrop spectrum and the falling speed at the four stations in Tibet shown in Fig. 3. The correction factor for fall velocity considering air density is shown in Table 3.
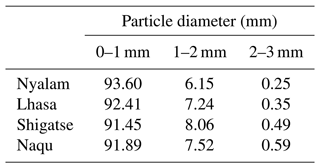
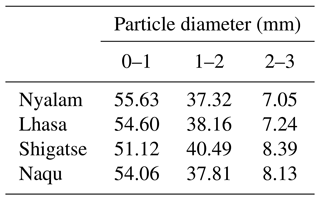
The proportions of the particle number density in the raindrop spectrum and of the contribution rate of precipitation are shown in Tables 4 and 5, respectively.
It can be observed from Table 4 that the number of precipitation particles with a distribution of 0–1 mm constitutes the largest proportion, exceeding 91 %, while the proportion of particles with a distribution of more than 3 mm is comparatively small, being less than 0.6 %. The proportion of precipitation intensity values below 1 mm constitutes over 51 %, with other particles comprising less than 49 %. The results indicate that the contribution of precipitation intensity on the Qinghai–Tibet Plateau is primarily concentrated in small particles with a diameter less than 1 mm.
In contrast to the convective cloud precipitation in Zheng'an, Guizhou, analyzed by Wang et al. (2020), where convective cloud particles less than 1 mm accounted for 64.4 %, the contribution rate to precipitation is only 17 %. Additionally, it significantly differs from the rainstorm in Hainan analyzed by Mao et al. (2020): despite the proportion of less than 1 mm being 82.7 %, the contribution rate is only 18.2 %, and the rainstorm particle size spectrum in Hainan is remarkably wide. It is evident that the precipitation characteristics of convective clouds on the Qinghai–Tibet Plateau exhibit a peculiarity, wherein the diameter of precipitation particles is generally small and the precipitation of small-diameter particles constitutes a substantial proportion of the total precipitation.
3.2 Microphysical characteristic parameters of precipitation
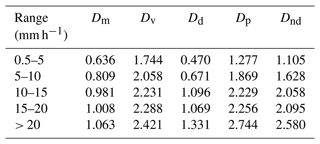
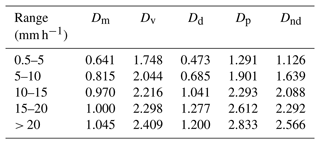
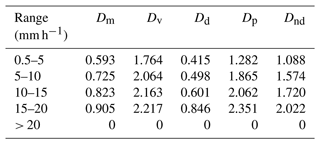
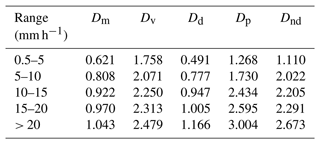
The calculation of microphysical parameters based on raindrop spectra is divided into five levels according to different rainfall intensities. The mean diameter (Dm), average volume diameter (Dv), mode diameter (Dd), dominant diameter (Dp), and median diameter (Dnd) were calculated for four stations. Comprehensive analysis based on the characteristic parameters in Tables 6, 7, 8, and 9 shows that, under the same rainfall intensity level, Dm decreases with increasing altitude. The Dm at the higher-altitude Naqu and Nyalam stations is smaller than that at the lower-altitude Lhasa and Shigatse stations. Under the same rainfall intensity level, Dv increases with altitude, with the smallest value at the low-altitude Lhasa station and the largest at the high-altitude Naqu station. When the rainfall intensity is less than 1 mm h−1, Dd increases with altitude (except for at the Nyalam station), with the largest value at the Naqu station and the smallest at the Lhasa station and the Shigatse station in between. When the rainfall intensity is greater than 10 mm h−1, Dd decreases with altitude, with the largest value at the Lhasa station and the smallest at the Nyalam station and the Shigatse and Naqu stations in between. When the rainfall intensity is less than 10 mm h−1, Dp does not show a significant difference with altitude under the same rainfall intensity level. However, when the rainfall intensity is greater than 10 mm h−1, Dp increases with altitude under the same rainfall intensity level (except for at the Nyalam station). For the lower-altitude Lhasa and Shigatse stations, there is no significant difference in parameters under the same rainfall intensity. In contrast, for the higher-altitude Naqu and Nyalam stations, there are relatively obvious differences in parameters under the same rainfall intensity, with the Nyalam station values being significantly smaller than those of the Naqu station. The reason for the smaller values at the Nyalam station compared to the Naqu station, despite the stations being close in altitude, might be due to the former's unique geographical conditions. The above analysis indicates a strong correlation between altitude and these microphysical parameters. Dm shows a negative correlation with altitude under the same rainfall intensity, while Dv shows a positive correlation with altitude. For Dd and Dp, using 10 mm h−1 as the dividing line, there are different correlations with altitude under the same rainfall intensity level. Additionally, when the altitude is below 4000 m, there is no significant difference in characteristic diameters under the same rainfall intensity. Conversely, when the altitude is above 4000 m, the differences in characteristic diameters become more pronounced.
3.3 Z–I relation distribution
Utilizing Eqs. (6) and (7), the radar reflectivity (Z) and precipitation intensity (I) are calculated independently, and the data undergo fitting. The results are depicted in Fig. 4.
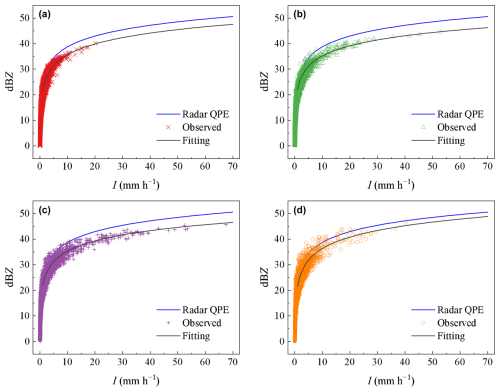
Figure 4The Z–I relationships at the four stations. (a) Nyalam, (b) Lhasa, (c) Shigatse, and (d) Naqu.
Figure 4 reveals that the suggested reference relation Z = 300×I1.4 inaccurately predicts precipitation, leading to an underestimation of precipitation intensity under identical radar reflectivity. With identical radar reflectivity, the precipitation intensity is highest in Lhasa, followed by Shigatse, while the smallest precipitation intensity was observed in Naqu.
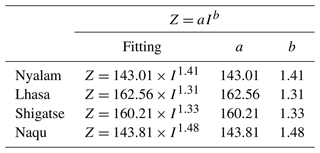
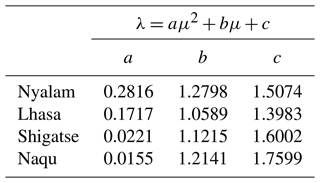
Table 10 shows the results of fitted Z–I relationships. Analyzing the altitude-based differences in the Z–I relationship, the a and b coefficients are similar for the station at 3653 m (Lhasa) and the station at 3910 m (Shigatse), while a and b for the station at 4519 m (Nyalam) and the station at 4560 m (Naqu) are close. This observation indicates that the fitting parameter a is notably smaller and the fitting parameter b is larger for stations at higher altitudes.
3.4 Precipitation particle distribution fitting
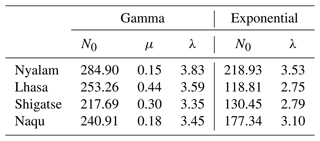
According to Eqs. (8) and (9), the least-squares method is applied to fit the exponential and gamma distributions of the mean raindrop spectrum of precipitation at the four stations. The results are presented in Fig. 5 and Table 11.
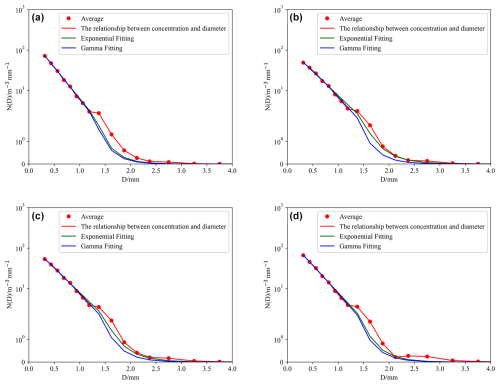
Figure 5Exponential and gamma distributions for precipitation. (a) Nyalam, (b) Lhasa, (c) Shigatse, and (d) Naqu.
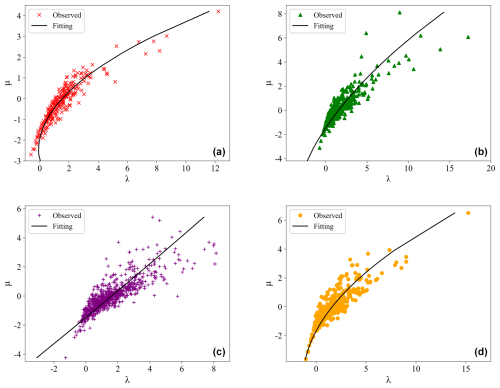
As indicated in Table 12, μ decreases with increasing altitude in the gamma distribution. A smaller μ corresponds to a wider raindrop spectrum, signifying that the diameter of raindrops increases with altitude. The raindrop diameter at higher altitudes is larger, corresponding to the precipitation microphysical characteristics calculated in Tables 6–9. Conversely, the fitting results of the exponential distribution show that N0 and λ exhibit a clear increasing trend with height. In Fig. 5, the abscissa represents the particle diameter and the ordinate represents the particle number density. The curve trends at the four stations are relatively consistent. For the Nyalam station, the exponential distribution is given by N(D) = , and the gamma distribution is N(D) = . For the Lhasa station, the exponential distribution is N(D) = , and the gamma distribution is N(D) = . For the Shigatse station, the exponential distribution is N(D) = , and the gamma distribution is N(D) = . Finally, for the Naqu station, the exponential distribution is N(D) = , and the gamma distribution is N(D) = . In the gamma distribution, two parameters, μ and λ, represent the curve shape factor and particle-scale parameters, respectively, as shown in Eq. (9). According to Eq. (10), the two parameters μ and λ for the four stations are fitted with an analytical binomial relationship, and the coefficients are presented in Table 12.
It can be observed from Fig. 6 that, although the four curves bend towards the lambda axis, the degree of bending varies. The curves for Shigatse exhibit nearly straight curves, whereas the curves for Nyalam and Naqu are more pronounced in their curvature towards the lambda axis. The μ–λ relationship varies among the four stations, and this variation is associated with the mass-weighted diameter. Equation (11) indicates that when λ remains constant, a higher μ value corresponds to a greater mass-weighted average diameter.
In this study, we conducted a statistical analysis of raindrop spectrum data above light and moderate rain at four sites in Tibet, considering different heights, latitudes, and longitudes. The analysis includes the precipitation particle size distribution, particle landing speed, precipitation particle number density, and rainfall intensity at the end. Additionally, the relationship between the Z–I distribution and rainfall rate, the precipitation particle distribution fitting, and gamma distribution μ–λ parameters for the precipitation raindrop spectrum characteristics at the four stations are examined. A comparison is made between the data from the four stations on the Qinghai–Tibet Plateau and some non-plateau areas. Simultaneously, the analysis of raindrop spectrum data at the Naqu station reveals certain similarities with previous studies (indicating convective clouds as the primary source of precipitation at the Naqu station). However, some differences are noted, such as the mean spectral width of convective precipitation at the Naqu station being relatively narrow.
The relationship between precipitation particle size and particle landing velocity at the four stations indicates that the terminal velocity of the four stations essentially coincides when the particle size is less than 1.5 mm. For particle sizes greater than 1.5 mm, the terminal velocity of particles at the four stations is faster at high altitudes than it is at medium and low altitudes. At the four stations, the proportion of precipitation raindrop spectral particles with sizes less than 1 mm exceeded 91 % and the contribution rate of precipitation was more than 51 %. The characteristics of convective cloud precipitation over the Qinghai–Tibet Plateau exhibit peculiarities that differ from the raindrop spectrum characteristics in the low-altitude areas of the mainland.
The five microphysical characteristics at the four stations have different correlation relationships with altitude under different rainfall intensities. Dm exhibits a negative correlation with altitude at the same rainfall intensity; in contrast, Dv shows a positive correlation with altitude. For microphysical parameters such as Dd and Dp, a rainfall intensity of 10 mm h−1 serves as the boundary line, and they have different correlation relationships with altitude under the same rainfall intensity level. Regarding the fitted Z–I relationship, the fitting parameter a at the high-altitude station is significantly smaller, while the fitting parameter b is larger. The particle spectrum of high-altitude stations is broader, with a larger equivalent diameter, and the reflectivity of high-altitude stations is significantly higher than that of low-altitude stations.
The concentration of small raindrops (less than 1 mm) in the raindrop spectrum of high-altitude stations on the Qinghai–Tibet Plateau is higher. Both the exponential distribution and the gamma distribution exhibit good fitting effects for low-altitude stations. Overall, the exponential fit performs better. In the relationship between the μ and λ of the two parameters in the gamma distribution, the larger the μ, the larger the weighted average diameter of the mass when the λ remains constant. In other words, the greater the μ, the greater the precipitation intensity when λ remains unchanged.
The data used to support the findings of this study are available from the corresponding author upon request.
FW and GC: conceptualization; FW and QW: methodology; YH, YD and QW: software; FW, YH, YD and YC: writing (review and editing); TZ and JL: resources; TZ and GC: supervision. All authors have read and agreed to the published version of the paper.
The contact author has declared that none of the authors has any competing interests.
Publisher's note: Copernicus Publications remains neutral with regard to jurisdictional claims made in the text, published maps, institutional affiliations, or any other geographical representation in this paper. While Copernicus Publications makes every effort to include appropriate place names, the final responsibility lies with the authors.
We thank the Tibet Meteorological Bureau for the raindrop spectrum data and the students and teachers of Chengdu University of Information Technology for their help.
This research was funded by the Open Fund project for the Key Laboratory of Land Surface Process and Climate Change in Cold and Arid Regions, Chinese Academy of Sciences (grant no. LPCC2020009); the Natural Science Foundation of Sichuan Province (grant no. 2022NSFSC0208); and the National Natural Science Foundation of China (grant no. 42075001).
This paper was edited by S. Joseph Munchak and reviewed by two anonymous referees.
Atlas, D., Srivastava, R. C., and Sekhon, R. S.: Doppler characteristics of precipitation at vertical incidence, Rev. Geophys, 11, 1–35, https://doi.org/10.1029/RG011i001p00001, 1973.
Carlton, W. U. and David, A.: Assessment of the contribution of differential polarization to improved rainfall measurements, Radio Sci., 19, 49–57, https://doi.org/10.1029/RS019i001p00049, 1984.
Chang, Y. and Guo, X. L.: Characteristics of convective cloud and precipitation during summer time at Nagqu over Tibetan Plateau, Chinese Sci. Bull., 61, 1706–1720, https://doi.org/10.1360/N972015-01292, 2016.
Foote, G. B. and Du Toit, P. S.: Terminal Velocity of Raindrops Aloft, J. Appl. Meteorol. Clim., 8, 249–253, https://doi.org/10.1175/1520-0450(1969)008<0249:TVORA>2.0.CO;2, 1969.
Jiang, J. X. and Fan, M. Z.: Convective clouds and mesoscale convective systems over the Tibetan Plateau in summer, Chin. J. Atmos. Sci., 26, 263–270, https://doi.org/10.3878/j.issn.1006-9895.2002.02.12, 2002.
Kruger, A. and Krajewski, W. F.: Two-Dimensional Video Disdrometer: A Description, J. Atmos. Ocean. Tech, 19, 602–617, https://doi.org/10.1175/1520-0426(2002)019<0602:TDVDAD>2.0.CO, 2002.
Li, D., Bai, A. J., Xue, Y. J., and Wang, P.: Comparative analysis on characteristics of summer convective precipitation over Ti-betan Plateau and Sichuan Basin, Meteorological Monthly, 40, 280–289, https://doi.org/10.7519/j.issn.1000-0526.2014.03.003, 2014.
Li, L. G. and De, L. G. E. : Analyses of microphysical features for spring precipitation cloud layers in east of Qinghai, Plateau Meteorology, 20, 191–196, https://doi.org/10.3321/j.issn:1000-0534.2001.02.013, 2001.
Li, S. S., Wang, X. F., Wan, R., and Li, G. P.: The Characteristics of Raindrop Spectrum in Different Altitude Region on the Eastern Slope of Qinghai-Xizang Plateau, Plateau Meteorology, 39, 899–911, https://doi.org/10.7522/j.issn.1000-0534.2019.00086, 2020.
Liu, L. P., Zheng, J. F., Ruan, Z., Cui, Z. H., Hu, Z. Q., Wu, S. H., Dai, G. Y., and Wu, Y. H.: The preliminary analyses of the cloud properties over the Tibetan Plateau from the field experiments in clouds precipitation with the vavious radars, Acta Meteorol. Sin., 73, 635–647, https://doi.org/10.11676/qxxb2015.041, 2015.
Mao, Z. Y., Huang, G. R., Huang, Y. B., Li, G. W., and Xing, F. H.: Characteristics Analysis of Raindrop Size Distribution during Hainan Autumn-Rainstorm Process, Natural Science Journal of Hainan University, 38, 59–66, https://doi.org/10.15886/j.cnki.hdxbzkb.2020.0009, 2020.
Marshall, J. S. and Palmer, W. M.: The Distribution of Raindrops with Size, J. Atmos. Sci., 5, 165–166, https://doi.org/10.1175/1520-0469(1948)005<0165:TDORWS>2.0.CO;2, 1948.
Ruan, Z., Jin, L., Ge, R. S., Li, F., and Wu, J.: The C-band FMCW pointing weather radar system and its observation experiment, Acta Meteorol. Sin, 3, 577–592, https://doi.org/10.11676/qxxb2015.039, 2015.
Shi, J. S., Zhang, W., Chen, T. Y., Bi, J. R., and He, M.: Raindrop-size distribution characteristics of the northern face of Qilian Mountains in the summer of 2006, J. Lanzhou University (Natural Sciences), 44, 55–61, https://doi.org/10.3321/j.issn:0455-2059.2008.04.011, 2008.
Shu, L., Li, M. S., Hua, S., Suo, L. J. C., Lv, Z., and Fu, W.: Statistical Characteristics of Raindrop Size Distribution and Microphysical Structure of Cloud in Yushu Region of Qinghai Tibet Plateau, Advances in Meteorological Science and Technology, 11, 113–121+134, https://doi.org/10.3969/j.issn.2095-1973.2021.04.016, 2021.
Ulbrich, C. W.: Natural Variations in the Analytical Form of the Raindrop Size Distribution, J. Appl. Meteorol. Clim., 22, 1764–1775, https://doi.org/10.1175/1520-0450(1983)022<1764:NVITAF>2.0.CO;2, 1983.
Ulbrich, C. W. and Atlas, D.: Assessment of the contribution of differential polarization to improved rainfall measurements, Radio Sci., 19, 49–57, https://doi.org/10.1029/RS019i001p00049, 1984.
Wang, F. Z., Wang, Q. S., He, S., Gu, X. P., and Yu, F.: Analysis of Summer Raindrop Spectrum Characteristics of Zheng'an in Guizhou, Journal of Chengdu University of Information Technology, 35, 689–696, https://doi.org/10.16836/j.cnki.jcuit.2020.06.016, 2020.
Xiong, J. N., Li, W., Liu, Z. Q., Cheng, W. M., Fan, C. K., and Zhang, H.: Monitoring and analysis of historical drought in southeast Tibet based on multi–source data, Arid Land Geography, 42, 735–744, https://doi.org/10.12118/j.issn.1000-6060.2019.04.04, 2019.
Xu, X. D. and Chen, L. S.: Advances of study on Tibetan Plateau experiment of atmospheric scicences, J. Appl. Meteor. Sci, 17, 756–772, https://doi.org/10.3969/j.issn.1001-7313.2006.06.013, 2006.
Yu, J. Y., Li, M. S., and Yin, S. C.: Analysis of Cloud Precipitation Microscopic Characteristic Raindrop Spectrum in Nagqu Area of Qinghai-Tibet Plateau, Journal of Chengdu University of Information Technology, 35, 188–194, https://doi.org/10.16836/j.cnki.jcuit.2020.02.010, 2020.
Zhang, G., Vivekanandan, J., Brandes, E. A., Meneghini, R., and Kozu, T.: The Shape-Slope Relation in Observed Gamma Raindrop Size Distributions: Statistical Error or Useful Information?, J. Atmos. Ocean. Tech., 20, 1106–1119, https://doi.org/10.1175/1520-0426(2003)020<1106:TSRIOG>2.0.CO;2, 2003.
Zhang, N. J., Xiao, T. G., and Jia, L.: Spatial and Temporal Characteristics of Precipitation in the Tibet Plateau from 1979 to 2016, J. Arid. Meteorology, 36, 373–382, https://doi.org/10.11755/j.issn.1006-7639(2018)-03-0373, 2018.


