the Creative Commons Attribution 4.0 License.
the Creative Commons Attribution 4.0 License.
Sampling the diurnal and annual cycles of the Earth's energy imbalance with constellations of satellite-borne radiometers
Thorsten Mauritsen
Linda Megner
The Earth's energy imbalance, i.e. the difference between incoming solar radiation and outgoing reflected and emitted radiation, is the one quantity that ultimately controls the evolution of our climate system. However, despite its importance, there is limited knowledge of the exact magnitude of the energy imbalance, and the small net difference of about 1 W m−2 between two large fluxes (approximately 340 W m−2) makes it challenging to measure directly. There has recently been renewed interest in using wide-field-of-view radiometers on board satellites to measure the outgoing radiation, as a possible method for deducing the global annual mean energy imbalance. Here we investigate how to sample in order to correctly determine the global annual mean imbalance and interannual trends, using a limited number of satellites. We simulate satellites in polar (90° inclination), sun-synchronous (98°) and precessing orbits (73, 82°), as well as constellations of these types of satellite orbits. We find that no single satellite provides sufficient sampling, both globally and of the diurnal and annual cycles, to reliably determine the global annual mean. If sun-synchronous satellites are used, at least six satellites are required for an uncertainty below 1 W m−2. One precessing satellite combined with one polar satellite results in root-mean-square errors of 0.08 to 0.10 W m−2, and a combination of two or three polar satellites results in root-mean-square errors of 0.10 or 0.04 W m−2, respectively. In conclusion, at least two satellites that complement each other are necessary to ensure global coverage and achieve a sampling uncertainty well below the current estimate of the energy imbalance.
- Article
(6168 KB) - Full-text XML
- BibTeX
- EndNote
The Earth's energy imbalance (EEI) determines the current rate of accumulation of energy in the climate system and is believed to have increased over the past decades (Kramer et al., 2021; Loeb et al., 2021; Raghuraman et al., 2021; Cheng et al., 2022; von Schuckmann et al., 2023). This net difference between incoming and outgoing radiation at the top of the atmosphere (TOA) is a fundamental property of the climate system and can serve as a useful quantity to indicate large-scale changes in the global energy budget over time and to better understand the climate system. The current best estimates of the TOA EEI over recent decades are 0.57 (0.43 to 0.72) W m−2 of net incoming radiation for the period of 1971–2008 and 0.79 (0.52 to 1.06) W m−2 for the period of 2006–2018 (Forster et al., 2021, p. 938). In this work, we take inspiration from the Earth Climate Observatory (ECO) satellite mission proposal and evaluate the potential of wide-field-of-view radiometers for long-term monitoring of the EEI.
Historically, analysis of the Earth's radiation balance has passed through multiple stages: from treatment of sporadic measurements, through the first organised attempts to achieve global coverage, to more numerous observations both from space and on Earth as humanity entered the satellite era. The different components of the Earth's TOA energy budget were initially investigated in the 19th century, but these investigations suffered from a lack of systematic global observations. The resulting values could be far from the ones we know today, notably exemplified by estimates of total solar irradiance at 1 au (i.e. the so-called solar constant) of over 2000 W m−2 (Shaw, 1926). Starting in the 20th century, improved observational data made it possible to analyse the global distribution of radiation in more detail and also to determine the global average more accurately. Estimates of the Earth's albedo were a central part of many studies, and initial overestimates gradually approached the now-established value of around 0.3 over the course of the first half of the century (Hunt et al., 1986; Goode et al., 2001). Notably, Danjon used observations of earthshine on the Moon to find an albedo of 0.29 as early as 1928 but later rejected this value in favour of an estimate revised to the higher value of 0.39 (Danjon, 1928, 1936; Hunt et al., 1986). A more detailed overview of the history of albedo studies can be found in Stephens et al. (2015).
In the second half of the 20th century, the first relevant satellite missions were launched. Satellites such as the Explorer 7 launched in 1959 and the Nimbus 3 launched in 1969 used radiometers to directly measure the TOA radiation (House et al., 1986). Over the course of the following decades, satellite missions evolved from short lifetimes of months to longer lifetimes of many years. The individual satellites followed various orbits, with an overall trend over time from drifting local times to sun-synchronous or geostationary orbits (House et al., 1986). The instrument payloads also gradually changed, from initial missions that had either wide-field-of-view (WFOV) radiometers, scanning radiometers or both to missions that had mostly scanning radiometers.
In parallel with the continued development of direct measurements at the TOA, there have also been efforts to determine the EEI from the change in the overall heat accumulated by the Earth, notably from the ocean heat content. These inventory methods rely either on in situ measurements of ocean temperatures or, for example, on satellite measurements of the ocean sea level and hence the thermal expansion of the oceans as well as contributions from melted land ice. By quantifying the change over time in the stored energy in the oceans, which take up most of the heat due to the positive EEI, it is possible to determine the corresponding average EEI over the same period (Wong et al., 2020; Hakuba et al., 2021; Marti et al., 2022; Meyssignac et al., 2023; von Schuckmann et al., 2023).
Current estimates of the EEI are based on both measurements by satellite radiometers and inventories from ocean heat content measurements. For satellite radiometry of the EEI, the current flagship satellite mission is Clouds and the Earth's Radiant Energy System (CERES; Wielicki et al., 1996), which uses scanning radiometers to measure the directional radiance at the satellite altitude and then relies on angular dependence models to translate measurements into actual fluxes. These models can typically introduce corrections of the order of 10 % for individual measurements (Loeb et al., 2018b).
For future measurements of the EEI, there are multiple potential methods that are being investigated and developed, ranging from extensions of current methods to novel conceptual ideas. An example of the former is the planned Libera mission (Hakuba et al., 2024), which is set to include scanning radiometers with higher spectral resolution than existing measurements and requires new angular dependence models to be created (Gristey et al., 2023). Wide-field-of-view radiometers are another relatively established type of instrument that has received renewed interest in recent years, concerning both instrument design and the potential for high-resolution measurements with large constellations of dozens of satellites (e.g. Gristey et al., 2017; Schifano et al., 2020; Swartz et al., 2019). By contrast, the novel conceptual ideas include Moon-based observation systems (Zhang et al., 2022, 2023). An alternative concept relies on the influence of radiation pressure on the motion of a satellite and would ideally use spherical black satellites equipped with accelerometers. The acceleration would then be translated into net flux measurements (Hakuba et al., 2023).
In this study, we specifically investigate the potential of simple wide-field-of-view radiometers. This investigation is connected to the proposed European Earth Climate Observatory (ECO) mission, which would conceptually function as illustrated in Fig. 1: a constellation of satellites, each measuring the EEI by differential measurement of incoming and outgoing radiative fluxes, for an absolute uncertainty in the annual EEI within 1.0 W m−2. The main instruments are four identically designed wide-field-of-view radiometers that measure the radiation from limb to limb. Rotation of the satellite enables differential calibration between the Earth-facing and space-facing radiometers, which makes it possible to eliminate certain common systematic biases from the final EEI measurement. Spare radiometers that are normally kept closed make it possible to monitor the drift of the main radiometers over time. In addition, cameras allow some limited distinction between longwave and shortwave signals; they also enable spatial resolution.
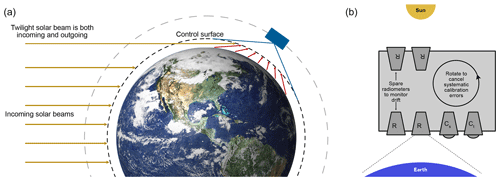
Figure 1Measurement principle of the proposed ECO satellite mission. Panel (a) is a schematic of the observation from each satellite, measuring all radiation from within the control surface. Panel (b) shows a simplified view of the intended satellite payload, namely the four wide-field-of-view radiometers (R) and the shortwave (Cs) and total (Ct) cameras that observe the Sun and the Earth. The idealised viewing geometry considered in the current study is presented in more detail in Sect. 2.3.

Figure 2(a) Map of annual-mean net radiation. (b) Reference monthly (dashed) and annual (solid) mean time series of global mean Earth energy imbalance (EEI) at TOA. Based on 2001–2020 CERES SYN1DEG data.
Here we focus only on sampling errors using the Earth-facing radiometer, with the intention of prioritising the accuracy of the long-term global mean over the spatial and temporal resolution. In particular, we investigate the effects of diurnal and annual sampling issues within an otherwise idealised framework. There are many other potential sources of error. For example, an earlier study found that the dominating source of error for the Earth Radiation Budget Experiment (ERBE) satellite mission was the thermal environment of the instruments (Wong et al., 2018). Other studies have also analysed the requirements of a reference level for TOA radiation studies (Loeb et al., 2002). Neither of these types of errors is addressed in the current study. This current work considers purely Lambertian emission, but a detailed investigation into the effects of the angular dependence of the radiation is planned for a future study.
The diurnal cycle presents certain difficulties as a result of variations in the sampling of a single satellite, something that has been known since at least the 1970s (Campbell and Vonder Harr, 1978; Salby, 1988; Kirk-Davidoff et al., 2005; Taylor and Loeb, 2013). Several studies have investigated the potential of satellites that gradually change the observed local time, usually with the goal of a monthly resolution in time and regional or higher spatial resolution (Campbell and Vonder Harr, 1978; Vonder Harr and Smith, 1979; Kirk-Davidoff et al., 2005; Smith et al., 2014; Gristey et al., 2017). Nevertheless, later efforts have typically considered sun-synchronous orbits and relied on a diurnal model to synthesise full sampling of the diurnal cycle, which requires that the model does not introduce additional errors (Young et al., 1998; Doelling et al., 2013). Our objective is to manage these issues without a diurnal model, instead relying on the direct sampling of the diurnal cycle and introducing as few a priori assumptions as possible in our synthetic measurement of the annual global mean. In principle, it would be possible to mitigate the difficulties if a large number of satellites could be used for dense sampling of the whole Earth at each moment in time. In practice, of course, any real mission will face physical, logistical and budget restrictions on the number and location of satellites. It is therefore interesting to explore how the sampling error in the EEI depends on the orbits chosen.
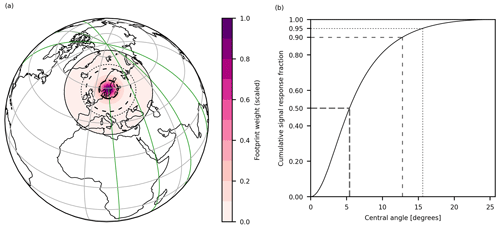
Figure 3(a) Satellite path and sample footprint. The solid green line shows the satellite path of a polar satellite. The solid black line shows the edge of the satellite footprint for a satellite at an altitude of 700 km. The footprint weights are scaled by a common factor such that the maximum value (immediately below the satellite) is unity. (b) Cumulative signal response fraction as a function of the central angle (see Fig. 5) for measurement of a homogeneous field. The dashed lines in both figures show the 50 %, 90 % and 95 % thresholds for the cumulative response function. The maximum central angle is 25.71°.

Figure 4Sample 1 h radiation field for outgoing longwave radiation at TOA (global mean 234.64 W m−2) (a) and at the satellite altitude based on Lambertian emission (global mean 190.48 W m−2) (b). The radiation field at the satellite altitude, which is computed from (a) according to Eq. (1), illustrates both the smoothing effect of the satellite footprint and the decreasing magnitude with the square of the fractional orbital radius (parameters defined in Fig. 5): .
In line with our investigation of satellite sampling issues, this section describes the methods used to simulate idealised satellites and what they would measure. To that end, we use reference data for the radiation field and a measurement kernel to generate each individual measurement. This is combined with a framework for simulating satellite positions in space and finally the conversion of the measurement time series into global averages that can be compared with those of the original reference data.
2.1 TOA radiation from CERES reference data
As the best available reference for top-of-atmosphere (TOA) radiation, we used data from the CERES satellite mission. CERES offers two particularly relevant data products: EBAF (Energy Balanced and Filled) data, where the TOA net flux is constrained to match EEI estimates from ocean heat storage measurements, and SYN (synoptic) data, where the focus is on regional and diurnal behaviour. We chose to use the SYN product (edition 4A) in order to be able to investigate regional sampling issues and the impact of the diurnal cycle (NASA/LARC/SD/ASDC, 2017). By contrast, the particular absolute magnitude of the reference radiation budget is less important in this study since the results are all analysed relative to this reference magnitude. Specifically, we used the all-sky TOA fluxes (hourly data on a 1° × 1° grid).
The time-averaged global TOA radiation field shows a large net influx of energy at lower latitudes and a large net outflux of energy at higher latitudes, with some regional variation as a result of smaller-scale features (Fig. 2). In the global mean, the monthly EEI time series fluctuates between nominally −5 and +15 W m−2, while the year-to-year variations in the annual time series are an order of magnitude smaller (Fig. 2). It is worth noting that this overall EEI time series is known to be inconsistent with current best estimates (Loeb et al., 2018a). This work nevertheless treats the SYN EEI value as if it were the true reference level for the purpose of evaluating the performance of the hypothetical satellites. As such, the nominal 5 W m−2 SYN bias does not affect the conclusions of the study.
We assume that the Earth is a perfectly spherical emitting shell with a radius of 6371 km, corresponding to TOA at zero altitude for simplicity, and radiative fluxes are given by the all-sky TOA fluxes from the CERES reference data. This emission is assumed to be Lambertian. No atmospheric twilight transmission was included (Fig. 1; see also Sect. 2.3).
2.2 Measurement kernel
Mathematically, each individual measurement of the satellite-level radiative flux F can be described by an integral over solid angle of the radiance from each visible surface element towards the satellite, projected onto the satellite normal (Smith and Green, 1981; Green et al., 1990). Nevertheless, because we are using CERES data for radiant exitance (i.e. the non-directional total flux) instead of radiance, the integral is expressed in a slightly different way and performed over the visible surface area. For a Lambertian surface, the radiance is independent of the viewing angle. If the total flux emitted by the surface element is M, the radiance I from that same element along a zenith angle θ is . Taking into account the decrease in the irradiance at the measurement location with distance d and a perfect cosine instrument response, the overall integral is
where A is the satellite-visible area of the emitting shell. The satellite viewing angle η and zenith angle θSAT are shown in Fig. 5. For non-Lambertian emission, the integral would require an anisotropy factor, which is typically parameterised as a function of the relevant angles and grouped into an angular dependence model (ADM) for a given scene type, to account for the angular dependence of the radiation (Loeb et al., 2003, 2005). Note that this is separate from a shape factor, which would be used to invert the satellite-level measurement to an estimate of the flux at a different altitude (Green and Smith, 1991). For a non-perfect instrument response, the ideal cos (η) factor would no longer apply and would in general be replaced by some instrument-specific function of η.
In this idealised Lambertian case, the measurement kernel is at a maximum immediately below the satellite and decreases for surface elements further from the satellite sub-point. As a result, surface elements near the centre of the satellite footprint dominate the overall measurement, as illustrated by the footprint weights shown in Fig. 3. For instance, half of the signal originates from within a central angle (Fig. 5) of 6°. This also means that the overall measurement is more sensitive to deviations from the ideal cos(η) factor in the instrument response at small η than at large η. Small-η deviations would typically be caused by inhomogeneities within the core of the instrument, while large-η deviations may instead be the result of geometric effects at the limits of the field of view.
The radiation field observed at the satellite altitude is the result of a convolution of the TOA field and the measurement kernel. As illustrated in Fig. 4, the resulting field retains large-scale features such as general differences between the poles and the equatorial regions, but smaller-scale features are lost in the smoothing process.
2.3 Viewing geometry and instrumentation
The geometry of a satellite observing a given point can be illustrated by a triangle with corners at the satellite, the surface point and the centre of the Earth, as shown in Fig. 5.
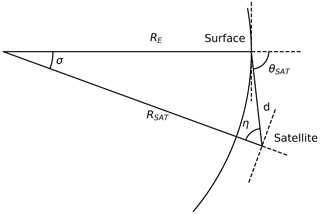
Figure 5Diagram of viewing geometry for a satellite observing a point on the Earth's surface. The angles marked are the satellite zenith angle θSAT, the satellite view angle η and the central angle σ. Also marked are the distance between the satellite and the surface point d, the distance from the centre of the Earth to the surface point RE, and the distance from the centre of the Earth to the satellite RSAT. The dashed lines show the local normal and horizontal at the surface and at the satellite.
The synthetic instrument being considered is an idealised wide-field-of-view radiometer, inspired by both first-principles studies and actual instrument designs (Mishchenko et al., 2016; Schifano et al., 2020). Such an instrument integrates incoming radiation from the entire footprint and from across the electromagnetic spectrum. To capture the correct radiation field, the field of view has to be sufficiently large to cover not only the visible Earth segment but also the atmosphere up to the altitude of a hypothetical control surface that contains the emitting atmosphere. The satellite would also periodically receive solar twilight radiation that passes through this atmospheric layer directly (Fig. 1). In our idealised framework, however, we treat the surface of the Earth as an emitting shell that exactly fills the satellite field of view and do not consider incoming solar radiation that may contribute to the outgoing radiation.
The angular size of the real Earth varies slightly between the Equator and the poles because of the equatorial bulge of the planet, but this has limited effect as long as the field of view allows the satellite to see from horizon to horizon. For a spherical Earth, the required field of view is constant at , which for our chosen radius is 128.6°. We assume that this instrument makes one measurement every minute, with zero satellite pointing error and with a perfect cosine response to accurately measure the irradiance at the satellite altitude.
2.4 Satellite orbits
To generate synthetic satellite measurements, idealised satellites were simulated at an orbital altitude of 700 km. They were initialised in circular zero-drag orbits with four different inclinations, as illustrated in Fig. 6. Because the orbital motion is fundamentally caused by the gravitational force from the Earth, gravitational variations due to the aspherical shape of the Earth exert torque on a satellite in a non-polar orbit, which causes the orbital plane to precess; i.e. the satellite orbital plane will rotate over time in a celestial reference frame (Kaplan, 2006). For a first-order expansion of the spherical harmonics of the geopotential, the rate of precession is proportional to the cosine of the inclination (IERS Convention Centre, 2010; Rees, 2012). As shown in Fig. 6, the inclination also determines the maximum latitude that the satellite reaches, which may lead to blank spots in the sampling.

Figure 6Satellite orbits with different inclinations. From (a) to (d): 73, 82, 90° (polar) and 98° (sun-synchronous). The inclination describes the angle the satellite makes against the Equator as it crosses from the Southern Hemisphere to the Northern Hemisphere, which is the same as the maximum latitude it reaches before returning south.
Table 1Settings used to compute satellite trajectories with the SGP4 simplified perturbation model (Vallado et al., 2006; Vallado and Crawford, 2008).
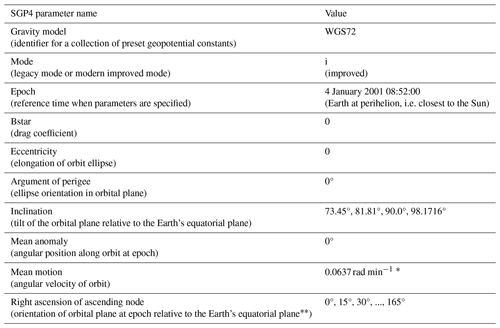
* This is only an approximation. The exact value of the mean motion is determined from the orbital period and is ultimately computed as , where m3 kg−1 s−2 is the gravitational constant, kg is the mass of the Earth and m is the radius of the orbit.
Specifically, the angle is given with the March equinox as the reference.
First consider a polar satellite, i.e. with a 90° inclination. By definition, such a satellite passes directly over the poles, with no net torque on the satellite and hence no precession. The orbital plane thus has a constant orientation in the celestial reference frame, and the polar satellite gradually observes different local solar times as the Earth orbits around the Sun. Provided that the satellite is observing on both sides of the planet in one orbit (i.e. both night and day or dusk and dawn), one such satellite samples the diurnal cycle in half a year.
Next, consider a satellite in a sun-synchronous orbit: the rate of precession exactly matches the orbital rate of the Earth around the Sun, so that the satellite always observes the same local time at the Equator, with gradually larger deviations from the Equator local time as the satellite observes higher and higher latitudes. As a result, a sun-synchronous satellite always samples the same part of the diurnal cycle. For our chosen orbital altitude, this corresponds to an inclination of 98.1716°, which is labelled as 98° in the rest of this article. Technically, this is a specific case of a precessing satellite, but in this article it will only be referred to as sun-synchronous.
Lastly, consider a satellite where the precession rate is such that the diurnal cycle is sampled multiple times per year. With our chosen orbital altitude, orbits with inclinations of 81.81 and 73.45° (labelled as 82 and 73° in the rest of this article) sample the diurnal cycle four and six times per year. These two orbits are described as precessing in this article. In principle, it is possible to use precessing orbits with even lower inclinations, but a simplified analysis indicated that the benefit decreased below approximately 60°.
For our simulations, the orbital trajectories were computed using the SGP4 simplified perturbation model (Vallado et al., 2006) with the settings and parameters shown in Table 1. The effect of satellite thrusters for orbital maintenance was included by setting the drag coefficient to zero.
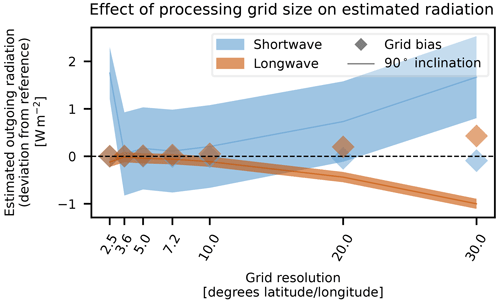
Figure 7Estimated outgoing shortwave and longwave radiation and the effect of the processing grid size (see Sect. 2.5) for the period of 2001–2020. The shortwave component includes the correction described in Eq. (2) near the end of Sect. 2.5. The lines mark the annual mean deviation from the reference truth for results from individual 90° satellites, with shaded regions showing the annual standard deviation. The same set of synthetic satellite measurements were used for all cases, but they were processed on grids with different spatial resolutions. The diamonds mark the bias associated with remapping the true reference field onto the grid in question.
2.5 Conversion to global mean
In order to compute a meaningful global average from the series of individual measurements, it is important that the averaging method accounts for the original sampling used when producing the measurements. For example, it is straightforward to see that a polar satellite will sample more densely at higher latitudes than at the Equator because of the geometry of the Earth. On a global scale, then, each individual measurement near the pole should arguably carry less overall weight than each individual measurement near the Equator. For a polar satellite, this is easily addressed by a sinusoidal weighting with measurement latitude, but in order to also handle non-polar satellites, we bin the measurements on a coarse latitude–longitude grid and process each bin separately. It is important that each bin be big enough to contain sufficient values to produce an accurate mean, while small enough to minimise biases within the bin and biases from the subsequent global averaging process. Given that the satellites can move almost 4° in latitude between measurements, the latitude bin width should be at least this size to avoid missing bins even when passing over them. We have investigated the effect of different bin sizes from 1° × 1° to 30° × 30° and find that the trade-off between bin return frequency and global-averaging error results in minimal errors for bin widths of nominally 3.6 to 10°. Figure 7 illustrates that the shortwave results show overall positive biases from the individual satellites and negative biases from the grids, while the longwave results show the opposite. These errors partially compensate for each other in the total results, but the shortwave biases still dominate.
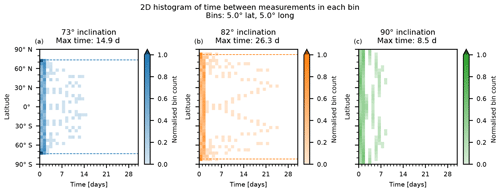
Figure 9Distribution of return times between subsequent measurements in a single latitude–longitude bin for different satellite inclinations. The results are for a single satellite over 20 years. The dashed lines show the latitude extent of the satellite orbit. The bin counts are normalised so that unity corresponds to the overall expectation value per latitude band, i.e. the total number of counts divided by the number of latitude bins. For non-polar orbits, the bins closest to the poles will have zero counts by construction, so the normalised count in the remaining latitude bins may exceed unity.

Figure 10Schematic overview of the sequence of processing steps to convert satellite measurements into global mean values.
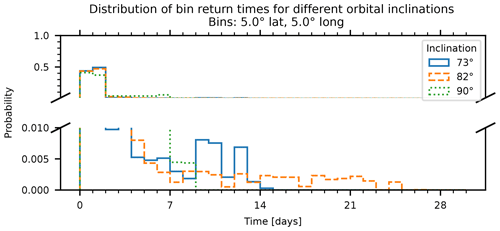
For this study, a 5° × 5° grid was used. This was chosen because it is in the previously mentioned range for minimal bin-size errors and because each individual grid cell is typically observed at least every 2 weeks, with most return times being far shorter. On average, this corresponds to between 200 and 250 measurements per bin and year, but the measurements for each bin are not evenly spaced in time as a result of the satellite orbit. The overall distribution of return times is shown in Fig. 8. Regardless of inclination, 80 %–90 % of measurements occur with a return time below 48 h, approximately evenly split between the first and second 24 h periods. The few remaining return times are spread across the tail of the distribution, with maximum return times of 9 d (90°), 15 d (73°) or 23 d (82°). A more detailed zonal distribution of the return times is shown in Fig. 9. There are some periodic zonal patterns to be seen in the occurrences of the long return times, but all latitudes nevertheless have typical return times below 48 h, in line with the previously mentioned overall distributions. As a consequence of the orbital trajectory, precessing orbits notably result in a greater number of measurements near the minimum and maximum orbit latitudes, with shorter return times in these specific regions as a result.
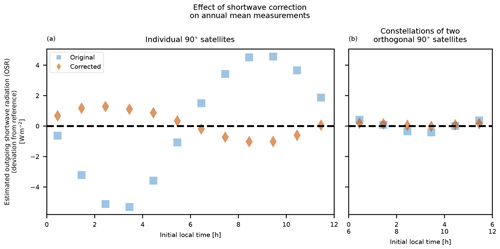
Figure 11Effect of correction of the estimated outgoing shortwave radiation based on measurements from 12 polar satellites for the year 2001. Panel (a) shows the deviation in estimated outgoing shortwave radiation using measurements from individual 90° satellites, with and without the shortwave correction described in Sect. 2.5. Panel (b) shows corresponding results for constellations of two orthogonal satellites, combined as per Sect. 2.5. The mechanics of the sinusoidal single-satellite deviation are addressed in Sect. 3.2. Constellations of polar satellites are detailed further in Sect. 3.3 and illustrated in Fig. 17.
A less obvious consideration is the variation in diurnal solar irradiation over the course of a year, where the local diurnal cycle is modulated by the amplitude of the overall incident solar radiation, which depends on the distance to the Sun. Depending on the orientation of the satellite orbital plane in relation to the orbit of the Earth around the Sun, this can lead to systematic biases depending on how the resulting apparent diurnal profile compares to the true diurnal profile. To address this issue, we apply a simple shortwave correction based on incoming and outgoing radiation, as described below. Note that this correction requires a method to separate the full-spectrum radiometer measurements of outgoing radiation into the longwave and shortwave components, such as the proposed ECO cameras (Fig. 1). We mainly assume that the fraction of shortwave to total outgoing radiation, and by extension the outgoing shortwave radiation itself, is measured perfectly, but we also perform a sensitivity test where this fraction is systematically ±10 % different compared with the true value. We consider the incoming solar radiation to be much more predictable than this and the associated correction errors to be negligible by comparison.
A general schematic of the processing sequence is shown in Fig. 10. More specifically, the following steps were carried out:
-
We computed synthetic measurement time series for each satellite with the kernel described in Sect. 2.2. Measurements were computed separately for outgoing longwave radiation (OLR), outgoing shortwave radiation (OSR) and incoming shortwave radiation (ISR) based on the corresponding fields in the reference CERES data.
-
We binned the measurements for each year on a 5° × 5° grid based on the coordinates of the satellite sub-point at the time of measurement. The annual sum of measurement values was stored in each bin.
-
We combined binned measurements from the different satellites within the chosen constellation as the sum of the corresponding measurement values. Note that for some constellations, a given satellite may only contribute to specific latitude bands (Sect. 3.3). If only a single satellite is being used, this step has no effect.
-
Within each bin, we computed the average measurement value for each radiation variable.
-
We computed a corrected value for OSR based on the measured ISR value, ISR, and the corresponding perfectly sampled reference truth ISR value from CERES, ISRCERES. For each bin b and year y
As shown in Fig. 11, this shortwave correction reduces the magnitude of the deviation from the reference. For convenience, the orbital plane is parameterised according to the equivalent local time observed at the reference epoch (Table 1).
-
We computed annual global means of the average binned measurements, weighted by the bin areas.
The resulting global annual mean EEI can then finally be computed as ISR−(OLR + OSRcorrected).
With the above explanation of how to translate measurement series into a global mean value, all that remains is to apply this method to specific satellite orbits and constellations. We shall see that the performance of different types of orbits and combinations thereof differs qualitatively regarding the EEI estimate. Let us start by considering sun-synchronous satellites.
3.1 Sun-synchronous satellites
By definition, the diurnal sampling of individual sun-synchronous satellites is limited to two samples per day at fixed times for a given latitude. As such, we can expect the straightforward mean of the measurements from a single satellite to be systematically biased depending on the observed local solar time. This is shown in Fig. 12 for the estimated total outgoing radiation. Of course, an estimate of the actual quantity of interest, the EEI, would in principle also require a measurement of the incoming component. Nevertheless, due to the fact that the sun-synchronous satellite by construction has a near-constant viewing angle to the Sun, we can expect that measurements of the incoming solar radiation will be very stable. Hence the main quantity of interest and the main source of uncertainty is the outgoing radiation component. The biases of up to several tens of W m−2 mean that a single sun-synchronous satellite is insufficient for measurement of the EEI in this way.
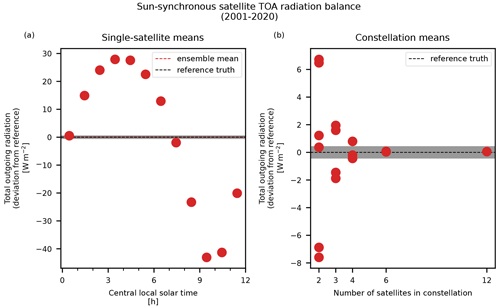
Figure 12(a) Observed total outgoing radiation for sun-synchronous satellites at different local solar times. (b) Mean total outgoing radiation for constellations of evenly spaced sun-synchronous satellites. These values do not use albedo-corrected shortwave radiation, as the limited diurnal sampling of the sun-synchronous satellites actually means that the albedo correction makes the estimate worse. The error bars and shaded areas show the standard deviations for the annual means.
Can better performance be achieved by combining multiple sun-synchronous satellites in a constellation? The more individual satellites there are, the better the diurnal sampling, and six satellites evenly spaced in sampling local time are enough for an overall uncertainty well below 1 W m−2 in the outgoing radiation (Fig. 12). However, such a large number of satellites may not be feasible for a real mission. If fewer sun-synchronous satellites are to be used, they would require a model of the diurnal cycle to compensate for the bias, as is used in CERES products (Doelling et al., 2013). Because we want to limit our usage of such models so as not to introduce errors, we might instead consider the use of satellites that directly sample the diurnal cycle. Sun-synchronous constellations are briefly discussed further in Sect. 3.3.
3.2 Single satellites: polar and precessing
Unlike sun-synchronous satellites, both polar and precessing satellites gradually observe different local times over the course of a year. As mentioned in Sect. 2.5, this can potentially lead to systematic biases depending on the chosen satellite orbital plane. Three examples of satellite trajectories in local-time space are shown in Fig. 13. We see that the period of the polar orbit (90°, right panel) coincides with the period of the global variations in TOA imbalance, which in turn is dominated by the incoming solar radiation such that a given polar satellite may consistently observe local maxima or minima and ultimately provide a biased estimate of the EEI (Fig. 14). By contrast, the precessing orbits have periods that are sufficiently different from the main period of the underlying EEI that they achieve negligible sampling error from the annual and diurnal cycles (Fig. 14).
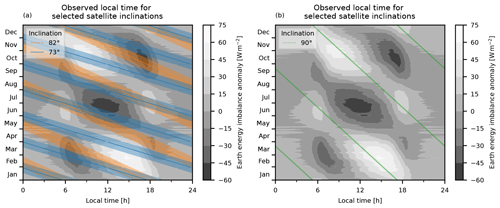
Figure 13Plot of the variation in local solar time over the course of 2001 for satellites with different inclinations ((a) 73° and 82°; (b) 90°), showing both the daily median local time and the daily standard deviation of the local time. Underneath the local-time trajectories are contours of the local-time reference truth EEI anomalies relative to the annual mean value for each local time.
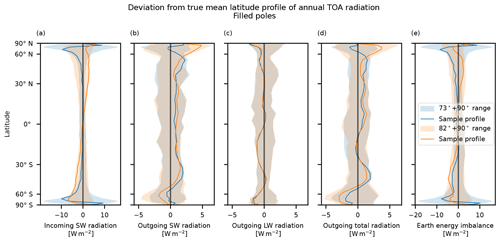
The spread in observed values can also be illustrated as a range of the latitude profile for each type of orbital inclination, as shown in Fig. 15. Individual polar satellites have the advantage that they cover the whole Earth, but they barely achieve an uncertainty below 1 W m−2, and these large systematic errors need to be addressed. Lower-latitude satellites (73 and 82°) have much smaller biases of the order of only 0.1 W m−2 or less, but on the other hand they miss data from the polar caps.
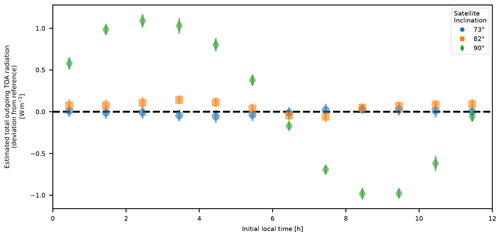
Figure 14Total outgoing radiation as estimated by individual satellites with different orbital inclinations. Each point represents the mean annual deviation from the reference truth over the period of 2001–2020, with error bars showing the standard deviation of the annual deviation. The reference truth is computed separately for each satellite, covering only the latitude range of the satellite. For example, the 90° estimates are compared with the full global mean, whereas e.g. the 82° estimates are compared with an area-weighted mean of the true latitude profile from 82° S to 82° N.
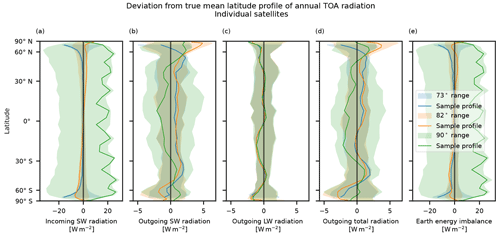
Figure 15Deviation of the TOA profile relative to the smoothed reference truth for single-satellite latitude profiles. The shaded regions show the minimum and maximum for the given inclination over 20 years for all initial local times. The variations in the incoming shortwave radiation (a) and in the Earth energy imbalance (e) are dominated by the effect of the initial local time. The variation in the outgoing longwave radiation (c) is dominated by year-to-year variations. The variations in the outgoing shortwave (b) and total radiation (d) are due to both initial local time and year-to-year variations. The solid lines show the results for one satellite and a single year, to indicate a typical latitude profile. The mean values for the outgoing total radiation are found in Fig. 14. The 73 and 82° satellites generally have lower deviations than the 90° satellites at lower latitudes, but on the other hand they miss data from the regions closest to the poles.
We can conclude that no single satellite provides sufficient coverage of both the whole Earth and the diurnal cycle. A natural next step is to combine different kinds of satellites to mitigate these limitations.
3.3 Satellite constellations
Since the precessing 73 and 82° satellites were observed to achieve good diurnal sampling, one precessing satellite is used as a starting point in this section, and a 90° satellite is used to fill in only the otherwise missing data at the poles. Results for these combinations are shown in Table 2. The combined errors for the 73° + 90° constellation are smaller than those of the 82° + 90° constellation, so we can conclude that the higher diurnal sampling rate of the 73° satellite is more beneficial than the greater latitude range of the 82° satellite.
It is worth noting that the orientation of the orbital plane, which is a function of initial local time, for either satellite in the constellation makes only a very small difference in the final estimate. Essentially, the precessing satellites sample the diurnal cycle frequently enough for any initial differences amongst them to soon shrink. The polar satellites are effectively only measuring near the poles, where they would be measuring much the same radiation field regardless of their orbital plane because all polar orbits converge at the poles. The latitude deviation profiles of these constellations are shown in Fig. 16.
Table 2Annual root-mean-square error (RMSE) in total outgoing TOA radiation, with and without shortwave correction (SW corr), relative to the reference truth. These errors are computed over all 20 years and all ensemble members. The values are based on measurements with five different constellations, as identified by the inclination of the satellites. The 73°+90° and 82°+90° constellations use one precessing satellite in combination with one polar satellite to fill in data for the poles. Results are also shown for the case of systematic positive or negative bias in the camera-determined OSR fraction (Sect. 2.5). The results for individual satellites (73, 82, 90°) based on the data from Fig. 14 are included for comparison.

* These results only cover the latitude range of the satellites and thus do not include the full polar regions. The effect of missing polar data is discussed in Sect. 3.4.
Table 3As Table 2 but for constellations of sun-synchronous satellites (98°).

* These results only cover the latitude range of the satellites and thus do not include the full polar regions. The effect of missing polar data is discussed in Sect. 3.4.
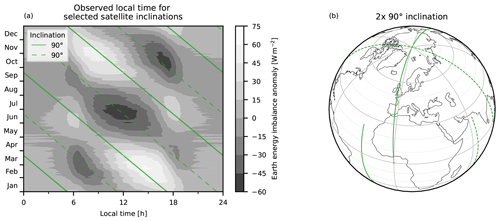
Figure 17Panel (a) is as Fig. 13 but for two orthogonal 90° satellites. Panel (b) shows sample trajectories for two orthogonal 90° satellites. As shown in panel (a), the complementary trajectories of the two satellites are such that they together observe both maxima and minima and together reach a mean value that is much closer to the true mean than the mean from either satellite individually.
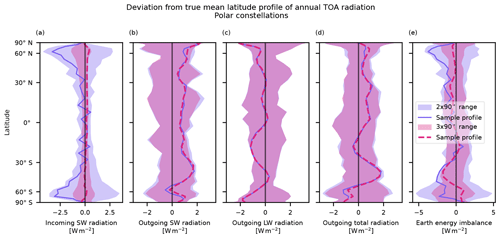
Next, instead of using two different kinds of orbits to each shore up the weakness of the other, we consider the use of multiple polar satellites in combination to mitigate the systematic biases in their diurnal sampling. With two polar satellites, the two orbital planes should be orthogonal to each other or equivalently 6 h apart in observed local time (e.g. 00:00/12:00 and 06:00/18:00). The trajectories and local-time paths of such a constellation are illustrated in Fig. 17. In a similar way, a constellation with three polar satellites should observe local solar time 4 h apart (e.g. 00:00/12:00, 04:00/16:00 and 08:00/20:00) in order to achieve an even sampling of the diurnal cycle, and a constellation with four polar satellites should have the orbital planes 3 h apart.
As shown in Table 2, the triple-polar constellation achieves a lower error, with the 0.04 W m−2 RMSE well within 0.1 W m−2. The double-polar constellation RMSE of 0.10 W m−2 is slightly larger, exactly at the 0.1 W m−2 threshold. The latitude deviation profiles of these constellations are shown in Fig. 18. The double-polar constellation has comparable performance to a 73°+90° or an 82°+90° constellation. The inclusion of a third satellite can lead to further improvement, as the triple-polar constellation performs noticeably better than all three two-satellite constellations. The shortwave correction consistently leads to a clear improvement for all these constellations, with only a small sensitivity to a 10 % bias in the OSR fraction. The four-polar constellation performs only marginally better than the triple-polar constellation, with the same shortwave-corrected RMSE, but it is worth noting that the fourth satellite seemingly negates the need for the shortwave correction altogether.
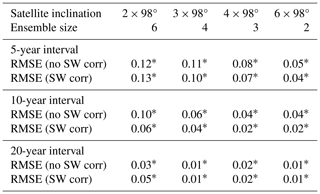
Lastly, we briefly consider the performance of these constellations compared with constellations of multiple sun-synchronous satellites. As was mentioned in Sect. 3.1, single sun-synchronous satellites result in too large uncertainties with the current methodology, and multiple satellites are required to achieve the desired level of uncertainty. Table 3 shows this in more detail and illustrates that six sun-synchronous satellites are necessary for results comparable to two or three satellites in one of the configurations from Table 2. The sun-synchronous satellites could still have other practical benefits related to e.g. intercalibration and shared launches since there are many other satellites in sun-synchronous orbits, but it is hard to include this in the current assessment in a meaningful way.
To summarise the performance of the different constellations, we note that a sun-synchronous constellation requires a large number of satellites to be reliable, but all of the previously mentioned combinations of two or more 73, 82 or 90° satellites result in typical uncertainties within 0.1 W m−2. The results also indicate that the shortwave correction introduced in Sect. 2.5 is robust even for biases of ±10 % in the camera-measured shortwave fraction, but the improvements from the shortwave correction can otherwise be achieved by including additional satellites.
Table 4Root-mean-square error (RMSE) in the trend of total outgoing TOA radiation, with and without shortwave correction (SW corr), relative to the reference truth. All values are given in units W m−2 per decade. These errors are computed over all ensemble members and all non-overlapping time periods for each period length. The values are based on measurements with five different constellations, as identified by the inclination of the satellites. The 73°+90° and 82°+90° constellations use one precessing satellite in combination with one polar satellite to fill in data for the poles. The results for individual satellites (73, 82, 90°) are included for comparison.
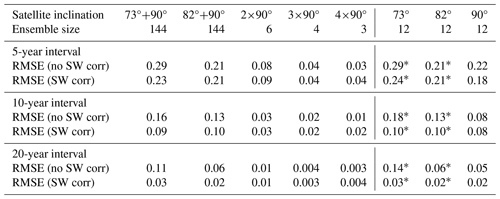
* These results only cover the latitude range of the satellites and thus do not include the full polar regions. The effect of missing polar data is discussed in Sect. 3.4.
3.4 Single satellites: revisited
In previous sections it has been demonstrated that constellations perform better than individual satellites, as we might intuitively expect; nevertheless, it is worth briefly revisiting the single satellites to further examine their potential. For instance, there may be logistical constraints such that only one satellite can be used for a certain period, or the permanent loss of a satellite may require the processing method of the remaining data to be adjusted.
In Sect. 3.2 we identified two weaknesses of individual satellites: missing data from the poles (73 and 82° satellites) and biased sampling of the diurnal cycle (90° satellites). In order to address the former, these satellites could potentially have the missing data filled in. This might be done by adapting measurements from the ECO cameras, which would still observe all latitudes even if the satellite itself only reaches 73° S/73° N. However, radiances from the polar regions would only be observed at relatively large satellite zenith angles, and we would need an angular dependence model to translate these measurements into fluxes for these regions. Rather than consider the complex effects of all the potential components of such a model, let us instead focus on different levels of overall performance.
If we first neglect the missing data altogether and compare the area-weighted mean of the satellite results directly with the reference global mean, it turns out that these results actually fall very close to the reference truth, with typical overall deviations of the order of 0.1 W m−2 for the annual outgoing radiation. This is not so surprising, given that the 73 and 82° satellites already pass directly over most of the Earth's surface (95.9 % and 99.0 %, respectively). However, this relies on an unspecified implicit correlation between the missing polar regions and the measured rest of the world rather than an explicit estimate of the missing data.
As a next step, let us assume that the chosen method somehow manages to perfectly fill the data gaps, which would mean that the 73 and 82° results from Fig. 14 and Table 2 would hold for the global mean. At an overall error of only approximately 0.1 W m−2, this would be a very good result for a single satellite measuring the whole Earth. More realistically, the method for filling the gaps is likely to introduce additional errors that may result in a systematic bias of the final result. If these missing data are filled with data that have a systematic bias of, say, 10 W m−2 (nominally 3 % of the global mean outgoing flux), this would then affect the final global average proportionally to the fractional global area of the missing data. For a single 73 or 82° satellite, this would lead to a systematic bias in the final global average of 0.4 or 0.1 W m−2, respectively.
In order to remain within the nominal target uncertainty of 1.0 W m−2, we could then in principle accept systematic errors of 20 or 80 W m−2 for these regions. The 82° orbit thus has a clear advantage in this particular case by virtue of its higher maximum latitude. However, this threshold is only a theoretical upper bound, based purely on the sampling error and the area of the affected polar regions. In practice, additional error sources would need to be accounted for, and the maximum tolerable systematic error would be much lower.
Overall, single satellites could be a viable option provided that missing data can be properly accounted for. However, a more straightforward solution is to include one or more additional satellites, as per the investigations in previous sections.
3.5 Trends
As a slightly separate topic, we will now briefly address the potential of trend determination using the satellites studied, both individually and in constellations. For reference, the 2001–2020 trend in the CERES input data used here, determined by simple linear regression, is +0.33 W m−2 per decade (net radiation) or −0.36 W m−2 per decade (total outgoing radiation). Tables 4 and 5 show the RMSEs in the trend over time periods of different lengths for the various satellites and constellations. Results for the case of systematic positive or negative bias in the camera-determined OSR fraction (Sect. 2.5) are not included for brevity but change little compared with the unbiased correction, much like the case with Table 2.
As with the annual-mean results in previous sections, the error decreases as the number of satellites increases, and here extended time intervals also lead to reduced errors. Already after 5 years, the RMSE for all constellations is smaller than the actual trend value, which is very promising for detection. There are a few other points that stand out among the results: first, it is worth noting that even single satellites perform reasonably well. In particular, the 90° satellites are now comparable with the 73 and 82° satellites, unlike the annual-mean results where single 90° satellites performed noticeably worse. Second, the 2×90° constellation now performs noticeably better than the 73° + 90° and 82° + 90° constellations, with RMSEs reduced by at least half in comparison with those constellations. Third, the shortwave correction that resulted in clear improvements for the annual means still results in an improvement in almost all cases, but the effect is less pronounced in the trend results. Fourth, constellations of sun-synchronous satellites perform significantly better in the trend than in the annual means. In fact, the 2 × 98° constellation now performs better than the 73° + 90° and 82° + 90° constellations. The trend errors from sun-synchronous constellations are comparable to but still slightly greater than those from polar constellations with the same number of satellites.
Overall, these results show that trend measurements are possible with all of the constellations investigated and that their sampling errors allow for detectable trends within 5 years.
3.6 Future studies
The analysis above allows some conclusions to be drawn, but there are issues that remain for further investigation in future studies. As mentioned in the introduction, an investigation of angular dependence and anisotropic radiation is already planned, which should provide valuable insights into the shortwave radiation in particular. It would be reasonable to analyse twilight transmission and the associated error in more detail at the same time. The transmission would mainly be determined by the geometry of the Sun, the Earth's surface and the satellite field of view, but the atmospheric layer would in principle also have an effect. On the satellite side of the analysis, it would be relevant to properly investigate the effects of the instrument response on the final result and determine quantitative requirements for the instrument performance. In terms of the data used as input, it may be worth analysing the simulated satellite performance in relation to the features of the original input, e.g. which features are detectable and carry through to the final result. Ideally, this could be done as a study of point-source radiation in different locations, in line with Green's function responses. An obvious candidate would be a set of input data that correspond to different past or future scenarios for greenhouse gas emissions. Another potential topic would be the impact of single dramatic events, such as volcanic eruptions.
The EEI is a critical quantity for monitoring the climate system. Hence, an adequate measurement system that includes both interior energy and satellite components is needed in order to observe the EEI over time. Satellite-borne instruments are one valuable potential source of such measurements, but the current satellite-only global-mean EEI estimates do not reach an absolute measurement uncertainty below 1 W m−2. As a result, satellite radiation measurements cannot currently independently verify EEI estimates from interior methods such as ocean temperature measurements, which monitor the changes in accumulated energy within the Earth system over time. There are therefore ongoing efforts to improve the situation both within existing satellite missions and as part of new initiatives, using both established and novel methods.
In this work we have focused on one kind of satellite instrument, namely wide-field-of-view radiometers, and investigated how idealised EEI estimates change due to orbital sampling effects related to the diurnal and annual cycles. We simulated satellite orbits with different inclinations and used hourly TOA radiation fields with assumed Lambertian emission to generate synthetic wide-field-of-view measurements. These measurements were processed using a coarse-grid bin method, without using any information from the diurnal or annual cycles, to produce global-mean EEI estimates. Although the introduction of a priori knowledge of these cycles could reduce the estimated error, it would inherently introduce a systematic uncertainty that would need to be accounted for. Even if such an uncertainty is small, it is by its very nature challenging to quantify. Our ambition was therefore to investigate orbital sampling options in order to minimise the estimated error without relying on a priori information.
We show that different orbital inclinations lead to different characteristics in terms of the sampling issues, with key findings that can be summarised in five points. First, no single satellite orbit provides the spatial and temporal sampling necessary to reliably estimate the global-mean TOA net imbalance. Second, two combined 90° satellites can estimate the EEI to within an RMSE of 0.10 W m−2. This is improved to 0.04 W m−2 by three 90° satellites, and with four 90° satellites, this is possible without a shortwave correction. Third, a combination of one 90° satellite and one either 73° or 82° satellite leads to an RMSE of 0.08 or 0.10 W m−2, respectively. Fourth, at least two satellites are necessary to achieve an uncertainty reliably lower than the current satellite-only best estimate of the EEI. If sun-synchronous orbits are used, at least six satellites are required. The latter result could be significantly improved with a diurnal cycle model, but doing so would in turn introduce the previously mentioned systematic bias. Fifth, all investigated constellations allow for detectable trends within 5 years.
These results can help inform current and future efforts to directly measure the EEI with satellite-borne instruments. At the same time, it is important to be aware that there are other error sources that have not been analysed here, such as the effect of non-Lambertian radiation, radiative effects from the upper atmosphere and errors associated with the instrument measuring the radiation. Future studies to address these aspects are necessary in order to bring the combined uncertainty in direct satellite measurements of the EEI below the 1 W m−2 threshold.
The software is available from the Bolin Centre Database https://doi.org/10.57669/hocking-2024-sampling-eei-cycles-1.0.0 (Hocking, 2024). The input data are available from https://doi.org/10.5067/TERRA+AQUA/CERES/SYN1DEG-1HOUR_L3.004A (NASA/LARC/SD/ASDC, 2017). The satellite orbits were computed with the simplified general perturbation model SGP4: https://doi.org/10.2514/6.2006-6753 (Vallado et al., 2006) and https://doi.org/10.2514/6.2008-6770 (Vallado and Crawford, 2008), as implemented in the Python library python-sgp4: https://pypi.org/project/sgp4/ (Rhodes, 2023).
All authors formulated the overarching goals of the study. TH developed the software, performed the analysis and prepared the article, with contributions from LM and TM.
The contact author has declared that none of the authors has any competing interests.
Publisher's note: Copernicus Publications remains neutral with regard to jurisdictional claims made in the text, published maps, institutional affiliations, or any other geographical representation in this paper. While Copernicus Publications makes every effort to include appropriate place names, the final responsibility lies with the authors.
The authors would like to thank Donal Murtagh, Jake Gristey, Norman Loeb, Seiji Kato and Steven Dewitte for useful comments and discussions. The authors would also like to thank Peter Pilewskie and one anonymous reviewer for their comments and suggestions, which helped improve the final version of this paper.
This research has been supported by the European Research Council, H2020 research and innovation programme (grant nos. 820829 and 101003470); the Swedish Research Council (grant nos. 2022-03262 and 2022-06725); and the European Research Council, FP7 Ideas (grant no. 770765). The computations were enabled by resources provided by the National Academic Infrastructure for Supercomputing in Sweden (NAISS) at the National Supercomputer Centre (NSC), partially funded by the Swedish Research Council (grant agreement no. 2022-06725). Linda Megner was supported by the Swedish National Space Agency.
The publication of this article was funded by the Swedish Research Council, Forte, Formas and Vinnova.
This paper was edited by Anthony Bucholtz and reviewed by Peter Pilewskie and one anonymous referee.
Campbell, G. and Vonder Harr, T.: Optimum satellite orbits for accurate measurement of the earth's radiation budget, summary, Atmospheric Science Paper 289, Department of Atmospheric Science, Colorado State University and NASA Langley Research Center, http://hdl.handle.net/10217/50 (last access: 7 July 2024), 1978. a, b
Cheng, L., von Schuckmann, K., Abraham, J. P., Trenberth, K. E., Mann, M. E., Zanna, L., England, M. H., Zika, J. D., Fasullo, J. T., Yu, Y., Pan, Y., Zhu, J., Newsom, E. R., Bronselaer, B., and Lin, X.: Past and future ocean warming, Nat. Rev. Earth Environ., 3, 776–794, https://doi.org/10.1038/s43017-022-00345-1, 2022. a
Danjon, A.: Recherches de photométrie astronomique, Annales de l'Observatoire de Strasbourg, vol. 2, 1-185 pp., https://adsabs.harvard.edu/full/1928AnOSt...2....1D (last access: 26 August 2024), 1928. a
Danjon, A.: Nouvelles recherches sur la photométrie de la lumière cendrée et l'albedo de la terre, Annalen der Kaiserlichen Universitats-Sternwarte in Strassburg, 3, 139–179, 1936. a
Doelling, D. R., Loeb, N. G., Keyes, D. F., Nordeen, M. L., Morstad, D., Nguyen, C., Wielicki, B. A., Young, D. F., and Sun, M.: Geostationary Enhanced Temporal Interpolation for CERES Flux Products, J. Atmos. Ocean. Technol., 30, 1072–1090, https://doi.org/10.1175/JTECH-D-12-00136.1, 2013. a, b
Forster, P., Storelvmo, T., Armour, K., Collins, W., Dufresne, J.-L., Frame, D., Lunt, D., Mauritsen, T., Palmer, M., Watanabe, M., Wild, M., and Zhang, H.: The Earth’s Energy Budget, Climate Feedbacks, and Climate Sensitivity, in: Climate Change 2021 – The Physical Science Basis: Working Group I Contribution to the Sixth Assessment Report of the Intergovernmental Panel on Climate Change, 943–1054 pp., Cambridge University Press, Cambridge, United Kingdom and New York, NY, USA, https://doi.org/10.1017/9781009157896.009, 2021. a
Goode, P. R., Qiu, J., Yurchyshyn, V., Hickey, J., Chu, M.-C., Kolbe, E., Brown, C. T., and Koonin, S. E.: Earthshine observations of the Earth's reflectance, Geophys. Res. Lett., 28, 1671–1674, https://doi.org/10.1029/2000GL012580, 2001. a
Green, R. N. and Smith, G. L.: Shortwave Shape Factor Inversion of Earth Radiation Budget Observations, J. Atmos. Sci., 48, 390–402, https://doi.org/10.1175/1520-0469(1991)048<0390:SSFIOE>2.0.CO;2, 1991. a
Green, R. N., House, F. B., Stackhouse, P. W., Wu, X., Ackerman, S. A., Smith, W. L., and Johnson, M. J.: Intercomparison of scanner and nonscanner measurements for the Earth Radiation Budget Experiment, J. Geophys. Res.-Atmos., 95, 11785–11798, https://doi.org/10.1029/JD095iD08p11785, 1990. a
Gristey, J. J., Chiu, J. C., Gurney, R. J., Han, S.-C., and Morcrette, C. J.: Determination of global Earth outgoing radiation at high temporal resolution using a theoretical constellation of satellites, J. Geophys. Res.-Atmos., 122, 1114–1131, https://doi.org/10.1002/2016JD025514, 2017. a, b
Gristey, J. J., Schmidt, K. S., Chen, H., Feldman, D. R., Kindel, B. C., Mauss, J., van den Heever, M., Hakuba, M. Z., and Pilewskie, P.: Angular sampling of a monochromatic, wide-field-of-view camera to augment next-generation Earth radiation budget satellite observations, Atmos. Meas. Tech., 16, 3609–3630, https://doi.org/10.5194/amt-16-3609-2023, 2023. a
Hakuba, M. Z., Frederikse, T., and Landerer, F. W.: Earth's Energy Imbalance From the Ocean Perspective (2005–2019), Geophys. Res. Lett., 48, e2021GL093624, https://doi.org/10.1029/2021GL093624, 2021. a
Hakuba, M. Z., Reynerson, C. M., Quadrelli, M. B., Wiese, D. N., Mccullough, C., Landerer, F. W., and Stephens, G. L.: Measuring Earth's Energy Imbalance via Radiation Pressure Accelerations Experienced in Orbit: Initial Simulations for “Space Balls”, in: 2023 IEEE Aerospace Conference, 1–10 pp., https://doi.org/10.1109/AERO55745.2023.10115678, 2023. a
Hakuba, M. Z., Kindel, B., Gristey, J., Bodas-Salcedo, A., Stephens, G., and Pilewskie, P.: Simulated variability in visible and near-IR irradiances in preparation for the upcoming Libera mission, AIP Conference Proceedings, 2988, 050006, https://doi.org/10.1063/5.0183869, 2024. a
Hocking, T.: Scripts for simulating wide-field-of-view satellite measurements of top-of-atmosphere radiation fields, Bolin Centre Code Repository [code], https://doi.org/10.57669/hocking-2024-sampling-eei-cycles-1.0.0, 2024. a
House, F. B., Gruber, A., Hunt, G. E., and Mecherikunnel, A. T.: History of satellite missions and measurements of the Earth Radiation Budget (1957–1984), Rev. Geophys., 24, 357–377, https://doi.org/10.1029/RG024i002p00357, 1986. a, b
Hunt, G. E., Kandel, R., and Mecherikunnel, A. T.: A history of presatellite investigations of the Earth's Radiation Budget, Rev. Geophys., 24, 351–356, https://doi.org/10.1029/RG024i002p00351, 1986. a, b
IERS Convention Centre: IERS Conventions (IERS Technical Note No. 36), https://www.iers.org/IERS/EN/Publications/TechnicalNotes/tn36.html (last access: 6 July 2024), 2010. a
Kaplan, G. H.: The IAU Resolutions on Astronomical Reference Systems, Time Scales, and Earth Rotation Models, https://doi.org/10.48550/arXiv.astro-ph/0602086, 2006. a
Kirk-Davidoff, D. B., Goody, R. M., and Anderson, J. G.: Analysis of Sampling Errors for Climate Monitoring Satellites, J. Climate, 18, 810–822, https://doi.org/10.1175/JCLI-3301.1, 2005. a, b
Kramer, R. J., He, H., Soden, B. J., Oreopoulos, L., Myhre, G., Forster, P. M., and Smith, C. J.: Observational Evidence of Increasing Global Radiative Forcing, Geophys. Res. Lett., 48, e2020GL091585, https://doi.org/10.1029/2020GL091585, 2021. a
Loeb, N. G., Kato, S., and Wielicki, B. A.: Defining Top-of-the-Atmosphere Flux Reference Level for Earth Radiation Budget Studies, J. Climate, 15, 3301–3309, https://doi.org/10.1175/1520-0442(2002)015<3301:DTOTAF>2.0.CO;2, 2002. a
Loeb, N. G., Manalo-Smith, N., Kato, S., Miller, W. F., Gupta, S. K., Minnis, P., and Wielicki, B. A.: Angular Distribution Models for Top-of-Atmosphere Radiative Flux Estimation from the Clouds and the Earth’s Radiant Energy System Instrument on the Tropical Rainfall Measuring Mission Satellite. Part I: Methodology, J. Appl. Meteorol., 42, 240–265, https://doi.org/10.1175/1520-0450(2003)042<0240:ADMFTO>2.0.CO;2, 2003. a
Loeb, N. G., Kato, S., Loukachine, K., and Manalo-Smith, N.: Angular Distribution Models for Top-of-Atmosphere Radiative Flux Estimation from the Clouds and the Earth’s Radiant Energy System Instrument on the Terra Satellite. Part I: Methodology, J. Atmos. Ocean. Technol., 22, 338–351, https://doi.org/10.1175/JTECH1712.1, 2005. a
Loeb, N. G., Doelling, D. R., Wang, H., Su, W., Nguyen, C., Corbett, J. G., Liang, L., Mitrescu, C., Rose, F. G., and Kato, S.: Clouds and the Earth’s Radiant Energy System (CERES) Energy Balanced and Filled (EBAF) Top-of-Atmosphere (TOA) Edition-4.0 Data Product, J. Climate, 31, 895–918, https://doi.org/10.1175/JCLI-D-17-0208.1, 2018a. a
Loeb, N. G., Su, W., Doelling, D., Wong, T., Minnis, P., Thomas, S., and Miller, W.: 5.03 - Earth’s Top-of-Atmosphere Radiation Budget, in: Comprehensive Remote Sensing, edited by: Liang, S., 67–84 pp., Elsevier, Oxford, ISBN 978-0-12-803221-3, https://doi.org/10.1016/B978-0-12-409548-9.10367-7, 2018b. a
Loeb, N. G., Johnson, G. C., Thorsen, T. J., Lyman, J. M., Rose, F. G., and Kato, S.: Satellite and Ocean Data Reveal Marked Increase in Earth’s Heating Rate, Geophys. Res. Lett., 48, e2021GL093047, https://doi.org/10.1029/2021GL093047, 2021. a
Marti, F., Blazquez, A., Meyssignac, B., Ablain, M., Barnoud, A., Fraudeau, R., Jugier, R., Chenal, J., Larnicol, G., Pfeffer, J., Restano, M., and Benveniste, J.: Monitoring the ocean heat content change and the Earth energy imbalance from space altimetry and space gravimetry, Earth Syst. Sci. Data, 14, 229–249, https://doi.org/10.5194/essd-14-229-2022, 2022. a
Meyssignac, B., Ablain, M., Guérou, A., Prandi, P., Barnoud, A., Blazquez, A., Fourest, S., Rousseau, V., Bonnefond, P., Cazenave, A., Chenal, J., Dibarboure, G., Donlon, C., Benveniste, J., Sylvestre-Baron, A., and Vinogradova, N.: How accurate is accurate enough for measuring sea-level rise and variability, Nat. Clim. Change, 13, 796–803, https://doi.org/10.1038/s41558-023-01735-z, 2023. a
Mishchenko, M. I., Lock, J. A., Lacis, A. A., Travis, L. D., and Cairns, B.: First-principles definition and measurement of planetary electromagnetic-energy budget, J. Opt. Soc. Am. A, 33, 1126–1132, https://doi.org/10.1364/JOSAA.33.001126, 2016. a
NASA/LARC/SD/ASDC: CERES and GEO-Enhanced TOA, Within-Atmosphere and Surface Fluxes, Clouds and Aerosols 1-Hourly Terra-Aqua Edition4A [data set], https://doi.org/10.5067/TERRA+AQUA/CERES/SYN1DEG-1HOUR_L3.004A, 2017. a, b
Raghuraman, S. P., Paynter, D., and Ramaswamy, V.: Anthropogenic forcing and response yield observed positive trend in Earth’s energy imbalance, Nat. Commun., 12, 4577, https://doi.org/10.1038/s41467-021-24544-4, 2021. a
Rees, W. G.: Physical Principles of Remote Sensing, Cambridge University Press, 3 Edn., https://doi.org/10.1017/CBO9781139017411, 2012. a
Rhodes, B.: Python sgp4 library, Python Software Foundation [code], https://pypi.org/project/sgp4/ (last access: 12 June 2023), 2023. a
Salby, M. L.: Asynoptic Sampling Considerations for Wide-Field-of-View Measurements of Outgoing Radiation. Part II: Diurnal and Random Space-Time Variability, J. Atmos. Sci., 45, 1184–1204, https://doi.org/10.1175/1520-0469(1988)045<1184:ASCFWF>2.0.CO;2, 1988. a
Schifano, L., Smeesters, L., Geernaert, T., Berghmans, F., and Dewitte, S.: Design and Analysis of a Next-Generation Wide Field-of-View Earth Radiation Budget Radiometer, Remote Sens., 12, 425, https://doi.org/10.3390/rs12030425, 2020. a, b
Shaw, N.: Volume I Meteorology in history, Cambridge University Press, Cambridge, United Kingdom, https://archive.org/details/manualofmeteorol01shawuoft/page/n5/mode/2up (last access: 20 January 2024), 1926. a
Smith, G. L. and Green, R. N.: Deconvolution of Wide Field-of-View Radiometer Measurements of Earth-Emitted Radiation. Part I: Theory, J. Atmos. Sci., 38, 461–473, https://doi.org/10.1175/1520-0469(1981)038<0461:DOWFOV>2.0.CO;2, 1981. a
Smith, G. L., Harrison, E. F., and Gibson, G. G.: Earth Radiation Budget Research at the NASA Langley Research Center, Special Publication NASA/SP-2014-619, NASA Langley Research Center, https://ntrs.nasa.gov/citations/20140006546 (last access: 7 July 2024), 2014. a
Stephens, G. L., O'Brien, D., Webster, P. J., Pilewski, P., Kato, S., and Li, J.-l.: The albedo of Earth, Rev. Geophys., 53, 141–163, https://doi.org/10.1002/2014RG000449, 2015. a
Swartz, W. H., Lorentz, S. R., Papadakis, S. J., Huang, P. M., Smith, A. W., Deglau, D. M., Yu, Y., Reilly, S. M., Reilly, N. M., and Anderson, D. E.: RAVAN: CubeSat Demonstration for Multi-Point Earth Radiation Budget Measurements, Remote Sens., 11, 796, https://doi.org/10.3390/rs11070796, 2019. a
Taylor, P. C. and Loeb, N. G.: Impact of Sun-Synchronous Diurnal Sampling on Tropical TOA Flux Interannual Variability and Trends, J. Climate, 26, 2184–2191, https://doi.org/10.1175/JCLI-D-12-00416.1, 2013. a
Vallado, D. and Crawford, P.: SGP4 Orbit Determination, AIAA/AAS Astrodynamics Specialist Conference and Exhibit, Honolulu, Hawaii, 18 August 2008–21 August 2008, https://doi.org/10.2514/6.2008-6770, 2008. a, b
Vallado, D., Crawford, P., Hujsak, R., and Kelso, T.: Revisiting Spacetrack Report #3, AIAA/AAS Astrodynamics Specialist Conference and Exhibit, Keystone, Colorado, American Institute of Aeronautics and Astronautics, Inc., https://doi.org/10.2514/6.2006-6753, 2006. a, b, c
von Schuckmann, K., Minière, A., Gues, F., Cuesta-Valero, F. J., Kirchengast, G., Adusumilli, S., Straneo, F., Ablain, M., Allan, R. P., Barker, P. M., Beltrami, H., Blazquez, A., Boyer, T., Cheng, L., Church, J., Desbruyeres, D., Dolman, H., Domingues, C. M., García-García, A., Giglio, D., Gilson, J. E., Gorfer, M., Haimberger, L., Hakuba, M. Z., Hendricks, S., Hosoda, S., Johnson, G. C., Killick, R., King, B., Kolodziejczyk, N., Korosov, A., Krinner, G., Kuusela, M., Landerer, F. W., Langer, M., Lavergne, T., Lawrence, I., Li, Y., Lyman, J., Marti, F., Marzeion, B., Mayer, M., MacDougall, A. H., McDougall, T., Monselesan, D. P., Nitzbon, J., Otosaka, I., Peng, J., Purkey, S., Roemmich, D., Sato, K., Sato, K., Savita, A., Schweiger, A., Shepherd, A., Seneviratne, S. I., Simons, L., Slater, D. A., Slater, T., Steiner, A. K., Suga, T., Szekely, T., Thiery, W., Timmermans, M.-L., Vanderkelen, I., Wjiffels, S. E., Wu, T., and Zemp, M.: Heat stored in the Earth system 1960–2020: where does the energy go?, Earth Syst. Sci. Data, 15, 1675–1709, https://doi.org/10.5194/essd-15-1675-2023, 2023. a, b
Vonder Harr, T. H. and Smith, E. A.: Theoretical comparison between radiometric and radiation pressure measurements for determination of the Earth's radiation budget: for the European Space Agency headquarters, Paris, France, Atmospheric Science Paper 315, Department of Atmospheric Science, Colorado State University, http://hdl.handle.net/10217/242 (last access: 7 July 2024), 1979. a
Wielicki, B. A., Barkstrom, B. R., Harrison, E. F., Lee, R. B., Smith, G. L., and Cooper, J. E.: Clouds and the Earth's Radiant Energy System (CERES): An Earth Observing System Experiment, B. Am. Meteorol. Soc., 77, 853–868, https://doi.org/10.1175/1520-0477(1996)077<0853:CATERE>2.0.CO;2, 1996. a
Wong, A. P. S., Wijffels, S. E., Riser, S. C., Pouliquen, S., Hosoda, S., Roemmich, D., Gilson, J., Johnson, G. C., Martini, K., Murphy, D. J., Scanderbeg, M., Bhaskar, T. V. S. U., Buck, J. J. H., Merceur, F., Carval, T., Maze, G., Cabanes, C., André, X., Poffa, N., Yashayaev, I., Barker, P. M., Guinehut, S., Belbéoch, M., Ignaszewski, M., Baringer, M. O., Schmid, C., Lyman, J. M., McTaggart, K. E., Purkey, S. G., Zilberman, N., Alkire, M. B., Swift, D., Owens, W. B., Jayne, S. R., Hersh, C., Robbins, P., West-Mack, D., Bahr, F., Yoshida, S., Sutton, P. J. H., Cancouët, R., Coatanoan, C., Dobbler, D., Juan, A. G., Gourrion, J., Kolodziejczyk, N., Bernard, V., Bourlès, B., Claustre, H., D'Ortenzio, F., Le Reste, S., Le Traon, P.-Y., Rannou, J.-P., Saout-Grit, C., Speich, S., Thierry, V., Verbrugge, N., Angel-Benavides, I. M., Klein, B., Notarstefano, G., Poulain, P.-M., Vélez-Belchí, P., Suga, T., Ando, K., Iwasaska, N., Kobayashi, T., Masuda, S., Oka, E., Sato, K., Nakamura, T., Sato, K., Takatsuki, Y., Yoshida, T., Cowley, R., Lovell, J. L., Oke, P. R., van Wijk, E. M., Carse, F., Donnelly, M., Gould, W. J., Gowers, K., King, B. A., Loch, S. G., Mowat, M., Turton, J., Rama Rao, E. P., Ravichandran, M., Freeland, H. J., Gaboury, I., Gilbert, D., Greenan, B. J. W., Ouellet, M., Ross, T., Tran, A., Dong, M., Liu, Z., Xu, J., Kang, K., Jo, H., Kim, S.-D., and Park, H.-M.: Argo Data 1999–2019: Two Million Temperature-Salinity Profiles and Subsurface Velocity Observations From a Global Array of Profiling Floats, Front. Mar. Sci., 7, https://doi.org/10.3389/fmars.2020.00700, 2020. a
Wong, T., Smith, G. L., Kato, S., Loeb, N. G., Kopp, G., and Shrestha, A. K.: On the Lessons Learned From the Operations of the ERBE Nonscanner Instrument in Space and the Production of the Nonscanner TOA Radiation Budget Data Set, IEEE T. Geosci. Remote Sens., 56, 5936–5947, https://doi.org/10.1109/TGRS.2018.2828783, 2018. a
Young, D. F., Minnis, P., Doelling, D. R., Gibson, G. G., and Wong, T.: Temporal Interpolation Methods for the Clouds and the Earth’s Radiant Energy System (CERES) Experiment, J. Appl. Meteorol., 37, 572–590, https://doi.org/10.1175/1520-0450(1998)037<0572:TIMFTC>2.0.CO;2, 1998. a
Zhang, Y., Bi, S., and Wu, J.: Effect of Temporal Sampling Interval on the Irradiance for Moon-Based Wide Field-of-View Radiometer, Sensors, 22, 1581, https://doi.org/10.3390/s22041581, 2022. a
Zhang, Y., Dewitte, S., and Bi, S.: A Model for Estimating the Earth's Outgoing Radiative Flux from A Moon-Based Radiometer, Remote Sens., 15, 3773, https://doi.org/10.3390/rs15153773, 2023. a


