the Creative Commons Attribution 4.0 License.
the Creative Commons Attribution 4.0 License.
Determination of low-level temperature profiles from microwave radiometer observations during rain
Moritz Lochmann
Pablo Saavedra Garfias
Heike Kalesse-Los
Usually, microwave radiometer observations have to be discarded during rain. The radomes of the receiver antenna get wet, which hampers accurate measurements since the retrieval algorithms to derive atmospheric quantities are not trained for rain events. The reason for the latter is, that the raindrops dominate the microwave signal compared to the weaker signal from atmospheric gases. To account for this, radiative transfer simulations need to include the electromagnetic properties of rain, which usually requires more complicated and expensive simulations. In this work, the performance of newly developed microwave radiometer retrievals that are not based on rain simulations is evaluated to assess how they work during rain events. It is shown that it is possible to retrieve low-level temperature profiles during rain by omitting certain frequencies and zenith observations. Retrievals with various combinations of elevation angles and frequencies are evaluated. We show that retrievals based on scanning mode observations with angles below 30° without zenith observation and only the less transparent upper four HATPRO microwave radiometer frequencies of the V-band (54.94, 56.66, 57.3, 58 GHz) provide the best results. An analysis of the calculated degrees of freedom of the signal shows that the retrieval of temperature profiles up to 3 km for no rain, 1.5 km for light to moderate rain, and 1 km for very heavy rain is driven by the HATPRO observation and not by climatology. Finally, the performance of the temperature profile retrieval is explained using a case study in Lindenberg, Germany, and evaluated with temperature profiles from the European Centre for Medium-Range Weather Forecasts (ECMWF) model for different rainfall intensities. The results show that the higher the rainfall rate, the larger the deviation of the retrieved microwave radiometer temperature profile from the ECMWF model output. The proposed retrievals for temperature profiles up to at least 1.5 km for rain rates below 0.5 and below 2.5 mm h−1 have uncertainties of less than 1 and 2 K, respectively, compared to ECMWF model output profiles.
- Article
(1848 KB) - Full-text XML
- BibTeX
- EndNote
The continuous development and improvement of weather and climate models poses a great challenge to atmospheric remote sensing. For the evaluation of the models, increasingly better-resolved measurements and retrieval methods are needed, e.g., regarding air temperature profiles (T profiles). Conventional remote sensing observational approaches mainly fail as they are incapable of providing continuous observations of T profiles under all weather conditions and especially during rain. Ground-based Raman lidars can usually measure temperature and humidity profiles only below clouds and certainly not during rain (Wandinger, 2005). Radiosondes can provide these atmospheric profiles with high vertical resolution, but they are only routinely available at selected locations and at maximum every 6 h.
Multifrequency microwave radiometers (MWRs) can provide temporally highly resolved profiles of temperature and humidity, as well as integrated water vapor and liquid water path (Solheim et al., 1998; Güldner and Spänkuch, 1999; Westwater et al., 2005; Rose et al., 2005). Measurements at different elevation angles increase the accuracy of the derived T profiles in the atmospheric boundary layer (Crewell and Löhnert, 2007). The measurement uncertainties are described by Böck et al. (2024). Valid retrievals are, however, generally only possible during non-rainy conditions (Ware et al., 2004). Snow and ice clouds do not emit radiation in the considered spectrum; hence they are not taken into account here. During rain, the instrument gets wet, and the received signal is dominated by the liquid water accumulated on the instrument. In previous studies, Cimini et al. (2011) and Ware et al. (2013) compared retrieved profiles of temperature and absolute humidity from a neural network approach (scanning and zenith) and a one-dimensional variational (1D-VAR) technique under 15° elevation angle with soundings during all weather conditions. For atmospheric profiling from the surface to 10 km, Cimini et al. (2011) obtained retrieval errors within 1.5 K for temperature and 0.5 g m−3 for absolute humidity. Xu et al. (2014) retrieved thermodynamic profiles such as temperature and humidity as well as liquid water profiles using off-zenith MWR observations at 15° elevation to reduce the impact of rain on the measurements using a neural network approach. The temperature bias and root mean square error against radiosondes in precipitation were reduced from 3.6 and 4.2 to 1.3 and 3.1 K, respectively, compared to the zenith MWR observations. Later, Araki et al. (2015) compared the method from Xu et al. (2014) with a 1D-VAR technique using zenith and off-zenith observation during rainy and non-rainy conditions. Their results were evaluated with co-located radiosondes, and they showed that the error in retrieved temperature and water vapor profiles in the low-level troposphere can be reduced by the 1D-VAR technique even during rainfall with rain rates less than 1 mm h−1 using off-zenith observations. In the presented study, the impact of rain is reduced using elevation scans only of off-zenith measurements, i.e., at lower elevation angles, as liquid water usually accumulates at the top of the MWR. Furthermore, the influence of rain can be reduced by using only the higher frequencies of the oxygen absorption complex (V-band) in which the signals are almost saturated and will thus not be influenced so strongly by liquid water. The method presented here can be applied to standard measurement modes and does not require any changes in measurement setup. We show that there is no need to constantly change the measurement mode according to the weather conditions.
The structure of the paper is as follows: instruments used such as MWRs and radiosondes, the European Centre for Medium-Range Weather Forecasts (ECMWF) ERA5 model, and radiative transfer models are introduced in Sect. 2, followed by a description of the retrieval methodology in Sect. 3. The retrieval performance based on simulations and observations, as well as a comparison of the observations with the ECMWF model output, is evaluated in Sect. 4.
Almost all remote sensing data presented in this work were gathered at the Meteorological Observatory Lindenberg – Richard Assmann Observatory (MOL-RAO; 52.208° N, 14.118° E) in Lindenberg, Germany, during an instrument intercomparison campaign from 16 July 2020 to 10 October 2020. In addition to that, MWR data presented in Sect. 3 were gathered at the Leipzig Institute for Meteorology, Leipzig University (51.333° N, 12.389° E). The instruments and models used are explained in the following subsections.
2.1 Microwave radiometer HATPRO
The humidity and temperature profiler (HATPRO, generation 5) is a fully automatic microwave radiometer (MWR) from the manufacturer Radiometer Physics GmbH (Rose et al., 2005). It is a passive instrument and measures atmospheric emission at 14 frequencies along the microwave spectrum with a high temporal resolution on the order of seconds. Seven frequencies are situated along the upper wing of the water vapor absorption band at 22 GHz (K-band) and seven at the lower wing of the oxygen absorption complex at 58 GHz (V-band). For both absorption bands, HATPRO has its own antenna, of which measured signal is converted into voltages at the individual frequencies. The voltages are then calibrated to brightness temperature (TB) by automated calibrations (Kazama et al., 1999; Maschwitz et al., 2013; Küchler et al., 2016). The antennae are situated below a radome sheet, which is transparent in the microwave region. It is made of foam with a hydrophobic coating. HATPRO utilizes a rain mitigation system, which blows a constant strong air stream over the radome. Nevertheless, during heavy or prolonged rainfall, liquid water might still accumulate on the radome's top, especially if the radome has aged, as is the case during long-term use in the field. An aged radome with a weathered coating absorbs moisture like a sponge. If an old radome gets wet not only on the top but also all over the body, none of the presented retrievals will work during or shortly after a rain event. Therefore, monitoring the state of the radome is very important. If the radome has not been replaced for a long time or is damaged and no longer hydrophobic, it is not possible to accurately determine the atmospheric variables during rain.
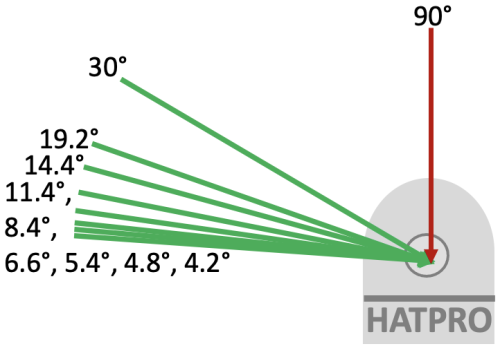
In order to estimate column-integrated variables such as the integrated water vapor and liquid water path, as well as vertical profiles of temperature and humidity, so-called retrievals must be created (Löhnert and Crewell, 2003). Retrievals are based on artificial neural networks or multi-variate linear regressions, which are trained on relations between measured TB and the wanted quantity from radiosondes or numerical weather prediction model output. Observations under different elevation angles enhance the accuracy of the retrieved T profile within the atmospheric boundary layer (Crewell and Löhnert, 2007). A sketch showing the HATPRO measurements at default elevation angles color-coded by zenith and off-zenith is illustrated in Fig. 1. Those angles were intentionally selected to represent 1, 2, 3, 4, 5, 7, 9, 11, 12, and 14 air masses.
2.2 Radiosondes
Radiosondes provide highly resolved vertical information of atmospheric temperature, humidity and pressure. Here we used a large data set of 10 172 Vaisala RS41 soundings from January 2015 to April 2024. This serves as input into radiative transfer calculations to create the synthetic TB used for the retrieval algorithm to estimate T profiles (see Sect. 2.5). For the comparisons of T profiles in Sect. 4.2, Vaisala RS41 radiosondes are used, too (Jensen et al., 2016; Sun et al., 2019). In the presented work, all radiosondes were launched at MOL-RAO.
2.3 European Centre for Medium-Range Weather Forecasts model
In this study, T profiles from ECMWF Integrated Forecast System (IFS) are used to evaluate the retrieved T profiles from the MWR observations. This is done because the ECMWF-IFS model data are available at a higher temporal resolution (hourly) than that of the radiosondes. The model data used here are stored in the CloudNet categorization product (Illingworth et al., 2007), which is freely available at https://cloudnet.fmi.fi/search/data?site=lindenberg (last access: 3 September 2024).
2.4 ERA5
ERA5 (ECMWF Reanalysis v5) is the fifth generation of ECMWF's atmospheric reanalysis of global climate (Hersbach et al., 2020). ERA5 is produced by the Copernicus Climate Change Service (C3S) at ECMWF and covers data from 1940 to the present. Here, hourly profiles of temperature, humidity, pressure and cloud liquid with a vertical resolution of 137 pressure levels from the surface up to a height of 80 km are extracted from the global data set for the MOL-RAO site. A total of 173 088 profiles from the ERA5 data set from 2004 to 2023 are used as input for the radiative transfer calculation for the temperature retrieval creation.
2.5 Non-scattering microwave radiative transfer model
Based on Simmer (1994), the non-scattering microwave radiative transfer is applied to calculate the TB of each profile from 10 172 radio soundings and 173 088 ERA5 profiles. This results in a data set of 183 260 profiles with corresponding calculated TB; these serve as a base for the retrieval generation. It uses the 2022 Rosenkranz gas absorption (Larosa et al., 2024) and liquid water absorption by Liebe et al. (1993). The Rosenkranz gas absorption model is corrected for the water vapor continuum absorption according to Turner et al. (2009). The uncertainty of atmospheric microwave absorption models and their impact on ground-based radiometer simulations and retrievals are extensively described in Cimini et al. (2018). The model code is written in Interactive Data Language (IDL) and was, e.g., also applied in Löhnert and Crewell (2003), Löhnert et al. (2007), and Foth and Pospichal (2017).
2.6 Passive and Active Microwave TRAnsfer (PAMTRA)
PAMTRA solves the radiative transfer for passive and active microwave radiation in all-sky conditions, i.e., cloudless, cloudy, and precipitating atmospheres (Mech et al., 2020). In this study, PAMTRA is used to simulate the TB at the HATPRO frequencies during rain to investigate the impact of rain in the atmosphere and to assess the effect of liquid water accumulation on the radome (see Sect. 3.2).
In this section, the problem of retrieving T profiles during rain is first shown using an example. Then the theoretical basics of how to create a temperature retrieval are explained. Finally, the procedure to select the most relevant frequencies and elevation angles is explained, and the results of the information content analysis are shown.
Figure 2 illustrates a time series of a HATPRO measurement in non-rainy and rainy conditions. The problem of state-of-the-art temperature retrievals during rain, indicated by unrealistic spikes, is shown in Fig. 2d. The rain and Sun quality flag (a) denotes if rain was detected by HATPRO's weather station or if the Sun or the Moon is directly in the receiver's field of view. Both would affect the quality of the retrieval. The second (b) shows the results of the spectral consistency check, which is retrieved by the so-called “tbx” retrievals. Since the signals in the individual channels are highly dependent on each other, they can be used to retrieve the entire spectrum. During spectral consistency checks (tbx retrievals), 13 of the 14 HATPRO frequencies are used to estimate the value of the unused frequency, which is then compared to the measured TB, and the discrepancy is noted. This procedure is repeated for all 14 frequencies. If the TB difference at a given frequency exceeds the limits of 1 K for the K-band and 2 K for the V-band, the time steps are flagged with spectral consistency failed. This is done here only for zenith observations, and it usually happens when nonphysical or unrealistic spectra are measured due to rain or other obstacles in the field of view. During rainy periods none of the frequencies passed the consistency check; therefore none of the frequencies are reliable to be used. Thus, the retrieval will not be trustworthy.
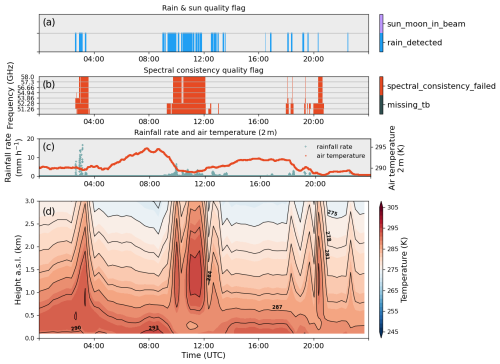
Figure 2Time series of Moon or Sun and rain quality flag (a), spectral consistency quality flag (b), air temperature and rainfall rate from HATPRO's weather station (c), and height–time series of T profiles based on HATPRO's firmware radiometer retrieval algorithms in Lindenberg (Germany) on 26 August 2020. The tb notation in the color bar of panel (b) means brightness temperature.
Figure 2c shows the temperature variation and rainfall rate from the HATPRO weather station during the example day. There are no physical temperature gradients during rain events that might explain the height–time series of temperature (d). The shown T profiles are retrieved by the RPG firmware retrieval for Lindenberg, which is based on a neural network approach using all seven V-band frequencies and all 10 elevation angles. This frequency and elevation angle setup corresponds to the state of the art in determining T profiles under rain-free conditions.
All MWR retrievals, including tbx retrievals and T profile retrievals, need to be created for each specific geographic region, as typical atmospheric profiles of temperature and humidity vary across the globe. Walbröl et al. (2022), e.g., created MWR retrievals for low-humidity conditions in the Arctic and Schnitt et al. (2024) in the tropical Atlantic.
3.1 Temperature profile retrieval method
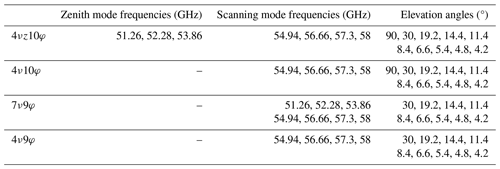
A retrieval essentially consists of a series of coefficients that can be based on an artificial neural network or a multi-variate linear regression method that relates modeled TB and T profiles (Löhnert and Maier, 2012). In this work we use the regression method. The T profiles are based on 10 172 radiosondes and 173 088 ERA5 output profiles corresponding to the location of the MOL-RAO site in Lindenberg. We decided to use these two different data sources to get a data set which contains profiles with high vertical resolution (radiosonde) and a large number of profiles with modeled liquid water information (ERA5). From this data set, temperature, humidity, and pressure profiles are extracted. The cloud liquid water content is directly extracted from the ERA5 data. For the radiosonde data, a cloud is synthetically determined where 95 % relative humidity is reached (Decker et al., 1978). The modified adiabatic liquid water content is then determined for the altitude range of the cloud according to Karstens et al. (1994). This information is used as input to the non-scattering microwave radiative transfer model (see Sect. 2.5). For each input profile, the TB which would be measured by a microwave radiometer under the given input conditions, frequencies, and elevation angles is simulated. In total 146 608 profiles (80 % randomly chosen profiles) were used for the training and 36 652 (20 %) to test the regression method to predict the T profiles based on simulated TB. In this study, different retrieval settings (varying number of frequencies and angles) were generated to contrast the RPG firmware method based on seven frequencies in the V-band (oxygen complex) and 10 elevation angles including the zenith direction (90°). Specifically, new retrieval setups are proposed that are only based on the upper four HATPRO frequencies in the V-band which exclude the zenith observation (nine angles). The different retrieval setups are listed in Table 1. The 4νz10φ retrieval is the most commonly used retrieval for low-level temperature profiling during non-rainy conditions. It uses 10 elevation angles (including the zenith angle) and the upper four frequencies of the V-band. Additionally, the lower three frequencies of the V-band are used at only the zenith angle.
Table 1Retrieval specification. Zenith mode frequencies indicate the frequencies (ν) that are observing only in zenith direction, whereas scanning mode frequencies mark those measuring in the directions given by the elevation angle (φ) in the last column. Retrieval name nomenclature: Xν[z]Yφ. X: number of frequencies with elevation scanning. Y: number of elevation angles. The index z indicates that, additionally, three zenith observations for 51.26–53.86 GHz have been included in retrieval development (first row). Nomenclature according to Crewell and Löhnert (2007).
The question of how the frequencies and elevation angles for the new temperature retrievals are selected is discussed in the following subsection. The performance during non-rainy (cloudy and cloudless) conditions is treated in Sect. 4.1 and is illustrated in Fig. 6.
3.2 Selection of frequencies and elevation angles
To select frequencies and elevations angles for a new temperature retrieval that is less compromised by rain, it is necessary to check which frequencies are less affected by rain accumulated on the radome and by rain in the atmosphere. This was done by a special MWR measurement strategy during a rain event described below. It is worth noting again that during rain, the atmosphere becomes more opaque with increasing frequency in the V-band.
On 27 July 2023 and on 1 August 2023, on the roof measurement platform of the Institute for Meteorology of Leipzig University, special measurements were performed with the microwave radiometer HATPRO. There was continuous rain from 09:00 to 15:00 UTC, with rain rates observed by the HATPRO weather station, generally below 2 mm h−1 on 27 July followed by showers with low intensities. On 1 August, it rained continuously from midnight to 08:30 UTC, with rain rates generally below 2 mm h−1 but occasionally reaching 7 mm h−1. Afterwards, there were repeated rain showers and cloudless periods until the end of the day. On 27 July at 07:01 UTC as well as on 1 August at 07:41 and 14:14 UTC, scan patterns from 0° (horizontal) to 90° (zenith) with 5° elevation angle steps were carried out. In addition, PAMTRA simulations of TB at all specified elevation angles were carried out for the three different situations on these days: no rain with a thin ice cloud (27 July), moderate rain (5.5 mm h−1, 1 August), and very heavy rain (61 mm h−1, 1 August). The ECMWF model output profiles of temperature, pressure and relative humidity in Leipzig from the same day were taken as input for the simulations. Raindrop size distributions for the stratiform rain event early in the day and for the heavy rain shower around 14:14 UTC were estimated by a modified gamma distribution (μ = 2, γ = 1), with rainwater contents of 0.23 and 1.6 g kg−1 and number concentrations of 400 and 30 m−3, respectively, with uniform raindrop size distributions between the cloud base of 2.5 km and the surface. The raindrop size distribution was chosen in a way such that the simulated rain rates match the observations.
The TB values from HATPRO observations and from PAMTRA simulations (a, b, c) as well as their difference (d, e, f) as a function of the elevation angle are illustrated in Fig. 3 for the seven frequencies in the V-band and for three weather conditions (no rain, moderate rain, very heavy rain). It can be seen that the simulation and observation fit well for the profile with no rain at 07:01 UTC on 27 July. The differences of around 6 K on average for the lower frequencies and higher elevation angles might be caused by the ECMWF model input, which slightly differs from the atmospheric state that was observed by MWR. Additionally, horizontally homogeneous atmospheric conditions are assumed. If this is not the case, different air masses might be observed by the more transparent channels at 51.26, 52.28, and 53.86 GHz. For the profile at 07:41 UTC on 1 August with rain rates of 5.5 mm h−1 (observed) and 5.3 mm h−1 (simulated) the TB values from 51.26, 52.28, and 53.86 GHz differ from the simulation above 45° elevation angle by up to 26, 18, and 6 K, respectively. This might be caused by the accumulation of liquid water from rain on the top of the MWR radome. For the heavy rain shower at 14:14 UTC on 1 August, with rain rates of 61.1 mm h−1 (observed) and 61.7 mm h−1 (simulated) for the simulated and the observed TB at the same three frequencies differ by up to 36, 28, and 10 K, respectively, above 40° elevation angle. The frequencies 54.94, 56.66, 57.3, and 58 GHz, as well as all angles below 45°, are apparently unaffected by the impact of rain and show no significant difference between simulated and observed TB. The range of TB difference at the lower elevation angles (below 45°) is roughly around −5 to 5 K. When the TB difference exceeds this range, this is defined here as significant deviation. That means that all elevation angles below 40° and the upper four HATPRO frequencies from the V-band can be used to retrieve T profiles during rain. It is important to note that most state-of-the-art temperature retrievals from atmospheric boundary layer scans (e.g., HATPRO's firmware) use the set of elevation angles shown in Fig. 1; thus the majority of elevation angles used by the retrievals are below 40° except for the zenith observation.
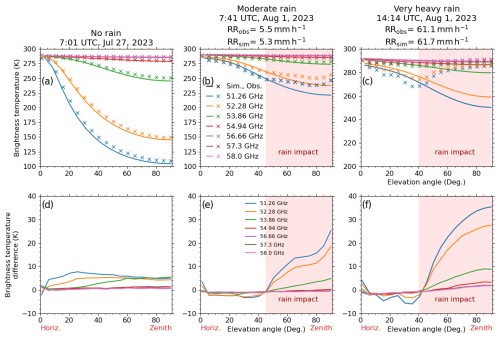
Figure 3Observed and simulated brightness temperatures (a, b, c) as well as their difference (d, e, f) for different frequencies (colors) versus elevation angle for no rain (a, d), moderate rain (b, e), and very heavy rain events (c, f). Rose rectangle marks the area where the observations significantly differ from the simulation probably caused by a wet radome. Note that the y axis in panel (c) differs from panels (a) and (b).
The spectral consistency check applied to all elevation angles using the corresponding tbx retrievals for these elevation angles shows similar results. Figure 4 illustrates the 95th quantile of the TB difference (observed − retrieved) for different elevation angles for all elevation scans that were performed during rain in the observation period. The 95th quantile is used here to exclude outliers and has more significance than median or mean. For 95 % of the zenith observations the difference is larger than 2 K for all frequencies except for 58 GHz and even for small rain rates. The 58 GHz channel at zenith observation (a) shows small differences since this channel is almost saturated, which means that even rain does not increase the observed signal significantly. A typical threshold used for the maximum allowed difference would be 2 K as used in the open-source processing software MWRpy (Marke et al., 2024). Values higher than 2 K indicate inconsistency in the spectrum probably caused by rain. For the 30° elevation angle the differences are larger than 3 K for rain rates above 2.5 mm h−1 and for the first three frequencies of the V-band. Lower elevation angles (below 19.2°) show smaller differences in the TB and mostly below 2 K for all rain rates and frequencies, except the 52.28 GHz channel at 14.4°. This implies that the upper four frequencies of the V-band can be used for temperature retrievals at elevation angles below 30° for rain rates of up to 2.5 mm h−1. Disturbances of the observations by a wet radome would result in larger differences as can be seen at the zenith angle (90°).
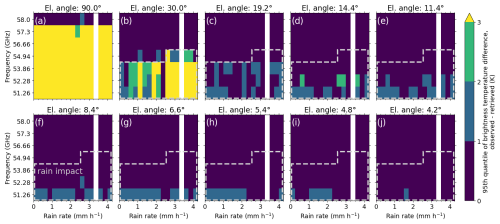
Figure 4The 95th quantile of brightness temperature difference (observed − retrieved) per frequency (y axis) and rain rate (x axis) for different elevation angles (a–j). The dashed grey boxes mark the area of rain impact determined by differences of more than 2 K.
One might expect that adding the lower HATPRO frequencies of the V-band (i.e., using all seven frequencies in the retrieval) would be more appropriate, as the atmosphere is more transparent at these frequencies. However, our analyses have shown that for that purpose the lower V-band frequencies are not optimal and instead increase uncertainties. At low elevation angles, however, different air masses are observed by the more transparent channels, leading to uncertainties in the retrieved profiles.
3.3 Information content analysis
To investigate how much information originates from the observations and not from the climatology, an optimal estimation technique has been applied to the case studies (Rodgers, 2000; Maahn et al., 2020). It calculates the degrees of freedom for signal (DFS) and specifies the information content that comes from the measurement itself. The cumulated DFS values of all four retrievals are illustrated in Fig. 5 for the three weather conditions (a, b, c) mentioned in Sect. 3.2. The curves of all retrievals have a similar shape and do not differ significantly below heights of 3 km. However, with increasing altitude, the differences of cumulative DFS increase. Once a DFS curve reaches a vertical line, no more information is added by the measurements. The retrievals with fewer frequencies and elevation angles (4ν10φ, 4ν9φ) display lower values of the cumulated DFS under all three weather conditions. This means that there is less information from altitudes above roughly 1.5 km from the measurement, and the profile is more driven by the climatology. The more rain there is in the atmosphere, the lower the information content of the measurement, as can be seen in the maximum value of the cumulated DFS in 3 km, which reaches values between 3 and 4 for no rain, between 2.8 and 3.4 during moderate rain, and between 2.7 and 3.4 during very heavy rain. To summarize, the retrieved T profile is driven by the measurement at least up to 3 km for no rain, about 1.5 km for rain, and about 1 km for heavy rain proven by the determined DFS, indicated by the point at which the line with lowest information content (red) becomes vertical.
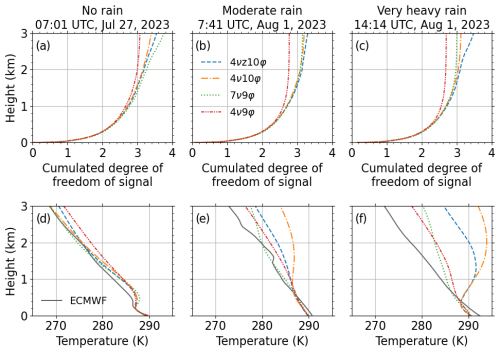
Figure 5The cumulated degrees of freedom of signal and T profiles for no rain (a, d) conditions on 27 July 2023 and moderate rain (b, e) and heavy rain (c, f) conditions on 1 August 2023.
The retrieved T profiles from the four retrievals, as well as the ECMWF temperature output profile for the same three conditions (no rain, moderate rain, very heavy rain), are illustrated in Fig. 5d, e, and f. As expected for non-rainy conditions (d) and shown in Sect. 4.1, all four retrievals show similar deviations from the reference ECMWF profile in the lowest 1.5 km. Above 1.5 km, 4ν9φ differs from 4νz10φ, 4ν10φ, and 4ν9φ as well as from ECMWF output. For the moderate rain case (e), all retrievals perform similarly below about 1 km. Retrievals which use zenith observations (4νz10φ and 4ν10φ) perform worse than the others (7ν9φ and 4ν9φ). The 7ν9φ retrieval performs best and shows the smallest differences to the ECMWF profile, with a difference of 1 K below 2 km. For the very heavy rain event (f), the 7ν9φ and 4ν9φ retrievals show the best performance, indicated by the smallest difference to the reference ECMWF model output. As expected, 4νz10φ and 4ν10φ have largest deviations (more than 12 K in 2 km) from ECMWF model output since they are intentionally made for non-rainy conditions. It is likely that the ECMWF T profile does not represent the truth, especially during rain showers. For this reason, no quantitative statement is made here, and more attention is paid to the intercomparison between the individual retrievals.
This section first shows the performance of the newly created T profile retrievals based on simulations with the test data set under non-rainy conditions. This is only to show that the new different retrievals produce meaningful results. In Sect. 4.2, the retrieval performance is evaluated on the basis of observations using the MOL-RAO case study of 26 August 2020, introduced in Sect. 3. Finally, the retrieved T profiles are compared to ECMWF output on a larger data set.
4.1 Retrieval performance based on simulations during non-rainy conditions
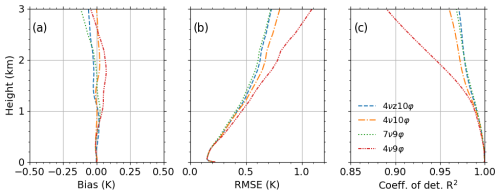
The performance of the new approaches (7ν9φ, 4ν10φ, 4ν9φ) in comparison to the common retrieval (4νz10φ) under non-rainy idealized conditions is shown in Fig. 6. This is the result of the test data from the atmospheric profiles from radiosonde and ERA5 (36 552 profiles). Bias (a), root mean square error (RMSE, b), and coefficient of determination (R2, c) between true values and the prediction of the regression method indicate how much uncertainty is added by omitting frequencies and elevation angles during cloudy and cloudless conditions using profiles from the test data set. All four sets of retrievals show similar behavior in bias (a), namely just small systematic deviations from zero. For all four retrievals, the RMSE (b) increases with altitude, while R2 decreases with altitude, both indicating an increase in uncertainty with height. RMSE and R2 diverge above 1 km, with 4ν9φ being worse, whereas 4νz10φ, 7ν9φ, and 4ν10φ almost overlap. Bias, RMSE, and R2 values are in accordance with Crewell and Löhnert (2007). Highest uncertainties are evident for the 4ν9φ retrieval. This is an expected behavior since information can be lost by omitting frequencies and zenith observations as shown in Fig. 5. In conclusion, the 4ν9φ retrieval does not perform as well as the other retrievals, which is expected as it was optimized for rainy conditions.
4.2 Case study based on observations
The four T profile retrievals introduced in Table 1 were applied to the MOL-RAO example of 26 August 2020. Results are displayed in Fig. 7 where the height–time plots of the ECMWF model temperature (a), the four temperature retrievals (b, d, f, h), as well as the difference of the retrieved temperatures to the ECMWF model temperature (c, e, g, i) are shown. As introduced above (Sect. 2.1), there are three rain events on that day, early morning around 03:00 UTC, between 09:00 and 13:00 UTC, and around 20:00 UTC (see Fig. 2a). During all rain events with rain rates between 0 and at maximum 10 mm h−1, the spectral consistency check failed (Fig. 2b). The presence of rain in the lower atmosphere or accumulated liquid water on the radome compromises the retrieval output, indicated by the unrealistic spikes in the T profiles (Fig. 7b, d) and by a high temperature difference (c, e). Neither the 4νz10φ nor the 4ν10φ can be applied during rain conditions, as can be seen by very large positive temperature differences of more than 10 K above 1 km and values below −3 K below 1 km during a the rain events. However, the 7ν9φ retrieval and the 4ν9φ retrieval can tackle the rain limitation and are able to produce reasonable results in comparison to the ECMWF model temperature output (f, g, h, i). Their deviations are mostly below 3 K during rain and mostly between −1 and 1 K for the rest of the day. Nevertheless, during the rain events there is some variability in the 7ν9φ and 4ν9φ retrievals in contrast to the ECMWF profile. This is probably caused by a wet radome as the rain rates are larger than 2.5 mm h−1 (see Fig. 2), which is the threshold derived in Fig. 4.
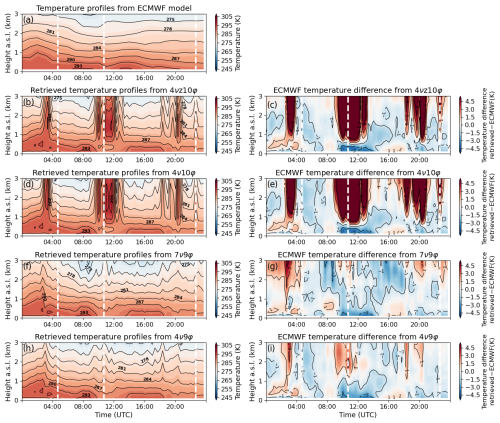
Figure 7Height–time series of T profiles from the ECMWF model (a) and T profiles based on different retrieval algorithms (b, d, f, h) and associated temperature difference to ECMWF model (c, e, g, i) in Lindenberg (Germany) on 26 August 2020. The radiosonde launch times are indicated by dashed white lines.
To further estimate the performance of the four T profile retrievals, they are compared to radiosonde launches at MOL-RAO on 26 August 2020 at 04:45 (a), 10:45 (b), and 22:25 UTC (c) in Fig. 8. During the launch at 04:45 UTC in non-rainy conditions, there are no significant differences between the retrievals, the sounding, and the ECMWF T profiles (a). The differences are much higher during the rain event at 10:45 UTC (b), with rain rates around 1.5 mm h−1. The sounding and ECMWF model T profile are in good agreement, and only the 7ν9φ and the 4ν9φ retrievals fit the sounding as reference within less than 2 K below 1 km. Above 1 km the 7ν9φ retrieval performs best, since it almost overlaps with the sounding. The 4ν9φ retrieval deviates around 3 K at 2 km. In contrast, the temperature retrievals from 4νz10φ and 7ν9φ are completely off by over 10 K above 1 km. The T profile comparison during the short and light rain shower, with rain rates below 0.5 mm h−1 at around 22:45 UTC in Fig. 8c, shows a similar result; the 7ν9φ and the 4ν9φ retrieval even fit to the reference sounding within the expected sounding uncertainty.
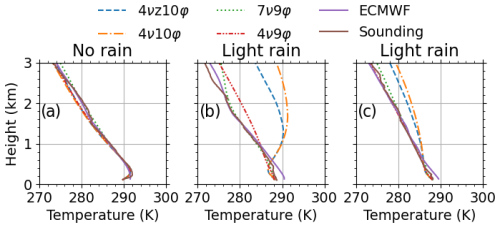
Figure 8Panels (a), (b), and (c) show a comparison of three retrieved T profiles obtained from the four different retrievals with radio soundings launched at MOL-RAO on 26 August 2020, at 04:45 (a), 10:45 (b), and 22:45 UTC (c) and ECMWF model output from 05:00, 11:00, and 23:00 UTC.
Up to this point, the performance of the retrieval has only been evaluated on the basis of case studies. In the next section it will be evaluated against ECMWF model output using a larger data set.
4.3 ECMWF model comparison
In this section the performance of the 4ν9φ, 7ν9φ, and state-of-the-art 4νz10φ temperature retrievals against ECMWF model T profiles is investigated. Therefore, all 3 months of HATPRO observation at MOL-RAO from July to October 2020 is taken into account. Hourly ECMWF model temperatures are interpolated to the measurement grid of approximately 20 min per T profile, since there is a routine elevation scan every 20 min. Figure 9 shows the retrieval performance in terms of bias (left panels) and root mean square errors (RMSEs; right panels) between ECMWF output and retrievals for non-rainy cases (a, b) and rainy cases with rain rates smaller than 0.5 mm h−1 (c, d), rain rates between 0.5 and 2.5 mm h−1 (e, f), and rain rates larger that 2.5 mm h−1 (g, h). The rain rates used here are from the HATPRO weather station. During non-rainy conditions (3671 sample profiles), all retrievals agree well with the ECMWF output (Fig. 9a, b, c, dashed), as could be expected from Fig. 6. But for small rain rates below 0.5 mm h−1 (57 sample profiles), the proposed 4ν9φ retrieval agrees much better, with a bias of around 1 K (Fig. 9c, dash-dotted line) and a RMSE ranging between 0.5 and 2 K (d). The state-of-the-art retrieval (4νz10φ) leads to very high deviations from the ECMWF T profiles, with biases and RMSEs around 5 to 7 and 5 to 10 K, respectively, apart from altitudes below 0.5 km. The bias of the 7ν9φ and the 4ν9φ retrievals increases with height and reaches a maximum values of around 4 K in 3 km for rain rates between 0.5 and 2.5 mm h−1. The corresponding RMSEs are around 1.5 K within the lowest 1 km and increase up to around 5 K at 3 km. For rain rates above 2.5 mm h−1 the biases and RMSE are largest for each retrieval. The higher the rain rate, the worse the performance of the MWR T profile retrievals. Although the 7ν9φ and 4ν9φ retrievals are significantly better than the common 4νz10φ retrieval, they deviate from the ECMWF output. Of course the ECMWF model output is not the truth, especially during rain, but it serves as a reference for comparing the three retrievals. It should be noted that the 7ν9φ and 4ν9φ retrievals perform better since the common 4νz10φ retrieval setup was intentionally not developed for working under rainy conditions. To summarize, the new proposed retrieval based on MWR observation under lower elevation angles and only the higher V-band frequencies allow T profiles during rain to be resolved, with rain rates of up to 2.5 mm h−1, which was not possible before with the state-of-the-art retrievals.
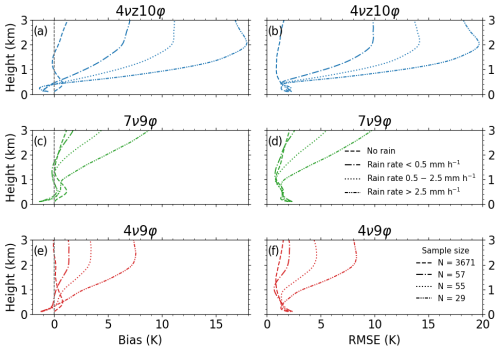
Figure 9Bias (a, c, e) and root mean square error (b, d, f) between retrieved and ECMWF T profiles for rain-free and rain cases with different rain rates (lines) and for different retrievals (rows, colors). N denotes the number of time steps taken into account at Lindenberg Meteorological Observatory (MOL-RAO) between 16 July and 8 October 2020. Bias is defined as retrieved minus ECMWF output as reference.
In summary, the HATPRO 4ν9φ retrieval method demonstrated in this study achieves unprecedented accuracy of low-level temperature profiling, with a bias of less than 1.5 K and an RMSE below 2 K up to 3 km during rain events, with rain rates below 0.5 mm h−1 compared to ECMWF T profiles. For rain rates between 0.5 and 2.5 mm h−1, the bias increases up to 2 K and RMSE up to 3 K in 1.5 km. An intercomparison of the different retrievals during non-rainy conditions showed a good agreement in bias and RMSE values, respectively. As shown based on ERA5 and radiosonde data, the proposed 4ν9φ retrieval performs very similarly to the state-of-the-art 4νz10φ retrieval up to 1.5 km, during non-rainy conditions. Above these heights, the RMSE increases up to 1.2 K instead of 0.8 K in 3 km as for the 4νz10φ, 7ν9φ, and 4ν10φ retrievals, which almost overlap. The bias is very similar to the state-of-the-art retrieval around zero from surface up to 3 km. It was shown that even in very heavy rain (61 mm h−1), measurements at elevation angles below 40° can be used to derive T profiles up to 1.5 km using the 4ν9φ retrieval. The 7ν9φ partially performs better than the suggested 4ν9φ retrieval, but in general the 4ν9φ retrieval is proposed to be used in most cases. The lower frequencies of the V-band used in the 7ν9φ are more transparent and hence observe different air masses in the lower elevation angles, which might lead to large uncertainties, especially in the case of spatially variable precipitation. The recommendation is to use the 4ν9φ retrieval for rain rates below 2.5 mm h−1 to retrieve T profiles up to 1.5 km with uncertainties less than 2 K.
The temperature retrievals can be easily applied with existing open-source software (MWRpy). In addition, the published software package can be used to create custom retrievals for user-defined locations (Foth, 2024b). This represents a significant improvement towards the reliability of using MWR for weather nowcasting or forecast. Improved low-level T profile retrievals are of great value for the investigations of evaporative cooling, which can in turn improve the reliability of the evaluation of model parameterizations. Furthermore, the proposed method can be applied retrospectively to correct T profiles from long-term observations, as long as the MWR scanning TB data are available for the post-processing. In this way, improved climatologies of MWR-based T profiles can be derived.
Several future modifications to increase the performance of the presented retrieval even further are envisioned: an optimal estimation method, which is also a variational technique, could be used in further investigations. In contrast to Cimini et al. (2011), only HATPRO frequencies that pass the consistency check for all elevation angles should be used at each time step independent of the rain situation. Thus, a continuous time series of T profiles can be created, which provides physical uncertainties for each time and height range. This might also improve profiles of absolute humidity, which is also of interest for evaporation studies. Additionally, long-term HATPRO observations will enable a quantification of the maximum rain rate at which the new 4ν9φ retrieval can be applied.
The HATPRO raw data are processed with MWRpy version 0.8.2 (https://github.com/actris-cloudnet/mwrpy, Marke et al., 2024). Also, some MWRpy subroutines for plotting are used in this study. The optimal estimation software package pyOptimalEstimation version 1.2 is available at https://github.com/maahn/pyOptimalEstimation (last access: 29 October 2024) and is described in detail in Maahn et al. (2020, https://doi.org/10.1175/BAMS-D-19-0027.1). The Passive and Active Microwave TRAnsfer model (PAMTRA) is also available at github.com (https://github.com/igmk/pamtra, last access: 29 October 2024) and is already published in Mech et al. (2019, https://doi.org/10.5281/zenodo.3582992) and Mech et al. (2020, https://doi.org/10.5194/gmd-13-4229-2020). ERA5 data are available under https://cds.climate.copernicus.eu/ (last access: 29 October 2024; https://doi.org/10.24381/cds.6860a573, Hersbach et al., 2019). The HATPRO data from the general scans in Leipzig are available at Zenodo at https://doi.org/10.5281/zenodo.13692454 (Foth, 2024a). The Lindenberg HATPRO and model data used in this study are generated by the Aerosol, Clouds and Trace Gases Research Infrastructure (ACTRIS) and are available from the ACTRIS Data Centre from the following: O'Connor (2023, https://doi.org/10.60656/ca8017ee6ef94027) and Lehmann (2023, https://doi.org/10.60656/e938967bc0524dee). The retrievals are done with the pyMakeRetrieval routines version 1.2.0 (https://doi.org/10.5281/zenodo.13692444, Foth, 2024b) and are available on GitHub (https://github.com/remsens-lim/pyMakeRetrieval, last access: 29 October 2024).
AF prepared the manuscript in close cooperation with ML, PSG, and HKL. AF performed the investigations and data analyses. ML and AF realized the experimental setup in Lindenberg and Leipzig, respectively, and were responsible for the high quality of the HATPRO measurements. The conceptualization was initialized by AF, ML, and PSG. All authors contributed to the scientific discussions.
The contact author has declared that none of the authors has any competing interests.
Publisher's note: Copernicus Publications remains neutral with regard to jurisdictional claims made in the text, published maps, institutional affiliations, or any other geographical representation in this paper. While Copernicus Publications makes every effort to include appropriate place names, the final responsibility lies with the authors.
The authors thank the LIM team and the MOL-RAO team for supporting the HATPRO observations in Lindenberg. The authors also acknowledge the ACTRIS-Cloudnet team and all associated developers for the well-documented code around remote sensing, especially the HATPRO processing within MWRpy.
This research has been supported by the Deutsche Forschungsgemeinschaft (DFG, German Research Foundation) – project no. 268020496 – TRR 172, within the Transregional Collaborative Research Center “ArctiC Amplification: Climate Relevant Atmospheric and SurfaCe Processes, and Feedback Mechanisms (AC)3”, sub-project B07 (grant no. 437153667) and E05, and DFG project no. FO 1285/2-11, as well as the Federal State of Saxony and the European Social Fund (ESF) in the framework of the program “Projects in the fields of higher education and research” (grant nos. 232101734 and 100339509). This work has also been supported by the Saxon State Ministry for Science, Culture and Tourism (SMWK) (grant no. 3-7304/44/4-2023/8846).
This paper was edited by Domenico Cimini and reviewed by three anonymous referees.
Araki, K., Murakami, M., Ishimoto, H., and Tajiri, T.: Ground-Based Microwave Radiometer Variational Analysis during No-Rain and Rain Conditions, Sola, 11, 108–112, https://doi.org/10.2151/sola.2015-026, 2015. a
Böck, T., Pospichal, B., and Löhnert, U.: Measurement uncertainties of scanning microwave radiometers and their influence on temperature profiling, Atmos. Meas. Tech., 17, 219–233, https://doi.org/10.5194/amt-17-219-2024, 2024. a
Cimini, D., Campos, E., Ware, R., Albers, S., Giuliani, G., Oreamuno, J., Joe, P., Koch, S. E., Cober, S., and Westwater, E.: Thermodynamic Atmospheric Profiling During the 2010 Winter Olympics Using Ground-Based Microwave Radiometry, IEEE T. Geosci. Remote, 49, 4959–4969, https://doi.org/10.1109/TGRS.2011.2154337, 2011. a, b, c
Cimini, D., Rosenkranz, P. W., Tretyakov, M. Y., Koshelev, M. A., and Romano, F.: Uncertainty of atmospheric microwave absorption model: impact on ground-based radiometer simulations and retrievals, Atmos. Chem. Phys., 18, 15231–15259, https://doi.org/10.5194/acp-18-15231-2018, 2018. a
Crewell, S. and Löhnert, U.: Accuracy of Boundary Layer Temperature Profiles Retrieved With Multifrequency Multiangle Microwave Radiometry, IEEE T. Geosci. Remote, 45, 2195–2201, https://doi.org/10.1109/TGRS.2006.888434, 2007. a, b, c, d
Decker, M. T., Westwater, E. R., and Guiraud, F. O.: Experimental Evaluation of Ground-Based Microwave Radiometric Sensing of Atmospheric Temperature and Water Vapor Profiles, J. Appl. Meteorol. Clim., 17, 1788–1795, https://doi.org/10.1175/1520-0450(1978)017<1788:EEOGBM>2.0.CO;2, 1978. a
Foth, A.: Brightness Temperature Data and Weather Station Data from General Scans of the Microwave Radiometer HATPRO, Zenodo [data set], https://doi.org/10.5281/zenodo.13692454, 2024a. a
Foth, A.: pyMakeRetrieval, Zenodo [code], https://doi.org/10.5281/zenodo.13692444, 2024b. a, b
Foth, A. and Pospichal, B.: Optimal estimation of water vapour profiles using a combination of Raman lidar and microwave radiometer, Atmos. Meas. Tech., 10, 3325–3344, https://doi.org/10.5194/amt-10-3325-2017, 2017. a
Güldner, J. and Spänkuch, D.: Results of Year-Round Remotely Sensed Integrated Water Vapor by Ground-Based Microwave Radiometry, J. Appl. Meteorol. Clim., 38, 981–988, https://doi.org/10.1175/1520-0450(1999)038<0981:ROYRRS>2.0.CO;2, 1999. a
Hersbach, H., Bell, B., Berrisford, P., Biavati, G., Horányi, A., Muñoz Sabater, J., Nicolas, J., Peubey, C., Radu, R., Rozum, I., Schepers, D., Simmons, A., Soci, C., Dee, D., and Thépaut, J.-N.: ERA5 Hourly Data on Pressure Levels from 1940 to Present, Copernicus Climate Change Service (C3S) Climate Data Store (CDS) [data set], https://doi.org/10.24381/cds.6860a573, 2019. a
Hersbach, H., Bell, B., Berrisford, P., Hirahara, S., Horányi, A., Muñoz-Sabater, J., Nicolas, J., Peubey, C., Radu, R., Schepers, D., Simmons, A., Soci, C., Abdalla, S., Abellan, X., Balsamo, G., Bechtold, P., Biavati, G., Bidlot, J., Bonavita, M., Chiara, G., Dahlgren, P., Dee, D., Diamantakis, M., Dragani, R., Flemming, J., Forbes, R., Fuentes, M., Geer, A., Haimberger, L., Healy, S., Hogan, R. J., Hólm, E., Janisková, M., Keeley, S., Laloyaux, P., Lopez, P., Lupu, C., Radnoti, G., Rosnay, P., Rozum, I., Vamborg, F., Villaume, S., and Thépaut, J.-N.: The ERA5 Global Reanalysis, Q. J. Roy. Meteor. Soc., 146, 1999–2049, https://doi.org/10.1002/qj.3803, 2020. a
Illingworth, A. J., Hogan, R. J., O'Connor, E., Bouniol, D., Brooks, M. E., Delanoé, J., Donovan, D. P., Eastment, J. D., Gaussiat, N., Goddard, J. W. F., Haeffelin, M., Baltink, H. K., Krasnov, O. A., Pelon, J., Piriou, J.-M., Protat, A., Russchenberg, H. W. J., Seifert, A., Tompkins, A. M., van Zadelhoff, G.-J., Vinit, F., Willén, U., Wilson, D. R., and Wrench, C. L.: Cloudnet: Continuous Evaluation of Cloud Profiles in Seven Operational Models Using Ground-Based Observations, B. Am. Meteorol. Soc., 88, 883–898, https://doi.org/10.1175/BAMS-88-6-883, 2007. a
Jensen, M. P., Holdridge, D. J., Survo, P., Lehtinen, R., Baxter, S., Toto, T., and Johnson, K. L.: Comparison of Vaisala radiosondes RS41 and RS92 at the ARM Southern Great Plains site, Atmos. Meas. Tech., 9, 3115–3129, https://doi.org/10.5194/amt-9-3115-2016, 2016. a
Karstens, U., Simmer, C., and Ruprecht, E.: Remote Sensing of Cloud Liquid Water, Meteorol. Atmos. Phys., 54, 157–171, https://doi.org/10.1007/BF01030057, 1994. a
Kazama, S., Rose, T., Zimmermann, R., and Zimmermann, R.: A Precision Autocalibrating 7 Channel Radiometer for Environmental Research Applications, J. Remote Sens. Soc. Jpn., 19, 265–273, https://doi.org/10.11440/rssj1981.19.265, 1999. a
Küchler, N., Turner, D. D., Löhnert, U., and Crewell, S.: Calibrating Ground-based Microwave Radiometers: Uncertainty and Drifts, Radio Sci., 51, 311–327, https://doi.org/10.1002/2015RS005826, 2016. a
Larosa, S., Cimini, D., Gallucci, D., Nilo, S. T., and Romano, F.: PyRTlib: an educational Python-based library for non-scattering atmospheric microwave radiative transfer computations, Geosci. Model Dev., 17, 2053–2076, https://doi.org/10.5194/gmd-17-2053-2024, 2024. a
Lehmann, V.: Custom collection of Mwr Level 1c Data from Lindenberg between 16 Jul and 7 Sep 2020, ACTRIS Cloud remote sensing data centre unit (CLU) [data set], https://doi.org/10.60656/e938967bc0524dee, 2023. a
Liebe, H. J., Hufford, G. A., and Cotton, M. G.: Propagation Modeling of Moist Air and Suspended Water/Ice Particles at Frequencies below 1000 GHz, in: AGARD Conference Proceedings 542: Atmospheric Propagation Effects through Natural and Man-Made Obscurants for Visible to MM-Wave Radiation Electromagnetic Wave Propagation Panel Symposium, Palma de Mallorca, Spain, 17–20 May 1993, https://its.ntia.gov/publications/details.aspx?pub=2670 (last access: 9 December 2024), 1993. a
Löhnert, U. and Crewell, S.: Accuracy of Cloud Liquid Water Path from Ground-Based Microwave Radiometry 1. Dependency on Cloud Model Statistics, Radio Sci., 38, 8041, https://doi.org/10.1029/2002RS002654, 2003. a, b
Löhnert, U. and Maier, O.: Operational profiling of temperature using ground-based microwave radiometry at Payerne: prospects and challenges, Atmos. Meas. Tech., 5, 1121–1134, https://doi.org/10.5194/amt-5-1121-2012, 2012. a
Löhnert, U., van Meijgaard, E., Baltink, H. K., Groß, S., and Boers, R.: Accuracy Assessment of an Integrated Profiling Technique for Operationally Deriving Profiles of Temperature, Humidity, and Cloud Liquid Water, J. Geophys. Res., 112, D04205, https://doi.org/10.1029/2006JD007379, 2007. a
Maahn, M., Turner, D. D., Löhnert, U., Posselt, D. J., Ebell, K., Mace, G. G., and Comstock, J. M.: Optimal Estimation Retrievals and Their Uncertainties: What Every Atmospheric Scientist Should Know, B. Am. Meteorol. Soc., 101, E1512–E1523, https://doi.org/10.1175/BAMS-D-19-0027.1, 2020. a, b
Marke, T., Löhnert, U., Tukiainen, S., Siipola, T., and Pospichal, B.: MWRpy: A Python Package for Processing Microwave Radiometer Data, Journal of Open Source Software., 9, 6733, https://doi.org/10.21105/joss.06733, 2024 (data available at: https://github.com/actris-cloudnet/mwrpy, last access: 9 December 2024). a, b
Maschwitz, G., Löhnert, U., Crewell, S., Rose, T., and Turner, D. D.: Investigation of ground-based microwave radiometer calibration techniques at 530 hPa, Atmos. Meas. Tech., 6, 2641–2658, https://doi.org/10.5194/amt-6-2641-2013, 2013. a
Mech, M., Maahn, M., Ori, D., and Orlandi, E.: PAMTRA: Passive and Active Microwave TRAnsfer Tool v1.0, Zenodo [code], https://doi.org/10.5281/zenodo.3582992, 2019. a
Mech, M., Maahn, M., Kneifel, S., Ori, D., Orlandi, E., Kollias, P., Schemann, V., and Crewell, S.: PAMTRA 1.0: the Passive and Active Microwave radiative TRAnsfer tool for simulating radiometer and radar measurements of the cloudy atmosphere, Geosci. Model Dev., 13, 4229–4251, https://doi.org/10.5194/gmd-13-4229-2020, 2020. a, b
O'Connor, E.: Custom collection of model data from Lindenberg between 14 Jul and 20 Oct 2020, ACTRIS Cloud remote sensing data centre unit (CLU) [data set], https://doi.org/10.60656/ca8017ee6ef94027, 2023. a
Rodgers, C. D.: Inverse Methods for Atmospheric Sounding - Theory and Practice, Vol. 2, World Scientific Publishing, https://doi.org/10.1142/3171, 2000. a
Rose, T., Crewell, S., Löhnert, U., and Simmer, C.: A Network Suitable Microwave Radiometer for Operational Monitoring of the Cloudy Atmosphere, Atmos. Res., 75, 183–200, https://doi.org/10.1016/j.atmosres.2004.12.005, 2005. a, b
Schnitt, S., Foth, A., Kalesse-Los, H., Mech, M., Acquistapace, C., Jansen, F., Löhnert, U., Pospichal, B., Röttenbacher, J., Crewell, S., and Stevens, B.: Ground- and ship-based microwave radiometer measurements during EUREC4A, Earth Syst. Sci. Data, 16, 681–700, https://doi.org/10.5194/essd-16-681-2024, 2024. a
Simmer, C.: Satellitenfernerkundung Hydrologischer Parameter Der Atmosphäre Mit Mikrowellen, Kovač, ISBN 3860641964, 1994. a
Solheim, F., Godwin, J. R., Westwater, E. R., Han, Y., Keihm, S. J., Marsh, K., and Ware, R.: Radiometric Profiling of Temperature, Water Vapor and Cloud Liquid Water Using Various Inversion Methods, Radio Sci., 33, 393–404, https://doi.org/10.1029/97RS03656, 1998. a
Sun, B., Reale, T., Schroeder, S., Pettey, M., and Smith, R.: On the Accuracy of Vaisala RS41 versus RS92 Upper-Air Temperature Observations, J. Atmos. Ocean. Tech., 36, 635–653, https://doi.org/10.1175/JTECH-D-18-0081.1, 2019. a
Turner, D., Cadeddu, M., Löhnert, U., Crewell, S., and Vogelmann, A.: Modifications to the Water Vapor Continuum in the Microwave Suggested by Ground-Based 150-GHz Observations, IEEE T. Geosci. Remote, 47, 3326–3337, https://doi.org/10.1109/TGRS.2009.2022262, 2009. a
Walbröl, A., Crewell, S., Engelmann, R., Orlandi, E., Griesche, H., Radenz, M., Hofer, J., Althausen, D., Maturilli, M., and Ebell, K.: Atmospheric Temperature, Water Vapour and Liquid Water Path from Two Microwave Radiometers during MOSAiC, Sci Data, 9, 534, https://doi.org/10.1038/s41597-022-01504-1, 2022. a
Wandinger, U.: Raman Lidar, in: Lidar – Range-Resolved Optical Remote Sensing of the Atmosphere, in: Springer Series in Optical Sciences, edited by: Weitkamp, C., Springer Berlin/Heidelberg, 102, 241–271, ISBN 0-387-40075-3, 2005. a
Ware, R., Cimini, D., Herzegh, P., Marzano, F., Vivekanandan, J., and Westwater, E.: Ground-Based Microwave Radiometer Measurements during Preicipitation, in: 8th Specialst Meeting on Microwave Radiometry, Rome, Italy, 24–27 February 2004, p. 3, 2004. a
Ware, R., Cimini, D., Campos, E., Giuliani, G., Albers, S., Nelson, M., Koch, S. E., Joe, P., and Cober, S.: Thermodynamic and Liquid Profiling during the 2010 Winter Olympics, Atmos. Res., 132–133, 278–290, https://doi.org/10.1016/j.atmosres.2013.05.019, 2013. a
Westwater, E. R., Crewell, S., Mätzler, C., and Cimini, D.: Principles of Surface-Based Microwave and Millimeter Wave Radiometric Remote Sensing of the Troposphere, Quad. Soc. Ital. Elettromagnetismo, 1, 50–90, 2005. a
Xu, G., Ware, R. S., Zhang, W., Feng, G., Liao, K., and Liu, Y.: Effect of Off-Zenith Observations on Reducing the Impact of Precipitation on Ground-Based Microwave Radiometer Measurement Accuracy, Atmos. Res., 140–141, 85–94, https://doi.org/10.1016/j.atmosres.2014.01.021, 2014. a, b


