the Creative Commons Attribution 4.0 License.
the Creative Commons Attribution 4.0 License.
 | 31 Jan 2024
Single-blind test of nine methane-sensing satellite systems from three continents
Sahar H. El Abbadi
Philippine M. Burdeau
Zhan Zhang
Zhenlin Chen
Jeffrey S. Rutherford
Yuanlei Chen
Adam R. Brandt
Satellite-based remote sensing enables detection and mitigation of large point sources of climate-warming methane. These satellites will have the greatest impact if stakeholders have a clear-eyed assessment of their capabilities. We performed a single-blind test of nine methane-sensing satellites from three continents and five countries, including both commercial and government satellites. Over 2 months, we conducted 82 controlled methane releases during satellite overpasses. Six teams analyzed the resulting data, producing 134 estimates of methane emissions. Of these, 80 (58 %) were correctly identified, with 46 true positive detections (34 %) and 34 true negative non-detections (25 %). There were 41 false negatives, in which teams missed a true emission, and 0 false positives, in which teams incorrectly claimed methane was present. All eight satellites that were given a nonzero emission detected methane at least once, including the first single-blind evaluation of the EnMAP, Gaofen 5, and Ziyuan 1 systems. In percent terms, quantification error across all satellites and teams is similar to aircraft-based methane remote sensing systems, with 55 % of mean estimates falling within ±50 % of the metered value. Although teams correctly detected emissions as low as 0.03 metric tons of methane per hour, it is unclear whether detection performance in this test is representative of real-world field performance. Full retrieval fields submitted by all teams suggest that in some cases it may be difficult to distinguish true emissions from background artifacts without a known source location. Cloud interference is significant and appears to vary across teams and satellites. This work confirms the basic efficacy of the tested satellite systems in detecting and quantifying methane, providing additional insight into detection limits and informing experimental design for future satellite-focused controlled methane release testing campaigns.
- Article
(5344 KB) - Full-text XML
-
Supplement
(101952 KB) - BibTeX
- EndNote


Satellite-based remote sensing systems continue to find large point-source emissions of climate-warming methane across the globe (Lauvaux et al., 2022; Irakulis-Loitxate et al., 2022a, b; Pandey et al., 2019; Varon et al., 2018, 2019, 2021; Sánchez-García et al., 2022). Such systems empower stakeholders in industry and government to take corrective action, both to mitigate individual sources and to inform estimates of total methane emissions, particularly in oil and natural gas systems, where many of the largest sources have been observed (Lauvaux et al., 2022; Irakulis-Loitxate et al., 2022a; Pandey et al., 2019; Varon et al., 2018; Irakulis-Loitxate et al., 2022b; Varon et al., 2021, 2019; Cusworth et al., 2022; Duren et al., 2019; Chen et al., 2022; Sherwin et al., 2024; Sánchez-García et al., 2022).
A considerable fleet of point-source methane-sensing satellites is now in orbit, including purpose-built and repurposed instruments (Jacob et al., 2022). In the coming years, this number will increase substantially (Jacob et al., 2022).
These satellites will have the greatest positive environmental impact if their results are widely believed by a broad array of stakeholders across the world. Single-blind controlled methane release testing, in which teams estimate methane emissions from one or more metered sources without knowing the true rate, is an important and widely used method of independently determining the capabilities of a methane-sensing system (Sherwin et al., 2021, 2023; Bell et al., 2020, 2022, 2023; Ravikumar et al., 2019; Rutherford et al., 2023).
In the first such single-blind release test of satellite systems, Sherwin et al. (2023) tested five satellites: the commercial GHGSat-C and WorldView-3 systems and the government-supported PRISMA, LandSat 8, and Sentinel-2 systems. In that study five teams analyzed data from different subsets of these satellites. This test demonstrated that, across the array of these five satellites, this approach can be used to detect emissions ranging from 0.20 [95 % confidence interval = 0.19, 0.21] metric tons of methane per hour (henceforth t h−1) for the most sensitive systems to 7.2 [6.8, 7.6] t h−1. Relative quantification error was comparable to aircraft-based methane-sensing systems, although with significantly larger detection limits (Sherwin et al., 2023). Sample size was modest, with some satellites collecting only one measurement, limiting generalizability of the results without additional data collection.
In addition, several methane-sensing satellites have launched since the previous test concluded in 2021, including the German EnMAP system, the 02 edition of the Chinese Gaofen 5 Advanced Hyperspectral Imager (GF5), and the 02E edition of the Ziyuan 1 Advanced Hyperspectral Imager (ZY1) (EnMAP, 2023; Xinhua, 2022; Song et al., 2022). Although these satellites were not primarily designed to sense methane, scientists have used similar systems to detect substantial methane point sources from oil and natural gas infrastructure (Irakulis-Loitxate et al., 2021).
This work conducts single-blind testing of nine distinct satellite systems, focusing on detection and quantification performance for releases ranging from 0.03–1.6 t h−1. In addition, we take steps to evaluate the generalizability of our results through a highly transparent experimental design, in which all teams submit full methane retrievals for the scene surrounding the release. This approach provides insight into which identified methane emissions are unambiguously detected and which might be difficult to distinguish from artifacts if the source location were not known.
We employed a fixed-location single-blind controlled methane release experimental design to evaluate point-source methane-sensing systems from 10 October to 30 November 2022. Participating teams were aware of the existence, timeframe, and precise location coordinates of the test site. Teams were not informed during a given observation whether gas would be released or of the size of released emissions. Teams were informed of an approximate upper bound of 1.5 t h−1. Teams were not given the precise configuration of Stanford equipment on the ground, though large equipment may have been visible from space in some cases.
Metered controlled release volumes – including releases with zero volume – were retained by the Stanford team and not given to teams until all estimates were submitted by all participants for all stages of the test. Analysts estimated the presence and magnitude of methane emissions for each overpass, with a reporting approach in compliance with the Advancing Development of Emissions Detection (ADED) protocol for airplane and satellite systems (Zimmerle, 2022). More information is provided in the Supplement (Sect. S1.1).
We performed releases during overpasses of nine satellite constellations: the commercial satellites GHGSat-C (GSC) of Canada and the US-based WorldView-3 (WV3), as well as publicly funded satellites, including the German Environmental Mapping and Analysis Program (EnMAP), the Chinese Gaofen 5 (GF5), Ziyuan 1 (ZY1), and Huanjing 2 (HJ2), the Italian PRecursore IperSpettrale della Missione Applicativa (PRISMA), the US LandSat (LS) 8 and 9, and the pan-European Sentinel-2 (ESA, 2022a, b; Jervis et al., 2021; OHBI, 2022; EnMAP, 2023; Liu et al., 2019; USGS, 2022; Song et al., 2022; Zhong et al., 2021). With the exception of the GHGSat-C constellation, none of these satellites were explicitly designed for methane sensing, but their data have instead been applied to this end. Analysis teams first attempted to estimate emissions volumes using available data from satellites and wind reanalysis products. In some cases, multiple teams assessed the same observation from an instrument, providing an opportunity to empirically assess variability due to source quantification algorithms, which participating teams were not required to release. See the Supplement (Sect. S3) for the details each team elected to share about their algorithms.
These satellites range from high sensitivity with a narrow swath to low sensitivity with a large swath, as illustrated in Table 1. Revisit time is also anticorrelated with instrument sensitivity. The Sentinel-2 and LandSat 8/9 systems have estimated detection limits of roughly 1–5 t h−1 (Gorroño et al., 2023), but each satellite in these constellations covers the bulk of the world's landmass every 10–16 d with a swath of 185–290 km (USGS, 2022; ESA, 2021a). GHGSat, EnMAP, GF5, PRISMA, WorldView-3, and ZY1 are targeted “point-and-shoot” systems, with higher resolution but narrower swaths of 12–60 km (ESA, 2022a, b; Jervis et al., 2021; OHBI, 2022; EnMAP, 2023; Liu et al., 2019; Song et al., 2022). Existing publicly available information does not specify whether HJ2 is targeted or has global coverage, but its swath of 800 km suggests it is capable of global coverage (Zhong et al., 2021). Pixel size also varies widely across satellites, with most tested satellites ranging from 20–30 m2 pixels, while HJ2 has 6 km2 pixels and WorldView-3 has highly sensitive 3.7 m2 pixels. Spectral resolution also varies across the tested satellites, from 0.3 nm for GHGSat-C to 200 nm for Sentinel-2 and LandSat 8/9 (Jacob et al., 2022), as discussed further in the Supplement (Sect. S2). See the Supplement (Sect. S2) for additional discussion of the capabilities of each satellite system.
Table 1Key characteristics of each participating satellite constellation from lowest to highest swath width, which is roughly proportional to an instrument's minimum methane detection limit. Global coverage refers to a configuration that passively covers most of Earth's surface over a certain number of orbits, while targeted coverage refers to a “point-and-shoot” instrument that must be pointed to a particular location. Nadir pixel size is presented here. Constellation size includes only active satellites. Accessing data from the GF5, ZY1, and HJ2 satellites requires permission from the Chinese government. Adapted with permission from Sherwin et al. (2023).
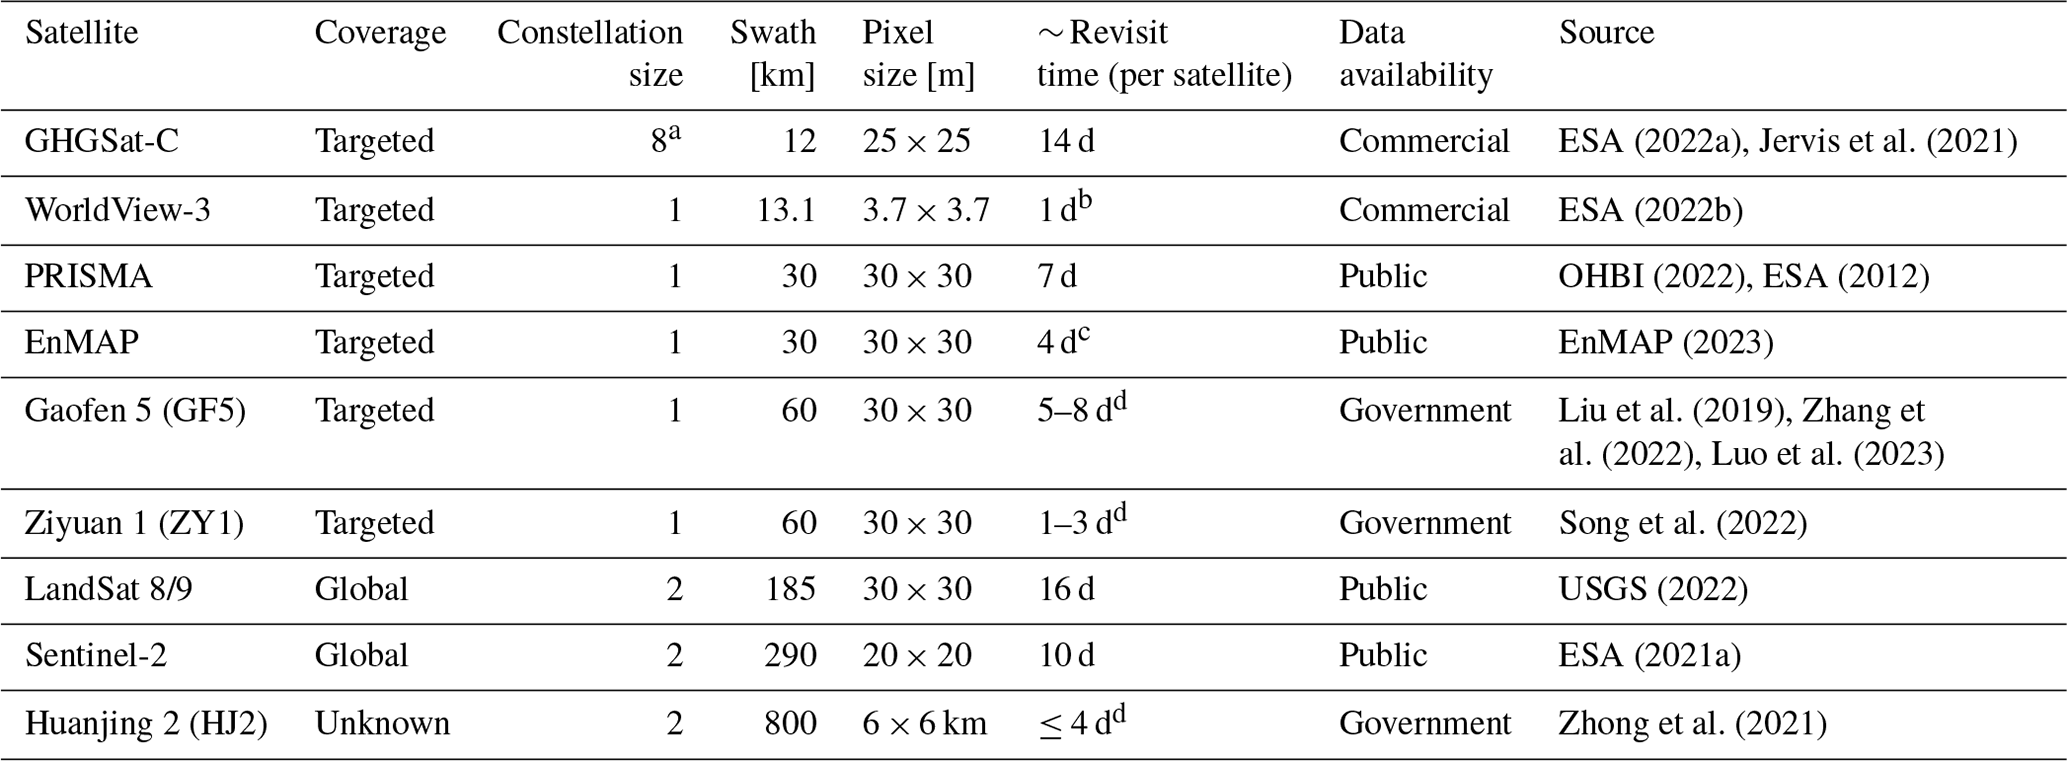
a Three of these GHGSat-C satellites were launched after the conclusion of testing. b WorldView-3 requires a 4.5 d repetition cycle for best resolution within 20∘ off nadir. c EnMAP requires a 27 d repetition cycle for best resolution within 30∘ off nadir (Jacob et al., 2022). d Revisit times for GF5, ZY1, and HJ2 are inferred, at least in part, from overpass schedules submitted by NJU.
This test does not include the TROPOMI system on the Sentinel-5P satellite, which has a detection limit far above the maximum of the release apparatus used in this study (ESA, 2021b). We inquired about tasking the Earth Surface Mineral Dust Source Investigation (EMIT) satellite, launched by the US National Aeronautics and Space Administration (NASA) in July 2022 (Wang and Lee, 2022), but the system was not available to participate in this test.
Participating analysis teams include the private companies GHGSat (GHGSat, 2022), Kayrros (Kayrros, 2022), Maxar (Scott, 2022), and Orbio Earth (Orbio, 2023), as well as the Land and Atmosphere Remote Sensing (LARS) group of university researchers from Universitat Politècnica de València (Luís Guanter, Javier Roger Juan, and Javier Gorroño Viñegla (Irakulis-Loitxate et al., 2022a, b, 2021; Guanter et al., 2021)) and Nanjing University (Fei Li, Huilin Chen, and Yongguang Zhang (Jia et al., 2022)). Each analysis team had the opportunity to submit estimates for all satellites tested, with the exception of the GHGSat-C satellites, to which GHGSat had sole access. See the Supplement (Sect. S3) for a description of each team and its members, as well as a list of invited teams that declined to participate.
2.1 Materials
For the full test period, our experimental equipment was located near Casa Grande, Arizona, south of Phoenix, Arizona, in the United States, with the release stacks located at [32.8218205∘, −111.7857730∘].
The methane source was two trailers of compressed natural gas, shown in Fig. 1, which passed through a pressure regulation and reheating apparatus. The gas was then transmitted to the metering and release trailer via a 7.62 cm (3 in.) shipping hose at an exit pressure of roughly 150–200 psig (1.03–1.37 Mpa), passing through one of three possible Coriolis meters before release through one of two stacks at a release height of either 7.3 or 3.0 m above ground level (El Abbadi et al., 2023), as shown in the Supplement (Fig. S1). This testing setup approximately mimics an unlit flare or tank vent on an oil and gas production site or other facility.
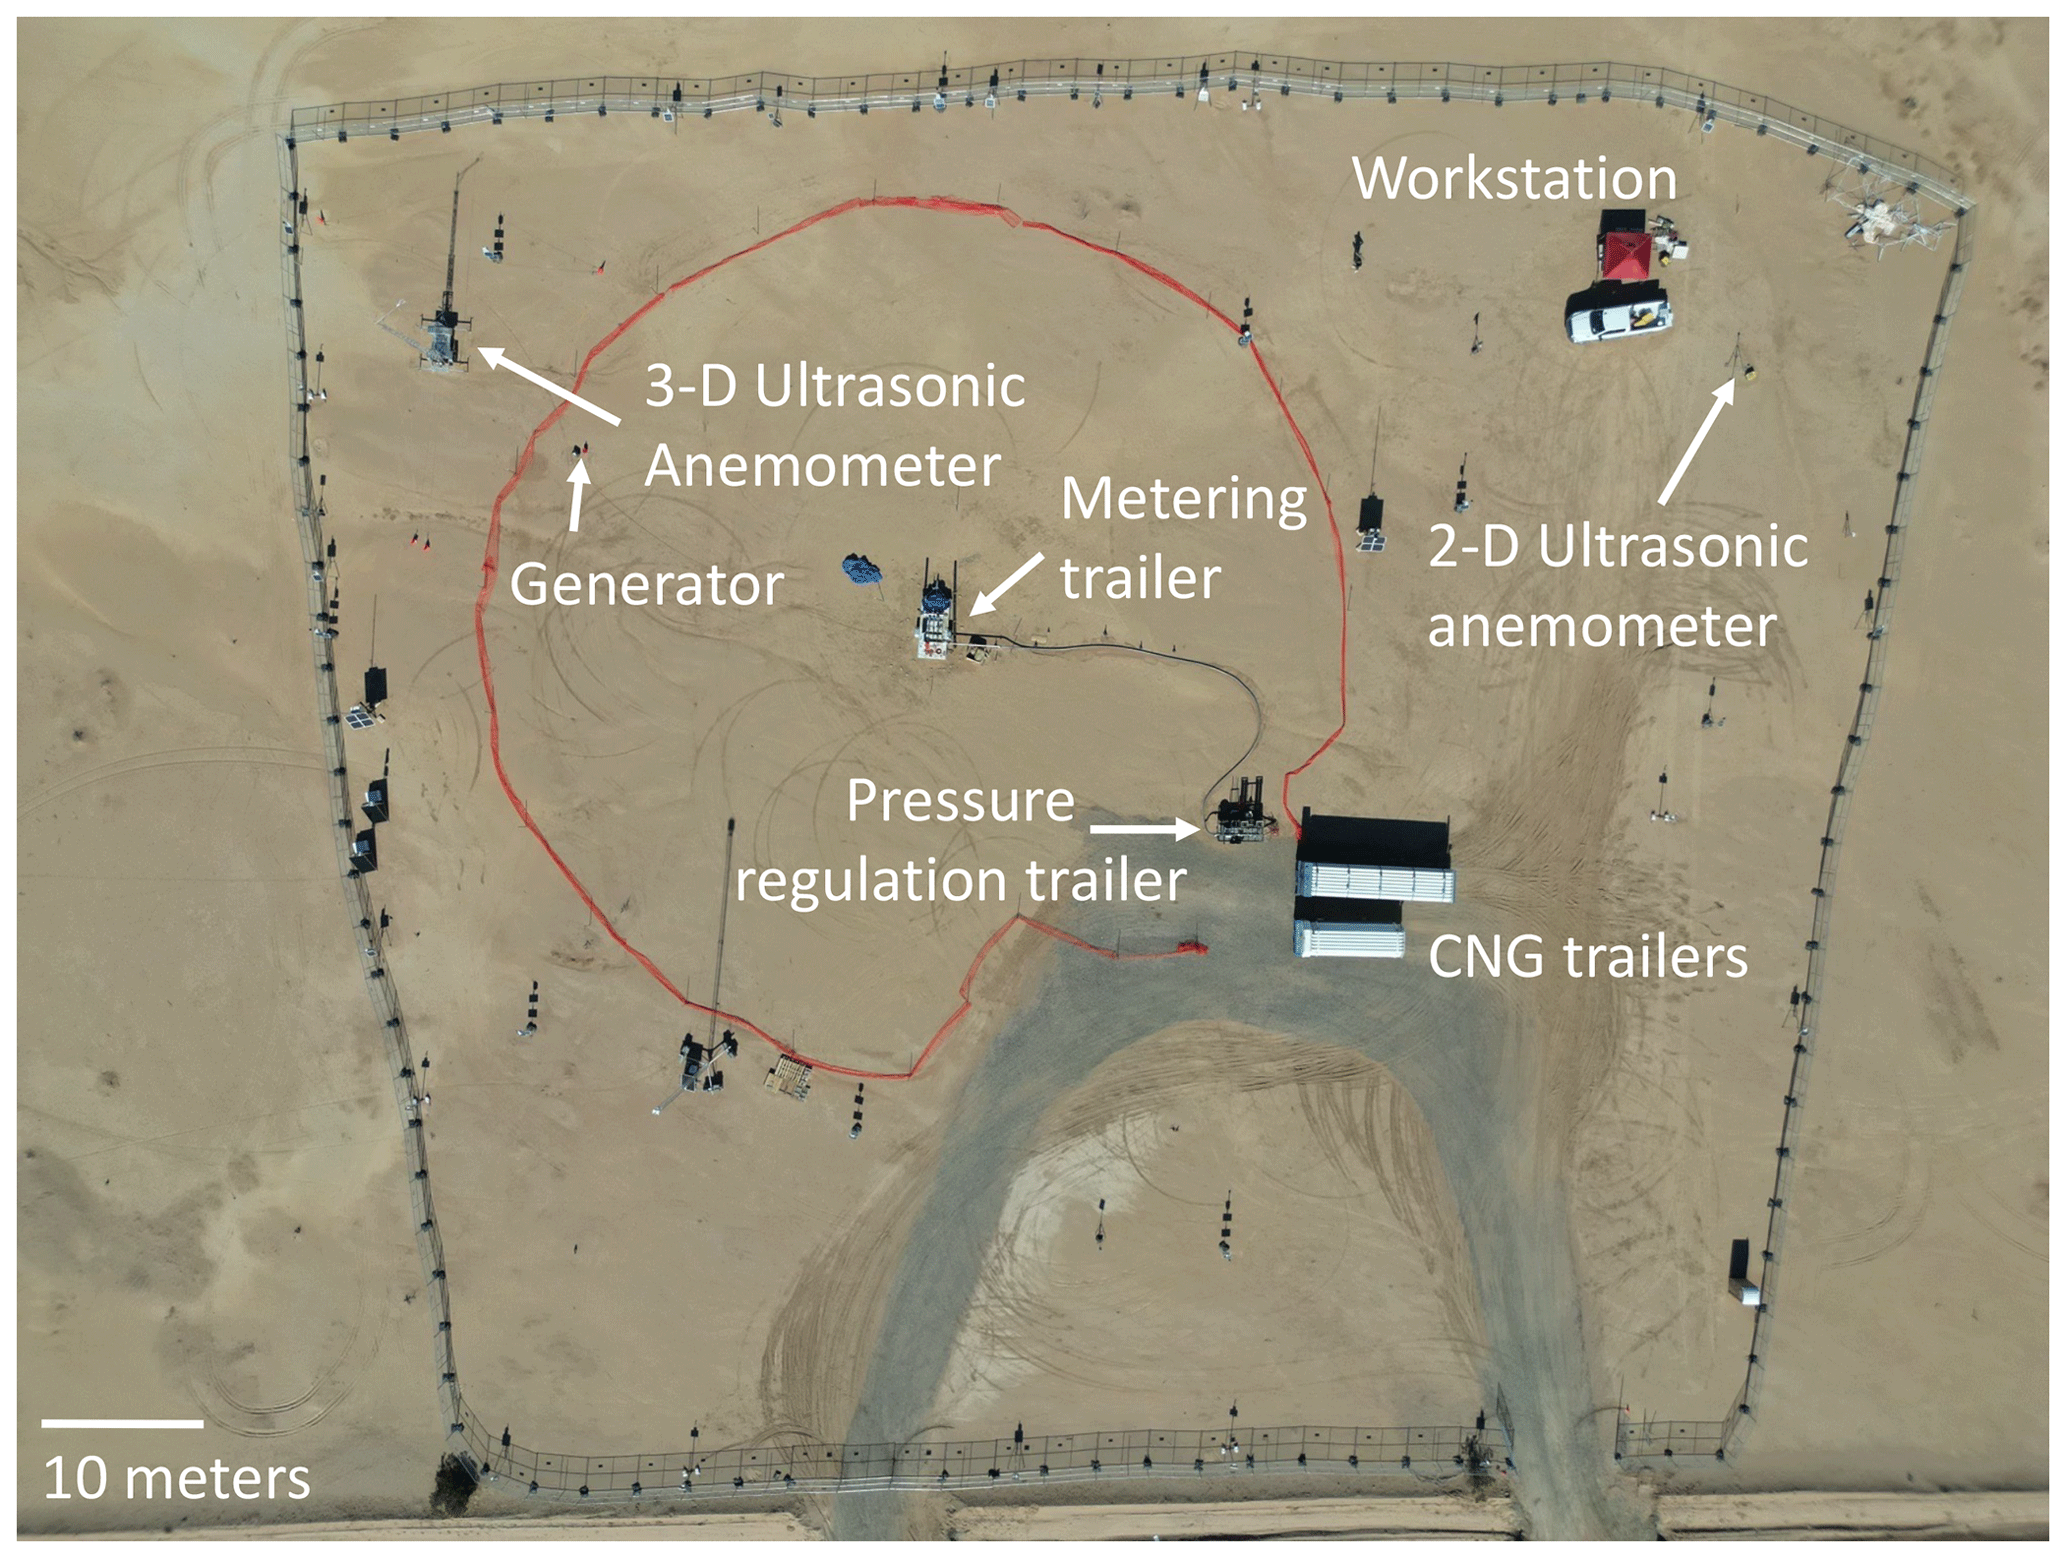
Figure 1Aerial photograph of the site. Note that the workstation is ∼ 60 m from the release apparatus and ∼ 50 m from the compressed natural gas (CNG) trailers. Reproduced with permission from El Abbadi et al. (2023).
This experiment was designed to provide nearly optimal conditions for methane-sensing satellites. In addition to the desert background, the site contained only equipment necessary to conduct controlled methane releases and test a suite of methane-sensing technologies. The result is a significantly less complex scene than many oil and gas facilities, which will often contain multiple pieces of infrastructure such as wellheads, tanks, flares, and separators at production sites, as well as entire buildings with sophisticated machinery and piping at compressor stations and gas processing plants. More complex scenery can make methane remote sensing more challenging. Future work with scenes that more closely mimic industrial sites will help determine the associated differences in technology efficacy, if any.
Achievable release rates for the three Coriolis meters, installed in pipes of different diameter, were 2–30, 30–300, and 300–2000 kg h−1 for natural gas. See El Abbadi et al. (2023) for further details.
2.2 Safety
Natural gas equipment fabrication, operation, and transportation were conducted by personnel affiliated with Rawhide Leasing, a gas services contractor. Stanford personnel contributed to assembly of some equipment but did not operate natural gas release equipment or pass within our 100 ft (30.5 m) safety perimeter fence during active releases. The research workstation, from which Stanford researchers coordinated data collection and related field operations, was ∼ 60 m away from any equipment through which natural gas flowed.
In addition, Stanford researchers periodically monitored plume dissipation in real time via a forward-looking infrared (FLIR) GasFinder 320 camera and continuously paid attention to olfactory signals from the gas, which was odorized. The infrared camera clearly showed that the plume dissipated well before reaching any on-site personnel. Equipment design contributed to this intrinsic safety because the emission source was elevated off the ground and gas often exited at a high vertical velocity, particularly at larger release volumes, accelerating natural methane lofting. When Stanford researchers detected gas smell during testing, they diligently checked infrared footage of the plume and/or ambient wind conditions to ensure the safety of all personnel on site.
2.3 Data logging
Stanford researchers collected data logs directly from the Coriolis gas flow meters, accounting for modest timestamp offsets as described in El Abbadi et al. (2023).
2.4 Data collection procedures
All satellite-coincident releases began at least 15 min before the scheduled satellite overpass time, provided by participating teams.
Stanford personnel set all release levels remotely using WiFi-enabled control software deployed on a laptop computer. For releases conducted on or before 20 October, Stanford personnel set a desired flow rate, with an automated control system adjusting valves in real time to target that rate. After it became clear that this approach resulted in unnecessary flow rate variability, releases from 21 October on were conducted by setting the relevant valve to a desired level of openness, improving flow stability while slightly reducing the system's ability to target a specific release rate, although this system still represents a major improvement over the manual approach employed in Sherwin et al. (2023). Flow can fluctuate during the releases due to shifts in pressure, temperature, and simple turbulent flow through the system. All performed releases except four had flow variability with a 5 min 95 % confidence interval within ±10 % of mean flow. On 15 November, a GF5 satellite acquisition was rescheduled without notice to the Stanford team for a time that happened to be 1 min after the conclusion of a different satellite release, resulting in flow variability within ±20 % of the 5 min mean. Three additional releases exceeded a 5 min flow variability 95 % confidence interval of ±10 %: the 11 October GHGSat-C overpass (in which the instrument was not tasked), the 17 October WorldView-3 release of 0.042 [0.034, 0.050] t h−1, and the 30 November PRISMA release of 0.98 [0.87, 1.08] t h−1.
Interference from other sources was examined and found to be minimal. Over the course of the experiment, we tested the Carbon Mapper, GHGSat AV, Kairos Aerospace, MethaneAIR, and Scientific Aviation aerial methane-sensing systems (El Abbadi et al., 2023), all of which are more sensitive than any of the satellites tested. These aircraft, which also surveyed the nearby area during the process of data collection, found no detectable methane sources outside our test site. This strongly suggests that our test was free of interference from significant confounding methane sources. The only evidence of modest possible landfill interference comes Scientific Aviation, whose highly sensitive in situ measurement technology found modest and diffuse methane concentration enhancements over a nearby landfill, potentially impacting only one of the three days of testing and only one of the seven measurements conducted on that day (El Abbadi et al., 2023).
2.5 Flow rate uncertainty
Sources of uncertainty in measured methane flow rates include variability in actual natural gas flow rates (represented as the standard deviation of metered natural gas flow over a 5 min period), rated meter uncertainty, and uncertainty in gas composition, which can vary even for a consistent supplier. We used highly precise Coriolis meters, which have manufacturer rated uncertainty of 0.25 % of the flow rates used in this study (El Abbadi et al., 2023). Natural gas composition for the gas used in these releases, derived from measurement stations on the transmission pipeline that supplied the gas used in this test, ranged between 93.6 % [93.3 %, 93.9 %] and 95.4 % [94.7 %, 96.1 %] methane, as described further in the Supplement (Sect. S1.2) and in references (El Abbadi et al., 2023). We propagate these sources of error into our metered values using code listed in the “Code and data availability” statement. See El Abbadi et al. (2023) for further discussion of sources of metering uncertainty and our method of determining flow rate uncertainty, as well as detailed gas composition data.
Following Sherwin et al. (2023), we use a 5 min averaging period used to compute flow variability. This is based on the fact that a plume traveling with a relatively slow average wind speed of 2 m s−1, the minimum observed 5 min average wind speed for any valid satellite measurement, would traverse 600 m within 5 min (300 s). By this distance, much of the originally emitted methane has likely dissipated into background concentrations, with the bulk of the methane enhancement detected by a satellite remaining closer to the release point.
2.6 Experimental design
This single-blind field trial employed a two-stage experimental design, modeled on Sherwin et al. (2023). This approach aims to disentangle the effect of wind speed uncertainty from other sources of methane quantification uncertainty, e.g., due to algorithmic differences.
Stanford personnel released metered quantities of methane from the test site via procedures described above and in references (El Abbadi et al., 2023). The Stanford ground team and contract personnel operating equipment communicated no information to participating teams regarding metered flow rates or metered wind speed or direction. Participating teams were aware of the precise location coordinates of the test but were not informed of the precise configuration of ground-based equipment within the test site. Teams were given a rough range of possible overall flow rates, from below 0.01 to roughly 1.5 t h−1. To facilitate efficient tasking of government satellites, LARS and NJU were informed in advance that weekend releases in November would be canceled and all such dates were excluded from single-blind analysis for those teams. In addition, participating teams were not informed of the details of the equipment and its configuration or the diameter of the pipes and hoses involved, although teams were informed that the test would use compressed natural gas as the methane source.
After each team submitted final stage 1 estimates based on the above information, we proceeded to stage 2 estimates. In stage 2, Stanford provided 10 m wind speed and direction data from our on-site ultrasonic anemometer (shown in Fig. 1) at 1 s resolution, and teams were allowed to re-estimate emissions based on measured ground wind conditions rather than reanalysis products as in stage 1. All teams submitted stage 1 and stage 2 estimates, with the respective timelines described in the Supplement (Sect. S2.10). Note that turnaround time for results in this study may not be representative of commercial or field performance.
For the eight satellites given nonzero methane emissions, at least one analysis team correctly detected methane. The single HJ2 measurement, using the HJ2B satellite, was rescheduled without notice to a time at which Stanford was not releasing methane.
In total, the nine tested satellites conducted 82 overpasses. Six analysis teams analyzed data from between one and eight satellites each, resulting in a total of 492 potential estimates. Stanford filtered many of these estimates from analysis before teams submitted results for various reasons (e.g., due to release system malfunction or prior notice to teams tasking government satellites that there would be no weekend releases in November). In addition, most teams opted to submit estimates for only a subset of all available satellites. See the Supplement (Sect. S1.3) for further discussion of data exclusion criteria.
Of the 139 estimates not filtered by Stanford, in five instances (3.6 % of the total), teams filtered estimates using internal quality control criteria related to cloud cover, image clipping, or other factors that could compromise the ability to produce a valid methane estimate. GHGSat filtered three retrievals from the GHGSat-C satellite due to clouds (see Fig. 8 and the Supplement, Sect. S4, for sky images and further discussion of clouds). LARS filtered two WorldView-3 retrievals due to cloud cover (22 November) and inconsistent wind, as well as possible effects of human-made surface features (10 October). As a result, a total of 134 estimates included valid methane detection estimates.
Of these 134 estimates, 80 (58 %) were identified as either a true positive or true negative, correctly determining the presence or absence of methane, as shown in Fig. 2. True positives represent 46 (34 %) of total estimates with valid detection estimates, with 34 (25 %) true negatives. Note that for Sentinel-2, we consider non-detection of an 0.005 t h−1 release on 28 November to be a true negative, as this value is more than 2 orders of magnitude below existing estimates of the detection threshold of this system (Gorroño et al., 2023; Sherwin et al., 2023).
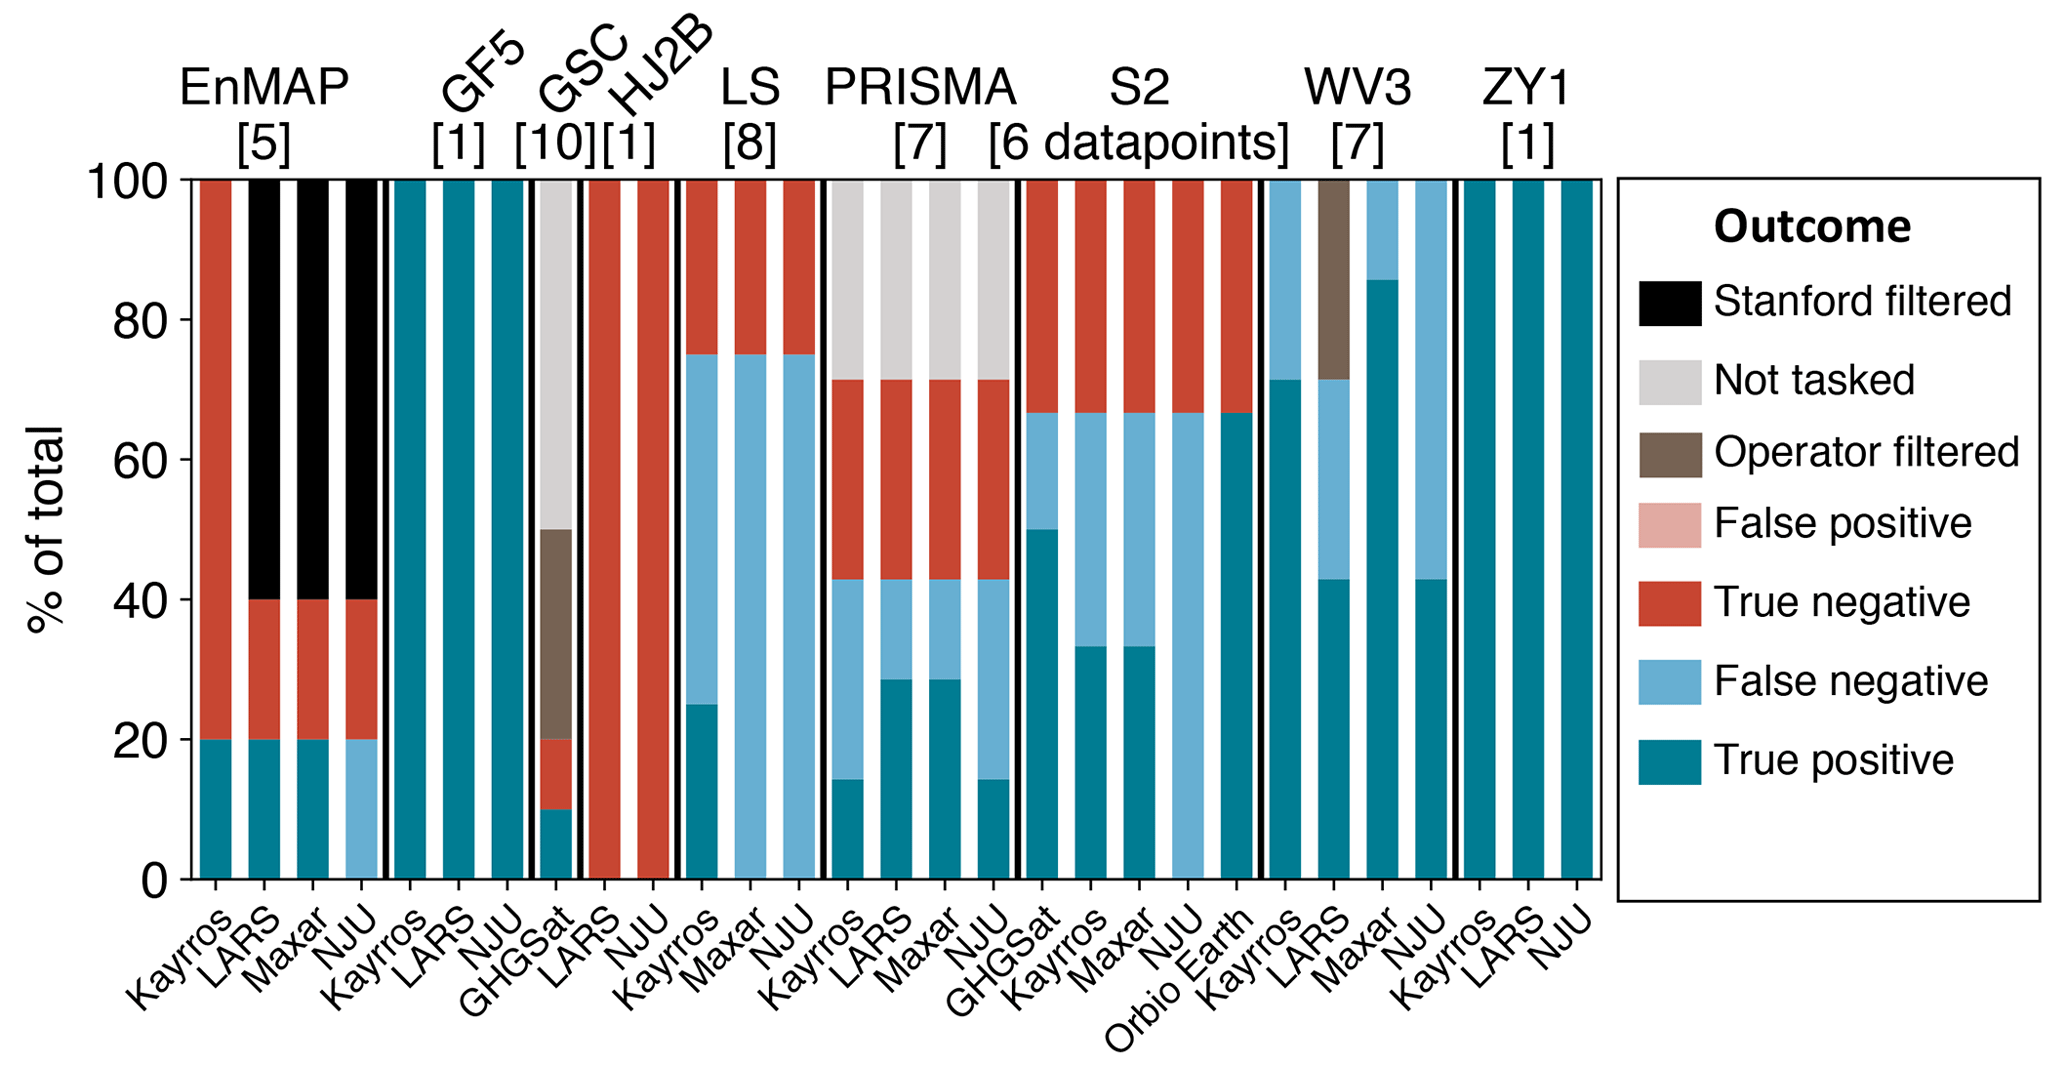
Figure 2Detection performance by satellite and team. The total number of measurements per satellite is listed in brackets, excluding measurements filtered by Stanford across all teams. All teams analyzing data from the three Chinese satellites, Gaofen 5 Advanced Hyperspectral Imager (GF5), Ziyuan 1 (ZY1), and Huanjing 2B (HJ2B), all correctly classified all emissions. Detection performance varied substantially across the Sentinel-2 (S2) and LandSat 8/9 (LS) wide-area satellites. On several days, anticipated measurements from PRISMA and GHGSat-C (GSC) were not collected because the satellite was not tasked. In others, e.g., two WorldView-3 retrievals from LARS, no retrieval was conducted due to concerns over image clipping or excessive cloud cover. No teams submitted false positives in which they reported the presence of methane when none was released.
Of the 41 false negatives (30 %), most (25) are concentrated in the lower-sensitivity Sentinel-2 and LandSat 8/9 systems. There is substantial variability in false negative rates across teams. For example, Orbio Earth correctly classified all valid Sentinel-2 releases. GHGSat missed only one Sentinel-2 release, and NJU detected none. This highlights the fact that analysis of identical spectral data can produce very different results. As in Sherwin et al. (2023), there were no false positives, defined as incorrect reports of the presence of methane.
In several cases, a satellite was not tasked during an overpass for which the Stanford team conducted a release, either due to technical issues, scheduling issues, or miscommunications between the Stanford team and the operator. This occurred for five GHGSat overpasses and two PRISMA overpasses, resulting in a total of 13 not tasked estimates from participating teams for these two satellites, which is 9 % of all estimates not filtered by Stanford.
3.1 First-time single-blind detections from three satellites
This work includes the first-ever single-blind test of the Chinese Ziyuan 1 (ZY1), Gaofen 5 (GF5), and Huanjing 2B satellites (HJ2B), as well as the European EnMAP satellite. Previous studies have used a subset of these satellites to detect and quantify point-source emissions with estimated magnitudes as small as 0.5 t h−1 but have not performed ground-truth testing (Irakulis-Loitxate et al., 2021). Roger et al. (2023) compare EnMAP retrievals with the single-blind-validated PRISMA satellite as a benchmark, finding promising results, including for offshore emissions of 1 t h−1 or more.
Figure 3 shows masked methane plume images from ZY1, GF5, and EnMAP over a standard optical satellite image background for emissions of roughly 1 t h−1. Masking refers to the process of spatially differentiating a methane emission from background noise. The HJ2B acquisition was rescheduled without prior notice to the Stanford team to a time at which no release took place, which all teams analyzing HJ2B data correctly identified as a non-emission. We present images from all teams analyzing satellite data from these measurements, including LARS, Kayrros, NJU, and Maxar. See the Supplement (Sect. S4) for masked and unmasked plume images for all satellites and teams.
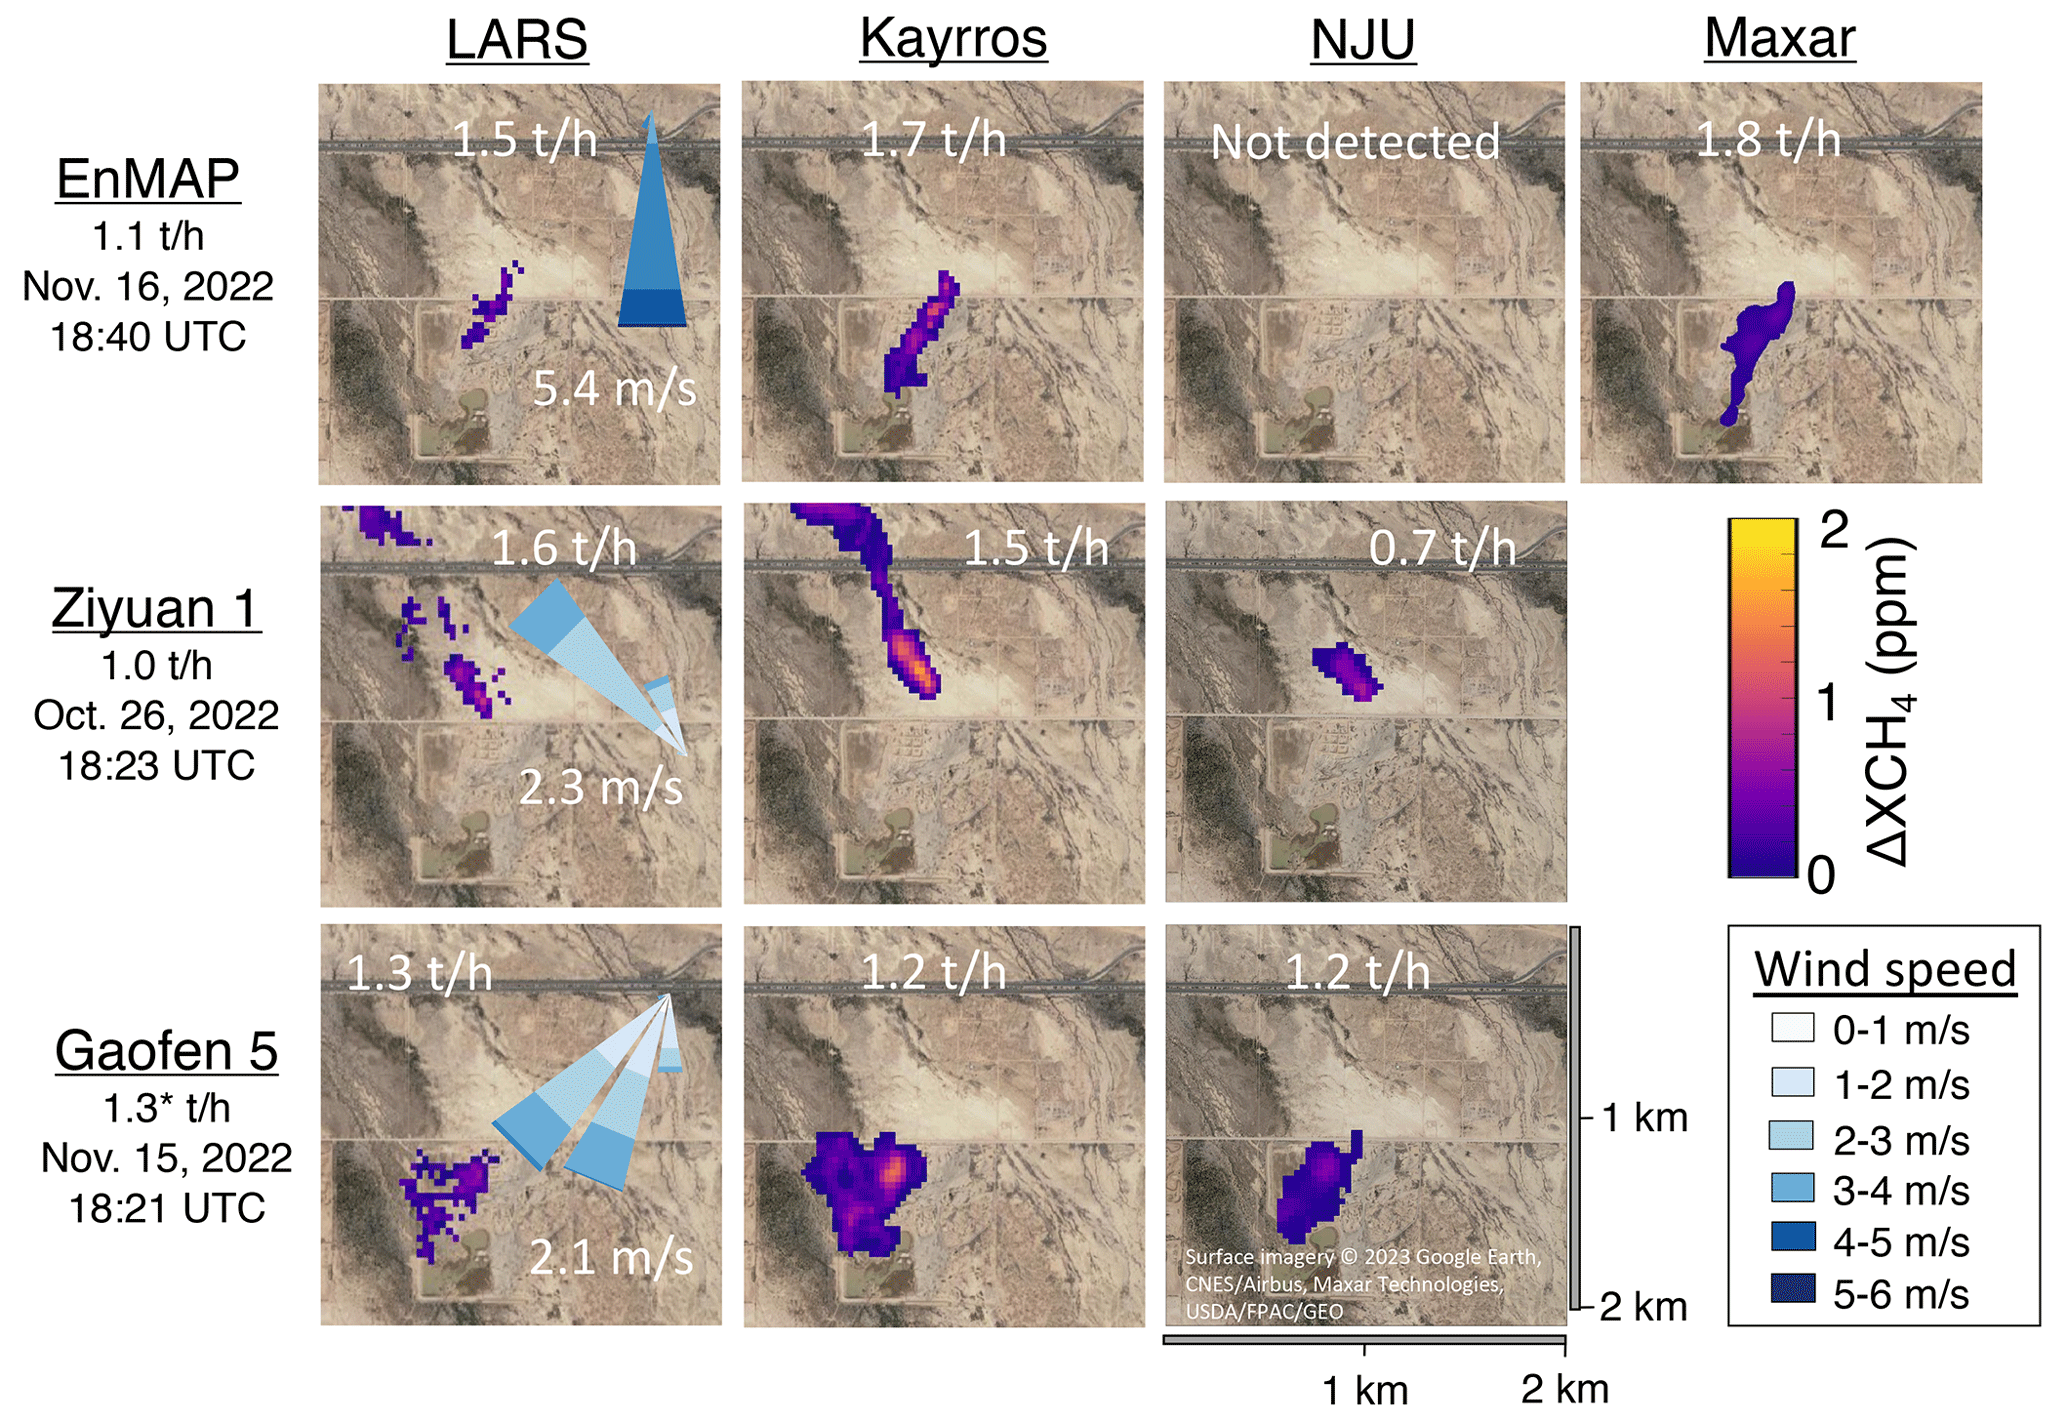
Figure 3Visualization of detected emissions for the newly tested European and Chinese satellites using the release closest to 1 t h−1 in all cases. The true measured emission rate and the timestamp are shown below the satellite name. Mean estimated volume from each team–satellite pair and a 5 min wind rose of measured 10 m wind speed as well as the direction toward which the wind was blowing are superimposed on the corresponding picture. The wind rose represents a histogram of 1 s wind measurements in each direction, broken down by wind speed. Where an emission was not detected, we show only the background landscape image. Cloud-free surface imagery © 2023 Google Earth, CNES/Airbus, Maxar Technologies, USDA/FPAC/GEO. ∗ The Gaofen 5 measurement was rescheduled without notice to a time that happened to be 1 min after releases had concluded for a different satellite, resulting in artificially high variability in the metered ground-truth flow rate.
Note that, as was observed in Sherwin et al. (2023), teams analyzing precisely the same spectral data can produce methane plume masks with very different shapes. Each row represents a distinct satellite, while each column shows estimates from a distinct team. For example, the first row shows estimates for the 16 November EnMAP satellite measurement, for which four teams submitted estimates. Three of the four teams detected the emission. LARS, Kayrros, and Maxar all show masked plumes traveling in roughly the same direction, but the Kayrros and Maxar plumes are fairly contiguous, while the LARS plume is smaller and contains disjunct or tenuously connected clusters of estimated methane enhancements. Overall, masks from LARS are more conservative and less spatially contiguous than other teams. However, quantification estimates from LARS, Kayrros, and Maxar all have overlapping confidence intervals, demonstrating that the results are not statistically distinguishable across these three teams (NJU did not detect this EnMAP emission). Even in cases with large mean differences, e.g., 26 October estimates for ZY1, which range from 1.6 [1.2, 2.0] t h−1 for LARS to 0.7 [0.6, 0.9] t h−1 for NJU, the 95 % confidence intervals overlap. These findings suggest that many factors influence quantification performance, even when working with identical spectral data, but large uncertainties make disentangling these differences a challenge. Further analysis of these algorithmic differences is beyond the scope of this work, as teams were not asked to provide algorithmic details, which are often proprietary. Further experimentation may enable analysis of general trends in advantages of one algorithm over another, but the order-100 number of data points here is insufficient to make such judgments.
Wind can vary substantially in speed and direction even on 5 min timescales relevant to methane quantification, as shown in wind roses inset in the leftmost panel for each satellite in Fig. 3. This variability clearly influences plume formation, with emissions with steadier wind directions and higher speed, such as the EnMAP and ZY1 measurements shown here (5.4 [3.7, 7.2] m s−1 and 2.3 [1.0, 3.7] m s−1 average wind speed, with a wind direction circular standard deviation of 16 and 11∘, respectively), resulting in narrower plumes. The highlighted GF5 measurement has slower and more variable winds and a wider plume in all three retrievals (2.1 [0.3, 4.0] m s−1, with a wind direction circular standard deviation of 18∘).
3.2 Reliable overall quantification performance
Releases in this study covered a wide range of emission rates as low as 0.0332 [0.0328, 0.0336] t h−1, analogous to a medium-sized liquids unloading event at an oil and gas production site (Bell et al., 2017), and as high as 1.48 [1.43, 1.52] t h−1, analogous to a medium-sized unlit flare (Cusworth et al., 2021). For all detected emissions, mean estimates for all satellite–team combinations are between −56 % and 456 % of the metered value (Fig. 4; see also the Supplement, Sect. S5), with 55 % of nonzero estimates falling within ±50 % of the metered value. Excluding estimates from Maxar, which discovered after submitting results that its estimates were likely a factor of 2.3 too high due to a misinterpretation of a deprecated spectral absorption library, this fraction rises to 63 % (Hayden and Christy, 2023). However, the best-fit line across all satellite measurements, any one of which may have substantial quantification error, is largely unbiased, with a slope close to the ideal value of 1 (which would denote perfect agreement on average).
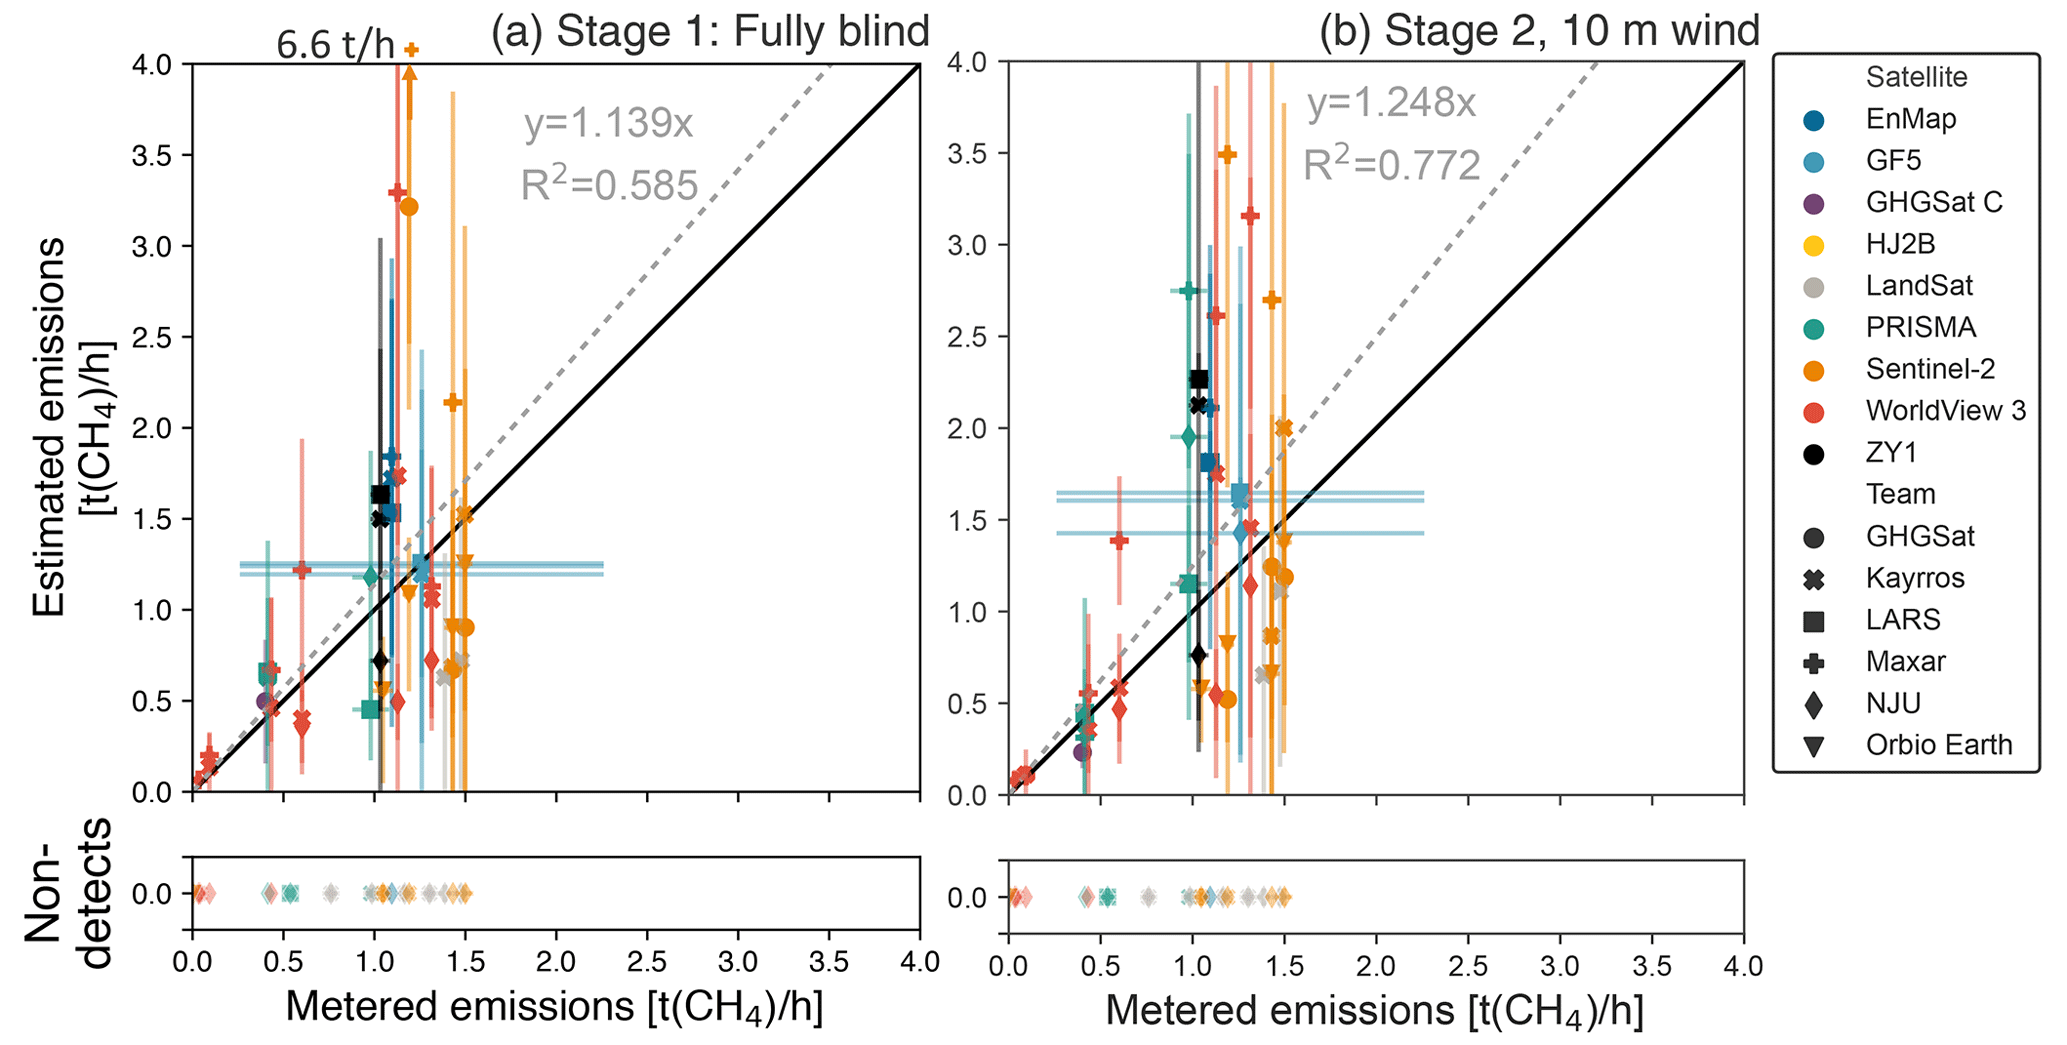
Figure 4Methane quantification performance by satellite and team. Metered emissions compared with single-blind estimates for each overpass with successfully reported data, with 95 % X and Y confidence intervals. (a) Fully blind stage 1 results using modeled wind speed estimates. Note that one Sentinel-2 estimate exceeds the y-axis limit at 6.6 t(CH4) h−1. (b) Stage 2 results using on-site 10 m wind speed and direction measurements. LARS WorldView-3 quantification estimates are excluded from the main analysis, as stage 1 estimates were submitted after wind data had been unblinded to a member of the LARS team not involved in analyzing WorldView-3 data, while corresponding stage 2 estimates were submitted after release volumes were unblinded. Note that Maxar submitted PRISMA estimates for stage 2 only. The dashed grey lines represent an ordinary least-squares fit with the intercept fixed at zero, with slope and uncentered R2 displayed. Maxar has since determined that its estimates were likely artificially high, potentially introducing upward bias into aggregate statistics (Hayden and Christy, 2023). See the Supplement (Sect. S4.2) for a version of this plot excluding Maxar, which shows overall improvement in both slope and R2. The solid black lines denote exact 1:1 agreement. See the Supplement (Sect. S4) for satellite- and team-specific results.
In percent quantification error terms, this overall performance approaches that of the satellites and teams tested in Sherwin et al. (2023), in which 75 % of estimates fell within ±50 % of the metered value, demonstrating a relative error profile similar to that observed in aircraft-based methane remote sensing technologies (albeit with minimum detection limits 1 to 3 orders of magnitude larger) (Sherwin et al., 2023; El Abbadi et al., 2023; Bell et al., 2022). Direct comparison with the results in Sherwin et al. (2023) is complicated by the fact that releases in this study focused on smaller emissions, with a maximum of roughly 1.5 t h−1 instead of 7.2 t h−1. Aircraft-based methane remote sensing technologies tested in El Abbadi et al. tend to have modestly better quantification performance in percentage terms, with 68 %–80 % of estimates from Carbon Mapper, GHGSat, Kairos Aerospace, and MethaneAIR falling within ±50 % of the metered value (El Abbadi et al., 2023), a substantial improvement over prior tests of the same technologies (Sherwin et al., 2021; Rutherford et al., 2023). In each of these cases, best-fit lines have a slope that is similarly close to 1:1 agreement.
See the Supplement (Sect. S4) for error summary statistics by satellite and team. Error bars in metered values along the x axis are generally too small to be visible, with the notable exception of the GF5 measurement, which was rescheduled without notice to a time that happened to be 1 min after releases had concluded for a different satellite.
In stage 2 of the test, teams produced updated results using measured 10 m wind data from an on-site three-dimensional ultrasonic anemometer, though still blind to released volumes. Applying an ordinary least-squares linear fit to all quantified emissions with the intercept set to zero, we see a modest increase in slope, rising from 1.139 [0.832, 1.446] in stage 1 to 1.248 [1.037, 1.459] in stage 2 (Fig. 4).
Interpretation of these results is complicated by the fact that the Maxar team discovered after submitting blinded results that the spectral library underlying their estimates contained an error that likely artificially inflated their estimates by a factor of 2.3, as discussed in detail in a white paper produced by Maxar personnel (Hayden and Christy, 2023). This is consistent with the Maxar-specific parity chart in the Supplement (Sect. S4) alongside other satellite- and team-specific results, which shows a regression best-fit line of 2.334 [1.030, 3.638] and an uncentered R2 of 0.96, indicating a close linear fit. Excluding Maxar results (as in the Supplement, Sect. S4.2), the stage 1 slope for all remaining teams falls to 0.897 [0.716, 1.078], with a stage 2 slope of 1.010 [0.841, 1.180], which is almost perfect average agreement with metered values. These slopes are 21 % and 19 % below the respective estimates in which Maxar values were included.
Note that LARS WorldView-3 quantification estimates are excluded from the main analysis, as stage 1 estimates were submitted after wind data had been unblinded to a member of the LARS team not involved in analyzing WorldView-3 data, while corresponding stage 2 estimates were submitted after release volumes were unblinded. Although the Stanford team believes all LARS quantification estimates for WorldView-3 were submitted without leveraging unblinded data, we must exclude them from the main analysis. This does not affect the integrity of detection estimates, as only wind measurements were unblinded when these were first submitted. See the Supplement (Sect. S4) for LARS WorldView-3 quantification results.
After incorporating on-site wind measurements, the uncentered R2 increases from 0.585 to 0.772, a substantial improvement in goodness of fit. Excluding Maxar results, these numbers rise to 0.768 and 0.826, respectively. The linear fit presented here treats all estimated emission rates from all team as independent data points. Note that uncentered R2 values from such a linear fit, with a zero intercept, have a different interpretation than R2 values from nonzero intercept regressions and should not be compared directly. See Sherwin et al. (2023) and the Supplement (Sect. S5) for a further explanation of the reasons for an ordinary least-squares fit with the intercept fixed to zero. This improved average linear fit with in situ wind does not necessarily translate to lower error for each individual satellite, as shown in the Supplement (Sect. S4) alongside additional regression results.
Confidence intervals submitted by teams appear to be modestly overconfident. For stage 1 estimates, the metered value is within the provided 95 % confidence interval only 70 % of the time, which is somewhat below the expected value of 95 % for perfectly calibrated 95 % confidence intervals. For stage 2, this fraction falls to 52 %, although mean error improves. Note that these values combine results from multiple satellites and teams and thus represent an overall sense of the performance of satellite-based methane-sensing systems as a technology class. Additional data collection is needed to characterize the performance of each individual satellite in detail.
Figure 5 shows stage 1 fully blinded results, the same underlying data as in Fig. 4, for each individual team. Team-specific parity lines tend to fall near the ideal 1:1 level, with Orbio Earth and NJU exhibiting modest low bias parity slopes of 0.74. Note that Maxar's parity slope of 2.3 almost exactly matches the factor of 2.3 they believe was error introduced into their system through misinterpretation of a deprecated spectral library (Hayden and Christy, 2023). The bulk of false negatives were from the relatively low-resolution Sentinel-2 and LandSat 8/9 satellites. However, Orbio Earth successfully detected all Sentinel-2 releases, except a release below 0.010 t h−1 (testing another technology), which is far below all estimates of the Sentinel-2 detection limit (Gorroño et al., 2023; Sherwin et al., 2023). These results highlight algorithmic variation across teams analyzing the same spectral data.
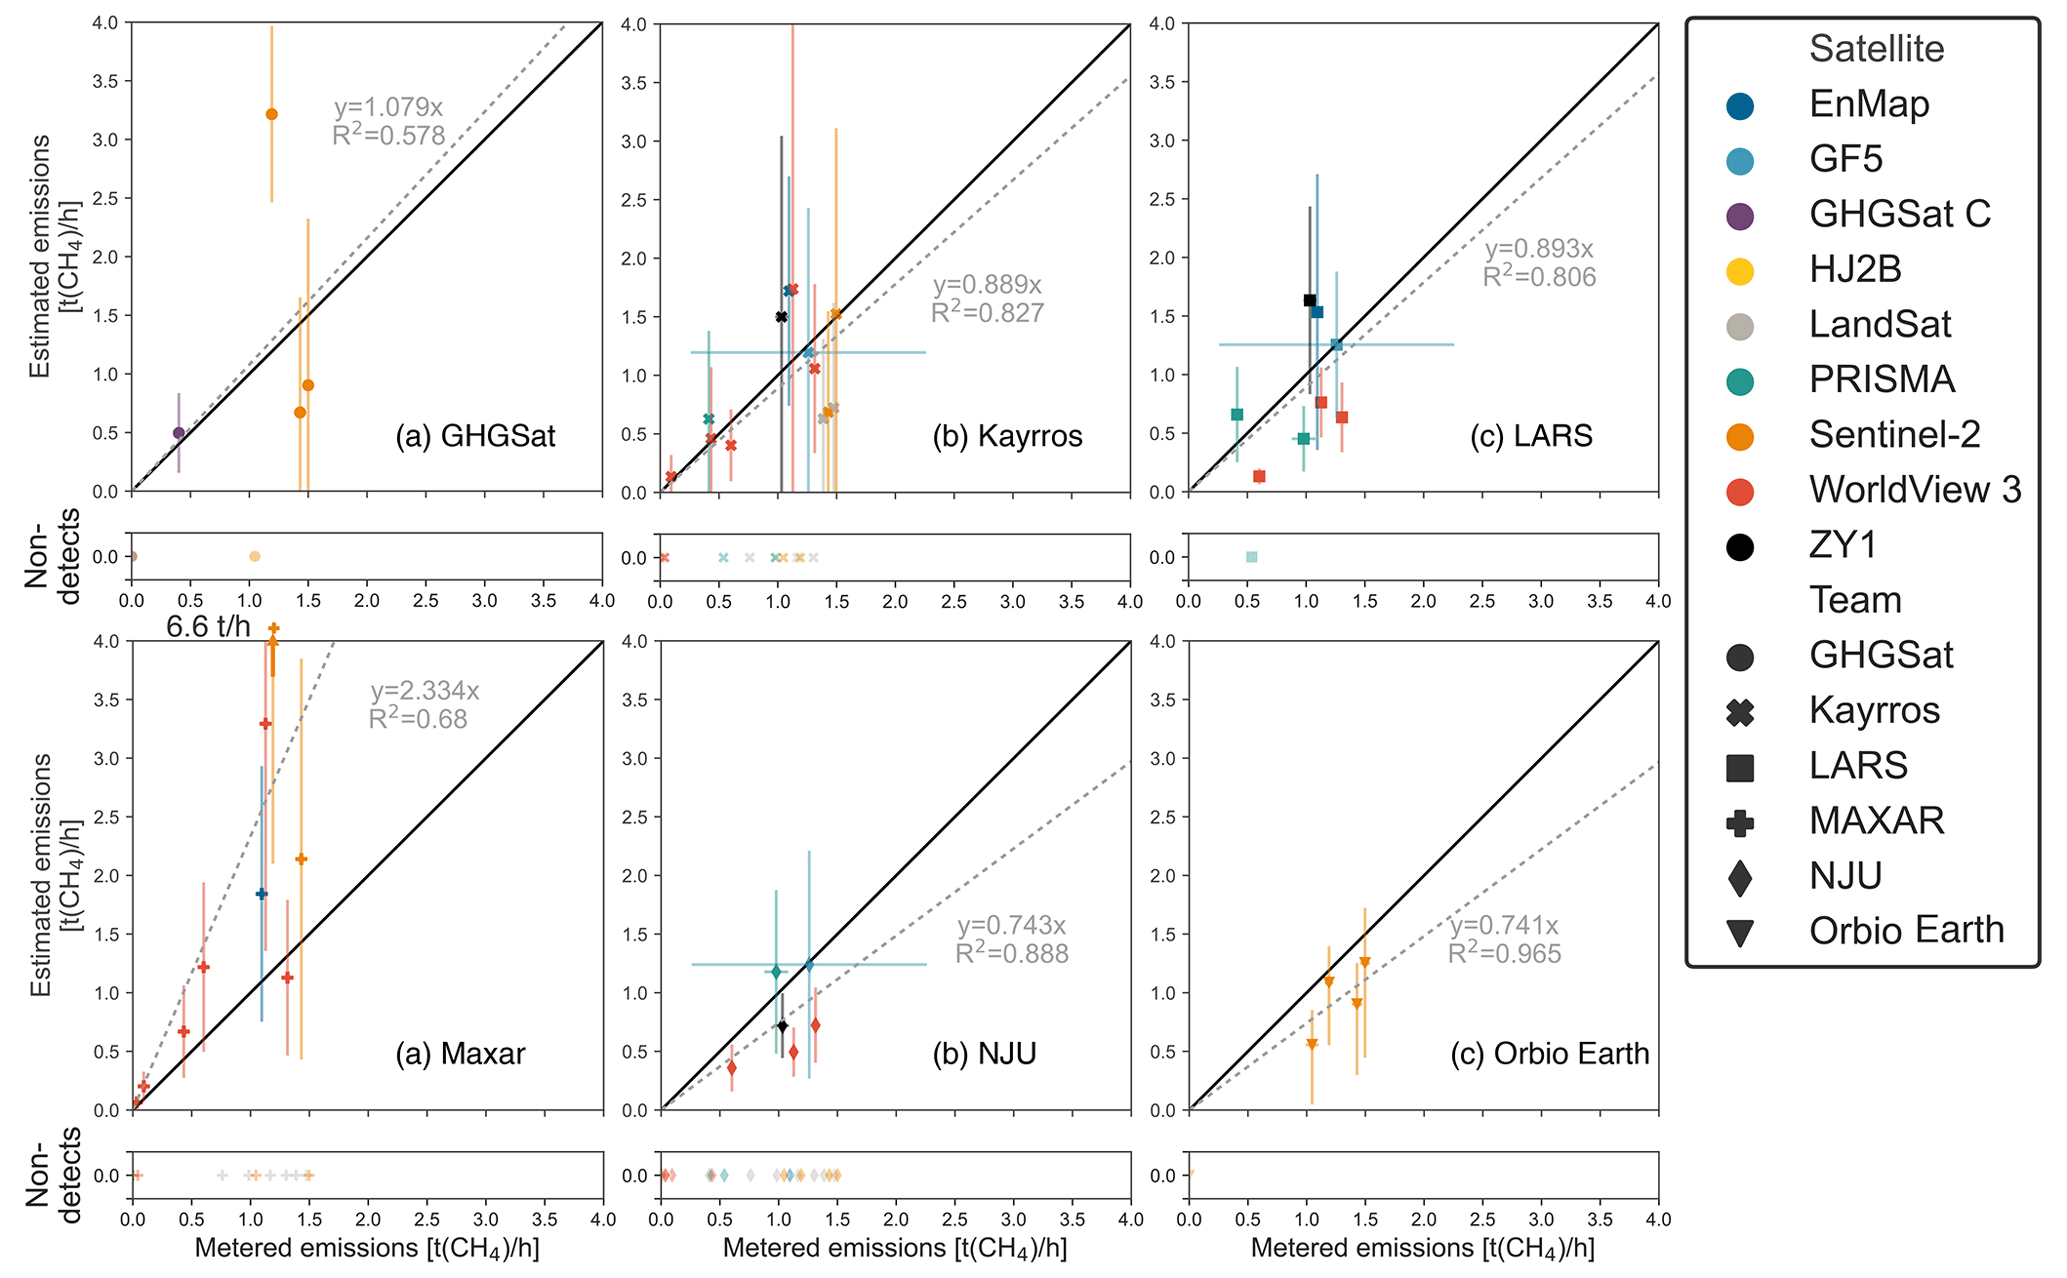
Figure 5Parity charts by team for fully blinded stage 1 estimates only. Metered emissions compared with single-blind estimates for each overpass with successfully reported data, with 95 % X and Y confidence intervals. Note that one Maxar Sentinel-2 estimate exceeds the y-axis limit at 6.6 t(CH4) h−1. LARS stage 1 WorldView-3 quantification estimates are excluded from the main analysis, as they were submitted after wind data had been unblinded to a member of the LARS team not involved in analyzing WorldView-3 data. The dashed grey lines represent an ordinary least-squares fit with the intercept fixed at zero, with slope and uncentered R2 displayed. Maxar has since determined that its estimates were likely artificially high, potentially introducing upward bias into aggregate statistics (Hayden and Christy, 2023). The solid black lines denote exact 1:1 agreement. See the Supplement (Sect. S4) for stage 1 and stage 2 satellite- and team-specific results.
3.3 Qualitatively assessing detection performance in the field
The smallest emission detected by each team gives a rough upper bound on the lower detection capabilities of each instrument, at least in a desert environment with a known release location. We compare these smallest detected emissions with previous estimates of lower detection capabilities of each satellite. The smallest emission detected was 0.0332 [0.0328, 0.0336] t h−1, identified by Maxar using WorldView-3, shown in Fig. 6. Kayrros also detected an emission below 0.1 t h−1 using WorldView-3. This is consistent with previous estimates of lower detection capabilities, with Sánchez-García et al. (2022) detecting an emission estimated at ∼ 0.040 t h−1 in Turkmenistan using WorldView-3.
Orbio Earth, Maxar, and GHGSat all detected a 1.19 [1.15, 1.23] t h−1 emission using Sentinel-2, with errors ranging from −8 % to +170 %. Orbio Earth detected a 1.05 [0.99, 1.10] t h−1 emission to within ±47 %. These emissions are 15 %–25 % below the smallest emission detected using Sentinel-2 in any previous satellite controlled methane release test and consistent with simulation-based estimates (Sherwin et al., 2023; Gorroño et al., 2023). The story is similar for LandSat 8/9, with the smallest detected emission at 1.39 [1.34, 1.43] t h−1. This is also slightly below estimated lower detection capabilities in the literature (Jacob et al., 2022).
The smallest emission detected via PRISMA was 0.414 [0.410, 0.417] t h−1, which is smaller than the 0.5–2.0 t h−1 estimated by Guanter et al. as PRISMA's lower detection threshold (Guanter et al., 2021). The smallest detected emissions for the remaining satellites are 1.10 [1.06, 1.13] t h−1 for EnMAP, 1.26 [0.26, 2.26] t h−1 for GF5, and 1.03 [0.98, 1.09] t h−1 for ZY1. However, given that the technical characteristics of these three satellites are similar to PRISMA, they can likely be used to detect emissions below 1 t h−1, at least under favorable environmental conditions (Jacob et al., 2022; Roger et al., 2023).
GHGSat correctly detected and quantified the only nonzero release for which GHGSat-C collected data and passed quality control, which was 0.401 [0.399, 0.404] t h−1, roughly double the smallest release GHGSat quantified using the same satellite system in Sherwin et al. (2023). GHGSat's lower detection threshold is estimated at 0.1–0.2 t h−1 (Jacob et al., 2022). HJ2B was not tasked during any active releases, meaning that future testing is needed to assess its detection capabilities.
In practical applications for global remote sensing, teams have only limited information about the location of possible sources and their likelihood of emitting at visible levels. As a result, it is possible that the known-location experimental design applied here may have allowed teams to artificially boost detection sensitivity to levels that would be difficult to achieve in general practice. To qualitatively assess this possibility, all teams were required to submit methane retrieval field images for all submitted estimates, including both detections and non-detections. In all cases, teams submitted full-scene retrieval fields in a 2×2 km box around the release location. For detected emissions, teams also submitted masked plume images, overlaying the estimated methane plume above an optical image of the background location. See the Supplement (Sect. S4) for all such images.
We highlight selected images in Fig. 6 to showcase issues related to spectral artifacts, e.g., apparent methane enhancements due to water bodies, clouds, or roads, that we were not able to quantitatively address in this study. The GHGSat images, shown at a contrast-enhancing narrower color scale of 0–0.2 ppm instead of this study's standard 2 ppm, show that for the 8 November retrieval of the 0.401 [0.399, 0.404] t h−1 release, there are pixel clusters with enhancements of comparable magnitude outside of the release area. However, these enhancements are concentrated along ground features such as a water body southwest of the site and a highway north of the site, confirmed in Google Maps imagery and WorldView-3 optical images in the Supplement (Sect. S4). As a result, automated or manual intercomparison of the spatial overlap of apparent methane enhancements and ground features visible in optical imagery could plausibly help differentiate between such signal artifacts and true emissions. In some cases, it may be possible to use measurements in which there is no evidence of a methane emission, e.g., the 16 November measurement (in which GHGSat correctly determined the absence of methane in a single-blind manner), to gain additional information on ambiguous cases. Artifacts such as the water feature may consistently appear across retrievals, which could suggest that they are not true methane enhancements. Furthermore, GHGSat flagged the water body in both retrievals as a potential artifact, indicating that it would likely have been possible to correctly identify only the true methane emission in the 8 November scene even without a reference image with no methane.
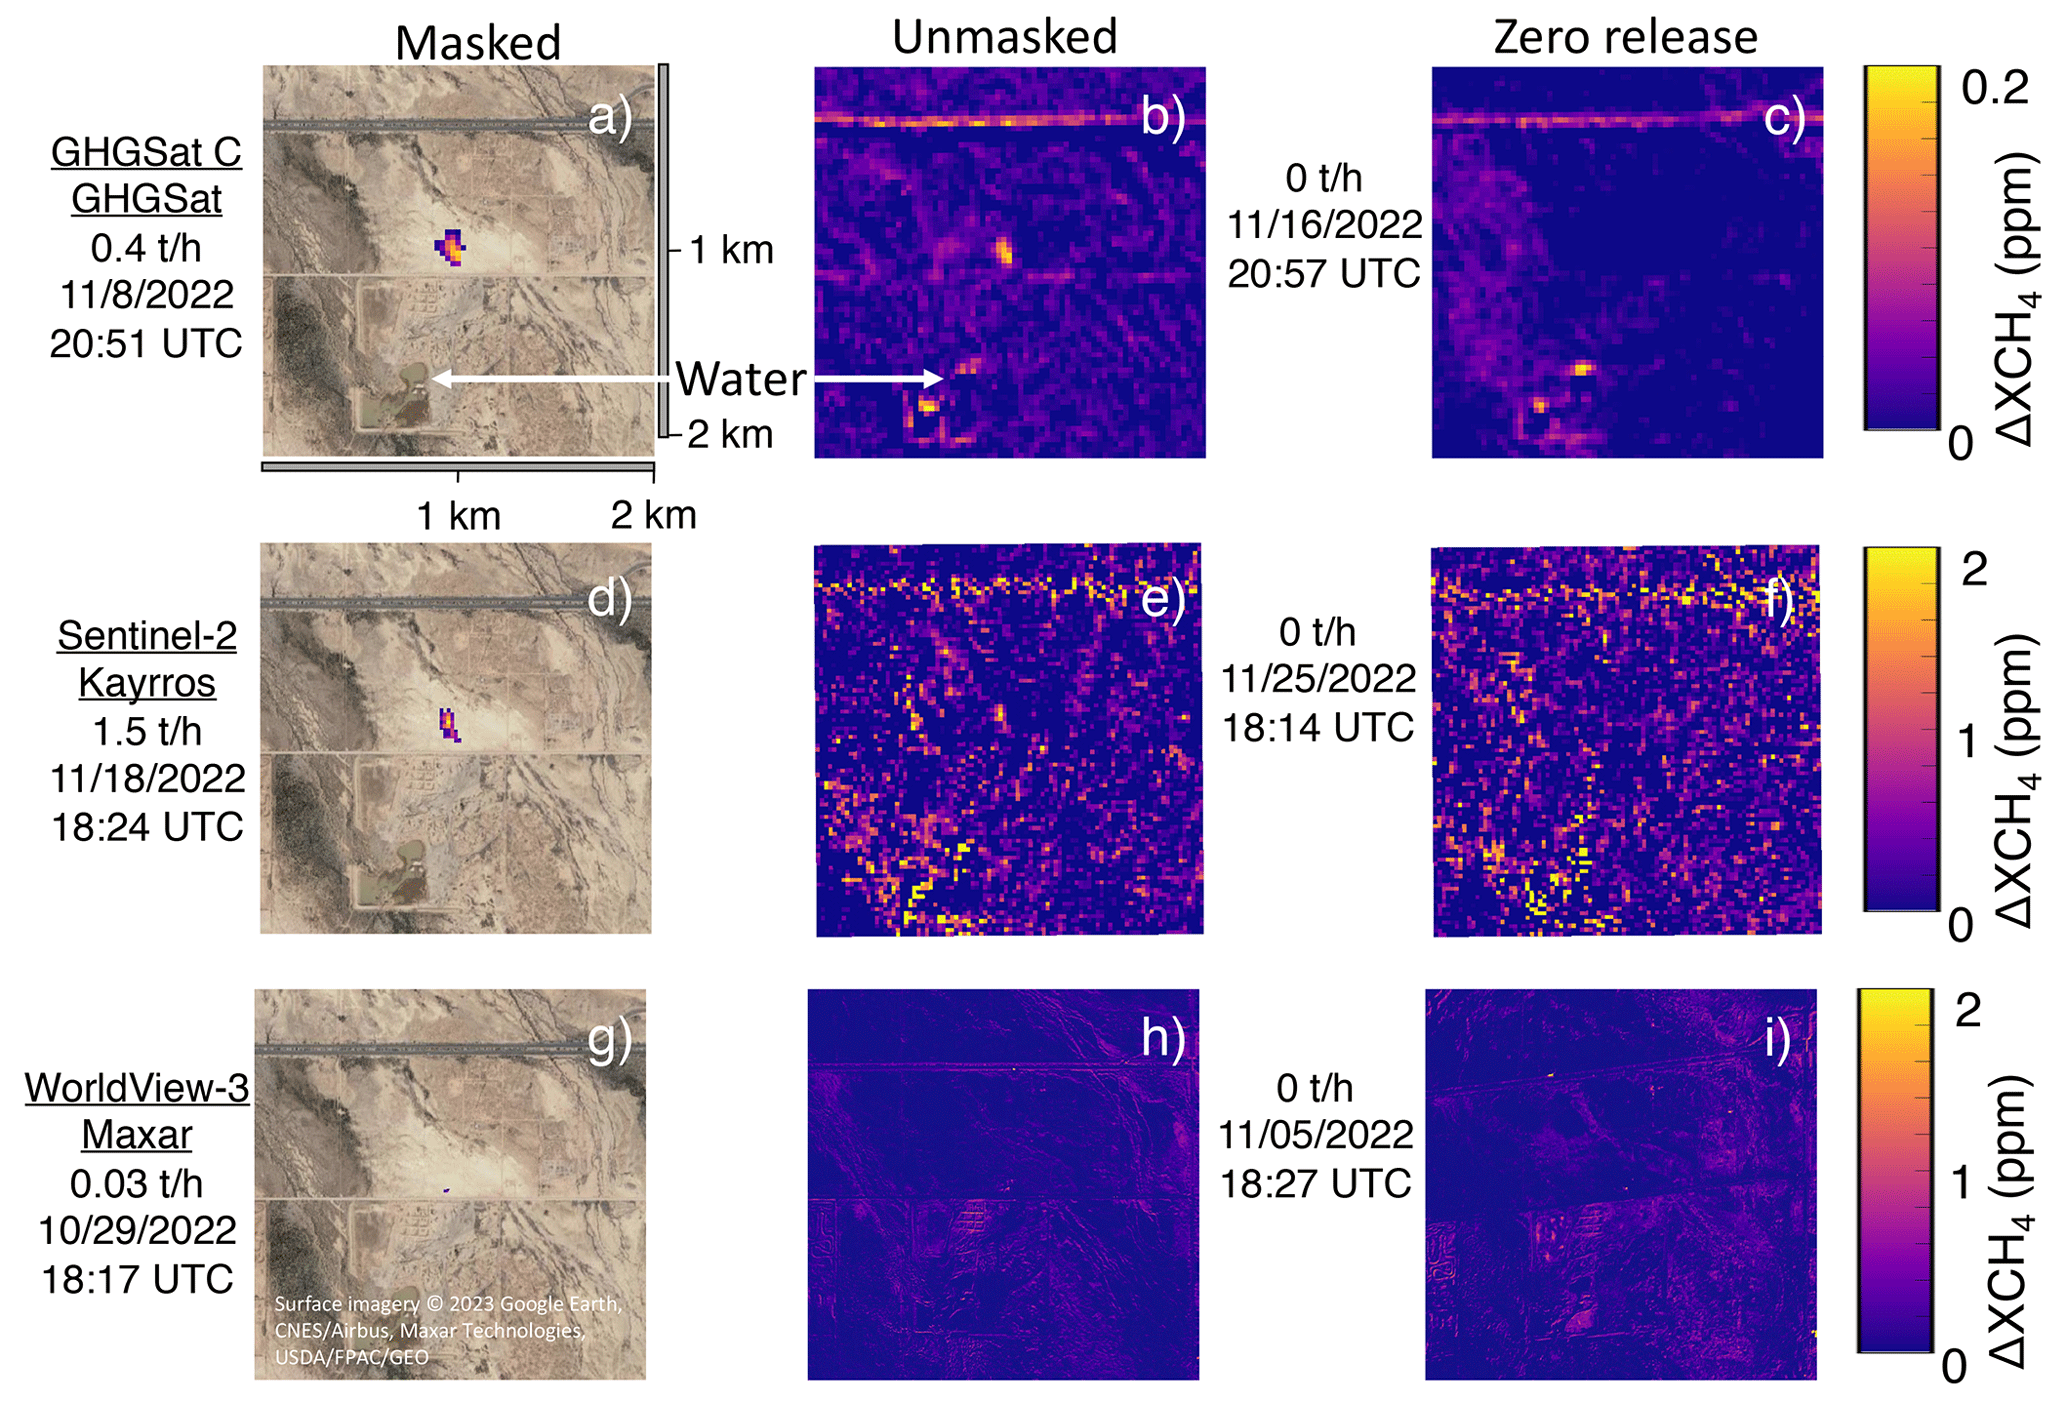
Figure 6Masked and unmasked retrievals for selected emissions. In each case, the unmasked retrieval in the middle column appears to contain artifacts of similar intensity and shape to the masked emission. However, the emission may be more distinguishable from artifacts after intercomparison with ground features revealed through optical imagery, e.g., the water body southwest of the release site, and intercomparison with a reference day with zero emissions, as in the right column. Note that the GHGSat retrievals use a higher-contrast scale of 0–0.2 ppm. See the Supplement (Sect. S4) for GHGSat images using the standard 0–2 ppm scale applied for most retrieval images in this study. Cloud-free surface imagery © 2023 Google Earth, CNES/Airbus, Maxar Technologies, USDA/FPAC/GEO.
Sentinel-2 imagery is significantly noisier than most other tested satellites. The 18 November Kayrros retrieval in Fig. 6 shows noticeable enhancements, comparable in intensity to the true emission, along the water feature and the highway, as well as northwest of the release site. In such a noise environment, knowledge of the emission location and access to images known not to contain emissions, such as in panel (f), may assist in correct identification of the true emission. See the Supplement (Sect. S4) for all masked and unmasked retrieval images from all satellites.
Maxar correctly detected emissions as small as 0.0332 [0.0328, 0.0336] t h−1 using their WorldView-3 satellite on 29 October. Interestingly, their retrieval algorithm does not appear to introduce high-concentration artifacts over the water body (although that is not the case for all teams analyzing WorldView-3 data, as shown in the Supplement, Sect. S4). The full retrieval image for the 29 October retrieval shows concentration enhancement artifacts of comparable magnitude to the correctly detected emission at several points in the image. However, these artifacts are largely conformal with surface features visible in optical imagery.
In addition to the known location, Maxar tasked its WorldView-3 satellite without notice to the Stanford team on 24 November, a holiday in the United States. These data were shared with all teams, but Maxar did not submit an unmasked image for the 24 November retrieval, although they did for the zero-emission 5 November retrieval shown in panel (i). As a result, Maxar and all other participating teams were able to compare satellite data from active testing days with data that they knew very likely did not contain methane enhancements. As a result, these teams had information in addition to the known release location that would not necessarily be available in the field. As a result, we cannot definitively conclude from this study whether Maxar or other teams would successfully identify emissions as small as 0.0332 [0.0328, 0.0336] t h−1 in the field. Future testing, likely with multiple potential source locations, is needed to more rigorously assess field-realistic detection limits of all satellites tested in this study.
3.4 The role of clouds
Because water vapor is highly absorptive in the methane-active infrared frequencies targeted by all nine methane-sensing satellites tested in this study, cloud cover can impede or prevent valid satellite-based methane measurements. Although our Arizona test site was selected in part due to its arid, relatively low-cloud climate, periodic cloud cover occurred to varying degrees throughout the testing period.
The treatment of clouds varied across teams, with some filtering images due to cloud cover more aggressively than others. LARS filtered the 22 November WorldView-3 retrieval shown in Fig. 7a, noting that “the image is cloudy but we see some enhancement.” Kayrros and Maxar correctly detected the 0.433 [0.430, 0.436] t h−1 emission for the same measurement, while NJU reported a non-detection.
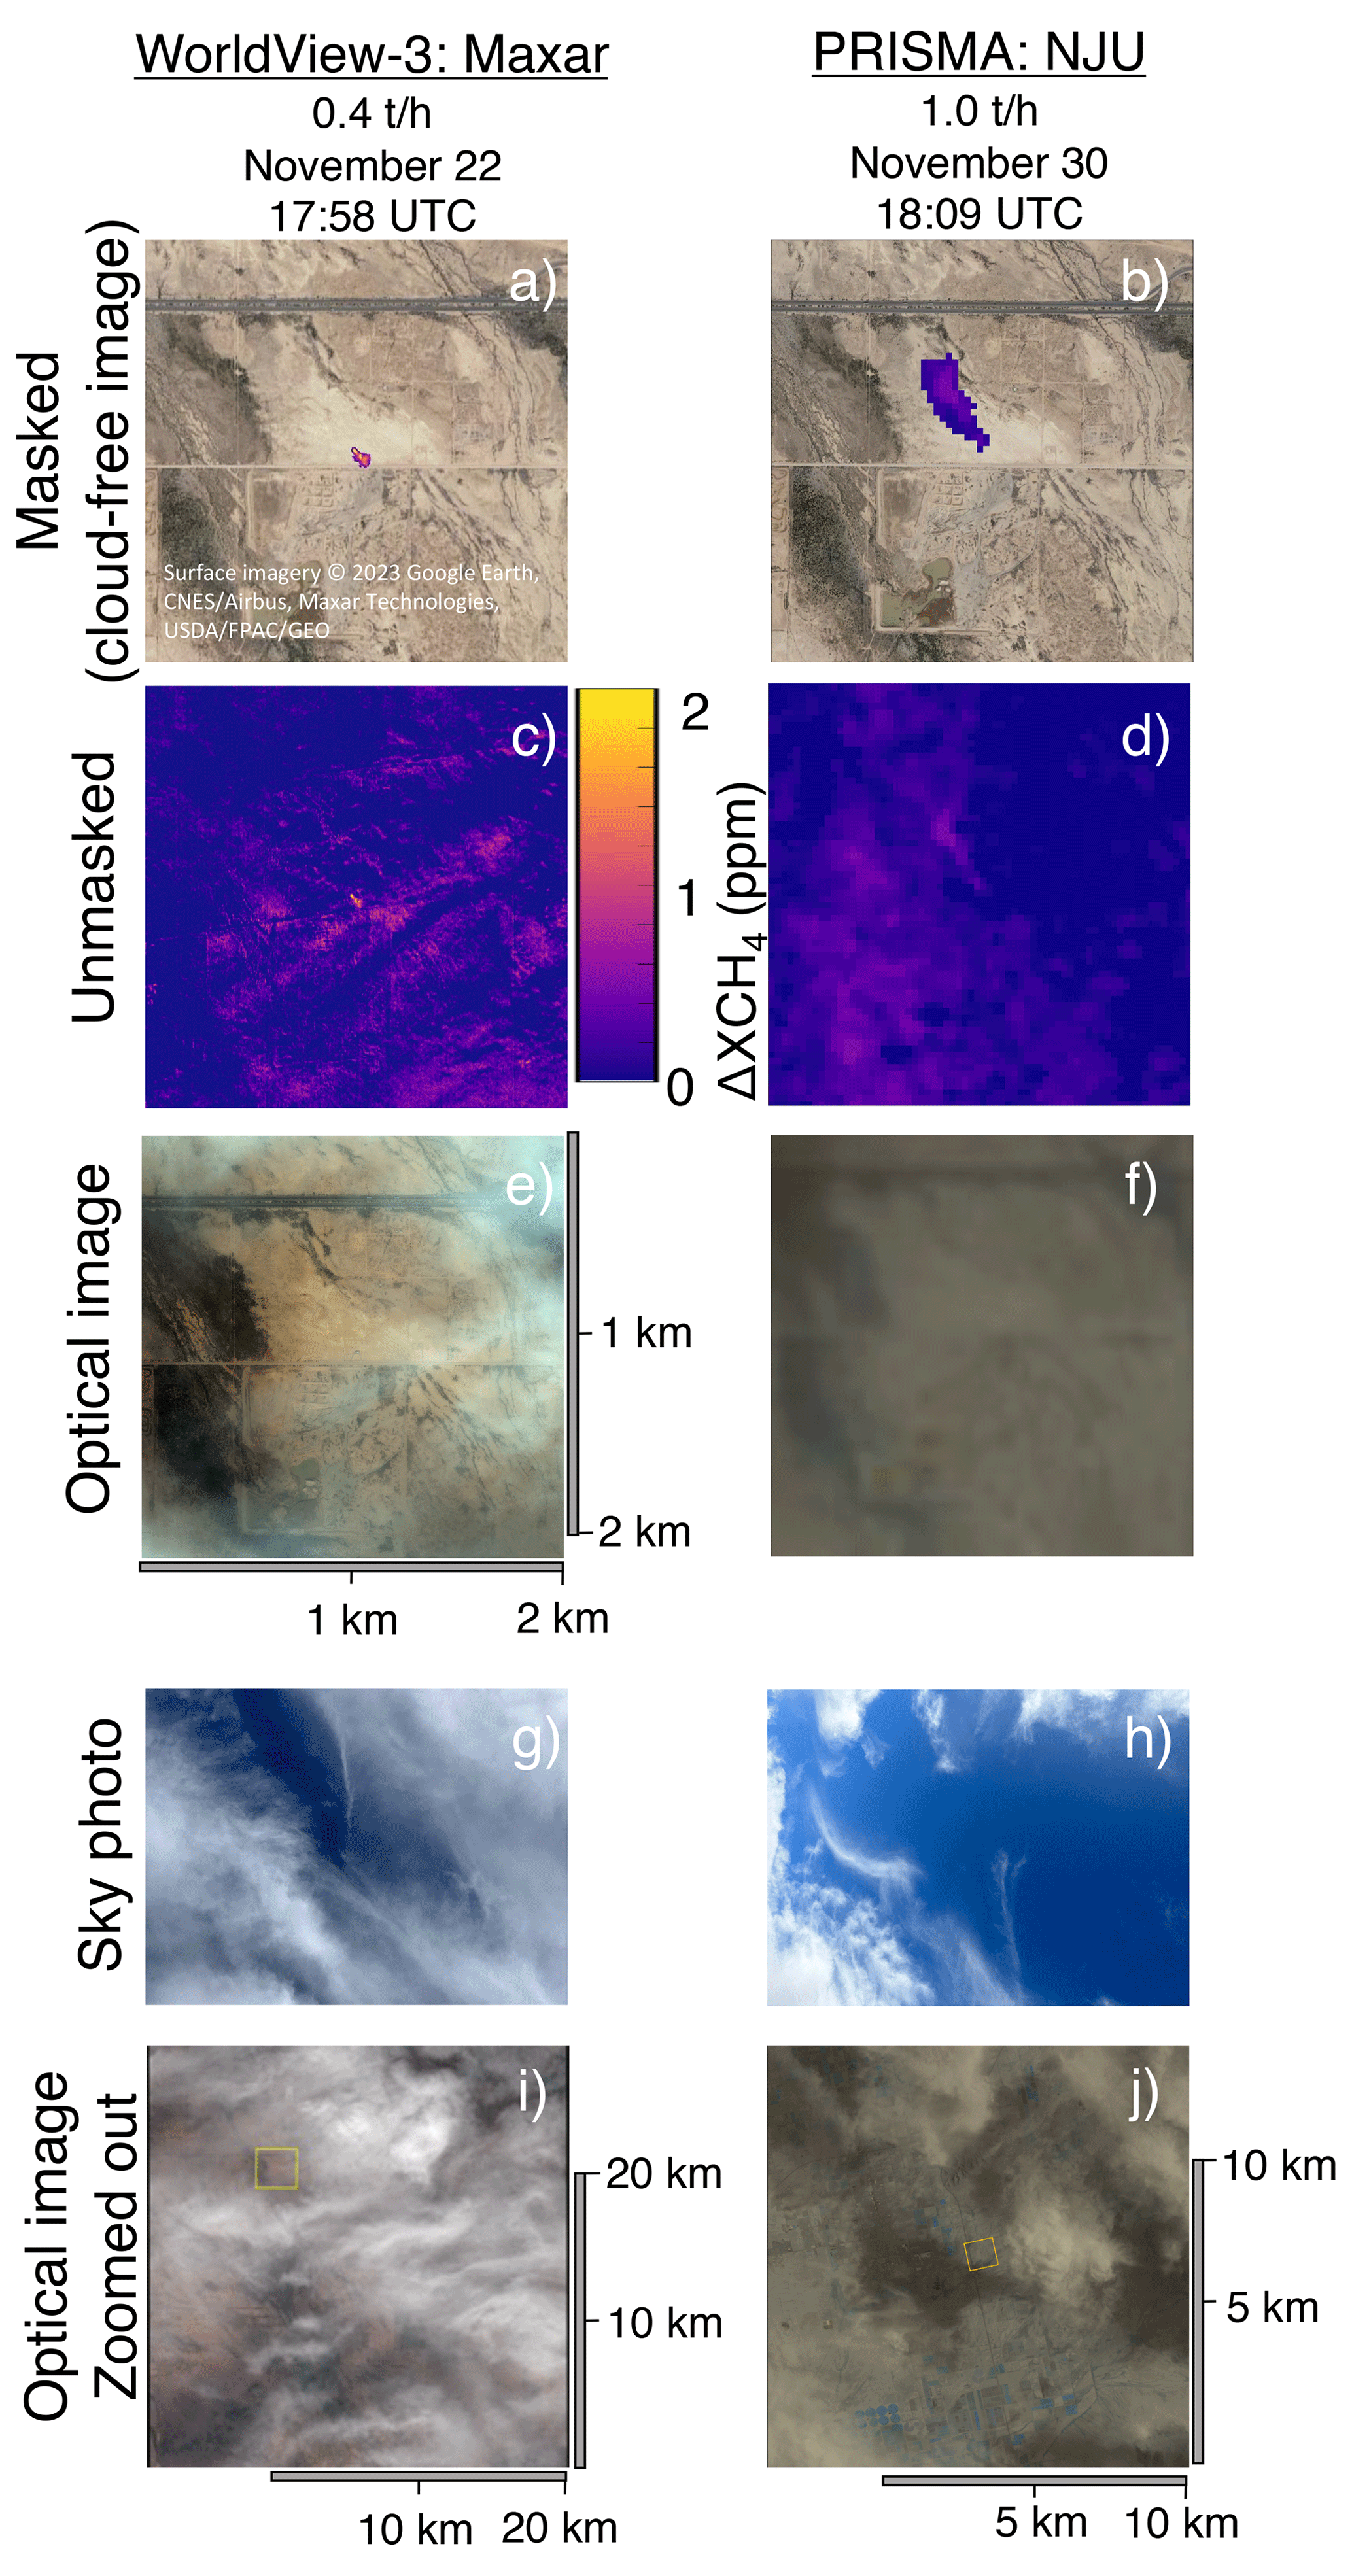
Figure 7Cloudy days with successful methane detections. Panels (a) and (b) show masked methane emissions from WorldView-3 and PRISMA above a cloud-free standard background © 2023 Google Earth, CNES/Airbus, Maxar Technologies, USDA/FPAC/GEO. Panels (c) and (d) show corresponding unmasked images. Panels (e) and (f) show optical images of the same 2×2 km scene collected by each satellite. Panels (g) and (h) show photographs of the sky taken by Stanford researchers on smartphones at the time of each overpass. Panels (i) and (j) show zoomed-out versions of the optical images shown in (e) and (f), with different length scales than the other panels.
This highlights the fact that accurately interpreting the results of field measurements from each of these teams requires an understanding of both detection performance and data filtering processes as a function of cloud cover.
Stanford researchers took photographs of the sky coincident with most satellite overpasses to document cloud cover, shown in full in the Supplement (Sect. S4). The photograph for the 22 November WorldView-3 overpass (Fig. 7g) appears to show significant, thick cloud cover. However, analysis of optical WorldView-3 imagery from this measurement (Fig. 7e) shows that the area immediately above the test site was relatively cloud-free even though the broader area was experiencing significant cloud cover, as shown in Fig. 7i.
Analysis of the 30 November PRISMA measurement, shown in the second column of Fig. 7, adds further nuance to the question of cloud cover. The sky photograph in Fig. 7h shows the presence of thin clouds. However, the optical image collected by PRISMA in Fig. 7f shows no clouds within the 2×2 km square surrounding the release site. The photographed clouds are only visible in the larger 14×14 km image in Fig. 7j, which demonstrates that clouds are too far away from the release site to interfere with the 0.98 [0.88, 1.08] t h−1 methane plume, which was correctly detected by LARS, NJU, and Maxar.
These two cases demonstrate that only limited information regarding cloud cover can be determined from single-frame sky photographs taken from the ground. This is particularly true without clear orientation information, which is not available for the smartphone-based photographs used in this study.
Figure 8 shows sky photographs of all dates with valid or operator-filtered GHGSat measurements. Both days with valid measurements, one true positive and one true negative, were essentially cloudless, as shown in Fig. 8d–e. In addition, GHGSat filtered three retrievals due to clouds. Of the three days filtered due to cloud cover, one was fully overcast (Fig. 8c), while two had thin clouds, as shown in Fig. 8a–b and also noted in the GHGSat report for those days. As demonstrated above, it is difficult to determine from these sky photographs alone where these clouds were in relation to the release site.
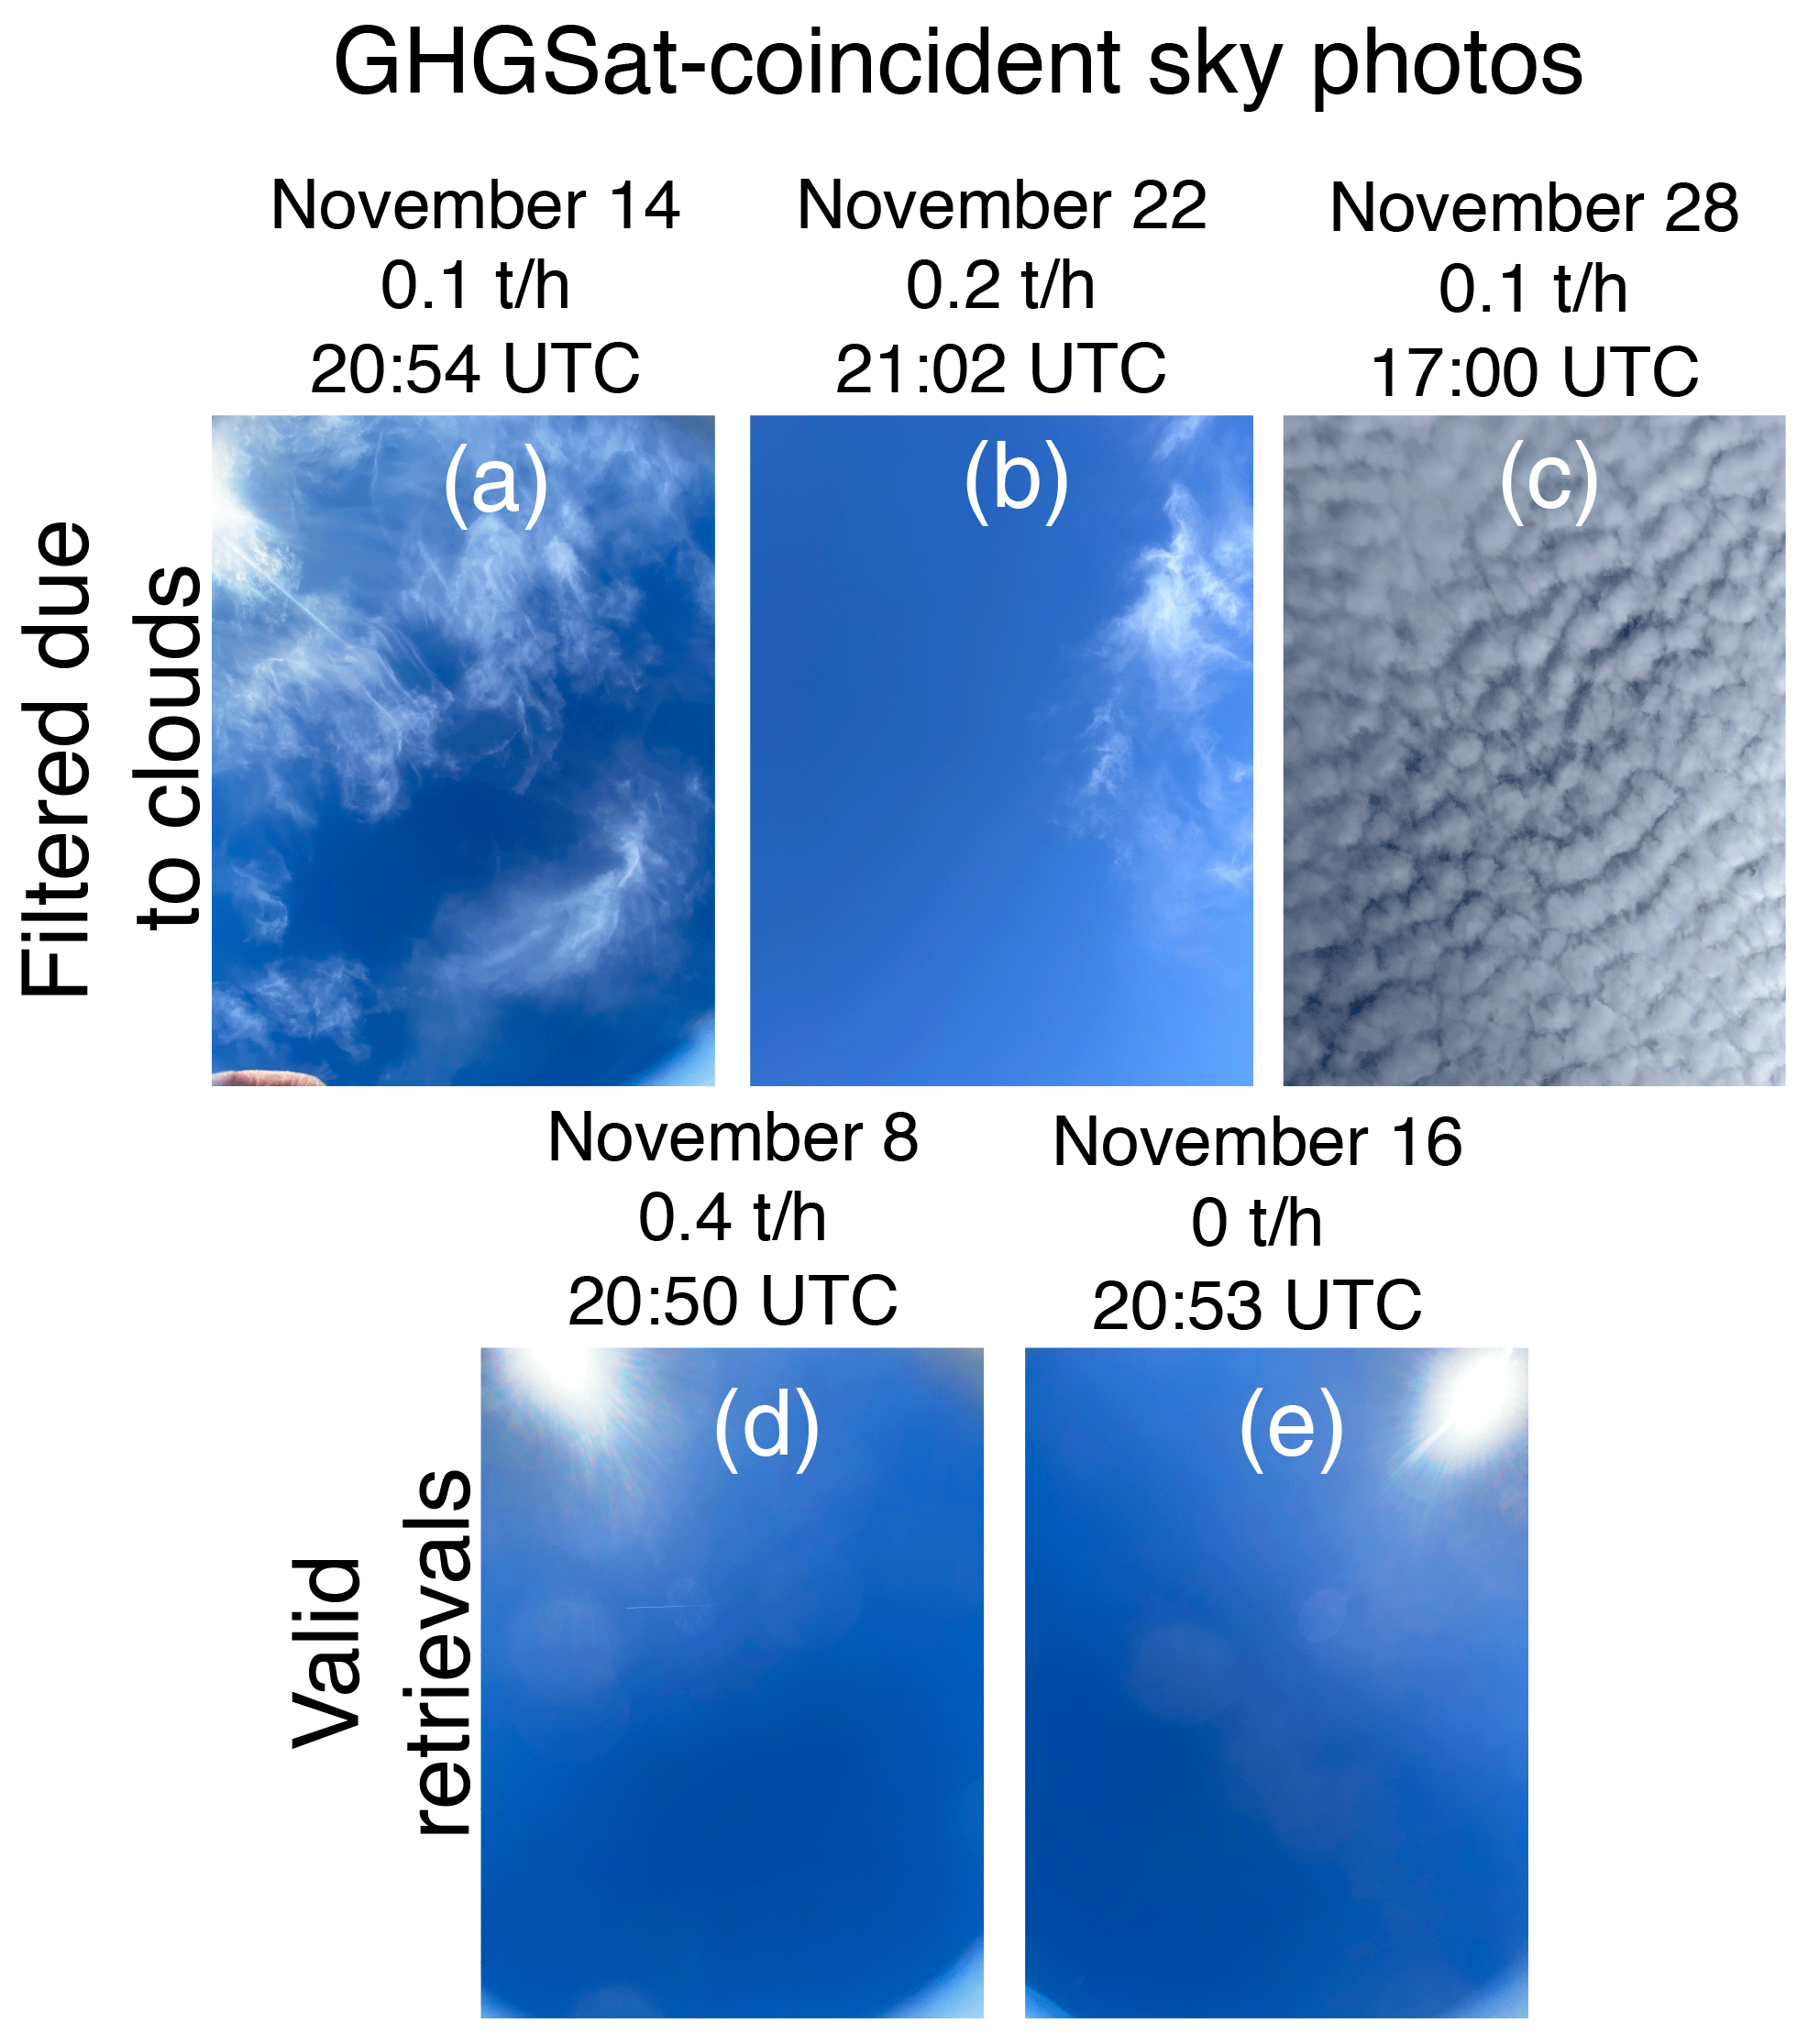
Figure 8Ground-perspective sky photos for GHGSat-C measurements. Panels (a)–(c) correspond to measurements filtered due to cloud cover. Panels (d) and (e) correspond to valid retrievals, including one true positive detection and one true negative non-detection. GHGSat-C satellites do not collect optical imagery, making it difficult to directly compare ground-perspective photographs with satellite-perspective optical imagery.
GHGSat did not submit unmasked retrieval images for operator-filtered measurements (these images were requested from all teams but were not required as a condition of participation in this test). Furthermore, GHGSat does not collect optical imagery in visible frequencies, so none could be submitted. As a result, we can draw only limited conclusions about the role of cloud cover in GHGSat's ability to conduct valid measurements with the GHGSat-C satellite model.
Future satellite-focused controlled methane release tests should further investigate the role of cloud cover. This should include conducting testing in cloudier locations. In addition, sky photographs should be replaced or supplemented by passively collected time series of panoramic, georeferenced sky time series, e.g., using a fisheye camera, as used in solar forecasting systems (Sun et al., 2018). This, together with optical images collected by satellites (when available), will allow a more systematic evaluation of the capabilities of the tested systems as a function of cloud cover. Such analysis should include assessment of the effect of clouds on detection sensitivity and quantification performance, as well as their role in preventing collection of valid measurements. These cloud-informed performance findings will be indispensable in regional analysis of satellite-based methane remote sensing data, including its incorporation into emissions inventories.
This work demonstrates that all tested satellites are capable of detecting and quantifying methane emissions. All eight satellites given the opportunity to detect methane emissions did so, with similar overall quantification accuracy, in percent terms, to aircraft-based methane-sensing systems. This highlights the large suite of satellite-based tools available to detect and quantify methane point sources across the globe.
Detection limits appear to improve with smaller swath width and pixel size, as well as with higher spectral resolution. Global-coverage satellites such as LandSat 8/9 and Sentinel-2, with swaths of 185 and 290 km, respectively, and spectral resolution 20–650 times coarser than the hyperspectral instruments (EnMAP, PRISMA, GF5, ZY1, HJ2B, and GHGSat), have higher detection limits. See the Supplement (Sect. S2) for additional discussion of spectral resolution. Our results are consistent with Gorroño et al. (2023), whose simulation-based approach suggests that such instruments have a best-case minimum detection limit of roughly 1 t h−1. Targeted satellites with swaths of 30–60 km, including EnMAP, GF5, PRISMA, and ZY1 (EnMAP, 2023; Liu et al., 2019; OHBI, 2022; Song et al., 2022), all reliably detected emissions of ∼ 1 t h−1. Of these, only PRISMA has had the opportunity to be tested with emission fluxes below 1 t h−1, correctly detecting 0.413 [0.410, 0.417] t h−1, the smallest emission given to PRISMA. GHGSat correctly detected 0.401 [0.399, 0.403] t h−1, with quantification accuracy within ±20 %, using their GHGSat-C series satellite, with a swath width of 12 km. Estimates for smaller emission sizes were filtered due to clouds, but in previous testing GHGSat successfully detected a 0.197 [0.187, 0.208] t h−1 emission and quantified it with similar accuracy, suggesting that the system may be capable of detecting emissions even smaller than 200 kg h−1.
Maxar successfully detected emissions as low as 0.0332 [0.0328, 0.0336] t h−1 using the WorldView-3 satellite, with swath width 13.1 km. Two teams successfully detected emissions below 0.1 t h−1 using WorldView-3, while two teams applied more conservative criteria and detected only emissions above 0.5 t h−1. Although Maxar has a coarser spectral resolution than hyperspectral instruments, its very high spatial resolution enables heightened sensitivity.
In the high-emission New Mexico Permian basin oil and natural gas system, using 2019 emission levels, a comprehensive measurement campaign with a constellation of satellites detecting all emissions above 1 t h−1 would find 20 % of emissions from oil and gas well sites, rising to 62 % for a satellite detecting emissions above 0.2 t h−1 and 83 % above 0.03 t h−1 (Sherwin et al., 2023). These fractions are upper-bound estimates because near-real-time comprehensive coverage would be challenging for satellite systems and because the underlying emission size distribution estimate may be conservative for emissions below roughly 0.05 t h−1 (Sherwin et al., 2024). In lower-emitting basins such as the Denver–Julesburg, each of these systems would detect a much smaller fraction of total emissions, highlighting the need for a variety of technology approaches tailored to regional system characteristics (Sherwin et al., 2024).
Note that the detection results presented in this paper reflect system performance with a known source location under favorable desert climate conditions. These results may not translate to field performance in different environments and with less foreknowledge about the location of possible sources.
Unmasked methane retrieval fields, submitted by all teams, suggest that achievable detection limits may be higher in practice for some satellites. In some cases, these images contain background artifacts with estimated methane enhancements comparable in magnitude and qualitatively similar in shape to the detected methane plumes. However, in many of these retrieval fields, particularly for larger emissions, the true methane plume is unambiguous. It is noteworthy that some teams correctly flagged likely background artifacts in blinded submissions, but such georeferenced quality flagging was not required of all participating teams, although doing so may be advisable in future tests.
The role of surface features, such as water bodies, in creating apparent methane enhancements should be explored further. For example, the retrieval field for the 0.401 [0.399, 0.403] t h−1 GHGSat measurement shows an apparent methane enhancement over a water body that is similar in magnitude to the detected plume. However, if this is a known characteristic of the algorithm, then such artifacts could be automatically or manually filtered out, leaving only the clear methane plume at the release site. The water body appears as a flagged region in all data reported by GHGSat, indicating that their system is capable of identifying potential confounding factors such as water bodies and differentiating any resulting artifacts from true methane emissions.
Clouds add several levels of complexity to satellite-based methane sensing. The water vapor in clouds interferes with the frequencies all tested satellites use to identify methane enhancements. Heavy cloud cover essentially prevents valid satellite-based methane sensing. This test demonstrates that it is possible in some circumstances to detect and quantify methane emissions even in the presence of nearby patchy or thin clouds. However, it is unclear in some cases whether these detected emissions would have been distinguishable from background noise, e.g., artifacts caused by clouds or highly reflective and/or absorptive surface features, in the absence of a known source location and reasonable anticipation of the presence of an emission due to an ongoing test.
Different teams employed different filtering criteria. GHGSat excluded all GHGSat-C measurements with cloud cover. Maxar and Kayrros used WorldView-3 to successfully detected a 0.433 [0.430, 0.436] t h−1 emission on a cloudy day on 22 November, while LARS filtered the measurement due to clouds and NJU reported a non-detection.
Future testing should characterize the cloud conditions under which valid point-source methane measurements can and cannot be conducted with each satellite-based system. In addition, future work should characterize the effect of partial cloud cover on detection and quantification performance. Understanding these two factors will be critical when interpreting the results of large-scale satellite-based methane measurement campaigns, which will inevitably encounter interference from clouds. Cloud cover varies widely across oil- and gas-producing regions, with limited clouds in arid areas such as the Permian basin in Texas and New Mexico and significant cloud cover in more temperate producing regions such as the Appalachian basin in the eastern United States and the Williston basin in the midwestern United States (NASA, 2023).
It is noteworthy that even under cloud-free conditions, a targeted satellite overpass is not guaranteed to produce valid data. Errors in tasking software, as well as onboard hardware upsets, can prevent valid data collection. The incidence of both in this paper may not be representative of field performance for the tested technologies. Additional data collection, ideally field data, would be needed to accurately quantify the incidence of data collection failure, and further location-specific analysis of cloud trends would be needed to understand the impact of cloud cover on satellite data collection capabilities in a specific area.
Wind speed remains a major driver of uncertainty in satellite-based methane point-source quantification. Moving from wind reanalysis data to in situ wind measurements substantially reduces scatter around the line of best fit, as was also the case in other work from the same group (Sherwin et al., 2023). In addition, in situ wind measurements show considerable temporal variability in wind speed and direction over the multi-minute timescales most relevant to plume formation.
In the field, winds are generally only available from reanalysis data, which capture temporal, spatial, and directional variability with much lower fidelity than on-the-ground wind measurements. Advances in the spatial and temporal fidelity of wind reanalysis products, as well as their accuracy, could help improve methane remote sensing. In addition, it may be possible to entirely eliminate reliance on wind speed, e.g., by inferring emission rate information solely from plume shapes as in Jongaramrungruang et al. (2022).
It is important to note that conducting this test did require the release of considerable amounts of methane into the atmosphere. We estimate total emissions from the satellite testing discussed in this paper at 7.7 t(CH4), which is discussed further in the Supplement (Sect. S1.5). However, this pales in comparison with anthropogenic emissions occurring across the globe. Lauvaux et al. (2022) identify over 1000 emission sources across the world emitting at least 7.7 t(CH4) every hour, in some cases over 50 times as much every hour. If this work assists in accelerating mitigation of even one of these emissions by even a single hour, e.g., by ensuring that key decision-makers view satellite-based methane detection and quantification as reliable, we will have broken even from a methane emissions perspective.
The findings presented here demonstrate that at least eight distinct satellite systems from three continents are capable of detecting methane point sources of 1.5 t h−1 or less. Furthermore, this study more systematically probes the lower detection limits of these systems, with two teams detecting emissions below 0.1 t h−1, which is the first time to our knowledge that such performance has been demonstrated in a single-blind test of satellite-based methane-sensing systems.
These satellites can play an important role in reducing methane emissions through existing regulatory pathways, both in the United States and internationally. The US Environmental Protection Agency's proposed update to rules governing methane emissions from oil and natural gas production includes a super-emitter response program, in which approved third-party data providers can flag identified emissions above 0.1 t h−1, obliging operators to investigate further and, if necessary, take action to halt any further emissions (EPA, 2022). A proposed update to the EPA Greenhouse Gas Reporting Program also includes a new category of “other large release” for inclusion in company emissions reports (EPA, 2023). The Methane Alert and Response System, part of the United Nations' International Methane Emissions Observatory, uses vetted satellite data to notify governments, and in some cases operators, of large emissions detected by satellite, with the aim of mitigating these emissions (IMEO, 2023). The eight satellite systems tested with at least one nonzero emission in this study can provide high-quality data to each of these programs.
In coming years, the Carbon Mapper and MethaneSAT systems will launch, alongside additional satellites in some of the constellations tested here (Jacob et al., 2022). The airplane-mounted precursors to both the Carbon Mapper and MethaneSAT systems have conducted substantial single-blind testing of their point-source detection and quantification capabilities (Rutherford et al., 2023; Chulakadabba et al., 2023; El Abbadi et al., 2023), but the satellites will require additional tests. Furthermore, the NASA Earth Surface Mineral Dust Source Investigation (EMIT) system, which launched shortly before our testing began (Wang and Lee, 2022), has already reported detecting methane emissions in the field and should be tested, along with the HJ2 system, in future single-blind controlled methane releases.
The tools exist for multi-lateral global methane monitoring efforts, with satellites from multiple countries and continents able to independently assess emissions from regions of interest. The single-blind test conducted here is a step toward ensuring that stakeholders across the world have confidence in the methane emissions these satellite systems find at oil and gas facilities, landfills, coal mines, and other emitting infrastructure. This will help satellites achieve their potential to not only detect and quantify large methane emissions, but also to inspire meaningful action to reduce emissions of this powerful greenhouse gas.
| ADED | Advancing Development of Emissions Detection |
| ASI | Italian Space Agency |
| CNG | Compressed natural gas |
| EMIT | Earth Surface Mineral Dust Source Investigation |
| EnMAP | Environmental Mapping and Analysis Program |
| GF5 | Gaofen 5 |
| GSC | GHGSat-C (satellite) |
| HJ2 | Huanjing 2 |
| IME | Integrated mass enhancement |
| kg h−1 | Kilograms per hour |
| LARS | Land and Atmosphere Remote Sensing |
| LS | LandSat |
| METEC | Methane Emissions Technology Evaluation Center |
| NASA | National Aeronautics and Space Administration |
| NJU | Nanjing University |
| NOAA | National Oceanographic and Atmospheric Administration |
| OHB | Orbitale Hochtechnologie Bremen |
| PRISMA | PRecursore IperSpettrale della Missione Applicativa |
| UPV | Universitat Politècnica de València |
| USGS | United States Geological Survey |
| SRON | Stichting Ruimte Onderzoek Nederland |
| SWIR | Shortwave infrared |
| TROPOMI | TROPOspheric Monitoring Instrument |
| t h−1 | Metric tons per hour |
| VNIR | Visible to near-infrared |
| WAF-P | Wide-angle Fabry–Pérot |
| WV3 | WorldView-3 |
| ZY1 | Ziyuan 1 |
All data and code required to reproduce the figures and analysis in this paper are available at https://doi.org/10.5281/zenodo.10149991 (El Abbadi and esherwin, 2023). Underlying spectral imagery will not be made directly available through this study, but for many satellites tested in this study these spectral data can be acquired either for free or for purchase for via platforms discussed in the Supplement (Sect. S2).
The supplement related to this article is available online at: https://doi.org/10.5194/amt-17-765-2024-supplement.
Conceptualization – EDS and ARB. Methods – EDS, SHE, YC, JSR, and ARB. Software – EDS, PMB, ZC, and SHE. Validation – EDS. Formal analysis – EDS, PMB, ZZ, and SHE. Investigation – EDS and SHE. Resources – ARB. Data curation – EDS, PMB, YC, ZZ, ZC, JSR, and SHE. Writing (original draft) – EDS. Writing (review and editing) – all authors. Supervision – EDS and ARB. Project administration – EDS, SEA, and ARB. Funding acquisition – EDS, SHE, and ARB.
Adam R. Brandt serves on the Science and Measurement advisory committee of Carbon Mapper, which plans to launch a methane-sensing satellite. Yuanlei Chen and Zhan Zhang previously worked as interns at Carbon Mapper. The remaining authors have no competing interests to declare.
Publisher's note: Copernicus Publications remains neutral with regard to jurisdictional claims made in the text, published maps, institutional affiliations, or any other geographical representation in this paper. While Copernicus Publications makes every effort to include appropriate place names, the final responsibility lies with the authors.
We acknowledge Carlo de Franchis, Clément Giron, and Alexis Groshenry of Kayrros as well as Zani Mouton, William Kingwill, and Robert Huppertz from Orbio Earth for their participation in this test. We further acknowledge Ángel Esparza, Liam Clark-Squire, Jean-Francois Gauthier, Marianne Girard, Dylan Jervis, Ryan Mattson, Jason McKeever, and Ashley Newhook of GHGSat as well as Javier Gorroño Viñegla, Javier Roger Juan, and Luís Guanter Palomar of LARS, along with Chen Huilin, Li Fei, and Zhang Yongguang of NJU and Andreas Hayden, Julie Jonik, and Joseph Christy of Maxar for participating in the test and for coordinating tasking and data sharing from key satellites. We acknowledge the German Aerospace Center and the Italian Space Agency for tasking the EnMAP and PRISMA satellites, respectively. Rawhide Leasing (Mike Brandon, Walt Godsil, S. M., and Merritt Norton) and Volta Fabrication (Dana Walker) provided indispensable operational, logistical, and planning support for the experiment.
This research has been supported by the International Methane Emissions Observatory initiative of the United Nations Environment Programme, the Environmental Defense Fund, the Global Methane Hub, and the Stanford Natural Gas Initiative, an industry consortium that supports independent research at Stanford University.
This paper was edited by Huilin Chen and reviewed by three anonymous referees.
Bell, C., Rutherford, J., Brandt, A., Sherwin, E., Vaughn, T., and Zimmerle, D.: Single-blind determination of methane detection limits and quantification accuracy using aircraft-based LiDAR, Elementa, 10, 80, https://doi.org/10.1525/elementa.2022.00080, 2022.
Bell, C., Ilonze, C., Duggan, A., and Zimmerle, D.: Performance of Continuous Emission Monitoring Solutions under a Single-Blind Controlled Testing Protocol, Environ. Sci. Technol., 57, 5794–5805, https://doi.org/10.1021/acs.est.2c09235, 2023.
Bell, C. S., Vaughn, T. L., Zimmerle, D., Herndon, S. C., Yacovitch, T. I., Heath, G. A., Pétron, G., Edie, R., Field, R. A., Murphy, S. M., Robertson, A. M., and Soltis, J.: Comparison of methane emission estimates from multiple measurement techniques at natural gas production pads, Elementa, 5, 79, https://doi.org/10.1525/elementa.266, 2017.
Bell, C. S., Vaughn, T., and Zimmerle, D.: Evaluation of next generation emission measurement technologies under repeatable test protocols, Elementa, 8, 32, https://doi.org/10.1525/elementa.426, 2020.
Chen, Y., Sherwin, E. D., Berman, E. S. F., Jones, B. B., Gordon, M. P., Wetherley, E. B., Kort, E. A., and Brandt, A. R.: Quantifying Regional Methane Emissions in the New Mexico Permian Basin with a Comprehensive Aerial Survey, Environ. Sci. Technol., 56, 4317–4323, https://doi.org/10.1021/acs.est.1c06458, 2022.
Chulakadabba, A., Sargent, M., Lauvaux, T., Benmergui, J. S., Franklin, J. E., Chan Miller, C., Wilzewski, J. S., Roche, S., Conway, E., Souri, A. H., Sun, K., Luo, B., Hawthrone, J., Samra, J., Daube, B. C., Liu, X., Chance, K., Li, Y., Gautam, R., Omara, M., Rutherford, J. S., Sherwin, E. D., Brandt, A., and Wofsy, S. C.: Methane point source quantification using MethaneAIR: a new airborne imaging spectrometer, Atmos. Meas. Tech., 16, 5771–5785, https://doi.org/10.5194/amt-16-5771-2023, 2023.
Cusworth, D. H., Duren, R. M., Thorpe, A. K., Olson-Duvall, W., Heckler, J., Chapman, J. W., Eastwood, M. L., Helmlinger, M. C., Green, R. O., Asner, G. P., Dennison, P. E., and Miller, C. E.: Intermittency of Large Methane Emitters in the Permian Basin, Environ. Sci. Tech. Let., 8, 567–573, https://doi.org/10.1021/acs.estlett.1c00173, 2021.
Cusworth, D. H., Thorpe, A. K., Ayasse, A. K., Stepp, D., Heckler, J., Asner, G. P., Miller, C. E., Yadav, V., Chapman, J. W., Eastwood, M. L., Green, R. O., Hmiel, B., Lyon, D. R., and Duren, R. M.: Strong methane point sources contribute a disproportionate fraction of total emissions across multiple basins in the United States, P. Natl. Acad. Sci. USA, 119, e2202338119, https://doi.org/10.1073/pnas.2202338119, 2022.
Duren, R. M., Thorpe, A. K., Foster, K. T., Rafiq, T., Hopkins, F. M., Yadav, V., Bue, B. D., Thompson, D. R., Conley, S., Colombi, N. K., Frankenberg, C., McCubbin, I. B., Eastwood, M. L., Falk, M., Herner, J. D., Croes, B. E., Green, R. O., and Miller, C. E.: California's methane super-emitters, Nature, 575, 180–184, https://doi.org/10.1038/s41586-019-1720-3, 2019.
El Abbadi, S. and esherwin: sahar-elabbadi/SU-Controlled-Releases-2022: First release (publish), Zenodo [code and data set], https://doi.org/10.5281/zenodo.10149992, 2023.
El Abbadi, S., Chen, Z., Burdeau, P., Rutherford, J., Chen, Y., Zhang, Z., Sherwin, E., and Brandt, A.: Comprehensive evaluation of aircraft-based methane sensing for greenhouse gas mitigation, Engineering, Earth Arxiv [preprint], https://doi.org/10.31223/X51D4C, 2023.
EnMAP: EnMAP: Mission, EnMAP, EnMAP, https://www.enmap.org/mission/ (last access: 24 May 2023), 2023.
EPA: Standards of Performance for New, Reconstructed, and Modified Sources and Emissions Guidelines for Existing Sources: Oil and Natural Gas Sector Climate Review, 40 CFR Part 60, 87, Docket Numbers: EPA-HQ-OAR-2021-0317, FRL-8510-04-OAR, https://www.federalregister.gov/documents/2022/12/06/2022-24675/standards-of-performance-for-new-reconstructed-and-modified-sources-and-emissions-guidelines-for Agency (last access: 30 March 2023), 2022.
EPA: Greenhouse Gas Reporting Rule: Revisions and Confidentiality Determinations for Petroleum and Natural Gas Systems, 40 CFR Part 98, 88, https://www.govinfo.gov/content/pkg/FR-2023-08-01/pdf/2023-14338.pdf (last access: 29 September 2023), 2023.
ESA: eoPortal: PRISMA (Hyperspectral), European Space Agency, Paris, France, https://www.eoportal.org/satellite-missions/prisma-hyperspectral#launch (last access: 29 September 2023), 2012.
ESA: Sentinel-2, European Space Agency, Paris, France, https://sentinel.esa.int/web/sentinel/missions/sentinel-2 (last access: 21 February 2022), 2021a.
ESA: Sentinel-5P, European Space Agency, Paris, France, https://sentinel.esa.int/web/sentinel/missions/sentinel-5p (last access: 22 March 2022), 2021b.
ESA: About GHGSat, European Space Agency, Paris, France, https://earth.esa.int/eogateway/missions/ghgsat (last access: 21 February 2022), 2022a.
ESA: Earth Online: Worldview-3, European Space Agency, Paris, France, https://earth.esa.int/eogateway/missions/worldview-3 (last access: 21 February 2022), 2022b.
GHGSat: Global leader in remote sensing of greenhouse gas, GHGSat, Montreal, Canada, https://www.ghgsat.com/en/who-we-are/ (last access: 10 June 2022), 2022.
Gorroño, J., Varon, D. J., Irakulis-Loitxate, I., and Guanter, L.: Understanding the potential of Sentinel-2 for monitoring methane point emissions, Atmos. Meas. Tech., 16, 89–107, https://doi.org/10.5194/amt-16-89-2023, 2023.
Guanter, L., Irakulis-Loitxate, I., Gorroño, J., Sánchez-García, E., Cusworth, D. H., Varon, D. J., Cogliati, S., and Colombo, R.: Mapping methane point emissions with the PRISMA spaceborne imaging spectrometer, Remote Sens. Environ., 265, 112671, https://doi.org/10.1016/j.rse.2021.112671, 2021.
Hayden, A. and Christy, J.: Maxar's WorldView-3 Enables Low-Concentration Methane Detection from Space, Earth Arxiv [preprint], https://doi.org/10.31223/X51T1C, 15 June 2023.
IMEO: Methane Alert and Response System (MARS), United Nations Environment Programme, International Methane Emissions Observatory, Paris, France, 2023.
Irakulis-Loitxate, I., Guanter, L., Liu, Y.-N., Varon, D. J., Maasakkers, J. D., Zhang, Y., Chulakadabba, A., Wofsy, S. C., Thorpe, A. K., Duren, R. M., Frankenberg, C., Lyon, D. R., Hmiel, B., Cusworth, D. H., Zhang, Y., Segl, K., Gorroño, J., Sánchez-García, E., Sulprizio, M. P., Cao, K., Zhu, H., Liang, J., Li, X., Aben, I., and Jacob, D. J.: Satellite-based survey of extreme methane emissions in the Permian basin, Sci. Adv., 7, eabf4507, https://doi.org/10.1126/sciadv.abf4507, 2021.
Irakulis-Loitxate, I., Gorroño, J., Zavala-Araiza, D., and Guanter, L.: Satellites Detect a Methane Ultra-emission Event from an Offshore Platform in the Gulf of Mexico, Environ. Sci. Tech. Let., 9, 520–525, https://doi.org/10.1021/acs.estlett.2c00225, 2022a.
Irakulis-Loitxate, I., Guanter, L., Maasakkers, J. D., Zavala-Araiza, D., and Aben, I.: Satellites Detect Abatable Super-Emissions in One of the World's Largest Methane Hotspot Regions, Environ. Sci. Technol., 56, 2143–2152, https://doi.org/10.1021/acs.est.1c04873, 2022b.
Jacob, D. J., Varon, D. J., Cusworth, D. H., Dennison, P. E., Frankenberg, C., Gautam, R., Guanter, L., Kelley, J., McKeever, J., Ott, L. E., Poulter, B., Qu, Z., Thorpe, A. K., Worden, J. R., and Duren, R. M.: Quantifying methane emissions from the global scale down to point sources using satellite observations of atmospheric methane, Atmos. Chem. Phys., 22, 9617–9646, https://doi.org/10.5194/acp-22-9617-2022, 2022.
Jervis, D., McKeever, J., Durak, B. O. A., Sloan, J. J., Gains, D., Varon, D. J., Ramier, A., Strupler, M., and Tarrant, E.: The GHGSat-D imaging spectrometer, Atmos. Meas. Tech., 14, 2127–2140, https://doi.org/10.5194/amt-14-2127-2021, 2021.
Jia, M., Li, F., Zhang, Y., Wu, M., Li, Y., Feng, S., Wang, H., Chen, H., Ju, W., Lin, J., Cai, J., Zhang, Y., and Jiang, F.: The Nord Stream pipeline gas leaks released approximately 220,000 tonnes of methane into the atmosphere, Environ. Sci. Ecotechnol., 12, 100210, https://doi.org/10.1016/j.ese.2022.100210, 2022.
Jongaramrungruang, S., Thorpe, A. K., Matheou, G., and Frankenberg, C.: MethaNet – An AI-driven approach to quantifying methane point-source emission from high-resolution 2-D plume imagery, Remote Sens. Environ., 269, 112809, https://doi.org/10.1016/j.rse.2021.112809, 2022.
Kayrros: A partner for today and the future, agile with technology and with a smarter approach to data, Kayrros, Paris, France, https://www.kayrros.com/who-are-we/ (last access: 10 June 2022), 2022.
Lauvaux, T., Giron, C., Mazzolini, M., d'Aspremont, A., Duren, R., Cusworth, D., Shindell, D., and Ciais, P.: Global Assessment of Oil and Gas Methane Ultra-Emitters, Science, 375, 557–561, https://doi.org/10.31223/X5NS54, 2022.
Liu, Y.-N., Zhang, J., Zhang, Y., Sun, W.-W., Jiao, L.-L., Sun, D.-X., Hu, X.-N., Ye, X., Li, Y.-D., Liu, S.-F., Cao, K.-Q., Chai, M.-Y., and Zhou, W.-Y.-N.: The Advanced Hyperspectral Imager: Aboard China's GaoFen-5 Satellite, IEEE Geosci. Remote Sens., 7, 23–32, https://doi.org/10.1109/MGRS.2019.2927687, 2019.
Luo, H., Li, Z., Wu, Y., Qiu, Z., Shi, H., Wang, Q., and Xiong, W.: Greenhouse Gases Monitoring Instrument on GaoFen-5 Satellite-II: Optical Design and Evaluation, Remote Sens., 15, 1105, https://doi.org/10.3390/rs15041105, 2023.
NASA: NASA Earth Observations Cloud Fraction (1 Month TERRA/MODIS), National Aeronotics and Space Administration, Washington, D.C., https://neo.gsfc.nasa.gov/view.php?datasetId=MODAL2_M_CLD_FR&date=2022-06-01 (last access: 19 June 2023), 2023.
OHBI: Satellites & Missions: PRISMA, Orbitale Hochtechnologie Bremen Italia S.p.A., Milan, Italy, https://www.ohb-italia.it/satellites-missions/ (last access: 21 February 2022), 2022.
Orbio: Actionable Methane Intelligence: Filling the global methane gap with asset-level emissions data, Orbio, Köln, Germany, https://www.orbio.earth/ (last access: 25 February 2023), 2023.
Pandey, S., Gautam, R., Houweling, S., van der Gon, H. D., Sadavarte, P., Borsdorff, T., Hasekamp, O., Landgraf, J., Tol, P., van Kempen, T., Hoogeveen, R., van Hees, R., Hamburg, S. P., Maasakkers, J. D., and Aben, I.: Satellite observations reveal extreme methane leakage from a natural gas well blowout, P. Natl. Acad. Sci. USA, 116, 26376–26381, https://doi.org/10.1073/pnas.1908712116, 2019.
Ravikumar, A. P., Sreedhara, S., Wang, J., Englander, J., Roda-Stuart, D., Bell, C., Zimmerle, D., Lyon, D., Mogstad, I., Ratner, B., and Brandt, A. R.: Single-blind Inter-comparison of Methane Detection Technologies – Results from the Stanford/EDF Mobile Monitoring Challenge, Elementa, 7, 29, https://doi.org/10.1525/elementa.373, 2019.
Roger, J., Irakulis-Loitxate, I., Valverde, A., Gorroño, J., Chabrillat, S., Brell, M., and Guanter, L.: High-resolution methane mapping with the EnMAP satellite imaging spectroscopy mission, Earth Arxiv [preprint], https://doi.org/10.31223/X5M65Z, 2023.
Rutherford, J., Sherwin, E., Chen, Y., Aminfard, S., and Brandt, A.: Evaluating methane emission quantification performance and uncertainty of aerial technologies via high-volume single-blind controlled releases, Oil, Gas, and Energy, Earth Arxiv [preprint], https://doi.org/10.31223/X5KQ0X, 2023.
Sánchez-García, E., Gorroño, J., Irakulis-Loitxate, I., Varon, D. J., and Guanter, L.: Mapping methane plumes at very high spatial resolution with the WorldView-3 satellite, Environ. Sci. Technol., 56, 10517–10529, https://doi.org/10.1021/acs.est.1c08575, 2022.
Scott, W.: Mapping Methane Emissions Using Maxar's WorldView-3 Satellite, Maxar, Ann Arbor, MI, USA, https://blog.maxar.com/earth-intelligence/2022/mapping-methane-emissions-using-maxars-worldview-3-satellite (last access: 25 May 2023), 2022.
Sherwin, E. D., Chen, Y., Ravikumar, A. P., and Brandt, A. R.: Single-blind test of airplane-based hyperspectral methane detection via controlled releases, Elementa, 9, 00063, https://doi.org/10.1525/elementa.2021.00063, 2021.
Sherwin, E. D., Rutherford, J. S., Chen, Y., Aminfard, S., Kort, E. A., Jackson, R. B., and Brandt, A. R.: Single-blind validation of space-based point-source detection and quantification of onshore methane emissions, Sci. Rep., 13, 3836, https://doi.org/10.1038/s41598-023-30761-2, 2023.
Sherwin, E. D., Rutherford, J. S., Zhang, Z., Chen, Y., Wetherley, E. B., Yakovlev, P. V., Berman, E. S. F., Jones, B. B., Cusworth, D. H., Thorpe, A. K., Ayasse, A. K., Duren, R. M., and Brandt, A. R.: US oil and gas system emissions from nearly a million aerial site measurements, Nature, https://doi.org/10.21203/rs.3.rs-2406848/v1, in press, 2024.
Song, Q., Ma, C., Liu, J., and Wei, H.: Quantifying ocean surface green tides using high-spatial resolution thermal images, Opt. Express, 30, 36592, https://doi.org/10.1364/OE.472479, 2022.
Sun, Y., Szücs, G., and Brandt, A. R.: Solar PV output prediction from video streams using convolutional neural networks, Energy Environ. Sci., 8, 1811–1818, https://doi.org/10.1039/C7EE03420B, 2018.
USGS: Landsat 8, United States Geological Survey, Washington, D.C., https://www.usgs.gov/landsat-missions/landsat-8 (last access: 21 February 2022), 2022.
Varon, D. J., Jacob, D. J., McKeever, J., Jervis, D., Durak, B. O. A., Xia, Y., and Huang, Y.: Quantifying methane point sources from fine-scale satellite observations of atmospheric methane plumes, Atmos. Meas. Tech., 11, 5673–5686, https://doi.org/10.5194/amt-11-5673-2018, 2018.
Varon, D. J., McKeever, J., Jervis, D., Maasakkers, J. D., Pandey, S., Houweling, S., Aben, I., Scarpelli, T., and Jacob, D. J.: Satellite Discovery of Anomalously Large Methane Point Sources From Oil/Gas Production, Geophys. Res. Lett., 46, 13507–13516, https://doi.org/10.1029/2019GL083798, 2019.
Varon, D. J., Jervis, D., McKeever, J., Spence, I., Gains, D., and Jacob, D. J.: High-frequency monitoring of anomalous methane point sources with multispectral Sentinel-2 satellite observations, Atmos. Meas. Tech., 14, 2771–2785, https://doi.org/10.5194/amt-14-2771-2021, 2021.
Wang, A. and Lee, J. J.: Methane “Super-Emitters” Mapped by NASA's New Earth Space Mission, National Aeronotics and Space Administration, Pasadena, California, USA, https://www.nasa.gov/feature/jpl/methane-super-emitters-mapped-by-nasa-s-new-earth-space-mission (last access: 25 May 2023), 2022.
Xinhua: China launches new remote sensing satellite, XinhuaNet, 9th December, https://english.news.cn/20221209/55ef410290954ce1a77f34a6be9beb64/c.html (last access: 24 May 2023), 2022.
Zhang, B., Guo, B., Zou, B., Wei, W., Lei, Y., and Li, T.: Retrieving soil heavy metals concentrations based on GaoFen-5 hyperspectral satellite image at an opencast coal mine, Inner Mongolia, China, Environ. Pollut., 300, 118981, https://doi.org/10.1016/j.envpol.2022.118981, 2022.
Zhong, B., Yang, A., Liu, Q., Wu, S., Shan, X., Mu, X., Hu, L., and Wu, J.: Analysis Ready Data of the Chinese GaoFen Satellite Data, Remote Sens., 13, 1709, https://doi.org/10.3390/rs13091709, 2021.
Zimmerle, D.: METEC Controlled Test Protocol: Survey Emission Detection And Quantification, Colorado State University, Fort Collins, CO, USA, https://doi.org/10.25675/10217/235363, 2022.