the Creative Commons Attribution 4.0 License.
the Creative Commons Attribution 4.0 License.
 | 01 Feb 2024
An intercomparison of EarthCARE cloud, aerosol, and precipitation retrieval products
Howard W. Barker
Jason N. S. Cole
Nicole Docter
David P. Donovan
Robin J. Hogan
Anja Hünerbein
Pavlos Kollias
Bernat Puigdomènech Treserras
Zhipeng Qu
Ulla Wandinger
Gerd-Jan van Zadelhoff
The objective of the Earth Cloud, Aerosol, and Radiation Explorer (EarthCARE) mission is to infer attributes of cloud, aerosol, precipitation, and radiation from observations made by four complementary instruments. This requires the development of single-instrument and multiple-instrument (i.e. synergistic) retrieval algorithms that employ measurements made by one, or more, of EarthCARE's cloud-profiling radar (CPR), atmospheric lidar (ATLID), and multi-spectral imager (MSI); its broadband radiometer (BBR) places the retrieved quantities in the context of the surface–atmosphere radiation budget. To facilitate the development and evaluation of ESA's EarthCARE production model prior to launch, sophisticated instrument simulators were developed to produce realistic synthetic EarthCARE measurements for simulated conditions provided by cloud-resolving models. While acknowledging that the physical and radiative representations of cloud, aerosol, and precipitation in the test scenes are based on numerical models, the opportunity to perform detailed evaluations wherein the “truth” is known provides insights into the performance of EarthCARE's instruments and retrieval algorithms. This level of omniscience will not be available for the evaluation of in-flight EarthCARE retrieval products, even during validation activities coordinated with ground-based and airborne measurements. In this study, we compare EarthCARE retrieval products both statistically across all simulated scenes and from a specific time series from a single scene.
For ice clouds, it is shown that retrieved profiles of ice water content and effective particle size made by the ATLID-CPR-MSI cloud, aerosols, and precipitation (ACM-CAP) synergistic algorithm are consistently more accurate than those from its single-instrument counterparts. While liquid clouds are often difficult to detect from satellite-borne sensors, especially for multi-layered clouds, ACM-CAP benefits from combined constraints from lidar backscatter, solar radiances, and radar-path-integrated attenuation but still exhibits non-trivial random error. For precipitation retrievals, the CPR cloud and precipitation product (C-CLD) and ACM-CAP have a similar performance when well-constrained by CPR measurements. The greatest differences are in coverage, with ACM-CAP reporting retrievals in the melting layer, and in heavy precipitation, where CPR signals are dominated by multiple scattering and attenuation. Aerosol retrievals from ATLID compensate for a high degree of measurement noise in a number of ways, with the ATLID extinction, backscatter, and depolarisation (A-EBD) product and ACM-CAP demonstrating similar performance. The multi-spectral imager (MSI) cloud optical properties (M-COP) product performs very well for unambiguous cloud layers. Similarly, the MSI aerosol optical thickness (M-AOT) product performs well when radiances are unaffected by cloud, but both products provide little information about vertical profiles of properties. Finally, a summary of the performance of all retrieval products and their random errors is provided.
- Article
(5375 KB) - Full-text XML
- BibTeX
- EndNote


With its mission to measure clouds, aerosols, and precipitation and their radiative effects using two active and two passive instruments aboard a single platform, the Earth Cloud, Aerosol, and Radiation Explorer (EarthCARE) is the most complex of the European Space Agency (ESA) Earth Explorer satellites to date. EarthCARE's four instruments are the 355 nm atmospheric lidar (ATLID), 94 GHz cloud profiling radar (CPR), the multi-spectral imager (MSI), and the broadband radiometer (BBR), each fully described in Wehr et al. (2023). The ESA EarthCARE production model (Eisinger et al., 2023) includes 14 single-instrument (L2a) and 11 synergistic (L2b) data products, which will present the post-processed measurements from all instruments, interpret those measurements to describe the spatial distributions and classifications of hydrometeors and aerosols through the atmosphere, retrieve the bulk quantities and microphysical properties of clouds, precipitation, and aerosols, and finally place each scene in its broadband radiative context. As part of the development of EarthCARE's L2 processors, an unprecedented effort has been directed at the simulation of EarthCARE measurements based on high-resolution numerical weather forecasts (Donovan et al., 2023a; Qu et al., 2023b). These simulated test scenes have provided the basis for developing and testing the L2 processors ahead of EarthCARE's launch and facilitate an evaluation of retrieved geophysical quantities wherein the “true” physical quantities are known.
Each L2 processor and its data products have been described and evaluated using the simulated test scenes in dedicated publications. In this study, we present an intercomparison of geophysical retrievals describing the bulk amount and microphysical properties of hydrometeors and aerosols as follows:
-
ATLID retrievals of profiles of ice clouds (A-ICE) and aerosols (A-AER and A-EBD) are described in Donovan et al. (2023b) and the aerosol layer descriptor (A-ALD) in Wandinger et al. (2023);
-
CPR retrievals of ice and liquid clouds, snow, and rain (C-CLD) are described in Mroz et al. (2023);
-
MSI cloud mask (M-CM; Hünerbein et al., 2023a) and retrievals of cloud optical properties (M-COP; Hünerbein et al., 2023b) and retrievals of aerosol properties (M-AOT; Docter et al., 2023) are discussed;
-
retrievals from EarthCARE's active instruments – ice clouds from A-ICE and C-CLD, snow, liquid clouds, and rain from C-CLD and aerosols from A-EBD – are composited into a unified cloud, aerosol, and precipitation product (ACM-COM; Cole et al., 2023); and,
-
the corrected measurements from active and passive sensors provide the synergistic inputs for a simultaneous and unified retrieval of all cloud, aerosol, and precipitation (ACM-CAP; Mason et al., 2023).
Table 1Descriptions and references for EarthCARE L2 products relating to retrievals of geophysical quantities, as adapted from Tables 1 and 3 from the ESA production model (Eisinger et al., 2023).
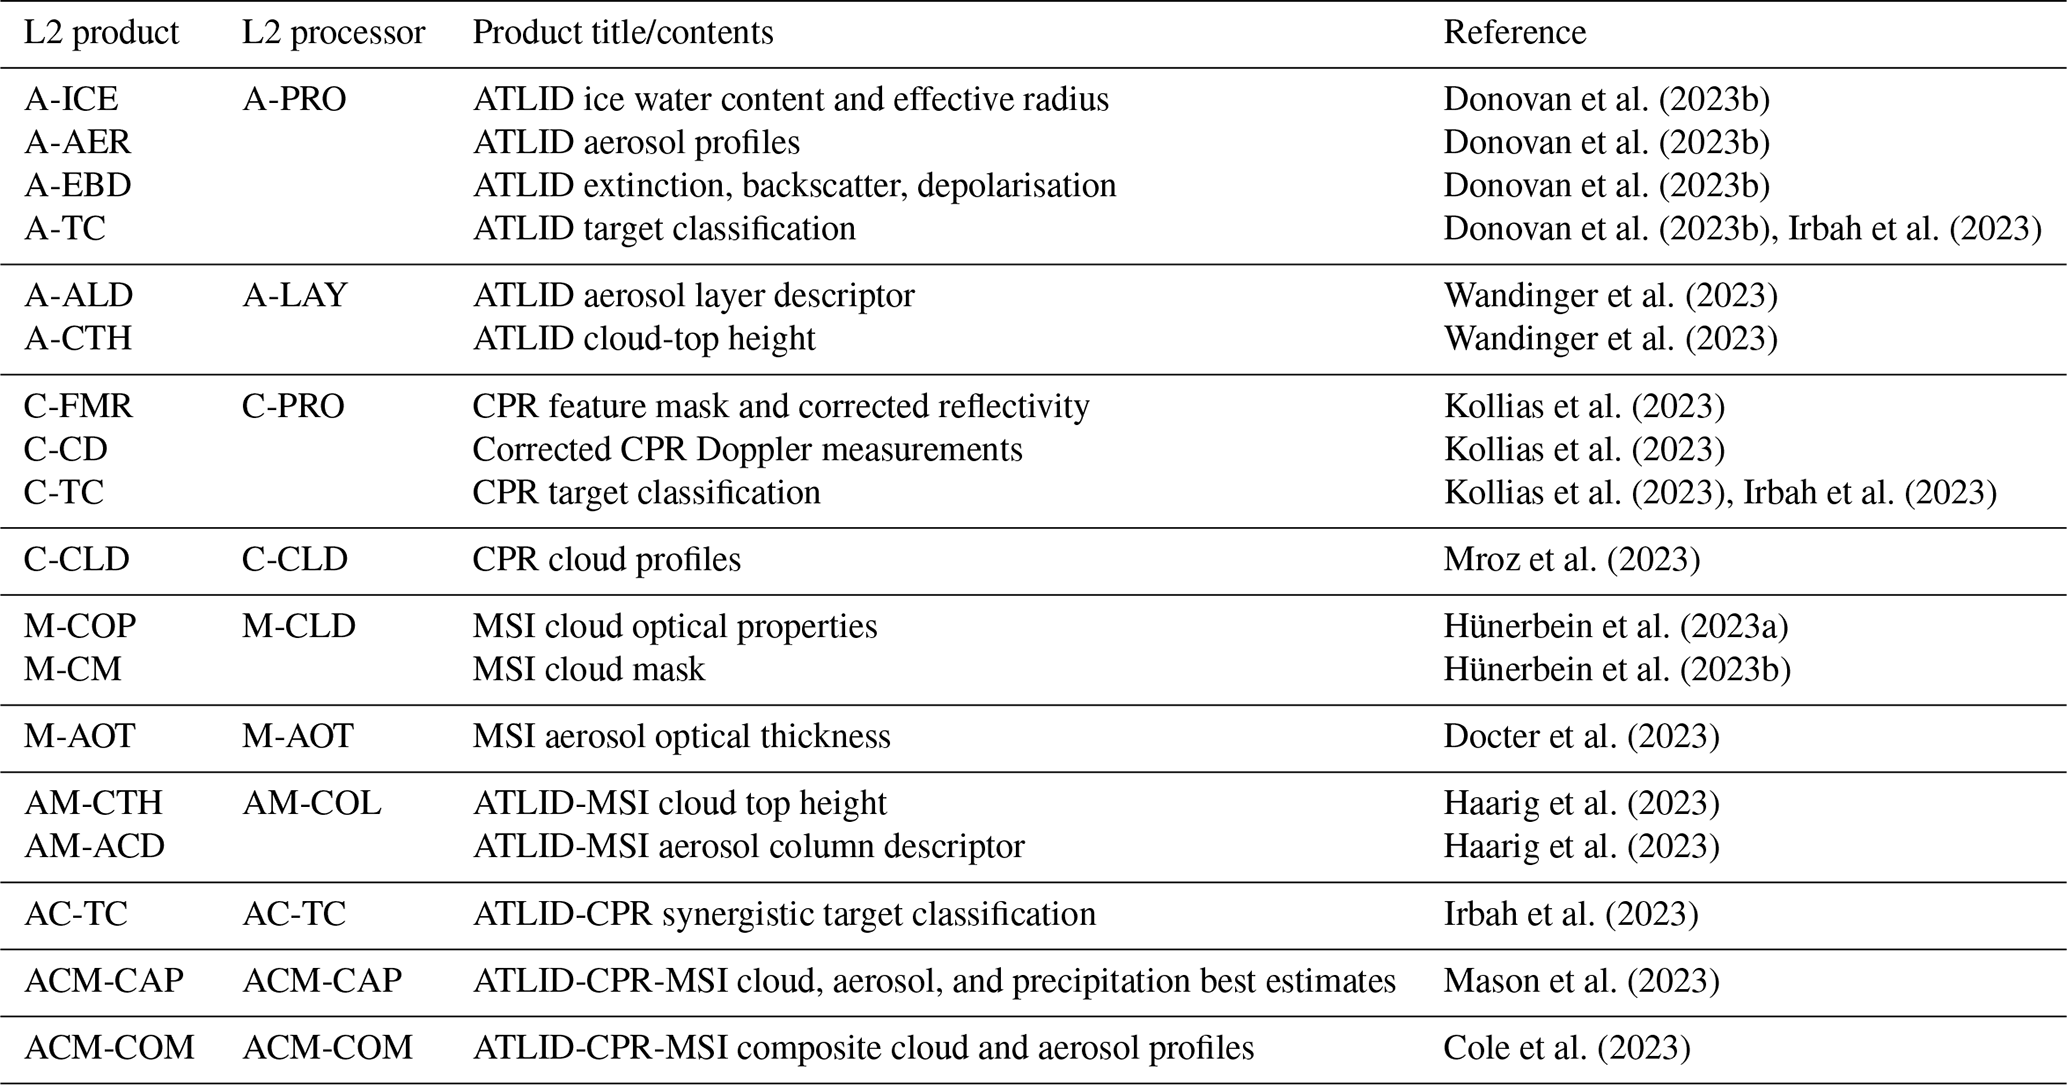
All relevant L2 products, their expanded acronyms, references, and associated processors are listed in Table 1. The production of both single-instrument (L2a) and synergistic (L2b) retrievals builds some redundancy into the production model and provides the capacity for an immediate internal verification of EarthCARE products, based on intercomparison between geophysical retrieval products within the same processing chain.
Prior to launch, the evaluation of EarthCARE retrieval products has been limited to simulated EarthCARE scenes and measurements from previous satellites or field campaigns that can be used as proxies for EarthCARE. After launch, validation efforts will depend on correlative data products from dedicated field campaigns and supersites; however, with multiple single-instrument and synergistic products available, one valuable form of verification that can be carried out using both simulated scenes and in-flight data is by detailed intercomparison of EarthCARE retrievals. Intercomparisons have been a key part of the algorithm development workflow and inform planning for verification activities during the commissioning phase. The description of the EarthCARE production model (Eisinger et al., 2023) and the papers describing the individual processors will provide important complementary information to this study, which is intended as a reference by which users of EarthCARE data can understand the differences between products, their performance as currently understood when applied to the simulated test scenes, and how to select data products suited to their purposes. We limit the intercomparison to retrieved geophysical quantities and properties of clouds, precipitation, and aerosols; an intercomparison of single-instrument and synergistic detection and target classification products is made in Irbah et al. (2023), while radiative fluxes and heating rates derived from two sets of retrieval products are compared in Barker et al. (2023).
In Sect. 2, we outline the EarthCARE retrieval products that are included in this study and describe the quantities from the numerical weather model against which they are evaluated. The evaluation (Sect. 3) is separated into retrievals of ice cloud and snow (Sect. 3.1), liquid clouds (Sect. 3.2), rain (Sect. 3.3), and aerosols (Sect. 3.4). A summary of the respective performance of single-instrument and synergistic retrievals products and some discussion and concluding remarks are made in Sect. 4.
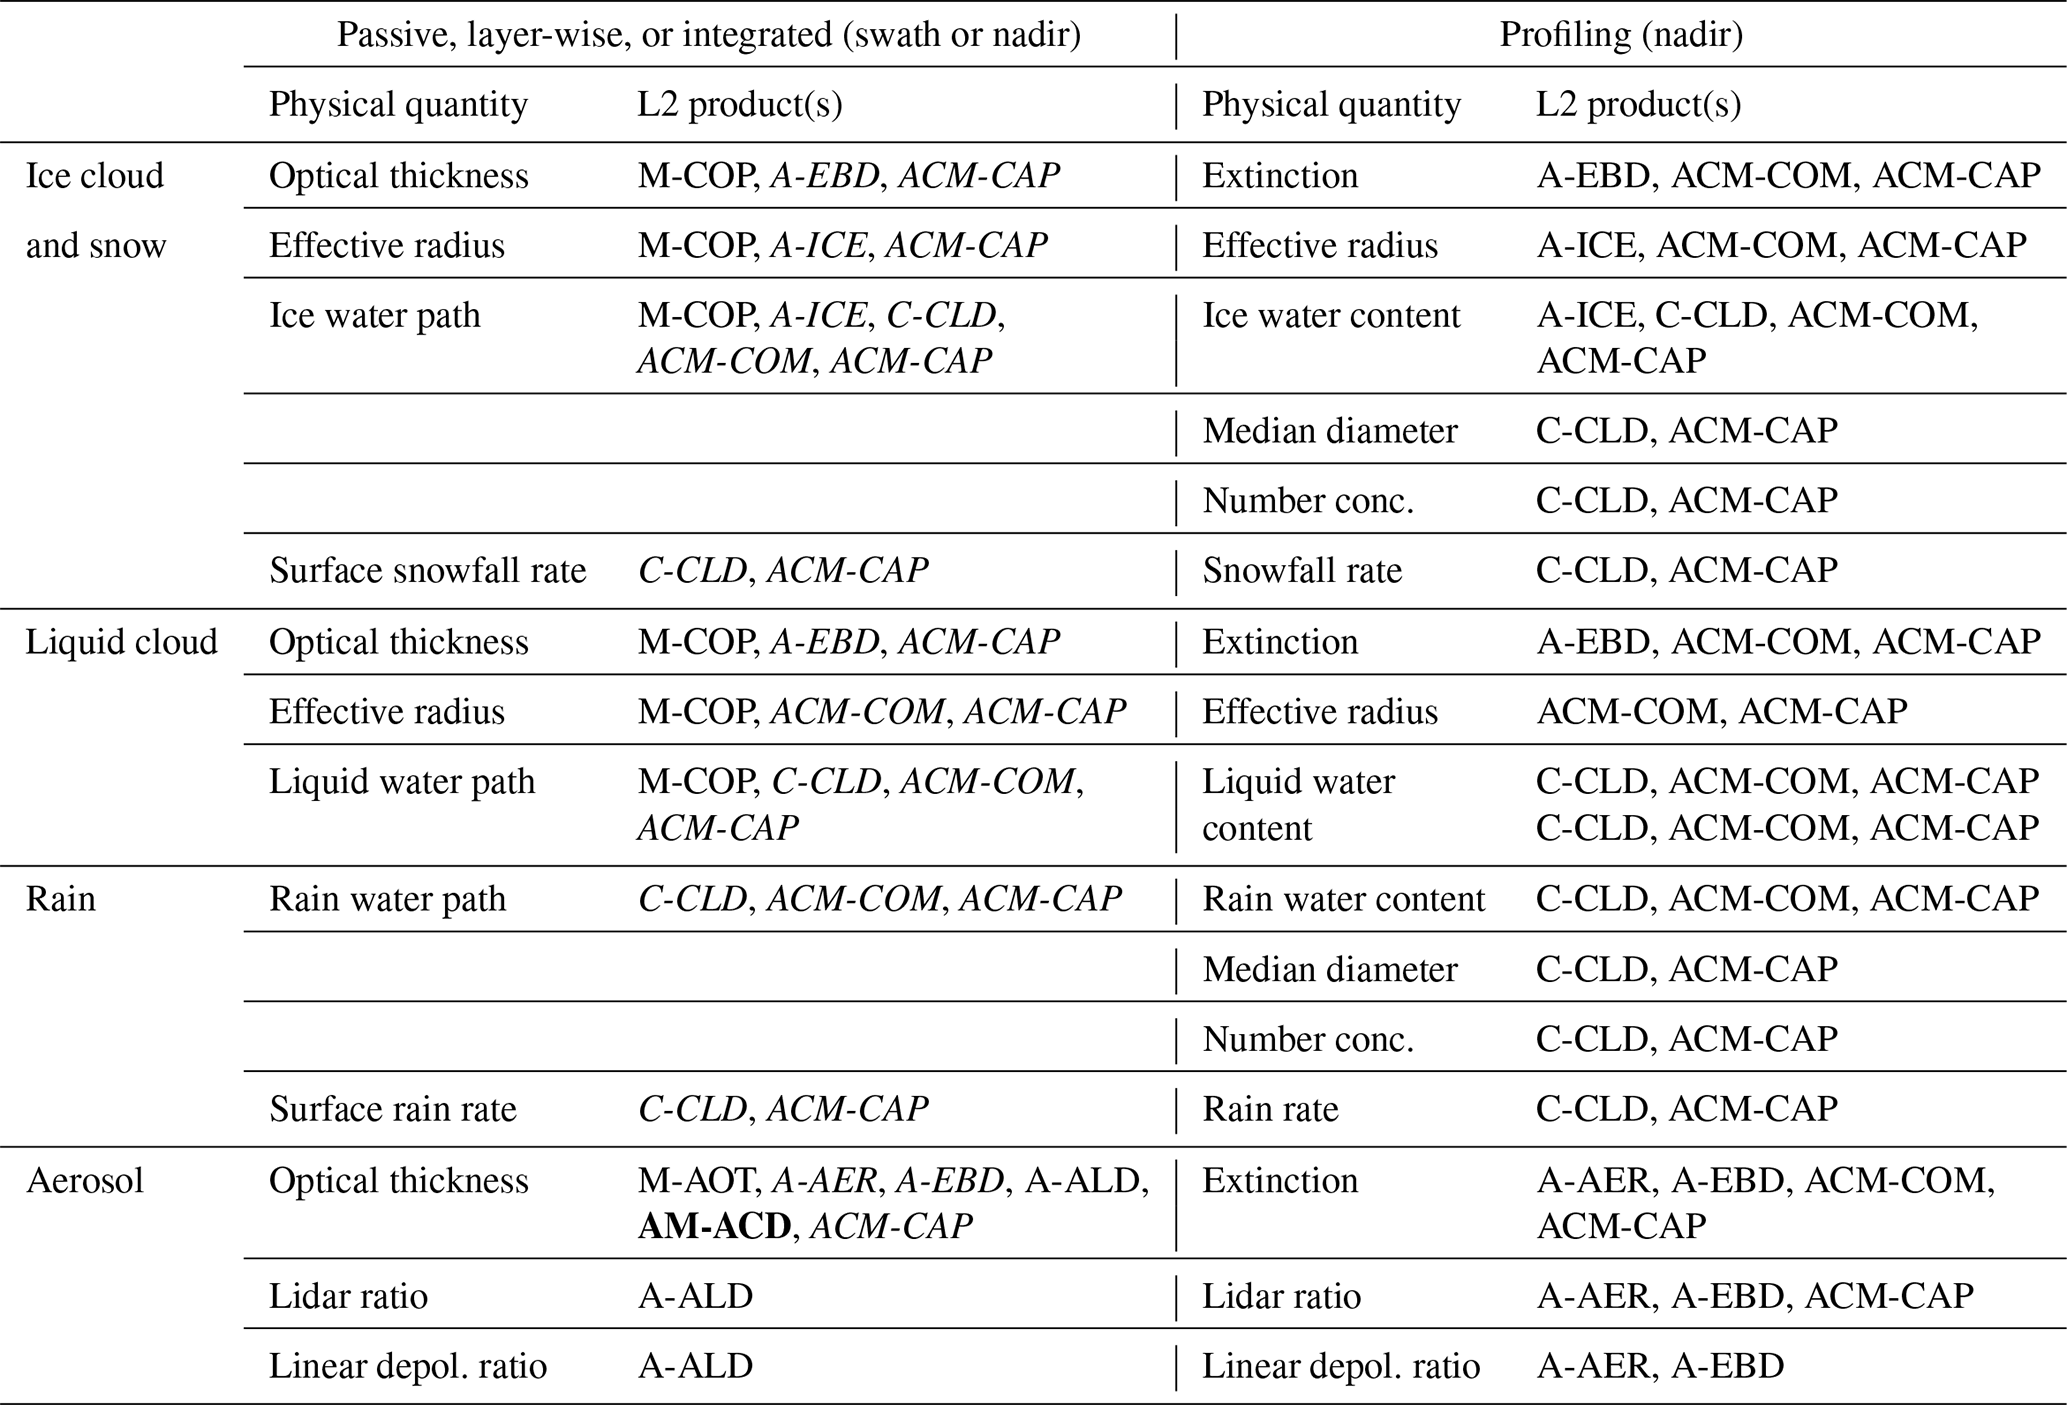
Table 2A summary of which EarthCARE L2a and b data products can be intercompared at nadir, according to their geometry and physical quantity. Italics indicate profiling retrieval products that are provided on higher dimensions but can be vertically integrated or subset for comparison with other products (e.g. deriving ice water path from ice water content). Products in bold are not included in this intercomparison. Note that some quantities listed here may be derived from variables in the L2 products; for example, both C-CLD and ACM-CAP report “mass flux” (in units of ) rather than “rain/snow rate” (in units of mm h−1). However, the conversion between these terms is unambiguous, and the terms are used interchangeably.
Two sets of data products are used to carry out the present evaluation and intercomparison. The model truth data products (Sect. 2.1) have been postprocessed from the numerical model data fields used as inputs for the simulated test scenes. These are non-standard data products that are specific to this activity. The retrieval products (Sect. 2.2 and Table 2) are the output of the official ESA EarthCARE L2 processors at the time of writing, which will closely resemble the data structure and variable naming conventions of the L2 products available after EarthCARE launch.
2.1 Model truth
The generation of the three EarthCARE test scenes based on Environment and Climate Change Canada (ECCC)'s high-resolution Global Environmental Multiscale (GEM) model and Copernicus Atmosphere Monitoring Service (CAMS) aerosol forecasts is described in Qu et al. (2023b), and the simulation of EarthCARE measurements is described in Donovan et al. (2023a). The thermodynamical, cloud, and precipitation fields are based on GEM and are merged with the CAMS aerosol fields. The merged and modified quantities describing the properties of the atmosphere, clouds, precipitation, and aerosols is referred to in this paper as the “model truth”. The model truth has been collated in two data products, which are archived alongside the L2 products (see the “Data availability” section at the end of the paper).
Each of the test scenes is a descending daylit frame (one-eighth of an EarthCARE orbit or around 5000 km). The Halifax scene passes over the western North Atlantic, starting near Halifax, Nova Scotia; it features high-latitude mixed-phase boundary layer clouds, a heavily precipitating cold front in the mid-latitudes, and scattered warm marine boundary layer clouds in the sub-tropics. The Baja scene is mid-latitude frame beginning over continental North America, including ice clouds over the Rocky Mountains, and ending over the Baja California peninsula. The Hawaii scene covers the tropical central Pacific Ocean, featuring heavy precipitation from deep tropical convective system. The meteorological and geographical contexts of the test scenes are described in more detail in Qu et al. (2023a).
While evaluating the L2 products against the model truth in these simulated scenes provides many insights into the performance of the retrievals, we stress that the numerical models and instrument simulators rely on approximations to the same quantities and properties as the retrievals (e.g. ice and rain fall speeds, ice density, hydrometeor size distributions, and number concentrations). Apparent errors or biases in the retrievals presented in this paper may therefore be due to differences in assumptions underlying the model truth and should not be interpreted as unambiguous deficits in the retrieval algorithms. These uncertainties can only ultimately be quantified with in-flight EarthCARE observations and correlative measurements from validation activities.
2.2 Retrievals
The EarthCARE L2 production model is described in detail in Eisinger et al. (2023). In this section, we provide brief descriptions of selected products, which include geophysical retrievals of cloud, aerosol, and precipitation.
Table 2 shows the L2 data products from which the retrieved quantities can be intercompared. Not all of these quantities are shown in this paper; single-instrument and synergistic profiling macrophysical products (A-TC, C-TC, and AC-TC) are intercompared in Irbah et al. (2023), while the radiative quantities are evaluated as part of the radiative closure assessment study (Barker et al., 2023). Among the geophysical retrieval products, we have not included the synergistic aerosol column product AM-ACD (Haarig et al., 2023) in this intercomparison.
2.2.1 MSI retrievals
The passive multi-spectral imager (MSI) measures radiances with four solar channels from the visible (670 nm) to the shortwave infrared (2.2 µm) and three thermal-infrared channels (8.5 to 12.5 µm), with 500 m spatial resolution across a 150 km swath (Wehr et al., 2023).
The L2a MSI cloud optical and physical properties (M-COP; Hünerbein et al., 2023b) product reports cloud optical thickness, effective radius, and derived cloud water path estimates and their uncertainties based on MSI's visible, shortwave infrared, and thermal-infrared channels. The thermodynamic phase, structure, and degree of certainty in the cloudy pixels are differentiated using cloud phase and cloud mask variables, which are part of the L2a MSI cloud mask product (M-CM; Hünerbein et al., 2023a). Unless otherwise stated, in this paper, we interpret cloud water path pixels as liquid water path when the cloud phase is liquid or supercooled/mixed and as ice water path when the cloud phase is ice or overlap.
The L2a MSI aerosol optical thickness (M-AOT; Docter et al., 2023) product includes aerosol optical thickness over ocean and land at 670 nm and over ocean at 865 nm, based on MSI's visible, near-infrared, and shortwave infrared channels. While both M-COP and M-AOT are provided across the MSI swath, for this study we present MSI retrievals at the nadir pixel only for intercomparison with the active instruments.
2.2.2 ATLID retrievals
The 355 nm atmospheric lidar (ATLID) (Wehr et al., 2023) with high-spectral-resolution lidar (HSRL) capability, detects clouds and aerosols. All L2 products downstream of the ATLID feature mask (A-FM; van Zadelhoff et al., 2023b) are postprocessed to a grid with 100 m vertical and 1 km along-track resolution. This grid defines the nadir curtain of the joint standard grid (JSG) onto which the data are mapped for all L2a ATLID products and L2b synergistic data products, such as ACM-CAP and ACM-COM.
The L2a ATLID aerosol product (A-AER; Donovan et al., 2023b) estimates the profile of extinction from targets identified as weak scatterers by A-FM (i.e. aerosols and optically thin ice clouds), using a long averaging window (150 km in the present configuration) to increase the signal-to-noise ratio (SNR). Due to its long averaging window, the aerosol retrievals in A-AER have a characteristically smooth distribution. The L2a ATLID extinction, backscatter, and depolarisation product (A-EBD; Donovan et al., 2023b) is based on an optimal estimation retrieval of extinction profiles, constrained by ATLID's Rayleigh (i.e. molecular) and Mie (i.e. particulate) backscatter channels. The smoother A-AER provides a first-pass aerosol retrieval as an input to A-EBD, which retrieves smaller-scale features, where justified, by stronger particulate backscatter signals.
The A-EBD product provides an input to downstream ATLID products that further interpret the extinction profiles to estimate the physical properties of aerosols and ice. The L2a ATLID aerosol layer descriptor (A-ALD; Wandinger et al., 2023) identifies aerosol layers and their layer-averaged properties. A-ALD provides a total column aerosol optical thickness based on A-EBD for comparison to the total optical thickness of identified aerosol layers to quantify how much a layer-based approach underestimates the contributions of unresolved aerosols in the profile. The L2a ATLID retrieval of ice cloud properties (A-ICE; Donovan et al., 2023b) combines an estimate of extinction from A-EBD with the temperature-dependent relation of ice water content and hence effective radius. The extinction coefficient is provided in liquid clouds, and the properties of liquid clouds are not retrieved from ATLID alone, due to the rapid extinction of the lidar in liquid layers.
All ATLID aerosol products include at least one aerosol classification variable in which six tropospheric aerosol mixtures (i.e. dust, sea salt, continental pollution, smoke, dusty smoke, and dusty mix) are distinguished; however, we note that these classifications are not identical between products, and the most robustly processed aerosol classification is included in the A-TC product. In general, this involves assigning a higher proportion of volumes to one of the unknown classes when the signal is difficult to interpret; these volumes are often at the edges of cloud features or where ATLID is nearly completely attenuated. For consistency, we therefore select aerosols across the A-AER and A-EBD products, using the same A-TC classification variable, and describe where this has a significant impact on the evaluation. We recommend that users use the most advanced target classification variable available, such as A-TC or even the synergistic product AC-TC.
2.2.3 CPR retrievals
The W-band (94 GHz) cloud profiling radar (CPR) has Doppler capability, approximately 5 dBZ more sensitivity than CloudSat (Wehr et al., 2023), and detects clouds and precipitation. CPR measurements are postprocessed onto a 100 m vertical grid (oversampled from 500 m vertical pulse length) with 1 km along-track resolution. While the CPR L2a products are provided on their own spatial grid, for the L2b synergistic products (e.g. ACM-CAP and ACM-COM), CPR data are mapped to the JSG using a nearest-neighbour interpolation.
The L2a CPR cloud and precipitation product (C-CLD; Mroz et al., 2023) employs an optimal estimation retrieval algorithm to retrieve the bulk quantities and characteristic sizes of snow, rain, and liquid clouds from the radar reflectivity, mean Doppler velocity, and path-integrated attenuation measurements of the CPR. Due to its high sensitivity, CPR is expected to detect some amount of non-precipitating liquid cloud, but the radar measurements are dominated by larger precipitating particles when present, and the microwave scattering properties of which are accounted for within the retrieval algorithms (Mroz et al., 2023; Mason et al., 2023). C-CLD includes a representation of liquid cloud both where it is directly diagnosed and where its presence is considered likely (e.g. within rain); however, the retrieval is not applied below a radar reflectivity threshold of −21 dBZ, below which sedimentation velocities are not available from C-CD (Kollias et al., 2023). This further limits the representation of non-precipitating clouds in the C-CLD product.
2.2.4 Synergistic retrievals
The L2b ACM-COM product (Cole et al., 2023) includes a composite atmosphere comprised of L2a ATLID and CPR products. Both A-ICE and C-CLD are used for ice cloud and snow. In volumes where A-ICE and C-CLD both contain ice cloud or snow, the product with the lowest uncertainty in the retrieved effective radius and ice water content is used. C-CLD provides information on rain and liquid clouds. The strong lidar backscatter signal from liquid clouds is invaluable for the detection and classification of liquid cloud layers (including mixed-phase cloud) in A-TC (Donovan et al., 2023b), but no L2a ATLID liquid cloud retrieval is available due to the rapid extinction of the lidar signal. A-EBD is used for aerosol fields.
The ACM-CAP product is a unified retrieval of cloud, aerosol, and precipitation from the synergy of ATLID, CPR, and MSI measurements (ACM-CAP; Mason et al., 2023). One advantage of a synergistic retrieval is the capacity for a smooth transition between the parts of a cloud that are detected only by ATLID (i.e. optically thin cirrus and the tops of high ice clouds), regions that are detected by both ATLID and CPR (i.e. the tops of most optically thick ice clouds), and those detected by CPR alone after ATLID is extinguished (i.e. within physically deep and optically thick clouds, or below layers of liquid cloud). The assimilation of MSI visible radiance and thermal infrared brightness temperature channels also provides passive constraints on the solar albedo and cloud-top properties that can only be applied consistently in a unified retrieval that represents complex and layered scenes with all combinations of hydrometeors.
For the intercomparison results presented here, both the model truth and all retrieval products are mapped onto the JSG using a nearest-neighbour interpolation. The intercomparison is illustrated by the time series of retrieved bulk quantities (e.g. ice water content and total aerosol extinction) and/or their vertical integrals (e.g. ice water path and total aerosol optical depth). We use case studies to illustrate the time series of retrieved quantities, wherein the first panel of each figure shows the model truth. We use the Halifax test scene. Of the three simulated EarthCARE test scenes, the Halifax scene samples the widest range of regimes, including deep and shallow ice clouds with snow and rain, supercooled liquid and mixed-phase clouds, liquid boundary layer clouds, and aerosols, including marine sea salt and continental pollution layers. For this reason, we use the Halifax scene to illustrate the intercomparison. For statistical evaluations, data from all three simulated test scenes are used.
In the evaluation, we quantify the random relative error between a retrieval and the model truth using the root mean squared logarithmic error (RMSLE), given by
where x is the retrieval, and y is the truth. This formulation is useful when the magnitude of the error may be as large as the value itself, or greater, and has been used for evaluating retrievals of ice water content (Hogan et al., 2006a). When the RMSLE is used in other applications such as machine learning, a scalar value (usually 1) is added to the retrieval and truth to prevent a division by zero. This issue is avoided here by only evaluating retrievals when both the product and the model truth have valid values. For ease of interpretation, the RMSLE is expressed as a pair of percentages, that is,
In this way, what could be called a factor of 2 error can be expressed as the range .
3.1 Ice clouds and snow
Ice clouds, snow, graupel, and hail are represented as distinct classes within GEM; however, in observations, there is no clear threshold between ice cloud and precipitation particles, so it is often necessary in retrievals to treat all glaciated hydrometeors as a continuum. Nevertheless, different instruments are more sensitive to different sizes of ice particles, and this is reflected in the retrieved quantities available in different EarthCARE products. Single-instrument retrievals in the optical spectrum (i.e. ATLID and MSI) are sensitive to smaller ice clouds particles. A-ICE reports profiles of ice water content (IWC), extinction, and effective radius within the part of the cloud for which ATLID is not yet extinguished around three optical depths, while M-COP reports ice water path (IWP), optical thickness, and cloud-top effective radius for the entire cloud layer. These are also the quantities of interest for the downstream radiative transfer modelling processor ACM-RT and are therefore reported in ACM-COM. In the microwave spectrum (i.e. CPR), larger snowflakes and precipitating particles are dominant. Therefore, C-CLD reports profiles of IWC, mean volume diameter, normalised number concentration, and precipitation rate S, which are characteristic of radar retrievals. The synergistic retrieval ACM-CAP assimilates radar, lidar, and radiometer measurements and therefore reports all of the above quantities.
Ice clouds and snow are the one part of the atmosphere in which measurements from the radar and lidar overlap usefully for synergistic retrievals; however, the thinnest ice clouds in the test scenes are only partially detected by ATLID. The A-FM (van Zadelhoff et al., 2023b) and A-PRO (Donovan et al., 2023b) processors use multiple techniques to distinguish cloud features from the ATLID signal, including along-track averaging to distinguish thin ice clouds from aerosols. In an intercomparison of target classification products, Irbah et al. (2023) showed that around 10 % of the ice clouds in the test scenes are seen by ATLID but not detected by CPR. These cirrus and cloud-top features detected only by lidar contribute almost negligibly to the total mass of ice in the tests scenes, which is dominated by snow but will nevertheless be radiatively important, both for the assimilation of MSI radiances in ACM-CAP and in the broadband radiative closure assessment. ACM-CAP has employed a method of extracting some synergistic information in lidar-only parts of the ice cloud by ensuring that the forward-modelled radar reflectivity in these regions does not exceed the threshold of CPR noise (Mason et al., 2023).
Ice clouds and snow seen by the radar only are dominated by precipitation in deep clouds, where ATLID becomes extinguished near the cloud top but will also include any ice clouds obscured by the extinction of the lidar in other contexts, such as by layers of supercooled or mixed-phase cloud aloft.

Figure 1Ice water content from (a) GEM, (b) A-ICE, (c) C-CLD, (d) ACM-COM, and (e) ACM-CAP for the Halifax scene. (f) The corresponding intercomparison of retrieved ice water paths, including M-COP, presented over duplicated axes for clarity. Shading in panel (b) indicates where A-ICE cannot retrieve ice clouds due to the extinction of the ATLID signal; shading in panels (c) and (d) indicates profiles not retrieved by C-CLD due to multiple scattering or attenuation of CPR signal.
In this section, we first intercompare the IWC and IWP, which are common to all retrievals and then compare selected quantities relating to optical retrievals (i.e. cloud effective radius) and radar retrievals (i.e. snow rate) separately. Figure 1 shows time series from the Halifax scene, with the GEM model truth and retrieved IWC for the active retrievals (panels a through e) and IWP for all products (panel f).
As discussed above, the lidar and radar retrievals are concerned with different parts of the size spectrum. A-ICE (Fig. 1b) accurately resolves the features at cloud top, including very high values of IWC up to 1 g m−3 in the deepest frontal part of the cloud (36–38∘ N), and some of the lowest values smaller than 1 mg m−3 in the optically thin anvils (38–44∘ N) and high-latitude clouds (65–67∘ N). In these thinnest clouds, it is possible to distinguish between the high degree of along-track smoothing used for weak backscatter targets and the more noisy or grainy retrieved values in the regions with moderate backscatter. Throughout the scene, the profile of IWC retrieved by A-ICE is limited by the extinction of ATLID (shaded in dark grey), while the very low values of IWC around cloud edges in GEM (Fig. 1a) illustrate that the very weakest features are not resolved by any of the instruments.
Conversely, C-CLD (Fig. 1c) accurately resolves the features of precipitating ice at high latitudes (48–66∘ N) and deep within the frontal cloud regime (35–45∘ N), with values of IWC up to 1 kg m−3, but misses areas of non-precipitating ice cloud in the optically thin high- and mid-level cloud layers, in ice or mixed-phase clouds between precipitating cells (63∘ N), and where the shallowest cloud layers may be obscured by surface clutter (45–55∘ N). The greatest differences between C-CLD and GEM are a deficit of IWC at the top of the deep frontal/anvil cloud (37–38∘ N), where the high IWC values are dominated by smaller ice cloud particles rather than the precipitating snow to which CPR is most sensitive.
The L2b products take advantage of the complementary lidar and radar measurements of different parts of the ice cloud and snow continuum to produce a more complete representation of the scene with ACM-COM (Fig. 1d) by merging A-ICE and C-CLD, resolving conflicts by selecting the product with the lower retrieval uncertainty in each volume, and ACM-CAP (Fig. 1e), by carrying out a synergistic retrieval in which all ATLID, CPR, and MSI measurements are used wherever they are available. ACM-COM inherits IWC from A-ICE at the cloud top and in optically thin clouds and from C-CLD deep within ice clouds and in snow. In many places, the merged IWC fields are consistent (throughout the high-latitude clouds and in the mid-level parts of the frontal cloud) and appear seamless, while discontinuities are evident where the two products differ (in the anvil and in mid-level clouds around 44 and 65∘ N). While cloud-top IWC from A-ICE is available above the convective core around 36∘ N, the lower parts of the profile are not available in profiles where CPR is strongly affected by radar multiple scattering and attenuation, and C-CLD does not currently attempt a retrieval (Mroz et al., 2023). ACM-CAP most closely resembles the GEM IWC. Many of the features in optically thin ice clouds are accurately resolved, including values of IWC smaller than 1 mg m−3. It is likely that the ACM-CAP Kalman smoother is less aggressive in applying along-track smoothing to compensate for noise in the ATLID particulate backscatter when compared with A-ICE. In heavy snowfall (64–65 and 37∘ N), ACM-CAP performs as well as C-CLD, with the notable difference that ACM-CAP retrieves profiles of IWC in a convective cell, where CPR is dominated by multiple scattering. Since radar multiple scattering effects were included in the instrument simulators used to generate the test scenes (Donovan et al., 2023a) and ACM-CAP includes multiple scattering in its radar forward model (Mason et al., 2023), some information is still available to constrain retrievals in heavy precipitation. Values of IWC in these profiles reach the values of 1 g m−3 in GEM but are under-constrained by measurements and are lower than the model truth both in the upper levels and close to the melting layer.
The time series of retrieved IWP (Fig. 1f) generally reflect the strengths and weaknesses of the products described above. A-ICE generally performs well in parts of the scene with low to moderate IWP and exhibits deficits in deep- and mixed-phase clouds, where ATLID is rapidly extinguished; C-CLD performs well in the high IWP profiles (with the exception of the heaviest precipitation cells, which are not retrieved) but misses or underestimates IWP in non-precipitating clouds. IWP from ACM-COM and ACM-CAP are both broadly closer to GEM. ACM-COM overestimates IWP in parts of the scene dominated by optically thin ice clouds, which are retrieved by A-ICE with a high degree of along-track averaging, and has a deficit in the deep precipitation where C-CLD does not report a retrieval; ACM-CAP overestimates IWP in the shallowest boundary layer clouds (52–55∘ N), where CPR measurements are obscured by surface clutter, and underestimates IWP in the anvil part of the frontal regime (37∘ N) and the small region of optically thin ice cloud around 34∘ N. M-COP is available in the sunlit region of the scene equatorward of 50∘ N; the passive retrieval shows very strong performance in parts of the scene where the active instruments can be limited by extinction and multiple scattering, such as the deep precipitation around 36–38∘ N. The mid-level and layered cloud regimes 42–45∘ N are more challenging for a passive retrieval, and M-COP underestimates IWP in places.
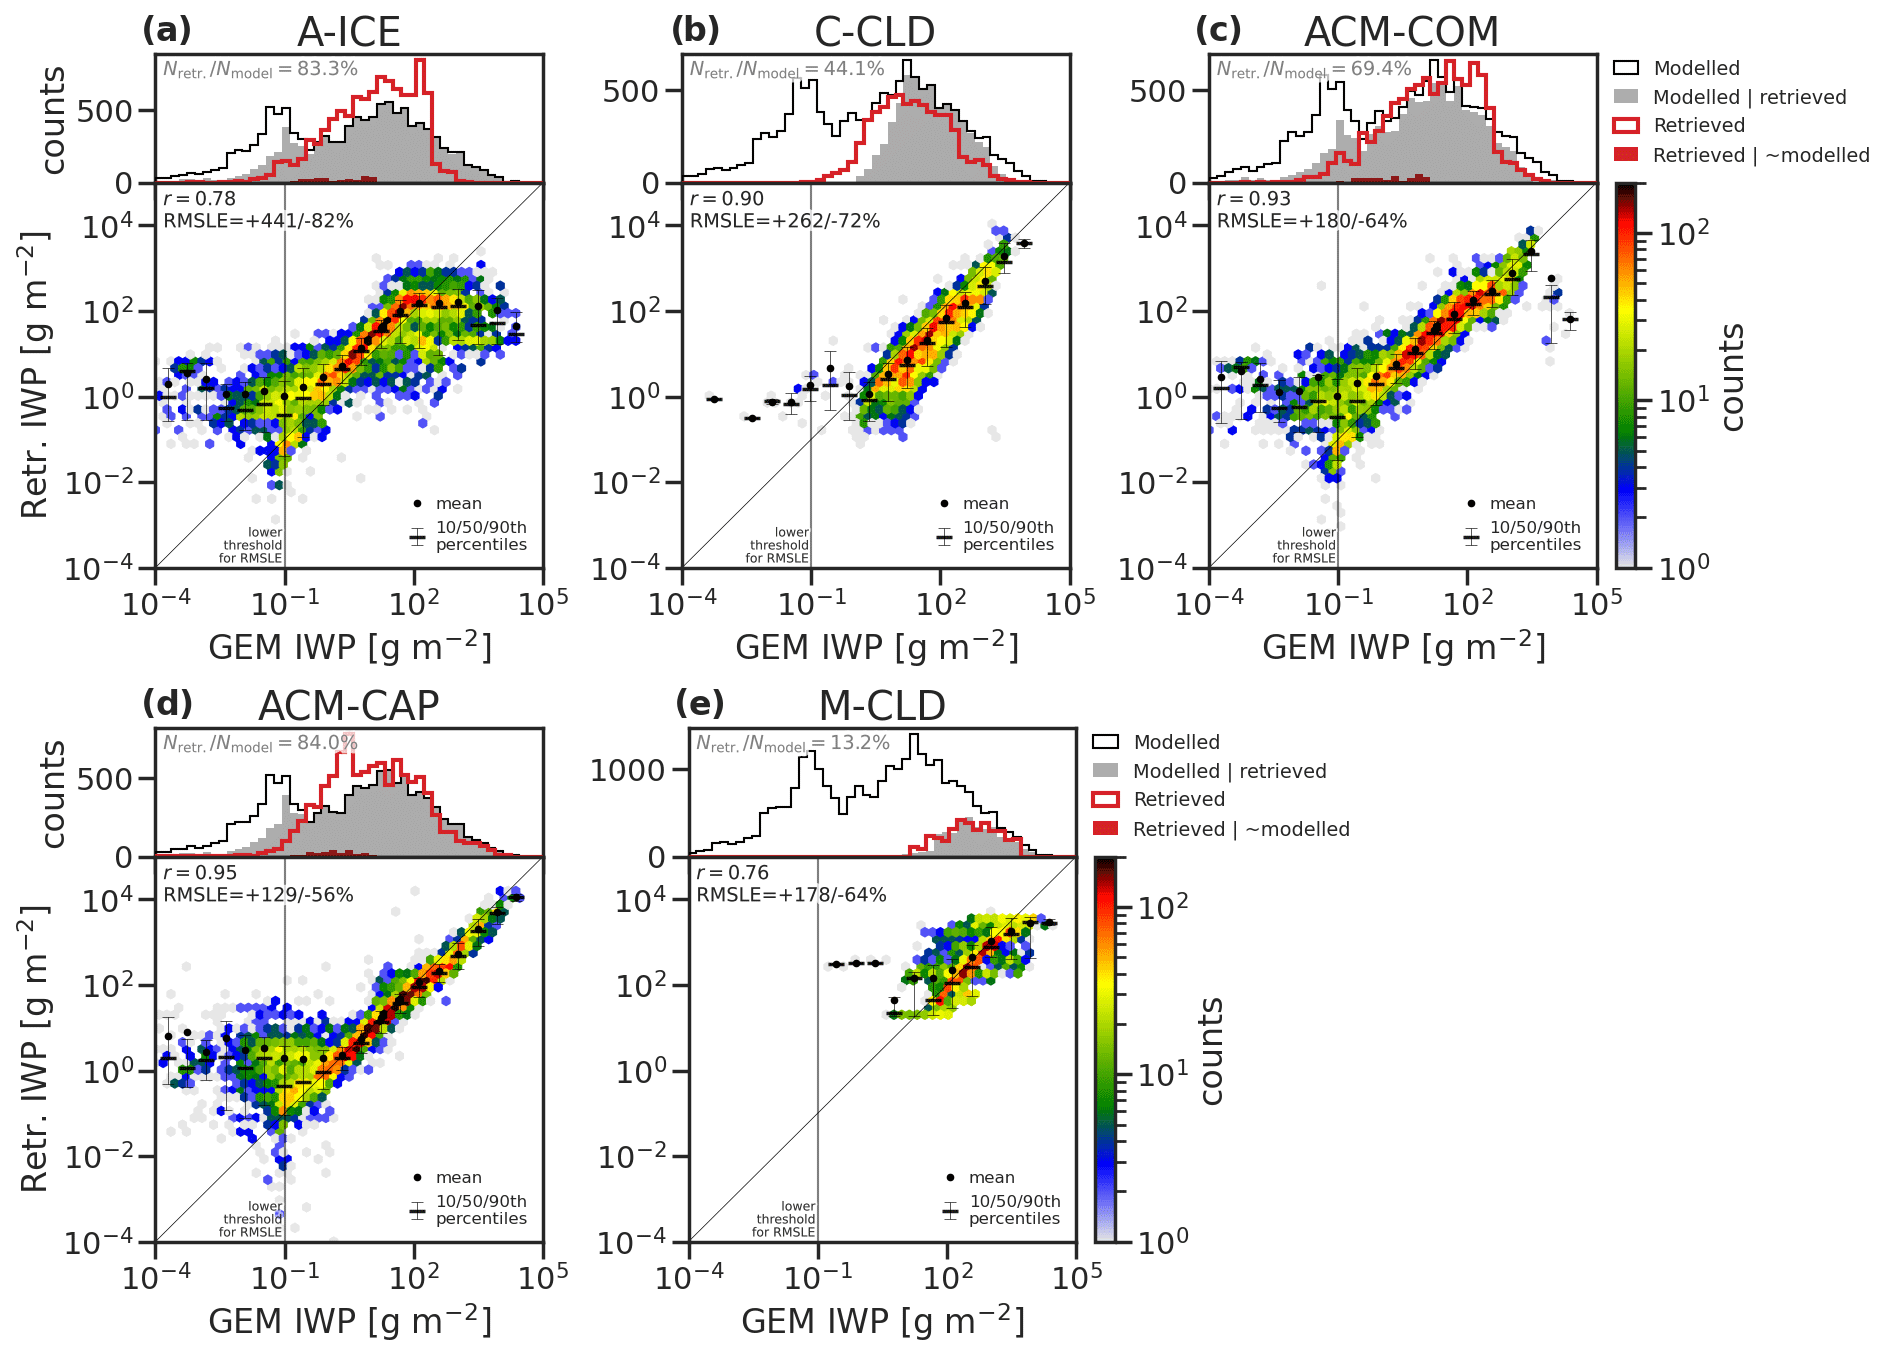
Figure 2Ice water path (IWP) evaluation for (a) A-ICE, (b) C-CLD, (c) ACM-COM, (d) ACM-CAP, and (e) M-COP. The top part of each panel shows probability density functions (PDFs) for all GEM data (black line), GEM data in volumes that are successfully retrieved by the product in question (grey shading), retrieved data (red line), and retrieved values in volumes where GEM does not include ice or snow (red shading). The percentage of profiles containing ice and snow in GEM that is reported in the product is given in the top left of each sub-panel, as an indicator of the coverage provided by each product. The bottom part of each panel shows joint histograms of GEM versus retrieved data, where a perfect retrieval would lie entirely along the diagonal. The colour scale is logarithmic to exaggerate rare features, and the mean and selected deciles of the distribution are overlaid. To summarise the performance of each product, the correlation coefficient r and RMSLE are given in the top left of each sub-panel.
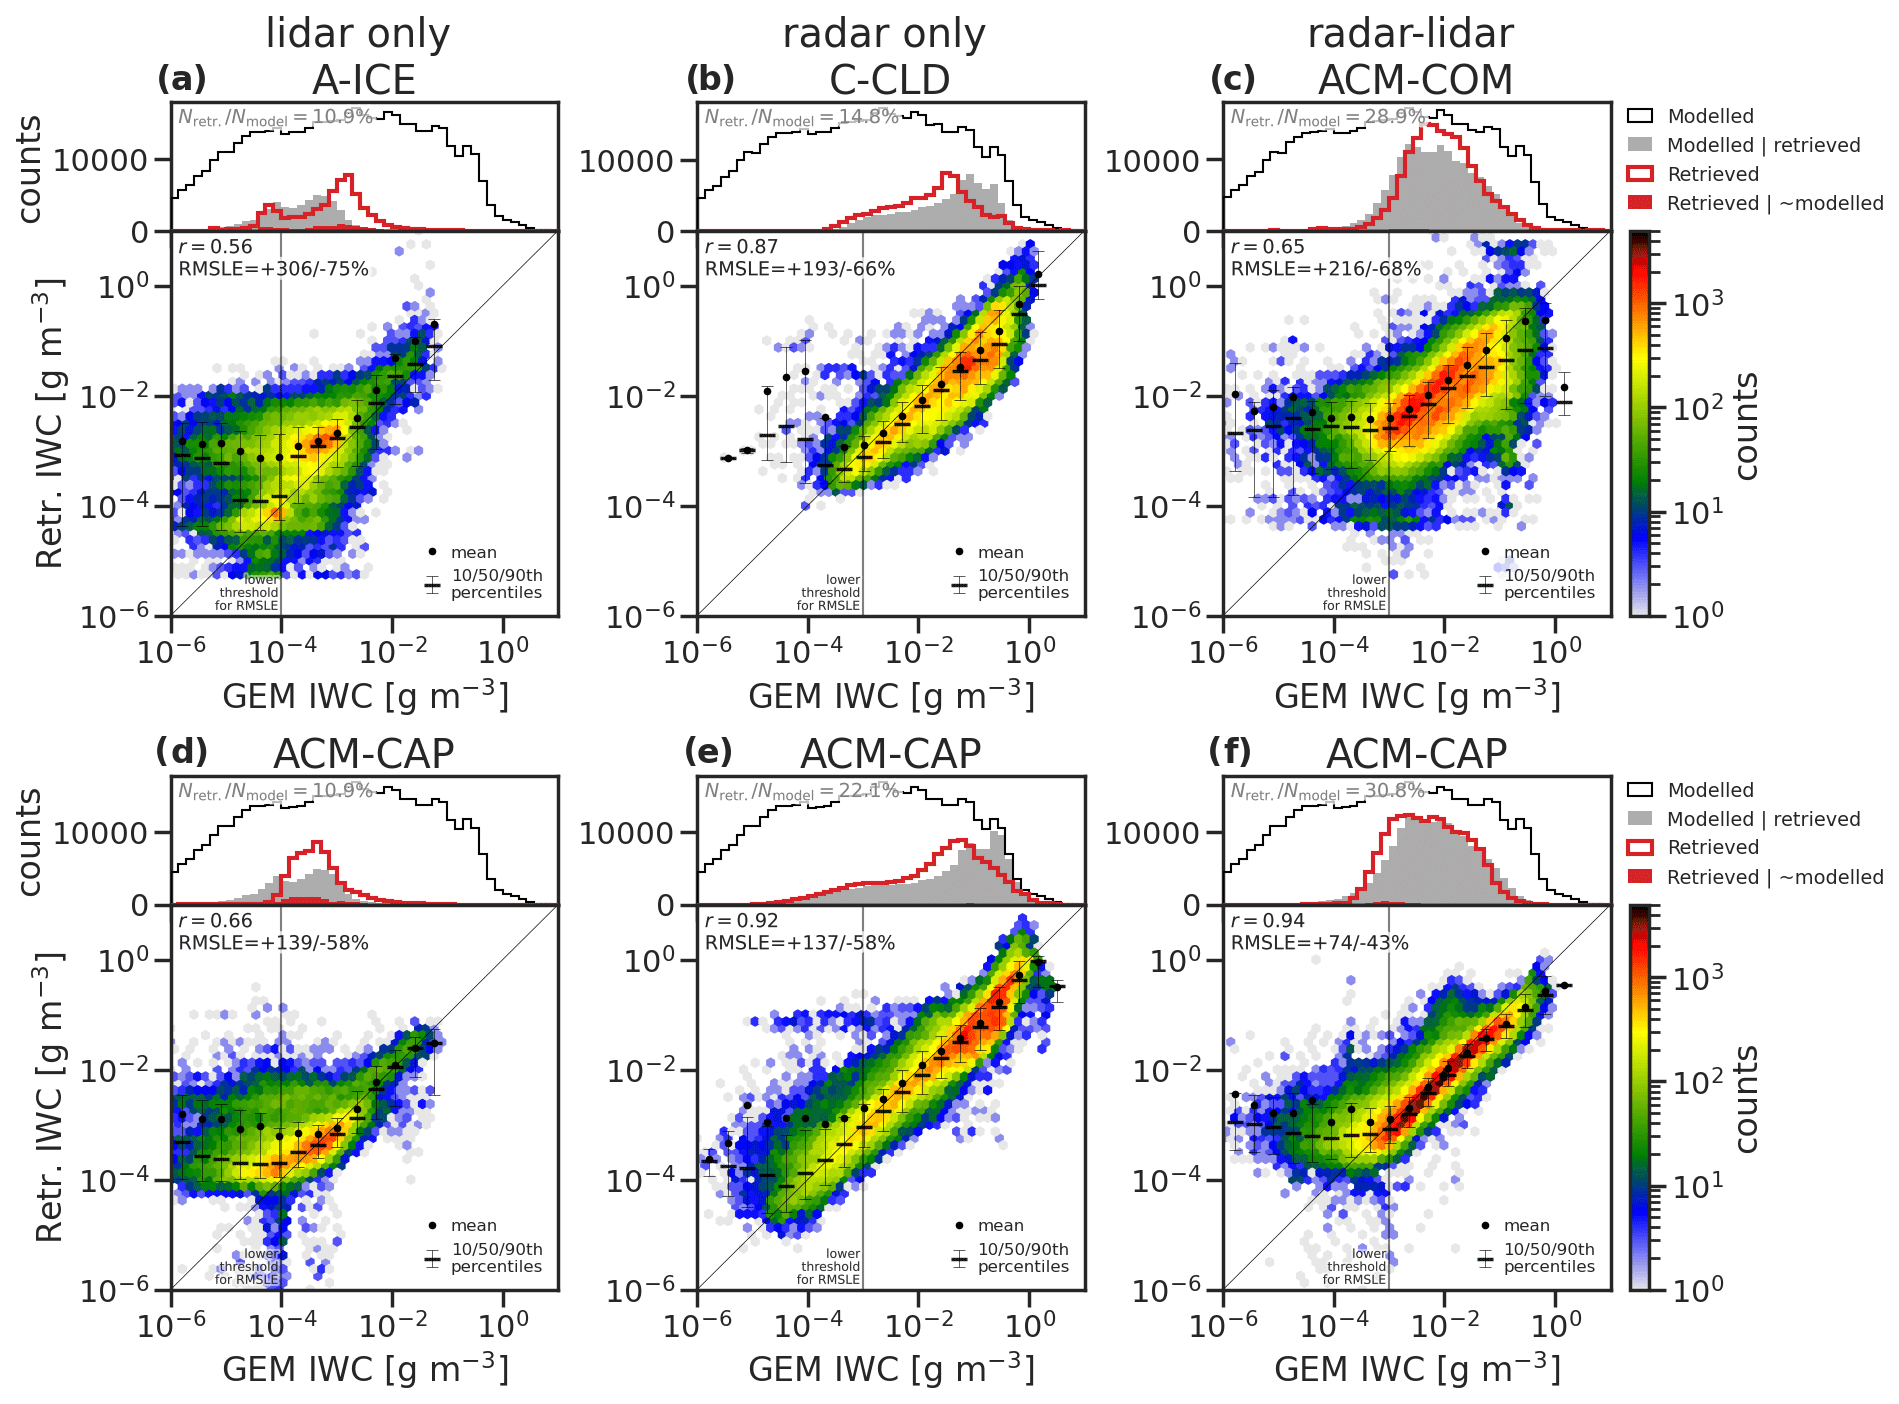
Figure 3As for Fig. 2 but an intercomparison of IWC retrievals from single-instrument and composite products (a–c) and ACM-CAP (d–f), distinguishing between ice clouds and snow that are detected by lidar only (a, d), radar only (b, e), and both radar and lidar (c, f).
Figure 2 presents a statistical evaluation across all three test scenes, comparing all IWP products against GEM. The statistical evaluation plots consist of two panels. In the lower panel of each plot, a joint histogram compares the GEM/CAMS model truth against the retrieved quantity, where a perfect retrieval would follow the diagonal. Annotated at the top left of each panel is the correlation coefficient r and the RMSLE. The frequency of occurrence colour map is log-scaled to exaggerate rare occurrences. The top panel compares the probability density functions of the same quantity. The black lines show all data from the model truth, and the red lines show all of the retrieved data; the grey shading indicates the model truth only in volumes where the retrieval is also defined, while the red shading indicates retrieved values in volumes where none exist in the model truth. For an omniscient observation, the grey shading would match the black line, while in a perfect retrieval the red line would match the grey shading. Annotated at the top left of each panel is the ratio of the number of retrieved volumes to the number of volumes containing the quantity in the model, a measure of how completely the product apprehends the underlying model truth. As was evident in the Halifax scene, M-COP retrievals are not available in all profiles but provide a good estimate in deep and optically thick ice cloud. For IWP between 10 and 1×10⁵ g m−2, the passive retrieval is well correlated with GEM (r=0.77), with an RMSLE of . The capacity of ATLID to detect optically thin ice cloud is evident in A-ICE and ACM-CAP; however, in both products, the retrieved IWP is often over-estimated below around 1 g m−2. For this reason, we take 1 g m−2 as the lower threshold for the calculation of correlation coefficients and error metrics. At higher IWPs, the extinction of ATLID is reflected in A-ICE, which underestimates IWP above around 100 g m−2. In contrast, C-CLD performs well at moderate to high IWPs, with a strong correlation (r=0.91) and an RMSLE of , with the caveat that profiles with the most extreme values, which tend to be subject to multiple scattering and strong attenuation, are not currently retrieved in this product. ACM-COM combines the advantages of A-ICE and C-CLD, while suppressing some extreme values. At low IWP, ACM-COM resembles A-ICE, but C-CLD retrievals compensate for the extinction of ATLID at values greater than 100 g m−2, resulting in a correlation coefficient closer to that of C-CLD and reduced random error. With the benefits of radar–lidar synergy in ice clouds, ACM-CAP is strongly correlated to GEM (r=0.97), with a very strong representation through moderate to high values of IWP, and an RMSLE of . In columns with IWP below the threshold of 1 g m−2, ACM-CAP shares the challenges apparent for A-ICE and ACM-COM, with both being biased high and subject to a large random error. Very low ice water content features that are unresolved by both ATLID and CPR were evident around the edges of the ice clouds in the Halifax scene in Fig. 1; the fraction of profiles that are undetected by EarthCARE was around 16 % across the three test scenes.
Figure 3 compares IWC retrievals from the single-instrument and composite retrievals against ACM-CAP in the distinct lidar-only, synergistic, and radar-only parts of the ice clouds and snow in the three test scenes. The IWC here is the combined mass of all ice, snow, and graupel species from GEM.
In ice clouds detected only by lidar, the distribution of IWC in GEM is bimodal, with peaks at around 10−4 and 10−3 g m−3 (grey shading in the top panel of Fig. 3a). These distinct peaks may relate to smaller ice particle and larger snowflake species within GEM. This bimodality is also resolved by A-ICE, which distinguishes between strong and weak ice cloud targets and where the retrieval of ice from weak targets are subject to along-track averaging (Donovan et al., 2023b). ACM-CAP includes no such distinction between ice species and does not resolve a bimodal distribution of IWC in the lidar-only part of the cloud (red line in top panel of Fig. 3d). ACM-CAP better resolves the upper end of the IWC in this part of the cloud, while A-ICE is biased high. While both A-ICE and ACM-CAP have difficulty retrieving IWC below 10−3 g m−3 as the limits of ATLID signal-to-noise ratio are reached, it is notable that the along-track averaging applied in processing the ATLID measurements enables more accurate retrievals of low IWC down to below 10−5 g m−3 in A-ICE, while ACM-CAP appears to saturate below around 10−4 g m−3.
Where radar and lidar measurements are available, ACM-COM selects the product with the lowest estimated uncertainty in each volume from A-ICE and C-CLD. As a result, the random error in ACM-COM is exaggerated in this region, with frequent values varying over an order of magnitude, where the transition between A-ICE (biased high) and C-CLD (biased low) leads to discontinuities. Exaggerating the differences between products, this is the region where ACM-CAP benefits the most from radar–lidar synergy. ACM-CAP has a correlation coefficient of 0.93 and an RMSLE of , compared with r=0.67 and RMSLE from ACM-COM.
For ice clouds and snow detected only by radar, we compare C-CLD and ACM-CAP. C-CLD covers a narrower range of IWC, as it does not include profiles subject to radar multiple scattering and does not retrieve IWC below 10−4 g m−3. The lower limit may be due to C-CLD completing retrievals only where there is sufficient SNR for a Doppler velocity measurements, which results in a lower limit of CPR radar reflectivity around −21 dBZ. Both C-CLD and ACM-CAP appear to have a slightly low bias in IWC, of a similar degree, which is greatest through the most frequent values of IWC around 0.1 to 1 g m−3. C-CLD and ACM-CAP have high to very high correlation coefficients (0.85 and 0.91, respectively). We note that when stratifying this evaluation by temperature (not shown), the correlation coefficient and RMSLE of C-CLD degrades toward the colder temperature ranges dominated by ice particles rather than snowflakes. This reflects choices made in the development of C-CLD to prioritise the representation of snow (Mroz et al., 2023). ACM-CAP, with the benefit of lidar measurements in ice clouds, has roughly similar correlation coefficients and RMSLE across all temperature ranges.
Previous evaluations of active retrievals of ice and snow have used airborne in situ measurements to quantify the uncertainty in retrieved IWC. Hogan et al. (2006b) estimated a range of in IWC for cloud radar retrievals in ice clouds and snow between −20 ∘C ∘C that were clear of liquid droplets, rising to for ice clouds with ∘C. These uncertainties were based on variations in particle size distribution, although the presence of mixed-phase cloud was observed to lead to substantial biases in retrieved ice water content. Delanoë and Hogan (2008) estimated the error in the retrieved extinction to be around 20 % to 40 % in ice clouds retrieved with radar–lidar synergy and around 50 % in the radar-only region. The simulated test scenes allow us to quantify uncertainties in retrieval of IWC in a way that includes additional uncertainties, both in the simulated instrument noise and based on the cloud properties represented in GEM, such as variations in the density of ice particles, the presence of supercooled liquid, and the possibility of riming in mixed-phase clouds and convective cores, as well as the simulated instrument noise. The retrieval uncertainties presented here are around twice that presented in other studies, which we attribute to resolving these additional sources of uncertainty. Comparing ACM-CAP retrievals in the parts of the scene detected with radar–lidar synergy and radar only, we note a similar doubling of the uncertainty in the radar-only part of the cloud to that estimated in Delanoë and Hogan (2008). An updated evaluation and intercomparison of EarthCARE's single-instrument and synergistic ice cloud and snow retrievals using in-flight data will be made as a part of calibration/validation activities.
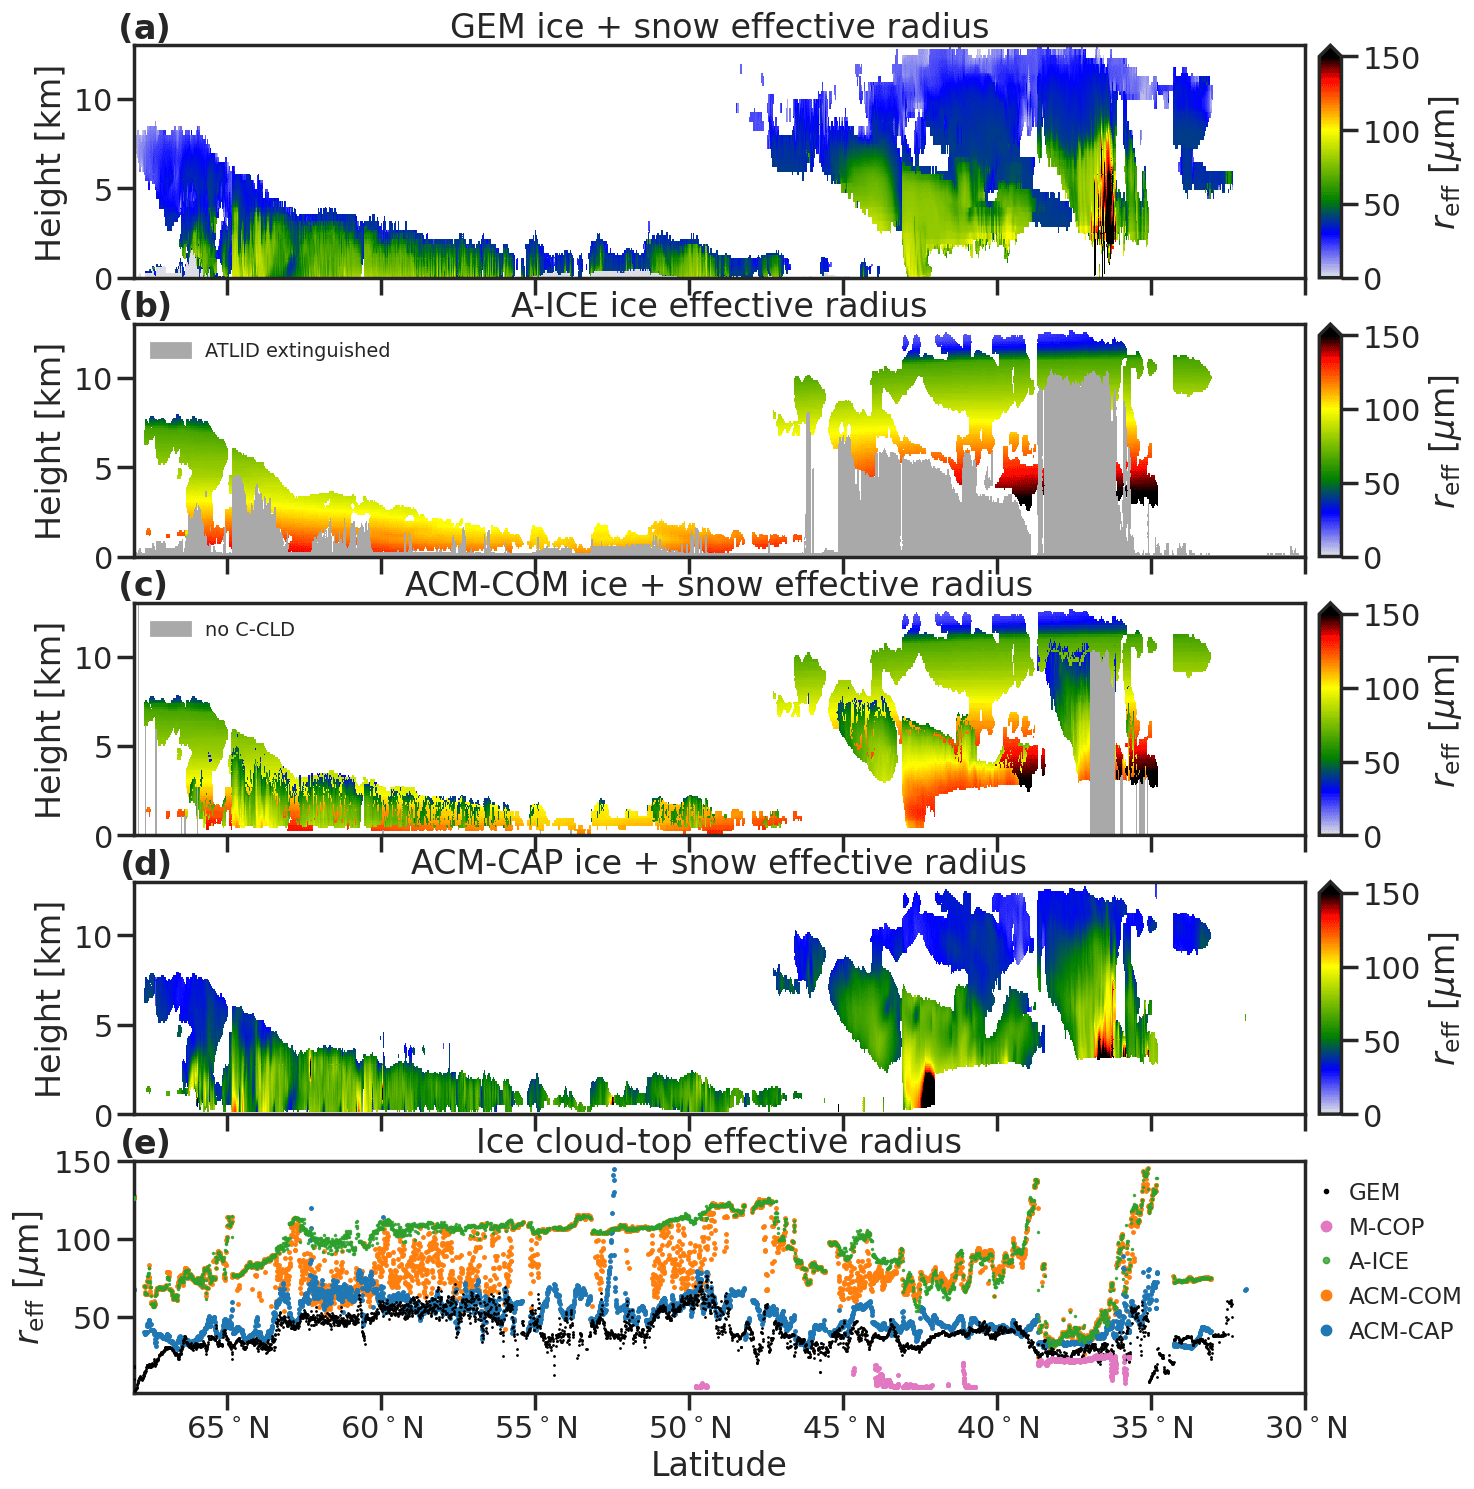
Figure 4Profiles of ice cloud effective radius from (a) GEM, (b) A-ICE, (c) ACM-COM, and (d) ACM-CAP for the Halifax scene. Panel (e) intercompares GEM and retrieved cloud-top effective radius (averaged where optical thickness is less than 1). Shading in panel (b) indicates where A-ICE cannot retrieve the ice cloud effective radius due to the extinction of ATLID signal, and shading in panel (c) indicates where ACM-COM has no information due to C-CLD not retrieving in profiles strongly affected by multiple scattering or attenuation of CPR signal. Note that C-CLD does not report ice cloud effective radius, so that product is not included in this comparison.
The effective radius of ice clouds is not easily constrained by single-instrument retrievals, which must rely on assumptions about the relation between extinction, ice water content, and effective radius. In A-ICE ice cloud effective radius (Fig. 4b) is a function of atmospheric temperature (Donovan et al., 2023b), which is propagated into the lidar-only portion of ACM-COM (Fig. 4c). Although C-CLD does not itself report the ice cloud effective radius, where radar information is available and has a lower retrieval uncertainty, ACM-COM derives the ice cloud effective radius based on the C-CLD retrieval (described in Cole et al., 2023); however, the differences between these two products can lead to large and noisy discontinuities in the composite field, where C-CLD retrievals result in significantly lower ice cloud effective radii. In contrast, the synergistic ACM-CAP retrieval assimilates – at least in parts of the profile – both the radar–lidar ratio and two thermal infrared channels from MSI, which constrain the retrieval of the ice cloud effective radius more smoothly and accurately (Fig. 4d). Some errors in ACM-CAP with respect to GEM are still evident in parts of the Halifax scene, especially in the convective core (37∘ N), where the density of ice particles is poorly constrained, and at the edge of the cold rain feature (42∘ N), where GEM contains freezing rain but AC-TC diagnoses snow. M-COP retrieves cloud properties over a plane-parallel, vertically homogeneous layer. In order to intercompare the cloud top and profile effective radius retrievals, Fig. 4e shows the cloud-top effective radius calculated from A-ICE, ACM-CAP, and GEM by taking the average ice cloud effective radius, where optical depth is less than 1 (note that the intercomparison is mostly insensitive to the choice of threshold). M-COP very accurately retrieves the cloud-top ice cloud effective radius in ice-only deep frontal clouds in the Halifax scene (36–38∘ N) but significantly underestimates those in layered parts of the scene (around 50 and 41–44∘ N), where the lower liquid cloud layers may dominate the radiances. This is a well-known challenge for passive retrievals, and layered cloud scenes can be filtered out using the MSI cloud-top phase (M-CP; Hünerbein et al., 2023a).
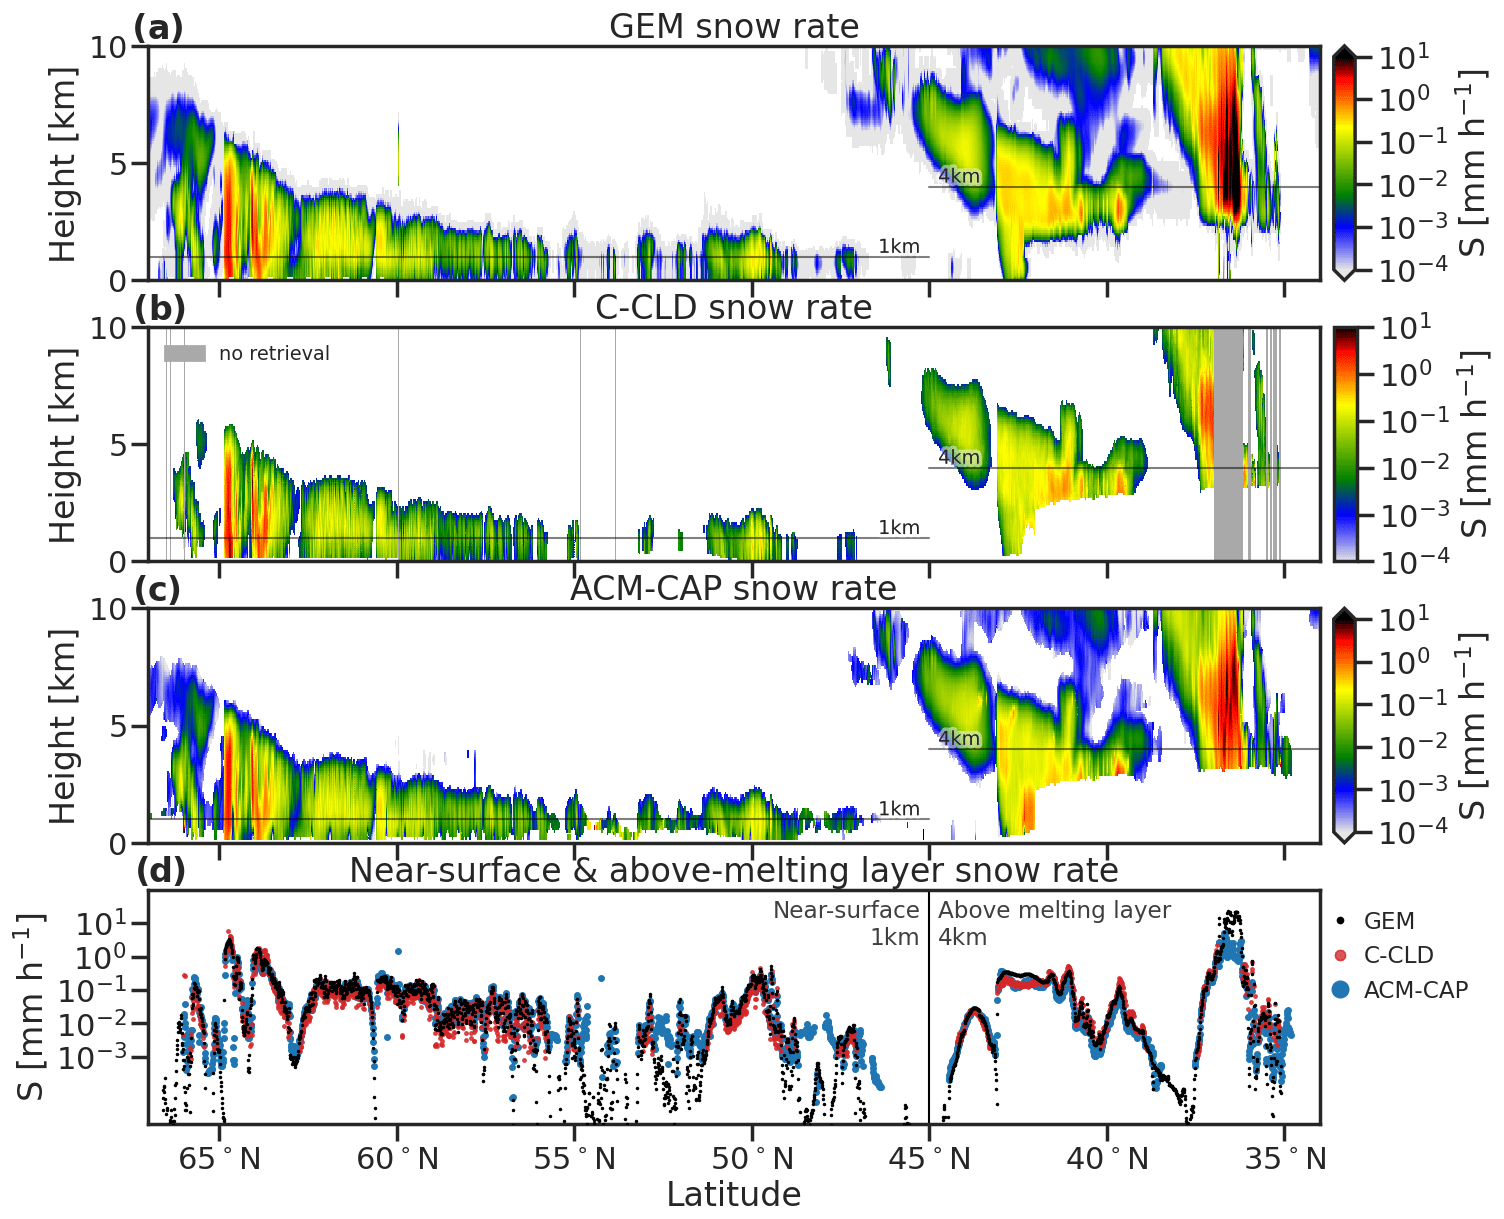
Figure 5Snow rate from (a) GEM, (b) C-CLD, and (c) ACM-CAP and (d) an intercomparison at selected levels over the Halifax scene. Shading in panel (b) indicates where C-CLD does not retrieve profiles where CPR is affected by multiple scattering and/or attenuation.
Estimates of snowfall are limited to retrievals taking advantage of CPR, which is sensitive to the larger snowflakes, penetrates through most profiles of snow, and includes Doppler velocity measurements of snow fall speed. C-CLD and ACM-CAP report snow mass flux, a quantity which combines information about both IWC and the fall speed of snowflakes. Accordingly, snow rates are associated with larger retrieval uncertainties related to both the assumed mass–size relation of ice particles and their terminal velocities. The model truth used here combines the mass flux of all ice species, including graupel; however, in practice, the snow rate is dominated by the unrimed snow species. Figure 5 compares snow rates for the Halifax scene both as vertical profiles and at selected levels. Both retrievals perform well, with slight differences evident in parts of the scene associated with mixed-phase cloud (e.g. 39–45∘ N), where ACM-CAP tends to estimate slightly lower snow rates, perhaps associated with simultaneously retrieving liquid cloud. The clearest difference between the retrievals is that ACM-CAP retrieves very light snow rate up to the edges and tops of clouds, taking advantage of the more sensitive synergistic target classification. Furthermore, C-CLD does not attempt a retrieval of snow rates in profiles strongly affected by multiple scattering and radar attenuation (i.e. the convective cell around 36–37∘ N).
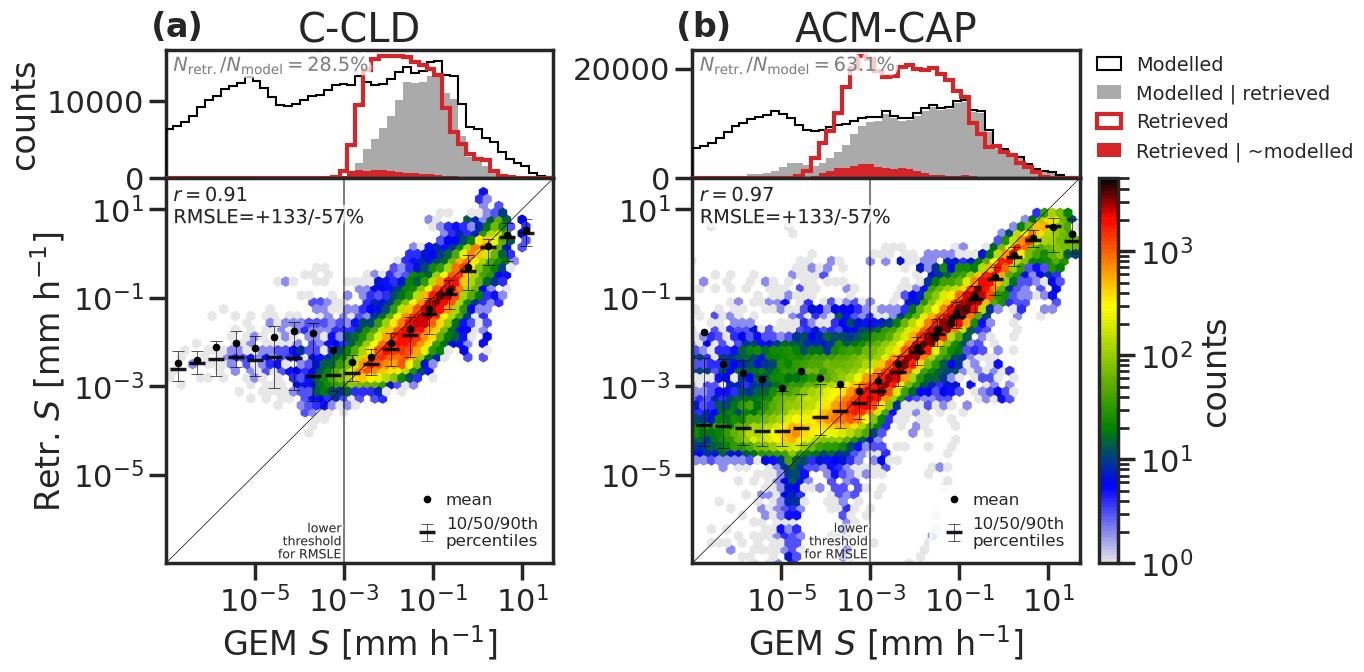
Figure 6As for Fig. 2 but for snow rate (i.e. ice mass flux) from (a) C-CLD and (b) ACM-CAP for all test scenes against that from the combination of all ice species in GEM.
An evaluation of snow rate retrievals across all test scenes is presented in Fig. 6, where the combined mass flux of all ice species from GEM is used. C-CLD and ACM-CAP have similar correlation coefficients with GEM data (r=0.91 and 0.97, respectively) and the same RMSLE of . C-CLD prioritises snow and does not report mass fluxes below around 10−3 mm h−1, so this is taken as the lower threshold for calculating correlation coefficients and error metrics. ACM-CAP retrieves snowfall rates in ice clouds detected only by ATLID or where the CPR Doppler velocity measurements provide only a weak constraint on vertical motion, with reported snow rates down to 10−5 mm h−1. ACM-CAP covers 63 % of volumes containing ice cloud and snow and C-CLD around 28 %; however, we note that the lightest mass fluxes retrieved by ACM-CAP still overestimate those in the ice clouds of GEM, which likely reflects different assumptions about the structure and terminal fall speeds of the smallest ice particles.
ACM-CAP also reports snow rates in the heaviest precipitation; however, in contrast to the integrated quantity (IWP; Fig. 1), there is a tendency to underestimate the heaviest snow rates around 5 mm h−1 and higher due to the onset of attenuation, multiple scattering, and associated uncertainties in the presence of supercooled liquid and the degree of riming, especially in convective cells.
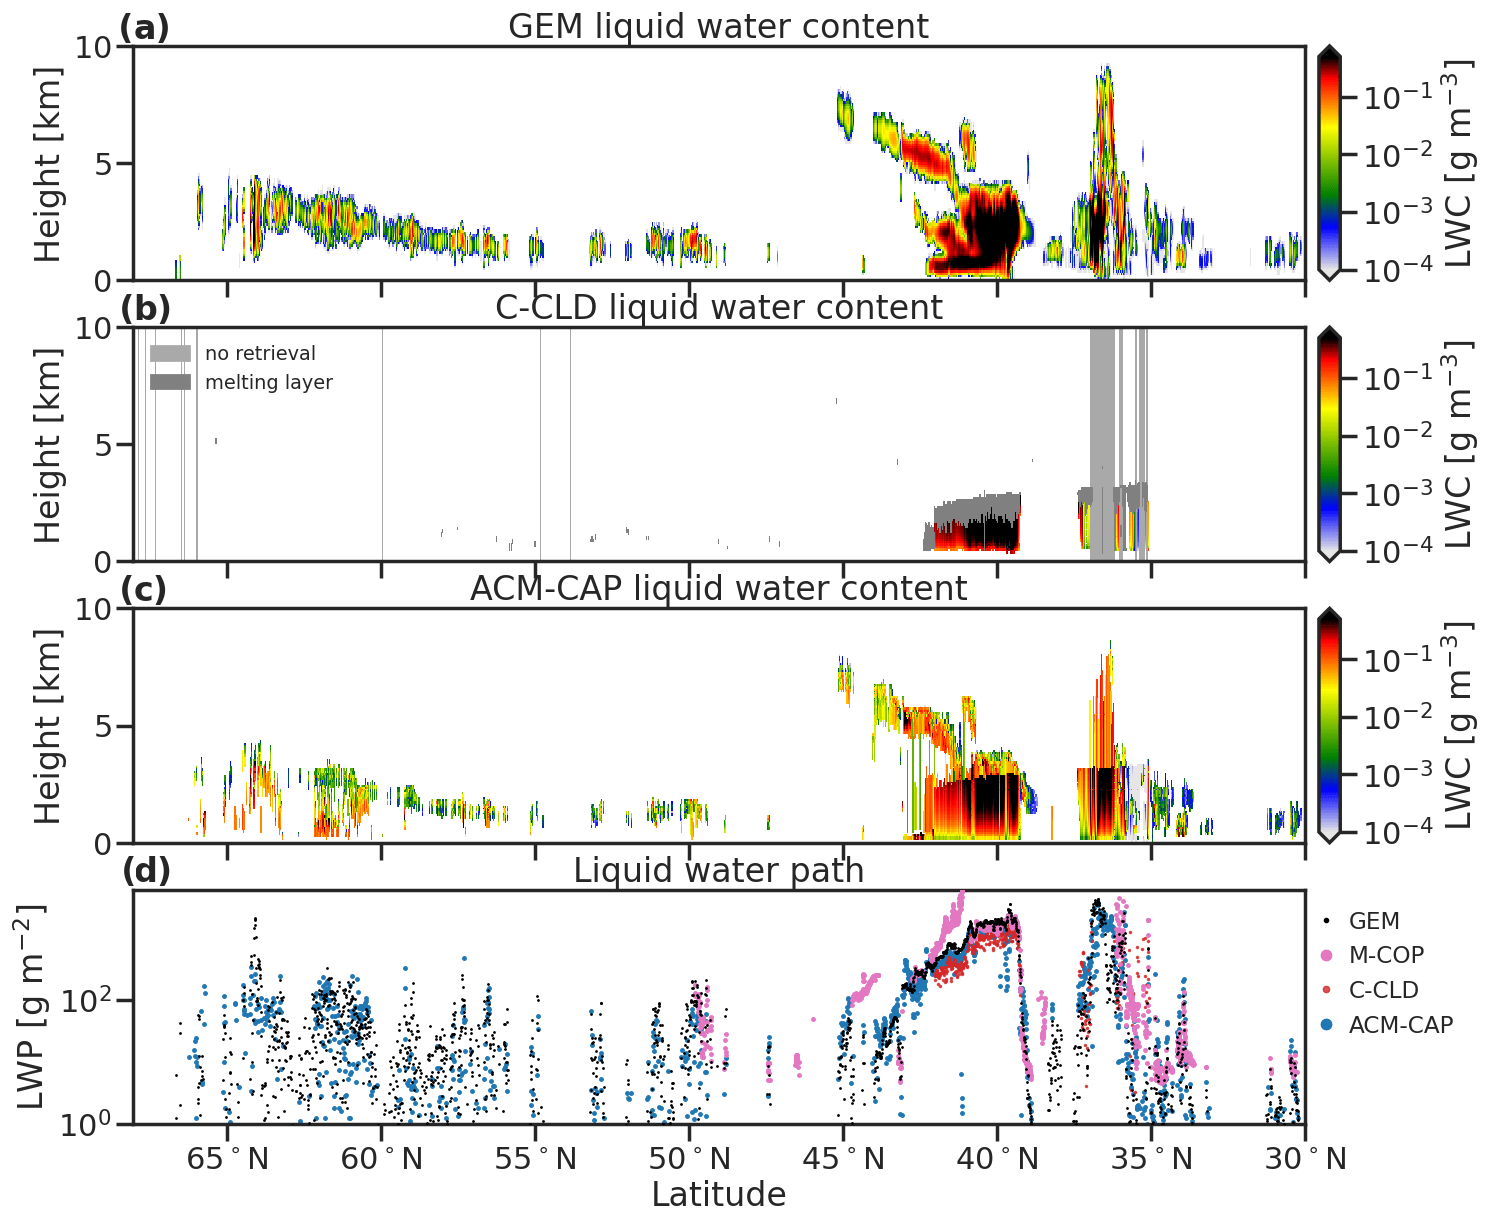
Figure 7Liquid water content profiles for the Halifax scene from (a) GEM, (b) C-CLD, and (c) ACM-CAP. Panel (d) compares the liquid water paths retrieved by C-CLD, ACM-CAP, and M-COP at the nadir pixel. Shading in panel (b) indicates that C-CLD does not retrieve profiles that are strongly affected by multiple scattering and/or extinction in the CPR signal; liquid water is only retrieved where coincident with rain and not the melting layer.
3.2 Liquid cloud
The penetration of the lidar beam into optically thick cloud layers is limited to around three optical depths. The extinction of ATLID occurs over such a shallow layer in liquid clouds that no single-instrument ATLID retrieval of their properties is attempted; however, A-EBD does report ATLID extinction coefficients in volumes identified as liquid cloud. The highly sensitive CPR may be capable of detecting non-precipitating liquid clouds in some cases, and C-CLD includes retrievals of liquid water content (LWC) from non-precipitating liquid clouds (Mroz et al., 2023); however, the simulated test scenes do not include sufficient sampling of stratocumulus regimes to demonstrate in this intercomparison. The intercomparison of liquid cloud retrievals for the Halifax scene (Fig. 7) includes the passive retrieval (M-COP), the radar retrieval (C-CLD), and the synergistic product (ACM-CAP); the representation of liquid cloud in the composite atmosphere of ACM-COM is inherited entirely from C-CLD, so it is not evaluated separately.
C-CLD accounts for the likely presence of liquid cloud water in the presence of rain, using an adiabatic distribution from the melting layer to the lifting condensation level (Mroz et al., 2023); this liquid cloud contributes to CPR's path-integrated attenuation (PIA) measurement, even when the radar reflectivity is dominated by larger precipitating drops. ACM-CAP makes similar assumptions in the presence of rain, rimed snow, and heavy precipitation, where a simplified profile of liquid water content can be constrained by both PIA and MSI visible radiances in daylit volumes (Mason et al., 2023). The inferred likelihood of liquid cloud coincident with rain is evaluated for the three test scenes from a target classification perspective in Sect. 6.2 of Irbah et al. (2023). Comparison with LWC in GEM (Fig. 7a–c) suggests that these are justified, if coarse, assumptions when applied in the stratiform cold rain part of the Halifax scene (40–43∘ N); both C-CLD and ACM-CAP retrieve values of LWC around 0.001 kg m−3 in these areas, which are close to that in GEM.
Elsewhere, only ACM-CAP retrieves liquid cloud, both by synergy with ATLID and by making more aggressive assumptions of liquid cloud through mixed-phase areas. In mixed-phase cloud above this region, ACM-CAP benefits from the detection of liquid cloud by ATLID and the diagnosis of rimed snow by CPR, which are both included in the synergistic target classification (AC-TC); retrieved values of LWC are close to the GEM model truth in the elevated mixed-phase layer but under-estimated near the melting layer. In the deeper precipitation (36–38∘ N), liquid cloud in ACM-CAP is based on the heavy precipitation classes diagnosed, where CPR experiences multiple scattering and strong attenuation. In these latter regions, the GEM model truth shows much more complex spatial distributions of liquid cloud, and the coarse assumptions of retrieving liquid cloud in these contexts are more prone to error; nevertheless, ACM-CAP appears to include liquid cloud in roughly the right amount.
In the sub-tropical boundary layer clouds, ATLID measurements in synergy with MSI visible radiances appear to be a very good constraint on the LWC and liquid water path (LWP) (Fig. 7d); in contrast, the discrimination of mixed-phase clouds within the high-latitude boundary layer clouds is much more challenging, and the ACM-CAP liquid water content is frequently interrupted by gaps in the target classification. Furthermore, the retrieved values of LWP tends to be biased low in this region, presumably both due to the difficulty in attributing ATLID measurements to ice and liquid cloud and due to the lack of MSI solar radiances in this part of the Halifax scene.
The passive MSI retrievals of liquid cloud (M-COP) are limited in their coverage to daylit pixels but exhibit very strong performance in unambiguous cloud scenes; both in mid-latitude (45–50∘ N) and sub-tropical (30–35∘ N) boundary layer clouds and the single-layered or deep frontal clouds (35–41∘ N), the M-COP LWP is very close to the GEM model truth. The exceptions are in very challenging layered clouds scenes (42–45∘ N), where LWP tends to be over-estimated.
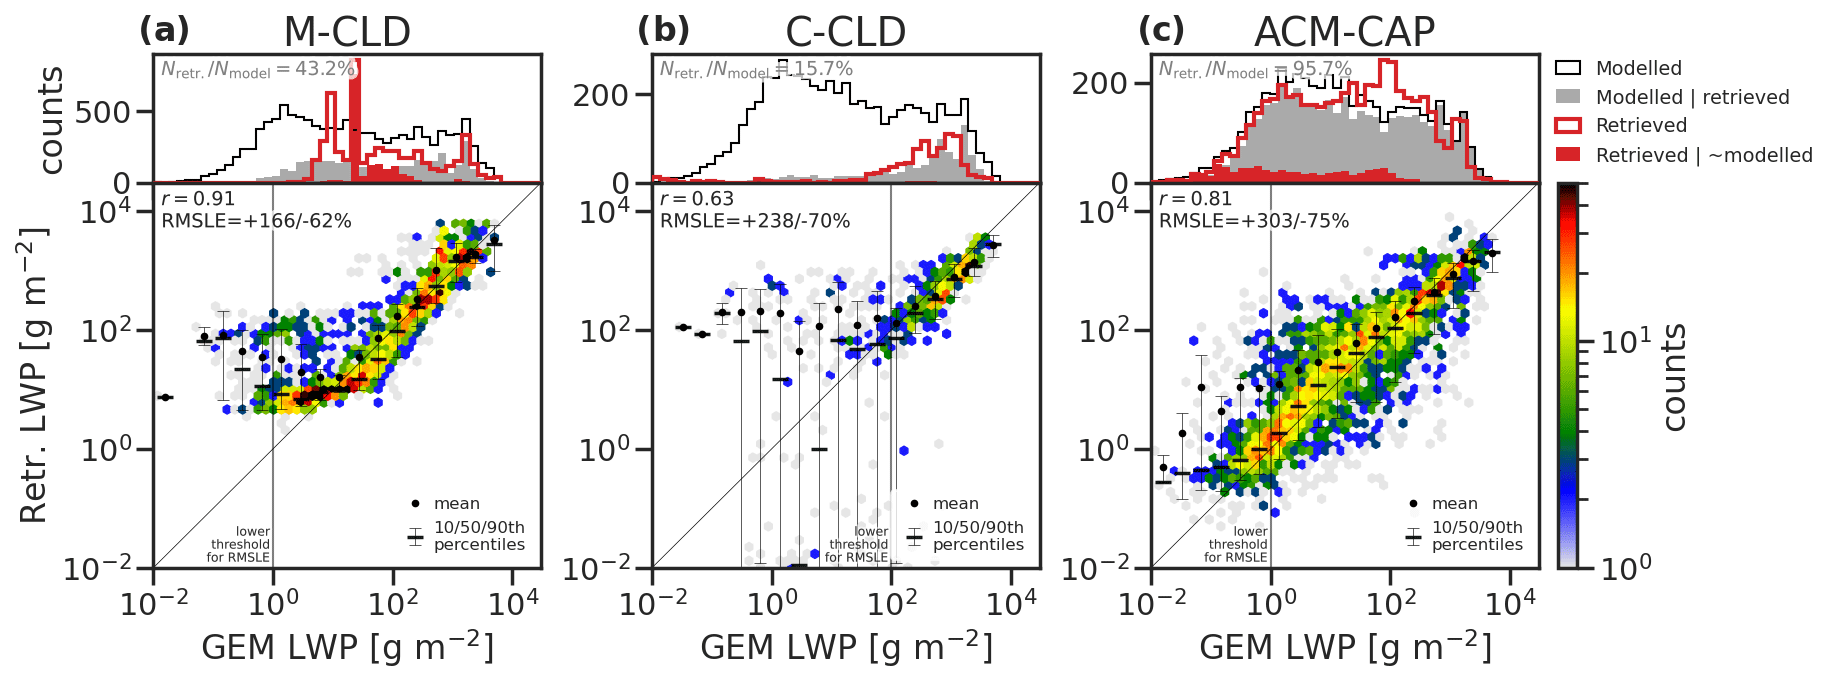
Figure 8The same as Fig. 2, showing retrieved LWP for (a) M-COP, (b) C-CLD, and (c) ACM-CAP across all test scenes.
An evaluation of M-COP, C-CLD, and ACM-CAP retrievals of LWP across all three test scenes is shown in Fig. 8. M-COP retrievals are available in profiles with unambiguous liquid and supercooled liquid cloud layers – and only during daytime – with a coverage of around 43 % of cloudy columns at nadir. Where a retrieval is returned, M-COP is highly correlated with the GEM model truth (r=0.91), with an RMSLE of .
C-CLD liquid cloud retrievals are limited to profiles containing rain, at least in the test scenes in which no significant stratocumulus clouds are sampled. This amounts to around 16 % of columns containing liquid clouds across the three test scenes. The retrieved LWP is close to the GEM LWP at the upper end of the distribution, but the moderate correlation (r=0.54) and large RMSLE () reflect the high degree of spread through moderate values of LWP.
The synergistic ACM-CAP retrievals cover the full range of LWP values in GEM and reports retrievals in 96 % of profiles containing liquid cloud. Considering the weak observational constraints on LWP in many parts of the test scenes, the retrieval is strongly correlated (r=0.81), with an overall RMSLE of values above 1 g m−2 is . The closest correlation and least random error is at the largest values of LWP above 1×10² g m−2, with a slight positive bias through moderate values 1 to 100 g m−2.
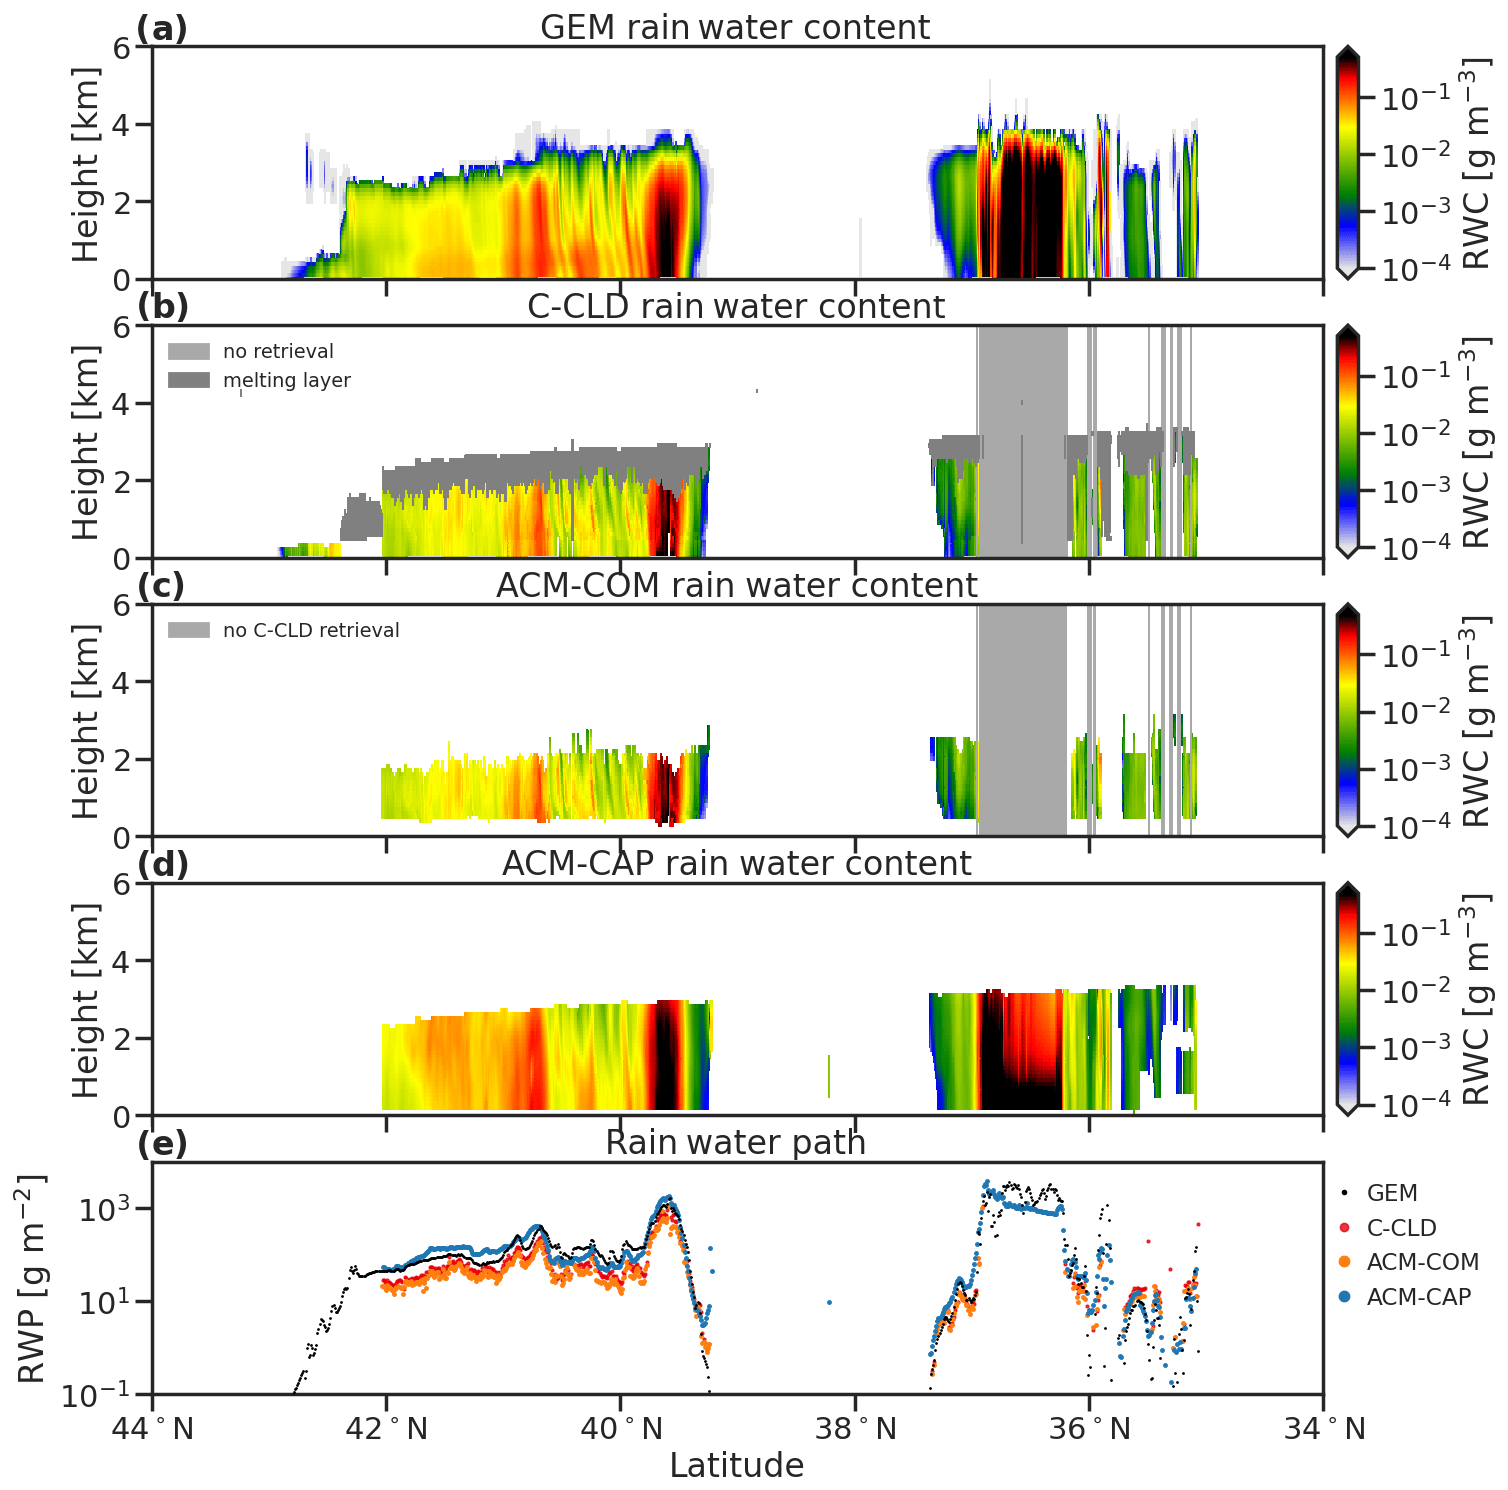
Figure 9Profiles of rain rate from (a) GEM, (b) C-CLD, (c) ACM-COM, and (d) ACM-CAP for the Halifax scene. Rain water paths are compared in panel (e). Shading in panel (b) indicates that C-CLD does not retrieve profiles that are strongly affected by multiple scattering and/or extinction of the CPR signal, and all melting snow is treated separately from the rain retrieval.
3.3 Rain
As with snow, the only rain retrievals are those constrained by CPR measurements, namely C-CLD and ACM-CAP. The greatest differences between the retrievals are their coverage; C-CLD takes the more conservative approach of reporting rain retrievals only where the microphysical properties are well constrained (i.e. not in the melting layer, which is shaded in dark grey in Fig. 9b), or where the signal-to-noise ratio is sufficient to extract a mean Doppler velocity estimate (i.e. radar reflectivity greater than −21 dBZ; Kollias et al., 2023), and where a complete profile of radar measurements can be used (i.e. where multiple scattering and strong radar attenuation are not detected; shaded in lighter grey in Fig. 9b). Since C-CLD does apply a mass flux continuity constraint across the melting layer, a simple interpolation of mass flux and snow and rain water content quantities is provided between the lowest volume containing ice and the highest rain in the C-CLD product (Mroz et al., 2023). In contrast, ACM-CAP prioritises continuity and retrieves rain throughout the melting layer by accounting for discrepancies with increased radar forward model errors at near-freezing temperatures. Where no mean Doppler velocity measurements are available to constrain the raindrop size, ACM-CAP will still retrieve rain based on a priori information – and will report a greater retrieval uncertainty accordingly. To facilitate rain retrievals even in heavy precipitation, radar multiple scattering is included in the ACM-CAP radar forward-model, and rain is retrieved even in conditions of complete extinction of the radar beam.
In terms of rain water content, the values retrieved by C-CLD (and included in ACM-COM) and ACM-CAP are all very close to the GEM model truth, with the exception of ACM-CAP over-estimating rain water content in some of the light stratiform rain (40.5–42∘ N) part of the Halifax scene. The rain water path (RWP; Fig. 9e) shows the importance of resolving the depth of the rain layer; the C-CLD and ACM-COM products tend to under-estimate the total amount of rain water due to not including rain in the melting layer and/or surface clutter.
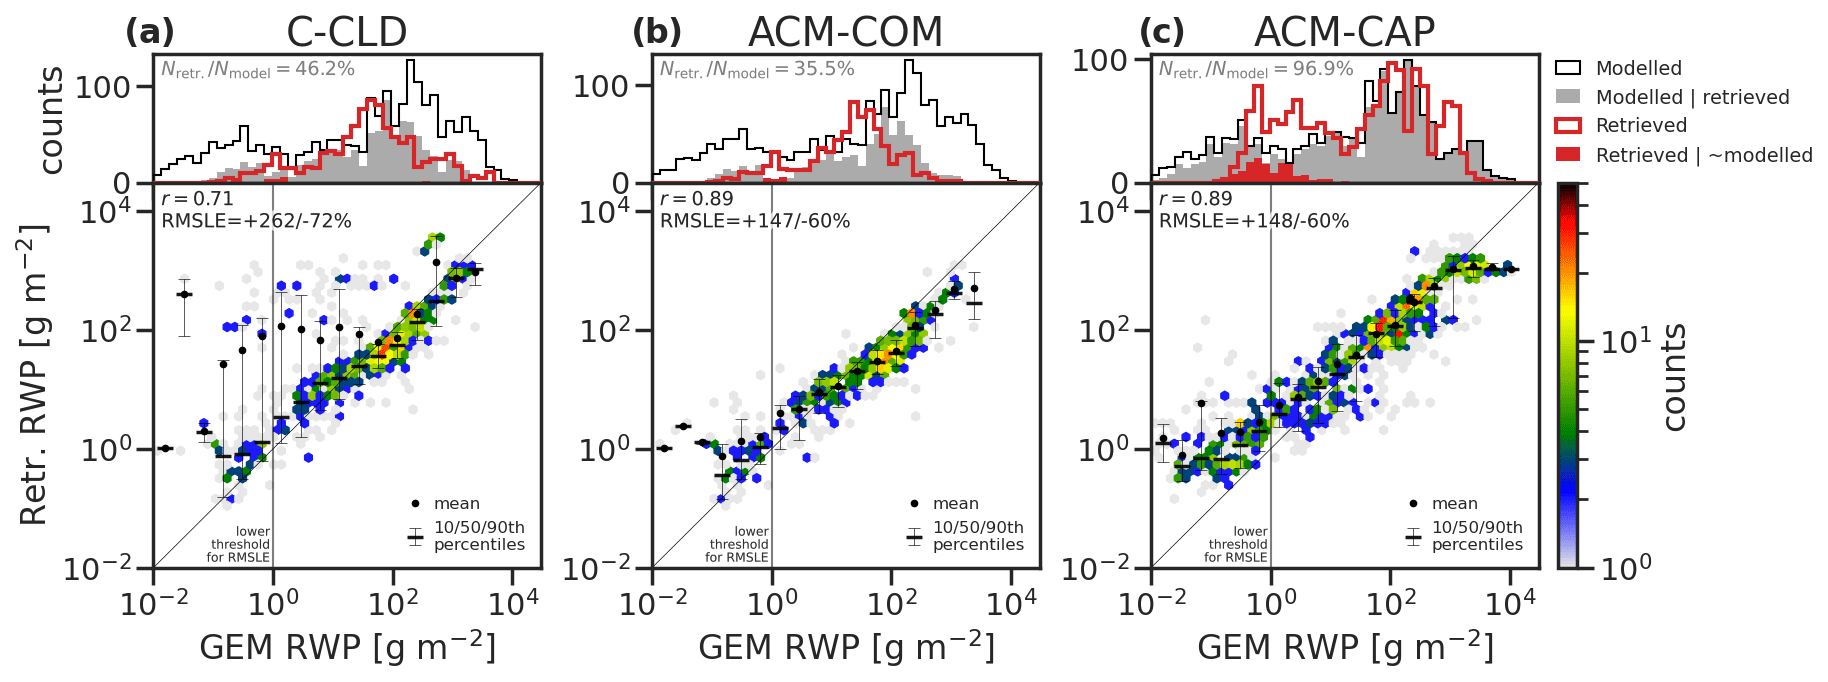
Figure 10The same as Fig. 2, showing RWP retrievals from (a) C-CLD, (b) ACM-COM, and (c) ACM-CAP across all test scenes.
This is further reflected in the evaluation of RWP over the three test scenes (Fig. 10). ACM-CAP and ACM-COM each exhibit high correlations (r=0.89) and moderate RMSLEs (); however, there are significant differences in the degree of coverage of rainy profiles. While ACM-CAP covers around 97 % of rainy volumes, rain in C-CLD does not currently include the melting layer (including virgae) or heavily precipitating profiles, limiting the coverage to 46 % across the three scenes. This is further reduced to 36 % for ACM-COM, where the surface clutter is also not included in the current configuration.
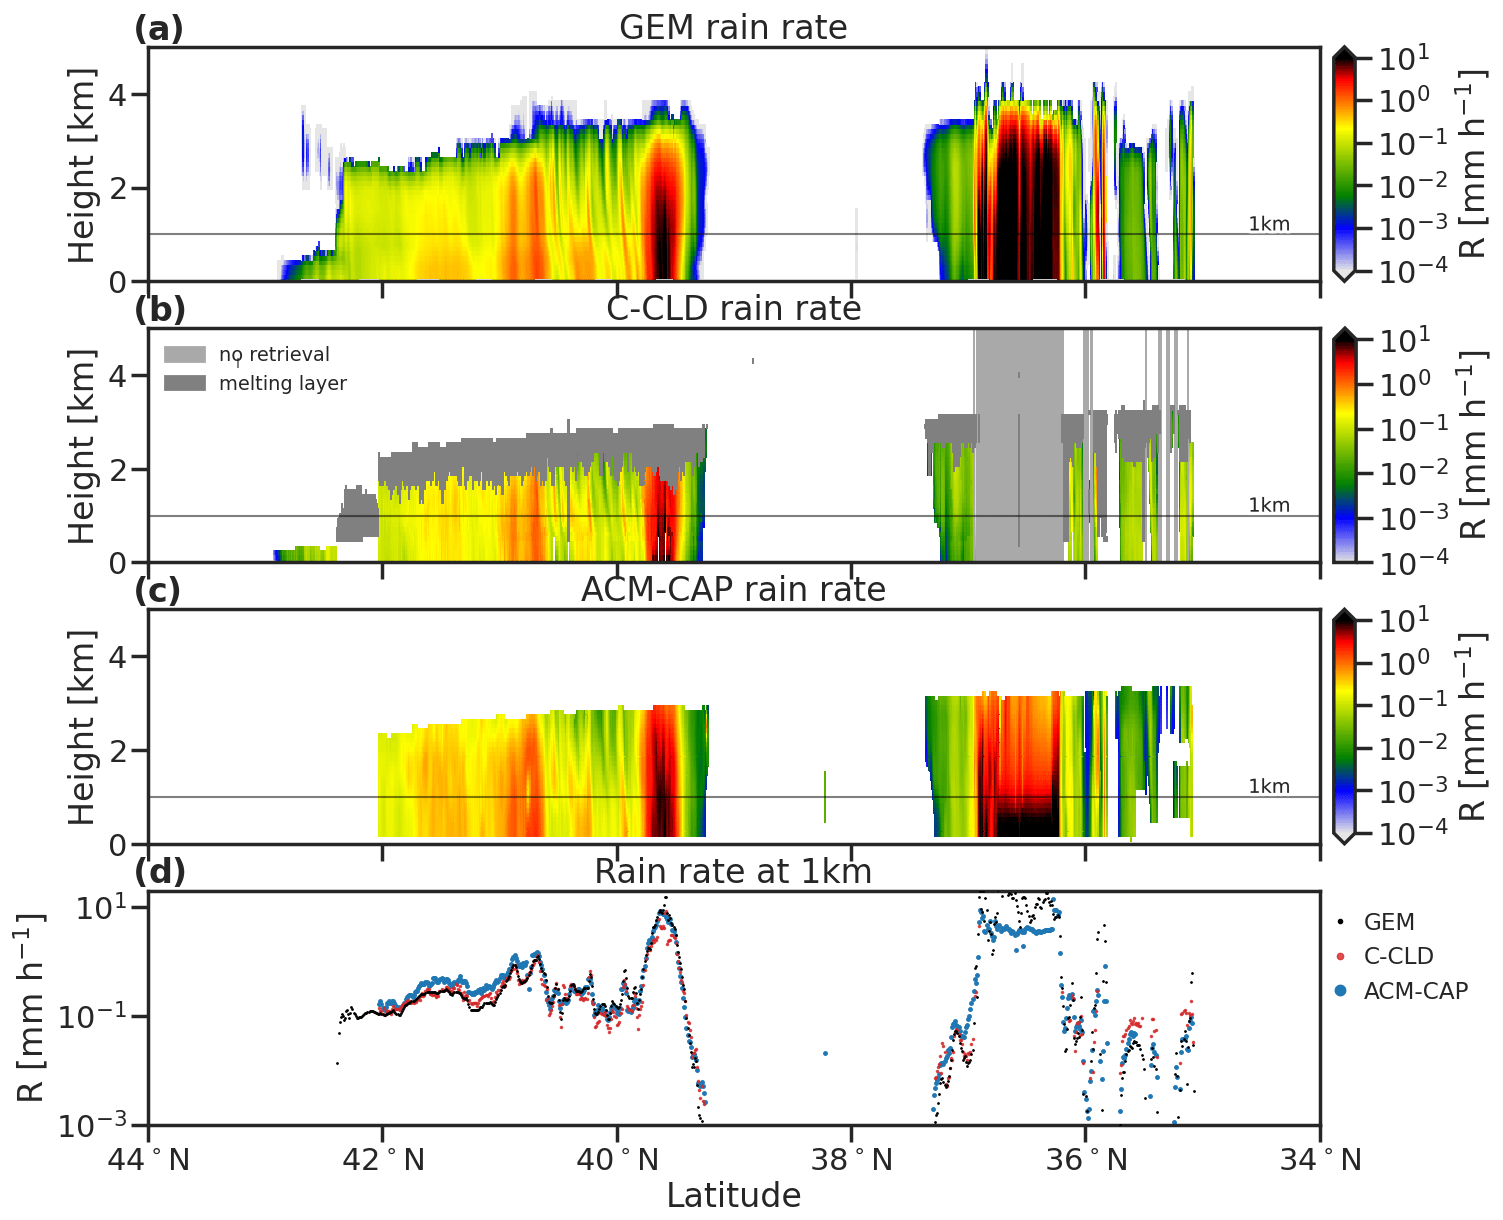
Figure 11GEM (a), C-CLD (b), and ACM-CAP (c) profiles of rain rate for the Halifax scene. A comparison of GEM and retrieved rain rates at 1 km are shown in panel (d). Shading in panel (b) indicates that C-CLD does not retrieve profiles that are strongly affected by multiple scattering and/or extinction of the CPR signal, and all melting snow is treated separately from the rain retrieval.
A quantity of more immediate interest than the rain water path is the rain rate, which includes information about the fall speed of raindrops and hence their size distribution. GEM and retrieved rain rates (R) through a subset of the Halifax scene are shown in Fig. 11. In the stratiform cold rain (39–43∘ N), rain rates are between 0.1 and 1.0 mm h−1, with embedded regions of heavier rain up to 10 mm h−1. In the heaviest convective rain (36–37∘ N), rain rates are between 10 and 30 mm h−1. Where both products report rain rates, they are each very close to the GEM rain rate, with some exceptions. Both products are unable to retrieve rain rates under the temperature inversion (42–42.5∘ N), due to a limitation of the target classification (Irbah et al., 2023), and in the lightest stratiform cold rain (40–42∘ N), some features are not resolved, especially close to the surface. In the heaviest convective precipitation where no radar reflectivity is available and PIA is saturated, ACM-CAP retrieves heavy rain broadly in the right magnitude, but the strong vertical gradient of rain rate is the result of a poorly constrained retrieval. This may be addressed by modifying the a priori assumptions or spatial constraints applied in profiles identified as heavy precipitation (Mason et al., 2023). The rain rate at 1 km (Fig. 11d) shows that both products broadly represent the near-surface rain rate, even resolving narrow precipitation features.
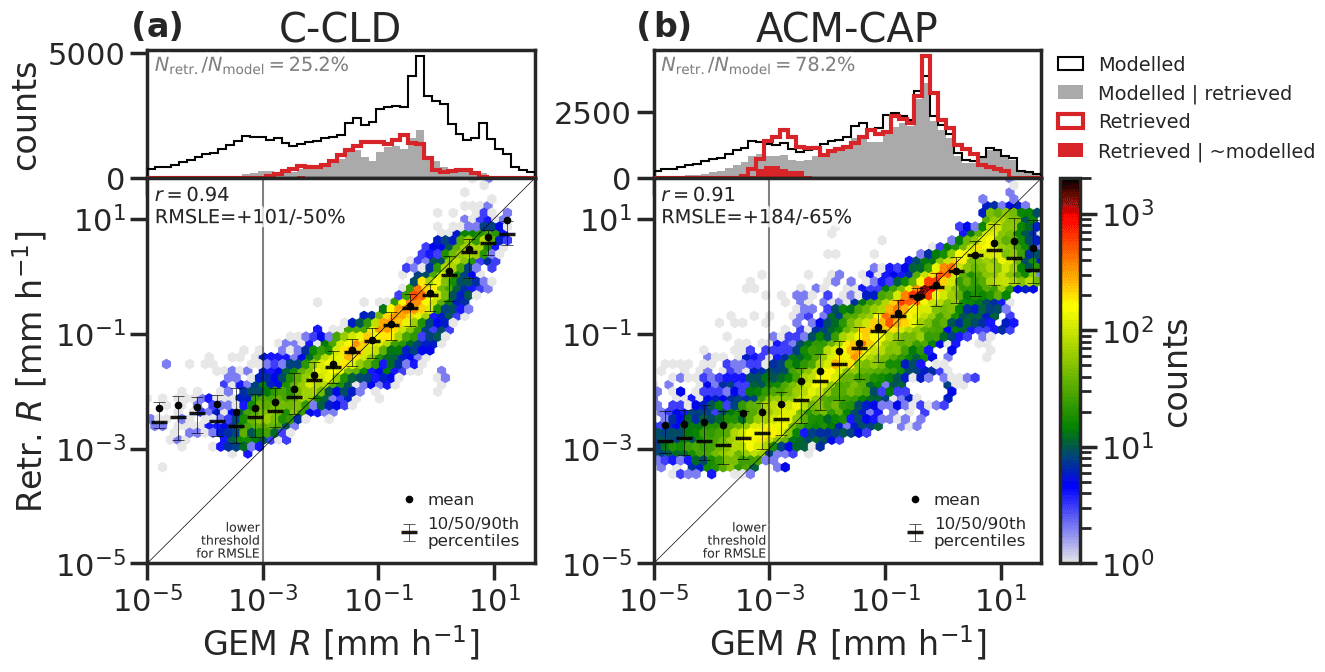
Figure 12The same as Fig. 2, showing rain rate retrievals from (a) C-CLD and (b) ACM-CAP across all test scenes.
An evaluation of rain rate across the three test scenes is shown in Fig. 12. The PDFs of the rain rate (top panels) show that the span of the retrieved values (red line) very closely matches the GEM values that are detected by the instrument (grey shading) and that the coverage of the ACM-CAP retrieval includes almost all moderate to heavy rain rates while missing some of the weakest features (compare Sect. 6.3 of Irbah et al., 2023), covering around 78 % of rainy volumes overall. The more cautious approach of C-CLD to the melting layer reduces coverage at all rain rates, as well as the heaviest rain rates, and covers around 25 % of rainy volumes from the three simulated test scenes. The joint histograms (lower panels) show that C-CLD and ACM-CAP perform very well through moderate to high rain rates (r=0.94 and 0.91, respectively), with a positive bias in ACM-CAP through moderate to low values. Both products tend toward high biases at the lowest rain rates (R<0.01 mm h−1). The larger RMSLE in ACM-CAP (, compared to for C-CLD), may be the result of its less cautious approach to screening out rainy volumes, such as volumes where mean Doppler velocity measurements are unavailable due to measurement noise.
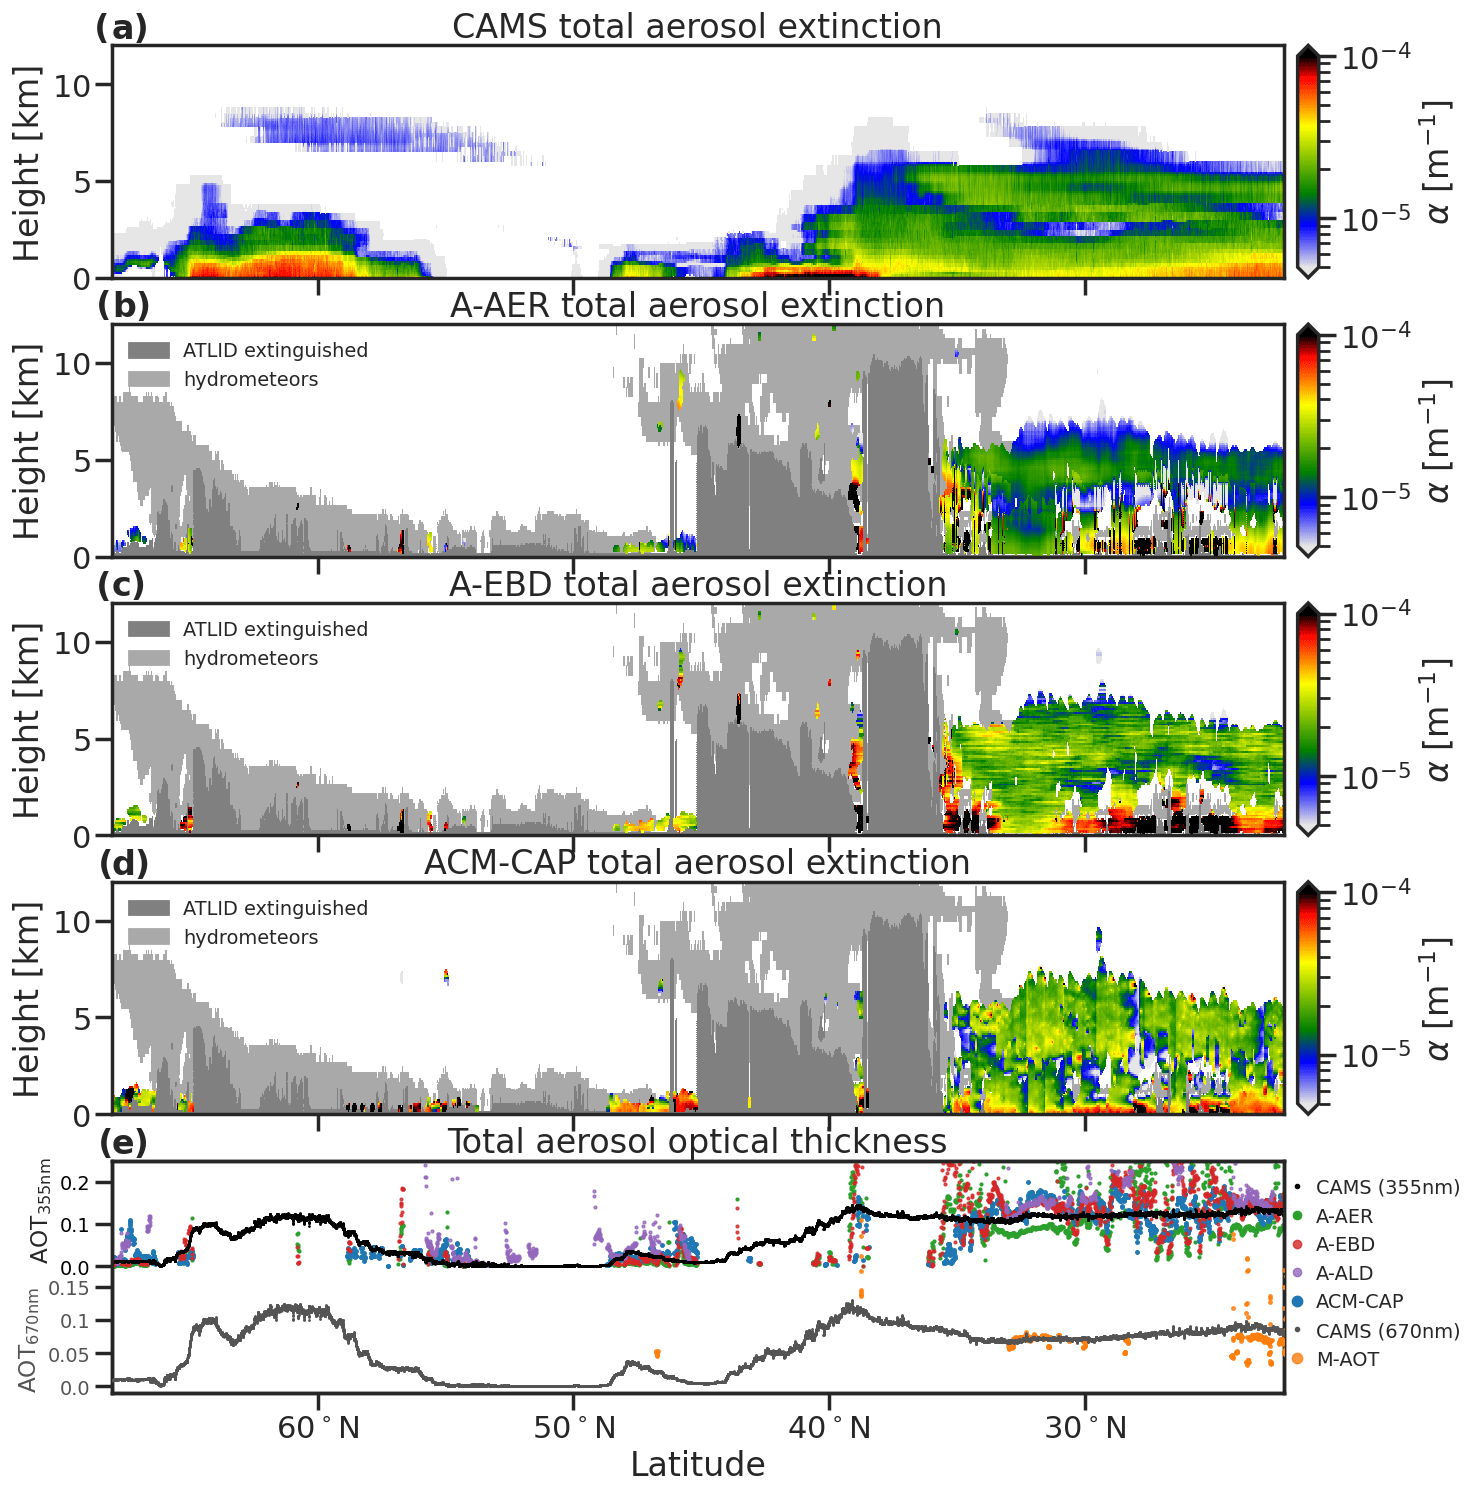
Figure 13Profiles of total aerosol extinction from (a) the CAMS model, (b) A-AER, (c) A-EBD, and (d) ACM-CAP, and (e) the total aerosol optical thickness from A-EBD, A-AER, A-ALD and ACM-CAP (at 355 nm), and the passive M-AOT (at 670 nm), for the Halifax scene. Shading over the A-EBD, A-AER, and ACM-CAP profiles indicates where aerosol retrievals are not available due to the complete extinction of ATLID signal and the presence of other targets.
3.4 Aerosols
We compare two ATLID retrievals of aerosol extinction in A-AER and A-EBD and the aerosol quantities reported by the synergistic retrieval product ACM-CAP, which also includes some information from MSI solar radiances. The layer-wise aerosol product A-ALD also provides two estimates of total AOT, comparing the column total and the sum of identified aerosol layers. The passive MSI aerosol optical thickness retrieval from M-AOT can also be compared against the ATLID products the nadir pixel. Figure 13 shows GEM and retrieved aerosol extinction and total aerosol optical thicknesses (AOT) for the Halifax scene. Note that aerosols can only be detected and retrieved in the absence of other targets and before the ATLID signal is extinguished (shaded in the figure). Clouds obscure much of the aerosols through the mid- and high-latitudes in this scene. In the sub-tropics, a layer of marine aerosols near the surface is interrupted by scattered non-precipitating cumulus clouds and overlaid by a layer of continental pollution Irbah et al. (see target classification in Fig. 9 in 2023). An elevated layer of aerosol over the high-latitude part of the scene is largely unresolved by ATLID.
The profiling retrievals of aerosol extinction (Fig. 13b–d) broadly represent the spatial structure of aerosol extinction in the numerical model through the sub-tropical part of the Halifax scene, with some significant differences due to the different methods used to compensate for the high degree of ATLID measurement noise when sampling aerosols. A-AER uses a 150 km along-track averaging window to increase the signal-to-noise ratio for aerosols, resulting in smooth retrieval very similar to the CAMS model truth – especially in the top-most layer of continental pollution, which is not interrupted by liquid clouds or breaks in the detection of aerosols. A-EBD retains the most small-scale features in the retrieved aerosol extinction, which is especially notable in the vertical dimension. Small-scale local maxima in the ACM-CAP aerosol extinction result in a dappled texture in the retrieved field, likely due to interruptions to the Kalman smoother around the edges of features. The removal of these artefacts will the subject of ongoing work.
Very high values of aerosol extinction near the surface in A-EBD and A-AER (e.g. 25 to 31∘ N and around 34∘ N) are likely related to contamination by liquid clouds embedded in the marine aerosol layer, which will affect both the ATLID Mie and Rayleigh backscatter channels. The number of volumes affected by this is partly reduced by using the A-TC target classification to select for known aerosol classes. The classifications included in the A-AER and A-EBD products include greater frequencies of volumes assigned an aerosol class but where the particulate signal is strongly affected by attenuation. Other challenging volumes, which are also better screened for by A-TC and the synergistic AC-TC classification used by ACM-CAP, occur within the mixed-phase layers between 39 and 44∘ N. ACM-CAP is less strongly affected by the issue of extreme aerosol extinctions below the embedded liquid clouds, possibly due to simultaneously retrieving liquid cloud and aerosols from the synergy of both ATLID backscatter channels and MSI solar radiances and as a consequence of making the extinction-to-backscatter ratio a fixed property of each aerosol class, which over-constrains the aerosol extinction. Small areas of erroneous aerosol retrievals in A-EBD and A-AER are also evident within the optically thin ice clouds (39 to 48∘ N), where the ATLID target classification is based on the along-track averaging of weak lidar signals. In this region, ACM-CAP benefits from using the synergistic target classification (AC-TC), wherein CPR measurements are used to clarify that no aerosol retrieval should be carried out. In the high-latitude parts of the Halifax scene, ACM-CAP retrieves erroneously high near-surface aerosol extinctions, perhaps due to this complementary information not being available because these are nighttime profiles for which MSI solar radiances are not available and are within the CPR surface clutter, where the radar cannot clarify ambiguities in the target classification. By visual inspection, A-AER appears to best represent the smoothly varying features in the large-scale and uninterrupted aerosol fields from the CAMS model; however, in layered and complex scenes, the advantages of a synergistic retrieval are evident.
When interpreting the total AOT in the Halifax scene (Fig. 13e), the challenges discussed above are still evident. In the largely cloud-free parts of the sub-tropical aerosol scene (23–25 and 31–33∘ N), A-EBD, A-ALD, and ACM-CAP are closest to the CAMS model or biased slightly high (up to around 30 % more than the model truth). Conversely, A-AER underestimates the total AOT by as much as 30 %. The passive retrieval (M-AOT) is available in only the completely cloud-free profiles and is very close to total AOT (at 670 nm) from the model truth, especially in largest cloud-free region from 30–33∘ N. Equatorward of 25∘ N, M-AOT exhibits a higher degree of noise, possibly due to small amounts of cloud near the surface. The AOT in this region underestimates that from the model truth by around 15 % to 20 %. Where liquid clouds are embedded in the marine aerosol layer (25–31∘ N), M-AOT cannot retrieve aerosols, and the active retrievals exhibit a much higher degree of noise. Here ACM-CAP stays closest to the model truth (within around 50 %), while both A-AER and A-EBD are biased high by as much as 100 %.
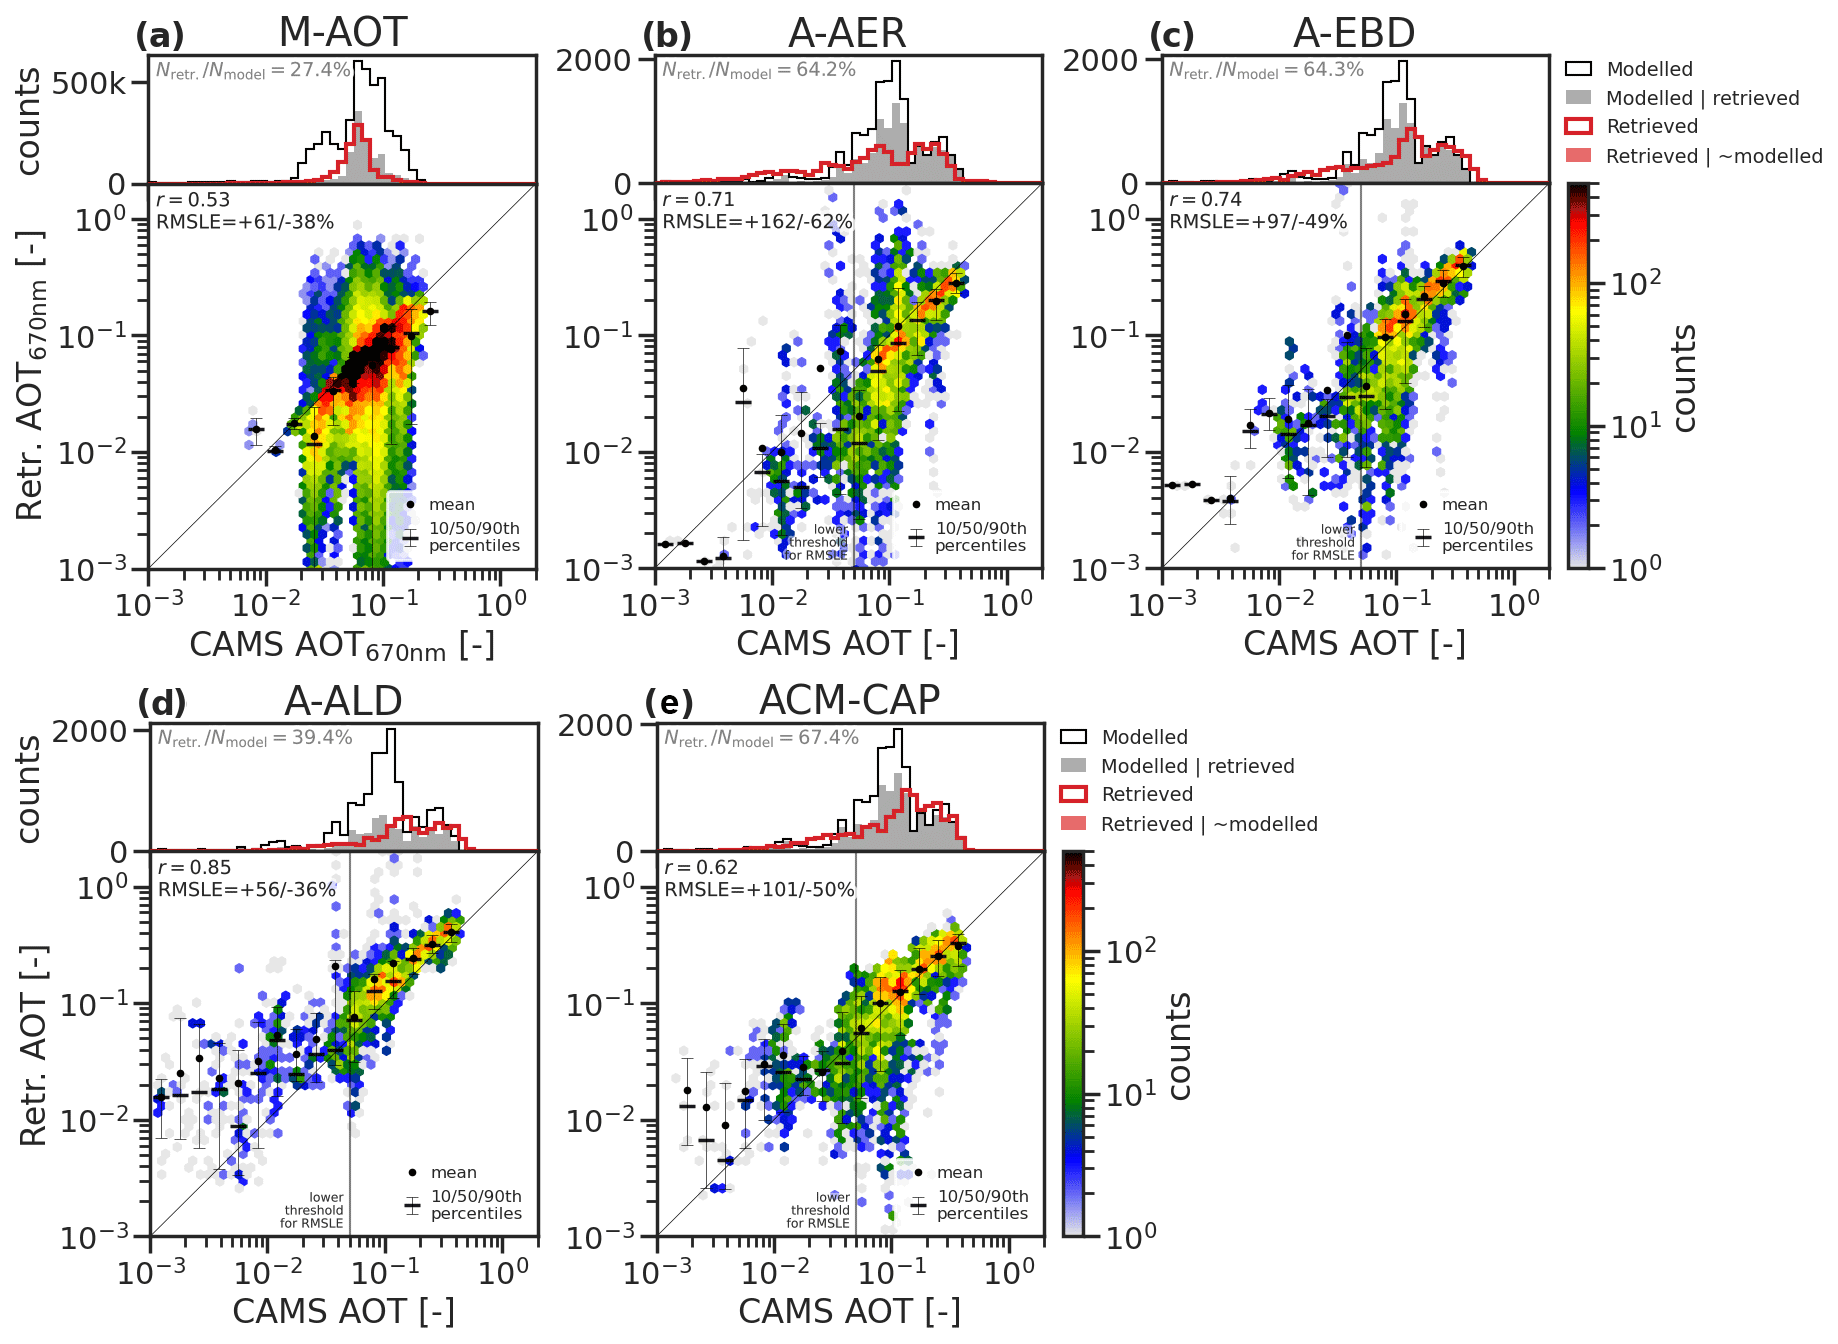
Figure 14The same as Fig. 2, showing retrieved total aerosol optical thickness (AOT) from (a) M-AOT at 670 nm, (b) A-AER, (c) A-EBD, (d) A-ALD, and (e) ACM-CAP at 355 nm across all simulated test scenes. Due to the need to avoid contamination from cloud in aerosol-only profiles and increase the number of samples, the M-AOT evaluation (a) uses data from across the MSI swath rather than just nadir pixels, drastically increasing the number of samples used in this panel.
An evaluation of total AOT across all three test scenes is shown in Fig. 14. In order to increase the sampling of M-AOT, which can only report aerosol retrievals in daylit and cloud-free pixels, the M-AOT evaluation includes off-nadir data across the entire MSI swath. The AOT at 670 nm is used here, which is distinct from the 355 nm AOT used for the lidar retrievals. Across the three test scenes, M-AOT reports aerosol retrievals in 27 % of pixels that contain aerosols in the model truth. Mostly, this is due to profiles obscured by clouds. M-AOT exhibits a moderate correlation coefficient (r=0.53) and relatively low RMSLE (), indicating strong performance in unambiguously cloud-free profiles.
Where there is a strong aerosol signal (AOT > 0.05), A-AER, A-EBD, A-LAY, and ACM-CAP all show joint histograms close to the diagonal, and the correlation coefficients range from moderate (ACM-CAP with r=0.62) to high (A-ALD with r=0.85). A-AER has a higher degree of RMSLE and is biased low, consistent with its high degree of spatial smoothing. A-EBD is more sensitive to small-scale features in ATLID's particulate backscatter measurements, reducing the RMSLE but biasing the AOT high overall. We note that the performance of A-AER and A-EBD are highly sensitive to the aerosol classifications used to select the volumes to be included in the evaluation; when the aerosol classifications provided within each product are used instead of that from A-TC, the random error increases (by around 50 percentage points) and correlation coefficients decrease by 0.1 to 0.2. The total columnar AOT from A-ALD is derived from the extinction profile of A-EBD but applies a more stringent screening for cloudy volumes; this discards a further 25 % of profiles across the three test scenes, improves the correlation coefficient (r=0.85), and roughly halves the RMSLE. ACM-CAP is notably the least biased of the aerosol products, exhibits a moderate correlation coefficient (r=0.62) that may be affected by the dappled artefacts evident in the Halifax scene, and has a similar RMSLE to A-EBD (). The performance of ACM-CAP may be due to the contribution of synergistic observational constraints and fixed values of extinction-to-backscatter ratio. Despite the synergistic target classification helping to screen out ice identified as aerosols, ACM-CAP is the least cautious of the aerosol products and reports aerosols in 67 % of profiles.
The ESA production model for EarthCARE data products includes single-instrument (L2a) and synergistic (L2b) retrievals of cloud, aerosol, and precipitation. This intercomparison provides an illustration of the available L2a and L2b geophysical retrieval products and demonstrates their capabilities and performance as applied to the simulated test scenes that have been produced ahead of the launch of EarthCARE. An overview of the quantities included in each product is provided in Table 2.
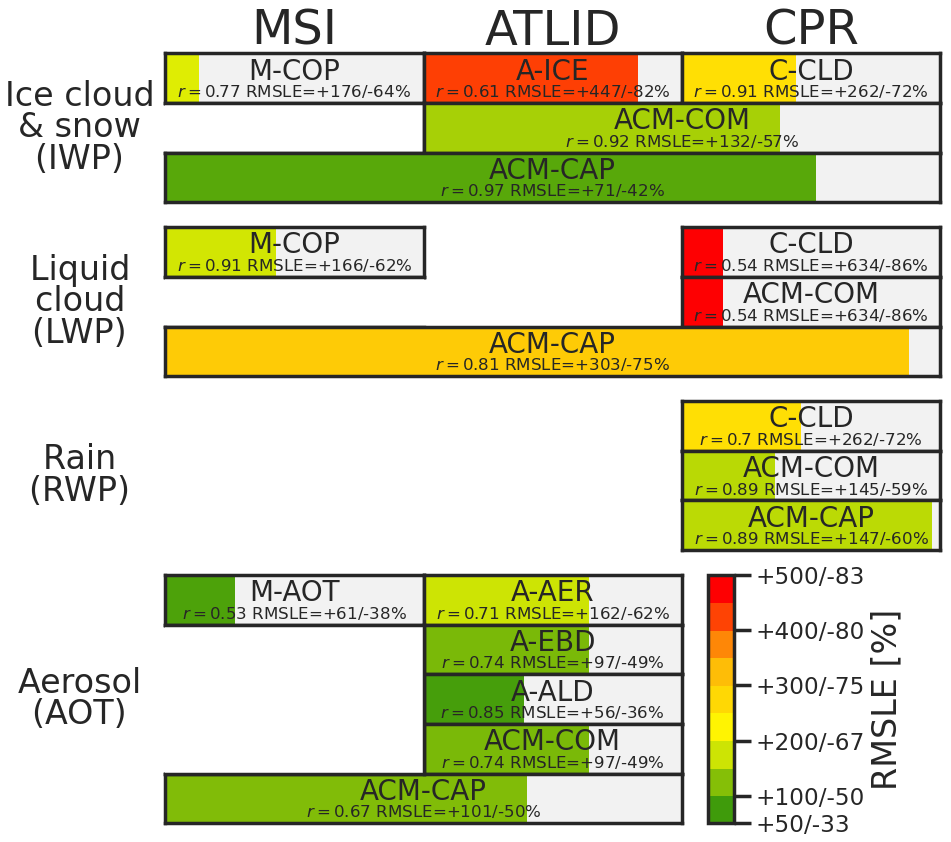
Figure 15A summary of the evaluation of EarthCARE geophysical retrieval products presented in this study, based on the three simulated EarthCARE test scenes. The columns indicate which of the EarthCARE instruments contribute to the retrieval of ice cloud and snow, liquid cloud, rain, and aerosols (with constituents grouped vertically). Each cell is coloured by the RMSLE of the bulk quantities pertaining to each class (i.e. IWP for ice cloud and snow, LWP for liquid cloud, RWP for rain, and AOT for aerosols), relative to the GEM/CAMS model truth, and is filled according to the fraction of profiles in the model truth that are successfully reported in the product.
Figure 15 summarises the results of the evaluation of selected bulk quantities of ice cloud and snow, liquid cloud, rain, and aerosols from the L2 EarthCARE products presented here, including all data from the three test scenes, which covers mid-latitude marine and continental aerosols, shallow and frontal cloud regimes (Halifax), mid-latitude continental aerosols and elevated clouds regimes (Baja), and tropical deep convection and marine aerosols (Hawaii). The products are organised by the EarthCARE instruments that contribute to their retrieval, and each cell is coloured by the RMSLE of the retrieval and filled according to the percentage of profiles that are successfully retrieved.
The benefits of instrument synergy are particularly evident in ice clouds and snow, where the ACM-COM and ACM-CAP products cover optically thin ice clouds detected only by ATLID to rimed snow deep within precipitating clouds. The composite of A-ICE and C-CLD performed nearly as well as the synergistic retrieval ACM-CAP in terms of IWP; however, in the regions detected by both lidar and radar, the transition from A-ICE to C-CLD can manifest as discontinuities in the profiles of retrieved ice water content and ice cloud effective radius. A comparison distinguishing the lidar-only, synergistic, and radar-only parts of the ice cloud and snow confirmed that the greatest differences between ACM-CAP and the composite of single-instrument retrievals (ACM-COM) are in the ice clouds detected by both radar and lidar; however, in both the lidar-only (ice cloud) and radar-only (snow) regions, ACM-CAP also shows somewhat higher correlations and lower RMSLEs. In the lidar-only region, this may reflect the contributions of MSI radiances, as well as the pseudo-synergistic constraint provided by the absence of radar measurements. In the radar-only snow retrievals, there may be some small contribution from MSI solar radiances in optically thick cloud, but we expect the majority of the differences here are due to different microphysical and microwave scattering assumptions in ice, which must ultimately be validated with in-flight EarthCARE data.
In some areas, the synergistic retrieval relies almost entirely on a single instrument, and L2a products perform equally well. For both snow and rain, the C-CLD and ACM-COM retrievals both perform very strongly, with the greatest differences being in the spatial coverage, where ACM-CAP benefits from the synergistic detection of ice clouds and a less cautious approach to screening out volumes at or beyond the limitations of the instruments to detect or constrain retrievals. For retrievals of aerosol optical thickness (AOT), the differences between the ATLID L2a products (A-AER, A-EBD, and A-ALD) and ACM-CAP are largely due to different treatments of measurement noise and the selection of volumes classified as aerosols. With its high degree of spatial smoothing, A-AER is biased low, while A-EBD and A-LAY are biased slightly high. The passive retrieval M-AOT performs very well in terms of random error, with a high degree of caution being taken to screening out cloudy profiles. In some areas, MSI radiances may help to constrain ACM-CAP's aerosol retrievals, while the synergy with CPR may help to resolve ambiguities in the ATLID target classification, especially around weak backscatter targets and as the lidar becomes fully attenuated.
We have also included passive retrievals of ice and liquid cloud (M-COP) at the nadir pixel; in the test scenes, the volume of data for comparison is reduced by the fraction of daylit pixels and, for aerosols, the relative rarity of cloud-free profiles. In terms of IWP and LWP, M-COP performed as well as ACM-CAP in profiles containing single-layered cloud scenes.
The simulated test scenes have proved invaluable as a resource for the development of the L1 and L2 processor algorithms, the evaluation of the L2 products, and testing the processor chain. We stress that the present evaluation has been carried out with three simulated EarthCARE frames, that is, three-eighths of one EarthCARE orbit, which cannot be treated as representative of the global distribution or frequency of occurrence of all cloud and aerosol regimes. Furthermore, we are limited to the representation of the numerical models used to generate the scenes, which, though they have been modified in the generation of the test scenes to produce more realistic microphysical properties (see Sect. 7 of Qu et al., 2023a), will not capture the full range of microphysical properties in the scenes that are sampled. An important principle of the pre-launch algorithm development and evaluation activities using the simulated test scenes was that the retrieval products should not be unduly “tuned” to fit the microphysical assumptions in the test scenes and that the ultimate verification and validation must take place with in-flight EarthCARE data. The respective L2 algorithm description papers (Table 1) justify the choices of physical assumptions based on campaign data or previous satellite missions rather than the test scenes. Algorithm development will continue both prior to EarthCARE's launch and during operations; informed by calibration and validation activities, many of the challenges presented in this evaluation will be improved upon with the benefit of physical insights from in-flight data.
In addition to the direct evaluation of geophysical quantities presented here, the ACM-RT and ACMB-DF processors (Barker et al., 2023) will provide a radiative assessment of the retrievals against the on-board top-of-atmosphere radiative fluxes from the broadband radiometer (BBR). The insights gained from the present direct intercomparison of the composite L2a (ACM-COM) and the synergistic L2b (ACM-CAP) retrievals will help to interpret their performance in terms of broadband radiative closure. Ongoing intercomparison between ESA L2 retrievals products, and with the corresponding Japanese L2 products, will be further leveraged for internal cross-verification of algorithms with in-flight EarthCARE data.
The EarthCARE Level 2 demonstration products from simulated scenes, including all products discussed in this paper, are available from https://doi.org/10.5281/zenodo.7728948 (van Zadelhoff et al., 2023a).
SLM led the L2 intercomparison and the writing of the article. RJH (ACM-CAP), DPD, and GJvZ (A-ICE, A-EBD, and A-AER), UW (A-ALD), PK and BPT (C-CLD), ZQ, JNSC, and HWB (ACM-COM), AH (M-COP), and ND (M-AOT) contributed to aspects of the intercomparison and paper pertaining to their respective data products.
At least one of the (co-)authors is a member of the editorial board of Atmospheric Measurement Techniques and a guest member of the editorial board for the special issue “EarthCARE Level 2 algorithms and data products”. The peer-review process was guided by an independent editor, and the authors also have no other competing interests to declare.
Publisher's note: Copernicus Publications remains neutral with regard to jurisdictional claims made in the text, published maps, institutional affiliations, or any other geographical representation in this paper. While Copernicus Publications makes every effort to include appropriate place names, the final responsibility lies with the authors.
This article is part of the special issue “EarthCARE Level 2 algorithms and data products”. It is not associated with a conference.
We thank Tobias Wehr, Michael Eisinger, and Anthony Illingworth for valuable discussions and are especially grateful to Tobias Wehr for his support of this work over many years as ESA's EarthCARE mission scientist. We acknowledge all those who contributed to the L2 processors included in this study and to the development of the simulated test scenes over many years.
This research has been supported by the European Space Agency (grant nos. 4000134661/21/NL/AD (CARDINAL), 4000112018/14/NL/CT (APRIL), and 4000112030/15/NL/CT (DORSY)).
This paper was edited by Hajime Okamoto and reviewed by two anonymous referees.
Barker, H. W., Cole, J. N. S., Qu, Z., Villefranque, N., and Shephard, M.: Radiative closure assessment of retrieved cloud and aerosol properties for the EarthCARE mission: the ACMB-DF product, Atmos. Meas. Tech., in preparation, 2023. a, b, c
Cole, J. N. S., Barker, H. W., Qu, Z., Villefranque, N., and Shephard, M. W.: Broadband radiative quantities for the EarthCARE mission: the ACM-COM and ACM-RT products, Atmos. Meas. Tech., 16, 4271–4288, https://doi.org/10.5194/amt-16-4271-2023, 2023. a, b, c, d
Delanoë, J. M. E. and Hogan, R. J.: A variational scheme for retrieving ice cloud properties from combined radar, lidar, and infrared radiometer, J. Geophys. Res., 113, D07204, https://doi.org/10.1029/2007JD009000, 2008. a, b
Docter, N., Preusker, R., Filipitsch, F., Kritten, L., Schmidt, F., and Fischer, J.: Aerosol optical depth retrieval from the EarthCARE Multi-Spectral Imager: the M-AOT product, Atmos. Meas. Tech., 16, 3437–3457, https://doi.org/10.5194/amt-16-3437-2023, 2023. a, b, c
Donovan, D. P., Kollias, P., Velázquez Blázquez, A., and van Zadelhoff, G.-J.: The Generation of EarthCARE L1 Test Data sets Using Atmospheric Model Data Sets, EGUsphere [preprint], https://doi.org/10.5194/egusphere-2023-384, 2023a. a, b, c
Donovan, D., van Zadelhoff, G.-J., and Wang, P.: The ATLID L2a profile processor (A-AER, A-EBD, A-TC and A-ICE products), Atmos. Meas. Tech., to be submitted, 2023b. a, b, c, d, e, f, g, h, i, j, k, l
Eisinger, M., Marnas, F., Wallace, K., Kubota, T., Tomiyama, N., Ohno, Y., Tanaka, T., Tomita, E., Wehr, T., and Bernaerts, D.: The EarthCARE Mission: Science Data Processing Chain Overview, EGUsphere [preprint], https://doi.org/10.5194/egusphere-2023-1998, 2023. a, b, c, d
Haarig, M., Hünerbein, A., Wandinger, U., Docter, N., Bley, S., Donovan, D., and van Zadelhoff, G.-J.: Cloud top heights and aerosol columnar properties from combined EarthCARE lidar and imager observations: the AM-CTH and AM-ACD products, EGUsphere [preprint], https://doi.org/10.5194/egusphere-2023-327, 2023. a, b, c
Hogan, R. J., Brooks, M. E., Illingworth, A. J., Donovan, D. P., Tinel, C., Bouniol, D., and Baptista, J. P. V. P.: Independent evaluation of the ability of spaceborne radar and lidar to retrieve the microphysical and radiative properties of ice clouds, J. Atmos. Ocean. Tech., 23, 211–227, https://doi.org/10.1175/JTECH1837.1, 2006a. a
Hogan, R. J., Mittermaier, M. P., and Illingworth, A. J.: The retrieval of ice water content from radar reflectivity factor and temperature and its use in evaluating a mesoscale model, J. Appl. Meteorol. Clim., 45, 301–317, https://doi.org/10.1175/JAM2340.1, 2006b. a
Hünerbein, A., Bley, S., Deneke, H., Meirink, J. F., van Zadelhoff, G.-J., and Walther, A.: Cloud optical and physical properties retrieval from EarthCARE multi-spectral imager: the M-COP products, EGUsphere [preprint], https://doi.org/10.5194/egusphere-2023-305, 2023a. a, b, c, d
Hünerbein, A., Bley, S., Horn, S., Deneke, H., and Walther, A.: Cloud mask algorithm from the EarthCARE Multi-Spectral Imager: the M-CM products, Atmos. Meas. Tech., 16, 2821–2836, https://doi.org/10.5194/amt-16-2821-2023, 2023b. a, b, c
Irbah, A., Delanoë, J., van Zadelhoff, G.-J., Donovan, D. P., Kollias, P., Puigdomènech Treserras, B., Mason, S., Hogan, R. J., and Tatarevic, A.: The classification of atmospheric hydrometeors and aerosols from the EarthCARE radar and lidar: the A-TC, C-TC and AC-TC products, Atmos. Meas. Tech., 16, 2795–2820, https://doi.org/10.5194/amt-16-2795-2023, 2023. a, b, c, d, e, f, g, h, i, j
Kollias, P., Puidgomènech Treserras, B., Battaglia, A., Borque, P. C., and Tatarevic, A.: Processing reflectivity and Doppler velocity from EarthCARE's cloud-profiling radar: the C-FMR, C-CD and C-APC products, Atmos. Meas. Tech., 16, 1901–1914, https://doi.org/10.5194/amt-16-1901-2023, 2023. a, b, c, d, e
Mason, S. L., Hogan, R. J., Bozzo, A., and Pounder, N. L.: A unified synergistic retrieval of clouds, aerosols, and precipitation from EarthCARE: the ACM-CAP product, Atmos. Meas. Tech., 16, 3459–3486, https://doi.org/10.5194/amt-16-3459-2023, 2023. a, b, c, d, e, f, g, h
Mroz, K., Treserras, B. P., Battaglia, A., Kollias, P., Tatarevic, A., and Tridon, F.: Cloud and precipitation microphysical retrievals from the EarthCARE Cloud Profiling Radar: the C-CLD product, Atmos. Meas. Tech., 16, 2865–2888, https://doi.org/10.5194/amt-16-2865-2023, 2023. a, b, c, d, e, f, g, h, i
Qu, Z., Barker, H. W., Cole, J. N. S., and Shephard, M. W.: Across-track extension of retrieved cloud and aerosol properties for the EarthCARE mission: the ACMB-3D product, Atmos. Meas. Tech., 16, 2319–2331, https://doi.org/10.5194/amt-16-2319-2023, 2023a. a, b
Qu, Z., Donovan, D. P., Barker, H. W., Cole, J. N. S., Shephard, M. W., and Huijnen, V.: Numerical model generation of test frames for pre-launch studies of EarthCARE's retrieval algorithms and data management system, Atmos. Meas. Tech., 16, 4927–4946, https://doi.org/10.5194/amt-16-4927-2023, 2023b. a, b
van Zadelhoff, G.-J., Barker, H. W., Baudrez, E., Bley, S., Clerbaux, N., Cole, J. N. S., de Kloe, J., Docter, N., Domenech, C., Donovan, D. P., Dufresne, J.-L., Eisinger, M., Fischer, J., García-Marañón, R., Haarig, M., Hogan, R. J., Hünerbein, A., Kollias, P., Koopman, R., Madenach, N., Mason, S. L., Preusker, R., Puigdomènech Treserras, B., Qu, Z., Ruiz-Saldaña, M., Shephard, M., Velázquez-Blazquez, A., Villefranque, N., Wandinger, U., Wang, P., and Wehr, T.: EarthCARE level-2 demonstration products from simulated scenes, Version 10.10, Zenodo [data set], https://doi.org/10.5281/zenodo.7728948, 2023a. a
van Zadelhoff, G.-J., Donovan, D. P., and Wang, P.: Detection of aerosol and cloud features for the EarthCARE atmospheric lidar (ATLID): the ATLID FeatureMask (A-FM) product, Atmos. Meas. Tech., 16, 3631–3651, https://doi.org/10.5194/amt-16-3631-2023, 2023b. a, b
Wandinger, U., Haarig, M., Baars, H., Donovan, D., and van Zadelhoff, G.-J.: Cloud top heights and aerosol layer properties from EarthCARE lidar observations: the A-CTH and A-ALD products, Atmos. Meas. Tech., 16, 4031–4052, https://doi.org/10.5194/amt-16-4031-2023, 2023. a, b, c, d
Wehr, T., Kubota, T., Tzeremes, G., Wallace, K., Nakatsuka, H., Ohno, Y., Koopman, R., Rusli, S., Kikuchi, M., Eisinger, M., Tanaka, T., Taga, M., Deghaye, P., Tomita, E., and Bernaerts, D.: The EarthCARE mission – science and system overview, Atmos. Meas. Tech., 16, 3581–3608, https://doi.org/10.5194/amt-16-3581-2023, 2023. a, b, c, d