the Creative Commons Attribution 4.0 License.
the Creative Commons Attribution 4.0 License.
Diurnal variations of NO2 tropospheric vertical column density over the Seoul metropolitan area from the Geostationary Environment Monitoring Spectrometer (GEMS): seasonal differences and the influence of the a priori NO2 profile
Seunghwan Seo
Kyoung-Min Kim
Andreas Richter
Kezia Lange
John P. Burrows
Junsung Park
Hyunkee Hong
Hanlim Lee
Ukkyo Jeong
Jung-Hun Woo
The Geostationary Environment Monitoring Spectrometer (GEMS), launched in 2020, provides both temporally and spatially continuous air quality data from geostationary Earth orbit (GEO). This study first investigates the seasonal variations and diurnal behavior of nitrogen dioxide (NO2) tropospheric vertical column densities (TropVCDs) over the Seoul metropolitan area (SMA) using GEMS data, retrieved by the IUP-UB algorithm. We find that the magnitude of the NO2 TropVCDs and their diurnal behavior have significant seasonal dependences. In January, the highest NO2 TropVCD values in the range 27.5–28.9×10¹⁵ during the four seasons were observed at 15:00 local time (LT) and NO2 TropVCD increases from the first retrieved values at 10:00 LT. On the other hand, we find the lowest values (7.4–8.8×10¹⁵ ) are at ∼14:00 LT in July. The VCD values in July increased up to 10:00 LT and then decreased until 14:00 LT but then began to increase again. These different diurnal behaviors of the TropVCDs in the different seasons reflect the differences in photochemical and meteorological conditions as well as the emissions of NOx. Photochemical transformations are typically more rapid in July and slower in January. The absolute values and diurnal behavior of NO2 TropVCDs are significantly influenced by the wind speed, except in July. Moderate (wind speed ≥3 m s−1) or strong wind (wind speed >5 m s−1) reduced the magnitude of the diurnal behavior in January, implying that the NO2 plumes were transported downwind. Finally, we compared the retrieved NO2 TropVCDs by using different a priori NO2 data simulated by TM5 and WRF-Chem, calculated using the most recent emission inventories. Although simulated VCDs from WRF-Chem and TM5 show differences of up to a factor 2.75, retrieved NO2 TropVCDs using each a priori data have almost identical values and diurnal behaviors, except in July. Notably, the diurnal behavior of the retrieved NO2 TropVCDs is independent of that from the two chemical transport models, indicating that observations of slant column densities are the dominant factor in determining the diurnal behavior of NO2 TropVCDs. Changes in the model horizontal resolution and volatile organic compound (VOC) emission inventory do not significantly affect the retrieved NO2 TropVCDs in this study. However, when the a priori NO2 vertical profile was fixed as the values at 13:45 LT, the diurnal patterns of NO2 TropVCDs showed significant changes, with differences of up to −18.3 %.
- Article
(3905 KB) - Full-text XML
- BibTeX
- EndNote
Nitrogen dioxide (NO2) is one of the most important trace gases in the photochemical mechanisms, which determine the tropospheric distributions of ozone and secondary aerosol (Milford et al., 1989). Beginning with the launch of the passive remote sensing instrument GOME on ESA ERS-2 (Burrows et al., 1999) in 1995; followed by SCIAMACHY on ESA Envisat in 2002 (Burrows et al., 1995; Bovensmann et al., 1999); OMI on NASA AURA (Levelt et al., 2006); GOME-2 on ESA EUMETSAT MetOp-A, MetOp-B, and MetOp-C (Callies et al., 2000; Munro et al., 2016); and TROPOMI on the ESA Sentinel 5 Precursor in 2018 (Veefkind et al., 2012), the amounts and distributions of stratospheric and tropospheric NO2 vertical column densities (TropVCDs) have been retrieved at increasing spatial resolutions from these instruments, which all fly in sun-synchronous low-Earth orbit (LEO). Using the retrieved NO2 TropVCDs from the LEO instruments, the tropospheric nitrogen oxide sources have been identified, their NOx emissions have been estimated, and the chemistry of the troposphere has been studied from the local to the global scale. While instruments on board LEO satellites provide spatially continuous data, observations are obtained only once or twice per day. It was recognized in the late 1990s that instruments similar to SCIAMACHY in geostationary Earth orbit (GEO) would potentially deliver the diurnal variations of key trace gases (see the GeoTROPE concept in Burrows et al., 2004, and references therein). The measurements at the top of the atmosphere of the Geostationary Environment Monitoring Spectrometer (GEMS), launched in 2020, yield the first not only spatially but also temporally continuous air quality data over Asia from GEO (see Kim et al., 2020).
Mathematical inversion of the GEMS observations provides diurnal variations of the NO2 TropVCD. These data products enable the seasonal changes not only in pollutant concentration but also in temporal characteristics, such as the times of the maxima and minima and the sources and sinks of NO2, which vary diurnally and seasonally, to be studied for the first time from space.
As part of the differential optical absorption spectroscopy (DOAS) retrieval of NO2 TropVCD data, air mass factors (AMFs) are used to convert slant column density (SCD) to VCD. The assumptions used in the AMF calculation are explained in Richter and Burrows (2002) and Palmer et al. (2001). In agreement with other studies, Lorente et al. (2017) reported that the AMF calculation is the largest source of error or uncertainty in NO2 satellite retrievals. This is because of the assumption used to determine the ancillary or a priori data used in the AMF calculation, such as surface albedo, terrain height, cloud parameters, and trace gas profiles. Consequently, the selection of optimal and appropriate a priori data is essential to accurately retrieve NO2 TropVCDs from the observations of any nadir-sounding satellite spectrometer. This is in addition to the need to separate upper atmospheric NO2 from that in the troposphere.
In this study we investigate two important issues using the GEMS NO2 TropVCD data over the Seoul metropolitan area (SMA): (1) the influence of a priori profiles on the retrieved GEMS NO2 TropVCDs and (2) the seasonal variation of the GEMS NO2 TropVCD. In Sect. 2, we describe the methods and data used.
Prior to our geophysical interpretation of the NO2 TropVCD, in Sect. 3 we compared three GEMS datasets, retrieved with different a priori data from the WRF-Chem model. Thereby we investigated the influence of the inventories of the emissions of NOx, defined as the sum of nitrogen monoxide (NO) and nitrogen dioxide (NO2) in an air mass, on the simulated and retrieved NO2 TropVCD.
In Sect. 4, we utilized two chemical transport models (CTMs), the Weather Research and Forecast model combined with Chemistry (WRF-Chem) and the global chemistry transport model TM5 (Tracer Model 5) to analyze both the seasonal variations and the influence of a priori NO2 profiles. The seasonal changes in the magnitudes and the time of the maxima of the diurnal NO2 TropVCD, which we define as the peak times, were investigated. The differences in the spatial distributions of NO2 TropVCD between the WRF-Chem- and TM5-based GEMS datasets using different a priori data were identified for each season and peak time. We also analyzed the influence of wind speed on the variations in the magnitude and diurnal behavior of the retrieved NO2 TropVCDs.
2.1 GEMS products
GEMS is an ultraviolet–visible (UV–VIS) instrument, measuring the spectral range from 300 to 500 nm contiguously at a spectral resolution of ∼0.6 nm (Kim et al., 2020). The nominal spatial resolution is 3.5 km × 7.7 km for gases including NO2 data products. The overall field of regard (FOR) of GEMS covers 5° S–45° N latitude and 75–145° E longitude. GEMS measures hourly during the daytime. The number of observations varies depending on the month, as a result of the length of the day and the measurement strategy. For South Korea, observations are least frequent in January, with 6 observations per day, and most frequent from April to September, with 10 observations per day. We utilized GEMS NO2 TropVCD data with the IUP-UB algorithm (GEMS IUP-UB products) in January, April, July, and October 2021 – detailed explanations of GEMS IUP-UB products are shown below.
GEMS IUP-UB products v1.0
The GEMS NO2 vertical columns used in this study are from the scientific data product of the University of Bremen, version 1.0 (Lange et al., 2024). NO2 slant columns are retrieved in the large fitting window 405–485 nm to reduce noise. In addition to the cross-sections of other absorbing species (O3, O4, H2O, and liquid water), pseudo-cross-sections for the Ring effect, for GEMS instrument polarization sensitivity, and for the effects of scene inhomogeneity are included. The stratospheric correction is performed using the STRatospheric Estimation Algorithm from Mainz (STREAM) (Beirle et al., 2016). Conversion to vertical tropospheric columns is based on lookup tables of altitude-dependent air mass factors calculated with the radiative transfer model SCIATRAN (Rozanov et al., 2014) using Lambertian equivalent reflectivity (LER) surface reflection values from the TROPOMI climatology (Tilstra et al., 2024). To apply the cloud correction, adjusted cloud fractions and pressure from the GEMS L2 cloud product were used. The NO2 a priori data are different in the different model simulations, which we call runs, as explained below.
2.2 Experiment designs
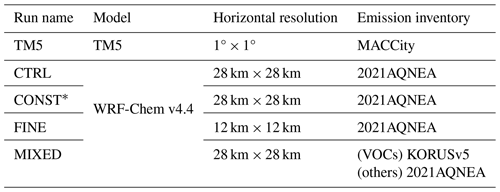
To analyze the spatiotemporal characteristics of GEMS NO2 VCDs and the impacts of different a priori data on the retrieved values, we undertook five experiments, called TM5, CTRL, CONST, FINE, and MIXED.
The TM5 experiment applies the standard GEMS IUP-UB products v1.0, which use the TM5 model, as their a priori data (Huijnen et al., 2010; Williams et al., 2017). The meteorological data for TM5 simulations are obtained from the European Centre for Medium-Range Weather Forecasts (ECMWF) operational forecast data. For the anthropogenic NOx emission inventory of TM5, the MACCity emission estimates are adopted (Granier et al., 2011), which have no diurnal variation of NOx emissions. The outputs from TM5 model have a horizontal resolution of 1° × 1° and 34 vertical layers.
For the other four numerical experiments (CTRL, CONST, FINE, and MIXED), WRF-Chem version 4.4 was used to generate a priori data (Grell et al., 2005; Skamarock et al., 2021). The chemistry scheme follows the Regional Atmospheric Chemistry Mechanism (RACM) with the secondary organic aerosol volatility basis set (SOA-VBS) option (chem_opt=108) (Ahmadov et al., 2012). The horizontal resolution of WRF-Chem simulation is 28 km × 28 km, except for the FINE run (12 km × 12 km). All simulations have 59 customized vertical layers. To account for the stratospheric vertical profiles, the Whole Atmosphere Community Climate Model (WACCM) model outputs were combined with the WRF-Chem data (ACOM/NCAR/UCAR, 2020). The combined data comprise a total of 113 vertical layers. Detailed model configuration is described in Kim et al. (2024). For the anthropogenic emission inventories, the Air Quality in Northeast Asia (AQNEA) emission inventory version 2 was adopted. Since the reference year of AQNEA version 2 is 2019, the anthropogenic NOx emissions decreased by 20 % to account for the decreasing trends of NOx emissions from 2019 to 2021. We applied the normalized diurnal variabilities of NOx emissions obtained from the Los Angeles Basin in Kim et al. (2016) but shifting the values 1 h earlier (Fig. 1). For the CONST run, only the a priori profiles at 13:45 LT were used to retrieve the NO2 TropVCD. To investigate the impact on the volatile organic compound (VOC) emissions of the anthropogenic VOC emissions, we used the KORUS emission inventory version 5 (Jang et al., 2020; Woo et al., 2012) in the MIXED run. We retrieved 4 months (January, April, July, and October 2021) for the TM5 and CTRL runs and 1 month (July 2021) for the other runs. The experimental designs are summarized in Table 1.
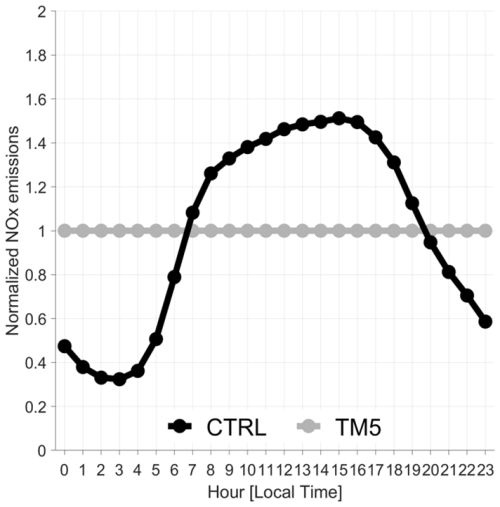
Figure 1Diurnal variabilities of normalized NOx emissions for CTRL (black) and TM5 (gray) runs over the SMA region.
We compared retrieved NO2 TropVCDs from the five different simulations, or runs, to study the impacts of a priori data used in AMF calculations on the retrieved NO2 TropVCD.
3.1 Comparison between the CTRL and TM5 runs
Retrieved NO2 TropVCDs from the CTRL and TM5 runs exhibit similar diurnal patterns, which are independent of the diurnal patterns of their respective a priori data (Fig. 2). This suggests that the observed slant column density (SCD) plays a more decisive role in the diurnal pattern of TropVCD than the influence of a priori data used to determine the AMF. Nevertheless, differences in NO2 TropVCDs between the two runs were observed and are particularly noticeable differences in July.
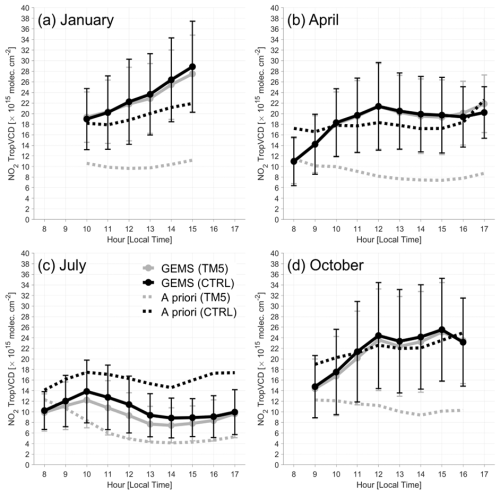
Figure 2Diurnal behavior of retrieved (solid) and a priori (dashed) NO2 TropVCDs during weekdays in (a) January, (b) April, (c) July, and (d) October 2021 over the SMA region. Gray lines identify the TM5 run, while black lines represent the CTRL run. Pixels with wind speed faster than 3 m s−1 are excluded.
Figure 3 displays spatial distributions of AMF differences between the CTRL and TM5 runs in January, April, July, and October 2021. In urban areas, the AMF in the CTRL run was generally lower (blue) than in the TM5 run, but higher values (red) were observed in the northern and eastern regions of Seoul. As a result, the average values across the SMA domain were similar between CTRL and TM5 – the diurnal patterns of the averaged air mass factor over the SMA are shown in Fig. 4. In July, however, lower values in the CTRL run were observed throughout Seoul and its surrounding areas, leading to lower average AMF values for the SMA region during most of the day. As a result, the TropVCD values in July were higher in the CTRL run (Fig. 2c).
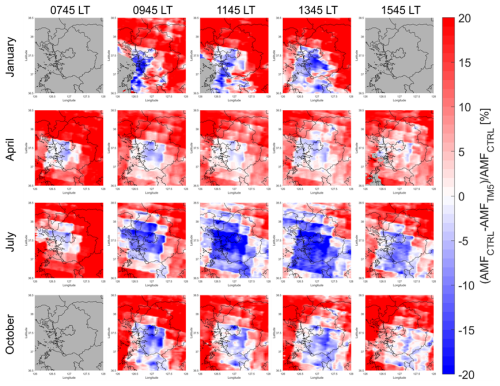
Figure 3Spatial distributions of air mass factor (AMF) differences (CTRL − TM5) in January, April, July, and October 2021. Pixels with wind speed faster than 3 m s−1 are excluded.
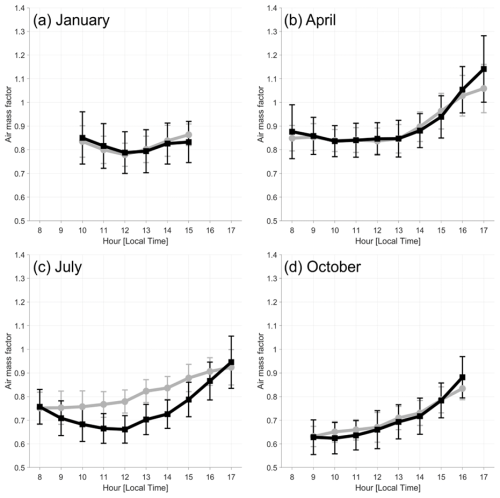
Figure 4Diurnal patterns of the air mass factor during weekdays in (a) January, (b) April, (c) July, and (d) October 2021 over the SMA region. Gray lines indicate the TM5 run, while black lines mean the CTRL run. Pixels with wind speed faster than 3 m s−1 are excluded.
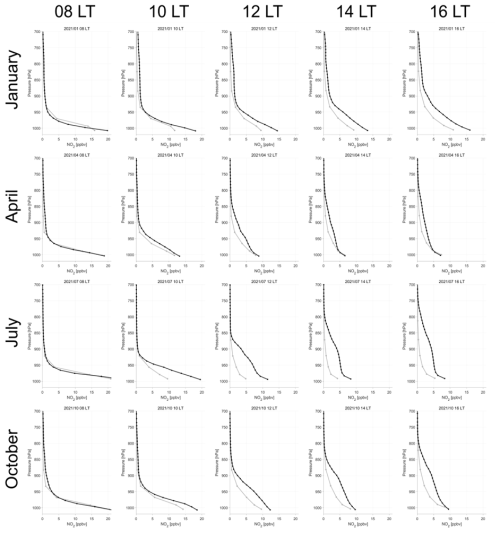
In Fig. 5, we compare NO2 vertical profiles at 08:00, 10:00, 12:00, 14:00, and 16:00 LT from the CTRL and TM5 runs. NO2 values in the lower atmosphere in the CTRL run are much higher than those in the TM5 run in July, which lead to lower AMF and thus higher NO2 TropVCD.
3.2 Comparisons between the CTRL run and the CONST, FINE, and MIXED runs
In Fig. 6, the diurnal patterns of retrieved and a priori NO2 TropVCDs in July 2021 over the SMA region from the CTRL run and the CONST, FINE, and MIXED runs are shown. Despite some changes in model resolution and VOC emissions, the FINE and MIXED runs did not show significant differences compared to the CTRL run. In particular, the MIXED run resulted in almost no difference in the a priori TropVCD, resulting in nearly identical retrieved NO2 TropVCD.
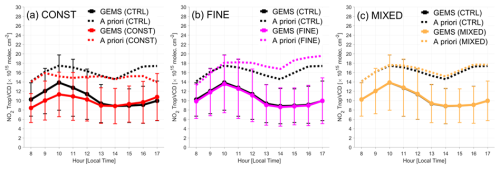
Figure 6Diurnal patterns of retrieved (solid) and a priori (dashed) NO2 TropVCDs in July 2021 over the SMA region from the CTRL run (black) and from the (a) CONST run (red), (b) FINE run (pink), and (c) MIXED run (yellow). Pixels with wind speed faster than 3 m s−1 are excluded. Note that diurnal changes in a priori NO2 TropVCDs in the CONST run occur during calculation of domain-averaged values – the location and number of pixels excluded during the collocation with satellite data vary over time during the day.
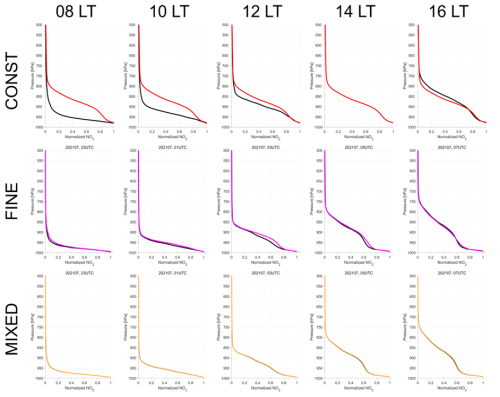
On the other hand, the CONST run, which only used the a priori vertical profile from 13:45 LT in the retrieval process, exhibited clear differences to the CTRL run. Specifically it had lower values than the CTRL run before ∼14:00 LT but higher values after. These differences are explained by comparisons of vertical profiles from each run, which are displayed in Fig. 7. The vertical profile shapes of the CTRL, FINE, and MIXED runs are identical, indicating that the AMF of each run has similar values. On the other hand, clear differences of vertical profile shape are apparent between the CTRL and CONST runs. Before 14:00 LT, the CTRL run showed lower sensitivity in the upper layers compared to the CONST run. This indicates a smaller AMF and thus higher VCD values. In contrast, after 14:00 LT, the CTRL run exhibited higher sensitivity to NO2 in the upper layers of the troposphere, leading to a larger AMF and consequently lower VCD values compared to the CONST run. These differences in the vertical profile arise from effects such as the development of the mixing layer and variations in emissions throughout the day. This implies that providing optimal time-dependent a priori data for the AMF calculation will improve the accuracy of the retrieved NO2 TropVCD.
We report on our investigation of the spatiotemporal characteristics of GEMS NO2 TropVCD. We use the retrieved NO2 TropVCDs and those simulated by the TM5 and CTRL runs to assess two geophysically important influences on the NO2 TropVCD in the SMA region (37.2–37.8° N, 126.5–127.3° E) in 2021: (1) the identification, quantification, and origin of the seasonal changes and (2) advection and convection of air masses.
4.1 Seasonal variations
Figure 2 displays diurnal patterns of retrieved and a priori NO2 TropVCDs during weekdays in January, April, July, and October 2021 over the SMA region from the TM5 and CTRL runs. Scenes with wind speed faster than 3 m s−1 are excluded to remove the transport impacts. The effects of transport on NO2 columns are analyzed in Sect. 4.2.
In January, NO2 TropVCDs continuously increase from 10:00 to 15:00 LT. During the winter, NO2 in the urban region particularly accumulates in the boundary layer. Qualitatively, this is explained as follows.
As tropospheric solar UV radiation is low in winter and the atmosphere is cold, photolysis frequencies are small. Similarly, the rate coefficients of many reactions are smaller at the lower winter temperatures compared to those of the other seasons. In winter, the relatively slow loss of NOx occurs through the three-body reaction of hydroxyl (OH) with NO2 to form nitric acid (HNO3):
The smaller photolysis frequencies of reactions following photoexcitation in the reactions,
lead to slower production of (i) the first excited state of oxygen (O(1D)) from the photolysis of ozone (O3), (ii) the hydroxyl radical (OH), and (iii) the production of organic peroxyl radicals (RO2) and hydroperoxyl (HO2) through the oxidation of methane (CH4) and VOCs. Some of the following reactions are involved:
Overall, at low solar insolation, the low levels of actinic radiation result in smaller amounts of OH and HO2. The oxidation process is slow, and HO2 chemistry and OH chemistry are coupled with NOx chemistry and controlled by the rate of oxidation of VOCs and CH4 and the rate of HO2 to OH through the rate of Reaction (R14) and the rate of loss of HOx and NOx, for example, through Reaction (R1).
In January the maximum values of retrieved TropVCDs are 27.5 × 10¹⁵ (TM5) and 28.9 × 10¹⁵ (CTRL) at 15:00 LT, whereas the a priori NO2 TropVCDs have maxima of 11.2×10¹⁵ (TM5) and 21.9×10¹⁵ (CTRL) at the same time. These higher values of retrieved NO2 TropVCDs relative to the model NO2 TropVCDs are explained by the following inadequate knowledge of the bottom-up diurnal NOx emissions in January and/or the dilution during the transport of plumes, which is dependent on the model horizontal resolution.
For other months, the maxima of NO2 TropVCDs occur at earlier times of the day in April at 12:00 LT, in July at 10:00 LT, and in October at 11:00 LT. There is also a second maximum at 15:00 LT in October. The behavior of NO2 TropVCD in April, July, and October, when compared to that in January, is explained by the following effects: (i) faster tropospheric photolysis frequencies, as a result of higher levels of tropospheric solar insolation and actinic radiation accelerating the photochemical oxidation of CH4 and VOCs in April, July, and October compared to January; (ii) generally faster reaction rate coefficients of the free radical reactions at the higher temperatures, the rate coefficient of Reaction (R4) being an exception; and (iii) the different diurnal emissions of NOx compared to those in January. Figure 8 shows the diurnal variations of OH concentrations averaged across boundary layer height in each month, calculated by the CTRL model run. The OH concentration in January is about an order of magnitude smaller than that in July.
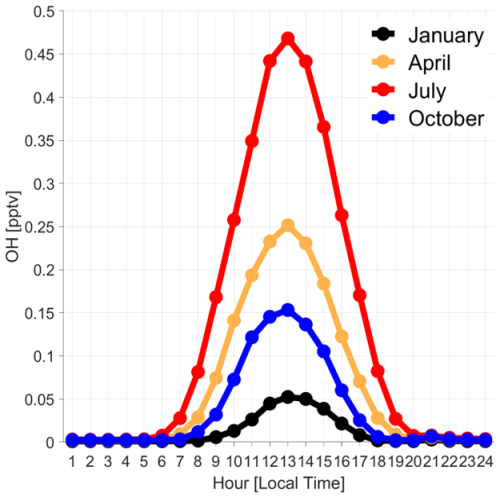
Figure 8Diurnal patterns of boundary layer mean OH concentrations over the SMA region in January (black), April (yellow), July (red), and October (blue) 2021 from the CTRL run.
In April, NO2 TropVCDs increased until 12:00 LT. They then maintain similar levels until 17:00 LT. The maximum NO2 TropVCD occurred at 12:00 LT for the CTRL run (21.4×10¹⁵ ). The maximum NO2 TropVCD for the TM5 run appeared at 17:00 LT, being 21.9×10¹⁵ . However, the retrieved NO2 TropVCDs from the TM5 and CTRL runs have almost identical behavior up to 15:00 LT. There is a difference of 1.6×10¹⁵ (8.1 %) between the two runs at 17:00 LT, when a priori NO2 TropVCD values sharply increased from the CTRL run.
In July, both the TM5 (12.2×10¹⁵ ) and CTRL (13.9×10¹⁵ ) runs show maxima at 10:00 LT, i.e., the earliest for the 4 months investigated. After the peak, NO2 TropVCDs decrease, most likely due to more rapid photochemical loss processes, e.g., Reaction (R1) until 14:00 LT, and then increase. In other seasons, the minimum values were observed in the morning. However, in July, the minimum occurred at 14:00 LT. This unique pattern of behavior is explained by the more rapid photochemical production and removal reactions in summer. We infer that the chemical removal becomes relatively more rapid than the emission and production of NO2 (see Fig. 8). The two types of run show similar diurnal behavior, but the retrieved NO2 TropVCDs of the CTRL runs between 10:00 and 14:00 LT rise to 2.1×10¹⁵ , i.e., higher than those of the TM5 runs. The diurnal change in a priori NO2 TropVCDs from the CTRL runs shows similar behavior to that of the retrieved NO2 TropVCDs, despite the magnitude of a priori NO2 TropVCD being 3.9–8.2×10¹⁵ higher than those retrieved. On the other hand, the a priori NO2 TropVCD from the TM5 runs decreases between 08:00 and 14:00 LT, reflecting diurnally varying photochemistry with similar levels of NOx emissions throughout the day.
In October, there are broad maxima of NO2 TropVCDs between 12:00 and 15:00 LT. Overall, diurnal behavior comprises an increase up to 12:00 LT, followed by broad maxima, after which the NO2 TropVCD are similar to those in April.
The highest retrieved values are in the range 25.1×10¹⁵ to 25.5×10¹⁵ for both the TM5 and CTRL runs. As expected, the NO2 TropVCDs are the highest in January and lowest in July.
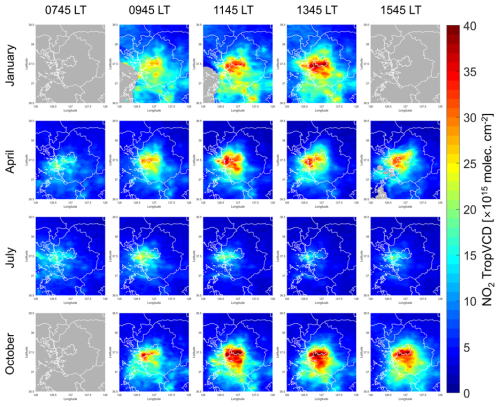
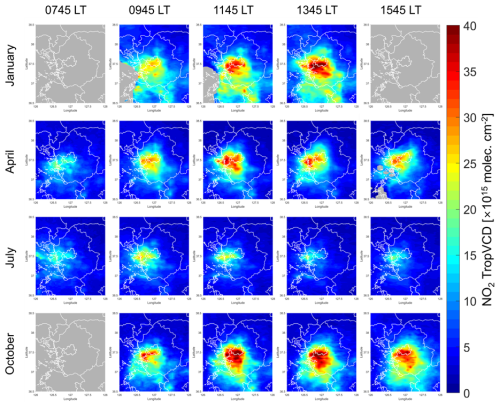
Figure 9Spatial distributions of retrieved NO2 TropVCDs in January, April, July, and October 2021, taking the a priori data for the AMF from the TM5 run. Scenes with wind speed faster than 3 m s−1 are excluded to minimize the impact of rapid transport.
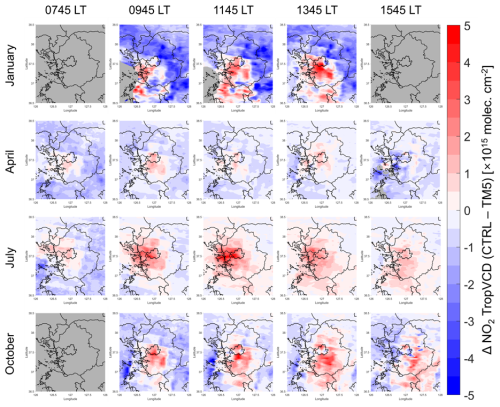
Figures 9 and 10 show the spatial distributions of retrieved NO2 TropVCDs in January, April, July, and October 2021 from the TM5 and CTRL runs, respectively. In January, a plume over the SMA region developed as a function of time. Consequently, the suburban areas, which surround the SMA region, experience relatively high NO2 TropVCD ( ) compared to that retrieved in the other months. In April and October, the plumes over the SMA are saturated prior to 12:00 LT and then decrease. In contrast, the NO2 TropVCDs of the surrounding regions are relatively constant or even increase. In July, the overall low values cover the SMA and nearby regions for whole days. The maximum values appear at 10:00 LT and then decreased until 14:00 LT. However, the NO2 VCD rebounded at 16:00 LT. Figure 11 displays the differences between the TM5 and CTRL runs – red indicates the CTRL run has higher values than the TM5 run; blue means the opposite. The CTRL run shows higher VCD values than the TM5 run for all times in July. The largest differences over the SMA region are found at 12:00 LT in July, with differences of 2.1×10¹⁵ . In other months, the CTRL run generally has higher values of VCD than the TM5 run over the Seoul and urban regions, while there are lower values of VCD from the CTRL run over rural regions.
4.2 Impacts of horizontal transport
Figure 12 shows the diurnal behavior of the retrieved NO2 TropVCDs from the CTRL run for different wind conditions. The black lines indicate calm runs (wind speed lower than 3 m s−1), the green line is a strong-wind run (wind speed faster than 5 m s−1), and the blue lines are the average values with no wind filters. In January (Fig. 12a), the diurnal behavior of the NO2 TropVCDs changes significantly with the wind conditions. In the calm run (solid black), NO2 TropVCD steadily increases due to a combination of the emissions increasing and the slow chemical loss in this month. In windy runs, however, diurnal changes in the retrieved NO2 TropVCD are negligible.
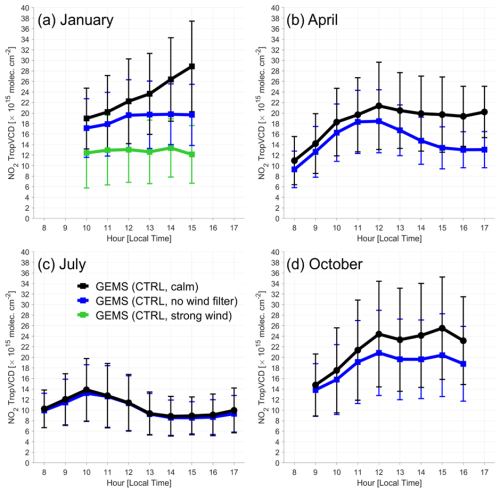
Figure 12Diurnal patterns of retrieved NO2 TropVCDs from the CTRL run in (a) January, (b) April, (c) July, and (d) October 2021 over the SMA region. Black lines indicate the NO2 TropVCD values with wind-filtered data; only the scenes with wind speed lower than 3 m s−1 are utilized. Blue lines are the averaged values without any wind filters. The green line is for the case of the strong-wind run with the NO2 TropVCD being selected and averaged for wind speeds faster than 5 m s−1 in January.
Although the chemical loss is slow during wintertime, the accumulation of NO2 was mitigated as strong winds transported large concentrations of NO2 to downwind regions. The differences between calm and other runs were most significant at 15:00 LT, further indicating that continuous outflow due to transport suppressed the accumulation. As the wind speed increased, there was a noticeable reduction in NO2 TropVCD values, which indicates a clear inverse relationship between wind speed and VCDs, as shown in Edwards et al. (2024). The values of calm, average (solid blue), and strong-wind (solid green) runs are 19.0–28.9, 17.2–19.8, and 12.1–13.4×10¹⁵ , respectively.
In April (Fig. 12b) and October (Fig. 12d), the averaged values with no wind filters (solid blue) have different diurnal behavior, but the maximum NO2 TropVCD appears almost simultaneously with that of the calm low wind speed run. In July (Fig. 7c), however, the diurnal behavior from the calm run and no wind filters is nearly identical, implying that the wind speeds are slow overall in July.
In summary, the transport effect is maximized in wintertime, changing not only the absolute values but also the diurnal behavior of NO2 Trop VCDs. Consequently, transport must be taken into account when analyzing NO2 TropVCDs and when estimating top-down NOx emissions. The role of transport needs to be taken into account, even for cases where the wind speed is relatively slow during summertime (Yang et al., 2024).
In this study, we analyzed the seasonal variations and diurnal behavior of the retrieved GEMS IUP-UB NO2 TropVCD, using monthly mean data in January, April, July, and October. We also investigated the effects of wind speed and the impact of a priori NO2 profiles on the retrieval. Both in the CTRL and TM5 runs, the GEMS NO2 product showed significant changes in quantity, diurnal pattern, and peak time as the seasons changed. In winter, the values were the highest, with a gradual increase over time, whereas in summer, the values were the lowest, reaching a minimum in the afternoon. This is consistent with previous studies, which have shown that atmospheric chemical reactions are more active in summer. Furthermore, we confirmed that wind-driven transport significantly influences the diurnal patterns, clearly demonstrating that advection and possibly convection need to be taken into account when top-down NOx emissions are estimated from an urban agglomeration such as SMA.
On the other hand, when using different a priori data to calculate VCD values, more complex results emerged. A comparison between the CTRL and TM5 runs revealed that, despite different spatial resolution and emission characteristics, the retrieved NO2 TropVCDs exhibited similar diurnal patterns, with significant differences only in July. Additionally, we found that the retrieved NO2 TropVCDs had diurnal behaviors independent of the a priori data in both runs. We infer that the observed SCD has a stronger influence on the retrieved diurnal patterns than a priori profiles. Adjusting the horizontal resolution of the model (FINE run) or changing the VOC emissions data (MIXED run) also resulted in no significant differences. However, in the CONST run, where only the vertical profile at 14:00 LT was used in the retrieval process throughout the day, there were significant differences in both the NO2 Trop VCD values and diurnal patterns. This reaffirms that the vertical shape factor of a priori data plays a critical role in NO2 TropVCD retrievals.
Additionally, given that vertical and horizontal model resolution can influence retrievals (Liu et al., 2020), future studies should analyze the results when the vertical resolution is adjusted. Furthermore, as highlighted by previous studies, such as Lorente et al. (2017) and Hong et al. (2017), which emphasized the importance of cloud parameters, aerosol characteristics, and surface albedo, uncertainties arising from factors in addition to the a priori NO2 profile should further be investigated in the retrieval of NO2 TropVCD for both diurnal GEO observation and that from LEO.
GEMS measurement data retrieved by the IUP algorithm are available on request from Andreas Richter (richter@iup.physik.uni-bremen.de). WRF-Chem v4.4 is available on GitHub (https://github.com/wrf-model/WRF/releases/tag/v4.4, wrf-model, 2022).
SWK initiated this study and secured funding. SS and SWK analyzed the satellite and model data. SS, KMK, and SWK conducted the model simulations. AR, KL, and JPB provided GEMS IUP products and analyzed the data. JK, JP, HH, HL, and UJ retrieved and analyzed the GEMS observations and discussed the results. JHW provided the AQNEA version 2 emission inventory. SS and SWK wrote the paper, with contributions from all co-authors.
At least one of the (co-)authors is a member of the editorial board of Atmospheric Measurement Techniques. The peer-review process was guided by an independent editor, and the authors also have no other competing interests to declare.
Publisher's note: Copernicus Publications remains neutral with regard to jurisdictional claims made in the text, published maps, institutional affiliations, or any other geographical representation in this paper. While Copernicus Publications makes every effort to include appropriate place names, the final responsibility lies with the authors.
This article is part of the special issue “GEMS: first year in operation (AMT/ACP inter-journal SI)”. It is not associated with a conference.
This work was supported by a National Research Foundation of Korea (NRF) grant, funded by the South Korean government (MSIT) (no. 2020R1A2C2014131). All the computing resources are provided by the National Center for Meteorological Supercomputer. The contributions from the University of Bremen were supported by the State and University of Bremen and the DLR.
This research has been supported by the National Research Foundation of Korea (grant no. 2020R1A2C2014131).
This paper was edited by Ben Veihelmann and reviewed by three anonymous referees.
ACOM/NCAR/UCAR (Atmospheric Chemistry Observations & Modeling/National Center for Atmospheric Research/University Corporation for Atmospheric Research): Whole Atmosphere Community Climate Model (WACCM) Model Output, Research Data Archive at the National Center for Atmospheric Research, Computational and Information System Laboratory, https://doi.org/10.5065/G643-Z138, 2020.
Ahmadov, R., McKeen, S. A., Robinson, A. L., Bahreini, R., Middlebrook, A. M., de Gouw, J. A., Meagher, J., Hsie, E.-Y., Edgerton, E., Shaw, S., and Trainer, M.: A volatility basis set model for summertime secondary organic aerosols over the eastern United States in 2006, J. Geophys. Res.-Atmos., 117, D06301, https://doi.org/10.1029/2011JD016831, 2012.
Beirle, S., Hörmann, C., Jöckel, P., Liu, S., Penning de Vries, M., Pozzer, A., Sihler, H., Valks, P., and Wagner, T.: The STRatospheric Estimation Algorithm from Mainz (STREAM): estimating stratospheric NO2 from nadir-viewing satellites by weighted convolution, Atmos. Meas. Tech., 9, 2753–2779, https://doi.org/10.5194/amt-9-2753-2016, 2016.
Bovensmann, H., Burrows, J. P., Buchwitz, M., Frerick, J., Noël, S., Rozanov, V. V., Chance, K. V., and Goded, A. P. H.: SCIAMACHY: Mission Objectives and Measurement Modes, J. Atmos. Sci., 56, 127–150, https://doi.org/10.1175/1520-0469(1999)056<0127:SMOAMM>2.0.CO;2, 1999.
Burrows, J. P., Hölzle, E., Goede, A. P. H., Visser, H., and Fricke, W.: SCIAMACHY – Scanning Imaging Absorption Spectrometer for Atmospheric Chartography, Acta Astronaut., 35, 445–461, https://doi.org/10.1016/0094-5765(94)00278-T, 1995.
Burrows, J. P., Weber, M., Buchwitz, M., Rozanov, V., Ladstätter-Weißenmayer, A., Richter, A., DeBeek, R., Hoogen, R., Bramstedt, K., Eichmann, K.-U., Elsinger, M., and Perner, D.: The Global Ozone Monitoring Experiment (GOME): Mission Concept and First Scientific Results, J. Atmos. Sci., 56, 151–175, https://doi.org/10.1175/1520-0469(1999)056<0151:TGOMEG>2.0.CO;2, 1999.
Burrows, J. P., Bovensmann, H., Bergametti, G., Flaud, J. M., Orphal, J., Noël, S., Monks, P. S., Corlett, G. K., Goede, A. P. H., von Clarmann, T., Steck, T., Fischer, H., and Friedl-Vallon, F.: The geostationary tropospheric pollution explorer (GeoTROPE) missions: objects, requirements and mission concept, Adv. Space Res., 34, 682–687, https://doi.org/10.1016/j.asr.2003.08.067, 2004.
Callies, J., Corpaccioli, E., Eisinger, M., Hahne, A., and Lefebvre, A.: GOME-2-Metop's second-generation sensor for operational ozone monitoring, ESA Bulletin, 102, 28–36, 2000.
Edwards, D. P., Martínez-Alonso, S., Jo, D. S., Ortega, I., Emmons, L. K., Orlando, J. J., Worden, H. M., Kim, J., Lee, H., Park, J., and Hong, H.: Quantifying the diurnal variation in atmospheric NO2 from Geostationary Environment Monitoring Spectrometer (GEMS) observations, Atmos. Chem. Phys., 24, 8943–8961, https://doi.org/10.5194/acp-24-8943-2024, 2024.
Granier, C., Bessagnet, B., Bond, T., D'Angiola, A., van der Gon, H. D., Frost, G. J., Heil, A., Kaiser, J. W., Kinne, S., Klimont, Z., Kloster, S., Lamarque, J.-F., Liousse, C., Masui, T., Meleux, F., Mieville, A., Ohara, T., Raut, J.-C., Riahi, K., Schultz, M. G., Smith, S. J., Thompson, A., van Aardenne, J., van der Warf, G. R., and van Vuuren, D. P.: Evolution of anthropogenic and biomass burning emissions of air pollutants at global and regional scales during the 1980–2010 period, Climatic Change, 109, 163, https://doi.org/10.1007/s10584-011-0154-1, 2011.
Grell, G. A., Peckham, S. E., Schmitz, R., McKeen, S. A., Frost, G., Shamarock, W. C., and Eder, B.: Fully coupled “online” chemistry within the WRF model, Atmos. Environ., 39, 6957–6975, https://doi.org/10.1016/j.atmosenv.2005.04.027, 2005.
Hong, H., Lee, H., Kim, J., Jeong, U., Ryu, J., and Lee, D. S.: Investigation of Simultaneous Effects of Aerosol Properties and Aerosol Peak Height on the Air Mass Factors for Space-Borne NO2 Retrievals, Remote Sens.-Basel, 9, 208, https://doi.org/10.3390/rs9030208, 2017.
Huijnen, V., Williams, J., van Weele, M., van Noije, T., Krol, M., Dentener, F., Segers, A., Houweling, S., Peters, W., de Laat, J., Boersma, F., Bergamaschi, P., van Velthoven, P., Le Sager, P., Eskes, H., Alkemade, F., Scheele, R., Nédélec, P., and Pätz, H.-W.: The global chemistry transport model TM5: description and evaluation of the tropospheric chemistry version 3.0, Geosci. Model Dev., 3, 445–473, https://doi.org/10.5194/gmd-3-445-2010, 2010.
Jang, Y., Lee, Y., Kim, J., Kim, Y., and Woo, J.-H.: Improvement China point source for improving bottom-up emission inventory, Asia-Pac. J. Atmos. Sci., 56, 107–118, https://doi.org/10.1007/s13143-019-00115-y, 2020.
Kim, J., Jeong, U., Ahn, M.-H., Kim, J. H., Park, R. J., Lee, H., Song, C. H., Choi, Y.-S., Lee, K.-J., Yoo, J.-M., Jeong, M.-J., Park, S. K., Lee, K.-M., Song, C.-K., Kim, S.-W., Kim, Y. J., Kim, S.-W., Kim, M., Go, S., Liu, X., Chance, K., Miller, C. C., Al-Saadi, J., Veihelmann, B., Bhartia, P. K., Torres, O., González Abad, G., Haffner, D. P., Ko, D. H., Lee, S. H., Woo, J.-H., Chong, H., Park, S. S., Nicks, D., Choi, W. J., Moon, K.-J., Cho, A., Yoon, J., Kim, S.-K., Hong, H., Lee, K., Lee, H., Lee, S., Choi, M., Veekfind, P., Levelt, P. F., Edwards, D. P., Kang, M., Eo, M., Bak, J., Baek, K., Kwon, H.-A., Yang, J., Park, J., Han, K. M., Kim, B.-R., Shin, H.-W., Choi, H., Lee, E., Chong, J., Cha, Y., Koo, J.-H., Irie, H., Hayashida, S., Kasai, Y., Kanaya, Y., Liu, C., Lin, J., Crawford, J. H., Carmichael, G. R., Newchurch, M. J., Lefer, B. L., Herman, J. R., Swap, R. J., Lau, A. K. H., Kurosu, T. P., Jaross, G., Ahlers, B., Dobber, M., McElroy, C. T., and Choi, Y.: New Era of Air Quality Monitoring from Space: Geostationary Environment Monitoring Spectrometer (GEMS), B. Am. Meteorol. Soc., 101, E1–E22, https://doi.org/10.1175/BAMS-D-18-0013.1, 2020.
Kim, K.-M., Kim, S.-W., Seo, S., Blake, D. R., Cho, S., Crawford, J. H., Emmons, L. K., Fried, A., Herman, J. R., Hong, J., Jung, J., Pfister, G. G., Weinheimer, A. J., Woo, J.-H., and Zhang, Q.: Sensitivity of the WRF-Chem v4.4 simulations of ozone and formaldehyde and their precursors to multiple bottom-up emission inventories over East Asia during the KORUS-AQ 2016 field campaign, Geosci. Model Dev., 17, 1931–1955, https://doi.org/10.5194/gmd-17-1931-2024, 2024.
Kim, S.-W., McDonald, B. C., Brown, S. S., Dube, B., Ferrare, R. A., Frost, G. J., Harley, R. A., Holloway, J. S., Lee, H.-J., McKeen, S. A., Neuman, J. A., Nowak, J. B., Oetjen, H., Ortega, I., Pollack, I. B., Roberts, J. M., Ryerson, T. B., Scarino, A. J., Senff, C. J., Thalman, R., Trainer, M., Volkamer, R., Wagner, N., Washenfelder, R. A., Waxman, E., and Young, C. J.: Modeling the weekly cycle of NOx and CO emissions and their impacts on O3 in the Los Angeles-South Coast Air Basin during the CalNex 2010 field campaign, J. Geophys. Res.-Atmos., 121, 1340–1360, https://doi.org/10.1002/2015JD024292, 2016.
Lange, K., Richter, A., Bösch, T., Zilker, B., Latsch, M., Behrens, L. K., Okafor, C. M., Bösch, H., Burrows, J. P., Merlaud, A., Pinardi, G., Fayt, C., Friedrich, M. M., Dimitropoulou, E., Van Roozendael, M., Ziegler, S., Ripperger-Lukosiunaite, S., Kuhn, L., Lauster, B., Wagner, T., Hong, H., Kim, D., Chang, L.-S., Bae, K., Song, C.-K., Park, J.-U., and Lee, H.: Validation of GEMS tropospheric NO2 columns and their diurnal variation with ground-based DOAS measurements, Atmos. Meas. Tech., 17, 6315–6344, https://doi.org/10.5194/amt-17-6315-2024, 2024.
Levelt, P. F., van den Oord, G. H. J., Dobber, M. R., Mälkki, A., Visser, H., de Vries, J., Stammes, P., Lundell, J. O. V., and Saari, H.: The Ozone Monitoring Instrument, IEEE T. Geosci. Remote, 44, 1093–1101, https://doi.org/10.1109/TGRS.2006.872333, 2006.
Liu, S., Valks, P., Pinardi, G., Xu, J., Argyrouli, A., Lutz, R., Tilstra, L. G., Huijnen, V., Hendrick, F., and Van Roozendael, M.: An improved air mass factor calculation for nitrogen dioxide measurements from the Global Ozone Monitoring Experiment-2 (GOME-2), Atmos. Meas. Tech., 13, 755–787, https://doi.org/10.5194/amt-13-755-2020, 2020.
Lorente, A., Folkert Boersma, K., Yu, H., Dörner, S., Hilboll, A., Richter, A., Liu, M., Lamsal, L. N., Barkley, M., De Smedt, I., Van Roozendael, M., Wang, Y., Wagner, T., Beirle, S., Lin, J.-T., Krotkov, N., Stammes, P., Wang, P., Eskes, H. J., and Krol, M.: Structural uncertainty in air mass factor calculation for NO2 and HCHO satellite retrievals, Atmos. Meas. Tech., 10, 759–782, https://doi.org/10.5194/amt-10-759-2017, 2017.
Milford, J. B., Russell, A. G., and McRae, G. J.: A new approach to photochemical pollution control: implications of spatial patterns in pollutant responses in nitrogen oxides and reactive organic gas emissions, Environ. Sci. Technol., 23, 1290–1301, https://doi.org/10.1021/es00068a017, 1989.
Munro, R., Lang, R., Klaes, D., Poli, G., Retscher, C., Lindstrot, R., Huckle, R., Lacan, A., Grzegorski, M., Holdak, A., Kokhanovsky, A., Livschitz, J., and Eisinger, M.: The GOME-2 instrument on the Metop series of satellites: instrument design, calibration, and level 1 data processing – an overview, Atmos. Meas. Tech., 9, 1279–1301, https://doi.org/10.5194/amt-9-1279-2016, 2016.
Palmer, P. I., Jacob, D. J., Chance, K., Martin, R. V., Spurr, R. J. D., Kurosu, T. P., Bey, I., Yantosca, R., Fiore, A., and Li, Q.: Air mass factor formulation for spectroscopic measurements from satellites: Application to formaldehyde retrievals from the Global Ozone Monitoring Experiment, J. Geophys. Res., 106, 14539–14550, https://doi.org/10.1029/2000JD900772, 2001.
Richter, A. and Burrows, J. P.: Tropospheric NO2 from GOME Measurements, Adv. Space Res., 29, 1673–1683, https://doi.org/10.1016/S0273-1177(02)00100-X, 2002.
Rozanov, V. V., Rozanov, A. V., Kokhanovsky, A. A., and Burrows, J. P.: Radiative transfer through terrestrial atmosphere and ocean: Software package SCIATRAN, J. Quant. Spectrosc. Ra., 133, 13–71, https://doi.org/10.1016/j.jqsrt.2013.07.004, 2014.
Skamarock, W. C., Klemp, J. B., Dudhia, J., Gill, D. O., Liu, Z., Berner, J., Wang, W., Powers, J. G., Duda, M. G., Barker, D. M., and Huang, X.-Y.: A Description of the Advanced Research WRF Model Version 4 (No. NCAR/TN-556+STR), https://doi.org/10.5065/1dfh-6p97, 2021.
Tilstra, L. G., de Graaf, M., Trees, V. J. H., Litvinov, P., Dubovik, O., and Stammes, P.: A directional surface reflectance climatology determined from TROPOMI observations, Atmos. Meas. Tech., 17, 2235–2256, https://doi.org/10.5194/amt-17-2235-2024, 2024.
Veefkind, J. P., Aben, I., McMullan, K., Förster, H., de Vries, J., Otter, G., Claas, J., Eskes, H. J., de Haan, J. F., Kleipool, Q., van Weele, M., Hasekamp, O., Hoogeveen, R., Landgraf, J., Snel, R., Tol, P., Ingmann, P., Voors, R., Kruizinga, B., Vink, R., Visser, H., and Levelt, P. F.: TROPOMI on the ESA Sentinel-5 Precursor: A GMES mission for global observations of the atmospheric composition for climate, air quality and ozone layer applications, Remote Sens. Environ., 120, 70–83, https://doi.org/10.1016/j.rse.2011.09.027, 2012.
Williams, J. E., Boersma, K. F., Le Sager, P., and Verstraeten, W. W.: The high-resolution version of TM5-MP for optimized satellite retrievals: description and validation, Geosci. Model Dev., 10, 721–750, https://doi.org/10.5194/gmd-10-721-2017, 2017.
Woo, J.-H., Choi, K.-C., Kim, H. K., Baek, B. H., Jang, M., Eum, J.-H., Song, C. H., Ma, Y.-I., Sunwoo, Y., Chang, L.-S., and Yoo, S. H.: Development of an anthropogenic emissions processing system for Asia using SMOKE, Atmos. Environ., 58, 5–13, https://doi.org/10.1016/j.atmosenv.2011.10.042, 2012.
wrf-model: WRF, Github [code], https://github.com/wrf-model/WRF/releases/tag/v4.4, last access: 18 May 2022.
Yang, L. H., Jacob, D. J., Dang, R., Oak, Y. J., Lin, H., Kim, J., Zhai, S., Colombi, N. K., Pendergrass, D. C., Beaudry, E., Shah, V., Feng, X., Yantosca, R. M., Chong, H., Park, J., Lee, H., Lee, W.-J., Kim, S., Kim, E., Travis, K. R., Crawford, J. H., and Liao, H.: Interpreting Geostationary Environment Monitoring Spectrometer (GEMS) geostationary satellite observations of the diurnal variation in nitrogen dioxide (NO2) over East Asia, Atmos. Chem. Phys., 24, 7027–7039, https://doi.org/10.5194/acp-24-7027-2024, 2024.
- Abstract
- Introduction
- Data and methods
- Impacts of different a priori data on the retrieved NO2 TropVCDs
- Spatiotemporal characteristics of GEMS NO2 TropVCD
- Conclusions
- Code and data availability
- Author contributions
- Competing interests
- Disclaimer
- Special issue statement
- Acknowledgement
- Financial support
- Review statement
- References


