the Creative Commons Attribution 4.0 License.
the Creative Commons Attribution 4.0 License.
 | 13 Mar 2025
Mid-Atlantic nocturnal low-level jet characteristics: a machine learning analysis of radar wind profiles
John T. Sullivan
Belay Demoz
This paper introduces a machine-learning-driven approach for automated nocturnal low-level jet (NLLJ) identification using observations of wind profiles from a radar wind profiler (RWP). The work discussed here is an effort to lay the groundwork for a systematic study of the mid-Atlantic NLLJ's formation mechanisms and their influence on nocturnal and diurnal air quality in major urban regions by establishing a general framework of NLLJ features and characteristics with an identification algorithm. Leveraging a comprehensive wind profile dataset maintained by the Maryland Department of the Environment's RWP network, our methodology employs supervised-machine-learning techniques to isolate the features of the southwesterly NLLJ because of its association with pollution transport in the mid-Atlantic states. This methodology was developed to illuminate spatiotemporal patterns and physical characteristics of NLLJ events to study their role in planetary boundary layer evolution and composition. This paper discusses the construction of this methodology, its performance against known NLLJs in the current literature, intended usage, and a preliminary statistical analysis. The results from this analysis have yielded a total of 90 southwesterly NLLJs from May–September of 2017–2021, as captured by the RWP stationed in Beltsville, MD (39.05° N, 76.87° W; 135 m a.s.l.). A composite analysis of 90 jets reveals that the mid-Atlantic NLLJ is characterized by a core wind speed exceeding 10 m s−1 at altitudes typically between 300–500 m above ground level, with maximum wind speeds occurring between 3–6 h after sunset. The jets show consistent wind direction from the southwest but transition from more southerly- to more westerly-dominated with increasing altitude and time after sunset. We hope our study equips researchers and policymakers with further means to monitor, predict, and address these nocturnal dynamics phenomena that frequently influence boundary layer composition and air quality in the US mid-Atlantic and northeastern regions.
- Article
(4537 KB) - Full-text XML
- BibTeX
- EndNote


Low-level jets (LLJs) are broadly defined as localized wind speed maxima that occur within the lower troposphere accompanied by decreasing wind speed above the maximum (Stensrud, 1996). LLJs have been reported all over the world under a wide range of formation mechanisms with varying characteristics and subsequently different impacts on the lower troposphere (De Jong et al., 2024; Ortiz-Amezcua et al., 2022; Lima et al., 2019, 2018; Tuononen et al., 2017; Ranjha et al., 2015; Karipot et al., 2009; Baas et al., 2009; Zhang et al., 2006; Corsmeier et al., 1997; Blackadar, 1957). In this study, we focus on long-lived nocturnal LLJs (NLLJs) to better understand their impacts on boundary layer chemistry. These NLLJs are important in moisture transport and air pollutant transport (Wei et al., 2023; Roots et al., 2023; Sullivan, 2017; Delgado et al., 2015; Weldegaber, 2009; Tollerud et al., 2008; Weaver and Nigam, 2008; Ryan, 2004; Corsmeier et al., 1997; Stensrud, 1996). We focus on furthering the study of the NLLJs reported by researchers in the east coast mid-Atlantic region of the United States. We do this by developing a framework for our future work in developing a climatology and systematic study of LLJs by characterizing their “critical characteristics” (maximum wind speed, height of maximum, duration, wind direction, etc.) and formation mechanisms (synoptic influence, temperature gradients, inertial oscillation, diurnal cycle, etc.). Herein we describe an algorithm developed to isolate southwesterly NLLJs in the study area of Maryland (MD) in the United States using the Maryland Department of the Environment's (MDE) 915 MHz DeTect RAPTOR DBS-BL/LAP-3000 radar wind profiler (RWP) stationed in Beltsville, MD. We use these systems because we hope to adapt our methods to the network of wind profilers in the area, and our region lacks sufficient decadal measurements of wind profilers from other, more commonly used systems like Doppler wind lidar.
The mid-Atlantic NLLJ, similar to the southern Great Plains (SGP) NLLJ, arises from the cooling of the low-level air mass relative to the air above it, resulting in a stratified nocturnal boundary layer and subsequent decoupling (Rabenhorst et al., 2014; Zhang et al., 2006). This decoupling facilitates the development of a low-friction residual layer where a super-geostrophic wind maximum emerges near the surface due to inertial oscillation, as described by Blackadar (1957) and later refined by Holton (1967). The genesis of NLLJs is influenced by a confluence of geography-specific atmospheric dynamics, including the formation of a pronounced temperature inversion within the stratified nocturnal boundary layer, diurnal pressure shifts, and the influence of terrain (Shapiro and Fedorovich, 2010; Holton, 1967; Blackadar, 1957). These jets typically exhibit wind speed maxima at altitudes between 200 and 800 m above ground level (a.g.l.), with directional variability governed by geographical and meteorological conditions, though they generally flow northward as per Blackadar's theory. The unique synoptic and diurnal physical conditions that define NLLJs make them more prevalent during spring and summer, when formation conditions are more favorable (Bonner, 1968; Shapiro et al., 2016; Shapiro and Fedorovich, 2010; Zhang et al., 2006). The implications of NLLJs extend significantly into weather, climate, and air quality, as they play a crucial role in the transport and mixing of atmospheric constituents such as pollutants, moisture, and heat, thereby influencing air quality and promoting cloud formation (Baas et al., 2009; Banta, 2008; Mahrt, 1998). NLLJs have been extensively documented in the Great Plains since the 1950s, where they contribute to moisture transport and regional weather, including convective storm development (Banta et al., 2003; Carroll et al., 2019, 2021; Lundquist, 2003; Stensrud, 1996; Tollerud et al., 2008; Whiteman et al., 1997). The mid-Atlantic NLLJ, though similar to the SGP NLLJ in its reliance on inertial oscillation theory and temperature gradients shaped by local topography, exhibits consistently lower wind speed maxima. It is influenced by a variety of terrain types, including mountainous regions, major bodies of water, and transitional landscapes.
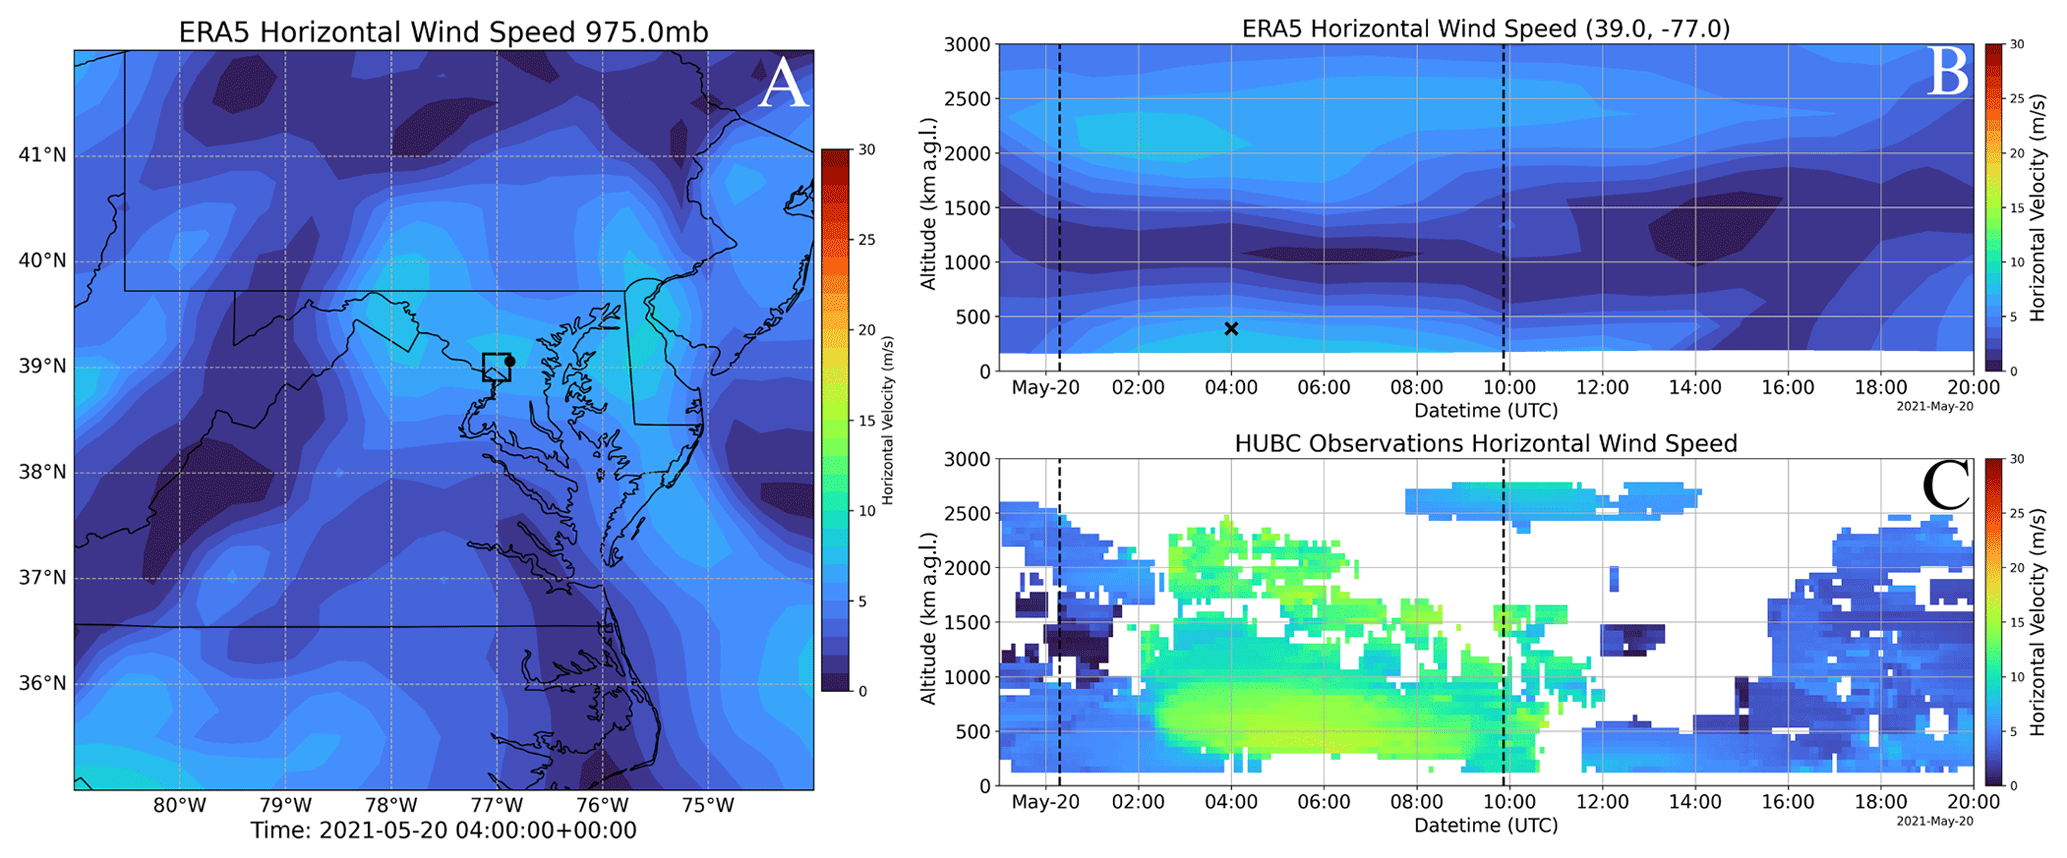
Figure 1Example depiction of the nocturnal low-level jet in the mid-Atlantic US on 20 May 2021: (a) ERA5 horizontal wind speed at 975 mbar, (b) the vertical profile evolution of the horizontal wind speed taken from a vertical slice (black square; “x” denotes 975 mbar at 04:00 UTC), (c) the radar wind profiler observations of horizontal wind speed from the location denoted by the black circle in panel (a). Dashed vertical lines indicate the sunset and sunrise times, respectively.
We define the mid-Atlantic NLLJ closely following the results found by Zhang et al. (2006) and Ryan (2004) in their Fort Meade, MD, RWP (decommissioned in 2006) observations. These studies provide detailed observations and analysis of NLLJ events, mainly focusing on their occurrence, structure, and dynamics within the mid-Atlantic region of the United States. According to Zhang et al. (2006) and Ryan (2004), the mid-Atlantic NLLJ is characterized by a robust and low-level wind speed maximum that typically occurs during the nighttime hours. These jets are predominantly observed during the warm season (late spring through early fall). The studies noted that winds from the south and southwest directions dominate most of the mid-Atlantic NLLJs. Figure 1 provides an illustrative example of the spatial and temporal extent of the mid-Atlantic nocturnal low-level jet (NLLJ) as depicted by an event reported on 20 May 2021, by Roots et al. (2023): panel A displays the European Centre for Medium-Range Weather Forecasts Reanalysis v5 (ERA5; Hersbach et al., 2020) reanalysis data at 0.25° spatial and hourly temporal resolution, showing horizontal wind speeds at 975 mbar (chosen to be near the core of the NLLJ in both the model and observations) and highlighting the spatial distribution of the NLLJ across the region. Panel B presents the vertical evolution of the horizontal wind speed along a vertical slice (indicated by the black square in panel A), capturing the temporal progression of the jet's strength and altitude through the night. Panel C demonstrates the horizontal wind speed profile observed at our site (black circle), capturing a well-defined NLLJ core with wind speeds exceeding 15 m s−1 centered at 500 m a.g.l. between 04:00–08:00 UTC. In contrast, the ERA5 reanalysis data shown in panel B fail to resolve the NLLJ, displaying significantly weaker wind speeds, with a maximum of around 7 m s−1, and lacking in pronounced vertical structure evident in the observations. This comparison highlights the value of high-resolution wind observations for accurately characterizing the jet's core height, intensity, and temporal evolution. Such deficiencies underscore its limitations for studying phenomena like the NLLJ that play a critical role in boundary layer dynamics and chemistry. The impact of NLLJs on air pollution in the mid-Atlantic is particularly significant during warm seasons, as these jets contribute to the transport of pollutants across the east coast, elevating surface ozone and particulate matter concentrations (Delgado et al., 2015; Roots et al., 2023; Sullivan, 2017; Weldegaber, 2009; Ryan, 2004). Zhang et al. (2006) reported that approximately 60 % of the mid-Atlantic NLLJs observed during their study period (warm seasons in 2001 and 2002) exhibited this southerly and southwesterly wind direction. Ryan (2004) contributed to our definition by providing insights into the frequency and timing of NLLJ occurrences, noting that these events were common during the study period from 1998 to 2002, identifying 80 warm-season cases in total. Together, the work of Zhang et al. (2006) and Ryan (2004) defines the mid-Atlantic NLLJ as a nocturnal atmospheric phenomenon characterized by a significant increase in wind speed (∼ 15 m s−1) at low altitudes (400–600 m a.g.l.), typically showing a preferential direction from the south or southwest.
This work presents the culmination of an investigation into the NLLJ phenomena within the mid-Atlantic region, leveraging a supervised-machine-learning model tested against a comprehensive dataset including previously reported NLLJ events. The model, designed with a focus on advancing our capability to detect and analyze NLLJs, was evaluated using cases from notable studies by Sullivan et al. (2017), Delgado et al. (2015), and Weldegaber (2009) based on data from the RWP stationed in Beltsville, Maryland, US (39.05° N, 76.87° W; 135 m a.s.l.). Without established benchmarks for NLLJ detection accuracy, our analysis adopts a qualitative approach, emphasizing visual inspection to assess the model's performance in accurately capturing NLLJ characteristics, particularly wind speed and direction. The primary objective of this research is to transition from episodic, qualitative analyses to a systematic, quantitative understanding of NLLJ physics and its impacts, utilizing observational data to explore the temporal distribution, morphology, and statistical properties of mid-Atlantic NLLJs. Furthermore, developing a generalized representation of mid-Atlantic NLLJs based on observational data marks a significant step forward in our ability to identify and analyze these phenomena.
The rest of the paper is structured as follows: Sect. 2 outlines the dataset and study area. Section 3 describes the methods, alongside the development and application of machine learning algorithms for detecting NLLJ features. Section 4 evaluates the performance of these algorithms in isolating NLLJ characteristics within the wind profile data, addressing the efficacy and limitations encountered. Section 4 also presents a brief analysis of the NLLJs identified by the RWP from May to September 2017 to 2021, revealing insights into their morphological characteristics. Finally, Sect. 5 synthesizes the study's key findings and discusses their implications for the understanding of the mid-Atlantic NLLJ and similar atmospheric phenomena, proposing directions for future research to enhance model accuracy and expand the scope of study within the field of atmospheric science.
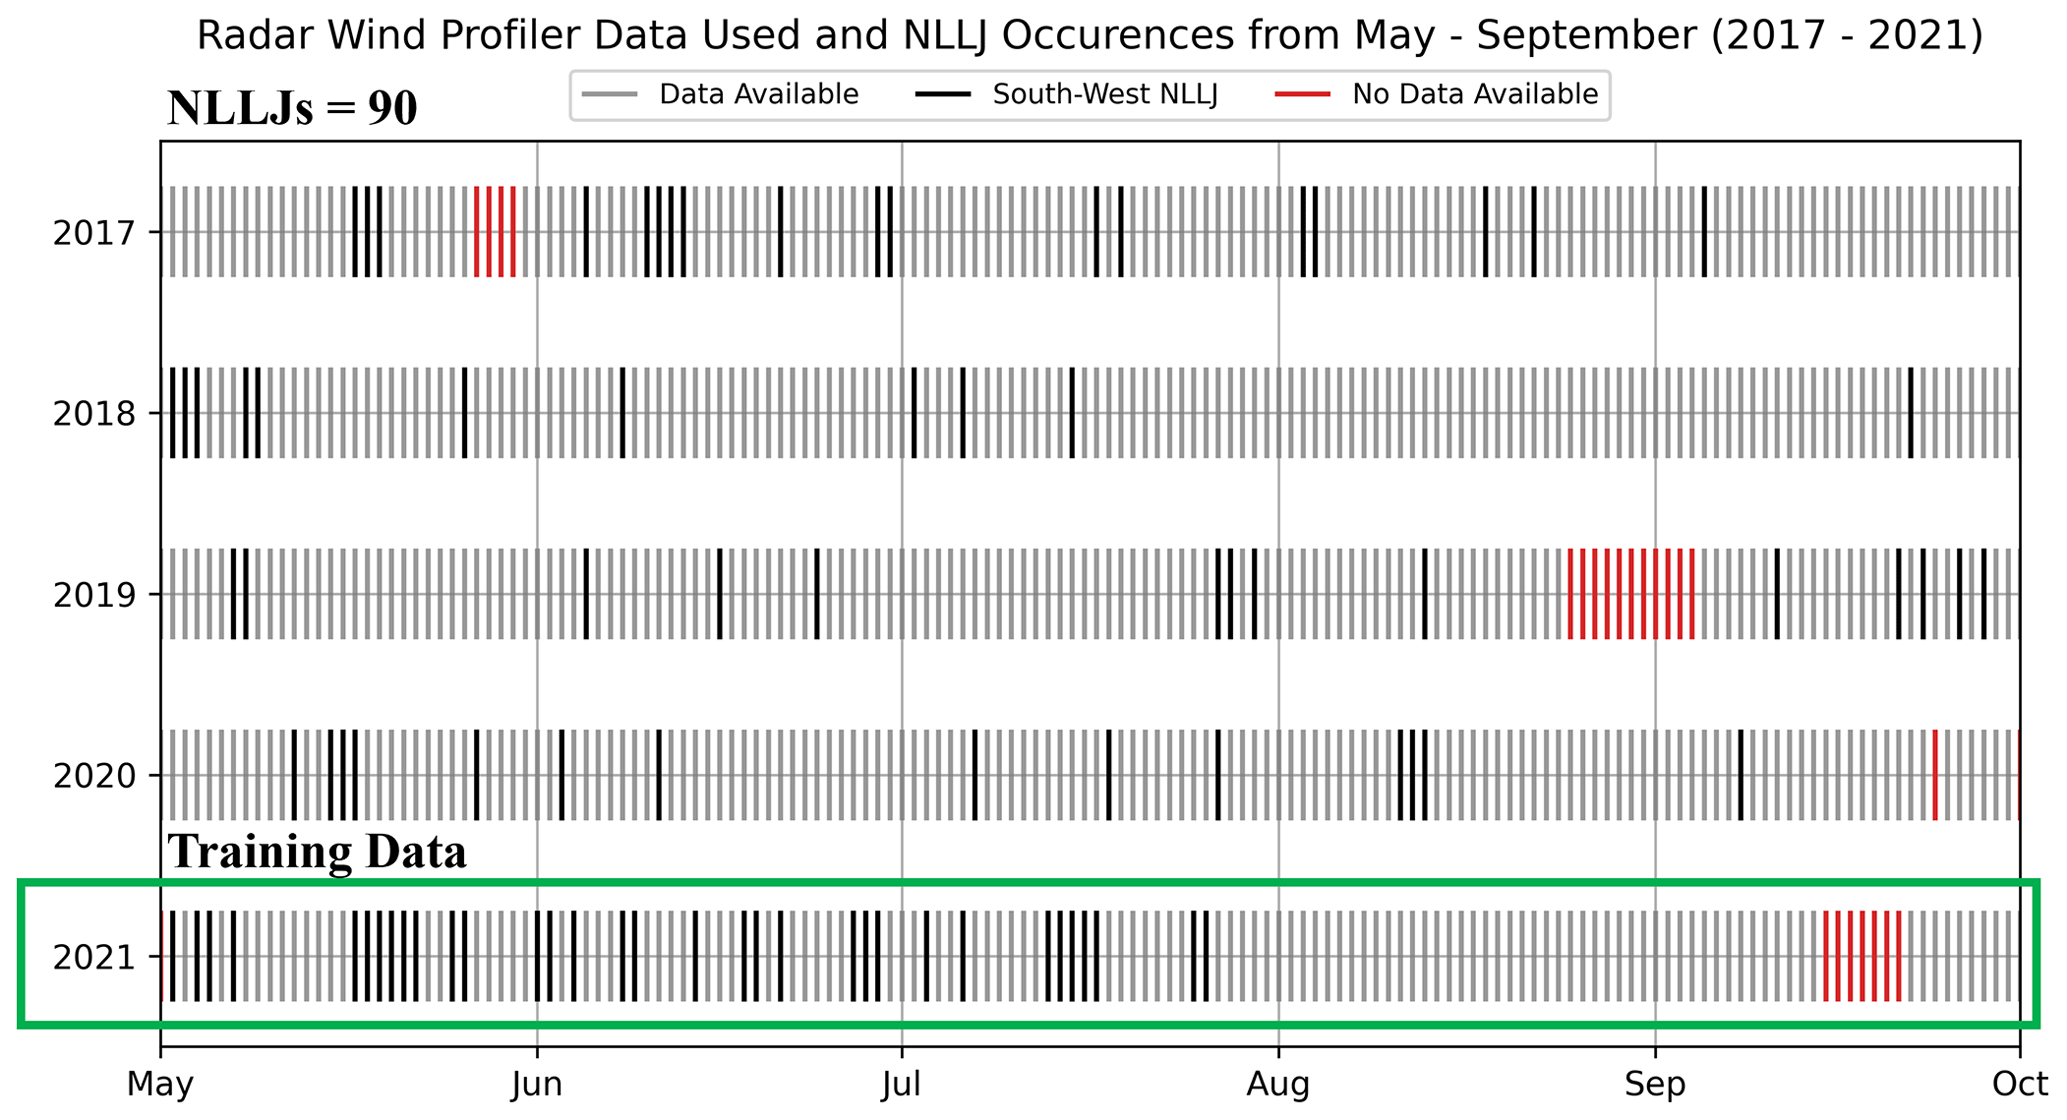
Figure 2Occurrences of NLLJs (black lines) identified by the algorithm from the Beltsville, MD, RWP data. Red lines indicate periods with missing data, while gray lines represent available data used in this study. The green box highlights the year from which the training dataset was derived.
This study uses the dataset of continuous daily wind profiles from the Howard University Beltsville Campus (HUBC) RWP, located in Beltsville, MD (instrument named BELT; see Fig. 1b for location, marked by the black circle). The HUBC site lies between the US Appalachian Mountains to the west and the Chesapeake Bay and Atlantic Ocean to the east. The Appalachian Mountains, located approximately 200 km to the west, with peaks reaching around 2 km a.s.l., exert a distinct orographic influence. HUBC resides in the Piedmont region, a transitional zone between the mountains and the coastal plains, which creates boundaries for a latitudinal flow regime shaped by both orographic effects to the west and thermal influences to the east.
The dataset from HUBC is depicted in Fig. 2, with an event plot showing the temporal distribution of data availability. Gray lines indicate times when daily files were available from the MDE record, while red lines denote periods of unavailability due to instrument failure or scheduled maintenance. Only 25 files were missing during the May–September period of 2017–2021, providing an optimal dataset for analyzing the summertime mid-Atlantic NLLJ.
The RWP instrument measures radial wind velocity using one zenith and four azimuthal beams at 915 MHz, providing horizontal wind speed and direction with sub-100 m vertical resolution (100–3000 m a.g.l.) at a temporal resolution of less than 30 min. This resolution is sufficient to capture the temporal and vertical extent of NLLJ events at the HUBC site. The selection of this training period ensures that the model is exposed to a broad range of conditions typical of the NLLJ season, improving its ability to generalize and accurately detect NLLJs. However, data gaps, indicated by the vertical red bars, may present challenges, as they could coincide with NLLJ events, potentially limiting the capture of all occurrences.
Several previous works have been published regarding the identification of low-level jets in wind profiles. These methods have employed peak detection of wind speed maximums in single profiles with threshold criteria on coherent height, speed, direction, and duration. These methods are robust in their objective of identifying continuous low-level wind maxima (De Jong et al., 2024; Tuononen et al., 2017; Baas et al., 2009). Our overall goal is to complete a fully automated system to be used on the network of wind profiles that is adept at identifying, classifying, and characterizing low-level wind maxima, and thus we report our exploration of supervised machine learning for this task. The conceptual model of the detection method presented here relies only on the wind speed (SPD), wind direction (DIR), radial velocity (RAD 1–5), and signal-to-noise ratio (SNR 1–5) at each altitude and time step of the dataset.
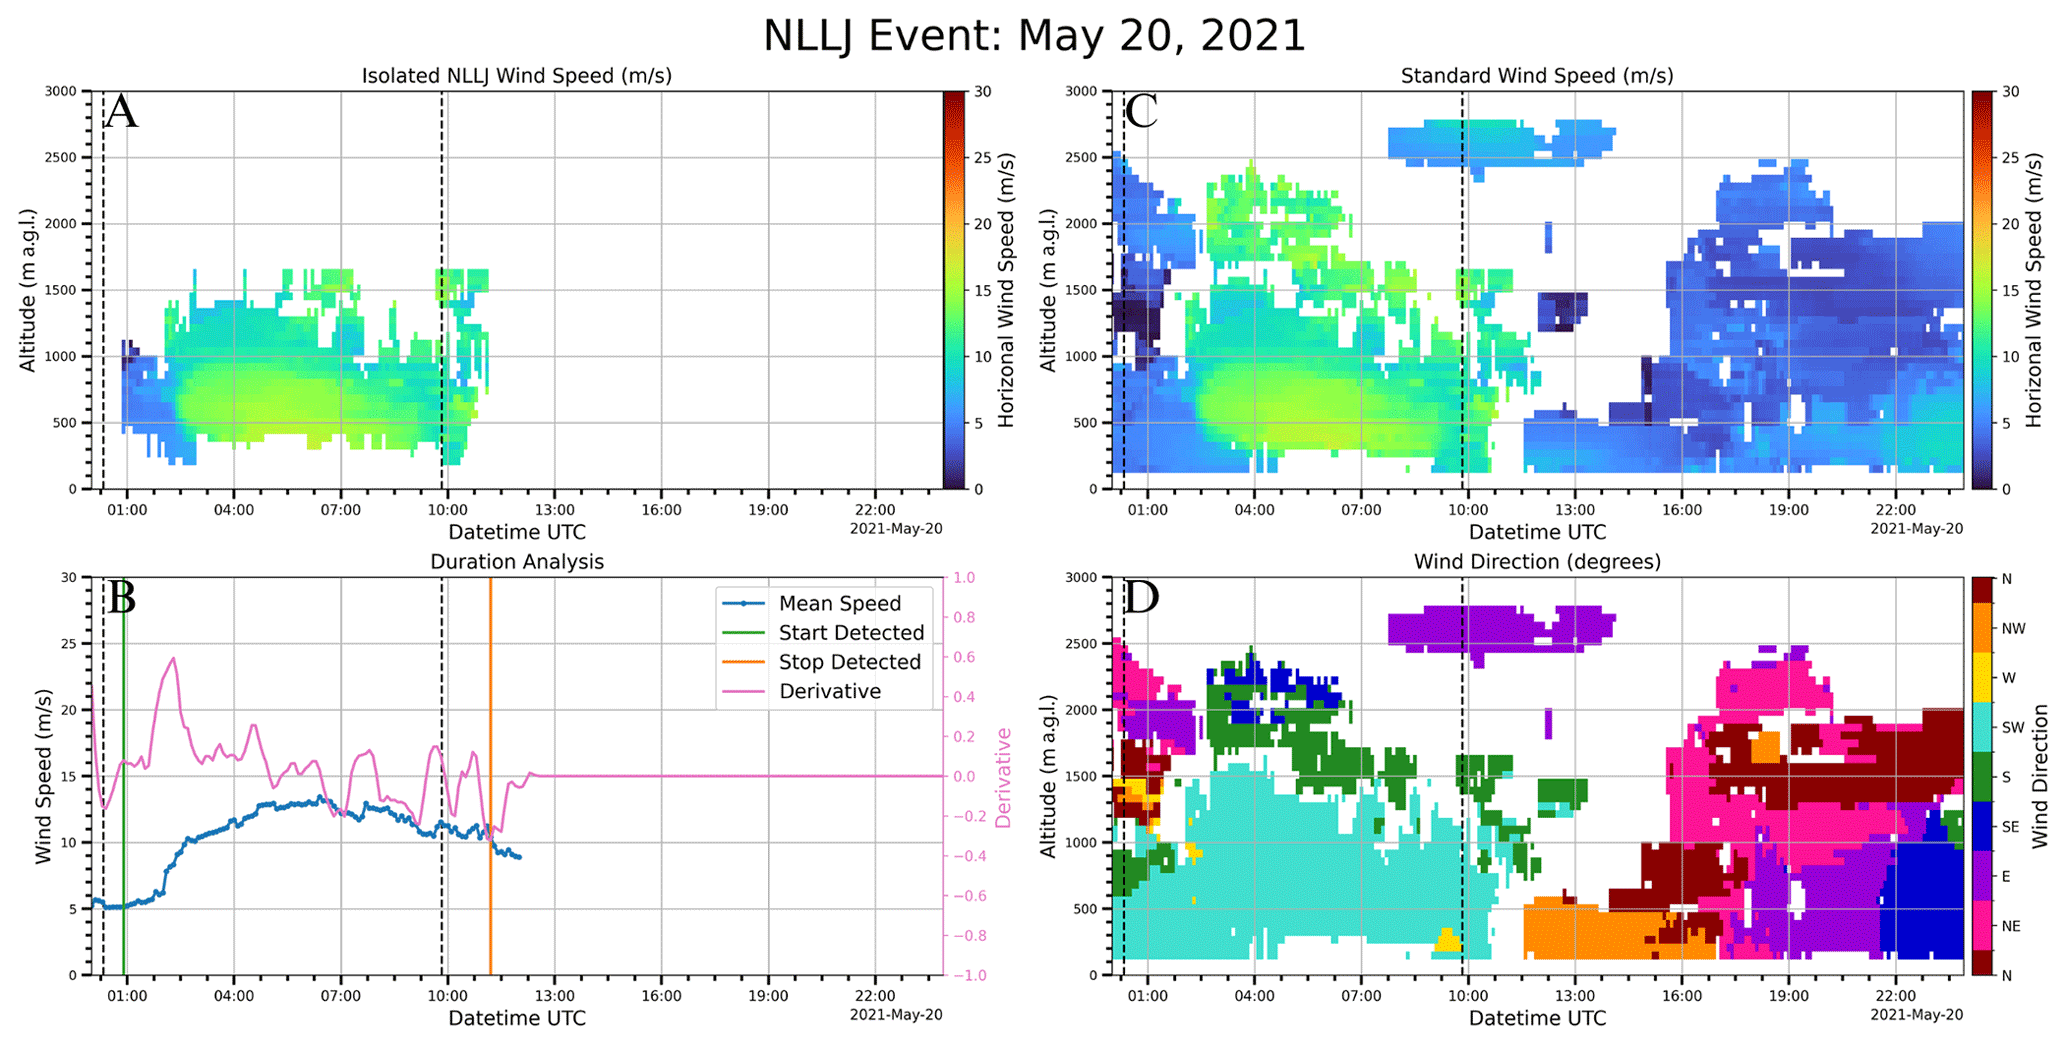
Figure 3Sample of training dataset creation using masking and gradient peak detection in the time and altitude dimensions: (a) isolated NLLJ, (b) gradient peak detection on the time axis with only southerly winds, full profile of (c) wind speed and (d) direction. Vertical dashed black lines denote sunrise and sunset.
3.1 Training dataset
The training dataset for this experiment was sampled from NLLJ events during 2021, while the validation dataset was selected from previously reported events, as depicted by Sullivan et al. (2017), Delgado et al. (2015), and Weldegaber (2009), all captured using the same instrument and station (i.e., HUBC-RWP). To gather a suitable dataset for machine learning, we have compiled scenarios expected in operation (e.g., incomplete daily files, missing data, large-scale weather systems, etc.). A manual and rudimentary isolation method was applied using gradient detection solely on the southerly winds (180–270° from the north) with maximums greater than 5 m s−1 in both time and altitude to capture the evolution and vertical extent of the NLLJ. This approach is demonstrated in Fig. 3, where panel A depicts the final isolated NLLJ events from the speed and direction profile (panels C and D), and panel B represents the visual representation of the gradient detection in the temporal evolution. This method takes the wind speed evolution averaged from 0–2000 m and then interpolated and smoothed. The resulting time series is then used to find the first positive gradient and the last negative gradient, which are taken as the start and end of the NLLJ event. This process is then repeated for the vertical extent using each profile to find the top and bottom at each time step. We found that the manual tuning needed for thresholds on time constraint, continuity, and direction evolution was important for isolating NLLJs but required attention in many different cases, and thus we used the well-isolated cases from this method as a training set for the supervised-machine-learning ensemble. The training set is comprised of 50 NLLJ events that were sufficiently isolated and 50 events that contain low-level wind maxima that we do not consider to be LLJ-relevant in this study for reasons of direction or evolution.
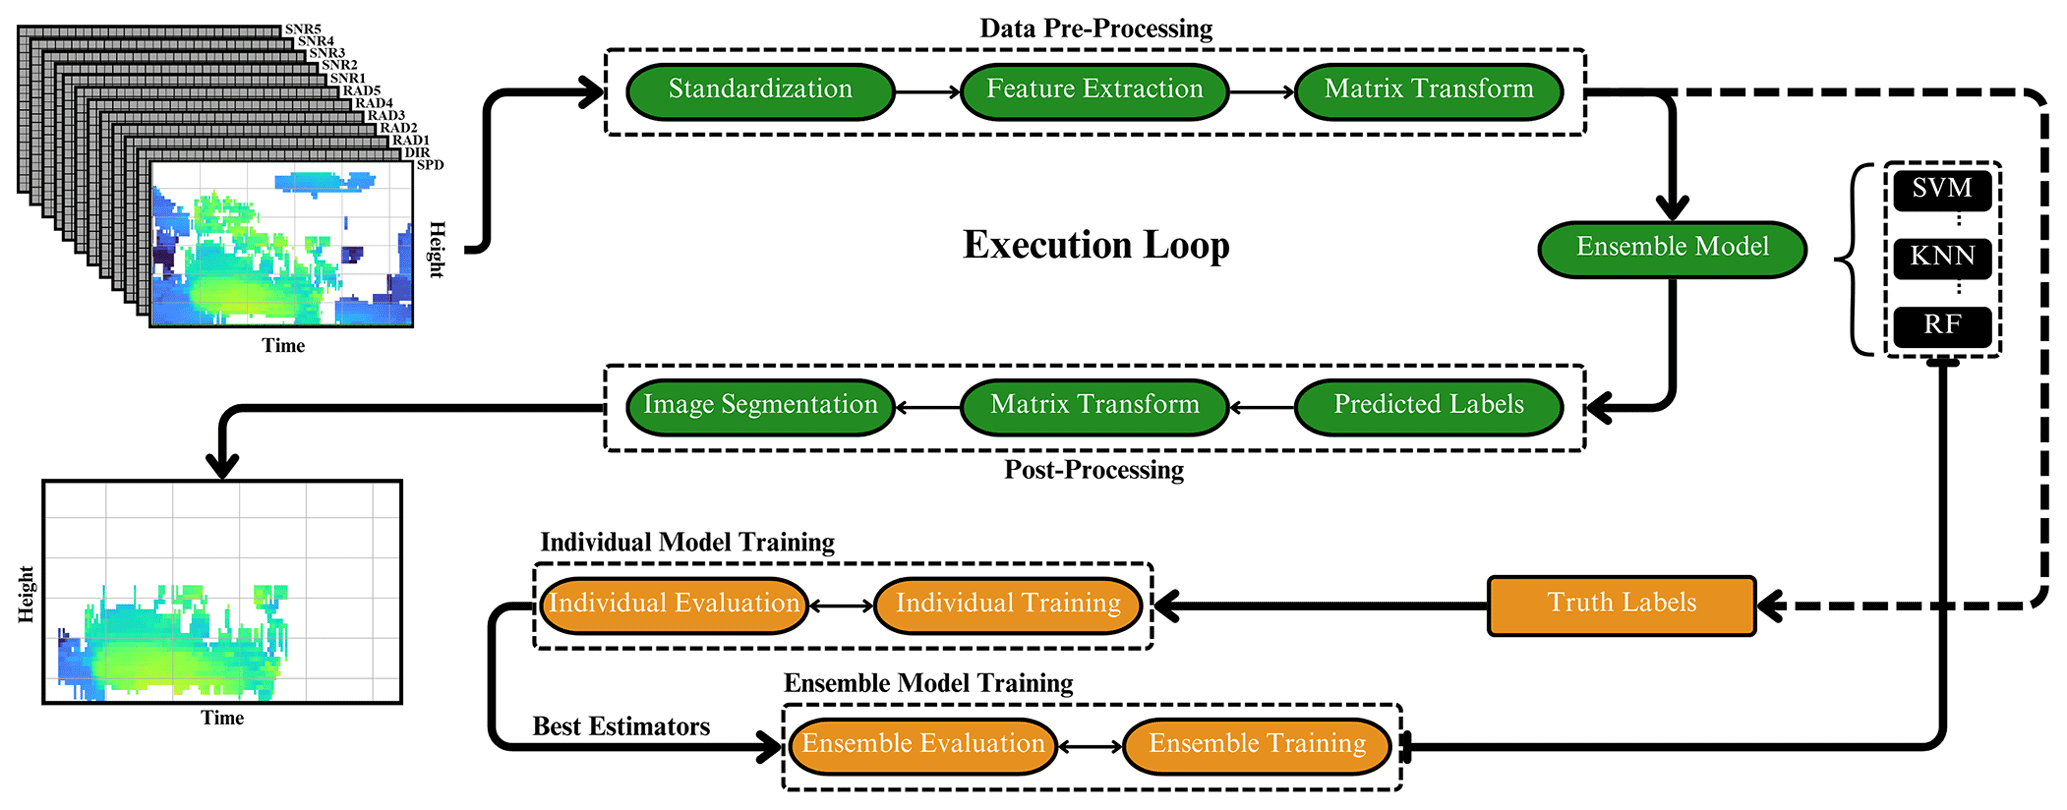
Figure 4Schematic of the supervised-machine-learning algorithm execution (top: green) and training (bottom: orange).
3.2 Algorithm development
The flowchart schema shown in Fig. 4 illustrates the process used to execute (green) and train (orange) the supervised-machine-learning algorithm for detecting NLLJ events in vertically resolved wind profiles. The process begins with data pre-processing, where daily files from the RWP instrument are submitted and then standardized in both height and vertical resolution to ensure the uniformity of profiles. This was accomplished by re-gridding for time and altitude, coupled with the strategic filling of missing data points with “not-a-number” (NaN) placeholders, thereby ensuring that the dataset maintained uniform dimensions across all the datasets. Following this, feature extraction is performed, extracting the critical variables (i.e., wind speed, wind direction, radial velocities, the averaged signal-to-noise ratios, height, and time). These parameters (or features) are then transformed into a single matrix where the columns indicate the features, and rows indicate the indexes of each variable at a given time and height, in turn creating a structured dataset ready for input into the machine learning model. The output of the model is then matched to the input matrix as predicted labels, which then undergo the reverse matrix transform from the data pre-processing, and an image segmentation process is applied to return the largest cluster of identified points as an NLLJ event. The image segmentation process will not be employed in the results of this work to show its importance and demonstrate the shortcomings of this approach and how it can propagate through to the analysis.
Central to the detection process (execution loop) is the ensemble model, which integrates multiple supervised-machine-learning algorithms, specifically the support vector machine (SVM), k-nearest neighbors (KNNs), and random forest (RF), all of which are available and open-source in Python with the scikit-learn package (Pedregosa et al., 2011). Each model in this ensemble contributes uniquely to the overall predictive capability by leveraging different mathematical principles. The SVM works by identifying a hyperplane in high-dimensional space that best separates the data points of different classes to maximize the distance between the hyperplane and the nearest data points from each class, known as support vectors (Cortes and Vapnik, 1995). The KNN approach operates on a different principle, classifying a data point based on the majority class among the “k”-nearest neighbors in the feature space, with the Euclidean distance used as the metric for determining proximity, where the algorithm then assigns the class most common among the nearest neighbors (Cover and Hart, 1967). The RF model is itself an ensemble of decision trees, each trained on a randomly selected subset of the dataset, in terms of samples and features. Each decision tree in the random forest individually classifies the data by making splits based on criteria such as information gain, entropy, and minimization of Gini impurity. The final classification by the RF is determined by the majority vote of the decision trees, ensuring that the model captures a broad array of patterns in the data (Breiman, 2001). By integrating the insights gained from each model's approach into a two-thirds-majority voting system we have found that this approach yields a suitable method of isolating NLLJ features in wind profiles.
As shown in Fig. 2, we have identified 90 warm-season (May–September) NLLJ events using the Beltsville, MD, RWP dataset from 2017 to 2021. This builds on the work of Zhang et al. (2006) and Ryan (2004), who established much of the mid-Atlantic NLLJ frequency analysis based on wind profile observations from an earlier version of the RWP instrument, stationed at Fort Meade, MD (∼ 10 km from Beltsville, MD). Their statistics defined the southwesterly mid-Atlantic NLLJ as a predominantly summertime nocturnal-boundary-layer phenomenon. Ryan (2004) reported 80 summer season events over a 5-year period (1998–2002), compared to the 90 events identified in our analysis. The algorithm used to identify these events and the subsequent analysis of the NLLJ characteristics are discussed below.
4.1 Algorithm evaluation
The process of evaluating the performance of the algorithm is complex due to the absence of an absolute ground truth for NLLJ detection. The training dataset, or truth labels, represents our best attempt at programmatically isolating NLLJs, yet this process is challenging because it lacks a definitive standard for what constitutes true NLLJ activity located at every measurement point of the wind profile datasets. To address this complexity, the evaluation approach involves two critical stages following the training phase. The first stage entails comparing the algorithm's results against the gradient method (see Sect. 3.1), which serves as a quantitative benchmark. The second stage involves a qualitative visual inspection by a trained observer, providing an additional layer of evaluation that helps mitigate the challenges posed by the absence of a standardized metric for NLLJ detection. The flowchart from Fig. 4 (orange) provides a visual representation of the training process, beginning with the selection of the best estimators. This selection process involves a search routine for hyperparameters that score the highest in each model; see Fig. 5 for the results of the best estimators. Once the best estimators are identified, they are combined into an ensemble model, which is then fully trained on the remaining unseen portion of the training dataset and evaluated against the supplied truth labels. The final stage involves applying this trained model to previously reported and depicted NLLJs from previous research studies such as those conducted by Sullivan et al. (2017), Delgado et al. (2015), and Weldegaber (2009), all of which used the same instrumentation in the same study area.
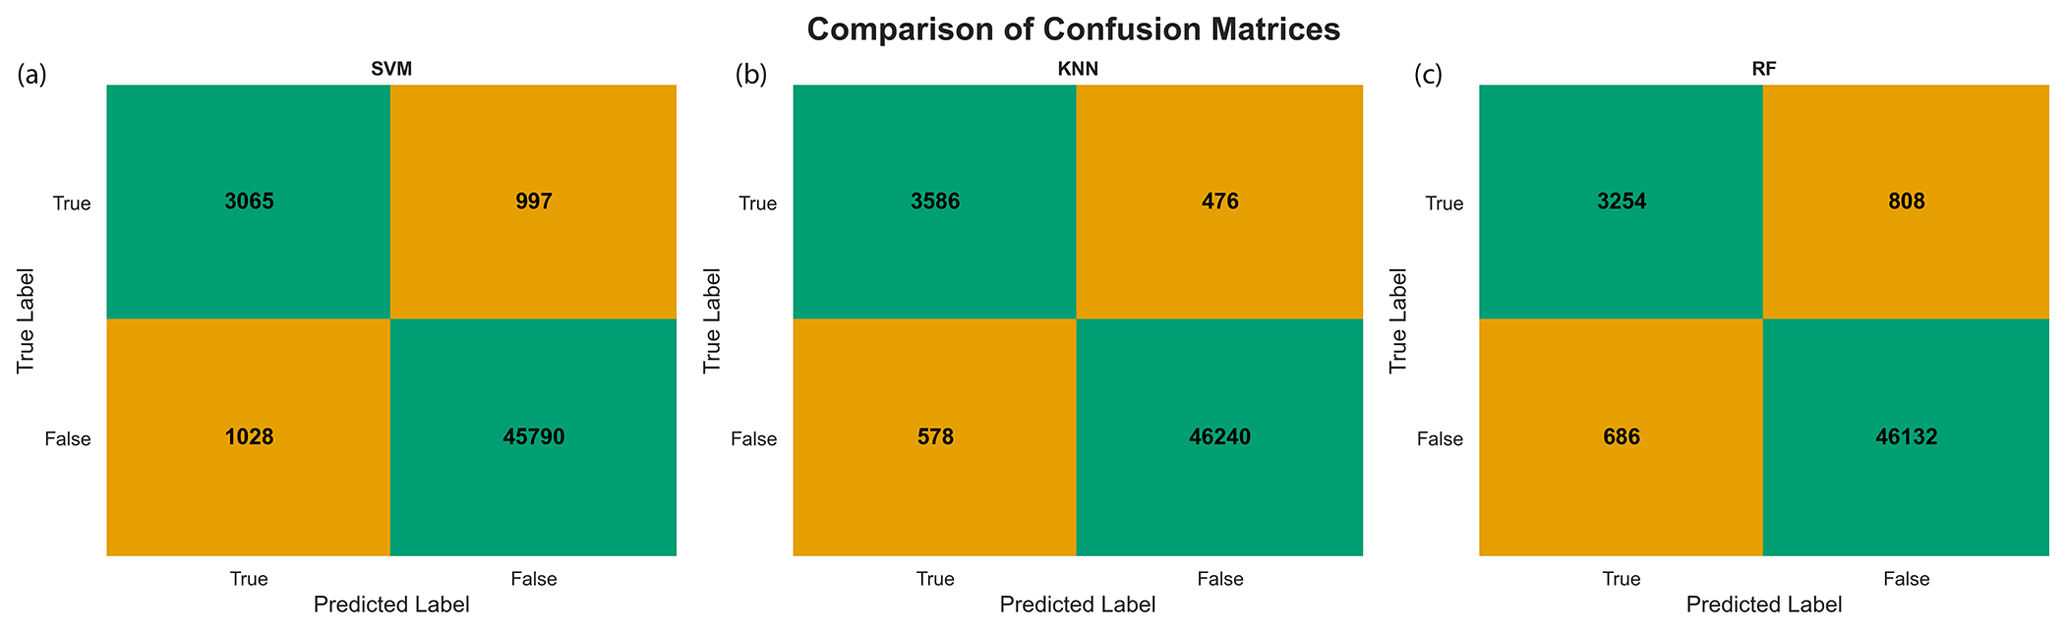
Figure 5Model training confusion matrices: green shows points correctly labeled by the algorithms, while orange shows incorrectly labeled points. The top left indicates true-positive labels, the bottom right indicates true-negative labels, the bottom left indicates false-positive labels, and the top right indicates false-negative labels.
Figure 5 illustrates a comparison of confusion matrices from training the machine learning algorithms, where the individual algorithm matrices show results from ∼ 16 daily files from the training dataset, and the ensemble matrix shows results from ∼ 64 daily files. Each confusion matrix provides a breakdown of the model's performance by showing the counts of true negatives (bottom right quadrant, green), true positives (top left quadrant, green), false positives (bottom left quadrant, orange), and false negatives (top right quadrant, orange). Overall, each shows a strong ability to correctly determine non-NLLJ activity, exhibits relatively balanced performance in the case of false negatives and false positives, and is able to correctly predict true positives relatively consistently. We attribute these results to the implementation of rigorous cross-validation and tuning of hyperparameters in a two-stage process (see Fig. 4 individual and ensemble model training). This was done to address the sparseness of NLLJ features in the training dataset. Note that these scores are based on the truth labels supplied, which themselves are imperfect isolations of NLLJ features (see Fig. 2). With this in mind, we reserved our final judgment for visual inspection of performance with mid-Atlantic NLLJs depicted in previous literature for validation of testing results.
Figure 6 illustrates the results of this inspection from the observations of BELT on 12 June 2015 (Sullivan et al., 2017), 3 August 2007, and 12 June 2008 (Delgado et al., 2015; Weldegaber, 2009). The figure is organized into three key panels for each event: isolated NLLJ activity (panels A1, B1, C1), horizontal wind speed (panels A2, B2, C2), and wind direction (panels A3, B3, C3). These panels plot the data against altitude and time, with sunrise and sunset times indicated by dashed vertical lines. In panels A1, B1, and C1, the algorithm effectively demonstrates its capability to detect the characteristic wind speed maximums and corresponding wind direction shifts indicative of NLLJ events. These panels highlight the algorithm's proficiency in identifying the vertical structure and temporal evolution of these jets, capturing key phases such as the onset, peak, and dissipation of the NLLJ events. However as noted by the outliers and dashed boxes in Fig. 6, the algorithm does have certain limitations.
On 12 June 2015, the wind speed shows a well-defined NLLJ structure, with wind speeds peaking in the early morning. The corresponding wind direction data for the same date transitions from southerly in the early hours to westerly later in the day, a directional shift that the model effectively captures. The capability of the model to detect these patterns is crucial. It suggests that the model can identify the presence of an NLLJ and its evolution over time. On 14 June 2008, the initial wind speed data might suggest that the NLLJ event concluded by 15:00 UTC; however, the wind direction gradients reveal the transition to a westerly-dominated regime, thus indicating the end of the NLLJ event at 12:00 UTC. The wind direction data from this date indicate a significant shift, with winds starting from a southerly direction and transitioning to a westerly direction as the day progresses. This shift to westerly-dominated high wind speeds indicates the kind of directional change the model can discern, echoing the findings of Rabenhorst et al. (2014) regarding the transitional phases of Appalachian downslope winds.
The circles indicate instances where the algorithm may have falsely identified NLLJ activity, suggesting potential issues of overestimation. This overestimation could be attributed to imperfections in the training dataset, which may cause the model to be overly sensitive to features that do not necessarily correspond to genuine NLLJ events. On the other hand, the dashed boxes highlight regions where the algorithm struggles to accurately identify NLLJ activity. For example, in the events observed on 12 June 2015 and 3 August 2007, the algorithm appears to have difficulty accurately representing the lower boundary of the NLLJ. This difficulty is likely due to a less pronounced NLLJ signal in the vertical profile, making it challenging for the model to distinguish the NLLJ from surrounding atmospheric conditions. The consistent issue of missed lower-level structures across different test cases suggests that modifications to the training set could significantly enhance the model's performance. The presence of outlier points in the visualized data further underscores the necessity for additional post-processing steps, such as image segmentation (Fig. 4), to refine the model output and reduce the occurrence of false positives. The dashed box in the 14 June 2008 observation marks an area where the core of the NLLJ was not identified by the algorithm. This oversight seems to result from a sharp increase in wind speed coupled with only a slight directional shift, leading to a case of false negatives. That withstanding, the isolated NLLJ activity aligns well with the analysis discussions from the literature, validating the potential for supervised machine learning to be proficient in this task of discerning NLLJs from the broader atmospheric flow. The level of accuracy achieved is sufficient to support robust long-term statistical analysis, which is critical for advancing our understanding of NLLJs and their impact on regional atmospheric composition.
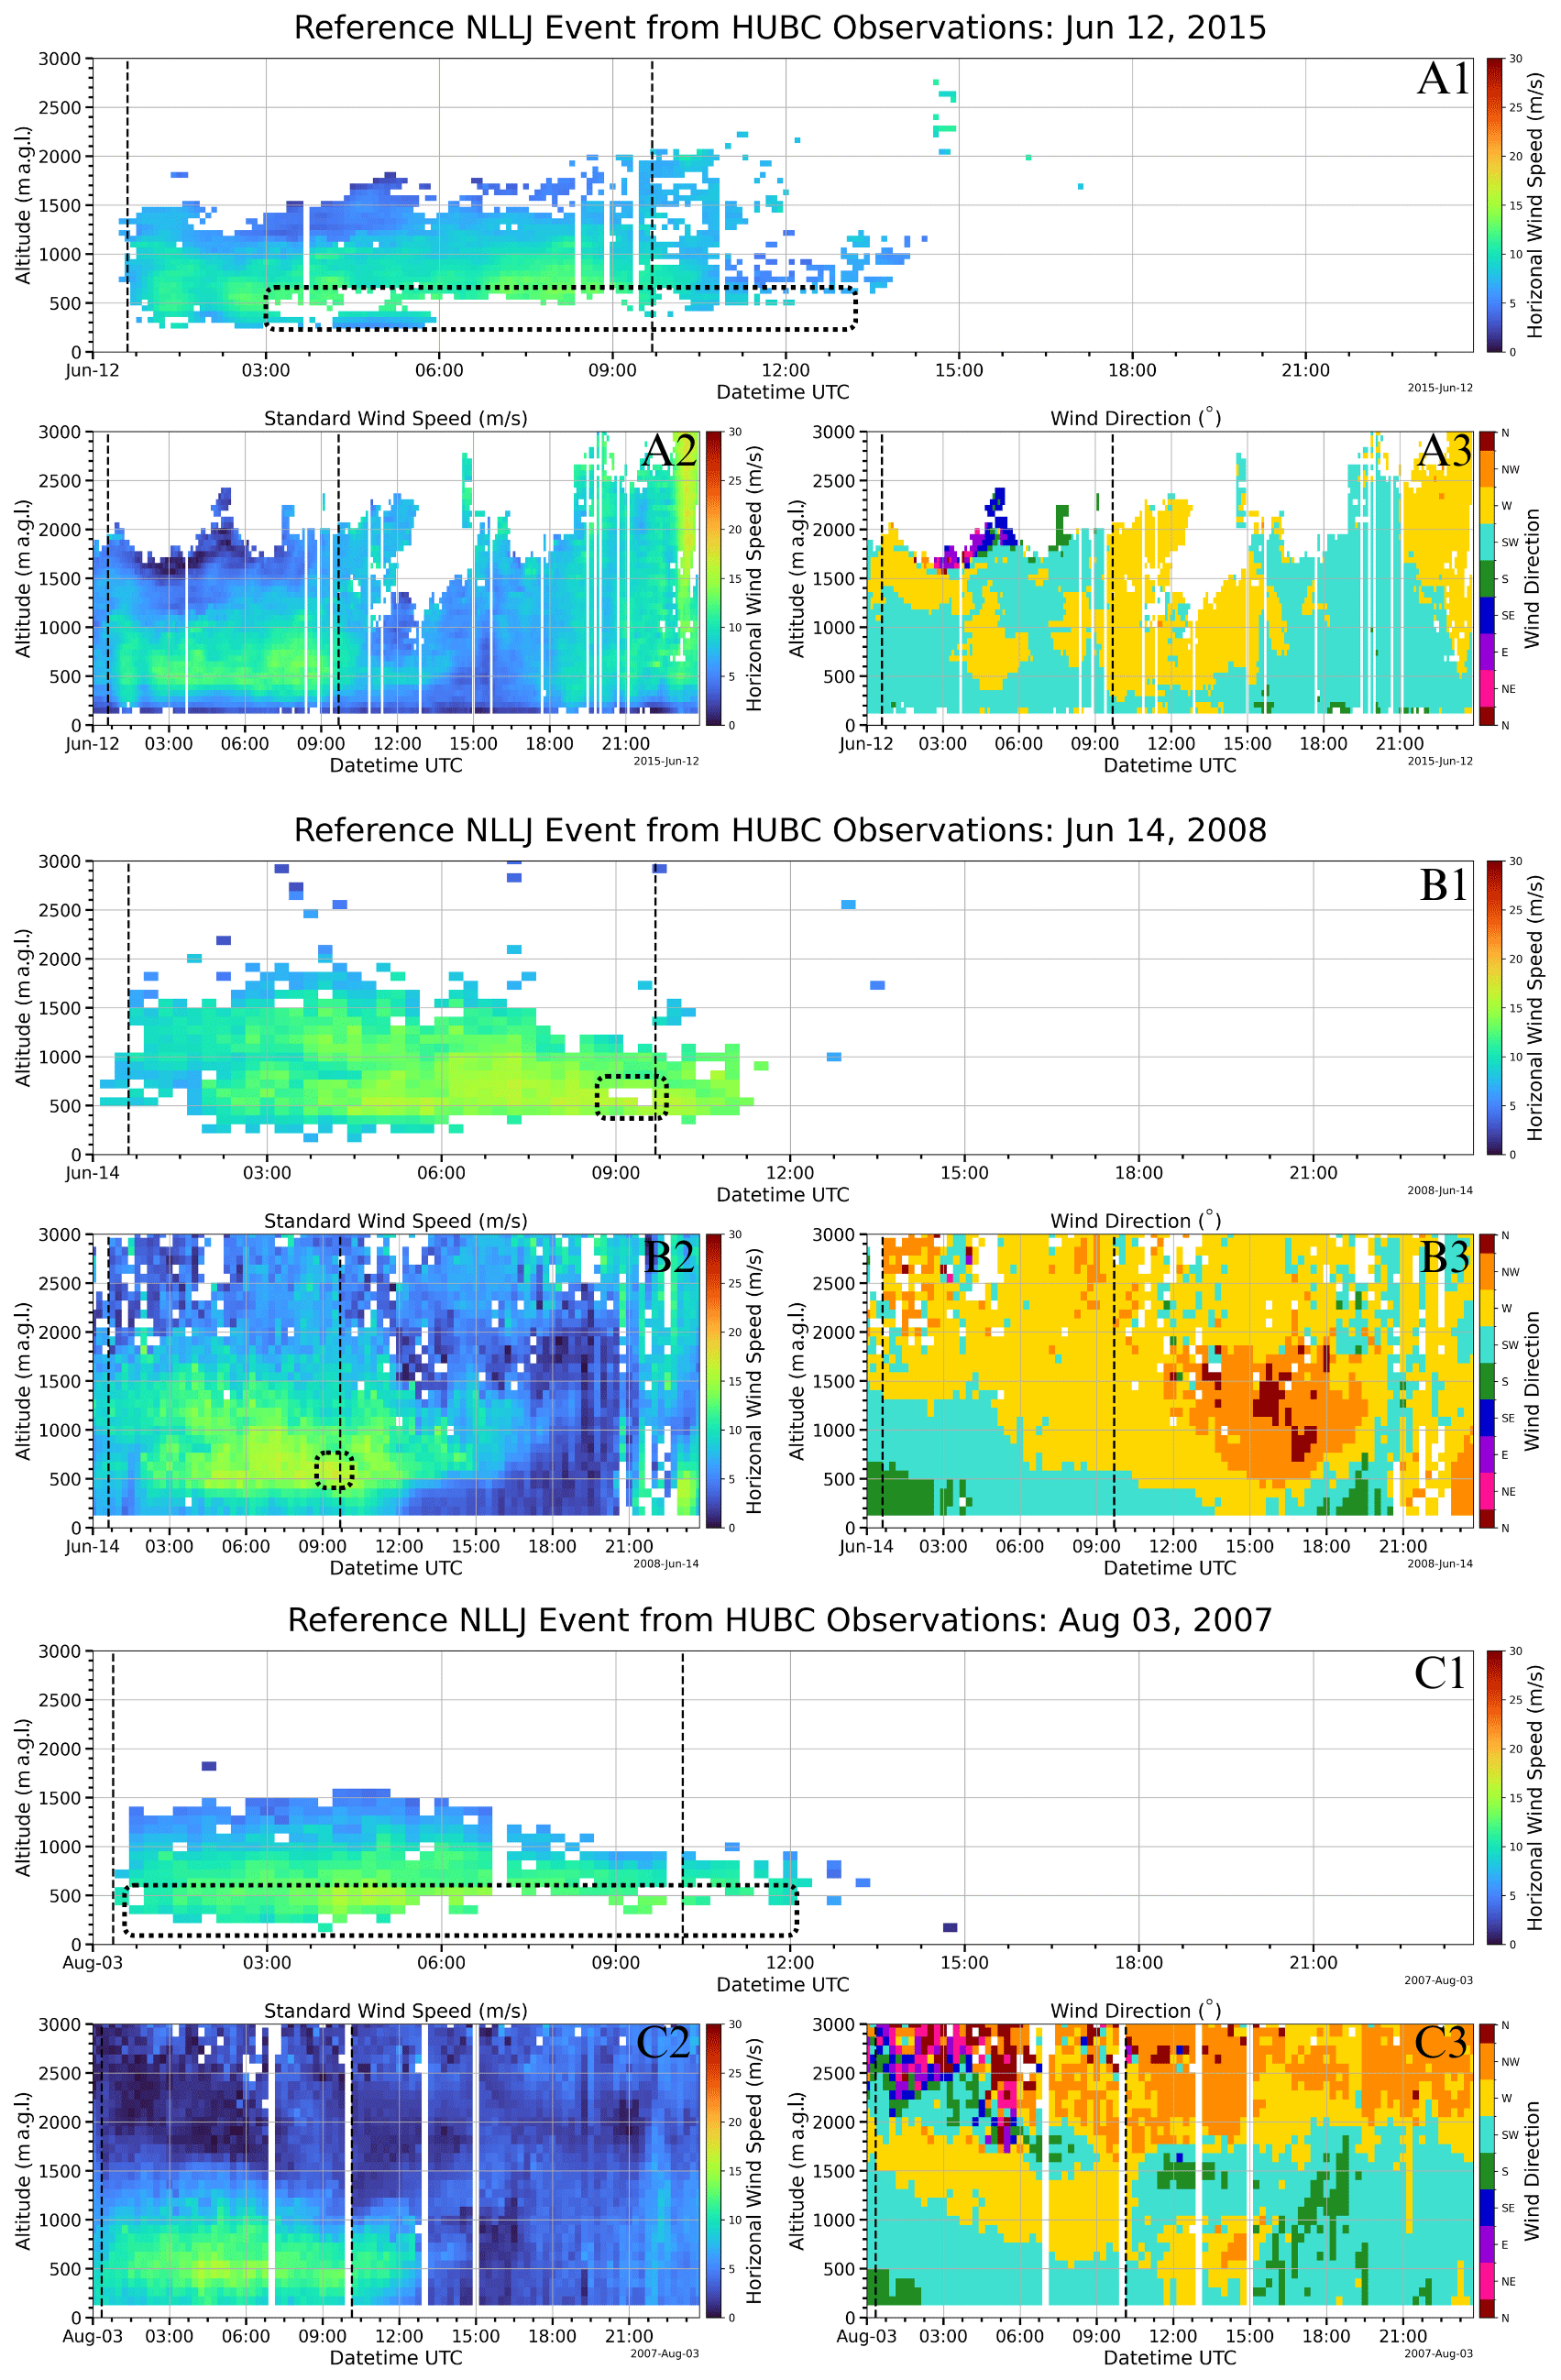
Figure 6Evaluation of NLLJ isolation algorithm with reference events from the literature illustrating the evolution of the NLLJ events reported on (a) 12 June 2015 (Sullivan et al., 2017) and on 3 August 2007 and 12 June 2008 (Delgado et al., 2015; Weldegaber, 2009), where panels (a1), (b1), and (c1) show the isolated NLLJ; panels (a2), (b2), and (c2) show the horizontal wind speed; and panels (a3), (b3), and (c3) show the wind direction.
4.2 Statistical analysis
To investigate the critical characteristics of the mid-Atlantic southwesterly NLLJ, we performed a preliminary statistical analysis of the 90 NLLJ events we have identified. The histograms, shown in Fig. 7, provide a statistical representation of maximum wind speeds, core heights, and core time for each NLLJ event, as derived from the dataset of 90 NLLJ events shown in Fig. 7. Figure 7a shows the distribution of maximum wind speed of each jet event, spanning 5 m s−1 to nearly 30 m s−1. The wind speed maximum probability density curve (orange) suggests that the most probable core speeds are between 10 and 15 m s−1, with decreasing probability between 15 and 20 m s−1 and the least probable being between 20 and 30 m s−1. This would suggest that a similar formation mechanism exists in the most probable range.
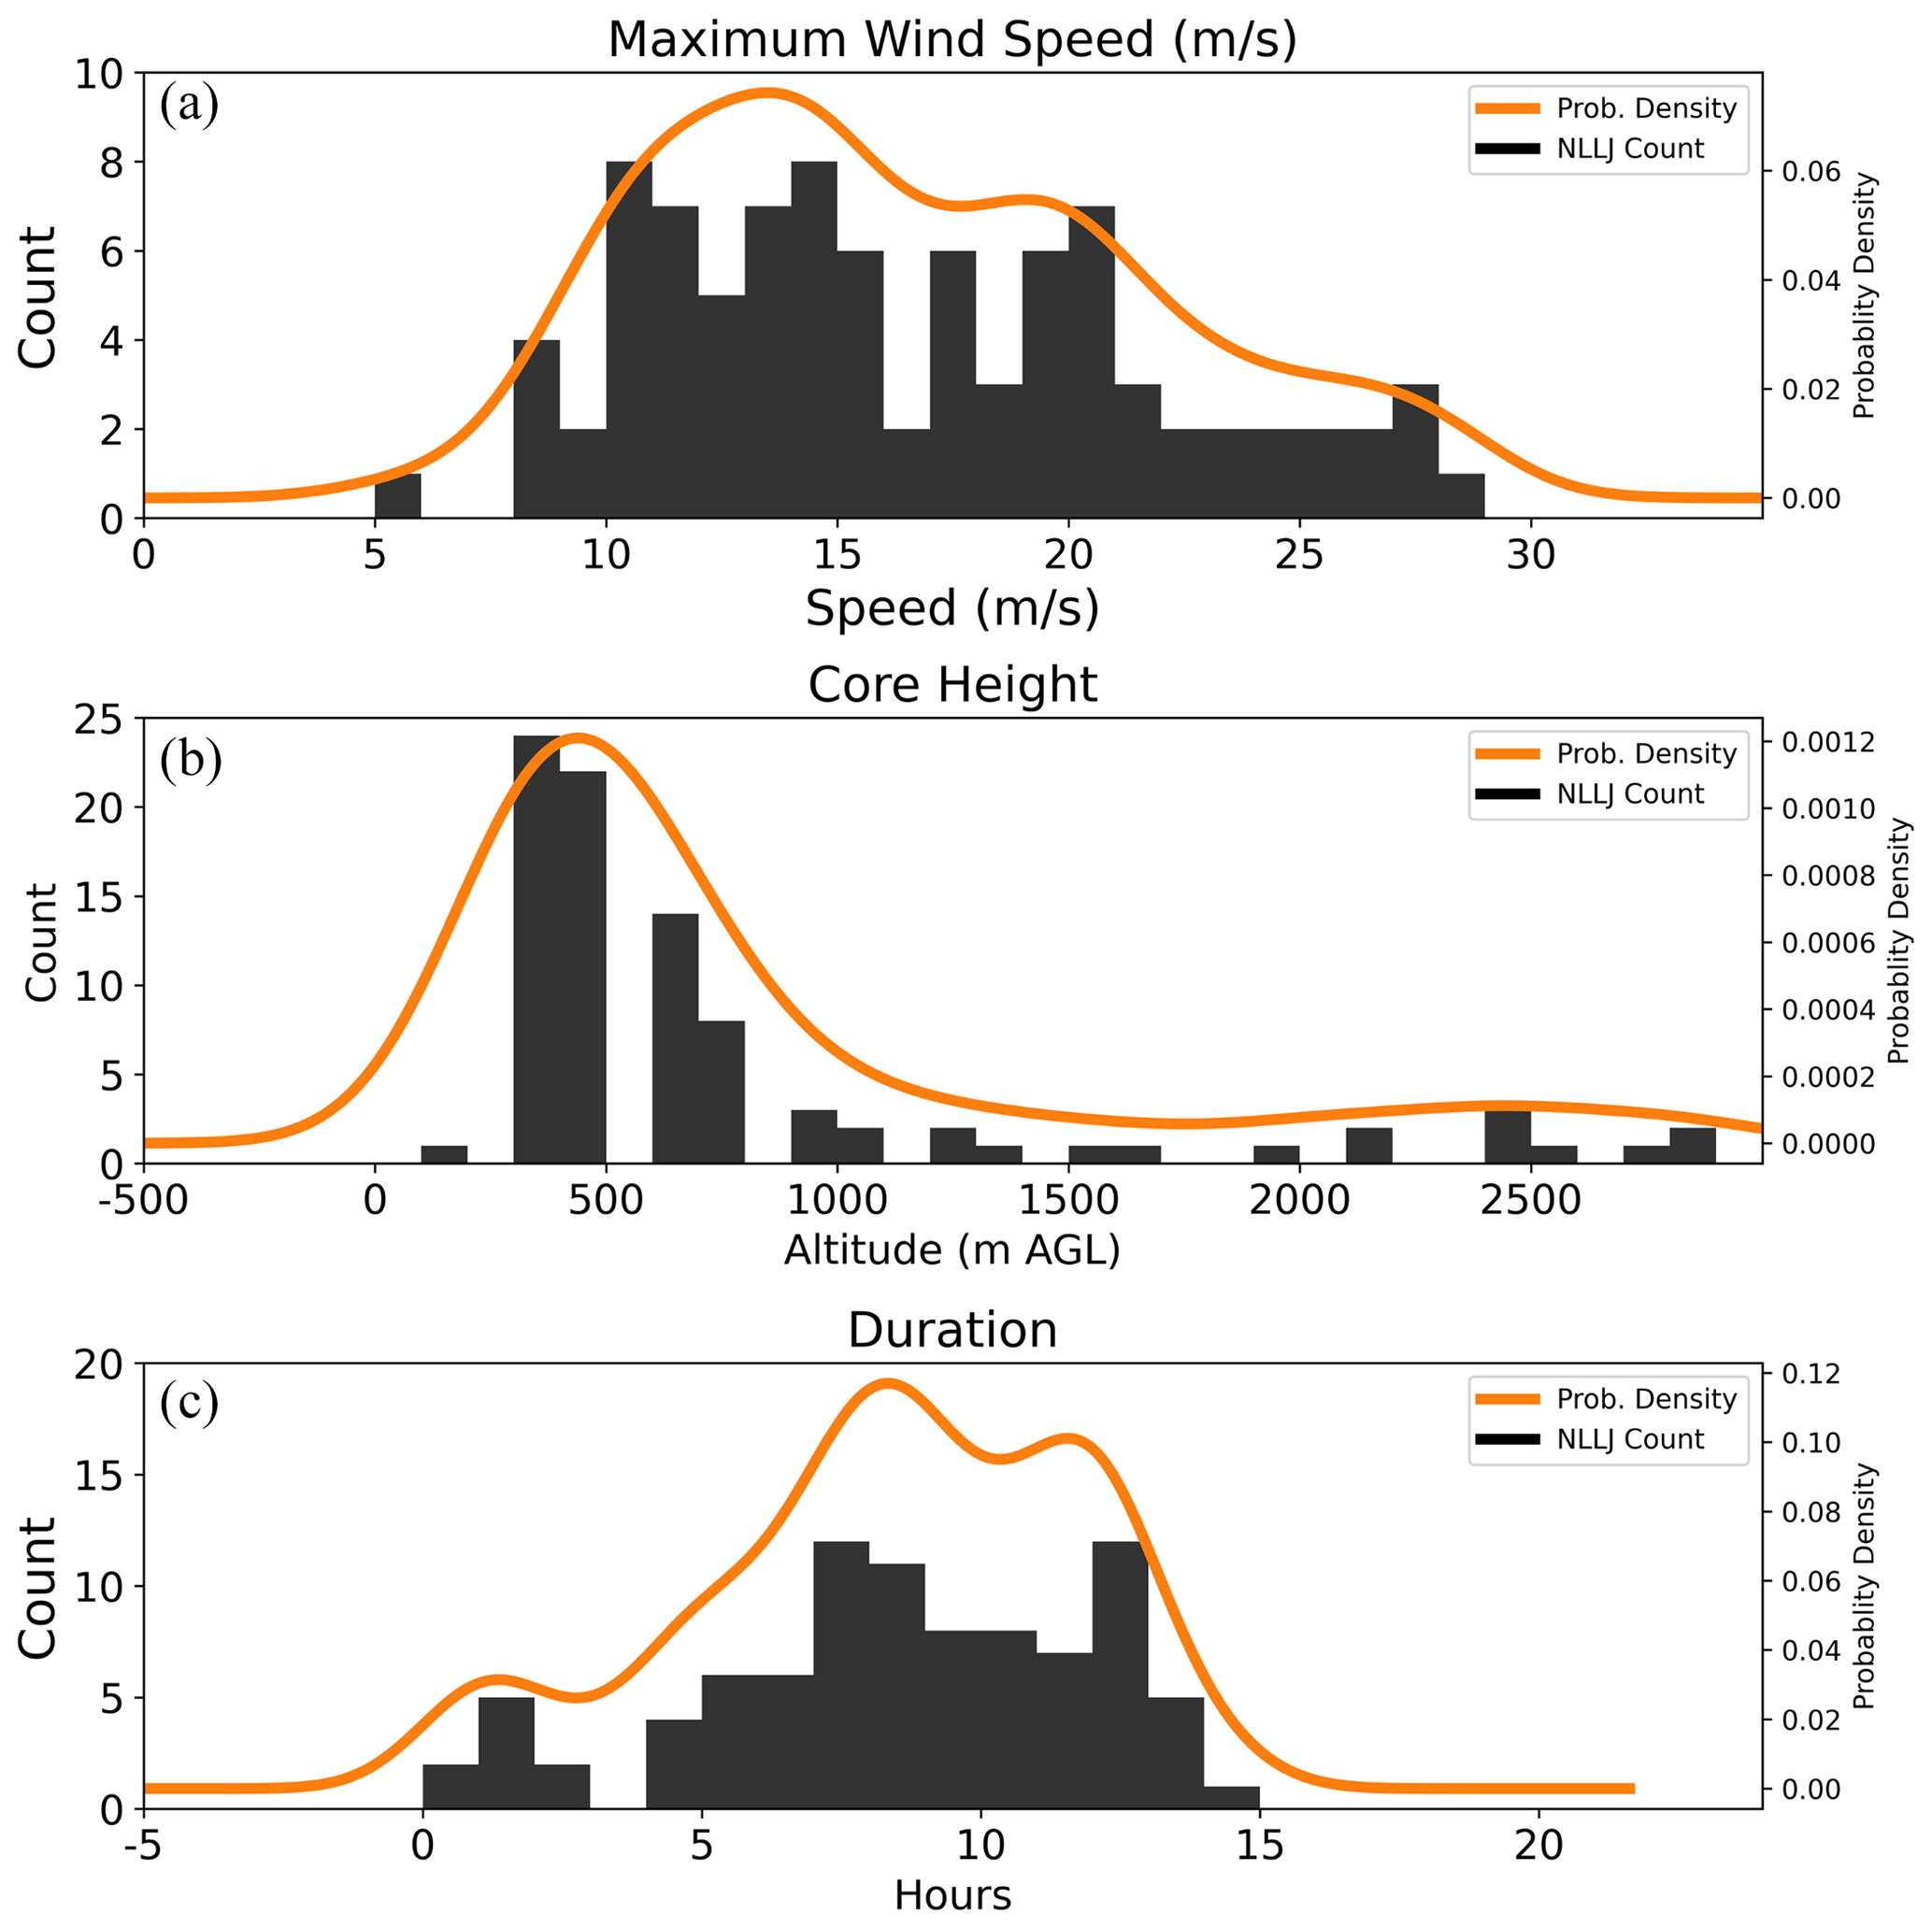
Figure 7Histogram of NLLJ characteristics from the 90 events noted in Fig. 2, where (a) is the distribution of maximum wind speeds, (b) is the height of the wind speed maximum, and (c) is the duration of the event at the core height.
The core height (Fig. 7b) illustrates the height at which the maximum wind speed was measured for each NLLJ event captured. We notice that most of the maximum wind speeds occur around 500 m a.g.l., showing a sharp peak at this altitude range, which can be interpreted as the typical altitude for the core. The narrowness of this peak in the probability density curve implies a strong consensus for this characteristic height, aligning with the notion that the jets are confined to the edge of the stable nocturnal boundary layer. Note the low probability and frequency of core height being above 1000 m a.g.l.; we attribute the presence of these altitudes to removable noise from the isolation due to the imperfect nature of our training dataset (see Sect. 3.1).
When considering the histogram for the duration of the NLLJ (Fig. 7c), we encounter a more complex distribution. The duration of the NLLJ event is calculated by finding the elapsed time from each jet's core height. The histogram and probability distribution suggest a multi-modal distribution, with two apparent peaks around 8 and 12 h. This multi-modal nature may hint at additional influencing factors, such as the baroclinicity of the region, which could induce variations in the timing of the jet's maximum wind speeds.
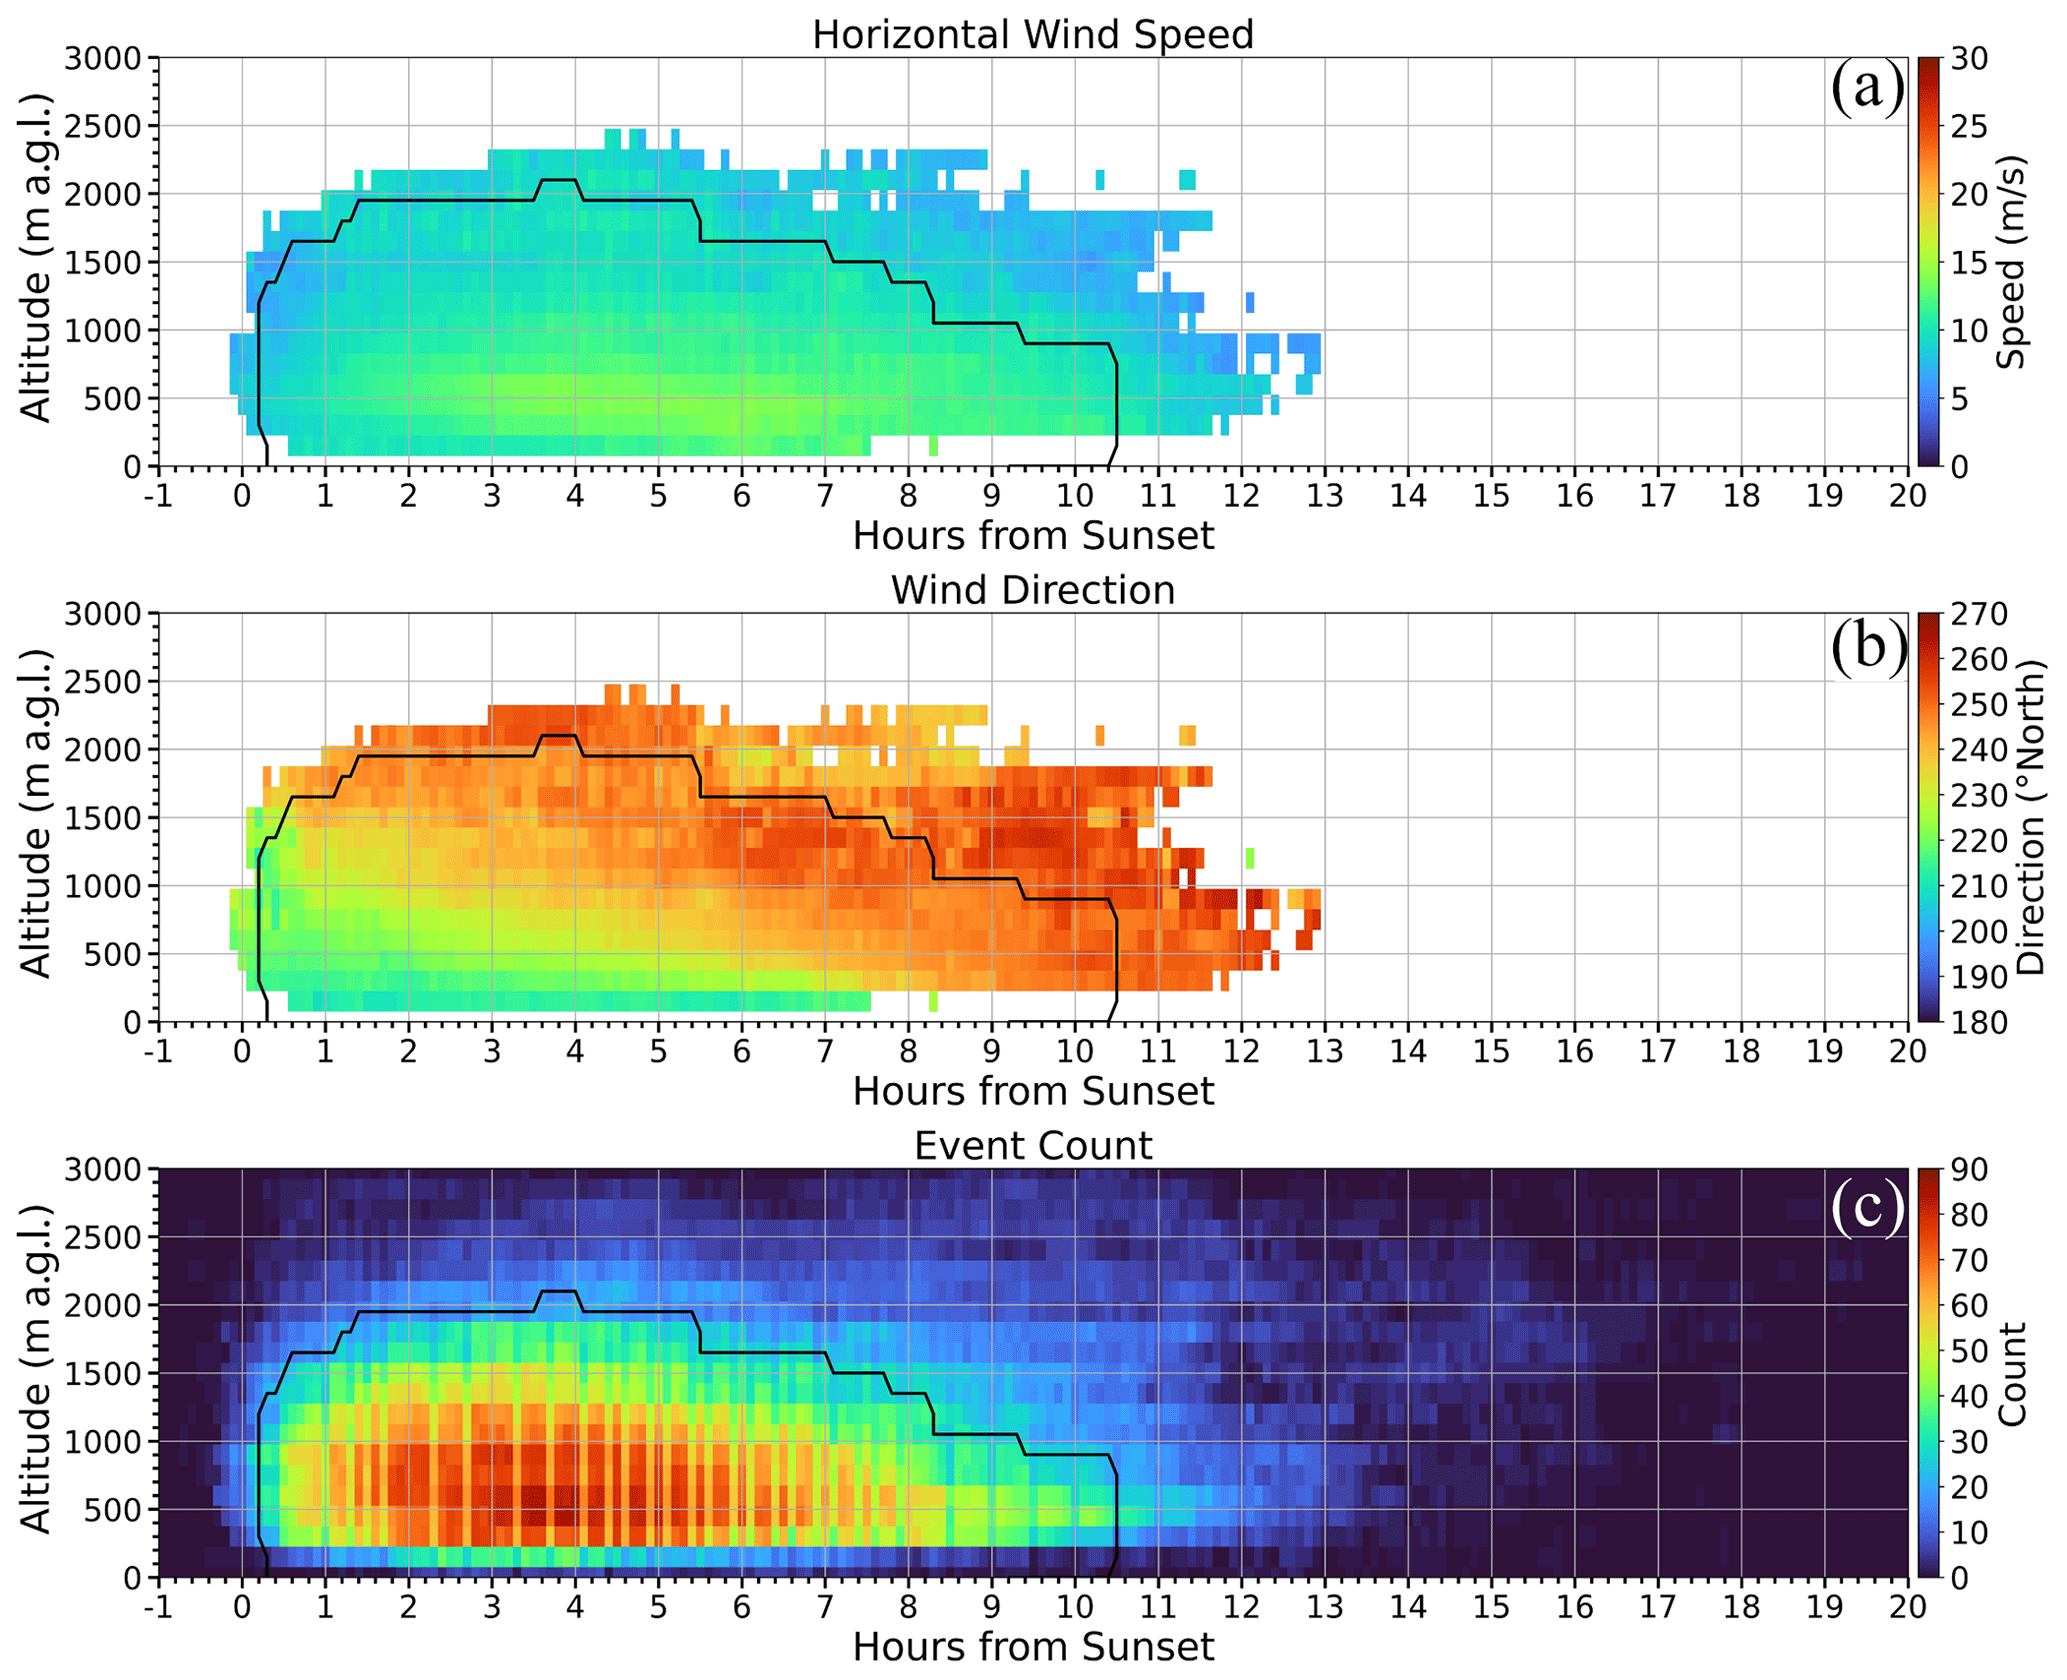
Figure 8Composite vertical profiles of nocturnal low-level jet (NLLJ) characteristics: (a) average wind speed, (b) average wind direction, and (c) event count. The solid black line represents the region where over 50 % of events are present.
4.3 Mid-Atlantic NLLJ morphology
As a result of this isolation of NLLJ occurrence in wind profiles, we have created a general representation of the mid-Atlantic NLLJ using observations. Figure 8 shows a composite plot of the NLLJ structure using the median of the 90 NLLJ datasets to visualize the temporal evolution as seen from the observations at Beltsville, MD. This offers a basis for future identification and analysis of the general southwesterly NLLJ. The region enclosed by the black line indicates the region in which more than 50 % of the cases were present (see Fig. 8c), thus serving as the general structure of the mid-Atlantic NLLJ. Outside the enclosed region is the variability in NLLJs found in our 90-event datasets. Figure 8a describes the horizontal wind speed, which exhibits a shallow layer of high wind speed (∼ 15 m s−1) concentrated around 500 m a.g.l.; this is noted as the NLLJ's core. This general NLLJ structure lasts from just after sunset (0 h) to almost 11 h after sunset. The vertical extent is shown to be persistent around 1500 m a.g.l. until the arrival of the horizontal wind speed maximum (NLLJ core) around 4 h after sunset, at which point the vertical structure of the NLLJ begins to decay.
Panel B of Fig. 8, which illustrates wind direction, shows a clear transition between the dominance of the meridional (south to north, southerly) and zonal (west to east, westerly) winds and is indicative of the dynamic atmospheric processes that govern the behavior of the mid-Atlantic NLLJ. The progression to more westerly winds across the night reflects the diurnal wind shift and underscores the influence of large-scale atmospheric circulation patterns on the NLLJ. This shift in wind direction is often related to the Coriolis force acting on the regional air mass over the night. As the land cools after sunset, the pressure gradients adjust, and the NLLJ develops, initially following the temperature gradient. As the night progresses, the Coriolis force begins to turn the flow toward the right in the Northern Hemisphere, resulting in the NLLJ acquiring a more westerly component.
The vertical dependence of the oscillation between wind vectors, as observed in panel B of Fig. 8, indeed underscores the manifestation of inertial oscillation theory in the behavior of the mid-Atlantic NLLJ. This oscillation between wind vectors at different altitudes signifies the vertical shear, which is characteristic of the NLLJ structure. The presence of wind shear is significant for various atmospheric processes, such as the development of turbulence, the dispersion of aerosols, and the vertical transport of momentum and heat within the atmosphere; notably, strong wind shear associated with NLLJs can induce turbulent downbursts, thereby affecting aviation safety, efficiency of wind energy generation, and surface-level air quality. The works of Roots et al. (2023) and Sullivan et al. (2017) both noted the increase in surface-level ozone from a polluted ozone reservoir in the residual layer during the arrival of the NLLJ core, which, as shown in Fig. 8, is the maximum point of the horizontal speed and balance between the zonal and meridional wind vectors.
Collectively, these panels deliver a cohesive understanding of the NLLJ's vertical and temporal structure. They demonstrate a pronounced nocturnal intensification in wind speed at low-level altitudes, accompanied by a veering wind direction, which indicates the inertial oscillation's influence on the jet's formation. Furthermore, the event count substantiates the observed morphology, confirming that the algorithm effectively captures the climatological presence of the NLLJ in the dataset. The variability outside the core zone may be attributed to synoptic-scale influences that modulate NLLJ behavior. Understanding this variability is essential for improving weather prediction models, particularly for events sensitive to low-level jet dynamics.
This study successfully applied machine learning (ML) algorithms to detect and characterize nocturnal low-level jets (NLLJs) using radar wind profiler (RWP) data.
The research explored the use of supervised ML for detecting NLLJ events in the mid-Atlantic region, offering both quantitative and qualitative evaluations that highlight the method's potential for atmospheric analysis.
Statistical analysis of 90 NLLJ events revealed key patterns in wind speed, core height, and event duration, which align with existing literature on NLLJ theory and case studies in the region.
The morphology composite (Fig. 8) provides a clear visualization of the vertical and temporal structure of NLLJs, offering a useful reference for understanding their typical characteristics and evolution.
Using data from the Beltsville, MD, RWP, we provide a general representation and preliminary analysis of morphology and statistical characteristics of the mid-Atlantic NLLJ, which will serve as a foundation for future research. The morphological analysis, based on composite plots in Fig. 7, reveals a general structure for the mid-Atlantic NLLJ, showing nocturnal wind speed intensification and a distinct oscillation pattern in wind direction. Variability outside the core zone highlights the influence of larger-scale atmospheric processes, emphasizing the need for further exploration of these external factors. Our analysis highlights both the strengths and limitations of the algorithm. While it is effective in detecting southwesterly NLLJ events, the model struggles to capture the full structural details of these features. This underscores the need for future refinements, particularly in optimizing the training set and incorporating image segmentation techniques to improve model representation.
The seasonal and daily data gaps highlight the inherent limitations of observational datasets. Future work should consider incorporating additional datasets and utilizing data synergy techniques to fill these gaps, providing a more continuous and comprehensive view of NLLJ occurrences. This could include data from other instruments, such as aerosol and ozone lidars, sondes, ground-based spectrometers, and radiometers. Algorithms could also be trained to predict NLLJ events during missing data periods, enhancing their predictive capabilities and advancing atmospheric research. Addressing data gaps through data synergy techniques is crucial for future studies to create a more complete understanding of NLLJ occurrences. As shown in Fig. 7, our statistical analysis provides a quantitative representation of the key characteristics of the mid-Atlantic NLLJ. The distribution of maximum wind speeds and core heights suggests a common atmospheric mechanism driving these jets, with most NLLJ cores around 500 m a.g.l. The bi-modal distribution of core timing points to the influence of regional baroclinicity, which may cause deviations from classical inertial oscillation predictions. These findings are critical for improving the representation of NLLJ behavior in atmospheric models.
Further research is necessary to investigate whether the observed interannual variability, with some years showing more frequent events, indicates a connection between NLLJ occurrences and broader synoptic patterns that influence regional dynamics. Identifying these patterns is crucial for future NLLJ studies and will require extended analysis over a longer time frame and across a broader observational network. Such research would enhance our understanding of the atmospheric forces driving NLLJ formation and improve the accuracy of atmospheric models.
Continued research into these low-level wind phenomena is essential for improving weather predictions and air quality management and particularly for understanding pollutant transport and dispersion in the mid-Atlantic region. This study lays the groundwork for future investigations into the complex dynamics of low-level mesoscale phenomena and their broader climatic and environmental implications. Accurately identifying and characterizing NLLJs is crucial for refining regional climate models and enhancing predictive capabilities for future climate scenarios. This work contributes significantly to boundary layer studies, providing valuable insights into NLLJ phenomena and advancing our understanding of atmospheric dynamics.
The integration of machine learning into atmospheric science, as demonstrated in this study, represents a promising advancement in meteorological analysis and climate prediction. Future research should build on these techniques to better understand the genesis of low-level wind phenomena, improving our understanding of regional pollutant distribution and the mesoscale transport of moisture, momentum, and mass. There is also potential to expand this research to other geographic regions and atmospheric phenomena, testing the adaptability and versatility of the methodology across different contexts.
Radar wind profiler datasets are available from the Maryland Department of the Environment upon request. The algorithm development, data processing, and analysis codes are currently available upon request, as they are in their beginning stages. Data from the MDE RWP network are shared with the National Oceanic and Atmospheric Administration (NOAA) Earth System Research Laboratory's (ESRL) Meteorological Assimilation Data Ingest System (MADIS) as part of the Cooperative Agency Profiler network (CAP). Real-time and historical data can be accessed through the MADIS CAP Data Display (https://madis-data.ncep.noaa.gov/cap/profiler.jsp, MADIS-CAP, 2025).
MR: conceptualization, methodology, software, validation, formal analysis, investigation, resources, data curation, writing – original draft. JTS: writing – review and editing, supervision. BD: project administration, funding acquisition.
At least one of the (co-)authors is a member of the editorial board of Atmospheric Measurement Techniques. The peer-review process was guided by an independent editor, and the authors also have no other competing interests to declare.
Any opinions, findings, conclusions, or recommendations expressed in this publication are those of the authors and do not necessarily reflect the views of NASA.
Publisher's note: Copernicus Publications remains neutral with regard to jurisdictional claims made in the text, published maps, institutional affiliations, or any other geographical representation in this paper. While Copernicus Publications makes every effort to include appropriate place names, the final responsibility lies with the authors.
The authors would like to acknowledge the continued support, guidance, and supply of datasets from the Maryland Department of the Environment (MDE), specifically James Boyle. The authors gratefully acknowledge the support provided by the NASA Tropospheric Composition Program, including the NASA Tropospheric Ozone Lidar Network (TOLNet). Maurice Roots was supported by the NASA FINESST program (Future Investigators in NASA Earth and Space Science and Technology) as a 2022 recipient (award no. 80NSSC22K1453) as well as the NASA Goddard Space Flight Center (GSFC) and was also a 2021 fellow of the GEM consortium, which partly funded this work and coordinated this collaboration.
This research has been supported by NASA (grant no. 80NSSC22K1453).
This paper was edited by Laura Bianco and reviewed by two anonymous referees.
Baas, P., Bosveld, F. C., Klein Baltink, H., and Holtslag, A. A. M.: A Climatology of Nocturnal Low-Level Jets at Cabauw, J. Appl. Meteorol. Climatol., 48, 1627–1642, https://doi.org/10.1175/2009JAMC1965.1, 2009.
Banta, R. M.: Stable-boundary-layer regimes from the perspective of the low-level jet, Acta Geophys., 56, 58–87, https://doi.org/10.2478/s11600-007-0049-8, 2008.
Banta, R. M., Pichugina, Y. L., and Newsom, R. K.: Relationship between Low-Level Jet Properties and Turbulence Kinetic Energy in the Nocturnal Stable Boundary Layer, J. Atmos. Sci., 60, 2549–2555, https://doi.org/10.1175/1520-0469(2003)060<2549:RBLJPA>2.0.CO;2, 2003.
Blackadar, A. K.: Boundary Layer Wind Maxima and Their Significance for the Growth of Nocturnal Inversions, B. Am. Meteor. Soc., 38, 283–290, https://doi.org/10.1175/1520-0477-38.5.283, 1957.
Bonner, W. D.: Climatology of the low level jet, Mon. Weather Rev., 96, 833–850, https://doi.org/10.1175/1520-0493(1968)096<0833:COTLLJ>2.0.CO;2, 1968.
Breiman, L.: Random Forests, Mach. Learn., 45, 5–32, https://doi.org/10.1023/A:1010933404324, 2001.
Carroll, B. J., Demoz, B. B., and Delgado, R.: An Overview of Low-Level Jet Winds and Corresponding Mixed Layer Depths During PECAN, J. Geophys. Res.-Atmos., 124, 9141–9160, https://doi.org/10.1029/2019JD030658, 2019.
Carroll, B. J., Demoz, B. B., Turner, D. D., and Delgado, R.: Lidar Observations of a Mesoscale Moisture Transport Event Impacting Convection and Comparison to Rapid Refresh Model Analysis, Mon. Weather Rev., 149, 463–477, https://doi.org/10.1175/MWR-D-20-0151.1, 2021.
Corsmeier, U., Kalthoff, N., Kolle, O., Kotzian, M., and Fiedler, F.: Ozone concentration jump in the stable nocturnal boundary layer during a LLJ-event, Atmos. Environ., 31, 1977–1989, https://doi.org/10.1016/S1352-2310(96)00358-5, 1997.
Cortes, C. and Vapnik, V.: Support-vector networks, Mach. Learn., 20, 273–297, https://doi.org/10.1007/BF00994018, 1995.
Cover, T. and Hart, P.: Nearest neighbor pattern classification, IEEE T. Inform. Theory, 13, 21–27, https://doi.org/10.1109/TIT.1967.1053964, 1967.
De Jong, E., Quon, E., and Yellapantula, S.: Mechanisms of Low-Level Jet Formation in the U.S. Mid-Atlantic Offshore, J. Atmos. Sci., 81, 31–52, https://doi.org/10.1175/JAS-D-23-0079.1, 2024.
Delgado, R., Rabenhorst, S. D., Demoz, B. B., and Hoff, Raymond. M.: Elastic lidar measurements of summer nocturnal low level jet events over Baltimore, Maryland, J. Atmos. Chem., 72, 311–333, https://doi.org/10.1007/s10874-013-9277-2, 2015.
Hersbach, H., Bell, B., Berrisford, P., Hirahara, S., Horányi, A., Muñoz-Sabater, J., Nicolas, J., Peubey, C., Radu, R., Schepers, D., Simmons, A., Soci, C., Abdalla, S., Abellan, X., Balsamo, G., Bechtold, P., Biavati, G., Bidlot, J., Bonavita, M., De Chiara, G., Dahlgren, P., Dee, D., Diamantakis, M., Dragani, R., Flemming, J., Forbes, R., Fuentes, M., Geer, A., Haimberger, L., Healy, S., Hogan, R. J., Hólm, E., Janisková, M., Keeley, S., Laloyaux, P., Lopez, P., Lupu, C., Radnoti, G., de Rosnay, P., Rozum, I., Vamborg, F., Villaume, S., and Thépaut, J.: The ERA5 global reanalysis, Q. J. Roy. Meteor. Soc., 146, 1999–2049, https://doi.org/10.1002/qj.3803, 2020.
Holton, J. R.: The diurnal boundary layer wind oscillation above sloping terrain, Tellus, 19, 199–205, https://doi.org/10.1111/j.2153-3490.1967.tb01473.x, 1967.
Karipot, A., Leclerc, M. Y., and Zhang, G.: Characteristics of Nocturnal Low-Level Jets Observed in the North Florida Area, Mon. Weather Rev., 137, 2605–2621, https://doi.org/10.1175/2009MWR2705.1, 2009.
Lima, D. C. A., Soares, P. M. M., Semedo, A., and Cardoso, R. M.: A Global View of Coastal Low-Level Wind Jets Using an Ensemble of Reanalyses, J. Climate, 31, 1525–1546, https://doi.org/10.1175/JCLI-D-17-0395.1, 2018.
Lima, D. C. A., Soares, P. M. M., Semedo, A., Cardoso, R. M., Cabos, W., and Sein, D. V.: A Climatological Analysis of the Benguela Coastal Low-Level Jet, J. Geophys. Res.-Atmos., 124, 3960–3978, https://doi.org/10.1029/2018JD028944, 2019.
Lundquist, J. K.: Intermittent and Elliptical Inertial Oscillations in the Atmospheric Boundary Layer, J. Atmos. Sci., 60, 2661–2673, https://doi.org/10.1175/1520-0469(2003)060<2661:IAEIOI>2.0.CO;2, 2003.
MADIS-CAP: Meteorological Assimilation Data Ingest System – Cooperative Agency Profiler network, https://madis-data.ncep.noaa.gov/cap/profiler.jsp, last access: 27 March 2025.
Mahrt, L.: Stratified Atmospheric Boundary Layers and Breakdown of Models, Theor. Comp. Fluid Dyn., 11, 263–279, https://doi.org/10.1007/s001620050093, 1998.
Ortiz-Amezcua, P., Martínez-Herrera, A., Manninen, A. J., Pentikäinen, P. P., O'Connor, E. J., Guerrero-Rascado, J. L., and Alados-Arboledas, L.: Wind and Turbulence Statistics in the Urban Boundary Layer over a Mountain–Valley System in Granada, Spain, Remote Sens., 14, 2321, https://doi.org/10.3390/rs14102321, 2022.
Pedregosa, F., Varoquaux, G., Gramfort, A., Michel, V., Thirion, B., Grisel, O., Blondel, M., Prettenhofer, P., Weiss, R., Dubourg, V., Vanderplas, J., Passos, A., and Cournapeau, D.: Scikit-learn: Machine Learning in Python, J. Mach. Learn. Res., 12, 2825–2830, 2011.
Rabenhorst, S., Whiteman, D. N., Zhang, D.-L., and Demoz, B.: A Case Study of Mid-Atlantic Nocturnal Boundary Layer Events during WAVES 2006, J. Appl. Meteorol. Clim., 53, 2627–2648, https://doi.org/10.1175/JAMC-D-13-0350.1, 2014.
Ranjha, R., Tjernström, M., Semedo, A., Svensson, G., and Cardoso, R. M.: Structure and variability of the Oman coastal low-level jet, Tellus Dyn. Meteorol. Oceanogr., 67, 25285, https://doi.org/10.3402/tellusa.v67.25285, 2015.
Roots, M., Sullivan, J. T., Delgado, R., Twigg, L., and Demoz, B.: An integrated monitoring system (IMS) for air quality: Observations of a unique ozone-exceedance event in Maryland, Atmos. Environ., 313, 120028, https://doi.org/10.1016/j.atmosenv.2023.120028, 2023.
Ryan, W. F.: The Low Level Jet in Maryland: Profiler Observations and Preliminary Climatology, Report prepared for MDEAir and Radiation Administration, Department of Meteorology, Pennsylvania State University, 2004.
Shapiro, A. and Fedorovich, E.: Analytical description of a nocturnal low-level jet, Q. J. Roy. Meteor. Soc., 136, 1255–1262, https://doi.org/10.1002/qj.628, 2010.
Shapiro, A., Fedorovich, E., and Rahimi, S.: A Unified Theory for the Great Plains Nocturnal Low-Level Jet, J. Atmos. Sci., 73, 3037–3057, https://doi.org/10.1175/JAS-D-15-0307.1, 2016.
Stensrud, D. J.: Importance of Low-Level Jets to Climate: A Review, J. Climate, 9, 1698–1711, https://doi.org/10.1175/1520-0442(1996)009<1698:IOLLJT>2.0.CO;2, 1996.
Sullivan, J. T.: Lidar observations revealing transport of O3 in the presence of a nocturnal low-level jet: Regional implications for “next-day” pollution, Atmos. Environ., 12, 160–171, https://doi.org/10.1016/j.atmosenv.2017.03.039, 2017.
Sullivan, J. T., Rabenhorst, S. D., Dreessen, J., McGee, T. J., Delgado, R., Twigg, L., and Sumnicht, G.: Lidar observations revealing transport of O3 in the presence of a nocturnal low-level jet: Regional implications for “next-day” pollution, Atmos. Environ., 158, 160–171, https://doi.org/10.1016/j.atmosenv.2017.03.039, 2017.
Tollerud, E. I., Caracena, F., Koch, S. E., Jamison, B. D., Hardesty, R. M., McCarty, B. J., Kiemle, C., Collander, R. S., Bartels, D. L., Albers, S., Shaw, B., Birkenheuer, D. L., and Brewer, W. A.: Mesoscale Moisture Transport by the Low-Level Jet during the IHOP Field Experiment, Mon. Weather Rev., 136, 3781–3795, https://doi.org/10.1175/2008MWR2421.1, 2008.
Tuononen, M., O'Connor, E. J., Sinclair, V. A., and Vakkari, V.: Low-Level Jets over Utö, Finland, Based on Doppler Lidar Observations, J. Appl. Meteorol. Clim., 56, 2577–2594, https://doi.org/10.1175/JAMC-D-16-0411.1, 2017.
Weaver, S. J. and Nigam, S.: Variability of the Great Plains Low-Level Jet: Large-Scale Circulation Context and Hydroclimate Impacts, J. Climate, 21, 1532–1551, https://doi.org/10.1175/2007JCLI1586.1, 2008.
Wei, W., Zhang, H., Zhang, X., and Che, H.: Low-level jets and their implications on air pollution: A review, Front. Environ. Sci., 10, 1082623, https://doi.org/10.3389/fenvs.2022.1082623, 2023.
Weldegaber, M. H.: Investigation of stable and unstable boundary layer phenomena using observations and a numerical weather prediction model (Order No. 3359094), ProQuest Dissertations & Theses Global, (305071169), http://proxy-bc.researchport.umd.edu/login?url=https://www.proquest.com/dissertations-theses/investigation-stable-unstable-boundary-layer/docview/305071169/se-2 (last access: 25 February 2025), 2009.
Whiteman, C. D., Bian, X., and Zhong, S.: Low-Level Jet Climatology from Enhanced Rawinsonde Observations at a Site in the Southern Great Plains, J. Appl. Meteorol., 36, 1363–1376, https://doi.org/10.1175/1520-0450(1997)036<1363:LLJCFE>2.0.CO;2, 1997.
Zhang, D.-L., Zhang, S., and Weaver, S. J.: Low-Level Jets over the Mid-Atlantic States: Warm-Season Climatology and a Case Study, J. Appl. Meteorol. Clim., 45, 194–209, https://doi.org/10.1175/JAM2313.1, 2006.
This paper presents a supervised-machine-learning approach for the automatic isolation of nocturnal low-level jets (NLLJs) using observations from a radar wind profiler. This analysis isolated 90 southwesterly NLLJs observed from May to September 2017–2021, highlighting key features in the evolution and morphology of the mid-Atlantic NLLJ.
This paper presents a supervised-machine-learning approach for the automatic isolation of...