the Creative Commons Attribution 4.0 License.
the Creative Commons Attribution 4.0 License.
 | 19 Mar 2025
Quality assessment of YUNYAO radio occultation data in the neutral atmosphere
Xiaoze Xu
Jincheng Wang
Zhiqiu Gao
Fenghui Li
Yan Cheng
Naifeng Fu
Global Navigation Satellite System (GNSS) radio occultation (RO) data are an important component of numerical weather prediction (NWP) systems. To incorporate more GNSS-RO data into NWP systems, commercial RO data have become an excellent option. Tianjin Yunyao Aerospace Technology Co., Ltd. (YUNYAO) plans to launch a meteorological constellation of 90 satellites equipped with GNSS-RO instruments, which will significantly increase the amount of GNSS-RO data in NWP systems. This study evaluates the quality of neutral atmospheric refractivity and bending angle profiles from YUNYAO satellites Y003 to Y010 during the period from 1 May to 31 July 2023. Compared with the refractivity and bending angle calculated from ERA5, the absolute values of the mean bias (MB) for YUNYAO refractivity and bending angle data are less than 1.54 % and 4.51 %, respectively, in the height range of 0 to 40 km and close to 0 between 4 and 40 km. The standard deviations (SDs) are below 3.35 % and 11.06 %, respectively, with variations in SDs among different GNSS satellites, especially in the lower troposphere and the stratosphere. Second, the refractivity error SD of YUNYAO RO data is estimated using the “three-cornered hat” (3CH) method and multiple data sets. In the pressure range of 1000–10 hPa, the refractivity error SD of YUNYAO RO data is below 2.53 %, and the differences in refractivity error SDs among different GNSS satellites do not exceed 0.52 %. Finally, compared to COSMIC-2 and Metop-C RO data, YUNYAO RO data exhibit consistent refractivity error SDs and are smaller within 300–50 hPa.
- Article
(7838 KB) - Full-text XML
-
Supplement
(1257 KB) - BibTeX
- EndNote


Radio occultation (RO) of the Global Navigation Satellite System (GNSS) satellites, as observed from low-Earth-orbiting (LEO) satellites, is used for remote sensing of the Earth's neutral atmosphere and ionosphere (Anthes et al., 2008). When a radio signal from a transmitter on a GNSS satellite passes through the limb of the atmosphere, the timing and direction of the signal received by LEO satellites are different from those of a straight-line path through a vacuum because the signal path is bent by the vertical gradient of atmospheric refractivity (Rocken et al., 1997). The profile of refractivity can be derived from the profile of the bending angle, analytically in the limit of a spherically symmetric atmosphere, using the Abel transform (Kursinski et al., 1997). The atmospheric refractivity is a function of atmospheric temperature, pressure, and water vapor pressure (Kursinski et al., 1997).
GNSS-RO observations can provide temperature information for the stratosphere and upper troposphere and humidity information for the lower troposphere (Eyre et al., 2022). Additionally, they are characterized by high vertical resolution, high accuracy, all-weather capability, and global coverage (Rocken et al., 1997; Schreiner et al., 2020; Sun et al., 2018; Ware et al., 1996), and they exhibit minimal bias between 5 and 30 km (Wickert et al., 2005). Therefore, GNSS-RO data products (i.e., bending angle, refractivity, temperature, water vapor, and pressure) have been widely used in numerical weather prediction (NWP) centers and have shown a significant positive impact on regional and global NWP forecasts (Anthes et al., 2024; Aparicio and Deblonde, 2008; Cucurull and Derber, 2008; Bowler, 2020; Harnisch et al., 2013; Healy and Thépaut, 2006; Huang et al., 2010; Le Marshall et al., 2010; Liu and Xue, 2014; Miller et al., 2023; Poli et al., 2008; Ruston and Healy, 2021; Sun et al., 2018), particularly in the upper troposphere and lower stratosphere and especially in the Southern Hemisphere regions (Cucurull and Derber, 2008; Eyre et al., 2022; Rennie, 2010; Sun et al., 2018).
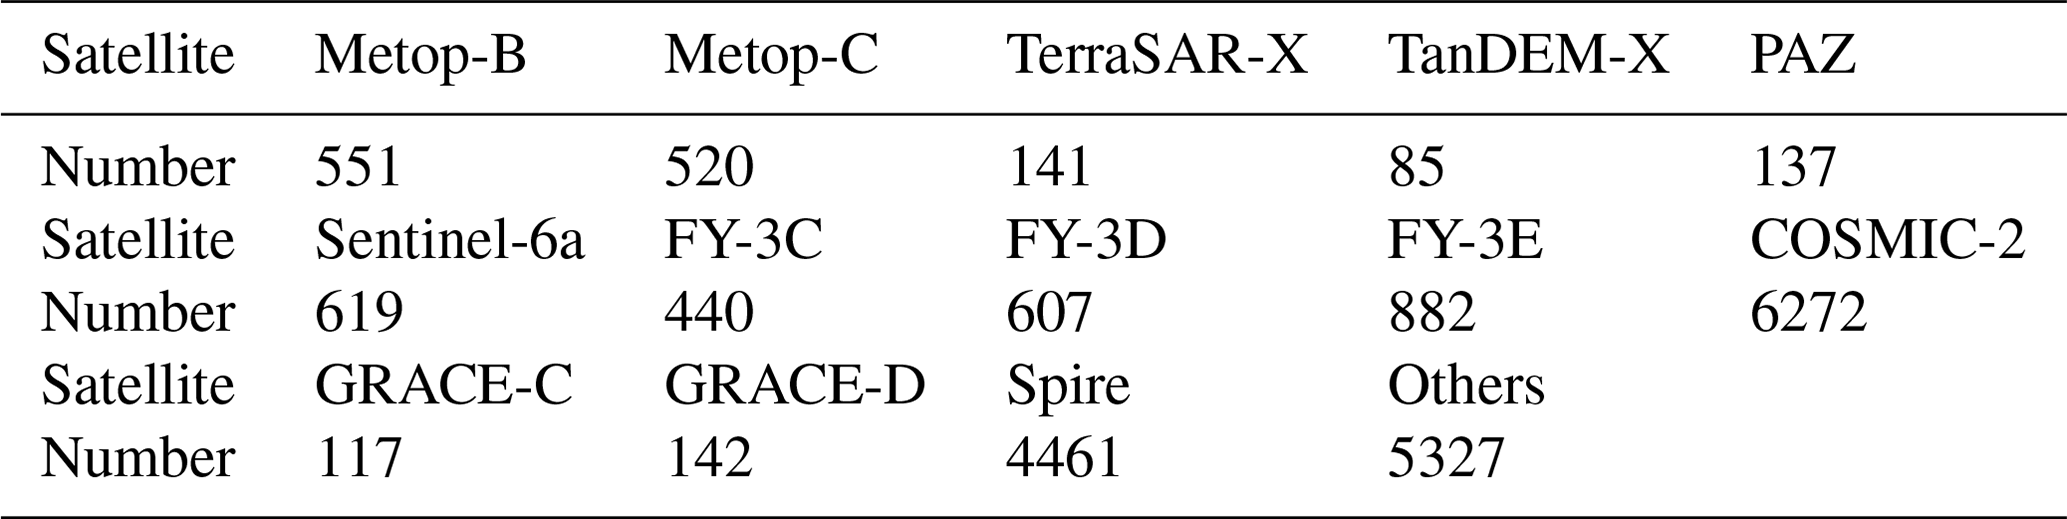
GNSS-RO ranks among the top contributors in global NWP systems (Cardinali and Healy, 2014; Eyre et al., 2022) and plays an important role as “anchor observations” in the calibration of radiance bias corrections (Aparicio and Laroche, 2015). Harnisch et al. (2013) found that even with 128 000 RO profiles per day for assimilation, increasing the number of RO profiles is still expected to provide additional benefits to the forecast. As of 2020, the missions providing GNSS-RO data to NWP centers have been summarized in Eyre et al. (2022). Currently, the Global Forecast System (CMA-GFS), developed by the China Meteorological Administration, incorporates approximately 20 000 GNSS-RO profiles per day. As shown in Table 1, this includes data summarized by Eyre et al. (2022), data from FengYun-3E, and commercial GNSS-RO data from Spire (Ho et al., 2023). Commercial GNSS-RO data from Spire constitutes 22 % of the total number of RO profiles in CMA-GFS, highlighting the importance of commercial RO data in global NWP systems.
Table 1The number of RO profiles applied in CMA-GFS on 25 May 2023.
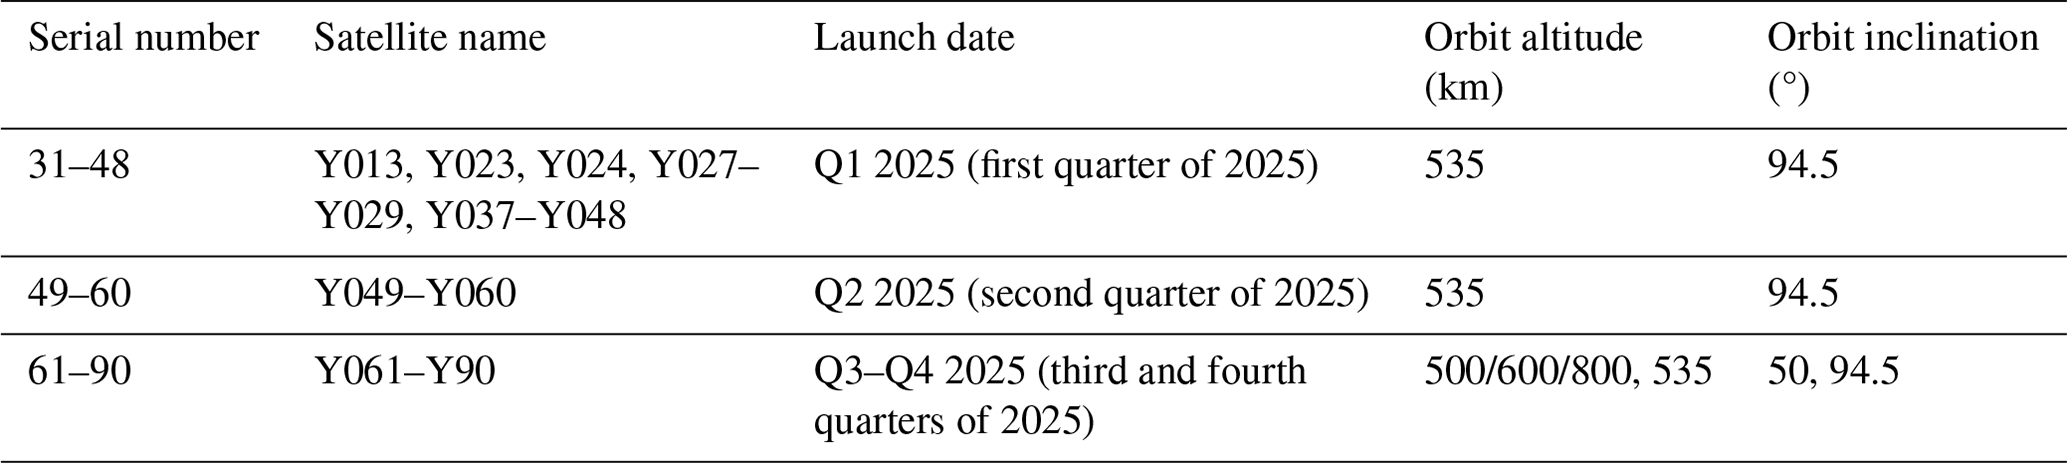
Tianjin Yunyao Aerospace Technology Co., Ltd. (YUNYAO) plans to launch a 90-satellite meteorological constellation equipped with GNSS-RO instruments (Table 2, Fu and Li, 2021). The YUNYAO GNSS-RO payload, as a multi-GNSS receiver, can simultaneously receive radio signals from the US global positioning system (GPS), the Chinese BeiDou Navigation Satellite System (BDS), the Russian Global Navigation Satellite System (GLONASS), and the Galileo (GAL). YUNYAO RO will significantly increase the number of GNSS-RO observations available to NWP centers and is expected to further improve the accuracy of NWP forecasts.
In this study, we conducted a quality assessment of the neutral atmospheric RO profiles of YUNYAO satellites 003 to 010 from 1 May to 31 July 2023. First, we compared the YUNYAO refractivity and bending angle data with the fifth-generation European Centre for Medium-Range Weather Forecasts (ERA5) reanalysis data. Then, using the three-cornered hat method (3CH; Anthes and Rieckh, 2018), we estimated the standard deviation (SD) of the errors in the YUNYAO RO refractivity data. Finally, we compared the assessment results of YUNYAO refractivity data with those of UCAR's COSMIC-2 (hereafter referred to as C2) and Metop-C (hereafter referred to as MTPC).
2.1 Data
2.1.1 YUNYAO RO data
Since the first time the YUNYAO data processing center provided the GNSS-RO profile products for the Radio Occultation Modeling Experiment (ROMEX), their data processing methodology has been updated in three key aspects. First, the deviation observed between 20 and 40 km, distinct from other GNSS-RO missions, was resolved by adjusting the smoothing window width for the exceed-phase-to-Doppler inversion to optimize its adaptability to YUNYAO's high-sampling-rate data (100 Hz). Second, to address the sudden increase in SD below 12 km, YUNYAO investigated the open-loop to closed-loop transition algorithms employed in other GNSS-RO missions. Their retrieval chain automatically identified the L1 open-loop and closed-loop splicing points through the L2 lock marks and used a sigmoid function as a weight to ensure a smooth transition from L1 closed-loop observations to open-loop observations. Third, for altitudes below 5 km, YUNYAO redesigned the L1 data truncation strategy to use the complete L1 open-loop observations as much as possible and process to obtain continuous exceed phases. In the geometric optics retrieval process, the Doppler retrieval truncation strategy is implemented by identifying cases where the difference between the Doppler shift obtained from L1 and that from the empirical atmospheric model exceeds a specified threshold. In the wave optics retrieval process, the effective bending angle sequence is obtained by restoring the signal amplitude from the exceed phase at each height in the full spectrum inversion of the bending angle retrieval.
YUNYAO RO data used in this study are from 1 May to 31 July 2023. During the quality evaluation period, a total of eight LEO satellites provided RO observations (hereafter referred to as Y003, Y004, Y005, Y006, Y007, Y008, Y009, and Y010). These LEO satellites are all in high-inclination-angle orbits, allowing their observations to cover the entire globe. The designed parameters of the YUNYAO GNSS receiver are summarized in Table 3. YUNYAO GNSS receivers are compact in size, with their weight being approximately that of the GNSS Occultation Sounder (GNOS) on board the FengYun-3C (Sun et al., 2018).
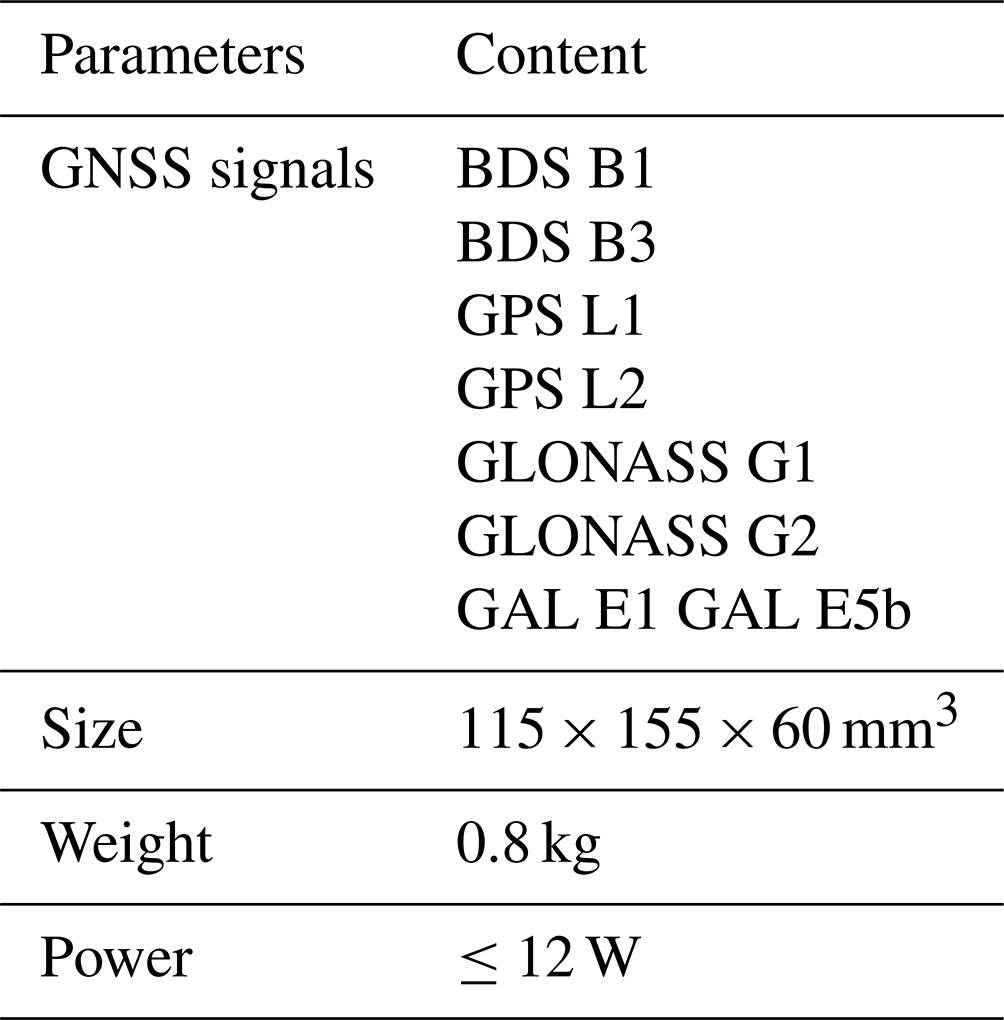
Figure 1 shows the time series of the number of RO profiles for these eight satellites. It is important to note that this study only evaluates the RO profiles from GPS, BDS, and GLONASS. The number of RO profiles generated daily by the eight satellites is almost the same, but there are differences in the number of profiles from different GNSS satellites. The number of BDS RO profiles is the highest, while the number of GLONASS RO profiles is the lowest. Specifically, each satellite produces an average of approximately 1500 RO profiles per day, with around 500 from GPS, 350 from GLONASS, and 650 from BDS. Taking Y008 as an example, Fig. 2b, d, and f show the horizontal distribution of the number of GPS, GLONASS, and BDS RO profiles, respectively. As shown in the figure, RO profiles cover the entire globe. Notably, the data transmission of the YUNYAO satellite primarily depends on ground stations situated within China. During data transmission, the satellite is required to perform specific onboard operations, leading to a reduction in occultation observations before entering Chinese airspace, particularly over the Indonesia region. Furthermore, due to GNSS signal interference in Europe and the Middle East, particularly with L2 signals, the number of occultation observations decreases. In the Central America region, the reduced number of BDS occultation observations correlates with the number of BDS satellites.
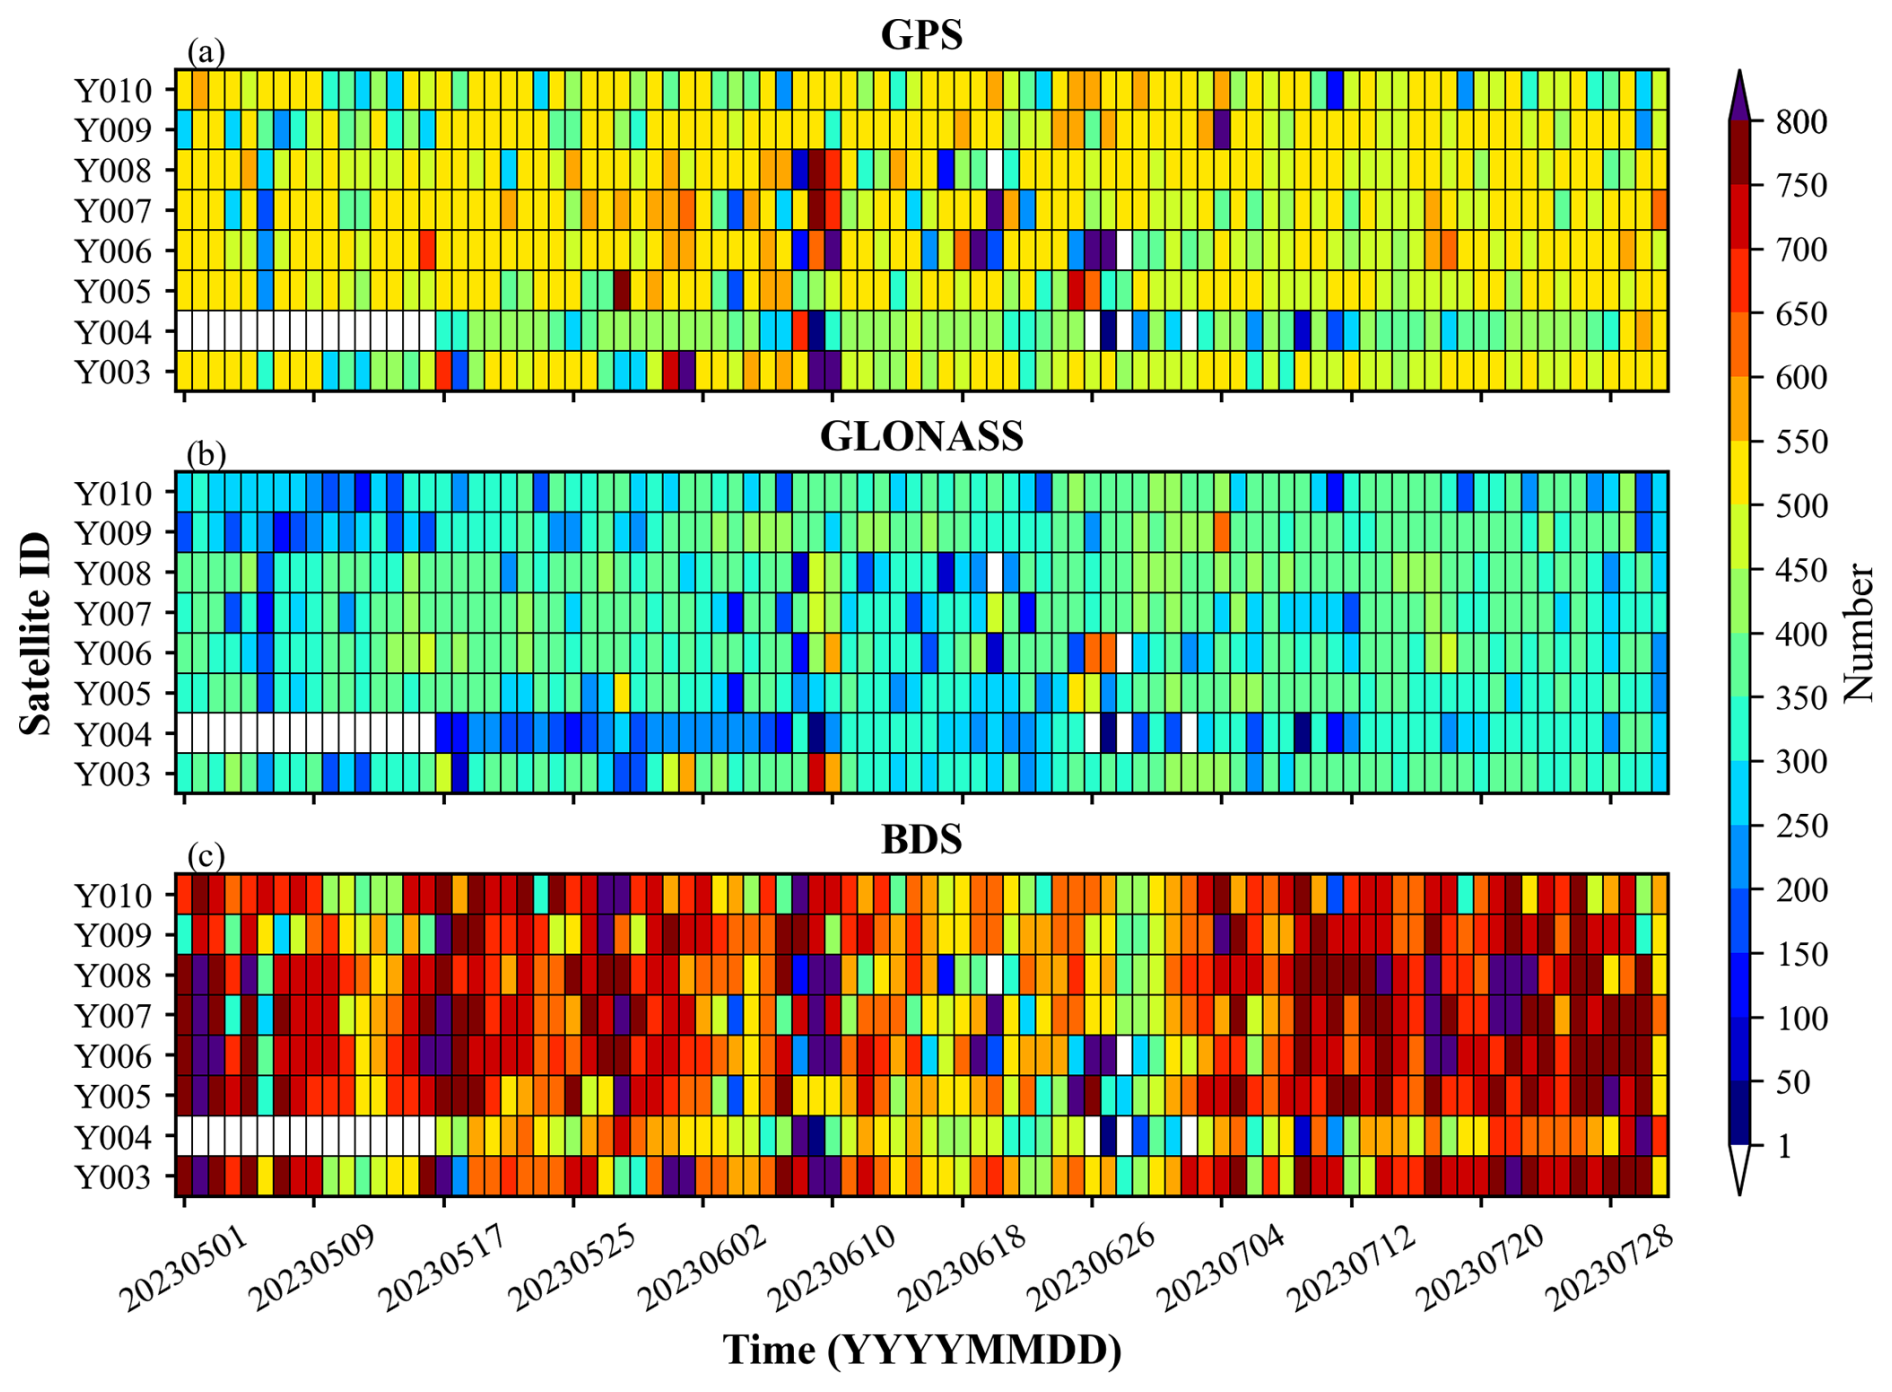
Figure 1The time series of the number of RO profiles for Y003–Y010 (a, b, and c represent GPS, GLONASS, and BDS occultations, respectively).
Figure 2a, c, and e show the penetration depths of Y008 GPS, GLONASS, and BDS occultation profiles, respectively. The Y008 satellite was selected randomly, and the performance of the other YUNYAO satellites is consistent with Y008. The penetration depth of RO is an important indicator of its detection performance. Due to the influence of moisture, various errors, such as multipath propagation errors, receiver tracking errors, and super-refraction errors, are introduced in the lower troposphere. Therefore, the detection capability of the signal in the lower troposphere is limited, and the proportion of profiles that can penetrate the complex atmosphere to reach near the ground is reduced. As shown in Fig. 2, the RO profiles from BDS and GPS have a consistent penetration depth, while the penetration depths of RO profiles from GLONASS are not as deep as those from BDS and GPS. In mid- to high-latitude regions, the penetration depth of BDS and GPS RO profiles is mostly below 1 km, while in low-latitude regions, it is around 2 km. This may be related to the higher humidity levels in low-latitude regions. For GLONASS RO profiles, the penetration depth is around 2 km in high-latitude regions and around 4 km in low-latitude regions.
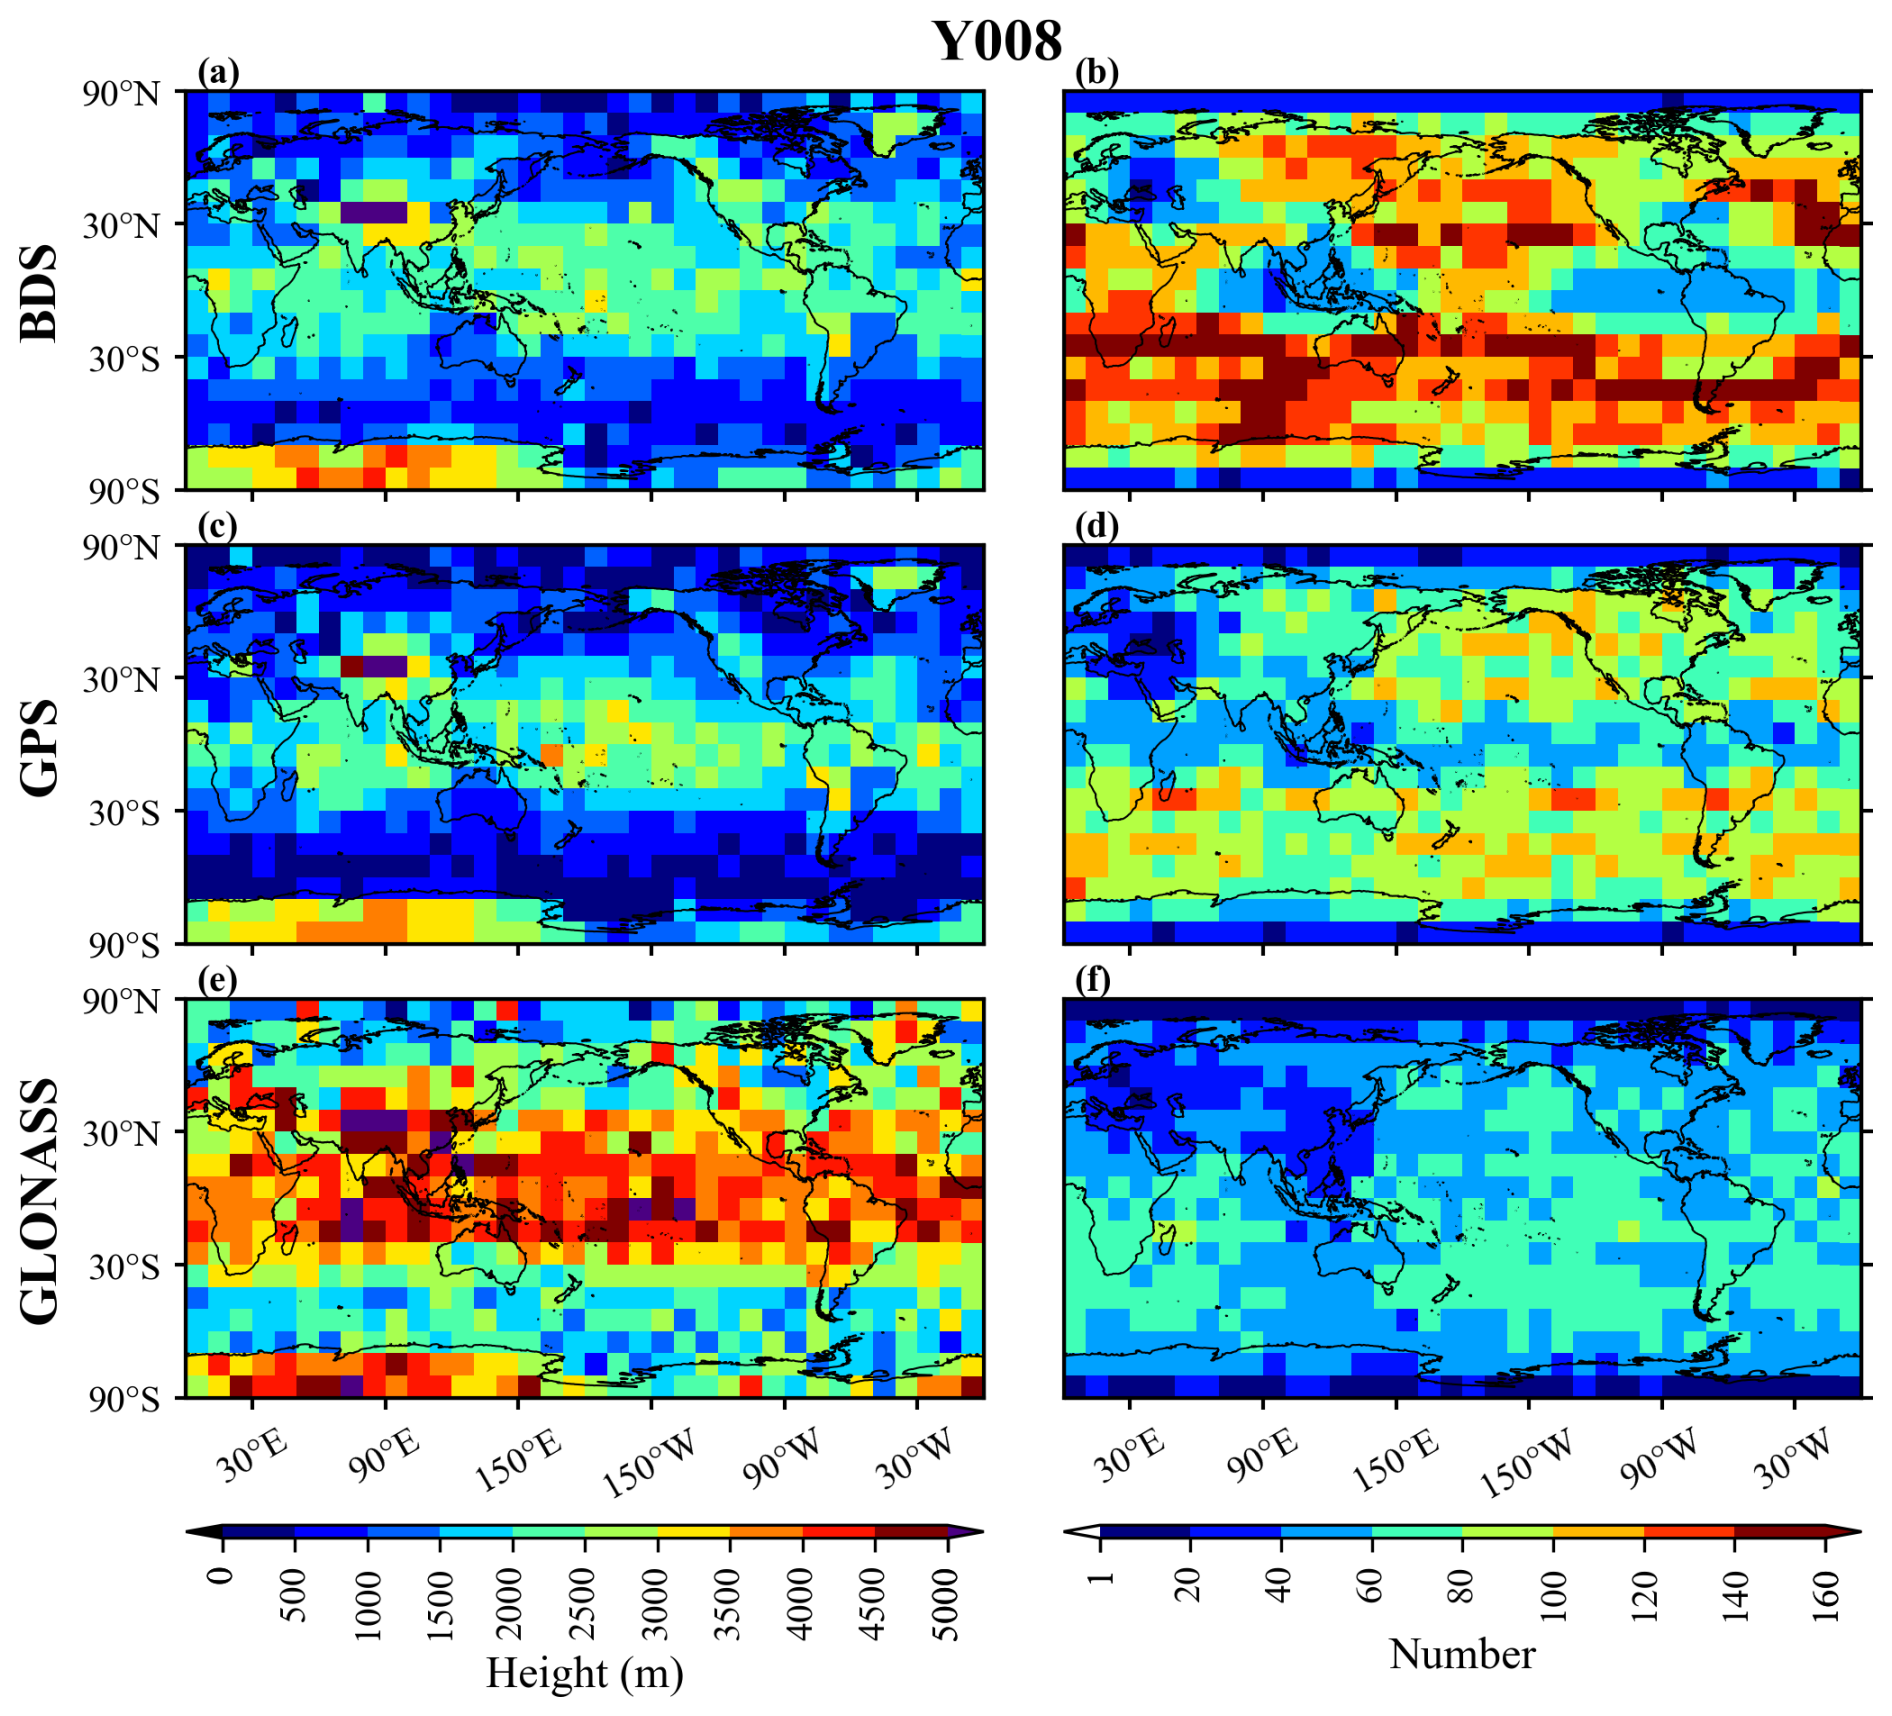
Figure 2The spatial distribution of the average penetration depths of Y008 RO profiles (a, c, and e represent GPS, GLONASS, and BDS, respectively) and the spatial distribution of the number of RO profiles (b, d, and f represent GPS, GLONASS, and BDS, respectively). RO profiles are grouped by their latitude and longitude positions into 10°×10° grid boxes for statistical analysis.
2.1.2 COSMIC-2 and Metop-C RO data
This study compares the assessment results of C2 and MTPC RO profiles with the assessment results of YUNYAO RO profiles to analyze the quality of YUNYAO RO profiles. RO data from C2 and GPS Receiver for Atmospheric Sounding (GRAS) on board the Metop satellites have been extensively evaluated and have shown positive impacts on numerical weather prediction (Anlauf et al., 2011; Cucurull, 2023; Schreiner et al., 2011, 2020). C2 and MTPC RO data are obtained from the COSMIC Data Analysis and Archive Center (CDAAC; https://www.cosmic.ucar.edu, last access: 13 March 2025). Similar to the period of YUNYAO RO data, C2 and MTPC RO data from 1 May to 31 July 2023 were used.
2.1.3 ERA5 data
ERA5 is the fifth generation of the ECMWF reanalysis data set, available in the Climate Data Store (https://cds.climate.copernicus.eu/, last access: 13 March 2025). The ERA5 data provide hourly atmospheric parameters with a horizontal grid spacing of 0.25°×0.25° and 37 pressure levels ranging from 1000 to 1 hPa. ERA5 data are widely regarded as the most comprehensive and accurate reanalysis archive. Therefore, we first compared the YUNYAO RO profiles with the ERA5 reanalysis data. ERA5 data were also used in the 3CH method. This study used ERA5 data only from 00:00, 06:00, 12:00, and 18:00 UTC.
2.1.4 FNL data
FNL is the final operational global analysis data from the Global Forecast System (GFS) of the National Centers for Environmental Prediction (NCEP). FNL is produced using the same model that NCEP uses in the GFS, but the FNLs are prepared about an hour or so after the GFS is initialized to allow for the use of more observational data. The FNL analysis data are published every 6 h on a 1°×1° global latitude–longitude grid and include 26 mandatory (and other pressure) levels from 1000 to 10 hPa (https://rda.ucar.edu/datasets/ds083.2/, last access: 13 March 2025).
2.1.5 Radiosonde data
Balloon sounding is a well-established method for obtaining atmospheric temperature and humidity profiles, and its data quality has been extensively studied and frequently used as a reference standard for evaluating other soundings (Corner et al., 1999; Lanzante, 1996; Mapes et al., 2003; Miloshevich et al., 2001). Therefore, global radiosonde (RS) observations are used in the 3CH method. RS data are usually available twice a day (mostly at 00:00 and 12:00 UTC). This study employed only 16 mandatory pressure levels: 1000, 925, 850, 700, 500, 400, 300, 250, 200, 150, 100, 70, 50, 30, 20, and 10 hPa.
2.2 Method
2.2.1 Observation operator
The raw observation of RO is the time delay of the radio signal. Through a series of inversions, additional phase, bending angle, refractivity, and atmospheric elements such as temperature, pressure, and humidity can be obtained. The aim of this study is to assess the quality of YUNYAO RO refractivity and bending angle profiles. To facilitate the comparison between RO data and ERA5/FNL/RS data, it is necessary to transform ERA5/FNL/RS variables into RO variables using an observation operator. This study employed the Smith and Weintraub (1953) equation to calculate refractivity (N):
where P is pressure, T is temperature, and e is water vapor pressure. This expression is accurate to 0.5 % in N for frequencies up to 30 000 MHz and under typical ranges of temperature, pressure, and humidity (a more detailed description can be found in Smith and Weintraub, 1953).
The one-dimensional forward model in the Radio Occultation Processing Package (ROPP) was used to transform the ERA5 variables into bending angles. The forward modeling can be simplified by assuming spherical symmetry so that the impact parameter remains constant along the ray path. In this case, it can be shown that the bending angle is given by the following integral:
where α is the bending angle, a is the impact parameter, n is the refractive index, and x=nr (r is the geocentric radial distance).
2.2.2 Comparison with ERA5
The evaluation method for this section involves analyzing the mean bias (MB) and SD between the RO refractivity and bending angle data and those calculated from ERA5. Given that the magnitude of refractivity and bending angle data decreases exponentially with height, the MB is normalized using the refractivity and bending angle calculated from ERA5, specifically analyzing and , where No represents the observed refractivity, Nb represents the refractivity calculated from ERA5, αo represents the observed bending angle, and αb represents the bending angle calculated from ERA5.
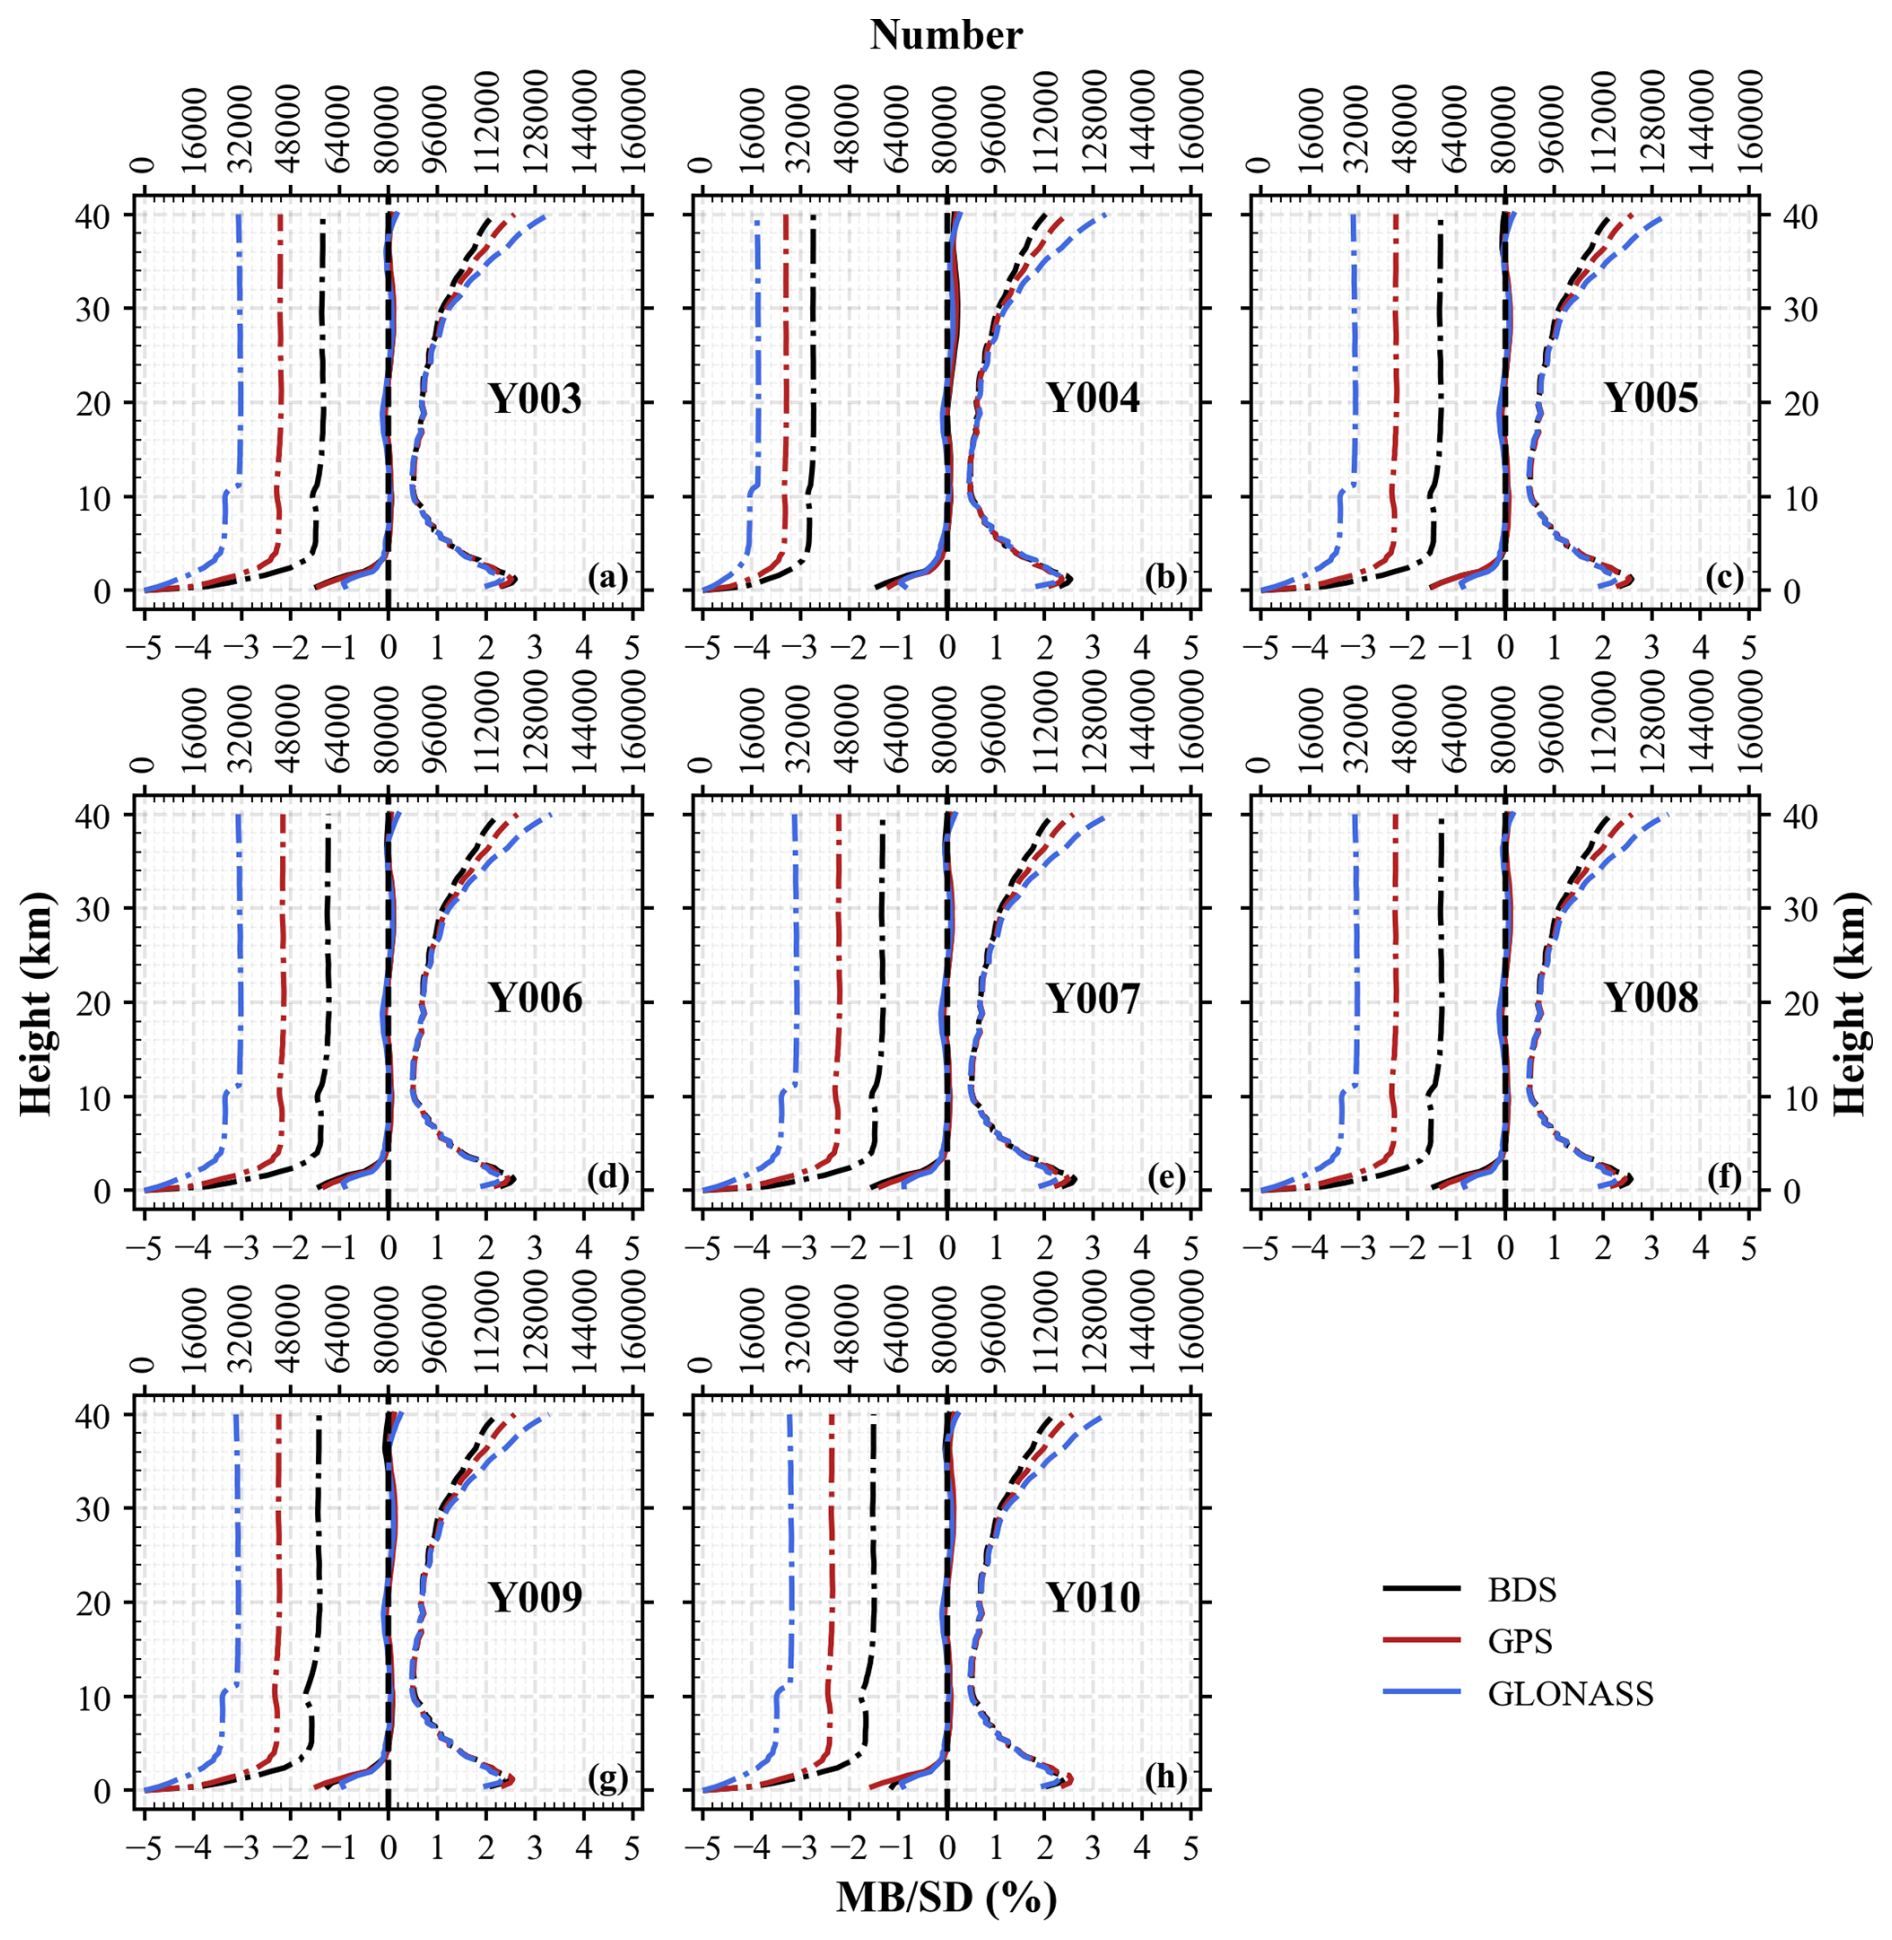
Figure 3Comparison of Y003–Y010 RO refractivity profiles with ERA5. The solid, dashed, and dash-dotted lines represent MB, SD, and observation number, respectively. Black, red, and blue colors represent BDS, GPS, and GLONASS, respectively. The horizontal axis below each subplot is used for MB and SD, while the horizontal axis above is used for observation number.
Given the different temporal and spatial resolutions of RO data and ERA5 reanalysis data, it is necessary to perform temporal and spatial matching to enable comparison. For temporal matching, ERA5 data are linearly interpolated to the RO observation times. For spatial matching, ERA5 data are interpolated to the positions of the RO observations using bilinear interpolation in the horizontal direction. Then, the refractivity at 37 levels of ERA5 is calculated using Eq. (1), and the bending angles are computed at heights of every 400 geopotential meters from 0 to 60 000 geopotential meters using the one-dimensional ROPP model (60 000 m is the default setting; the calculation is actually performed only up to the highest altitude of the ERA5 profile). Since the vertical resolution of RO is significantly higher than the vertical resolution of the refractivity and bending angle profiles calculated from ERA5 data, we first perform a linear interpolation of the RO observations to the heights of the refractivity and bending angle profiles derived from ERA5 data and calculate the biases. Then, the calculated biases are linearly interpolated to heights from 0 to 40 km at 400 m intervals. The use of linear interpolation assumes that the bias varies linearly with height, although the refractivity and bending angle do not change linearly with height.
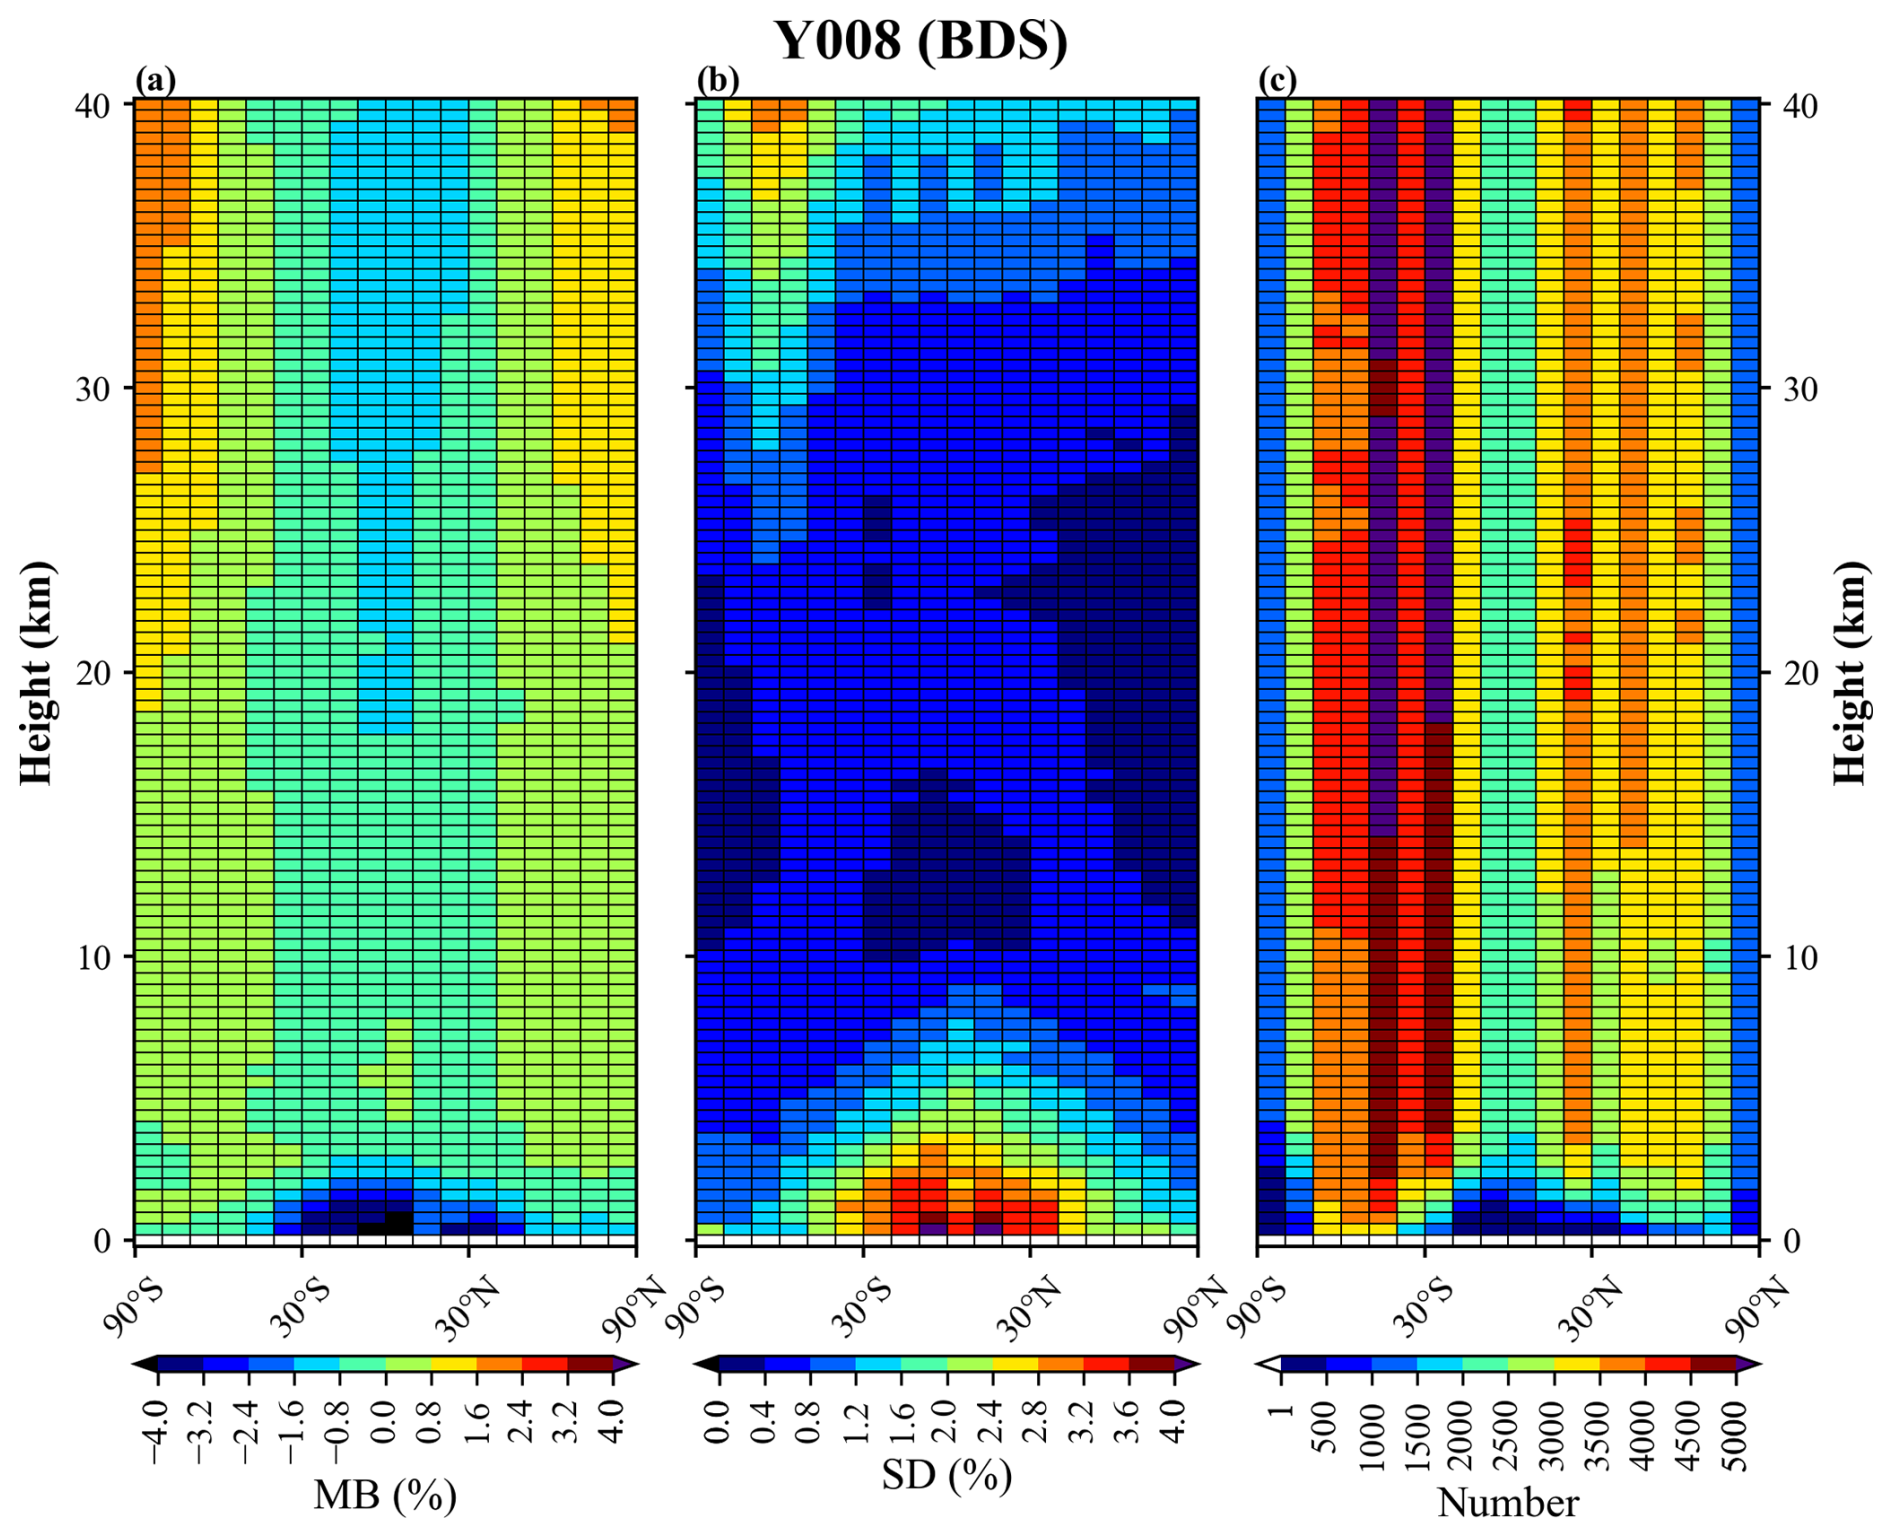
Figure 4The latitude variation in the MB (a) and SD (b) of Y008 BDS refractivity profiles compared to ERA5, as well as the latitude variation in observation number (c).
Due to errors in electromagnetic wave signals and other reasons, there may be erroneous RO data or outlier observations that are far from the simulated values. Therefore, the bi-weight method was used to eliminate outliers (Lanzante, 1996). Similar to Zou and Zeng (2006), this study used c=7.5 and a Z-score threshold of 4. The data were divided into three latitudinal bands for quality control: low latitude (30° S to 30° N), midlatitude (30 to 60° N and 30 to 60° S), and high latitude (60 to 90° N and 60 to 90° S). Observations that passed quality control were used to calculate the biases. Additionally, for refractivity biases, if a single RO refractivity profile contains observations with biases exceeding 50 % within 10 to 30 km, the entire profile is discarded. If more than 50 % of the observations in a single refractivity RO profile have biases exceeding 20 %, the entire profile is also discarded. Finally, observations with RO biases exceeding 10 % were eliminated. For bending angle biases, the same quality control method was applied, although RO observations with bending angle biases exceeding 10 % were retained.
For all quality-controlled samples, the MB and SD are calculated using the following formulas:
where Xi represents the refractivity bias or bending angle bias of a single sample, and n represents the total number of samples.
2.2.3 3CH method
In this study, the 3CH method (Anthes and Rieckh, 2018) is used to estimate the random error SD (uncertainty) of RO refractivity observations. Anthes and Rieckh (2018) provided a detailed description of the 3CH method. Similar to Anthes and Rieckh (2018), three data sets (ERA5, FNL, and RS) are used to estimate the errors in RO observations. The 3CH equations include bias correction terms; we remove the mean biases from each data set (O'Carroll et al., 2008).
ERA5 and FNL data are interpolated to the locations and times of RO data, and only the 16 pressure levels corresponding to the mandatory levels of RS are used. Then, the RO data are vertically interpolated to the heights of ERA5. RO data within 3 h and 300 km of the RS locations are matched to the RS data. Considering the spatial and temporal differences between RS and the matched RO observations, we applied a spatial–temporal sampling correction (Gilpin et al., 2018). The specific approach is as follows: first, the ERA5 data are interpolated to the times and locations of both RO and RS data to calculate the refractivity. Then, the difference in refractivity between these two spatiotemporal positions is computed to represent the bias introduced by spatiotemporal differences. Finally, this bias is subtracted from the refractivity calculated from the RS data. After performing the above steps, the error SDs for YUNYAO, C2, and MTPC are estimated at the 16 mandatory pressure levels of RS.
It is worth noting that this study used three data sets to estimate the RO errors, which allows for the production of three independent 3CH estimates of the error SD. The Results section mainly discusses the mean of these three error SDs.
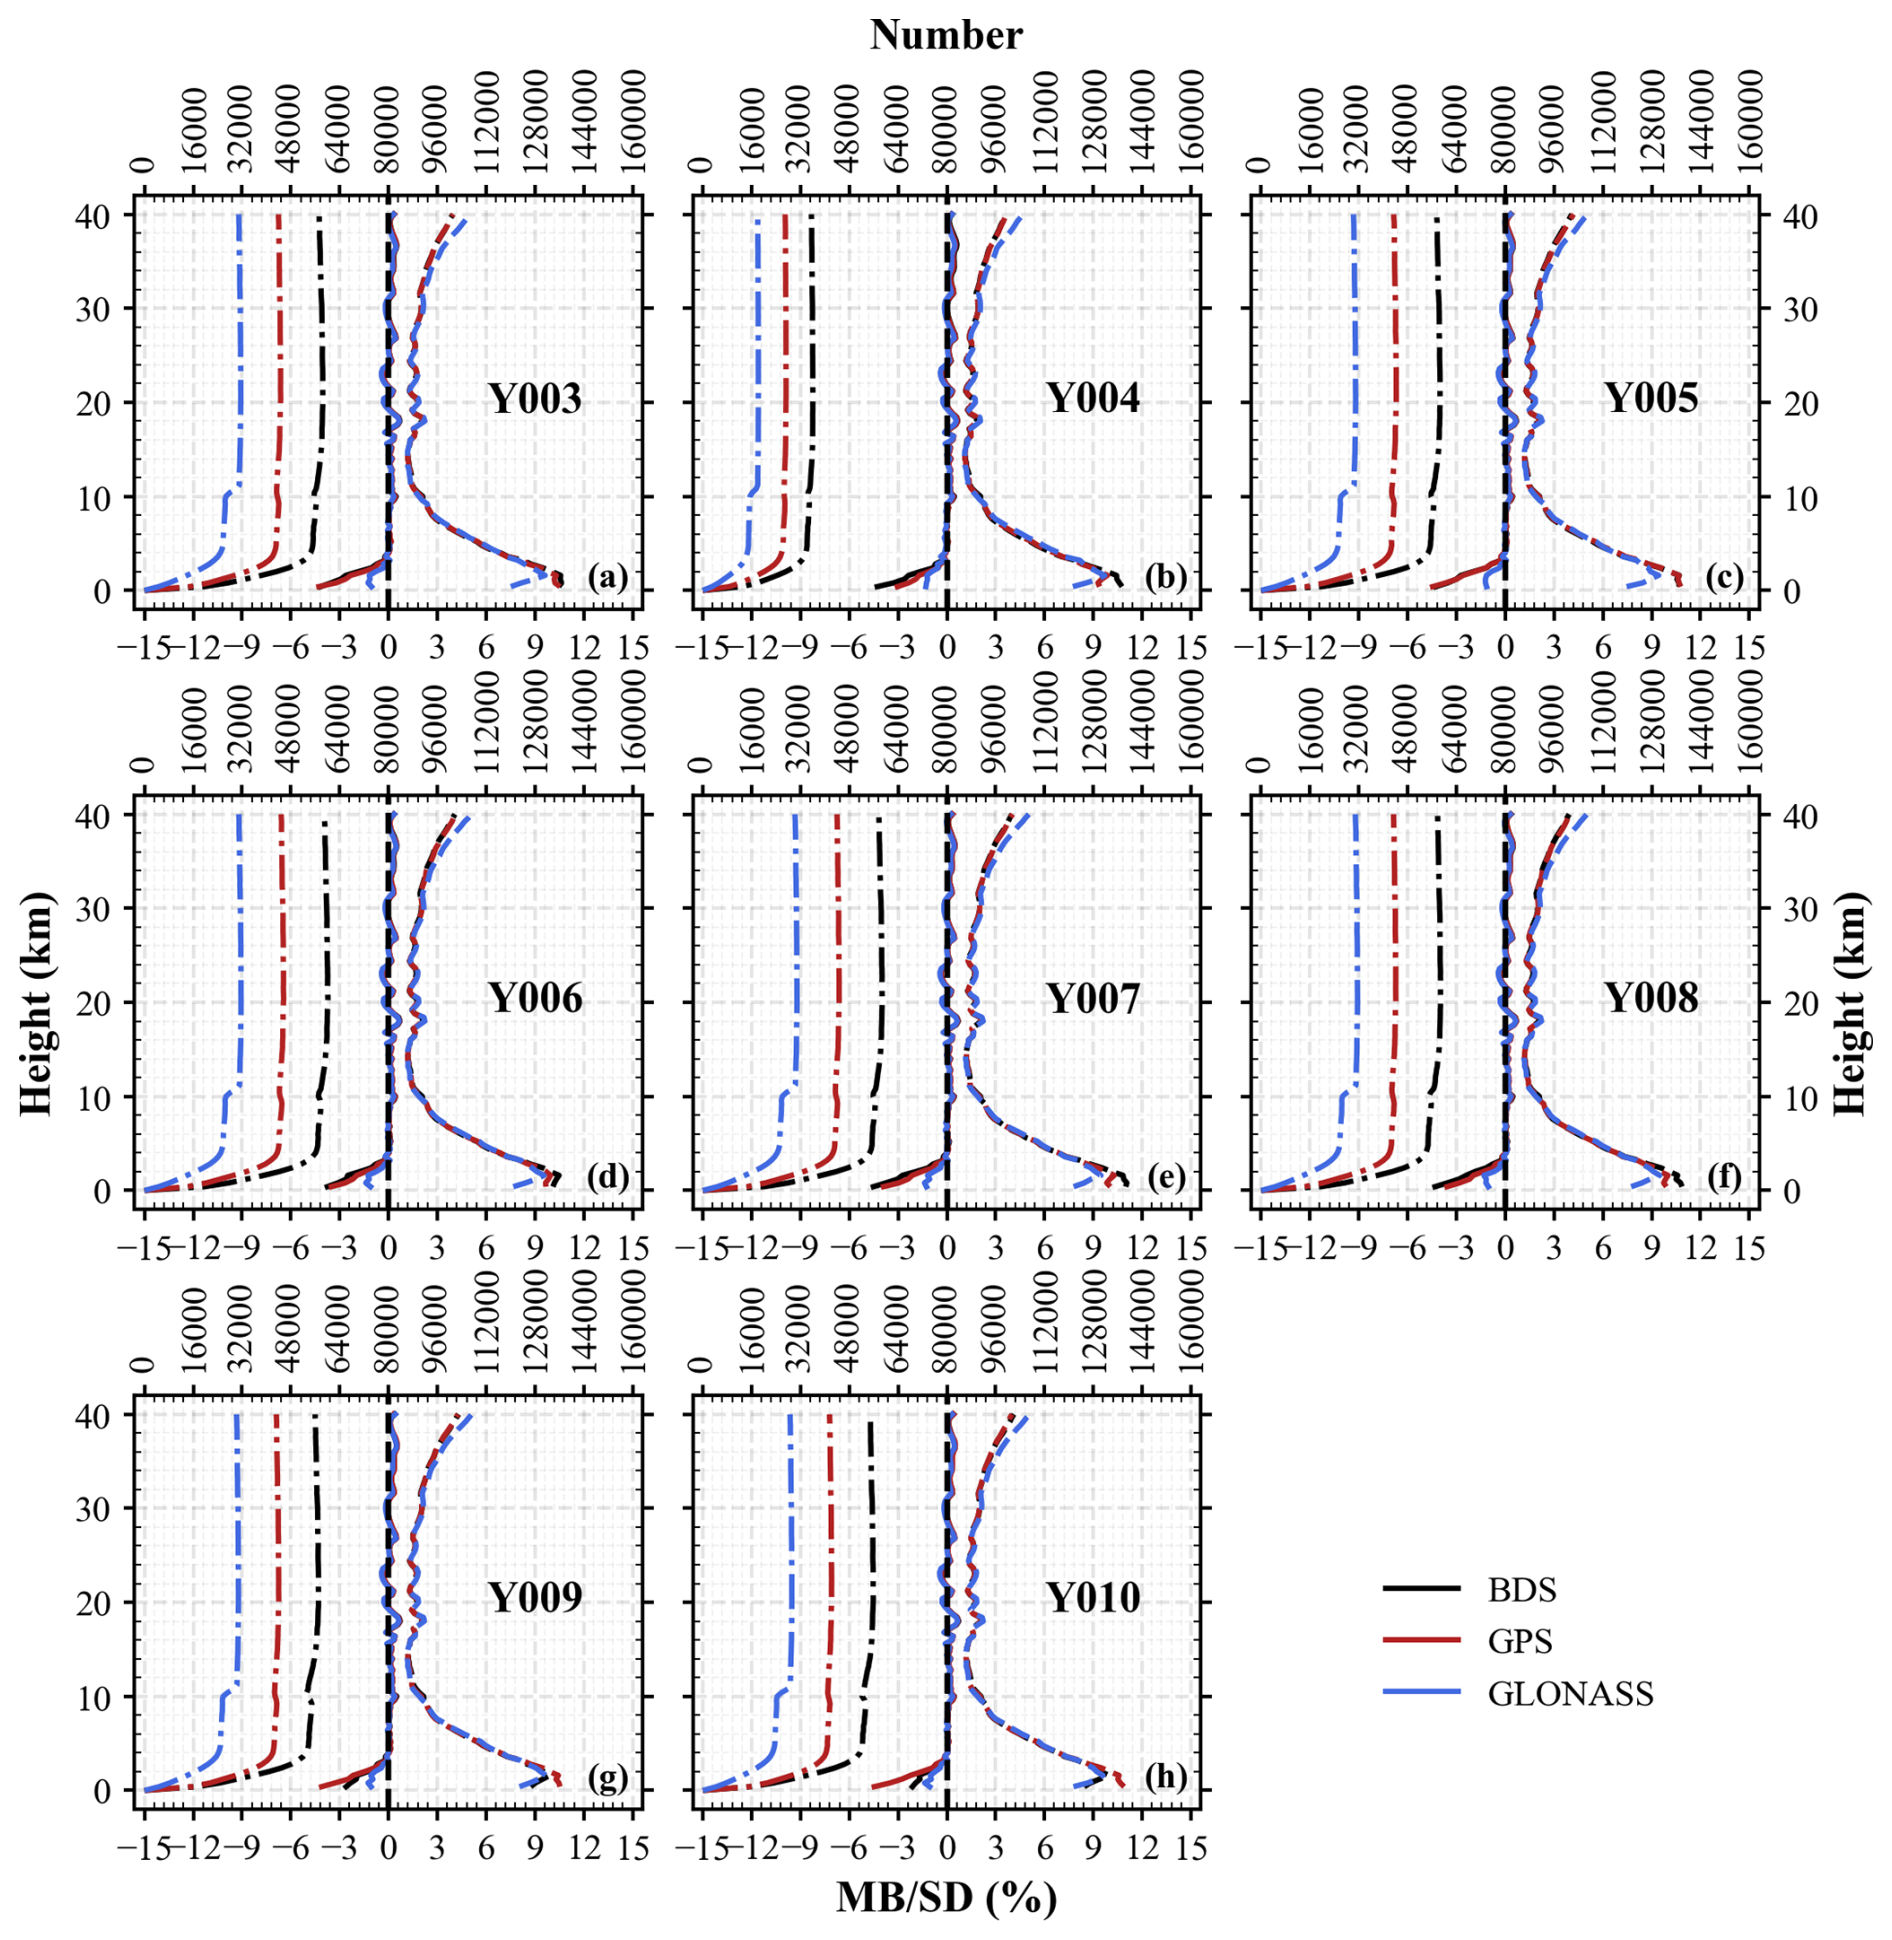
Figure 5Comparison of Y003–Y010 RO bending angle profiles with ERA5. The solid, dashed, and dash-dotted lines represent MB, SD, and observation number, respectively. Black, red, and blue colors represent BDS, GPS, and GLONASS, respectively. The horizontal axis below each subplot is used for MB and SD, while the horizontal axis above is used for observation number.
3.1 Comparison with ERA5
As described in Sect. 2.1.1, a total of eight satellites provided RO observations during the study period, and each satellite was capable of receiving radio signals from BDS, GPS, and GLONASS simultaneously. The RO observations from different LEO satellites and different GNSS satellites were evaluated separately. Figure 3 shows the comparison of YUNYAO RO refractivity profiles with ERA5. Each subplot represents a YUNYAO satellite, with black, red, and blue colors representing BDS, GPS, and GLONASS, respectively. For each YUNYAO satellite, the numbers of BDS, GPS, and GLONASS occultation profiles used for comparison are approximately 31 000, 41 000, and 59 000, respectively, with relatively fewer profiles for the Y004 satellite.
The RO refractivity data from each YUNYAO satellite exhibits similar bias characteristics. Taking the Y008 satellite as an example, the absolute values of MB for BDS, GPS, and GLONASS are less than 1.46 %, 1.31 %, and 0.86 %, respectively. Below 4 km, there is a slight negative bias, and GLONASS exhibits the smallest bias. RO biases in the lower troposphere are caused by various factors, such as super-refraction (Ao, 2007; Ao et al., 2003; Sokolovskiy, 2003; Xie et al., 2006), tracking depth and noise (Sokolovskiy, 2003; Sokolovskiy et al., 2010), and fluctuations of refractivity (Gorbunov et al., 2015; Gorbunov and Kirchengast, 2018). The MB is minimal between 4 and 40 km. Specifically, the average values of MB for BDS, GPS, and GLONASS between 4 and 40 km are 0.022 %, 0.036 %, and −0.008 %, respectively, while the average values of MB between 10 and 30 km are 0.020 %, 0.026 %, and −0.019 %, respectively.
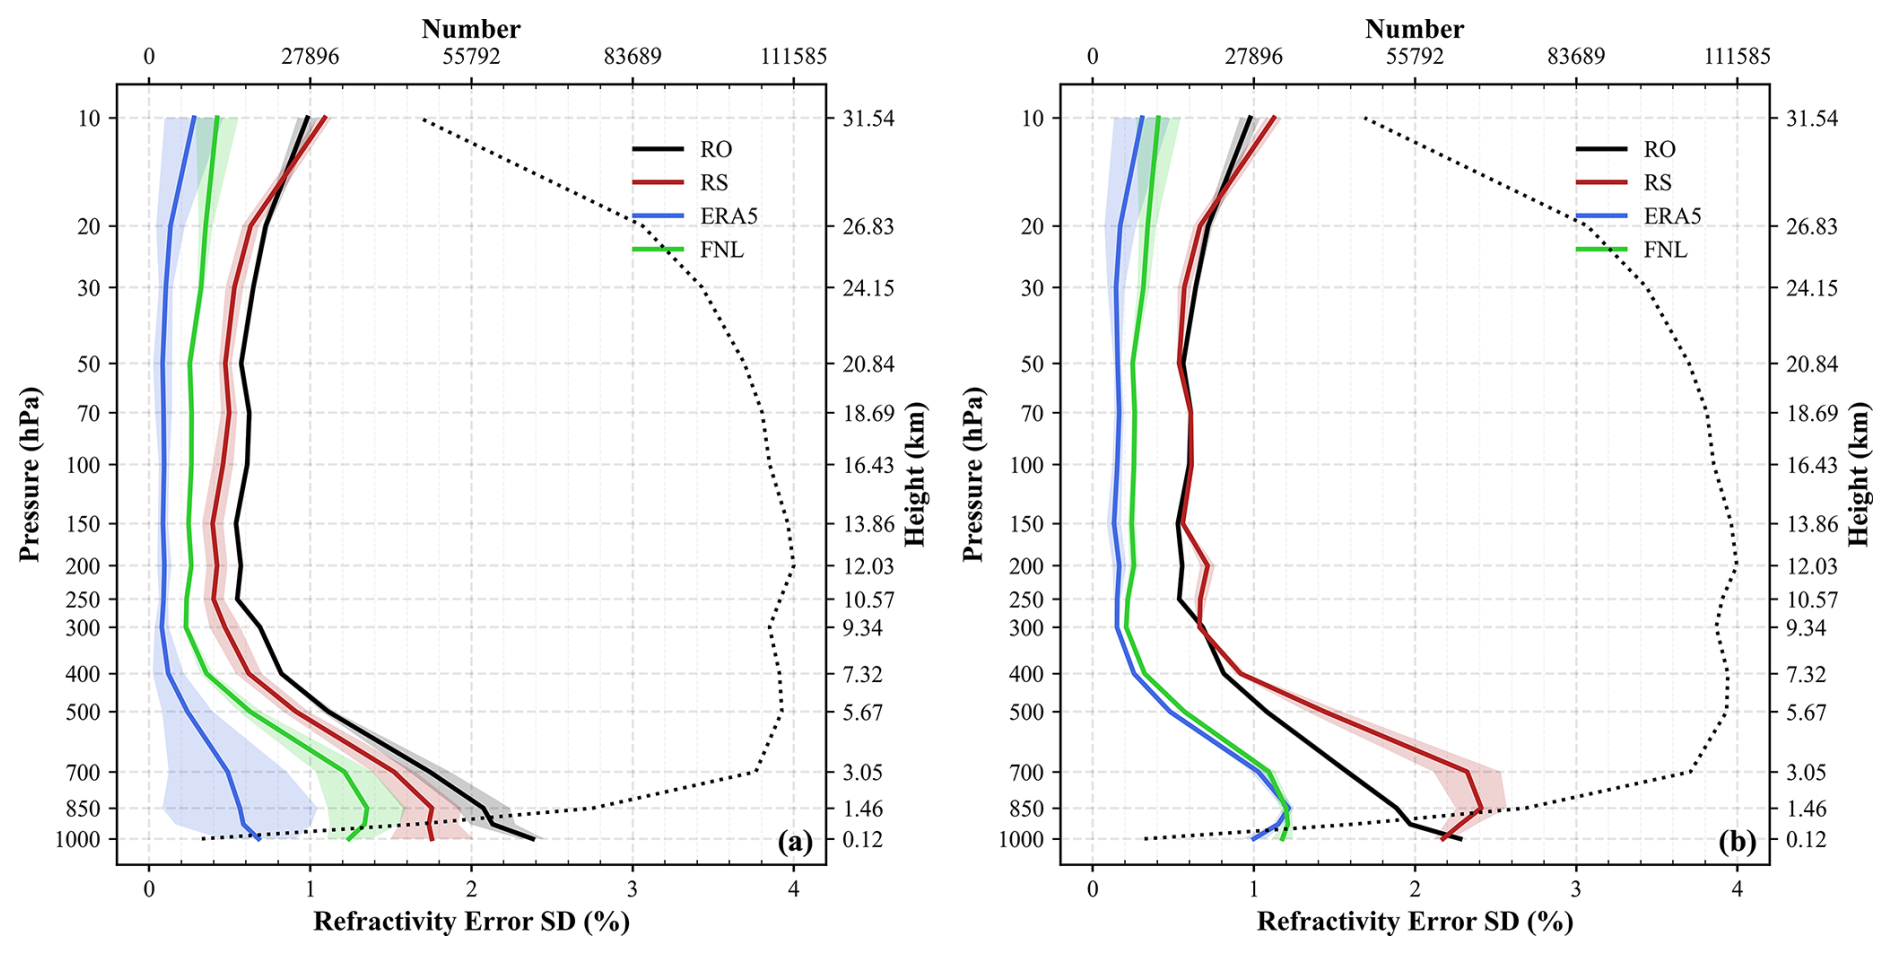
Figure 63CH estimates of refractivity error SD of YUNYAO RO (black), ERA5 (blue), FNL (green), and RS (red). (a) Spatial–temporal sampling correction applied and (b) without spatial–temporal sampling correction. The solid lines represent the mean of the three SD estimates for each data set, and the shading indicates the SD of the three error SD estimates. The dotted line shows the number of matched data. The right vertical axis represents the average height of all samples at each pressure level.
The SDs of BDS, GPS, and GLONASS are less than 2.58 %, 2.60 %, and 3.34 %, respectively, with larger SDs occurring in the lower troposphere and upper stratosphere. The increase in uncertainty in the upper stratosphere is related to the reduction in the neutral atmospheric signal below the phase noise level (Sokolovskiy et al., 2010). The SDs of BDS, GPS, and GLONASS between 10 and 30 km are less than 1.09 %, 1.17 %, and 1.24 %, respectively. Notably, there are differences in the SDs of BDS, GPS, and GLONASS, especially in the lower troposphere and upper stratosphere. Below 4 km, the SD of GLONASS is the smallest. Between 4 and 30 km, the SDs of BDS, GPS, and GLONASS are relatively consistent. Above 30 km, the SDs clearly show the pattern BDS < GPS < GLONASS.
To further discuss the horizontal distribution of data quality, Fig. 4 shows the variation in MB and SD with latitude between the Y008 BDS refractivity profiles and ERA5. As shown in Fig. 4, the Y008 BDS refractivity profiles exhibit a negative bias in the lower troposphere, with larger biases in low-latitude regions. Above 4 km, a cold bias still exists in low-latitude regions, and the bias gradually increases with altitude. In mid- to high-latitude regions, there is mainly a positive bias, which also gradually increases with altitude. The areas with larger SD are mainly distributed in two places: the lower troposphere in low-latitude regions and the stratosphere in the Southern Hemisphere. The negative bias and larger SD in the lower troposphere in low-latitude regions are related to higher water vapor content, while the larger SD in the Southern Hemisphere stratosphere may originate from model biases (Cucurull et al., 2007).
The bias characteristics of bending angles closely resemble those of refractivity (Fig. 5). Taking the Y008 satellite as an example, the absolute values of MB for BDS, GPS, and GLONASS are less than 4.31 %, 3.58 %, and 1.31 %, respectively. Between 4 and 40 km, the average values of MB for BDS, GPS, and GLONASS are 0.15 %, 0.15 %, and 0.09 %, respectively. Between 10 and 30 km, the average values of MB are 0.12 %, 0.13 %, and 0.06 %, respectively. Between 0 and 40 km, the SDs of BDS, GPS, and GLONASS are less than 10.87 %, 10.00 %, and 9.50 %, respectively. Between 10 and 30 km, the SDs of BDS, GPS, and GLONASS are less than 2.09 %, 2.11 %, and 2.23 %, respectively. Notably, the wavy structures in MB and SD are related to the sparse vertical layering of ERA5. The MB and SD of refractivity do not exhibit such phenomena because the interpolation method avoids directly interpolating the refractivity calculated from ERA5 to high resolution (see Sect. 3.1). In contrast, the bending angle is directly calculated at high resolution and is an integral quantity. The latitudinal distribution of bending angle biases aligns with the distribution of refractivity (Fig. S1 in the Supplement).
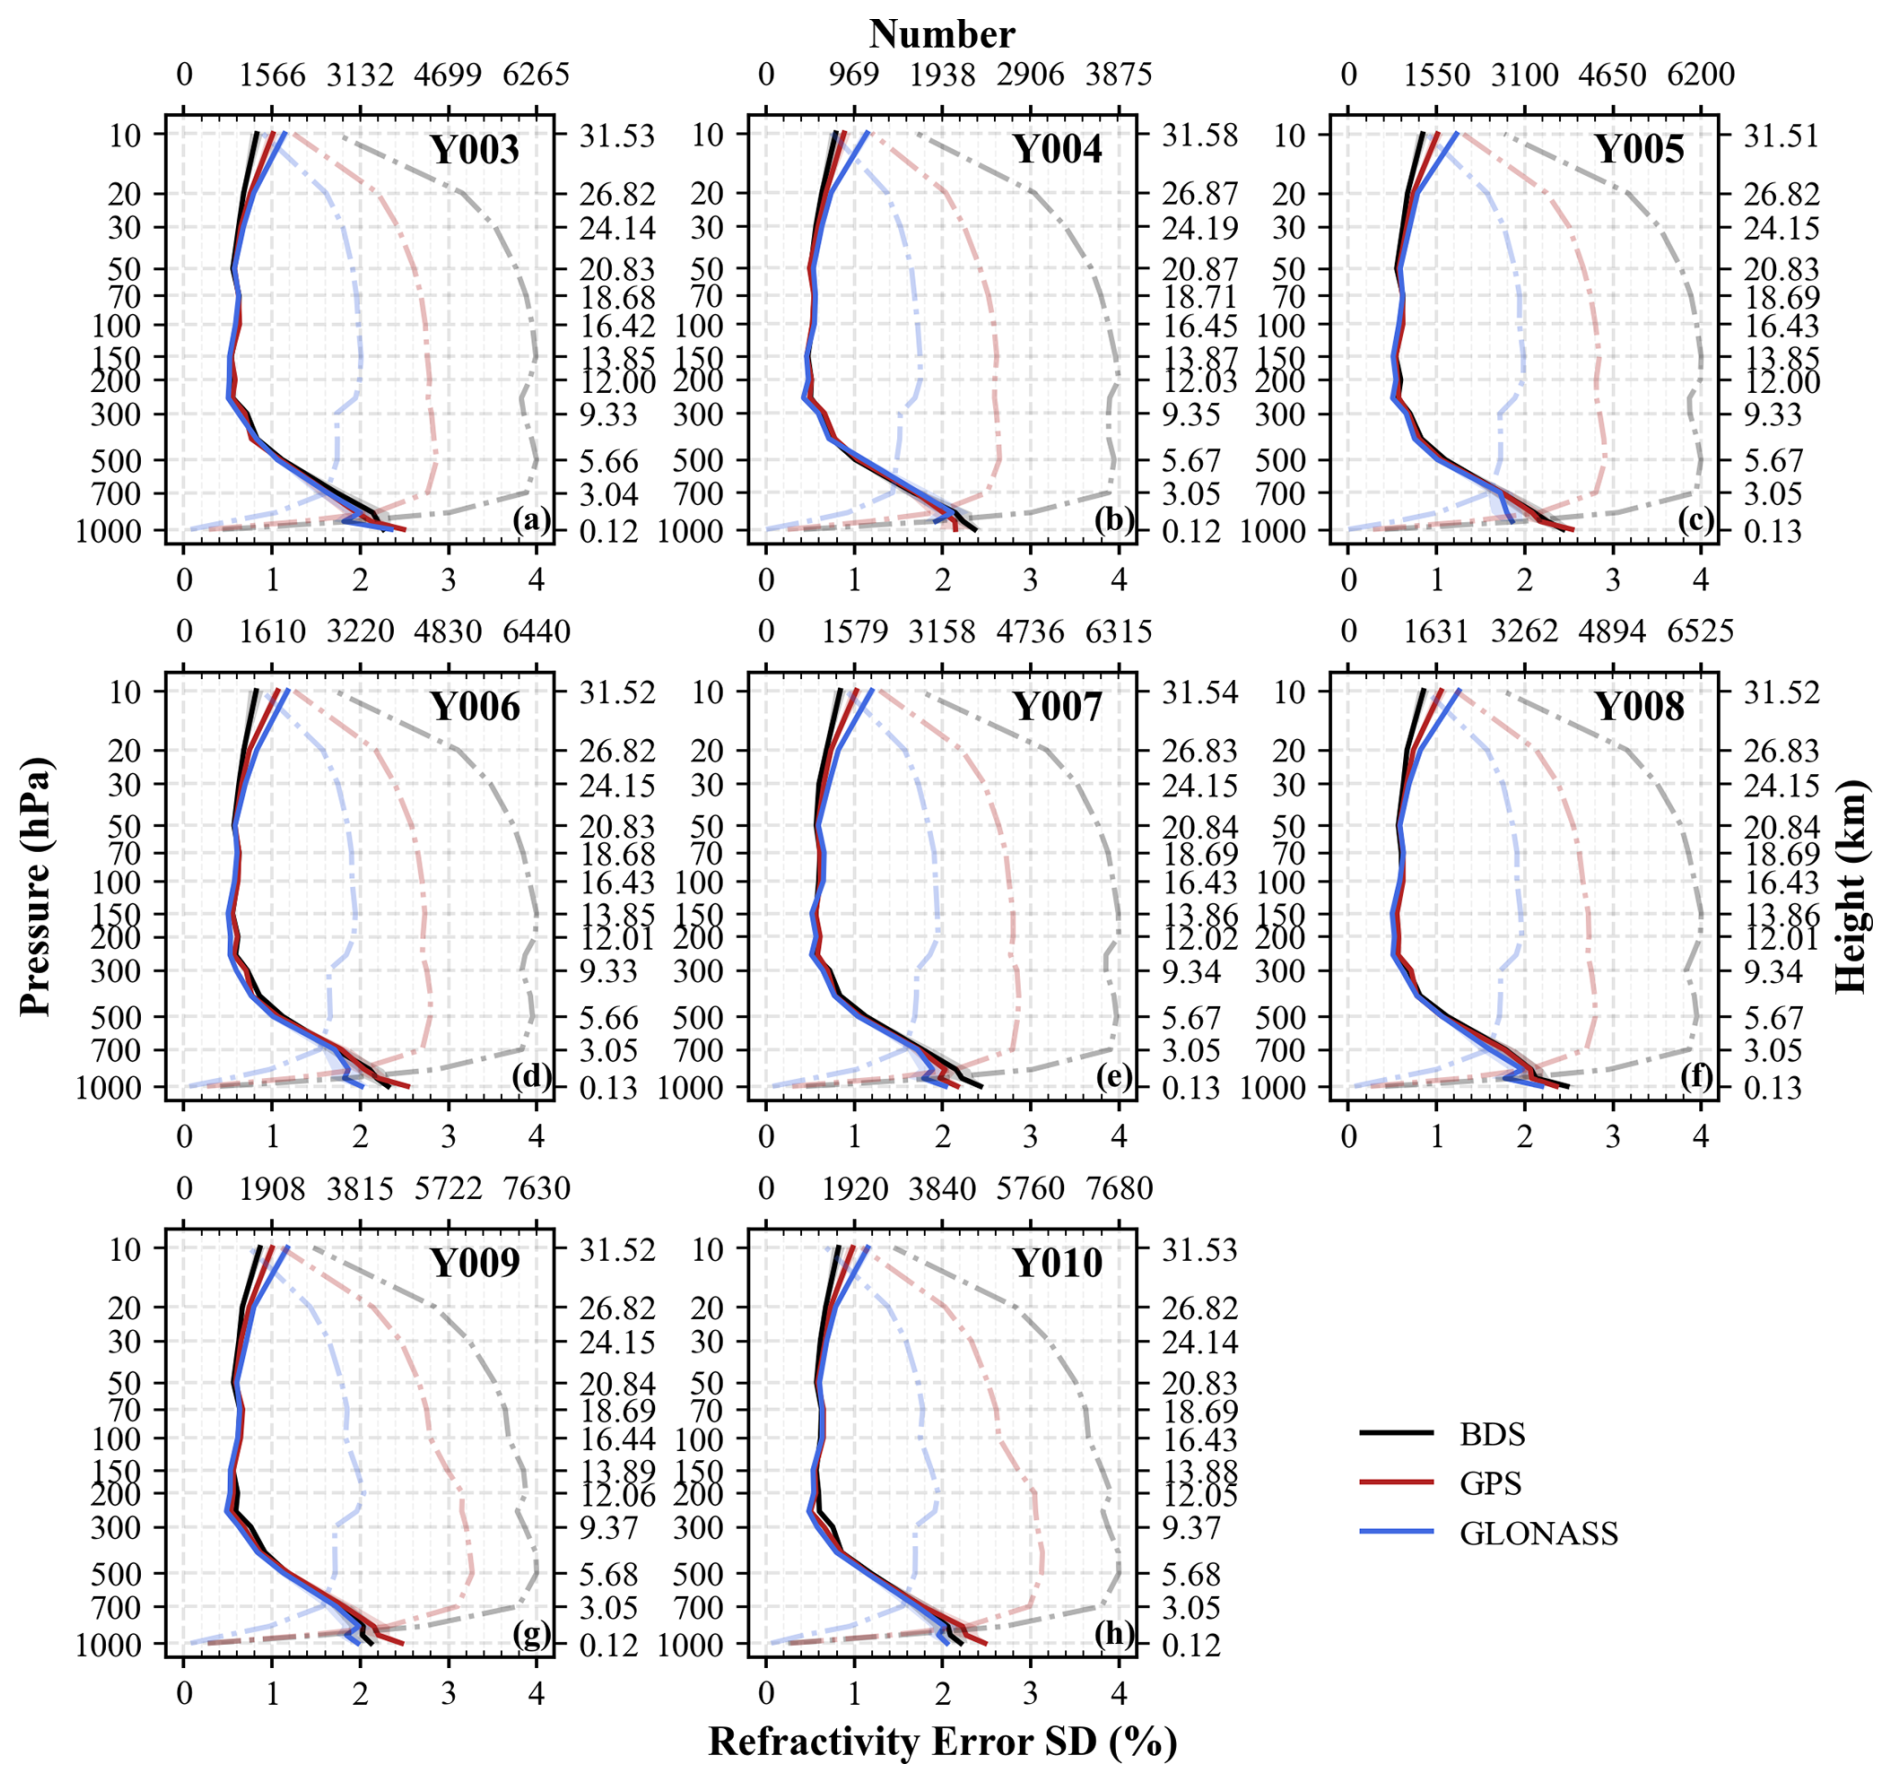
Figure 73CH estimates of the refractivity error SD of Y003–Y010 RO. The solid and dash-dotted lines represent the refractivity error SD and matched data number. Black, red, and blue colors represent BDS, GPS, and GLONASS, respectively. The horizontal axis below each subplot is used for the refractivity error SD, while the horizontal axis above is used for the data number. The right vertical axis represents the average height of all samples at each pressure level.
3.2 3CH results
ERA5, FNL, RS, and YUNYAO RO data were used in the 3CH method. Four data sets produce three independent 3CH estimates of the error SD. Figure 6 shows the 3CH results for the four data sets. LEO satellites and GNSS satellites are not distinguished here. In Fig. 6a, a spatial–temporal sampling correction was implemented for the RS data, whereas in Fig. 6b, the RS data did not undergo this correction. As shown in Fig. 6a, ERA5 demonstrated the smallest error SD, followed by FNL and RS, while RO exhibited the largest error SD. Compared to the results of Schreiner et al. (2020), the error SD of YUNYAO RO is generally consistent with that of C2 (a detailed comparison is provided in the next section). Unlike previous studies (Rieckh et al., 2021; Schreiner et al. 2020), the RS error SD in this study is smaller than the RO error SD, which is due to the application of the spatial–temporal sampling correction. Figure 6b shows the results in the absence of the spatial–temporal sampling correction for the RS data. As illustrated in the figure, the RS error SD increases significantly. The error SD of YUNYAO RO remains largely unchanged and is smaller than the RS error SD below 10 km. Above 10 km, the error SDs of YUNYAO RO and RS are comparable, which may be due to different quality control applied to the RS data. Notably, the error SD of ERA5 in Fig. 6b is larger than in Fig. 6a. This is because the spatial–temporal sampling correction was implemented using ERA5 data, leading to a notably smaller error SD for ERA5 when estimated with RS data after applying the correction (Fig. S2).
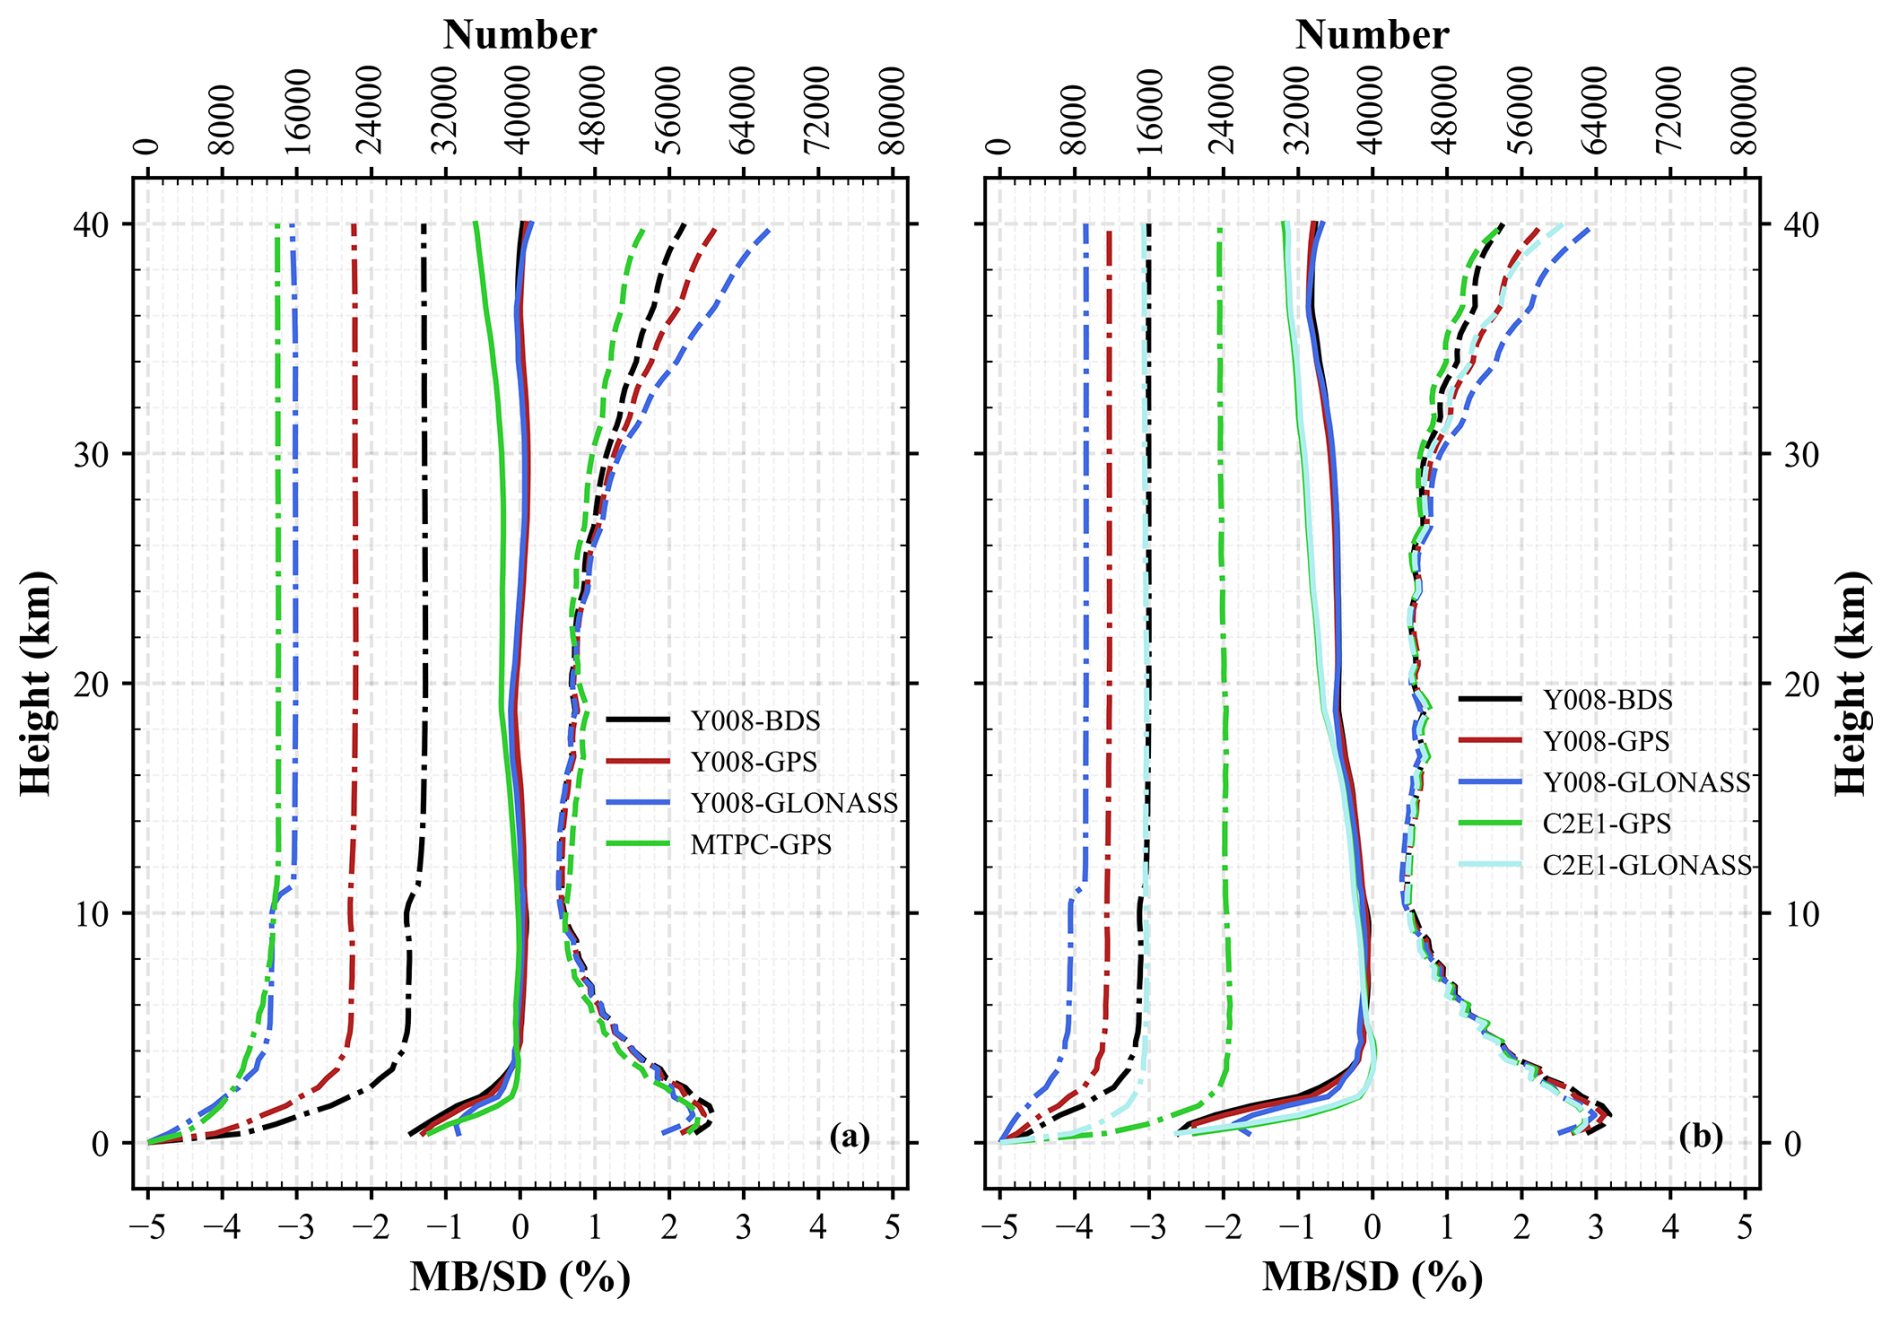
Figure 8Comparison of Y008, MTPC, and C2E1 RO refractivity profiles with ERA5. The solid, dashed, and dash-dotted lines represent MB, SD, and observation number, respectively. The horizontal axis below each subplot is used for MB and SD, while the horizontal axis above is used for observation number. In (a), black, red, blue, and green represent Y008 BDS, Y008 GPS, Y008 GLONASS, and MTPC GPS, respectively. In (b), black, red, blue, green, and pale turquoise represent Y008 BDS, Y008 GPS, Y008 GLONASS, C2E1 GPS, and C2E1 GLONASS, respectively.
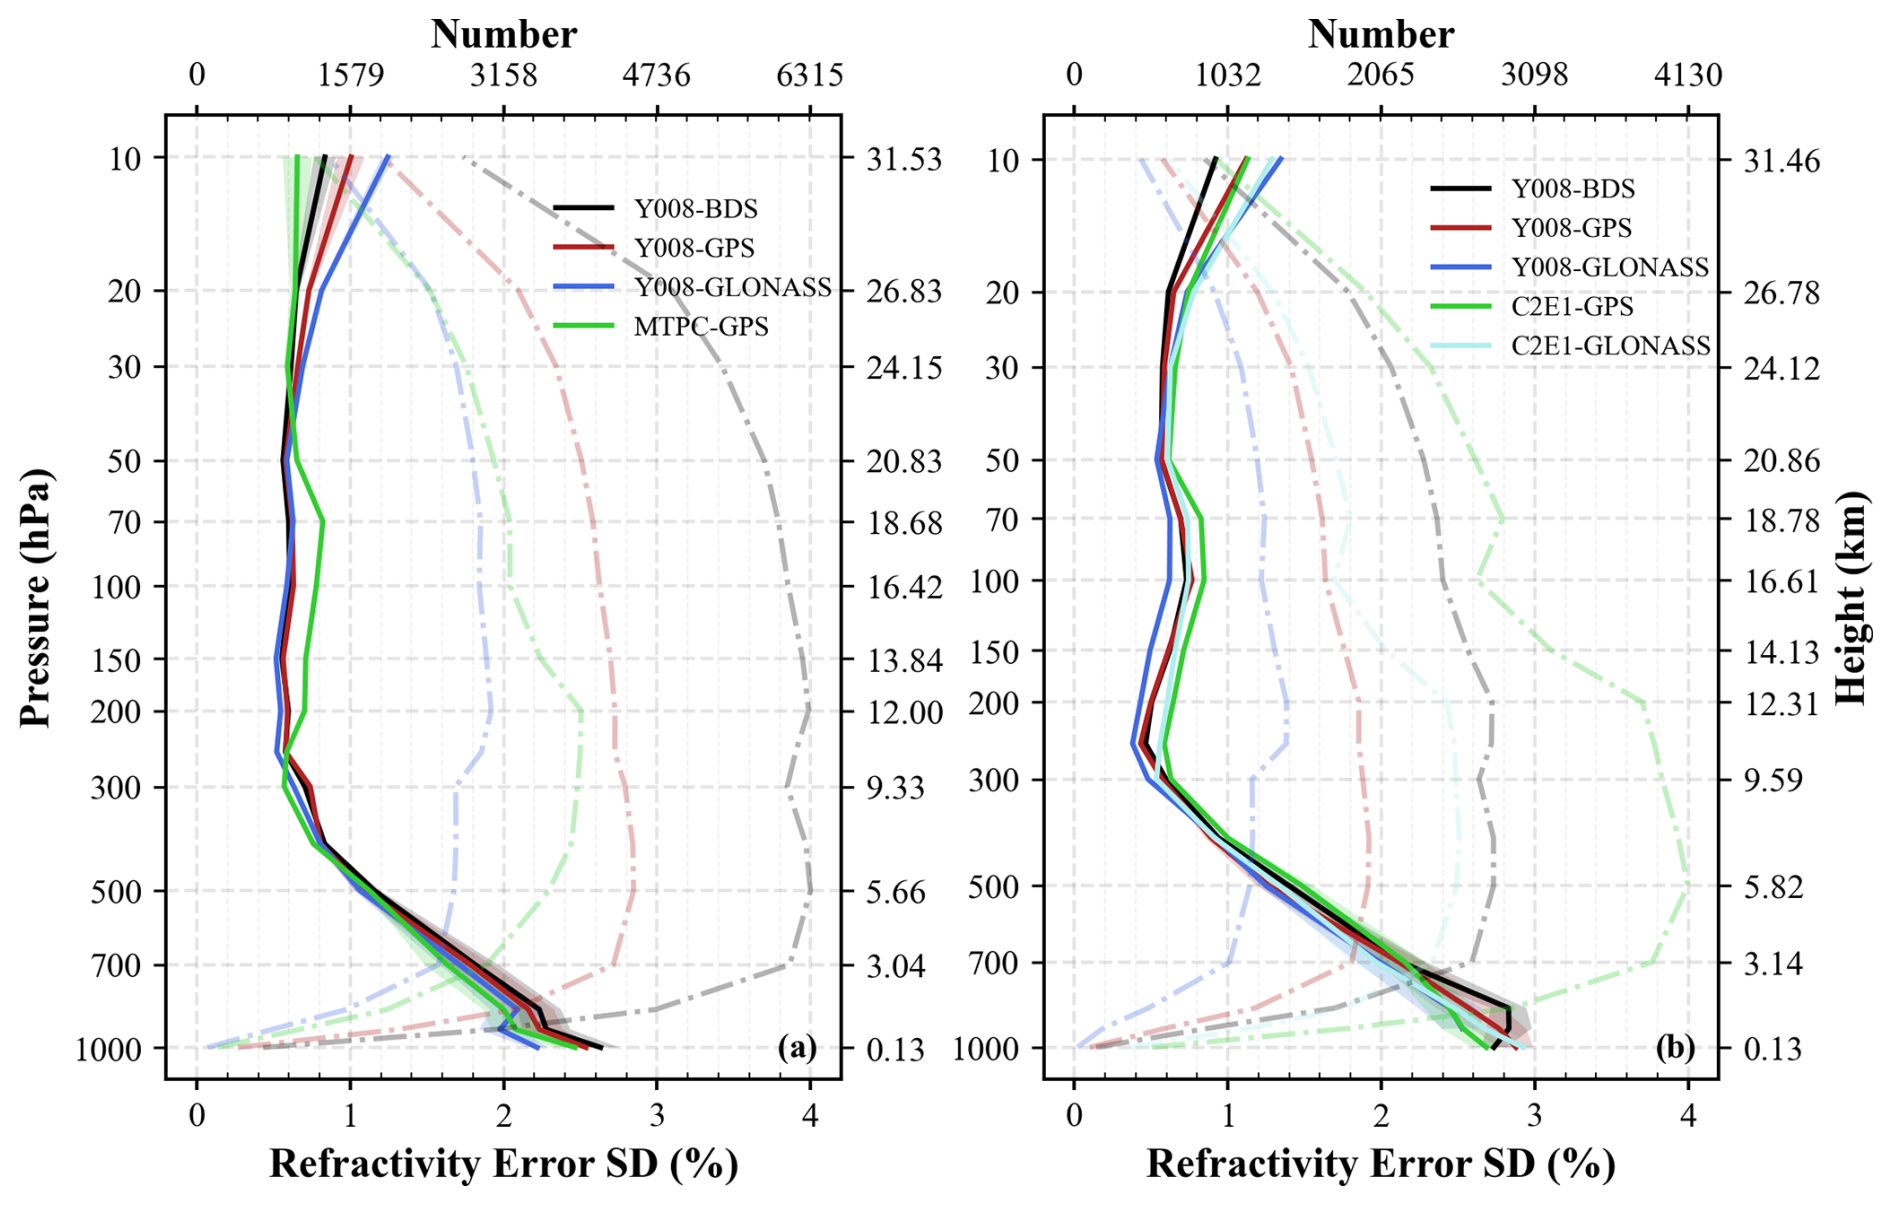
Figure 9Comparison of refractivity error SD between Y008 RO and MTPC (a), as well as comparison of refractivity error SD between Y008 RO and C2E1 (b). The solid and dash-dotted lines represent refractivity error SD and data number, respectively. The horizontal axis below each subplot is used for refractivity error SD, while the horizontal axis above is used for data number. The right vertical axis of each subplot represents the average height of all samples at each pressure level. In (a), black, red, blue, and green represent Y008 BDS, Y008 GPS, Y008 GLONASS, and MTPC GPS, respectively. In (b), black, red, blue, green, and pale turquoise represent Y008 BDS, Y008 GPS, Y008 GLONASS, C2E1 GPS, and C2E1 GLONASS, respectively.
The results for different LEO satellites and GNSS satellites are shown in Fig. 7. Similar to Fig. 3, the quality of RO data from different LEO satellites is generally consistent, as evidenced by the similar refractivity error SD. In the pressure range of 1000–10 hPa (approximately 0–32 km), the refractivity error SDs of Y002–Y010 are all below 2.53 %. Among these, they are greater than 1 % in the pressure range of 1000–500 hPa (approximately 0–6 km) and less than 1 % in the pressure range of 500–20 hPa (approximately 6–27 km).
There are differences in the refractivity error standard deviation (SD) of RO among different GNSS satellites. Below the 700 hPa level, the refractivity error SD for Y003–Y008 follows the pattern GLONASS < GPS < BDS, while for Y009 and Y010, it follows the pattern GLONASS < BDS < GPS. Around the 300 hPa level, the refractivity error SD for Y003–Y010 follows the pattern GLONASS < GPS < BDS, with the differences being more pronounced for Y009 and Y010. Above the 50 hPa level, the refractivity error SD for Y003–Y010 follows the pattern BDS < GPS < GLONASS. It is worth noting that the differences in refractivity error SD among different GNSS satellites are very small, with the maximum difference not exceeding 0.52 %.
3.3 Comparison with Metop-C and COSMIC-2
In this section, we compare the refractivity data of C2 and MTPC with ERA5, estimate the refractivity error SDs of C2 and MTPC using the 3CH method, and subsequently compare the results of YUNYAO with these results. MTPC observations come from only one LEO satellite. To ensure a fair comparison, we only used one YUNYAO satellite (Y008) and one C2 satellite (the first C2 satellite, hereafter referred to as C2E1). The results of Sect. 3.1 and 3.2 indicate that the differences among the eight YUNYAO satellites are small, and the study by Schreiner et al. (2020) also indicates that the differences among the six C2 satellites are small. Additionally, since C2 observations are primarily distributed in the tropics (approximately 45° S to 45° N; Ho et al., 2023), the comparisons between Y008 and C2E1 and between Y008 and MTPC were conducted separately. In the comparison between Y008 and C2E1, only observations between 45° S and 45° N were selected, while in the comparison between Y008 and MTPC, observations covering the entire globe were used.
Figure 8 shows the comparison of Y008, MTPC, and C2E1 RO refractivity profiles with ERA5, with the results of different GNSS satellites presented separately. As shown in Fig. 8a, Y008 acquires a significantly greater number of RO profiles than MTPC. In comparison to MTPC, Y008 displays a more pronounced negative refractivity bias below 4 km, except for the lesser GLONASS bias below 1 km, while the absolute value of the MB is smaller above 4 km. Regarding SD, Y008 GPS shows smaller values than MTPC GPS in the 10–20 km range. Although the SD of Y008 GPS is greater than that of MTPC GPS above 20 km, the maximum difference does not surpass 1 %. As shown in Fig. 8b, C2E1 has more profiles in this latitude range, but Y008 has more profiles globally (not shown). Y008 exhibits a greater negative bias below 5 km, except for GLONASS below 1 km, with the absolute value of MB being smaller above 5 km. Below 25 km, the SD of Y008 aligns with that of C2E1. Above 25 km, the SD of Y008 GPS is larger than that of C2E1 GPS, with a maximum difference of 0.89 %. Additionally, the SD of Y008 GLONASS differs from that of C2E1 GLONASS by less than 1 %. The SD of Y008 BDS is consistent with that of C2E1 GPS and is smaller than that of C2E1 GLONASS.
Figure 9 shows the refractivity error SDs of Y008, MTPC, and C2E1, with the error SDs of different GNSS satellites calculated separately. In the pressure range of 1000–300 hPa (approximately 0–9 km), the refractivity error SD of Y008 GLONASS is comparable to that of MTPC GPS, while that of Y008 BDS and GPS is slightly larger. In the pressure range of 300–50 hPa (approximately 9–20 km), the refractivity error SD of Y008 BDS, GPS, and GLONASS is significantly smaller than that of MTPC GPS, consistent with the results presented in Fig. 8a. Notably, in this height range, the number of MTPC samples decreases significantly, mainly due to the fact that some of the matched RS stations lack observations at 150 and 100 hPa (as shown in the red boxes of Figs. S1, S2, and S3). Fewer matched Y008 samples are present at these stations, resulting in no significant reduction in Y008 data within this height range. C2E1 has a greater number of samples matched to these stations, leading to a more pronounced reduction in data within this height range (as shown in Fig. 9b). In the pressure range of 50–10 hPa (approximately 20–32 km), the refractivity error SD of Y008 GPS is larger than that of MTPC GPS, with a maximum difference of 0.35 %. As shown in Fig. 9b, Y008 and C2E1 exhibit comparable error SDs in the pressure range of 1000–300 hPa (approximately 0–10 km). In the pressure range of 300–10 hPa (approximately 10–31 km), Y008 GPS shows smaller refractivity error SDs than C2E1 GPS, and Y008 GLONASS also exhibits smaller refractivity error SDs compared to C2E1 GLONASS.
Tianjin Yunyao Aerospace Technology Co., Ltd. (YUNYAO) plans to establish a meteorological satellite constellation consisting of 90 satellites equipped with GNSS-RO instruments. As of 2024, 30 satellites have been successfully launched. To investigate the usability of YUNYAO RO data, this study evaluated the quality of the YUNYAO RO refractivity and bending angle data. The assessment data include GNSS-RO data obtained from eight satellites over a 3-month period from May to July 2023.
Compared to the refractivity and bending angle calculated from ERA5, the absolute values of the mean bias (MB) for YUNYAO RO refractivity and bending angle data within the 0–40 km range are less than 1.54 % and 4.51 %, respectively, and close to 0 between 10 and 30 km. Larger biases are primarily observed in the lower troposphere, a phenomenon that has been extensively discussed in previous studies (Sokolovskiy et al., 2014; Xie et al., 2010). The standard deviations (SDs) of refractivity and bending angle data between 0 and 40 km are less than 3.35 % and 11.06 %, respectively, and less than 1.24 % and 2.27 %, respectively, between 10 and 30 km. The increased uncertainty in the lower troposphere is primarily related to the reduction in the neutral atmospheric signal below the noise level in terms of the amplitude, while the increased uncertainty in the upper stratosphere is associated with the reduction in the neutral atmospheric signal below the noise level in terms of the phase (Sokolovskiy et al., 2010). The study also found that the SDs of different GNSS satellites above 30 km show differences, with GLONASS having the largest SD. Latitudinal differences in MB and SD are evident. Larger absolute values of MB are primarily observed in the lower troposphere of low-latitude regions and the upper stratosphere, and this latitudinal distribution of the MB aligns closely with the discussion by Xu and Zou (2020) on bending angles. Larger SDs are mainly distributed in the lower troposphere of low-latitude regions and the stratosphere in the Southern Hemisphere. The abnormally larger SD in the stratosphere of the Southern Hemisphere may be related to the lower skill of ERA5 in simulating refractivity in the Southern Hemisphere at these high altitudes (Gilpin et al., 2018).
This study also used the three-cornered hat (3CH) method to estimate the error SD of YUNYAO RO refractivity data. The refractivity error SD of YUNYAO is below 2.53 % within the 1000–10 hPa pressure range. The refractivity error SD of YUNYAO is generally consistent with the evaluation results of COSMIC-2 by Schreiner et al. (2020). The refractivity error SD of RS is smaller than that of YUNYAO, which differs from previous studies (Rieckh et al., 2021; Schreiner et al., 2020). This difference is primarily due to the application of spatial–temporal sampling correction to the RS data, and the inconsistencies observed at other altitudes may result from variations in quality control processes. Similarly, differences in refractivity error SD are observed among different GNSS satellites, but the differences are less than 0.52 %. In comparison with COSMIC-2 and Metop-C RO data, YUNYAO RO data show a larger negative bias in the lower troposphere but smaller biases at other altitudes. The refractivity error SD of YUNYAO RO data is consistent with that of COSMIC-2 and Metop-C RO data within the 1000–10 hPa pressure range and is smaller within the 300–50 hPa pressure range.
YUNYAO commercial small RO satellites are characterized by their small size and low cost while maintaining high detection accuracy. By using a network of multiple satellites, these satellites will provide real-time global observations, greatly increasing the amount of available data for NWP centers, and are expected to further improve the accuracy of weather forecasts.
COSMIC-2 and Metop-C RO data are available at https://doi.org/10.5065/t353-c093 (UCAR COSMIC Program, 2019). YUNYAO data can be shared offline. Processed data and code can be downloaded from https://doi.org/10.5281/zenodo.13374107 (Xu, 2024).
The supplement related to this article is available online at https://doi.org/10.5194/amt-18-1339-2025-supplement.
XX, WH, and ZG contributed to the development of the ideas. XX, WH, and JW conducted data analysis. XX and WH wrote the paper. FL, NF, and YC provided data and revised the paper.
The contact author has declared that none of the authors has any competing interests.
Publisher's note: Copernicus Publications remains neutral with regard to jurisdictional claims made in the text, published maps, institutional affiliations, or any other geographical representation in this paper. While Copernicus Publications makes every effort to include appropriate place names, the final responsibility lies with the authors.
We appreciate the China Meteorological Administration, ECMWF, and NCEP for the data. We are also very grateful to the reviewers for their thorough reviews and very valuable comments.
This research was funded by the National Natural Science Foundation of China (grant nos. 42175082 and 42075155) and the National Key Research and Development Program of China (grant no. 2022YFC3004004).
This paper was edited by Peter Alexander and reviewed by Richard Anthes and one anonymous referee.
Anlauf, H., Pingel, D., and Rhodin, A.: Assimilation of GPS radio occultation data at DWD, Atmos. Meas. Tech., 4, 1105–1113, https://doi.org/10.5194/amt-4-1105-2011, 2011.
Anthes, R. and Rieckh, T.: Estimating observation and model error variances using multiple data sets, Atmos. Meas. Tech., 11, 4239–4260, https://doi.org/10.5194/amt-11-4239-2018, 2018.
Anthes, R. A., Bernhardt, P. A., Chen, Y., Cucurull, L., Dymond, K. F., Ector, D., Healy, S. B., Ho, S.-P., Hunt, D. C., Kuo, Y.-H., Liu, H., Manning, K., McCormick, C., Meehan, T. K., Randel W. J., Rocken, C. Schreiner, W. S., Socolovskiy, S. V., Syndergaard, S., Thompson, D. C., Trenberth, K. E., Wee, T.-K., Yen, N. L., and Zeng, Z.: The COSMIC/FORMOSAT-3 mission: Early results, B. Am. Meteor. Soc., 89, 313–334, https://doi.org/10.1175/BAMS-89-3-313, 2008.
Anthes, R. A., Marquardt ,C., Ruston B., and Shao H.: Radio Occultation Modeling Experiment (ROMEX): Determining the impact of radio occultation observations on numerical weather prediction, B. Am. Meteor. Soc., 105, E1552–E1568, 2024.
Ao, C.: Effect of ducting on radio occultation measurements: An assessment based on high-resolution radiosonde soundings, Radio Sci., 42, 1–15, https://doi.org/10.1029/2006RS003485, 2007.
Ao, C. O., Meehan, T., Hajj, G., Mannucci, A., and Beyerle, G.: Lower troposphere refractivity bias in GPS occultation retrievals, J. Geophys. Res.-Atmos., 108, 4577, https://doi.org/10.1029/2002JD003216, 2003.
Aparicio, J. M. and Deblonde, G.: Impact of the assimilation of CHAMP refractivity profiles on Environment Canada global forecasts, Mon. Weather Rev., 136, 257–275, https://doi.org/10.1175/2007MWR1951.1, 2008.
Aparicio, J. M. and Laroche, S.: Estimation of the added value of the absolute calibration of GPS radio occultation data for numerical weather prediction, Mon. Weather Rev., 143, 1259–1274, https://doi.org/10.1175/2007MWR1951.1, 2015.
Bowler, N. E.: An assessment of GNSS radio occultation data produced by Spire, Q. J. Roy. Meteor. Soc., 146, 3772–3788, https://doi.org/10.1002/qj.3872, 2020.
Cardinali, C. and Healy, S.: Impact of GPS radio occultation measurements in the ECMWF system using adjoint-based diagnostics, Q. J. Roy. Meteor. Soc., 140, 2315–2320, https://doi.org/10.1002/qj.2300, 2014.
Corner, B. R., Palmer, R. D., and Larsen, M. F.: A new radiosonde system for profiling the lower troposphere, J. Atmos. Ocean. Tech., 16, 828–836, https://doi.org/10.1175/1520-0426(1999)016<0828:ANRSFP>2.0.CO;2, 1999.
Cucurull, L.: Recent impact of COSMIC-2 with improved radio occultation data assimilation algorithms, Weather Forecast., 38, 1829–1847, https://doi.org/10.1175/WAF-D-22-0186.1, 2023.
Cucurull, L. and Derber, J.: Operational implementation of COSMIC observations into NCEP's global data assimilation system, Weather Forecast., 23, 702–711, https://doi.org/10.1175/2008WAF2007070.1, 2008.
Cucurull, L., Derber, J., Treadon, R., and Purser, R.: Assimilation of global positioning system radio occultation observations into NCEP's global data assimilation system, Mon. Weather Rev., 135, 3174–3193, https://doi.org/10.1175/MWR3461.1, 2007.
Eyre, J. R., Bell, W., Cotton, J., English, S. J., Forsythe, M., Healy, S. B., and Pavelin, E. G.: Assimilation of satellite data in numerical weather prediction. Part II: Recent years, Q. J. Roy. Meteor. Soc., 148, 521–556, https://doi.org/10.1002/qj.4228, 2022.
Fu, N. and Li, F.: An Introduction of GNSS Reflectometer Remote Sensing Mission From Yunyao Aerospace Technology Co., Ltd., in: 2021 IEEE Specialist Meeting on Reflectometry using GNSS and other Signals of Opportunity (GNSS+ R), Beijing, China, 14 September 2021, 77–81, https://doi.org/10.1109/GNSSR53802.2021.9617716, 2021.
Gilpin, S., Rieckh, T., and Anthes, R.: Reducing representativeness and sampling errors in radio occultation–radiosonde comparisons, Atmos. Meas. Tech., 11, 2567–2582, https://doi.org/10.5194/amt-11-2567-2018, 2018.
Gorbunov, M. E. and Kirchengast, G.: Wave-optics uncertainty propagation and regression-based bias model in GNSS radio occultation bending angle retrievals, Atmos. Meas. Tech., 11, 111–125, https://doi.org/10.5194/amt-11-111-2018, 2018.
Gorbunov, M. E., Vorob'ev, V. V., and Lauritsen, K. B.: Fluctuations of refractivity as a systematic error source in radio occultations, Radio Sci., 50, 656–669, https://doi.org/10.1002/2014RS005639, 2015.
Harnisch, F., Healy, S., Bauer, P., and English, S.: Scaling of GNSS radio occultation impact with observation number using an ensemble of data assimilations, Mon. Weather Rev., 141, 4395–4413, https://doi.org/10.1175/MWR-D-13-00098.1, 2013.
Healy, S. and Thépaut, J.-N.: Assimilation experiments with CHAMP GPS radio occultation measurements, Q. J. Roy. Meteor. Soc., 132, 605–623, https://doi.org/10.1256/qj.04.182, 2006.
Ho, S., Zhou, X., Shao, X., Chen, Y., Jing, X., and Miller, W.: Using the commercial GNSS RO spire data in the neutral atmosphere for climate and weather prediction studies, Remote Sens., 15, 4836, https://doi.org/10.3390/rs15194836, 2023.
Huang, C.-Y., Kuo, Y.-H., Chen, S.-Y., Terng, C.-T., Chien, F.-C., Lin, P.-L., Kueh, M.-T., Chen, S.-H., Yang, M.-J., Wang, C.-J., and Rao, A. S. K. A. V. P.: Impact of GPS radio occultation data assimilation on regional weather predictions, GPS Solut., 14, 35–49, https://doi.org/10.1007/s10291-009-0144-1, 2010.
Kursinski, E., Hajj, G., Schofield, J., Linfield, R., and Hardy, K. R.: Observing Earth's atmosphere with radio occultation measurements using the Global Positioning System, J. Geophys. Res.-Atmos., 102, 23429–23465, https://doi.org/10.1029/97JD01569, 1997.
Lanzante, J. R.: Resistant, robust and non-parametric techniques for the analysis of climate data: Theory and examples, including applications to historical radiosonde station data, Int. J. Climatol., 16, 1197–1226, https://doi.org/10.1002/(SICI)1097-0088(199611)16:11<1197::AID-JOC89>3.0.CO;2-L, 1996.
Le Marshall, J., Xiao, Y., Norman, R., Zhang, K., Rea, A., Cucurull, L., Seecamp, R., Steinle, P., Puri, K., and Le, T.: The beneficial impact of radio occultation observations on Australian region forecasts, Aust. Meteorol. Ocean., 60, 121–125, 2010.
Liu, Y. and Xue, J.: Assimilation of GNSS radio occultation observations in GRAPES, Atmos. Meas. Tech., 7, 3935–3946, https://doi.org/10.5194/amt-7-3935-2014, 2014.
Mapes, B. E., Ciesielski, P. E., and Johnson, R. H.: Sampling errors in rawinsonde-array budgets, J. Atmos. Sci., 60, 2697–2714, https://doi.org/10.1175/1520-0469(2003)060<2697:SEIRB>2.0.CO;2, 2003.
Miller, W. J., Chen, Y., Ho, S.-P., and Shao, X.: Evaluating the impacts of COSMIC-2 GNSS RO bending angle assimilation on Atlantic hurricane forecasts using the HWRF model, Mon. Weather Rev., 151, 1821–1847, https://doi.org/10.1175/MWR-D-22-0198.1, 2023.
Miloshevich, L. M., Vömel, H., Paukkunen, A., Heymsfield, A. J., and Oltmans, S. J.: Characterization and correction of relative humidity measurements from Vaisala RS80-A radiosondes at cold temperatures, J. Atmos. Ocean. Tech., 18, 135–156, https://doi.org/10.1175/1520-0426(2001)018<0135:CACORH>2.0.CO;2, 2001.
O'Carroll, A. G., Eyre, J. R., and Saunders, R. W.: Three-way error analysis between AATSR, AMSR-E, and in situ sea surface temperature observations, J. Atmos. Ocean. Tech., 25, 1197–1207, https://doi.org/10.1175/2007JTECHO542.1, 2008.
Poli, P., Healy, S., Rabier, F., and Pailleux, J.: Preliminary assessment of the scalability of GPS radio occultations impact in numerical weather prediction, Geophys. Res. Lett., 35, L23811, https://doi.org/10.1029/2008GL035873, 2008.
Rennie, M.: The impact of GPS radio occultation assimilation at the Met Office, Q. J. Roy. Meteor. Soc., 136, 116–131, https://doi.org/10.1002/qj.521, 2010.
Rocken, C., Anthes, R., Exner, M., Hunt, D., Sokolovskiy, S., Ware, R., Gorbunov, M., Schreiner, W., Feng, D., Herman, B., Kuo, Y.-H. and Zou, X.: Analysis and validation of GPS/MET data in the neutral atmosphere, J. Geophys. Res.-Atmos., 102, 29849–29866, https://doi.org/10.1029/97JD02400, 1997.
Rieckh, T., Sjoberg J. P., and Anthes R. A.: The Three-Cornered Hat Method for Estimating Error Variances of Three or More Atmospheric Datasets. Part II: Evaluating Radio Occultation and Radiosonde Observations, Global Model Forecasts, and Reanalyses, J. Atmos. Ocean. Tech., 102, 1777–1796, https://doi.org/10.1175/JTECH-D-20-0209.1, 2021.
Ruston, B. and Healy, S.: Forecast impact of FORMOSAT-7/COSMIC-2 GNSS radio occultation measurements, Atmos. Sci. Lett., 22, e1019, https://doi.org/10.1002/asl.1019, 2021.
Schreiner, W., Sokolovskiy, S., Hunt, D., Rocken, C., and Kuo, Y.-H.: Analysis of GPS radio occultation data from the FORMOSAT-3/COSMIC and Metop/GRAS missions at CDAAC, Atmos. Meas. Tech., 4, 2255–2272, https://doi.org/10.5194/amt-4-2255-2011, 2011.
Schreiner, W. S., Weiss, J. P., Anthes, R. A., Braun, J., Chu, V., Fong, J., Hunt, D., Kuo, Y.-H., Meehan, T., Serafino, W., Sjoberg, J., Sokolovskit, S., Talaat, E., Wee, T. K., and Zeng, Z.: COSMIC-2 radio occultation constellation: First results, Geophys. Res. Lett., 47, e2019GL086841, https://doi.org/10.1029/2019GL086841, 2020.
Smith, E. K. and Weintraub, S.: The constants in the equation for atmospheric refractive index at radio frequencies, P. IRE, 41, 1035–1037, https://doi.org/10.1109/JRPROC.1953.274297, 1953.
Sokolovskiy, S.: Effect of superrefraction on inversions of radio occultation signals in the lower troposphere, Radio Sci., 38, 1058, https://doi.org/10.1029/2002RS002728, 2003.
Sokolovskiy, S., Rocken, C., Schreiner, W., and Hunt, D.: On the uncertainty of radio occultation inversions in the lower troposphere, J. Geophys. Res.-Atmos., 115, D22111, https://doi.org/10.1029/2010JD014058, 2010.
Sokolovskiy, S., Schreiner, W., Zeng, Z., Hunt, D., Lin, Y.-C., and Kuo, Y.-H.: Observation, analysis, and modeling of deep radio occultation signals: Effects of tropospheric ducts and interfering signals, Radio Sci., 49, 954–970, https://doi.org/10.1002/2014RS005436, 2014.
Sun, Y., Bai, W., Liu, C., Liu, Y., Du, Q., Wang, X., Yang, G., Liao, M., Yang, Z., Zhang, X., Meng, X., Zhao, D., Xia, J., Cai, Y., and Kirchengast, G.: The FengYun-3C radio occultation sounder GNOS: a review of the mission and its early results and science applications, Atmos. Meas. Tech., 11, 5797–5811, https://doi.org/10.5194/amt-11-5797-2018, 2018.
UCAR COSMIC Program: COSMIC-2 Data Products, UCAR/NCAR – COSMIC [data set], https://doi.org/10.5065/T353-C093, 2019.
Ware, R., Exner, M., Feng, D., Gorbunov, M., Hardy, K., Herman, B., Kuo, Y., Meehan, T., Melbourne, W., Rocken, C., Schreiner, S., Solheim, F., Zou, X., Anthes, R., Businger, S., and Trenberth, K.: GPS sounding of the atmosphere from low Earth orbit: Preliminary results, B. Am. Meteor. Soc., 77, 19–40, https://doi.org/10.1175/1520-0477(1996)077<0019:GSOTAF>2.0.CO;2, 1996.
Wickert, J., Beyerle, G., König, R., Heise, S., Grunwaldt, L., Michalak, G., Reigber, Ch., and Schmidt, T.: GPS radio occultation with CHAMP and GRACE: A first look at a new and promising satellite configuration for global atmospheric sounding, Ann. Geophys., 23, 653–658, https://doi.org/10.5194/angeo-23-653-2005, 2005.
Xie, F., Syndergaard, S., Kursinski, E. R., and Herman, B. M.: An approach for retrieving marine boundary layer refractivity from GPS occultation data in the presence of superrefraction, J. Atmos. Ocean. Tech., 23, 1629–1644, https://doi.org/10.1175/JTECH1996.1, 2006.
Xie, F., Wu, D. L., Ao, C. O., Kursinski, E. R., Mannucci, A. J., and Syndergaard, S.: Super-refraction effects on GPS radio occultation refractivity in marine boundary layers, Geophys. Res. Lett., 37, 2010GL043299, https://doi.org/10.1029/2010GL043299, 2010.
Xu, X.: Quality Assessment of YUNYAO GNSS-RO Refractivity Data in the Neutral Atmosphere, Zenodo [data set], https://doi.org/10.5281/zenodo.13374107, 2024.
Xu, X. and Zou, X.: Comparison of MetOp-A/-B GRAS radio occultation data processed by CDAAC and ROM, GPS Solut., 24, 34, https://doi.org/10.1007/s10291-019-0949-5, 2020.
Zou, X. and Zeng, Z.: A quality control procedure for GPS radio occultation data, J. Geophys. Res., 111, D02112, https://doi.org/10.1029/2005JD005846, 2006.