the Creative Commons Attribution 4.0 License.
the Creative Commons Attribution 4.0 License.
 | 24 Mar 2025
Multi-layer retrieval of aerosol optical depth in the troposphere using SEVIRI data: a case study of the European continent
Maryam Pashayi
Mehran Satari
Mehdi Momeni Shahraki
Multi-layer aerosol optical depth (AOD) estimation with sufficient spatial and temporal resolution is crucial for effective aerosol monitoring, given the significant variations over time and space. While ground-based observations provide detailed vertical profiles, satellite data are essential for addressing the spatial and temporal gaps. This study utilizes profiles from the Cloud-Aerosol Lidar with Orthogonal Polarization (CALIOP) and data from the Spinning Enhanced Visible and Infrared Imager (SEVIRI) to estimate vertical AOD values at 1.5, 3, 5, and 10 km layers. These estimations are achieved with spatial and temporal resolutions of 3 km × 3 km and 15 min, respectively, over the European troposphere. We employed machine learning models – XGBoost (XGB) and random forest (RF) – trained on SEVIRI data from 2017 to 2018 for the estimations. Validation using CALIOP AOD retrievals in 2019 confirmed the reliability of our findings, emphasizing the importance of wind speed (Ws) and wind direction (Wd) in improving AOD estimation accuracy. A comparison between seasonal and annual models revealed slight variations in accuracy, leading to the selection of annual models as the preferred approach for estimating SEVIRI multi-layer AOD values. Among the annual models, the XGB model demonstrated superior performance over the RF model at all four layers, yielding more reliable AOD estimations with R2 values of 0.99, 0.97, 0.98, and 0.98 for the four layers from low- to high-altitude layers. Further validation using data from European Aerosol Research Lidar Network (EARLINET) stations across Europe in 2020 indicated that the XGB model still achieved better agreement with EARLINET AOD profiles, with R2 values of 0.86, 0.80, 0.75, and 0.59 and RMSE values of 0.022, 0.012, 0.015, and 0.005. We performed a qualitative validation of multi-layer AOD estimations by comparing spatial trends with CALIOP AOD retrievals for SEVIRI pixels on four dates in 2019, showing strong agreement across varying AOD levels. Additionally, the model successfully estimated AOD at 15 min intervals for two real events – a Saharan dust plume and the Mount Etna eruption – revealing consistent physical characteristics, including long-range transport in the upper layers and a gradual increase in AOD from lower to higher tropospheric layers during volcanic events. The results demonstrate that the proposed method facilitates comprehensive monitoring of AOD behavior throughout the four vertical layers of the troposphere, offering important insights into the dynamics of aerosol occurrence.
- Article
(11557 KB) - Full-text XML
-
Supplement
(1680 KB) - BibTeX
- EndNote


Aerosols are recognized as significant contributors to air pollution, climate change, and the modification of solar and thermal infrared radiation absorption and scattering (Hyslop, 2009; Pope et al., 2019; Li et al., 2022). Understanding aerosol behavior in the troposphere is vital for enhancing atmospheric models and refining monitoring techniques. Aerosol optical depth (AOD) is a critical parameter for quantitatively estimating aerosol concentration and its optical properties. Recent research emphasizes the importance of multi-layer retrieval of AOD in reducing uncertainties associated with aerosol characterization (Wang et al., 2018; Rogozovsky et al., 2021; Gupta et al., 2021; Rogozovsky et al., 2023). Additionally, an in-depth investigation of the multi-layer distribution of aerosol properties within the troposphere is essential for elucidating aerosol transport mechanisms, facilitating source identification, and improving atmospheric dynamics models. This understanding ultimately enhances the accuracy of simulations related to long-range aerosol transport (Chen et al., 2023). Vertical AOD retrieval can be conducted through ground-based observations or inferred from remote sensing data. Ground-based lidar networks, like the European Aerosol Research Lidar Network (EARLINET), provide detailed insights into aerosol characteristics by offering vertical profiles of optical properties, enabling high-resolution, multi-layer AOD retrieval through precise quantification of aerosol loading across distinct atmospheric layers (Bösenberg et al., 2001, 2003). While these observations offer detailed vertical information, their sparse nature necessitates supplementation with satellite observations. Satellite lidar remote sensing emerges as the primary method for capturing global temporal and spatial variations in aerosol profiles. The Cloud-Aerosol Lidar with Orthogonal Polarization (CALIOP), on board the Cloud-Aerosol Lidar and Infrared Pathfinder Satellite Observation (CALIPSO) satellite launched in 2006, offers distributions of aerosols and clouds, along with their geometrical and optical properties. Multi-layer AOD values are retrieved using level 2 aerosol extinction profiles at both 532 and 1064 nm, where the aerosol extinction profiles are determined from backscatter measurements (Winker et al., 2004, 2006, 2007). However, the CALIOP sensor encounters challenges in achieving adequate spatial and temporal coverage, with limitations in daily and global resolution (16 d temporal resolution and 5 km profile distance).
Recent advancements have sought to overcome these limitations through the use of passive satellite sensors with varying temporal resolutions, such as the Tropospheric Monitoring Instrument (TROPOMI), which provides near-daily global coverage with a spatial resolution of 3.5 × 7 km (improved to 3.5 × 5.5 km in 2019) and was launched in 2017 on the Sentinel-5P satellite (Veefkind et al., 2012); the Earth Polychromatic Imaging Camera (EPIC), offering a continuous daytime view every 60 to 100 min with a spatial resolution of about 8 × 8 km since its launch on 11 February 2015, on board the Deep Space Climate Observatory (DSCOVR) satellite (Marshak and Knyazikhin, 2017); the Global Ozone Monitoring Experiment-2 (GOME-2) on the Meteorological Operational satellite program (MetOp-C), with a 3 d revisit cycle and a spatial resolution of approximately 40 × 40 km since 2018; and the Moderate Resolution Imaging Spectroradiometer (MODIS), on board Terra (launched in 1999) and Aqua (launched in 2002), providing daily global coverage with spatial resolutions ranging from 0.25 to 1 km (Lyapustin et al., 2011).
Relevant research focuses on various methods specifically aimed at retrieving aerosol layer height (ALH) rather than AOD at different altitudes. One prominent method, oxygen (O2) A- and B-band absorption spectroscopy, utilizes the differential absorption of sunlight by O2 molecules at different altitudes (Zeng et al., 2018; Xu et al., 2017, 2019). Elevated aerosol layers scatter sunlight back to space, shortening the atmospheric path length and decreasing O2 absorption. By analyzing spectral characteristics in the O2 A and B bands, researchers infer ALH. However, retrieval sensitivity is enhanced over darker surfaces and higher AOD, making it challenging over bright surfaces or under low aerosol loading. For instance, Nanda et al. (2020) employed TROPOMI observations with an optimal estimation scheme in the O2 A band, assuming a uniformly distributed aerosol layer. Similarly, the algorithm developed using EPIC/DSCOVR data leverages atmospheric window bands and differential optical absorption spectroscopy (DOAS) ratios, integrating MODIS and GOME-2 surface reflectance data. For retrievals over vegetated areas, the algorithm favors the O2 B band due to its lower surface reflectance (Xu et al., 2019). Another study combined O2 A- and B-band data from the Scanning Imaging Absorption Spectrometer for Atmospheric Chartography (SCIAMACHY) and GOME-2 for enhanced ALH sensitivity, especially near boundary layers (Hollstein and Fischer, 2014).
An additional retrieval method, stereoscopic techniques – employed by the Multi-angle Imaging SpectroRadiometer (MISR), launched in 2000 – utilize multi-angle observations to geometrically determine plume heights. MISR offers a spatial resolution of approximately 275 m and a temporal resolution of around once every 7 d, making it especially useful over reflective surfaces, as it relies on geometric data rather than surface reflectance (Muller et al., 2002; Zakšek et al., 2013; Fisher et al., 2013; Val Martin et al., 2018).
Passive satellite-based ALH retrieval techniques, while offering global coverage, often simplify the aerosol vertical distribution by assuming a single homogeneous layer (Zeng et al., 2018; Xu et al., 2017, 2019). This simplification can lead to inaccurate representations of complex aerosol profiles, especially in cases of multi-layered events. In addition, these passive satellite-based methods face further constraints due to the low spatial resolution of instruments like EPIC and GOME-2, as well as low temporal resolution of sensors such as TROPOMI, GOME-2, and MISR. These constrains on resolution reduce the effectiveness of these retrievals in capturing fine-scale, rapidly evolving aerosol distribution events, such as smoke plumes from fires.
Other studies by Pashayi et al. (2023, 2024) have introduced seasonal and seasonal-independent machine learning models for AOD retrievals in multiple layers. These models seek to investigate the relationship between MODIS observations and CALIOP AOD for retrieval of multiple-layer AOD values at a spatial–temporal resolution corresponding to the MODIS AOD product. This analysis focuses specifically on the Persian Gulf region. The researchers subsequently analyze their findings using CALIOP AOD retrievals across multiple vertical layers. Although these studies have advanced the retrieval of AOD across multiple layers, the constraint of MODIS's daily temporal resolution remains a significant limitation (Wei et al., 2020).
Geostationary satellites, such as Himawari-8 (launched in 2014), which is equipped with the Advanced Himawari Imager (AHI; Da, 2015); the Geostationary Operational Environmental Satellite (GOES; launched in 2016) equipped with the Advanced Baseline Imager (ABI; Kalluri et al., 2015); and the Meteosat geostationary satellites featuring the Spinning Enhanced Visible and Infrared Imager (SEVIRI; launched in 2002; Pasternak et al., 1994), provide sub-hourly, high-resolution observations that significantly enhance global aerosol monitoring capabilities across diverse regions (Schmit et al., 2018; Zhang et al., 2019; Ge et al., 2018; Tang et al., 2019; Zawadzka-Manko et al., 2020; Witthuhn et al., 2020; Kocaman et al., 2022; Ceamanos et al., 2023). Notably, SEVIRI offers high temporal and spatial resolutions, presenting valuable opportunities to expand aerosol datasets for Europe (Stebel et al., 2021; Ajtai et al., 2021). Consequently, utilizing observations from these satellites enables the multi-layer retrieval of AOD, effectively addressing the limitations associated with temporal and spatial resolution presented in previous studies.
The retrieval of multi-layer AOD values from passive satellite observations typically entails two primary approaches: physically based (Seidel et al., 2012; Lipponen et al., 2018; Amini et al., 2021; Mehta et al., 2022) and data mining approaches (Radosavljevic et al., 2010; She et al., 2020; Chen et al., 2022). The physically based approach relies on established principles of aerosol behavior, utilizing models derived from physical laws to retrieve AOD values. This approach often involves simplifications and assumptions, such as treating the atmosphere as a single aerosol layer in most of the passive satellite-based ALH retrieval algorithms previously mentioned. While this assumption is necessary for practical implementation, it can introduce uncertainties and limit the accuracy of retrievals, particularly in complex scenes. Additionally, physically based methods are sensitive to surface reflectance. Over bright surfaces, the contribution of surface reflection to top-of-atmosphere (TOA) radiance can dominate, making it challenging to extract a clear aerosol signal, especially for low aerosol loading. This limitation underscores the need for accurate surface reflectance characterization (Xu et al., 2017, 2019; Nanda et al., 2020).
In contrast, data mining approaches offer a promising alternative by harnessing large datasets and employing learning-based algorithms to discern patterns and relationships within complex aerosol systems. Machine learning methods as a data mining approach have the potential to learn complex relationships between AOD and other atmospheric and surface variables. These methods can capture non-linear dependencies and potentially handle multi-layer scenarios more effectively than physical models. This advantage is particularly relevant for AOD retrieval in diverse and heterogeneous environments. Additionally, integrating data from multiple sources, such as meteorological, land cover, temporal, and location data, can provide more comprehensive information for a time- and location-based AOD retrieval, particularly for multi-layer scenarios (Chen et al., 2020; Lee et al., 2022; Berhane et al., 2024).
In this study, we introduce a model for sub-hourly multi-layer AOD retrieval over the European continent troposphere by integrating SEVIRI-based information with CALIOP aerosol profile products. To achieve this, two well-established machine learning models – XGBoost (XGB) and random forest (RF) – were utilized for retrieving AOD values in four distinct layers, approximately every 15 min, with a spatial resolution of 3 km × 3 km. The four tropospheric layers analyzed in this study are 0–1.5, 1.5–3, 3–5, and 5–10 km, denoted as AOD1.5, AOD3, AOD5, and AOD10, respectively. The selection of these layers for multi-layer AOD retrieval is based on the distinct aerosol transport mechanisms observed at these altitudes. The 0–1.5 km layer captures aerosols from local sources transported upward by updrafts from the cloud base, a process called pumping. The 1.5–3 km layer, where thermal bubbles often initiate, allows for the examination of aerosols, potentially from mid-range sources, which are lifted into the cloud with the rising bubble. The 3–5 km layer captures aerosols transported over longer distances that enter the cloud through entrainment at the cloud edges as the bubble ascends. The 5–10 km layer is designed to capture the influence of long-range-transported aerosols on cloud properties at higher altitudes. This multi-layer approach enables analysis of how local to long-range aerosol transport contributes to aerosol–cloud interactions (Zhang et al., 2021; Lebo, 2014; Marinescu et al., 2017).
To train and validate two machine learning models, we employed AOD data retrieved from the CALIOP aerosol product and EARLINET stations distributed across Europe. Model performance was qualitatively evaluated by analyzing its response to two notable aerosol events: a significant dust intrusion from 13 to 18 March 2022 and a volcanic eruption on 14 August 2023. These events offered valuable case studies to assess the model's capability in detecting and characterizing distinct aerosol signatures across these four layers. We organized the rest of the paper as follows: Sect. 2 provides a comprehensive overview of the dataset employed, while Sect. 3 details the necessary preprocessing steps and retrieval methodology. Subsequently, Sect. 4 delves into the discussion of the vertically retrieved AOD results, followed by conclusions outlined in Sect. 5.
2.1 Study area
The study area encompasses a significant portion of the European troposphere, spanning 35 to 71° N and 7° W to 70° E, covering approximately 10.18×10⁶ km2. Despite its relatively small land area, Europe exhibits a diverse geographical landscape and complex atmospheric dynamics. Urban centers in Europe face persistent air pollution issues due to industrial activities and vehicular emissions, compounded by the effects of climate change. Various aerosol types, originating from industrial processes, transportation, biomass burning, and natural events, significantly impact air quality, weather patterns, and climate dynamics across the continent. Long-range transport of aerosols, particularly from sources in Africa, such as Saharan dust storms, underscores the interconnectedness of atmospheric processes across continents and emphasizes the necessity of international cooperation in addressing air pollution and environmental challenges.
2.2 Data source
2.2.1 SEVIRI
Meteosat Second Generation (MSG) constitutes a series of four satellites managed by the Exploitation of Meteorological Satellites (EUMETSAT) and has been operational since 2004. Originally designated as MSG1 to MSG4, these satellites were subsequently rebranded as Meteosat-8 to Meteosat-11, respectively. The primary instrument on board these satellites is the Spinning Enhanced Visible and Infrared Imager (SEVIRI), a radiometer equipped with 11 spectral channels spanning the visible to the infrared spectrum. These include the visible (0.6 and 0.8 µm) channels, as well as a near-infrared (1.6 µm) channel, and provides a spatial resolution of about 3 km at the sub-satellite point and a high-resolution visible (HRV) channel offering a finer spatial resolution of 1 km at nadir. Strategically centered at various wavelengths, the thermal channels of SEVIRI include 6.2 and 7.3 µm (targeting strong water vapor absorption); 8.7, 10.8, and 12.0 µm (window channels); and 9.7 µm (for ozone absorption) and 13.4 µm (for carbon dioxide absorption). This operational system delivers full-disk Earth data, while the rapid-scan service focuses on observing the upper part of the Earth's disk, covering Europe and North Africa, with a repetition time of 15 min (Schmetz et al., 2002; Zawadzka and Markowicz, 2014). In our study, we primarily utilize SEVIRI data from Meteosat-11, the fourth and final flight unit of the MSG program, which was launched on 15 July 2015. Meteosat-11 currently operates in geostationary orbit, positioned 36 000 km above the Equator. Its coverage extends over Europe, Africa, and the Indian Ocean, spanning −81 to 81° longitude and −79 to 79° latitude. Figure 1 provides a visualization of the coverage area of SEVIRI (© EUMETSAT 2024).
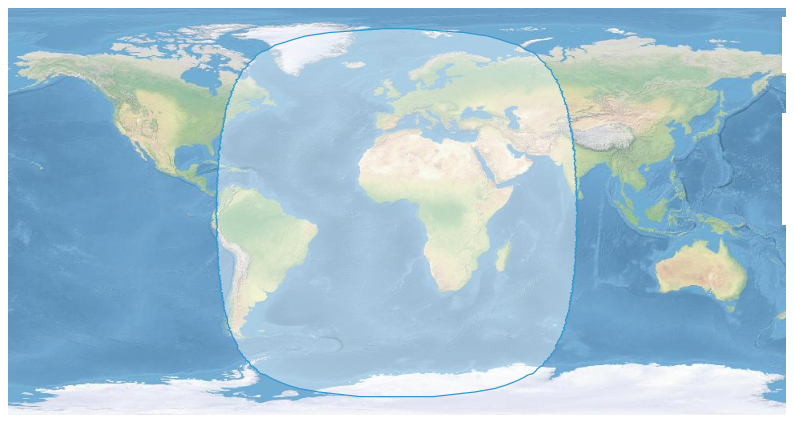
Figure 1The area covered by the SEVIRI instrument. Source: © EUMETSAT 2024 (https://data.eumetsat.int/data/map/EO:EUM:DAT:MSG:HRSEVIRI, last access: 20 January 2025).
2.2.2 CALIOP
The CALIOP instrument plays a pivotal role in the CALIPSO satellite, launched in April 2006 with the primary objective of reliably delivering high-resolution vertical profiles of global aerosol properties via an active sensing technique. Functioning as a polarization-sensitive lidar, CALIOP measures the depolarization ratio, serving as a degree of particle irregularity. CALIOP is specifically designed to observe aerosol optical properties during both the day and the night, focusing on vertical layers at wavelengths of 532 and 1064 nm. Its level 2 algorithm not only provides information on aerosol optical characteristics like the particle depolarization ratio and color ratio but also retrieves extinction coefficients. Notably, CALIOP data offer a temporal resolution of approximately 16 d, capturing insights into aerosol dynamics over time. Sampling occurs at intervals of 333 m along the orbital track, maintaining a vertical resolution of 60 m from altitudes of −0.5 to 20 km and 180 m from 20 to 30 km within the vertical profile (Winker et al., 2004, 2006, 2007). For this study, we employed CALIOP level 2 version 4.2 aerosol profile products from 2017 to 2019 to estimate multi-layer AOD values within the defined study region.
2.2.3 MODIS land cover data
In this research, we leveraged land cover (LC) data spanning 2017 to 2019, with a spatial resolution of 1 km, sourced from the global MODIS products (MCD12Q1 V6) covering Europe. These data, derived from both Terra and Aqua satellites, provide comprehensive land cover types annually from 2001. The dataset encompasses six classification schemes, elucidated in the downloadable user guide available at https://ladsweb.modaps.eosdis.nasa.gov/ (last access: 23 October 2023). Each MCD12Q1 version 6 hierarchical data format 4 (HDF4) file comprises layers for land cover types 1–5, land cover properties 1–3, land cover property assessments 1–3, land cover quality control (QC), and a land water mask (Sulla-Menashe and Friedl, 2018). Our study specifically focuses on the first classification scheme, the Annual International Geosphere-Biosphere Program (IGBP) classification.
2.2.4 Meteorological data
Meteorological data were acquired from the European Centre for Medium-Range Weather Forecasts (ECMWF) dataset, accessible at https://cds.climate.copernicus.eu/ (last access: 24 October 2023). ECMWF has been actively operational in real-time seasonal forecast systems since 1997, providing access to standard meteorological data. This dataset comprises two distinct sets of data (Copernicus Climate Change Service Climate Data Store, 2021). Firstly, version 2 of the Integrated Global Radiosonde Archive (IGRA) from 1978 integrates global radio sounding containing temperature, humidity, and wind data from various sources. The dataset is presented in the form of a global grid with a conventional grid resolution of 0.25° × 0.25°. Compared with previous-generation products, the temporal resolution has been increased from 6 to 1 h, enabling the study of diurnal variations in the troposphere. Secondly, the Radio Sounding HARMonization (RHARM) homogenized dataset offers adjusted values for temperature, relative humidity, and wind. RHARM effectively eliminates systematic effects, such as variations in measurement sensors, biases induced by solar radiation, calibration drifts, station relocations, and other factors, across 700 IGRA radiosonde stations and ship-based radio soundings. RHARM includes twice-daily (00:00 and 12:00 UTC) radiosonde data at mandatory and standard levels, featuring essential parameters like air temperature (T, K), air pressure (P, Pa), wind speed (Ws, m s−1), and wind direction (Wd, degrees from north). For this study, the global grid dataset is utilized over the European continent from 2017 to 2019, as depicted in Fig. 2.
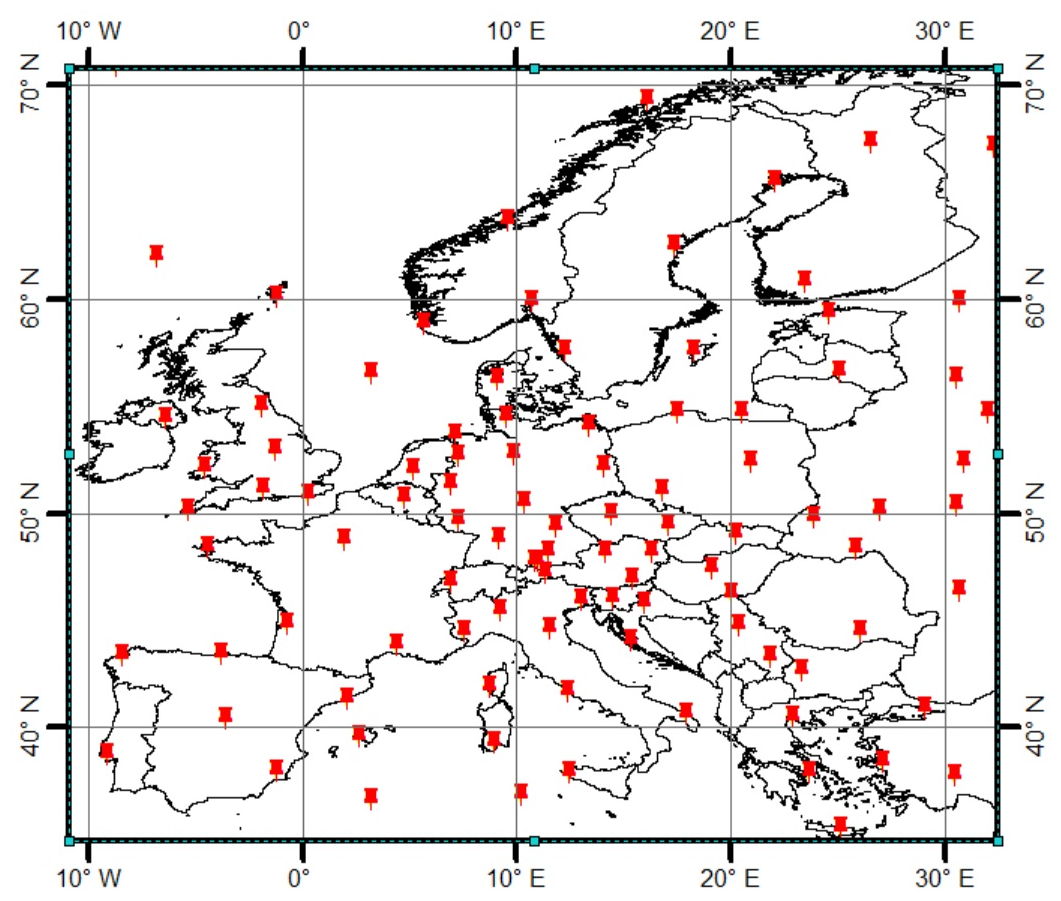
Figure 2Map depicting the ECMWF stations for meteorological data measurements.
2.2.5 EARLINET
EARLINET, established in the year 2000 (Bösenberg et al., 2001, 2003), originated as a research project funded by the European Commission within the framework of the Fifth Framework Programme. The primary objective of EARLINET is to generate profiles of aerosol optical properties, thereby constructing an expansive, quantitative, and statistically robust database for the continental-scale distribution of aerosols. This initiative aims to enhance network operations, facilitate research on aerosol-related processes, validate satellite sensor data, advance model development and validation, integrate aerosol data into operational models, and compile a comprehensive climatology of aerosol distribution. Currently, the network comprises 30 active stations, with the majority equipped with Raman lidar featuring depolarization channels. These Raman-lidar-operating EARLINET stations typically provide profiles of aerosol extinction and backscatter coefficients without relying on significant assumptions. Figure 3 illustrates the distribution of EARLINET stations over the study area.
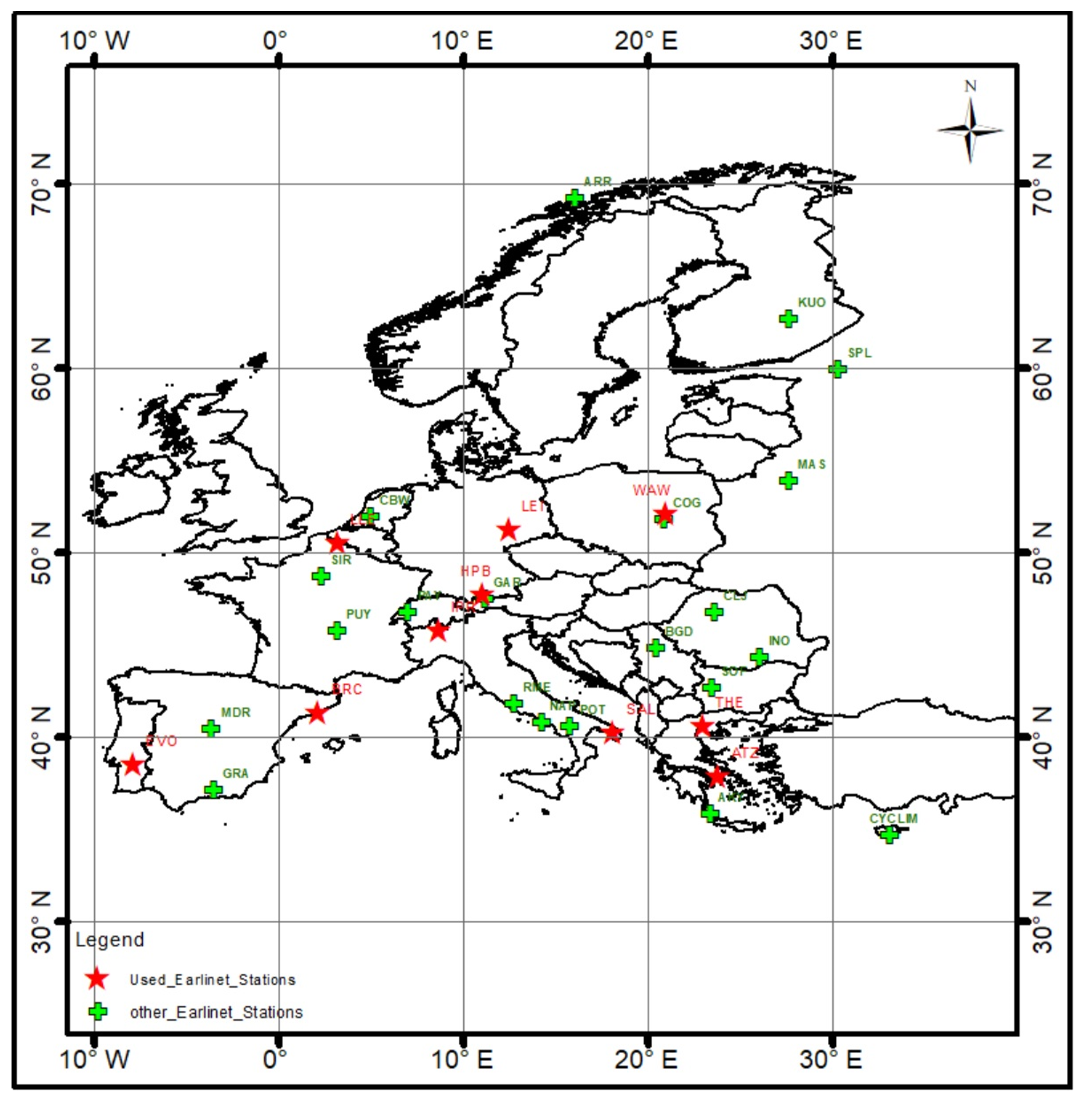
Figure 3Map depicting currently active EARLINET stations. The red stars indicate the geographical distribution of EARLINET lidar stations used in this study.
As noted, hyperspectral measurements in the oxygen bands enable aerosol vertical distribution retrieval by analyzing photon path length changes due to scattering at different altitudes. SEVIRI's spectral bands, however, are primarily designed for cloud and land surface observations and do not specifically cover the oxygen bands. The SEVIRI bands closest to the oxygen bands are B1 (635 nm) and B2 (810 nm), which are in the visible spectrum and respond to scattering by vertically distributed aerosols. The near-infrared and shortwave infrared (SWIR) bands (B3, B4, B7, B9, and B10) are indirectly influenced by aerosol vertical distribution, as the accuracy of AOD retrievals using these bands can be affected by aerosol layering. While these bands may not directly provide vertical profile information, they could yield complementary data that, when combined with other wavelength retrievals, enhance the understanding of aerosol vertical distribution (Wu et al., 2017; Li et al., 2020). B5 and B6 offer insights into water vapor profiles, which can be incorporated into aerosol retrieval algorithms. By accounting for water vapor influence, these bands indirectly improve the accuracy of aerosol vertical distribution estimates. The ozone band (B8) contributes to atmospheric chemistry and aerosol formation insights but does not directly reveal vertical distribution, while B11's lower scattering efficiency limits its sensitivity to vertical variations in aerosols for direct retrieval. As a result, SEVIRI's bands provide a range of potential avenues for studying aerosol vertical distribution, with both direct and indirect contributions. Although SEVIRI's bands offer valuable data for meteorological observations, such as cloud monitoring, surface temperature, and water vapor, its spectral design is not optimized for detailed monitoring of air quality or climate through atmospheric gases and aerosols, similar to TROPOMI. Thus, physical approaches for detailed multi-layer aerosol retrieval, especially for multi-layer AOD, remain challenging with SEVIRI's current spectral configuration.
Meteorological data significantly influence the vertical distribution of aerosols, with varying impacts depending on aerosol type, transport dynamics, and atmospheric conditions. Wind speed and direction drive both horizontal and vertical aerosol transport, with higher wind speeds over oceans enhancing sea salt aerosol concentrations (Kaufman et al., 1997; Yu et al., 2006; Chin et al., 2007; Tesche et al., 2009). Temperature and pressure also play critical roles; temperature inversions inhibit vertical mixing, trapping aerosols in distinct layers, while convective activity from surface heating mixes aerosols in the boundary layer, creating a more homogeneous distribution. Stable high-pressure systems promote surface accumulation by limiting mixing, whereas low-pressure systems enhance upward transport, extending aerosol atmospheric lifetimes (Tesche et al., 2009). The complexity of these interactions suggests a significant challenge for multi-layer AOD retrieval using physical approaches, as accurate modeling requires accounting for diverse meteorological influences and variations in aerosol type, transport, and vertical distribution.
Geographical location, land cover, and temporal factors significantly influence the vertical distribution of aerosols across Europe. Coastal regions tend to have elevated sea salt aerosols due to ocean surface wind activity, while continental areas, especially in winter, experience higher anthropogenic aerosol concentrations from sources like fossil fuel combustion and industrial emissions. Additionally, the latitude and prevailing wind patterns, such as easterly winds, play a role in the long-range transport of aerosols, affecting distribution both horizontally and vertically. Land cover also contributes to these dynamics: forests emit biogenic volatile organic compounds (VOCs), which can form secondary organic aerosols, while urban and agricultural areas introduce anthropogenic aerosols from activities like traffic, industrial emissions, and fertilizer use.
Temporal variations, including seasonal and diurnal changes, further complicate aerosol distribution. For example, during winter, stable high-pressure systems trap aerosols in the planetary boundary layer (PBL), while in summer, warmer temperatures enhance photochemical activity, leading to increased ozone and sulfate concentrations. Diurnal fluctuations are also evident, particularly in urban areas, where traffic and industrial activities create peaks in anthropogenic emissions during the day.
These combined effects underscore the complexity of aerosol behavior, emphasizing the necessity for an approach that integrates all relevant variables and effectively captures their interactions and influence on vertical aerosol distribution and multi-layer AOD retrieval. Machine-learning-based methodology, capable of managing large datasets and discerning intricate relationships between these variables, presents a promising solution for accurate multi-layer AOD retrieval. Our proposed model framework for estimating AOD at the mentioned four distinct layers over the European continent troposphere encompasses several sequential steps – data collection, preprocessing, partitioning, regression, and analysis of the performance of each regression model – to ascertain the most accurate one, as illustrated in Fig. 4.
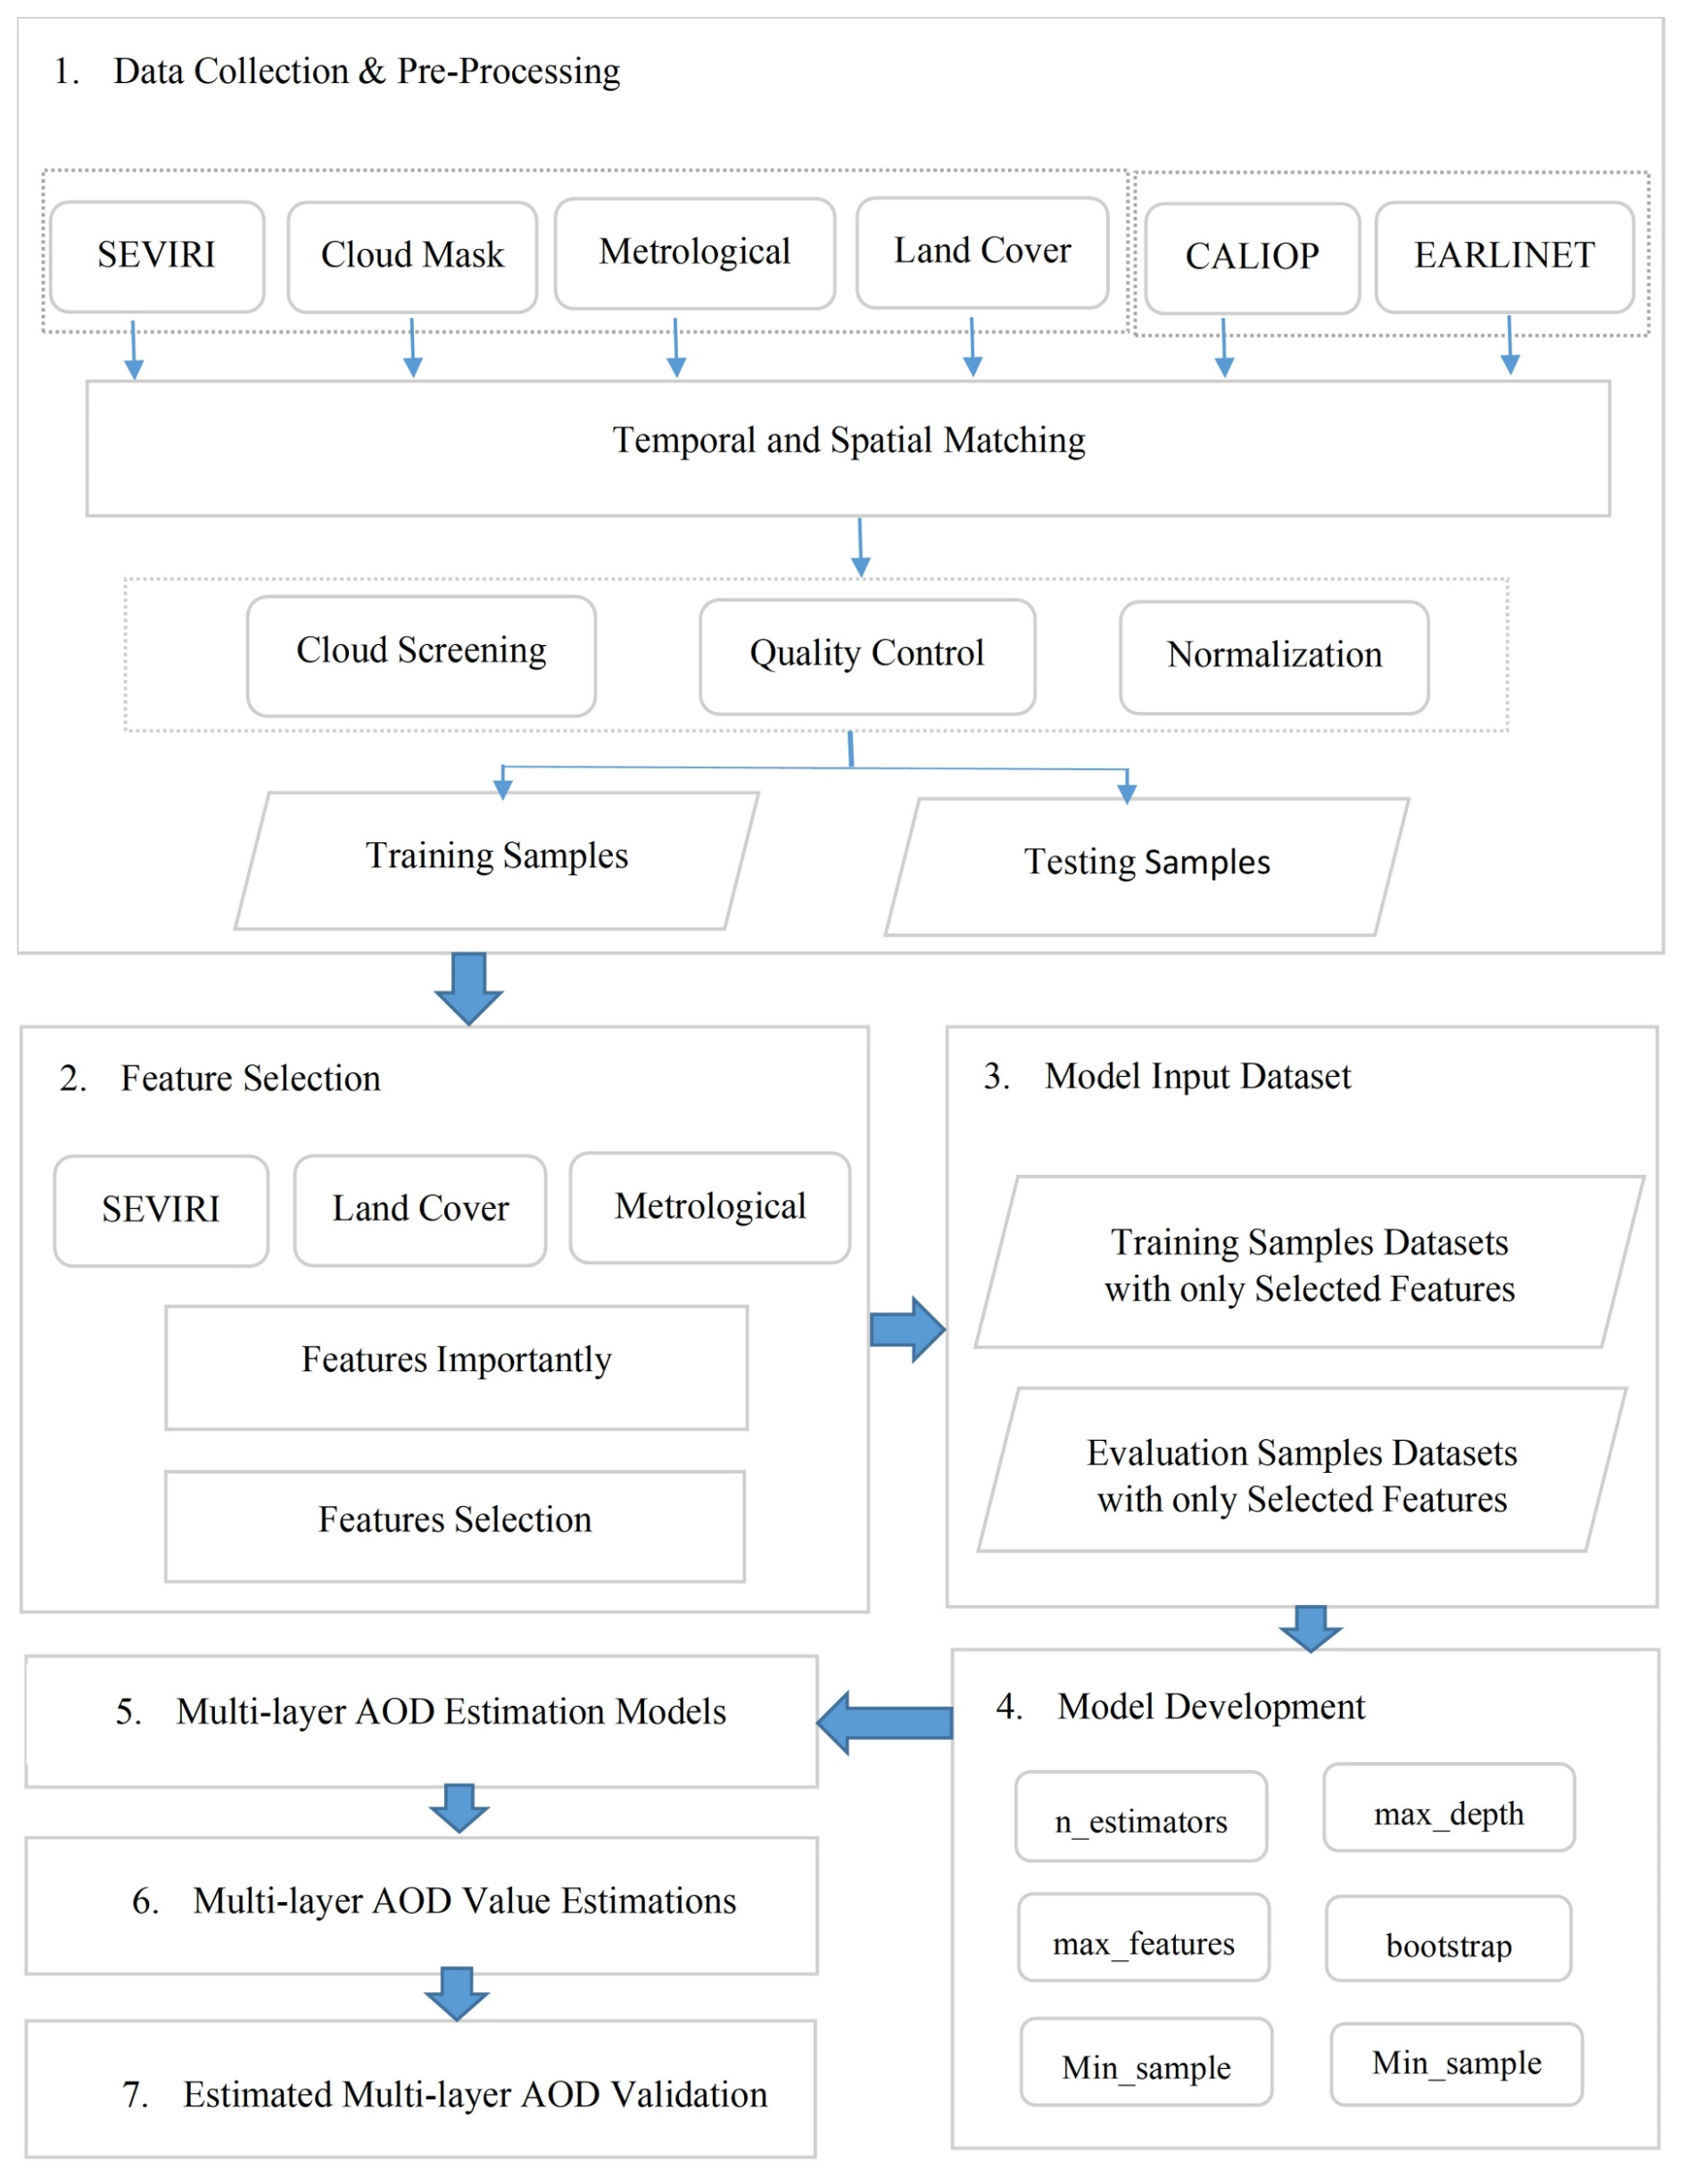
Figure 4Research framework for developing machine learning models to estimate SEVIRI multi-layer AOD values.
The process commences with data collection, detailed in the preceding section. Subsequently, preprocessing of both input and output data becomes imperative to ensure their suitability for subsequent analysis. The dataset is then partitioned into two subsets: training and testing, a pivotal step in machine learning aimed at assessing model performance and mitigating overfitting. Following data partitioning, various model structures are proposed and developed to capture the intricate relationships within the dataset. This phase entails selecting appropriate algorithms and architectures tailored to the specific task of multi-layer AOD estimation. Finally, the performance of each model is meticulously evaluated using predefined metrics to pinpoint the most accurate and reliable model for AOD estimation across the desired vertical layers. In the subsequent sections, we delve into a detailed examination of each step.
3.1 Preprocessing
To ensure a robust model for estimating AOD values at suitable 3D resolutions, this study integrates data from various sources, including satellites and ground-based observations. To address spatial–temporal sampling disparities, we employ a co-location approach where data from multiple sources, such as satellites and ground-based observations, are matched within a ±30 min time frame and within a 3 km radius of the study area (Kittaka et al., 2011; Redemann et al., 2012; Han et al., 2017; B. Liu et al., 2018). This method harmonizes disparate datasets, enhancing the reliability and comprehensiveness of our analysis. The subsequent preprocessing stages necessary for data refinement and analysis are elaborated upon in the following subsections.
3.1.1 SEVIRI
Utilizing SEVIRI data necessitates a critical preprocessing step involving co-referencing and applying geometric corrections. The Data Tailor tool, accessible at https://www.eumetsat.int/data-tailor (last access: 28 October 2024), serves as a valuable spatial resource introduced in recent years. It simplifies the definition of coordinate systems, image systems, cutting ranges, expected output types, and requisite file extensions for the output data. Estimating AOD values requires the conversion of radiance to reflectance for the SEVIRI reflective bands (VIS06, VIS08, and NIR16) and equivalent brightness temperature for the remaining eight bands. To achieve this, we computed the bidirectional reflectance factor (BRF) for the SEVIRI warm channels using Eq. (1) proposed by the European Organization for the Exploitation of Meteorological Satellites (2012):
where i denotes the channel number (1, VIS06; 2, VIS08; 3, NIR16; 4, HRV), represents the bidirectional reflectance factor (BRF) for channel λi, stands for the measured radiance in mW m−2 sr−1 (cm−1)−1, d(t) signifies the Sun–Earth distance in astronomical unit (AU) at time t, signifies the band solar irradiance for channel λi at 1 AU in mW m−2 sr−1 (cm−1)−1, and θ(t, x) denotes the solar zenith angle in radians at time t and location x. The equivalent brightness temperature (Tb) of a satellite observation is defined as the temperature of a black body emitting the same amount of radiation. Therefore, the brightness temperature follows the form of Eq. (2).
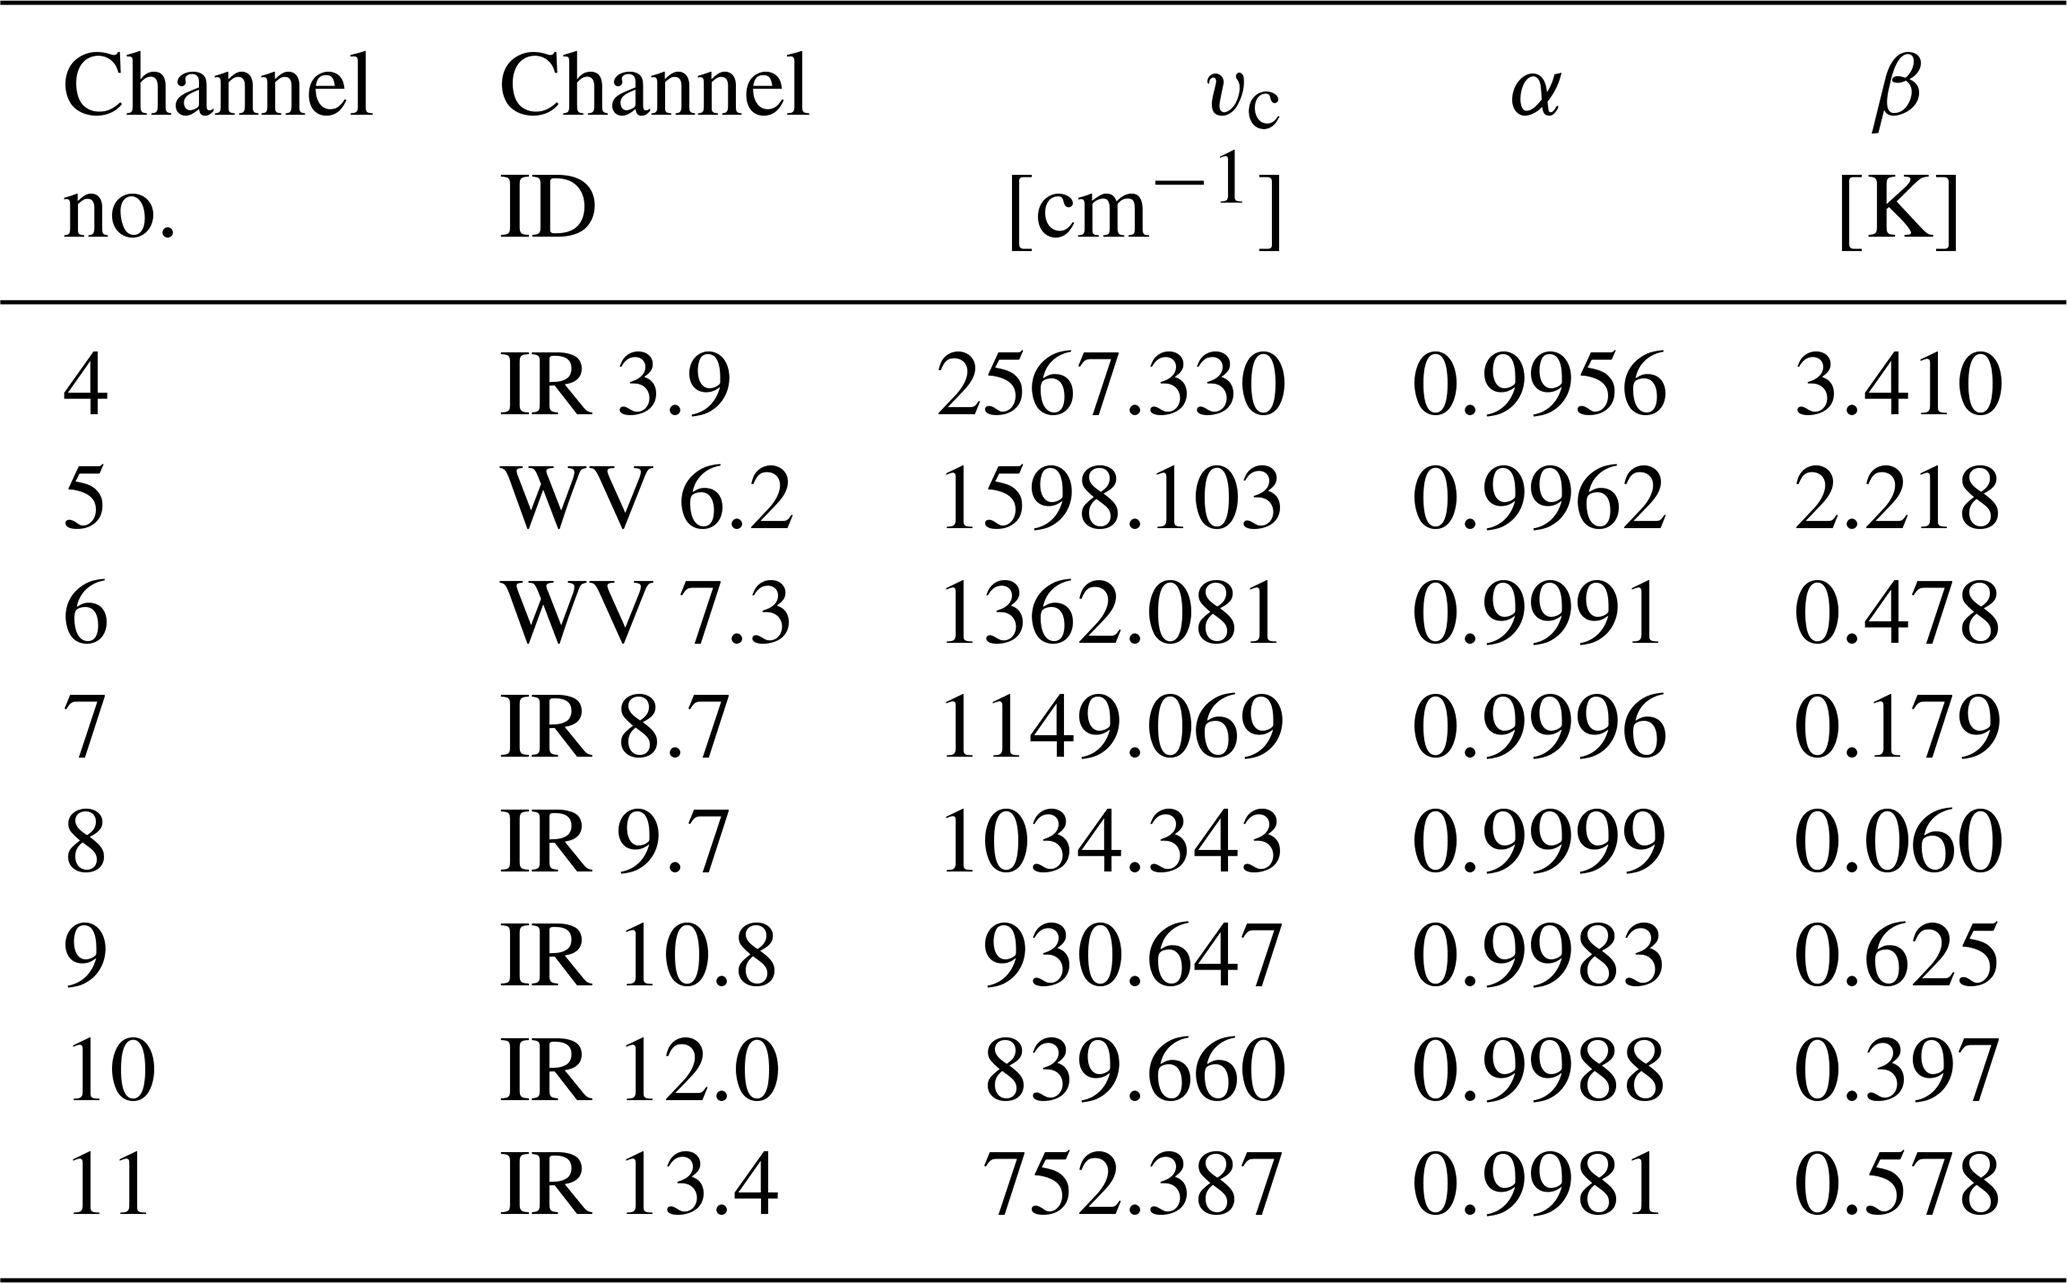
Using the observed radiances (in mW m−2 sr−1 (cm−1)−1) and radiation constants C1 = 2hc2 and C2 = , where c, h, and k represent the speed of light, Planck's constant, and the Boltzmann constant, respectively, the regression coefficients vc, α, and β are determined through non-linear regression analysis. This analysis is conducted on a pre-calculated lookup table generated for the various SEVIRI channels, as delineated in Table 1 (Tjemkes et al., 2012).
To further enhance the preprocessing workflow, we applied the SEVIRI cloud mask product to the data. This product categorizes pixels with values 00, 11, and 22, corresponding to clear, partially cloudy, and cloudy conditions, respectively. To integrate the cloud mask into the data, we utilized the following transformation:
This ensures that data from cloudy or partially cloudy pixels are appropriately weighted or excluded, preserving the accuracy of AOD retrieval for clear-sky conditions. By incorporating the cloud mask product, the preprocessing step effectively eliminates biases introduced by cloud contamination, ensuring the reliability of subsequent AOD estimations.
3.1.2 CALIOP
In this study, to mitigate the impact of cloud contamination and retrieval errors on CALIOP AOD retrieval, our screening methods closely follow the guidelines established by Winker et al. (2013). We employ various quality filters to identify and filter aerosol pixels, including cloud and aerosol discrimination (CAD) scores, extinction QC flags, and uncertainty values. Specifically, we utilize a CAD score range outside to address uncertainties in cloud–aerosol discrimination, ensuring the selection of cloud-free pixels with high confidence. Additionally, we apply extinction quality control flags with values of 0 and 1 to filter extinction retrievals with high confidence. This includes constrained retrievals utilizing transmittance measurements and unconstrained retrievals where the initial lidar ratio remains unchanged in iterations. Furthermore, we exclusively consider daytime profiles in this study. Uncertainty flags associated with extinction coefficients are employed for data screening. Range bins with an uncertainty flag value of 99.9 km−1 are excluded from the analysis, following the methodology outlined by Winker et al. (2013).
3.1.3 Land cover product
Considering that the original MCD12Q1 product is stored in an HDF and utilizes the sinusoidal projection, several data preprocessing steps are required. These steps encompass format conversion, reprojection, resampling, image mosaicking, and sub-area masking. To execute these tasks, we employ the pyModis free and open-source Python-based library. This tool enables the conversion of MODIS HDF into GeoTIFF format and facilitates the conversion of data projection from SIN to WGS84/UTM. Additionally, it facilitates image mosaicking and subsetting. Moreover, to enable comparison between the MCD12Q1 and SEVIRI datasets, the spatial resolution of MCD12Q1 is resampled at 3 km using the nearest neighbor resampling method. This method preserves the gray values of the original image, unlike bilinear interpolation or cubic convolution interpolation methods, which may alter them.
3.2 Machine learning models and parameter tuning
In this study, our primary objective is to develop a machine learning model to estimate SEVIRI AOD values at various altitudes – 1.5, 3, 5, and 10 km – using CALIOP's vertical profiles across the European continent. We employ two distinct machine learning algorithms, RF and XGB, to train layering models. Both RF and XGB adopt an ensemble approach, which involves constructing and aggregating multiple decision trees (Breiman, 2001; Chen and Guestrin, 2016). In RF, each tree is built using a bootstrap sample of the data, with nodes determined by the best subset of randomly selected predictors (Breiman, 2001). These trees are then averaged to obtain a final ensemble prediction. Conversely, XGB implements the gradient boosting method, where trees are interdependent, as newly trained trees are constructed based on previous trees, incorporating their ability to predict the residuals of prior trees (Chen and Guestrin, 2016). In both RF and XGB, all trained trees are combined to make the final prediction.
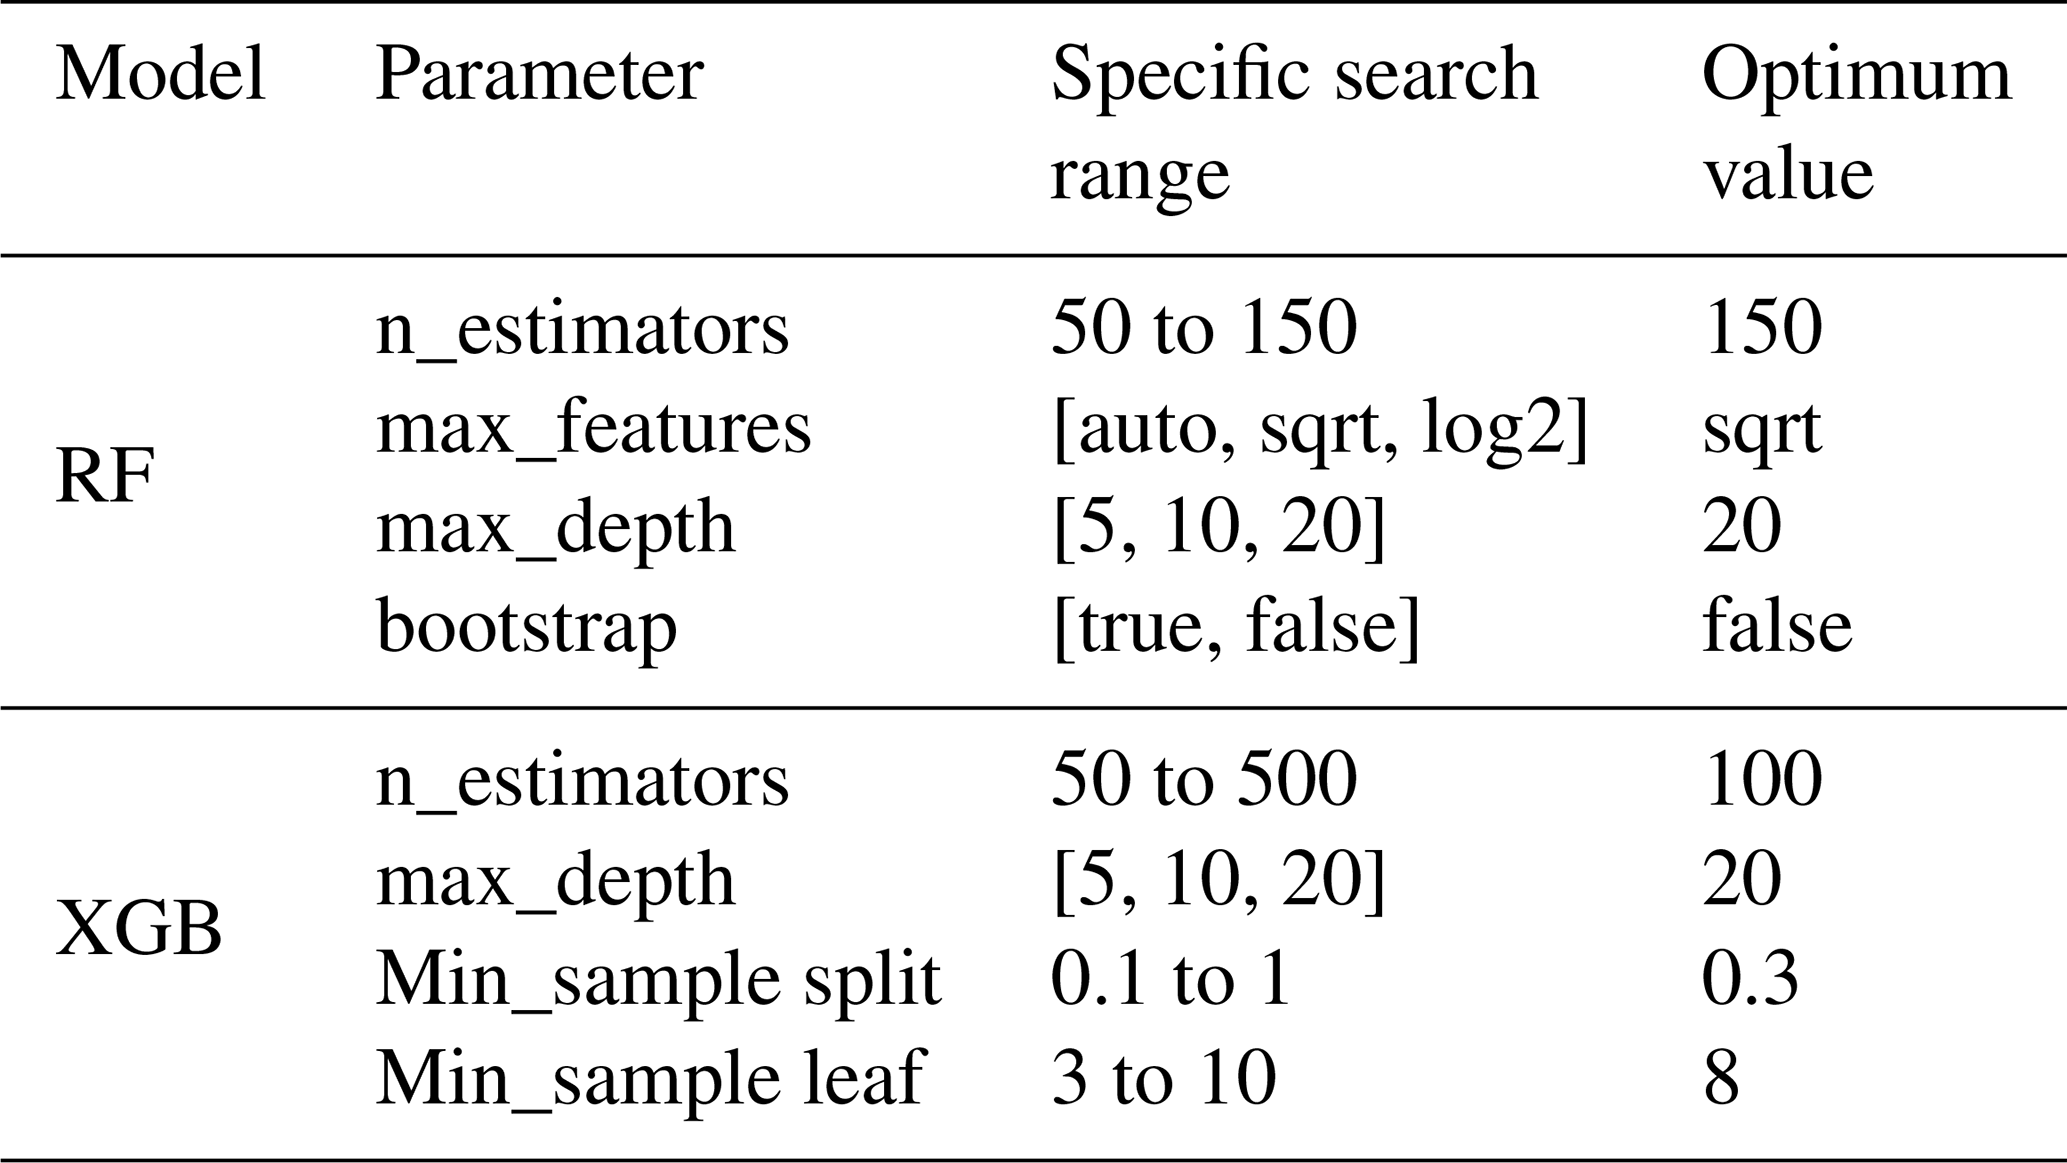
We systematically explored various parameter combinations for each machine learning model. Parameters such as the number of decision trees (N_estimators), the number of variables considered for splitting at each node (max_features), and the maximum depth of each decision tree (max_depth) for RF, as well as parameters including the number of gradient boosting rounds or decision trees (n_estimators), minimum sum of instance weight (Min_sample split), maximum depth of each decision tree (max_depth), and minimum number of samples required to be at a leaf node (Min_sample leaf) for XGB, were optimized using a grid search algorithm. This algorithm exhaustively searches through a specified subset of the hyperparameter space. We set up a grid of possible values for each hyperparameter to be tuned, as illustrated in the specific search range column in Table 2. For each combination of hyperparameters in the grid, the algorithm trains the model using the training data and evaluates its performance through cross-validation. The performance of each hyperparameter combination is measured using several specified evaluation metrics. Finally, the combination of hyperparameters that results in the best performance on the validation set is selected, as shown in the optimum value column in Table 2. This optimal set of parameters is then used to train the final model on the entire training dataset. For a comprehensive overview of the optimized parameters, refer to Table 2.
Table 2The control parameter for tuning the machine learning models.
3.3 Model training and evaluation
Data partitioning is essential for training and evaluating machine learning models, especially when working with time-series data where temporal autocorrelation might bias model performance. In this study, the dataset was partitioned by year to ensure temporal independence between training and testing data, addressing potential autocorrelation issues and enabling robust model evaluation. Specifically, the data from 2017 to 2018 were used for model training, while the 2019 data were reserved exclusively for testing. This approach was chosen following an analysis of the feature distributions of SEVIRI bands (B1 to B11); P, T, LC, Ws, and Wd; and multi-layer AOD values (AOD1.5, AOD3, AOD5, and AOD10) over the different years, as shown in Fig. S1 in the Supplement. The distribution represented in Fig. S1 reveals consistent patterns between 2017–2018 and 2019, with minimal variation in their shapes. This similarity confirms that the temporal separation does not introduce significant distributional shifts that might impact model generalization. In other words, the model's performance on the 2019 data would provide an unbiased evaluation of its predictive ability. This separation minimizes temporal autocorrelation, ensuring robust and unbiased model assessment.
During the training phase of our machine learning models, we leveraged datasets spanning diverse temporal periods and geographical regions where both SEVIRI and CALIOP data were accessible. However, following this training phase, the algorithms function autonomously, relying solely on SEVIRI data as their input. This advancement enables us to estimate AOD values at four specified vertical layers within each pixel of the SEVIRI dataset, based on a single SEVIRI observation along with its associated meteorological data and land cover data, covering the entire study area.
Evaluation of the multi-layer AOD-estimating models involved statistical metrics such as the coefficient of determination (R2), Pearson correlation coefficient (R), root mean square error (RMSE), and mean absolute error (MAE). The selection of the optimal model was based on higher R2 and R values, along with lower RMSE and MAE scores. Additionally, we conducted a validation analysis of estimated multi-layer AOD values with EARLINET AOD profiles on a continental scale to ascertain the model's performance.
In this paper, our primary aim is to develop a machine learning model capable of retrieving AOD across four distinct vertical layers: 1.5, 3, 5, and 10 km. To accomplish this, we utilized two well-established machine learning models, XGB and RF, previously employed in related studies. These models were trained on SEVIRI data spanning the European continent from 2017 to 2019. Our objective was to estimate sub-hourly AOD values, approximately every 15 min, at a spatial resolution of 3 km × 3 km.
To explore the relationship between AOD and potential predictor variables, we conducted a correlation analysis experiment utilizing the Pearson correlation coefficient (PCC; Benesty et al., 2009). Furthermore, we evaluated the influence of land cover and meteorological data as input variables for the machine learning models on estimating multi-layer AOD values from SEVIRI data, with a specific focus on identifying the most optimal model. Moreover, we conducted training and testing of the machine learning models across various temporal scales, including annual and seasonal analyses. Subsequently, we assessed the performance of each model using independent satellite and ground-based AOD profiles, employing evaluation metrics such as R2, R, MAE, and RMSE. Finally, multi-layer AOD values for two aerosol events – Saharan dust from 13 to 18 March 2022 and a volcanic eruption on 14 August 2023 – are presented as maps to evaluate the model's ability to detect and characterize distinct aerosol signatures across these four layers. In the subsequent sections, we provide a comprehensive review of the results derived from the aforementioned assessments.
4.1 Validation of estimated AOD with satellite-retrieved AOD
4.1.1 Feature importance
According to established radiative transfer theory (Tsang et al., 1984; Zege et al., 1991), the spectral signal captured by a satellite sensor at the top of the atmosphere is intricately shaped by various factors, including the composition, size distribution, and altitude of aerosols, as well as atmospheric molecules such as water vapor. These factors have a direct impact on the retrieval of AOD values. Consequently, SEVIRI reflectance and brightness temperature across bands 1 to 11 (B1 to B11) were identified as critical features for this analysis. The relationship between AOD and all candidate features – including spatial features such as latitude (lat) and longitude (long); temporal features including year, month, and day; meteorological data like P, T, Ws, and Wd; and LC – was investigated through a correlation analysis. This analysis, illustrated in Fig. 5, utilized the PCC as the chosen filtering method. The findings underscored that the majority of selected features in this study exhibited significance levels exceeding 1 %.
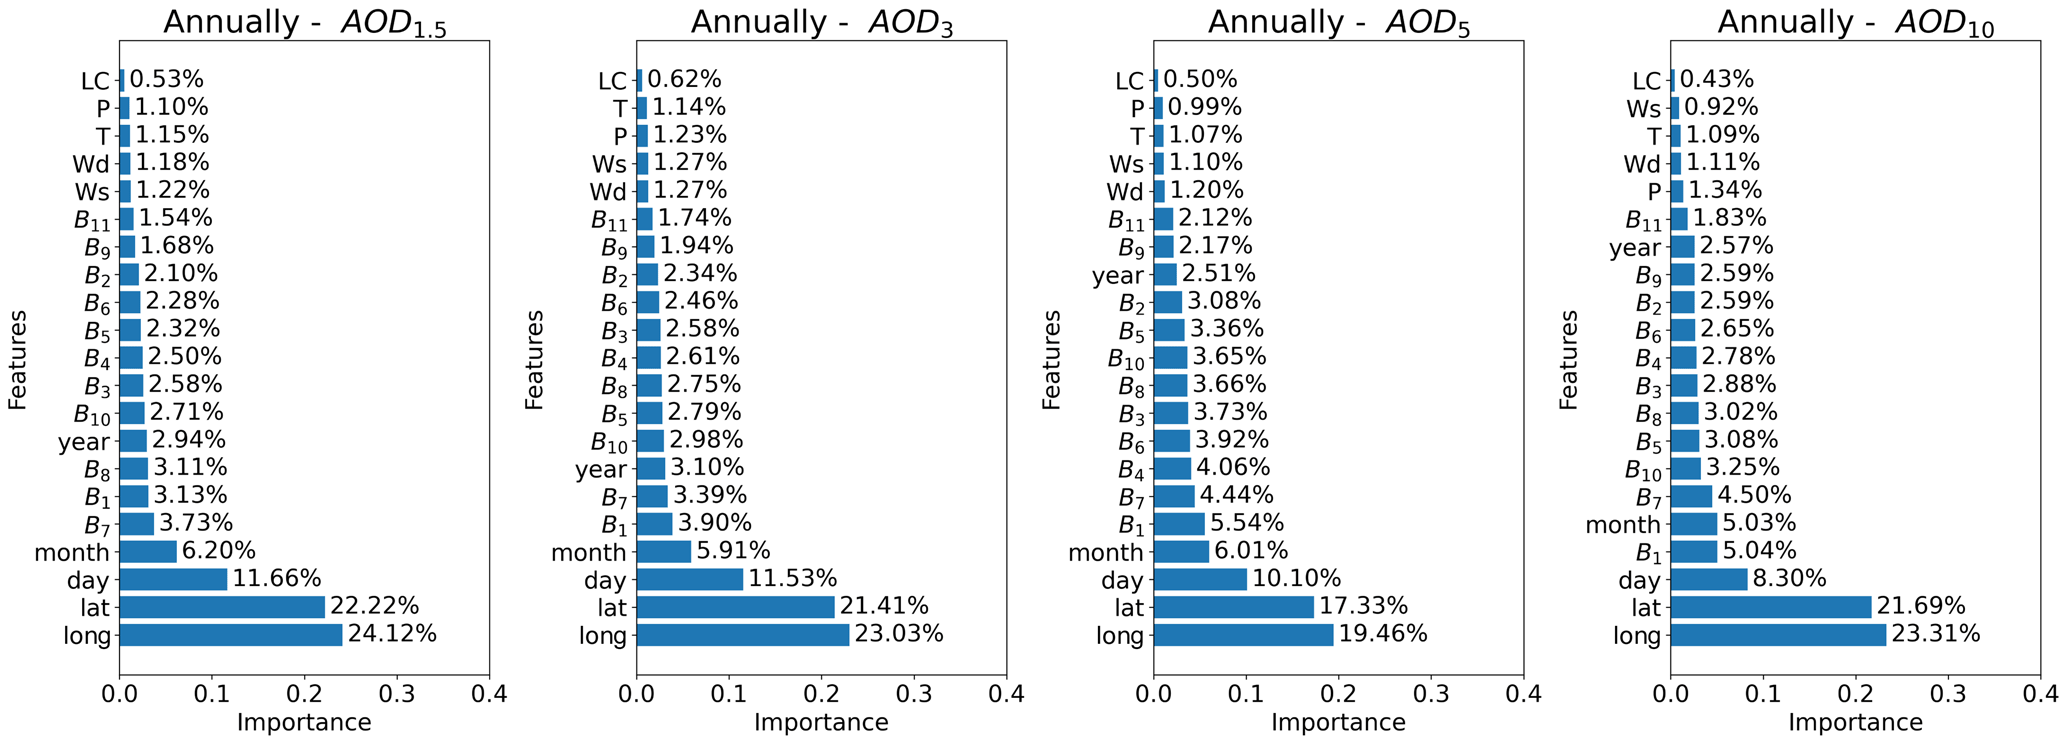
Figure 5The importance of input features in the retrieval of SEVIRI multi-layer AOD values, as determined by the PCC.
As illustrated in the PCC results (Fig. 5), aerosol dynamics in the 0–1.5 km layer of the study area are strongly influenced by geographic and temporal factors, characteristic of surface-dominated conditions. High correlations of AOD with long (23.92 %) and lat (22.41 %) highlight the impact of location-specific emissions and regional transport patterns, while significant correlations with day (11.59 %) and month (6.19 %) indicate the role of diurnal and seasonal cycles driven by emissions, meteorological changes, and boundary layer dynamics. Thermal infrared sensitivity also plays a role, as indicated by the strong correlations with B7 (3.73 %) and B8 (3.07 %), the highest among SEVIRI bands. This suggests a potential link between surface temperature variations and AOD in the lower atmosphere. Moreover, the correlation with B1 (3.06 %) points to aerosols interacting with visible light, likely from urban/industrial emissions, biomass burning, and potentially dust. Meanwhile, meteorological factors such as Ws (1.31 %), Wd (1.22 %), T (1.16 %), and P (1.1 %) are relatively weak compared to geographic and temporal factors. Finally, LC (0.54 %) shows the weakest correlation, suggesting a limited direct influence on AOD, potentially masked by stronger influences from emissions, transport, and meteorological factors.
In the 1.5–3 km layer of area of interest, aerosol dynamics remain strongly correlated with long (23.15 %) and lat (21.39 %), though they decrease slightly compared to the 0–1.5 km layer. This suggests a transition toward atmospheric stability and more synoptic-scale patterns. Day (11.29 %) and month (5.86 %) still exhibit notable correlations, reflecting the ongoing impact of diurnal and seasonal cycles on AOD, albeit slightly weaker than in the lower layer. The visible band B1 (3.86 %) shows the strongest correlation among SEVIRI bands, potentially reflecting a change in aerosol composition or properties compared to the lower layer. This could be due to an increased influence of transported aerosols, potentially with different spectral characteristics. B7 (3.48 %) remains strongly correlated, suggesting continued sensitivity to thermal characteristics. Enhanced transport influence is evident, as Wd (1.34 %) shows a stronger correlation than Ws (1.29 %), emphasizing the role of transport pathways in AOD distribution at this altitude. Additionally, the correlation with P (1.3 %) points to an emerging link between atmospheric stability and aerosol accumulation in this layer. This aligns with other studies' discussion on PBLH and its role in controlling pollutant dispersion, as PBLH is influenced by factors like temperature and stability. LC correlation increases slightly to 0.63 %, still remaining relatively weak overall.
In the 3–5 km layer of the research area, correlations with long (19.42 %) and lat (17.32 %) decrease further, indicating a reduced influence of local sources and an increased dominance of long-range transport and large-scale atmospheric circulation patterns. Correlations with day (9.87 %) and month (6.1 %) also weaken, suggesting a shift from surface-driven cycles to broader atmospheric processes. The high correlation with B1 (5.38 %) points to a prominent presence of aerosols interacting with visible light. Strong correlations with B7 (4.73 %) indicate the effect of thermal characteristics on AOD at this level. Wd (1.18 %), Ws (1.1 %), T (1.09 %), and P (0.99 %) correlations remain at similar levels to those of the previous layer, suggesting continued influence of transport and stability.
In the 5–10 km layer of the target region, where free tropospheric dynamics dominate aerosol behavior, geographic correlations with long (22.92 %) and lat (21.46 %) show a slight increase compared to the 3–5 km layer, potentially indicating the influence of large-scale transport patterns in the free troposphere. Day (8.59 %) and month (4.91 %) correlations further weaken, reinforcing the diminishing impact of surface-driven cycles. B1 (5.25) still shows the highest correlation, indicating aerosols that interact with visible light and are likely transported from lower altitudes or distant sources. B7 (4.6 %) also maintains a strong correlation, indicating a potential sensitivity to upper-level atmospheric dynamics. Notably, P (1.41 %) now shows the strongest correlation among meteorological variables, surpassing Wd (1.13 %), T (1.1 %), and Wd (0.84 %). This emphasizes the critical role of atmospheric stability in controlling AOD distribution in the free troposphere. Despite meteorological data showing low statistical importance (below 2 %) in estimating AOD across all altitude layers, they have significant physical relevance in processes unique to each layer. LC (0.42 %) shows the weakest correlation across all layers, further suggesting its limited direct influence on AOD at this altitude.
4.1.2 Meteorological data and land cover feature selection
As previously noted, LC, T, P, Ws, and Wd are key features in AOD estimation. To further understand their impact on machine learning model performance in SEVIRI multi-layer AOD values, we conducted 16 cases of experiments with varied meteorological and LC feature combinations, validated using CALIOP AOD retrievals. Our analysis, depicted in Fig. 6 and Tables S1–S2 in the Supplement, is summarized using statistical metrics like R2, R, RMSE, and MAE.
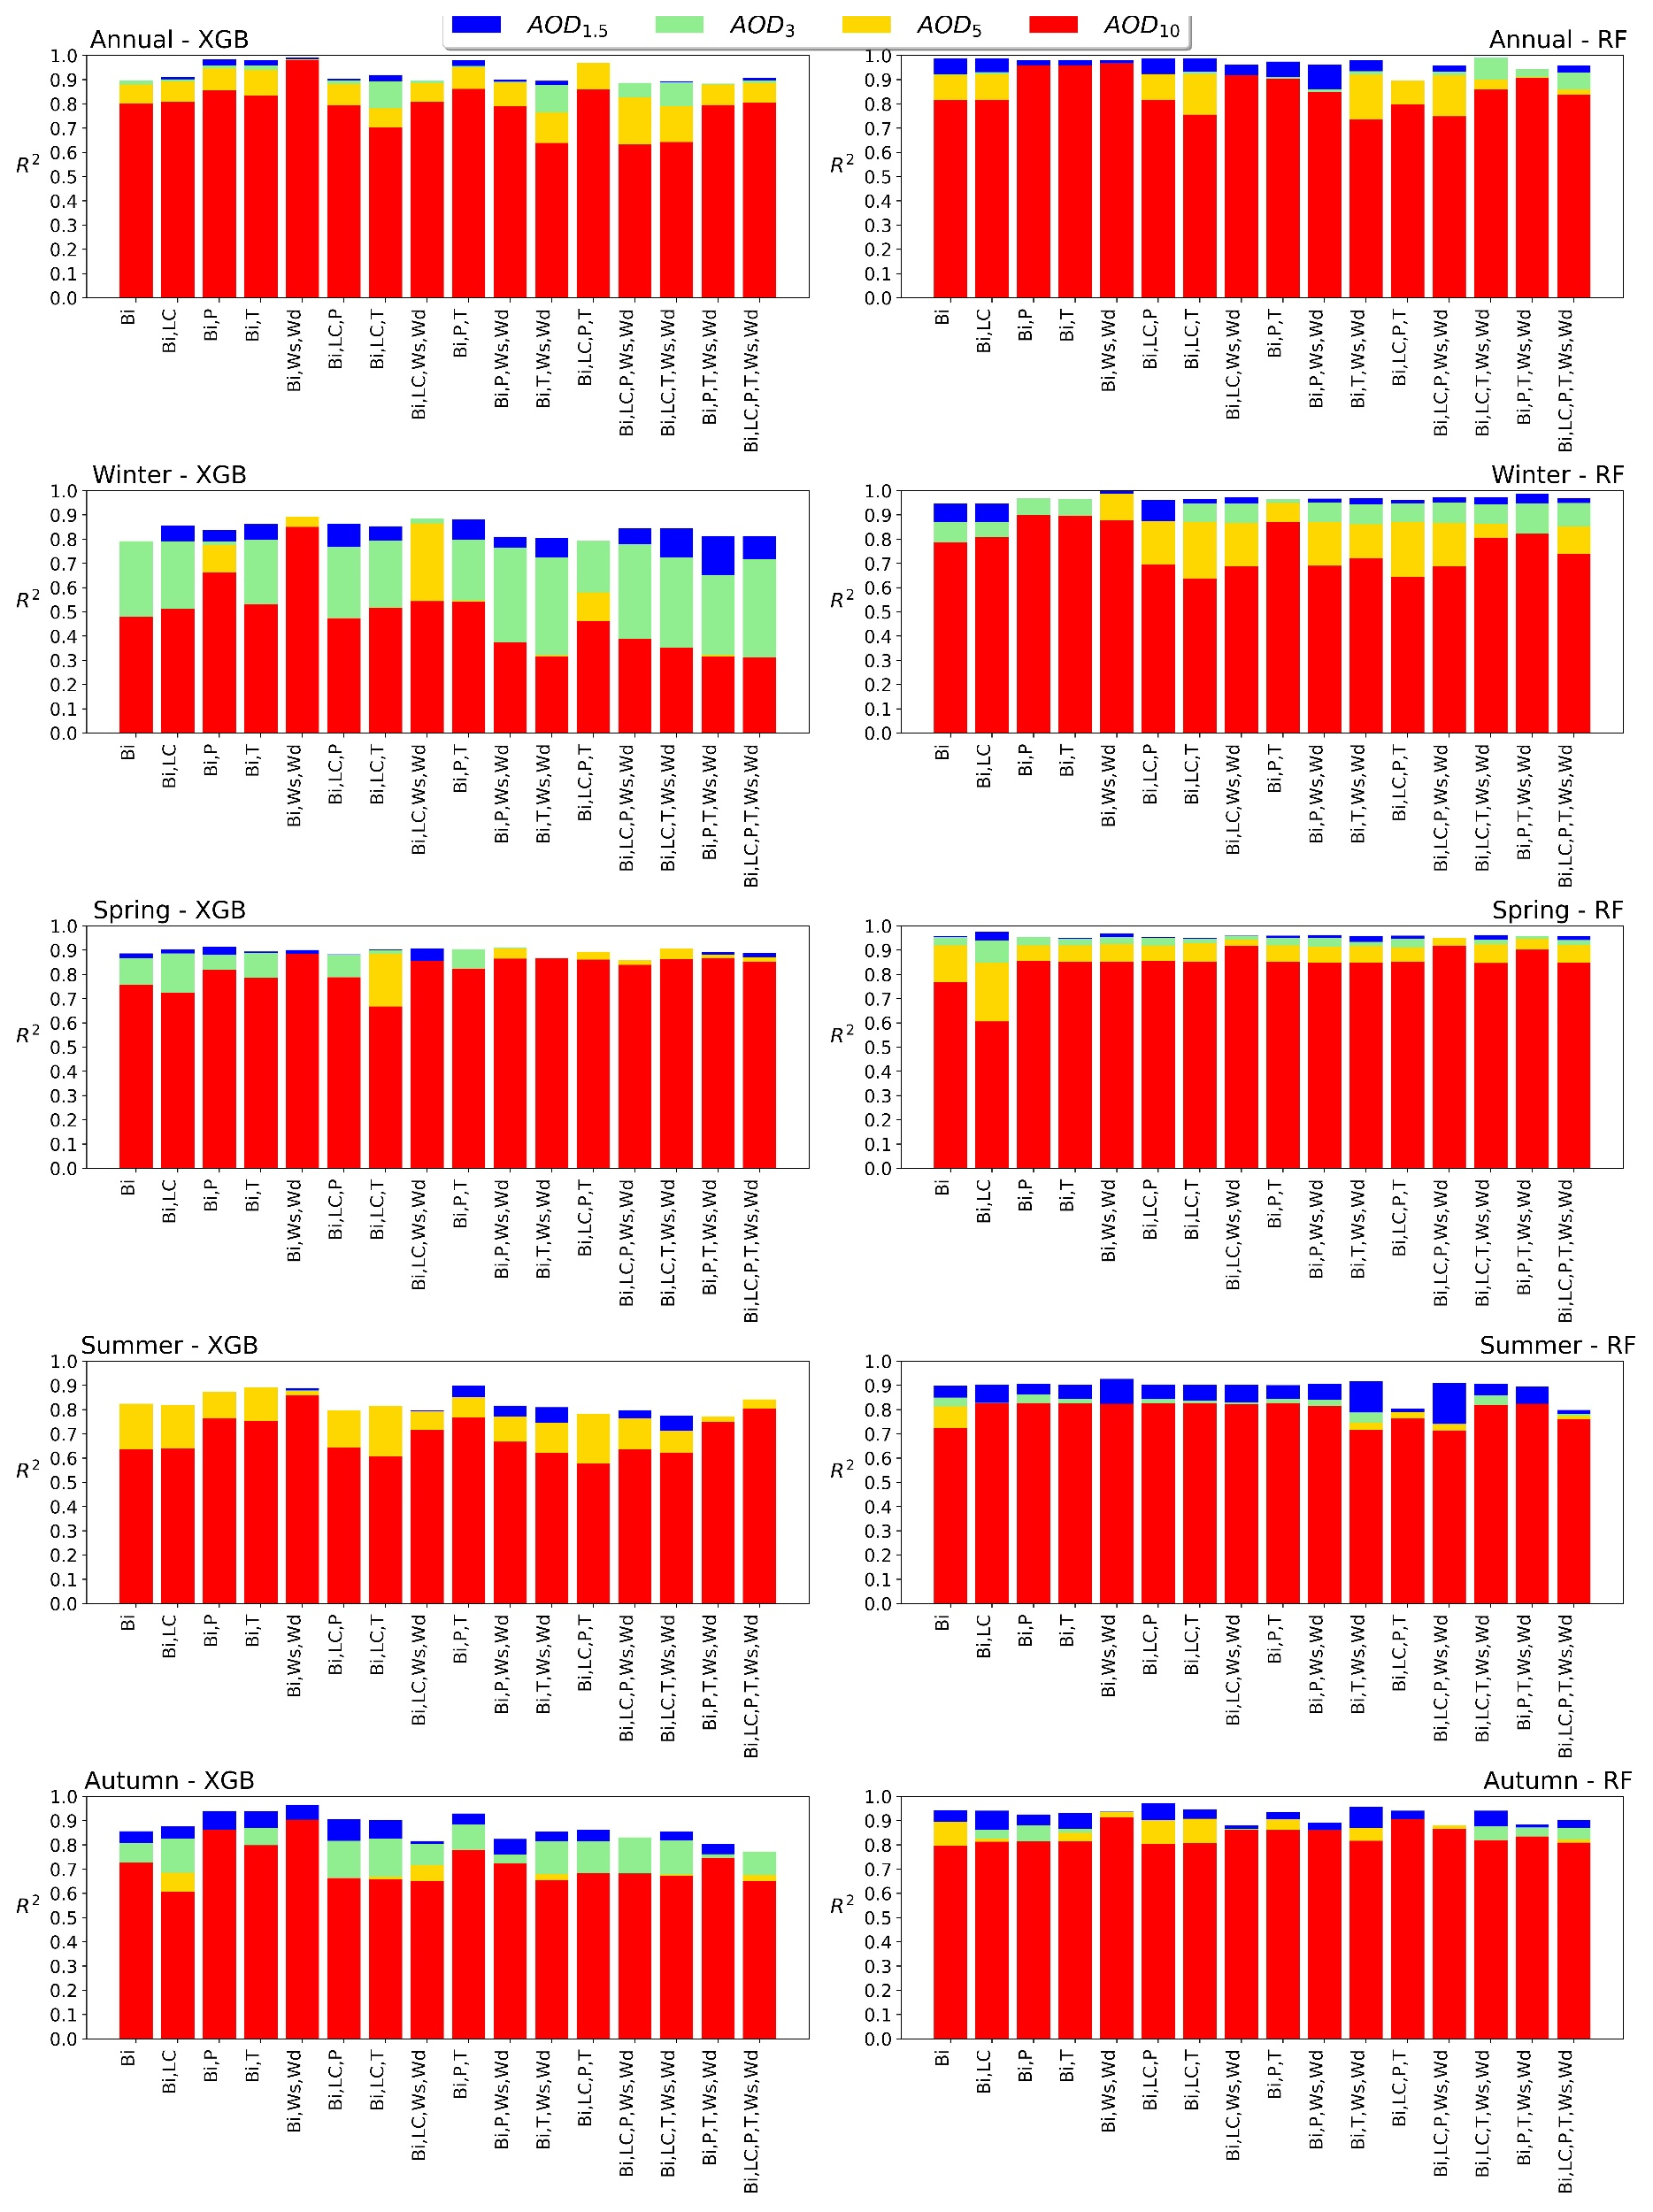
Figure 6The impacts of input features on the retrieval of SEVIRI multi-layer AOD values, represented as R2 metrics, for the RF and XGB models. Each row displays the results for the annual period and the four seasons (winter, spring, summer, and autumn). The four colors in each bar plot indicate the R2 values for AOD at 1.5, 3, 5, and 10 km layers.
Our findings indicate that, for most cases across annual and seasonal datasets, combining these features with Bi has a negligible impact on the 1.5 km layer. In contrast, integrating Ws and Wd with SEVIRI bands (case 5) consistently yields the highest R2 and lowest RMSE values across both annual and seasonal datasets. Incorporating these features significantly enhances R2 values across models, with substantial increases ranging from 0.75 to 0.99 and 0.89 to 0.99 observed in R2 and decreases ranging from 0.075 to 0.009 and 0.033 to 0.002 in RMSE, for both XGB and RF models from case 1 to case 5 in the 10 km layer. These statistical values underscore the crucial role of Ws and Wd in influencing the spatial and temporal properties of atmospheric aerosols, particularly in the 10 km layer. Physically, Ws and Wd are known to be primary drivers of aerosol transport across various spatial scales. High Ws can lift dust and other particulate matter into the atmosphere, while Wd affects the regional and long-range advection of aerosols. This mechanism is particularly impactful in the 5–10 km altitude range, where aerosols experience less drags and can be transported over long distances with minimal settling, especially in dry conditions (Pérez et al., 2006a, b; Georgoulias et al., 2016; Nicolae et al., 2019).
However, integrating T and P features, as seen in cases 3, 4, and 9, notably enhances AOD accuracy at 3, 5, and 10 km altitudes. This improvement is attributed to P reflecting changes in aerosol vertical layers, influencing aerosol diffusion capacity, while T is closely linked to atmospheric aerosol distribution by altering air movement dynamics. T affects atmospheric stability by controlling the thermal stratification of air masses; higher T can destabilize the atmosphere, promoting vertical mixing and lifting of aerosols. However, the impact of T on aerosol concentration diminishes with altitude, especially in stable layers where thermal inversion limits upward transport (Pérez et al., 2006a, b; Choobari et al., 2014; Xu et al., 2024). P, on the other hand, can reflect shifts in the PBL height, which influences the vertical distribution of aerosols. A higher PBL allows more aerosols to disperse vertically, enhancing their presence in layers such as AOD5, while a lower PBL restricts aerosols closer to the surface. Despite these influences, T and P are generally less effective than wind-related factors (cases 6, 7, and 8), particularly in upper layers, because wind-driven advection predominantly controls the lateral movement of aerosols, especially during seasonal changes when wind dynamics vary substantially (Nicolae et al., 2019; Georgoulias et al., 2016; Ortiz-Amezcua et al., 2017; Granados-Muñoz et al., 2016). However, T and P impact PBL dynamics, but these effects may be limited in certain seasons due to more stable atmospheric conditions, where lower T and P fluctuations are less conducive to vertical mixing. For example, case 12 including T and P may show less impact on AOD5 and AOD10 layers in winter, when aerosols tend to stay close to the surface due to limited vertical convection. In contrast, warmer seasons promote vertical convection, enhancing the influence of T and P in predicting AOD values across altitude layers. Additionally, the proposed learning models can capture complex, non-linear relationships among features, but they may not always prioritize individual variables unless they strongly affect the target variable. As a result, even if T or P is expected to influence AOD, their impact may be overshadowed by more influential Ws and Wd (cases 13, 14, 15, and 16).
Conversely, LC plays a more localized role in AOD estimation, particularly in lower layers (AOD1.5), as it impacts the sources and types of aerosols present near the surface. However, the effect of LC diminishes with altitude due to decreased influence on vertical transport; aerosols released from surface sources are progressively diluted as they disperse upward. This observation is confirmed by our findings that cases with LC (e.g., cases 2, 8, 13, 14, and 16) did not consistently outperform those with purely meteorological features, especially in higher layers (AOD5 and AOD10). Physically, this limitation arises from the fact that the vertical distribution of aerosols across different atmospheric layers over the European troposphere is more heavily influenced by continental and regional transport patterns, atmospheric stability, and meteorological conditions than localized land cover characteristics (Zhao et al., 2019).
In conclusion, the validation of our models using CALIOP AOD retrievals highlights the robustness of our findings, particularly the critical role of Ws and Wd in enhancing AOD estimation accuracy. The consistency of these findings across the RF and XGB models, evaluated at different temporal scales (annual and seasonal), highlights the critical role of Ws and Wd in AOD estimation at both the 5 and the 10 km layers. Consequently, we prioritize Ws and Wd, along with Bi, as the preferred input features for our models due to their demonstrated impact on improving AOD estimation accuracy.
4.1.3 Validation of seasonal modeling
Considering the substantial seasonal variations in aerosol distribution and meteorological conditions, we sought to evaluate whether adapting our proposed modeling approach to specific seasons could improve the accuracy of multi-layer AOD retrievals. Following the methodology outlined in Sect. 3, we partitioned the sample dataset, derived from 2017 to 2019 data, into four segments based on seasonal distinctions: winter (January, February, and March), spring (April, May, and June), summer (July, August, and September), and autumn (October, November, and December), as detailed in Table 3. Subsequently, we trained individual machine learning models on these seasonal and annual datasets spanning 2017 to 2018. For this analysis, we separately estimated SEVIRI multi-layer AOD values for the year 2019 using both the seasonal and the annual models. Detailed seasonal validation findings, including R2 and RMSE metrics, are delineated as highlighted values in Tables S1 and S2.
Table 3Number of samples used to train machine learning models in this study.
The XGB model exhibited acceptable performance across different seasons, with R2 (RMSE) values for the 1.5 km layer as follows: 0.901 (0.0103) for spring, 0.889 (0.0347) for summer, 0.966 (0.0265) for autumn, and 0.881 (0.0392) for winter. In comparison, the RF model demonstrated improvement, boasting R2 values of 0.97, 0.927, 0.937, and 0.999, with corresponding RMSE values of 0.0211, 0.0278, 0.052, and 0.0023 for spring, summer, autumn, and winter, respectively. Similarly, both the XGB and the RF models demonstrated satisfactory performance across other layers, with R2 ranging from 0.81 to 0.95, 0.80 to 0.98, and 0.82 to 0.91 for the 3, 5, and 10 km layers, respectively. Performances of models generally tend to decrease in the upper layers compared to the lower layers due to the prevalent types and sizes of existing aerosols throughout most of the year, with aerosol distribution in Europe predominantly concentrated within the 1.5 and 3 km atmospheric layers. Consequently, R2 and R metrics demonstrate higher values in these layers compared to the 5 and 10 km layers. Conversely, RMSE and MAE metrics are elevated at the 1.5 and 3 km layers but lower at the 5 and 10 km layers. This pattern arises from the typically higher aerosol concentrations occurring in the lower atmospheric layers, juxtaposed with lower AOD values observed in the 5 and 10 km layers.
However, the XGB annual model exhibited strong performance, achieving RMSE values of 0.0091, 0.0134, 0.0066, and 0.0059 and R2 values of 0.993, 0.974, 0.985, and 0.981. Similarly, the RF annual model produced notable results, with R2 values of 0.98, 0.962, 0.939, and 0.968, along with RMSE values of 0.015, 0.010, 0.0112, and 0.0066. In conclusion, annual models demonstrate consistently high predictive accuracy, with XGB showing slightly stronger performance in terms of both R2 and RMSE. The minimal RMSE and high R2 values indicate that both models effectively capture the multi-layer AOD values across the altitude layers on an annual basis. Compared to seasonal models, the annual models offer greater stability and reduced variability, as they are less affected by seasonal meteorological changes that can alter aerosol distribution, such as summer convection and winter temperature inversions. This consistency in annual performance provides a more reliable basis for long-term AOD retrieval, making annual models preferable for retrieving multi-layer AOD values for SEVIRI data. Therefore, we regarded the annual models as the desired models for retrieving multi-layer AOD values of SEVIRI.
4.1.4 Comparison of the models
Figure 7 presents scatterplots illustrating multi-layer AOD values estimated using the proposed annual XGB (Fig. 7a–d) and RF (Fig. 7e–h) models compared with CALIOP-retrieved AOD profiles over the European troposphere in 2019. Each subplot includes the number of points and mentioned metrics, i.e., R2, R, RMSE, MAE, bias, and linear regression equations, to facilitate clear and thorough analysis.
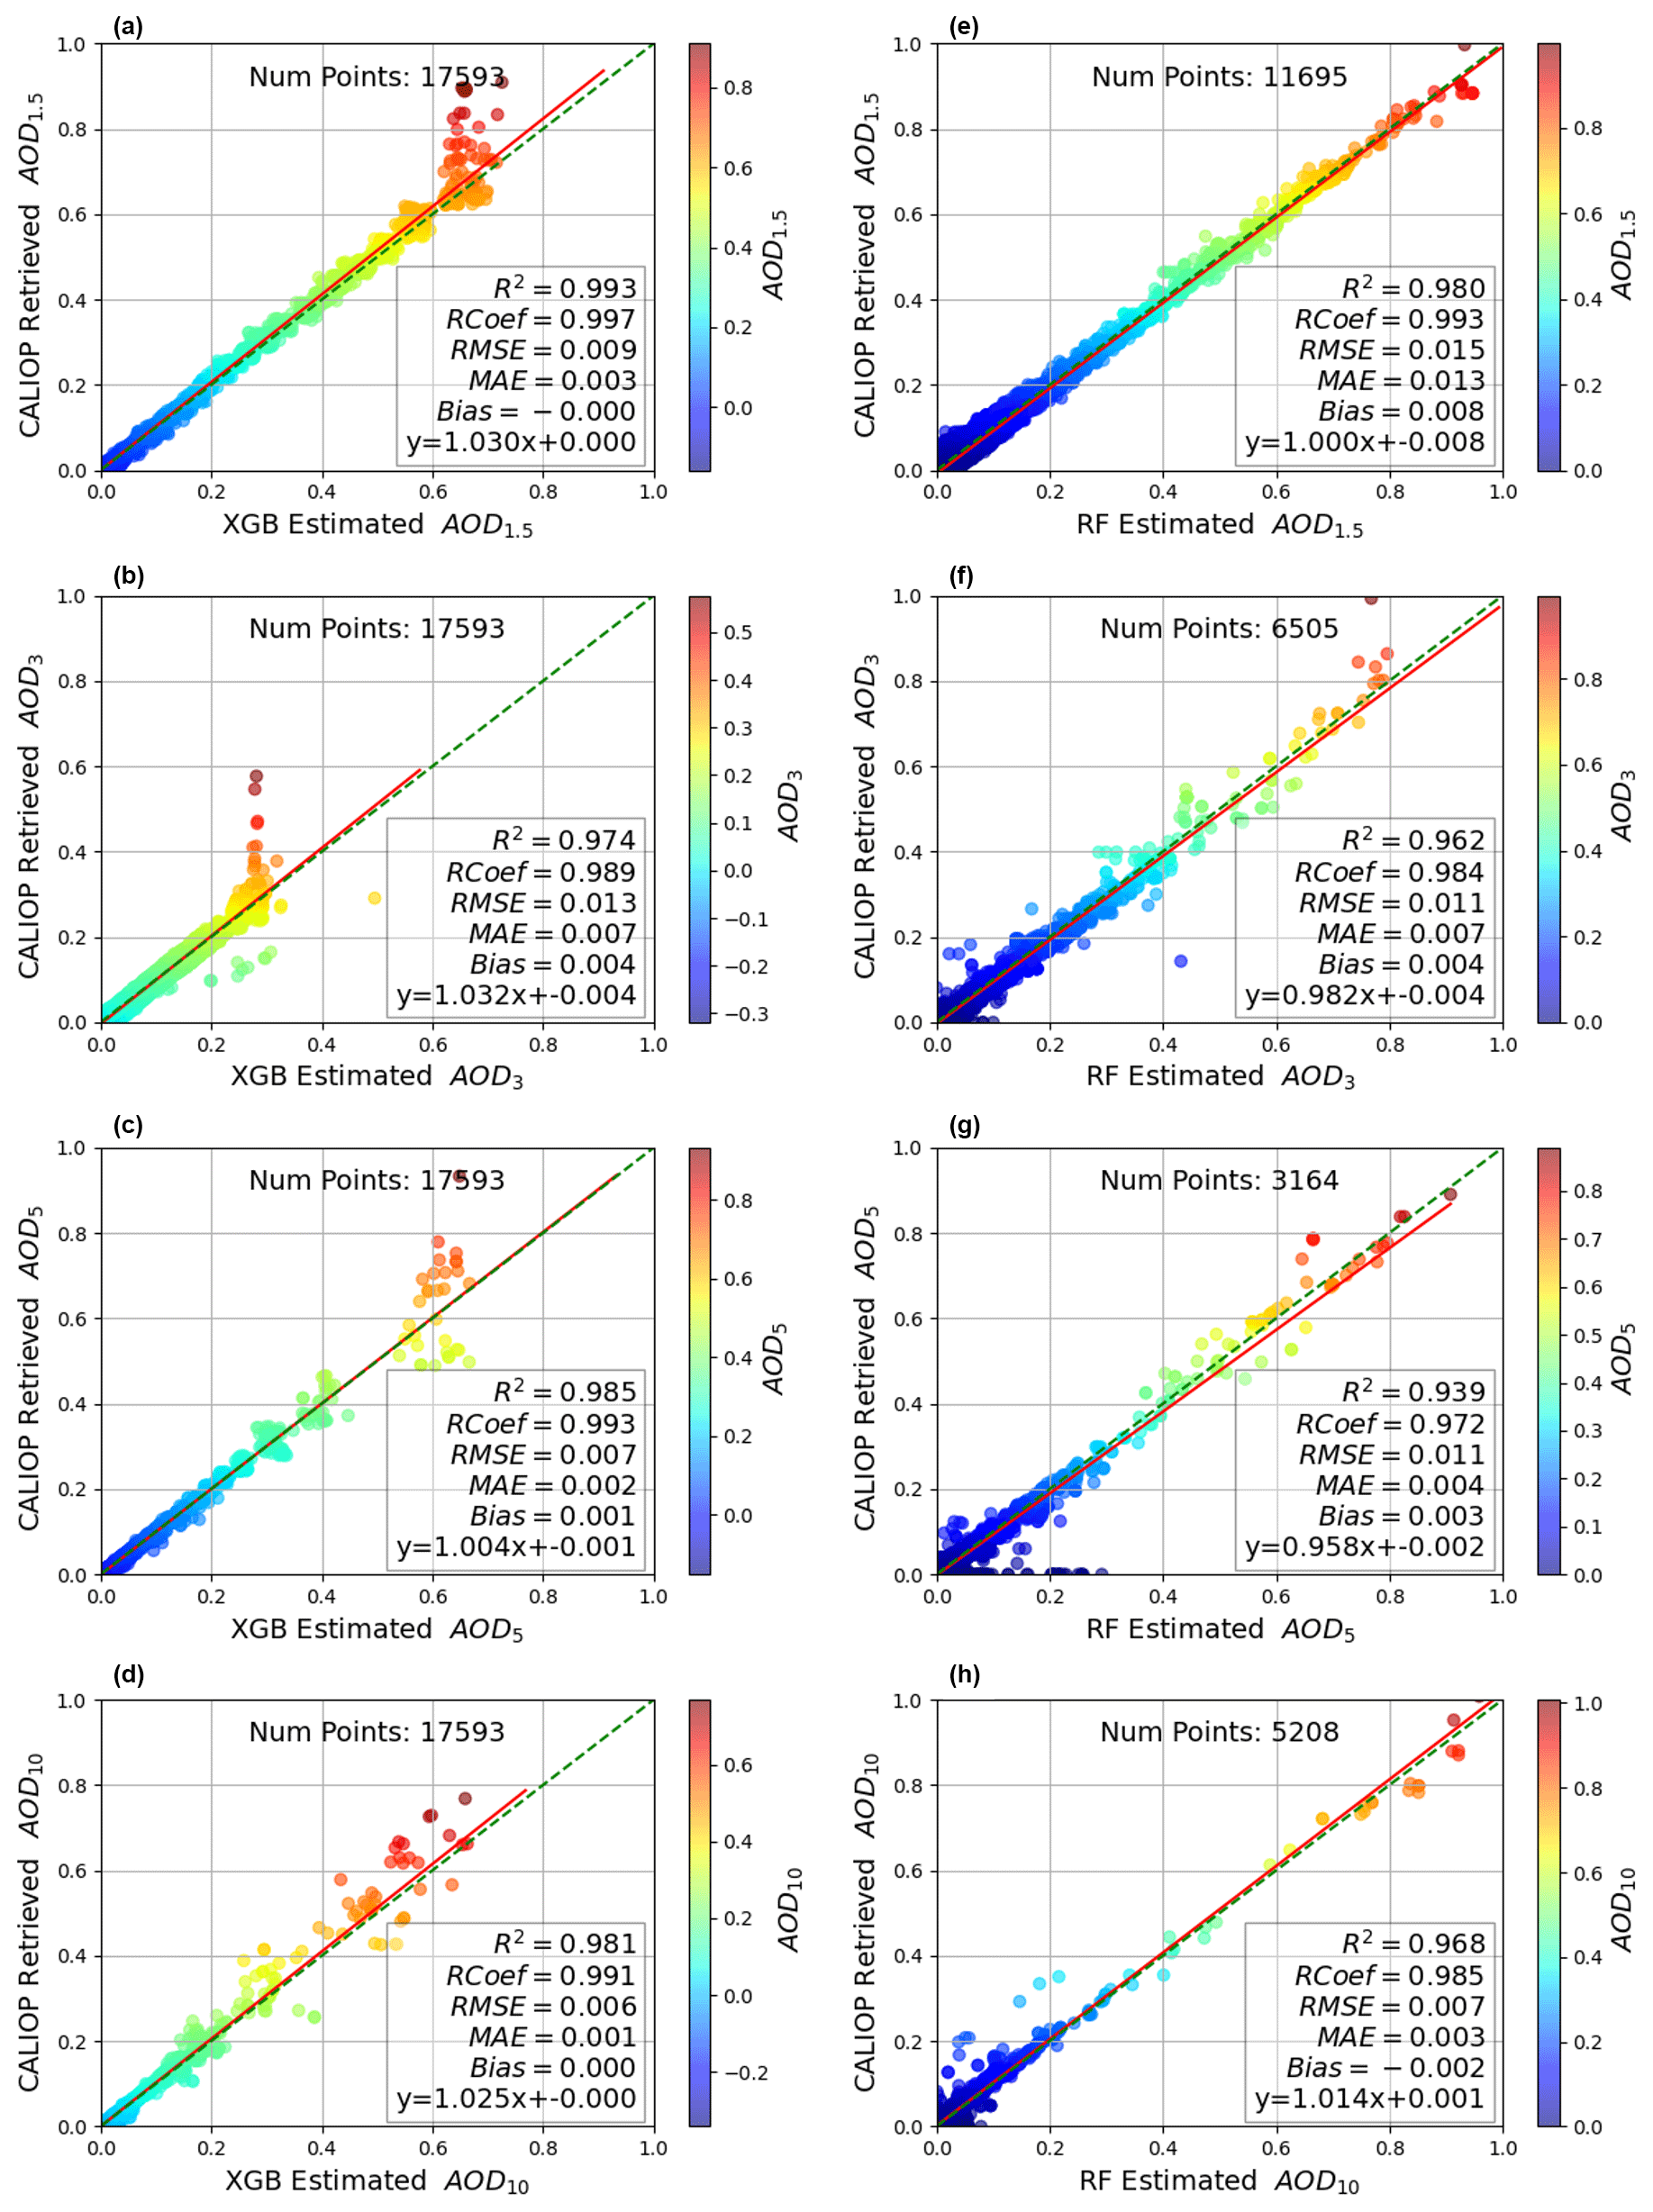
Figure 7Scatterplots comparing the estimated SEVIRI multi-layer AOD values derived from the proposed machine learning models with the CALIOP AOD profiles for the year 2019. The red line represents the linear fit between the two datasets.
Both models exhibit a strong correlation between the estimated values and retrievals. However, the XGB model demonstrates slightly superior performance, with R2 (R) values of 0.993, 0.974, 0.985, and 0.981 (0.997, 0.989, 0.993, and 0.991) for the 1.5, 3, 5, and 10 km layers, respectively. In comparison, the RF model shows lower R2 (R) values of 0.980, 0.962, 0.939, and 0.968 (0.993, 0.984, 0.972, and 0.985) for the same layers. The XGB model consistently outperforms in estimating AOD across all layers. However, the RF model demonstrates relatively higher accuracy in the 1.5 km layer compared to other layers, highlighting a significant performance gap when compared to XGB. Overall, the minimal variation in R2, R, RMSE, and MAE across the models suggests comparable estimation capabilities. However, a detailed analysis reveals the superior accuracy of the XGB model in capturing AOD values, as evidenced by the slope values in Fig. 7a–d. In contrast, the slope values in Fig. 7e–h indicate that the RF model tends to slightly underestimate AOD values. In summary, while both models demonstrate proficiency, the XGB model outperforms the RF model, particularly in its accuracy for higher-altitude layers, thereby providing more reliable AOD estimations.
4.2 Validation of estimated AOD with ground lidar retrievals
To further validate our top-performing models, annual XGB and RF, we conducted an extensive analysis using data from eight EARLINET stations across Europe in 2020. We analyzed pixels within a 3 km radius of each station to compare and validate SEVIRI multi-layer AOD estimates against EARLINET values. Figure 8 presents the comparison using linear regression and validation metrics, with scatterplots for AOD at four layers. The XGB model demonstrates stronger agreement with EARLINET profiles, achieving R2 values of 0.86, 0.79, 0.75, and 0.59 and RMSE values of 0.02, 0.01, 0.01, and 0.005. In contrast, the RF model shows weaker correlations, with R2 values of 0.83, 0.26, 0.52, and 0.16 and RMSE values of 0.024, 0.022, 0.021, and 0.007. This can be attributed to XGB's ensemble nature and its ability to reduce bias through boosting, enabling it to handle complex and diverse datasets more effectively (Ahmed et al., 2023).
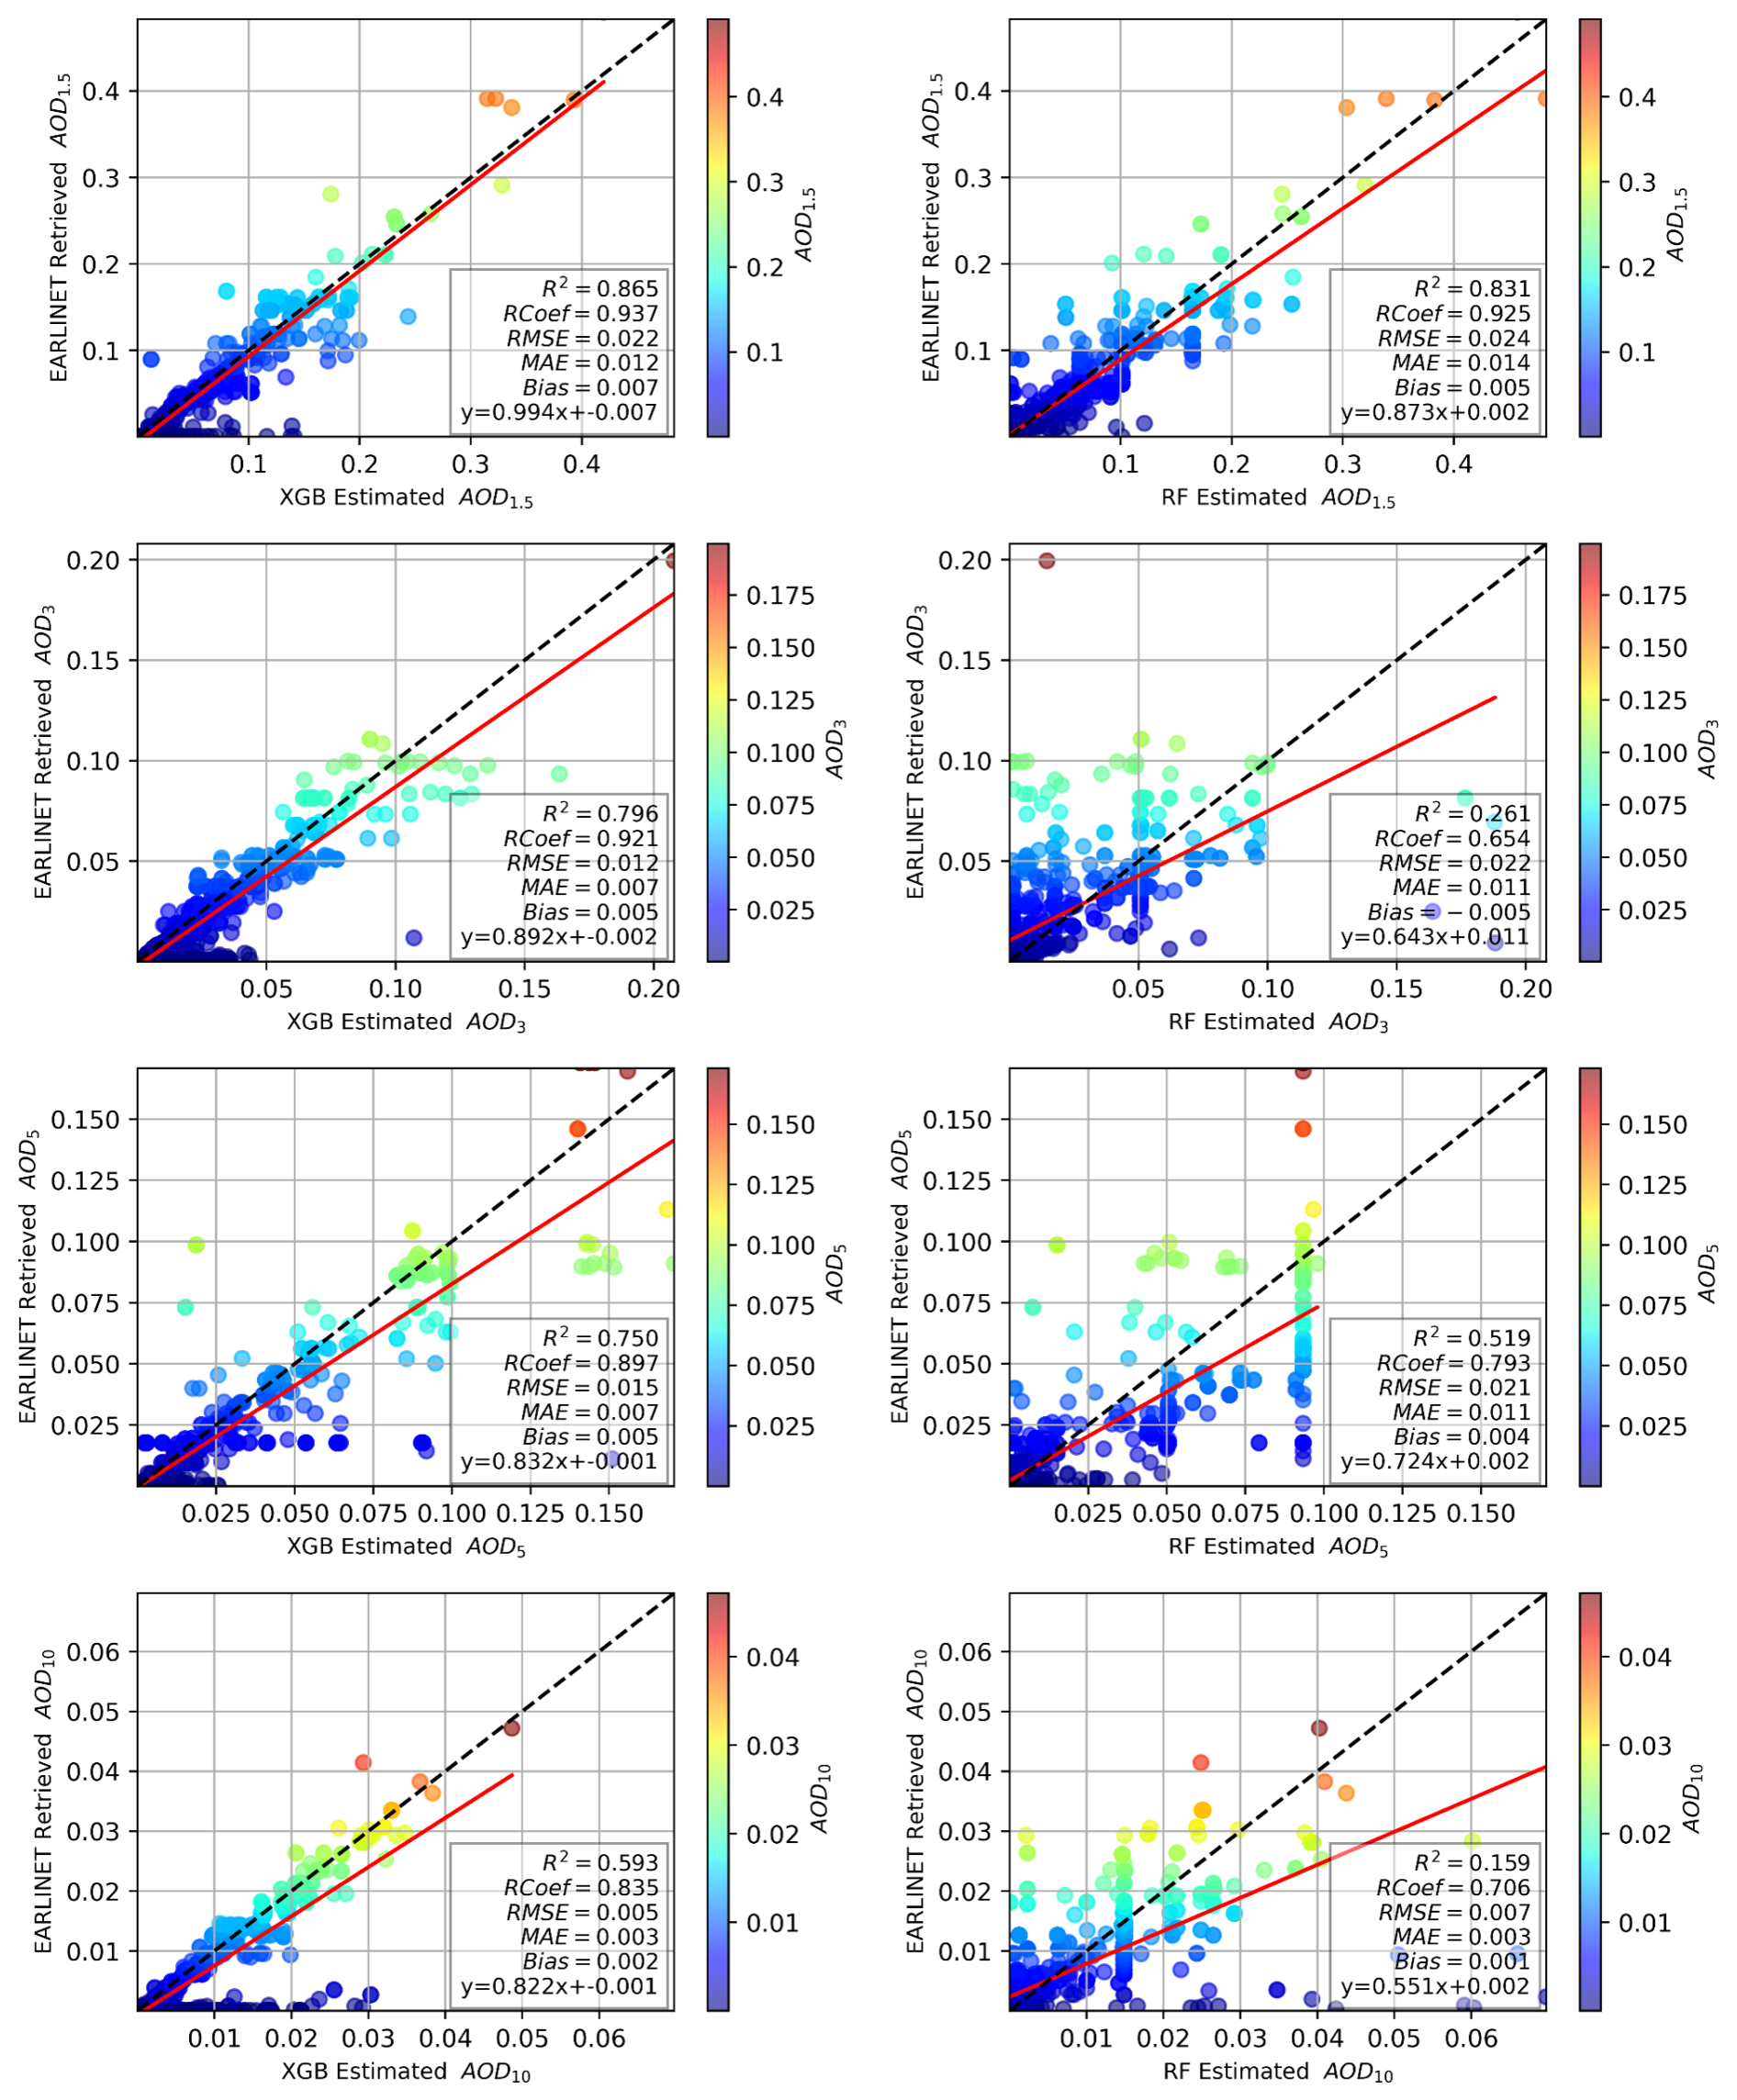
Figure 8Scatterplots comparing the estimated SEVIRI multi-layer AOD values derived from the proposed machine learning models with the EARLINET AOD profiles across eight specified stations in Europe for the year 2020. The red line represents the linear fit between the two datasets. Note that the scales of the subplots vary due to the different ranges of AOD values at the various vertical layers (1.5, 3, 5, and 10 km).
When comparing the R2 metrics of XGB AODs across different layers, it was found that XGB AODs exhibited lower R2 values with EARLINET at the 10 km layer but showed significant improvement at the 1.5, 3, and 5 km layers, with R2 values of 0.86, 0.79, and 0.75, respectively. This indicates a stronger correlation between XGB AOD estimations and EARLINET retrievals in these layers compared to the 10 km layer, which had an R2 value of 0.593. This trend is consistent with other evaluation metrics. Closely scrutinizing Fig. 8, it becomes apparent that there are specific points revealing notable discrepancies between EARLINET and XGB AOD values. To determine the root cause of these outliers, the data were color-coded based on AOD values, revealing that the majority of outliers occurred when EARLINET retrieved low AOD values in each layer. At these points, the XGB model tends to overestimate. This tendency contributed to a low R2 value (0.593) in the linear regression for the 10 km layer, as this layer contains small AOD values (0–0.05). Furthermore, the slope of the regression line for the XGB model ranges from 0.82 to 0.99, indicating that for every unit increase in the estimated values, the corresponding EARLINET AOD values increase by slightly less than one unit. This suggests a tendency for the XGB model to overestimate EARLINET AOD across all layers.
The statistical analysis of EARLINET AOD profiles at the eight specified stations, alongside estimated AOD values, is comprehensively presented in Table 4. The number of analyzed pairs (N) varies across stations, ranging from 12 at HPB to 387 at ATZ, providing robust validation of estimated AOD values with EARLINET AOD profiles. Metrics such as RMSE, MAE, and bias offer valuable insights into model performance at each station. A detailed analysis of the data reveals that the values of these metrics across the four layers are not consistently identical.
Table 4Station-based statistical analysis of XGB-estimated SEVIRI vs. retrieved EARLINET AOD values. All metric values are scaled by .
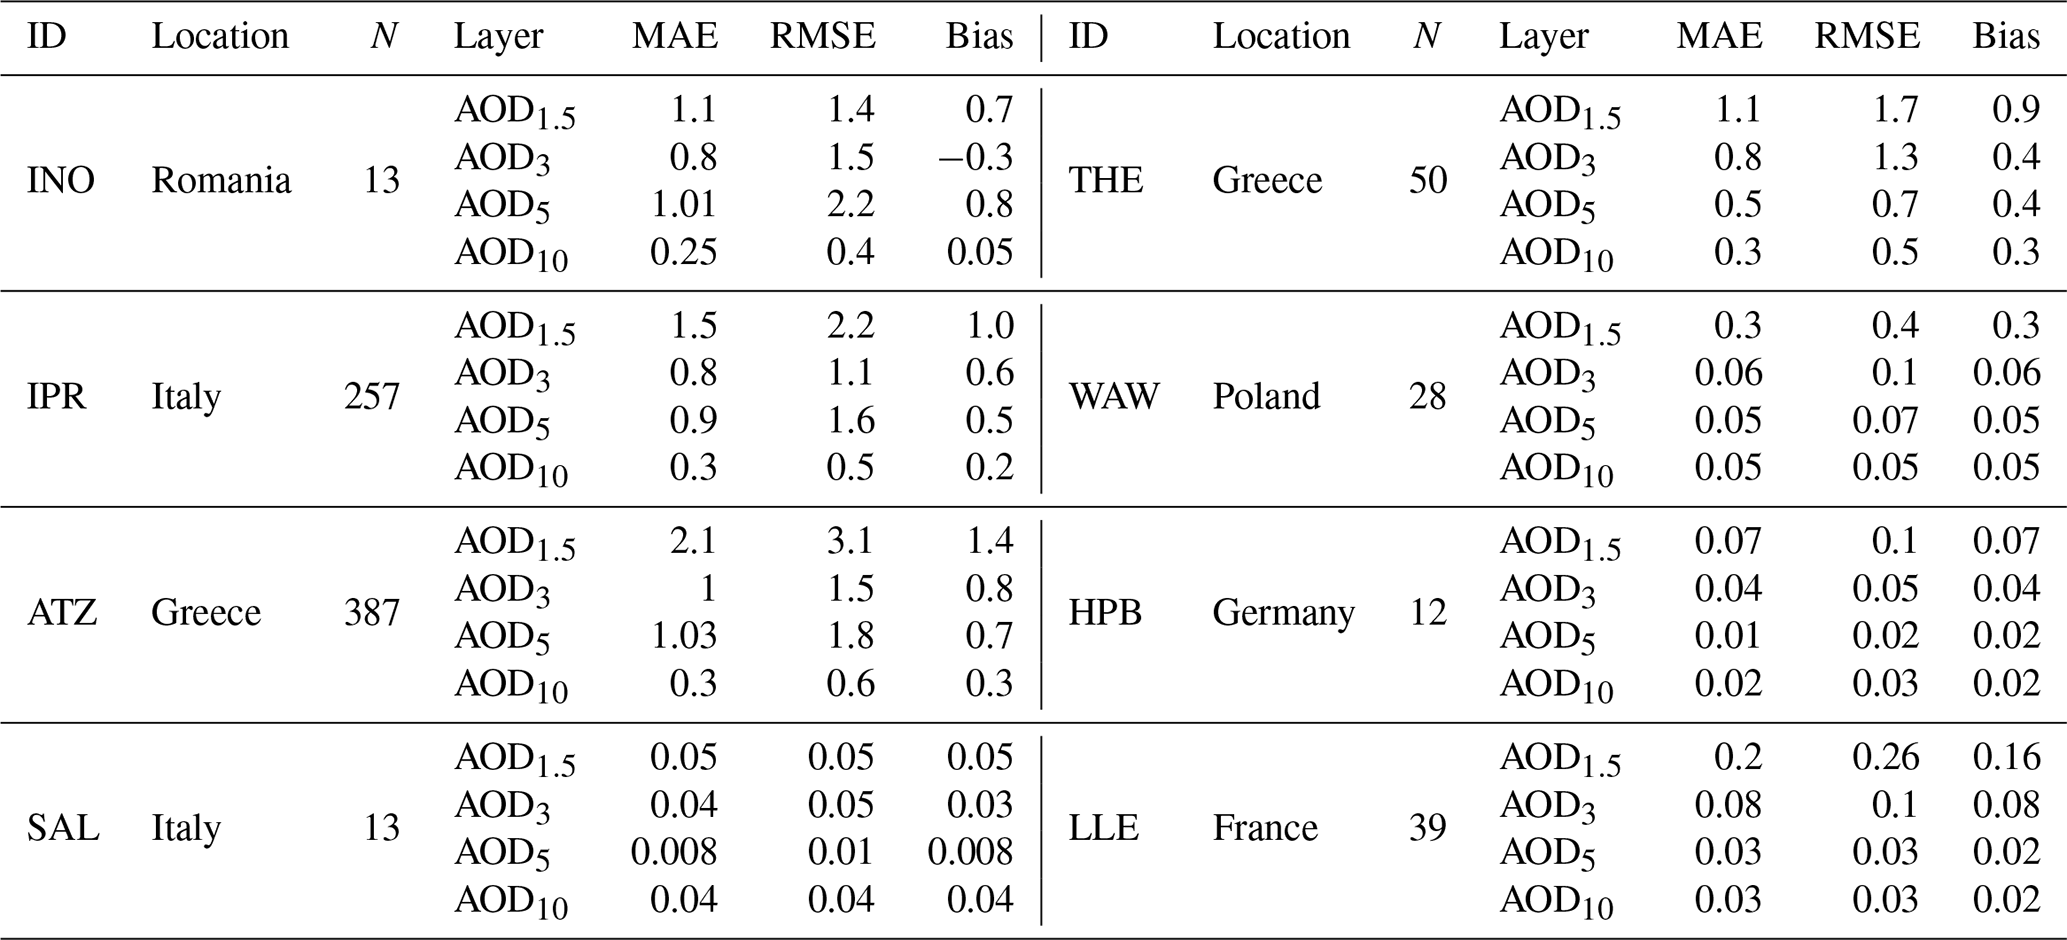
Performance varies significantly across stations and layers, with notable discrepancies observed at ATZ (Greece), particularly at the 1.5 km layer, which exhibits the highest RMSE of . The substantial bias at this station indicates that the model tends to consistently overestimate the AOD at this altitude. Conversely, performance improves at 3 and 5 km, with RMSE values of and , respectively. At this station, the model demonstrates the best performance at the 10 km layer, with an RMSE of , compared to the other layers. These variations are likely due to frequent forest fires in Greece, as most smoke from these fires remains in the lower layers of the atmosphere (Nicolae et al., 2019). In contrast, the XGB model generally performs well at the SAL, HPB, and LLE stations, where both RMSE and bias are minimal. The RMSE at the 1.5 km layer, ranging from to at the IPR, WAW, INO, and THE stations, alongside the low RMSE and bias values across other layers, demonstrates good overall model performance at these stations. A closer examination reveals that RMSE and bias metrics are often elevated at the 1.5 and 3 km layers but lower at the 5 and 10 km layers. This pattern arises from the typically higher aerosol concentrations in the lower atmospheric layers compared with lower AOD values retrieved in the 5 and 10 km layers.
The discrepancies between the estimated and retrieved values could stem from the different measurement techniques employed by satellite and ground-based systems. EARLINET utilizes ground-based lidar systems to capture backscattered light from aerosols within the atmosphere by looking upward, whereas satellite measurements are performed from above, looking down. In this configuration, the lower atmospheric layers attenuate the lidar signal, resulting in reduced power to penetrate the upper layers. This attenuation can complicate the detection of aerosols in the upper layers (Grigas et al., 2015; Nicolae et al., 2019). Furthermore, these limitations may be attributed to the constraints associated with the utilization of CALIOP AODs, particularly their reduced precision in low-aerosol-concentration scenarios. This reduced precision arises from the low signal-to-noise ratio under clean weather conditions, which is often insufficient to accurately detect weak aerosol layers on the aerosol extinction vertical profile. Because both transmitted and scattered light must traverse this portion of the atmosphere, highly diffuse and/or tenuous scattering aerosol layers below the CALIOP detection threshold are ignored in CALIOP's estimates of column AOD. Consequently, weak aerosol layers that are not detected would not be retrieved, leading to decreased retrieved AODs under clean weather conditions (B. Liu et al., 2018; C. Liu et al., 2018).
Finally, the efficacy of the XGB model is clearly demonstrated by its ability to reliably estimate multi-layer AOD values compared to EARLINET-retrieved AOD profiles across various European regions.
4.3 Qualitative validation
For qualitative validation of the estimated multi-layer AOD values, two distinct approaches were utilized. The first approach involved a visual comparison of the spatial trends of the estimated AOD values with CALIOP AOD retrievals for 4 specific days across various seasons in 2019: 3 March (11:57 UTC), 30 April (12:42 UTC), 13 June (10:57 UTC), and 31 October (12:27 UTC). The second approach concentrated on two noteworthy aerosol events: a significant dust intrusion that occurred over Europe from 13 to 18 March 2022 and a volcanic eruption at Mount Etna in Italy on 14 August 2023. For these events, the estimation model generated multi-layer AOD values at 15 min intervals. This high temporal resolution enabled detailed analysis of aerosol behavior within each layer during these events.
Conducting the qualitative validation for an entire scene within the first approach is challenging due to the spatial and temporal resolution constraints of CALIOP. To address this limitation, SEVIRI scene pixels corresponding to CALIOP overpasses with temporal differences of less than 4 min were compared on the specified days. The results, illustrated in Fig. 9, indicate that the spatial trends of the estimations generally align well with the trends of CALIOP AOD retrievals in regions with both high and low AOD values across the four seasons. This alignment highlights the model's ability to provide reliable AOD estimates with enhanced temporal resolution, effectively complementing CALIOP AOD retrievals.
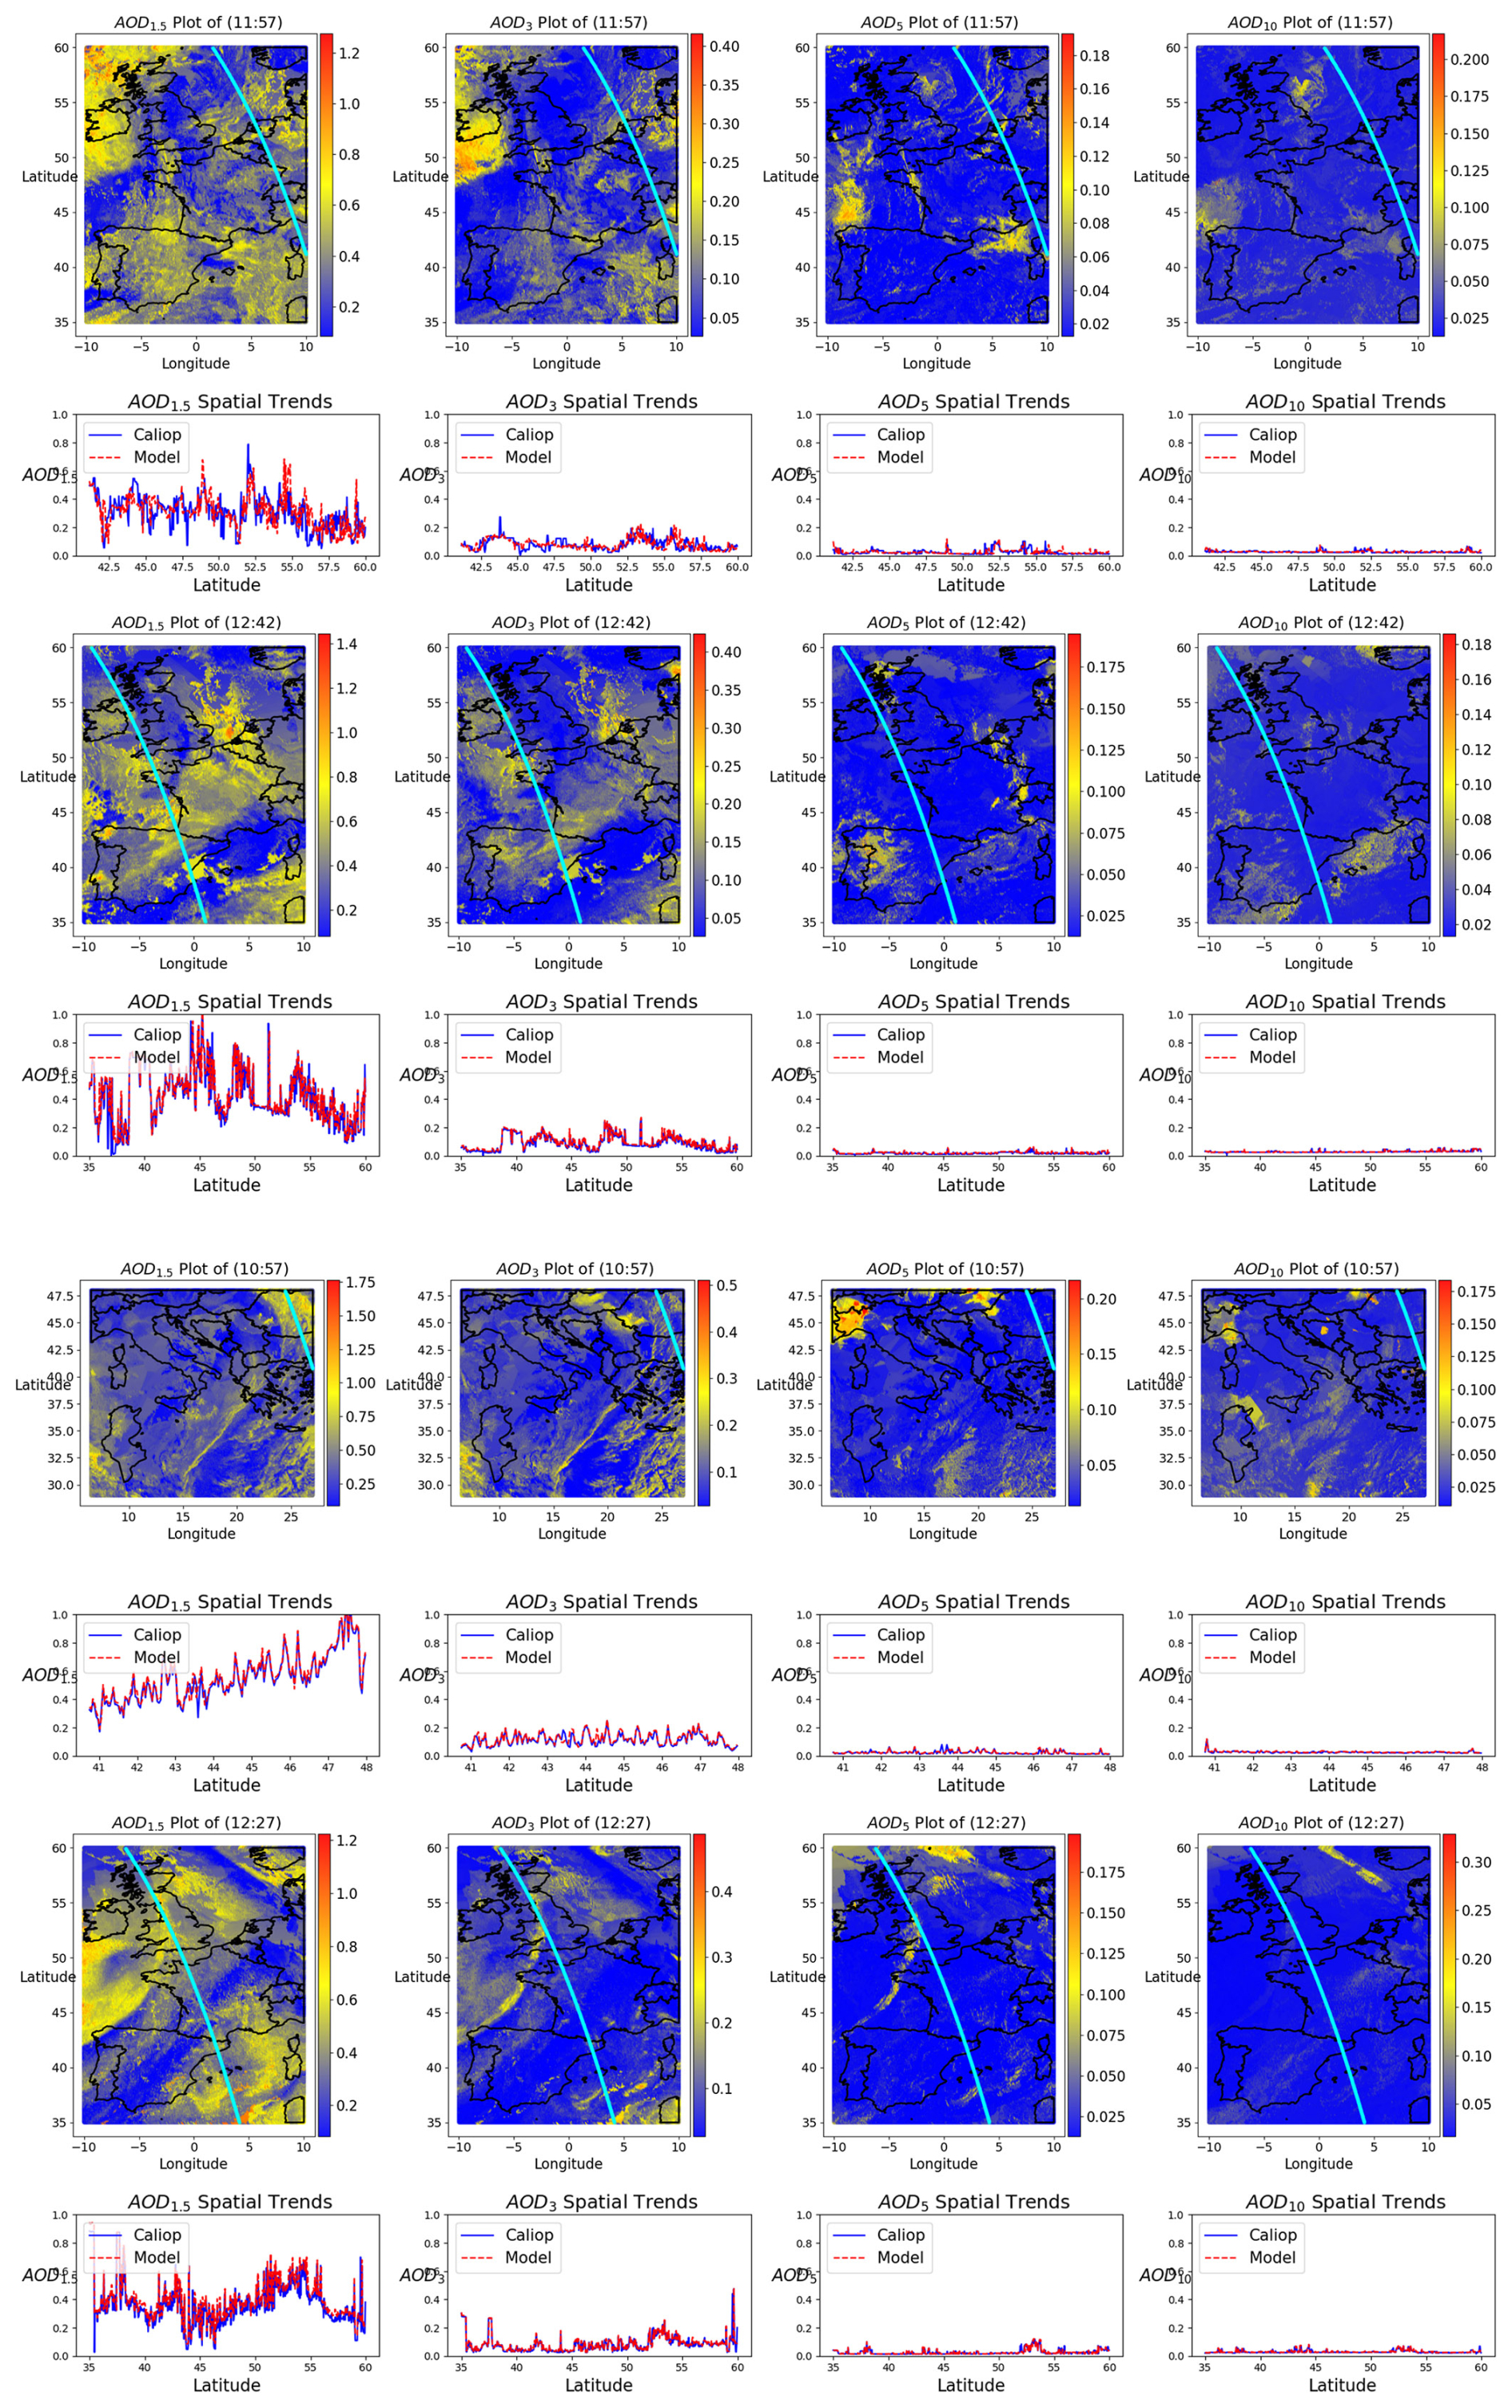
Figure 9Spatial distributions and trends of SEVIRI-retrieved multi-layer AOD values compared to CALIOP retrievals for 4 specific days on 3 March (11:57 UTC), 30 April (12:42 UTC), 13 June (10:57 UTC), and 31 October (12:27 UTC) across various seasons in 2019.
The subsequent approach for qualitative validation of the model on a regional scale involved analyzing two aerosol events. The first event examined was a substantial Saharan dust plume that traversed western and central Europe between 13 and 18 March 2022. SEVIRI scenes captured during this event, illustrated in Fig. 10, were visualized at specific hours to assess how well the aerosol vertical dispersion behavior aligned with the dynamic characteristics of the event.
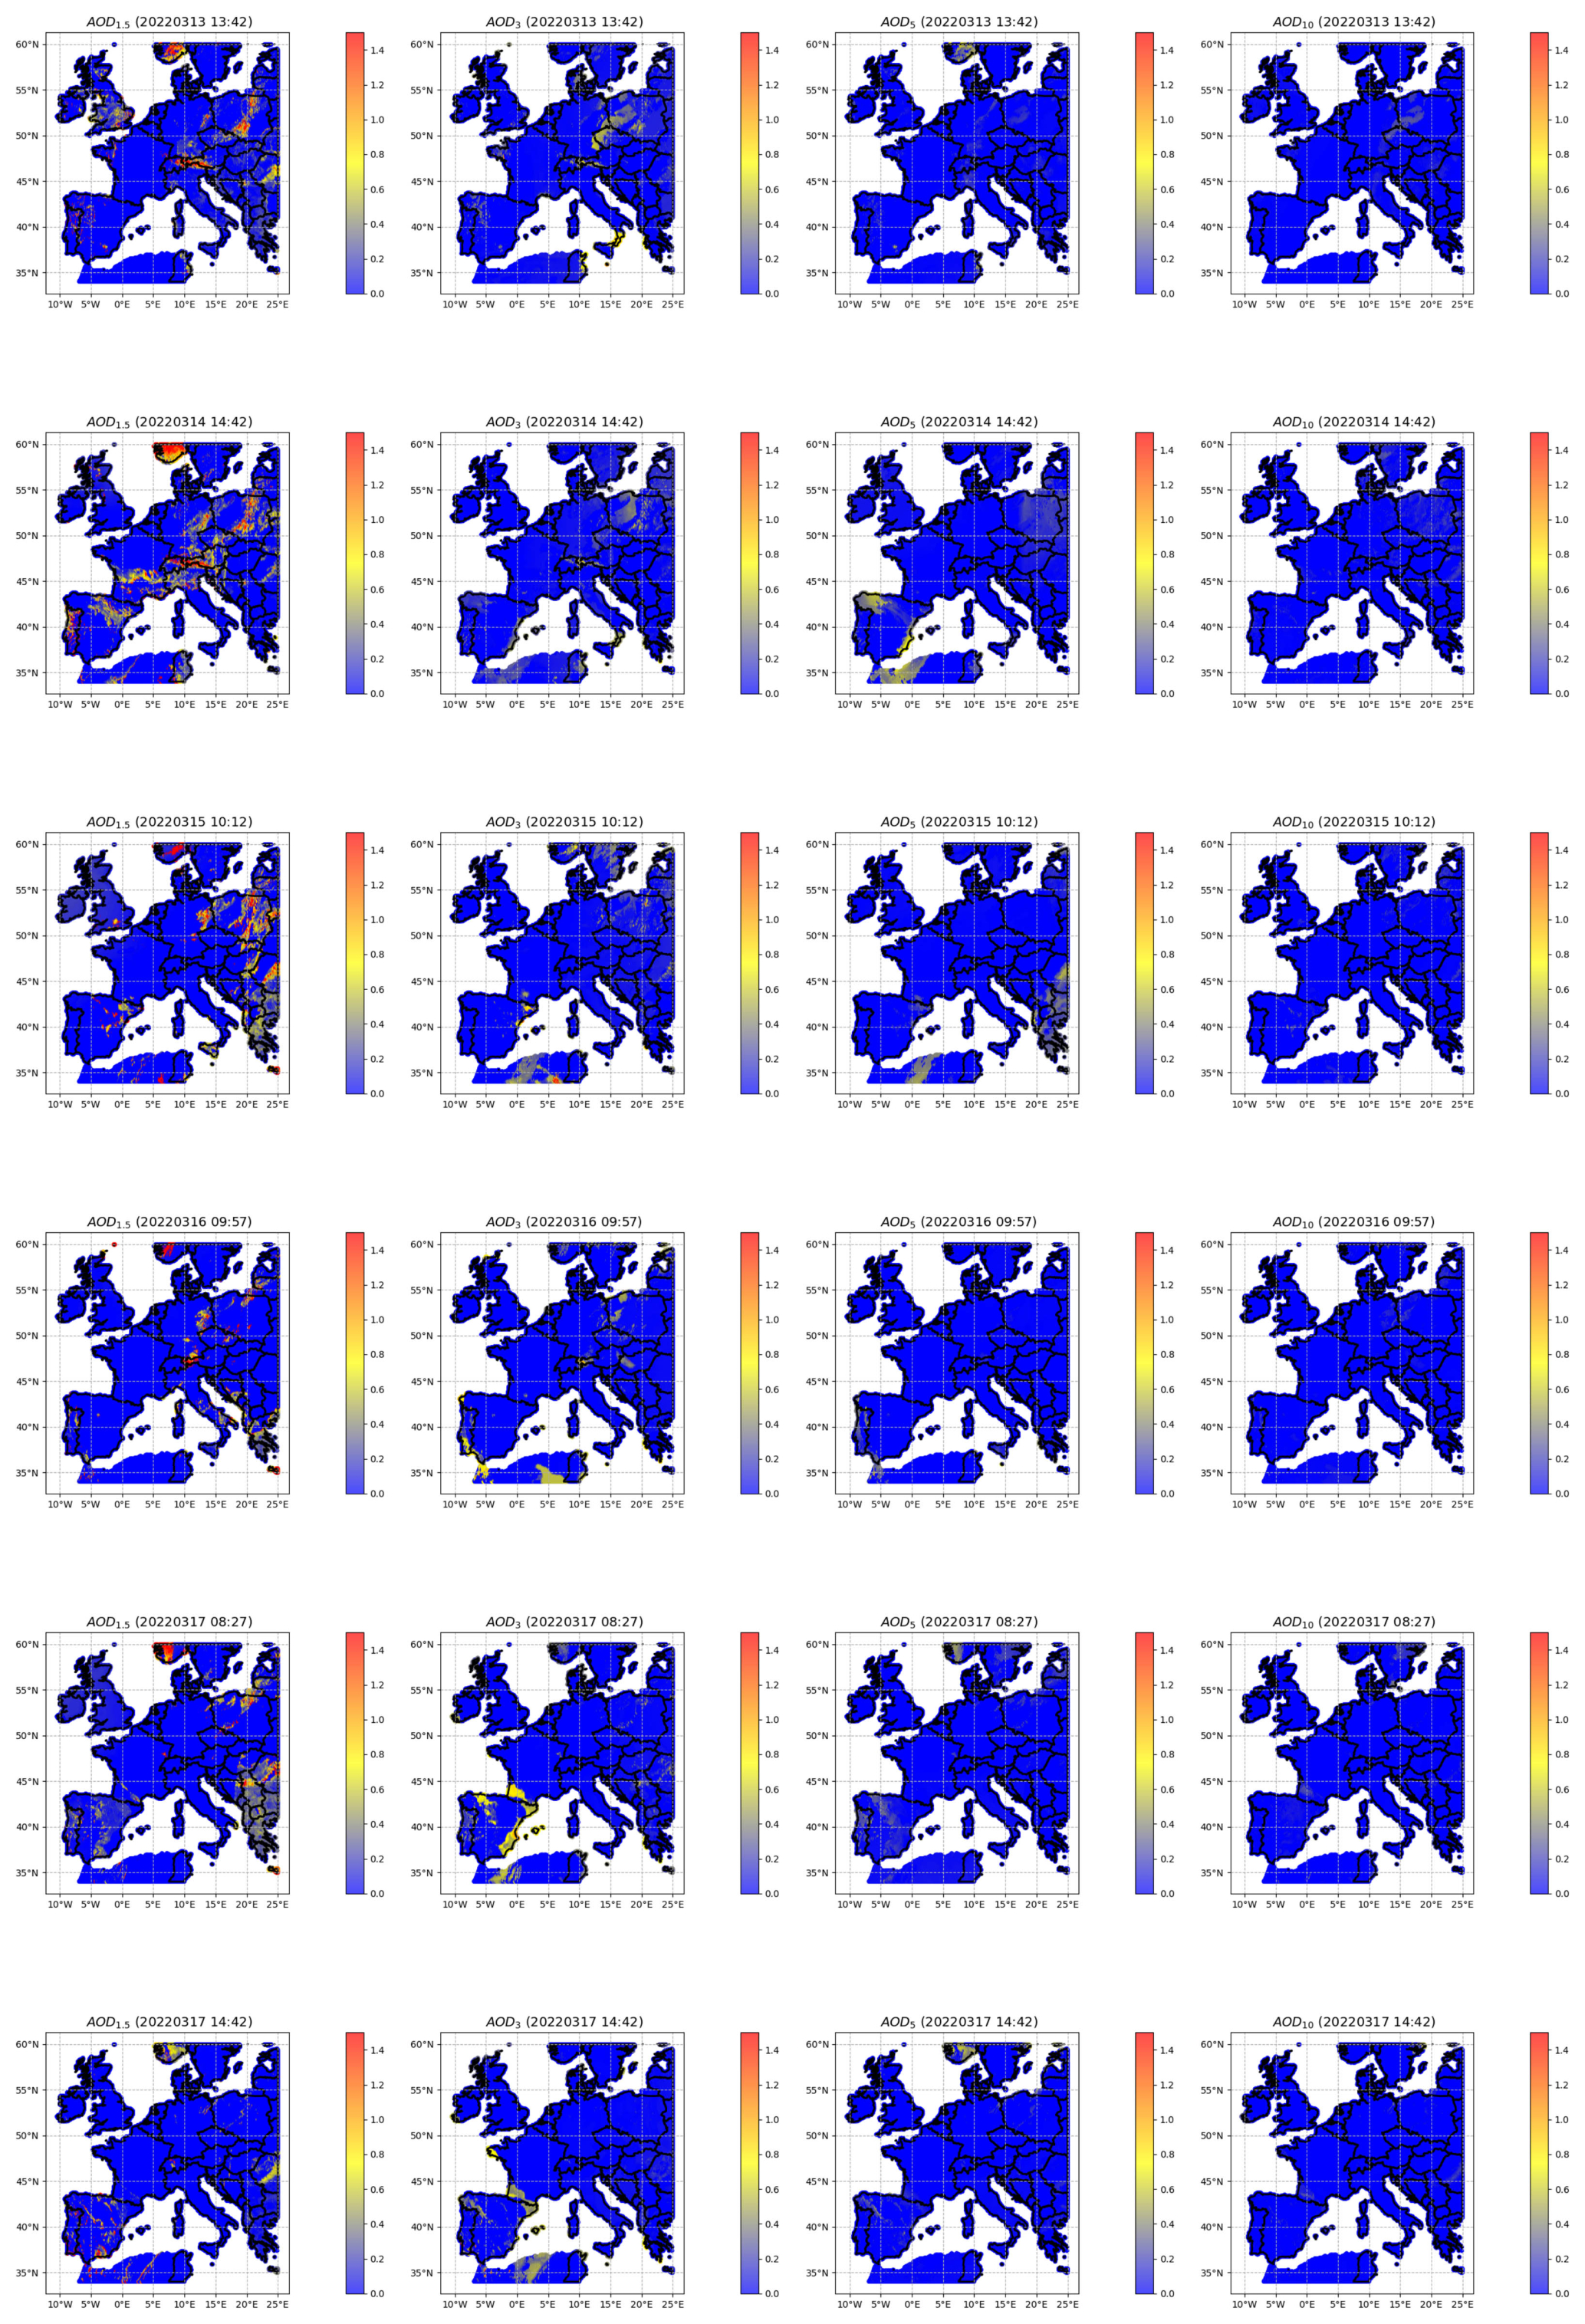
Figure 10Spatial distributions of SEVIRI-estimated multi-layer AOD values during the Saharan dust event from 13 to 18 March 2022, at selected times.
On 13 March, at 13:42 UTC, the event is characterized by concentrated aerosol presence at 1.5 km over southern Europe, particularly Spain, Italy, and the Mediterranean, with progressive dispersion at higher altitudes reaching central Europe. By 14 March at 14:42 UTC, the dust plume expands further into central and northern Europe at 1.5 km, while mid-altitudes (AOD3 and AOD5) show notable aerosol presence over the Iberian Peninsula and central Europe, reflecting the dust's horizontal transport. At 10 km, concentrations remain low, indicating limited vertical penetration. Comparing these 2 d reveals a clear intensification and northward progression of the plume. On 15 March, at 10:12 UTC, AOD1.5 shows sustained high concentrations over southern Europe, with increased impact in southeastern Europe, including the Balkans. At mid-levels, the plume spreads further into central and eastern Europe, reaching countries like Germany and Poland, while at 10 km, faint concentrations persist over parts of southern and central Europe. By 16 March at 09:57 UTC, the plume shows signs of dissipation, with reduced intensity at 1.5 km across Spain, Greece, and the Mediterranean and weaker signals at mid-altitudes over central Europe. On 17 March at 08:27 UTC, the dust plume is confined mainly to southern Europe at lower altitudes, while mid-altitudes exhibit limited spread and intensity, and 10 km shows negligible influence.
Finally, the spatial distributions on 18 March at 14:42 UTC, as shown in the figure, reveal a significant reduction in aerosol concentrations at all altitudes. At 1.5 km, the AOD values remain notable over southern Spain and the western Mediterranean but are much weaker compared to earlier days. At 3 km, the dust plume is localized over the Iberian Peninsula, with faint traces extending toward southeastern Europe. Higher altitudes, represented by AOD5 and AOD10, exhibit very low concentrations, indicating minimal vertical transport of the dust on the final day of the event. This vertical behavior, compared to earlier days, reflects the dissipation phase of the Saharan dust plume, as atmospheric processes like mixing, dilution, and deposition progressively weaken its intensity. Additionally, during the Saharan dust event, sub-hourly estimated multi-layer AOD values for the European continent (from 07:12 to 16:12 UTC daily on 18 March 2022) were compiled into an animation that includes 37 SEVIRI scenes over Europe, as shown in Pashayi et al. (2025a) (https://doi.org/10.5446/69730).
The other event in this approach is the Mount Etna eruption, located on the eastern coast of Sicily, Italy, one of the most active volcanoes in the world and a prominent feature in the Mediterranean region. On 14 August 2023, Mount Etna erupted in a significant volcanic event that released vast quantities of ash and aerosols into the atmosphere. This eruption produced an ash plume reaching up to 8200 m above the crater and spreading southward over the Mediterranean. The event provided another opportunity to visualize the aerosol vertical dispersion behavior aligned with the dynamic characteristics of the event. The AOD spatial distribution maps in Fig. 11 revealed distinct layers of aerosol, with a clear upward transport of particles, especially in the lower- to mid-level layers (1.5 to 3 km) at 07:27 UTC, suggesting strong vertical convective activity driven by the eruption's intensity. As time progressed, the AOD values in the upper layers increased, particularly at the 5 km altitude around 08:27 UTC, signalling a greater vertical transport of aerosols. This upward transport continued throughout the day, with the highest values observed at 10 km by 09:57 UTC, suggesting the plume had reached greater altitudes. By 13:42 UTC, the AOD values in the 10 km layer were at their peak, reflecting the maximum extent of vertical transport before the aerosols began to disperse more horizontally. After this point, the plume's vertical extent started to decrease (15:57 UTC), likely due to the long-distance transport of the aerosols across the Mediterranean region. This multi-layer analysis highlights the dynamic behavior of volcanic aerosols, providing valuable insight into their dispersal patterns. An animation of sub-hourly SEVIRI multi-layer AOD estimations during the eruption (from 07:27 to 15:57 UTC) was also generated, represented as a video in Pashayi et al. (2025b) (https://doi.org/10.5446/69731), providing a detailed view of the plume's evolution over time.
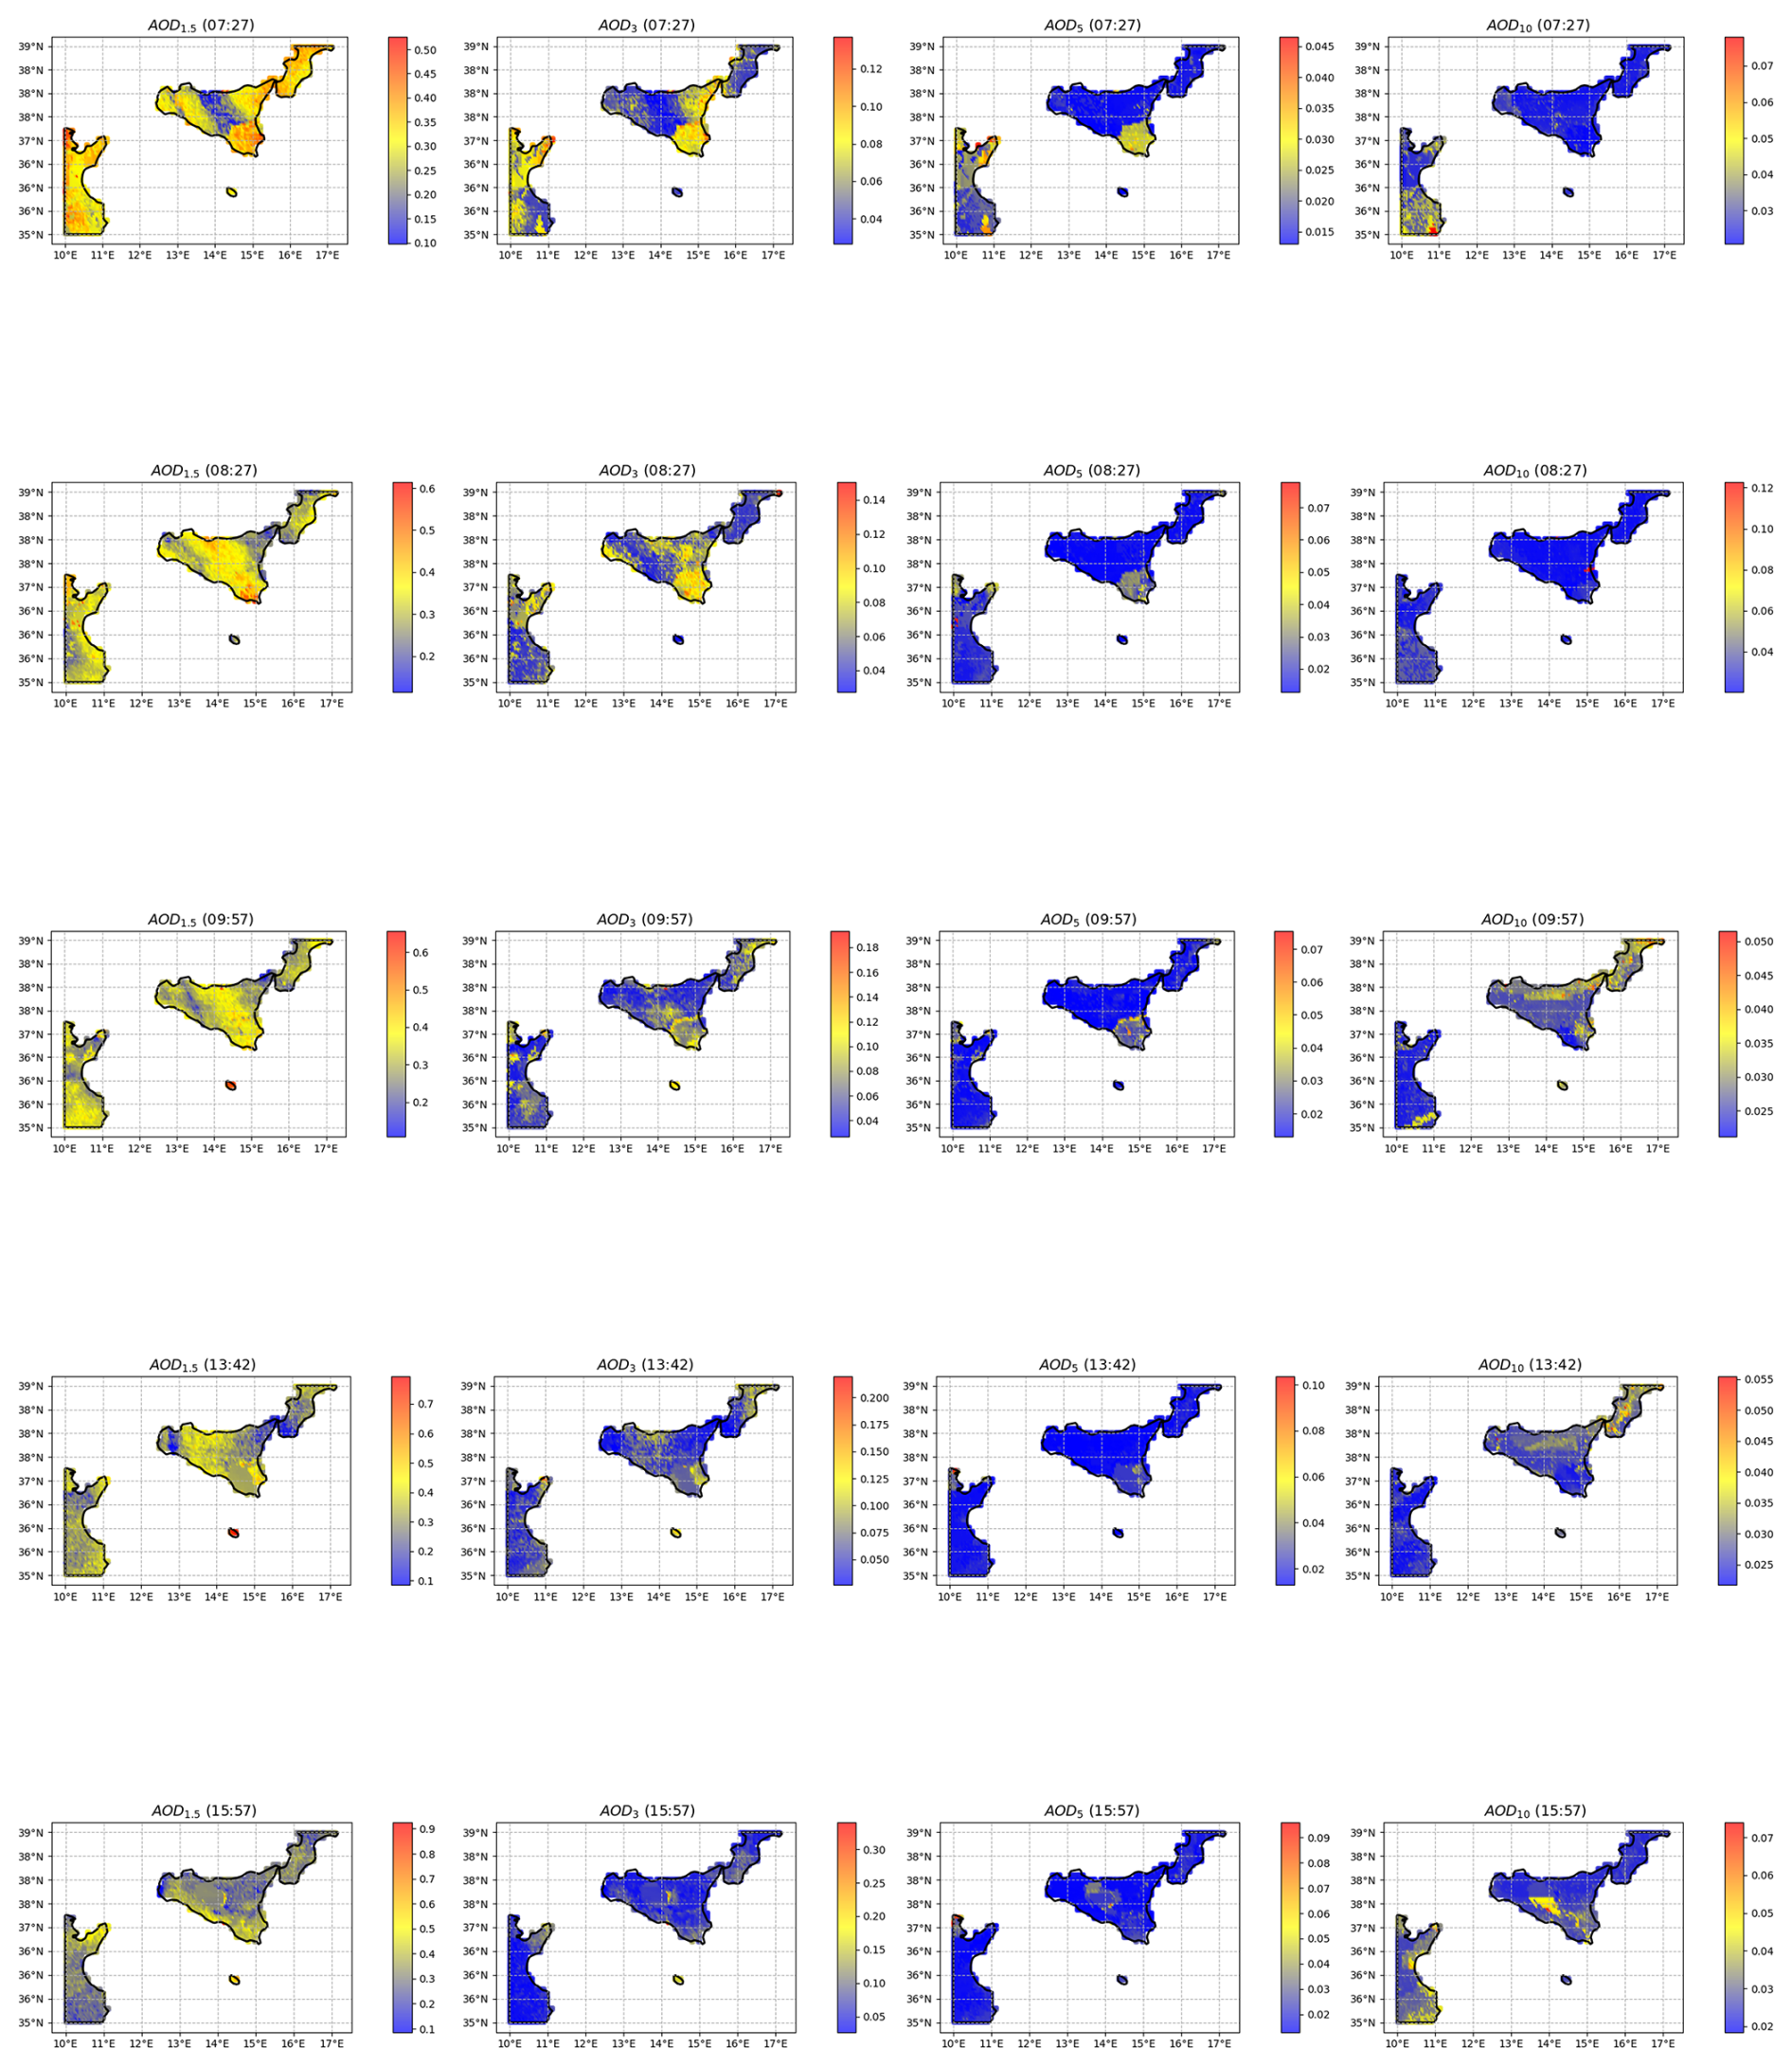
Figure 11Spatial distributions of estimated multi-layer AOD values during the volcanic eruption on 14 August 2023, at selected times.
This study proposes a model that integrates satellite TOA reflectance data from the SEVIRI sensor, meteorological data, and land cover to estimate AOD across distinct altitude layers at 1.5, 3, 5, and 10 km. Using CALIOP AOD profiles as reference data, RF and XGB models were trained on a dataset spanning 2017 to 2018. The trained models were then used to estimate SEVIRI-based multi-layer AOD values over Europe for 2019 and 2020. The 2019 estimates were compared with CALIOP AOD retrievals, while the 2020 estimates were evaluated against EARLINET AOD retrievals, yielding the following insights.
Both RF and XGB models demonstrate high accuracy in estimating sub-hourly SEVIRI multi-layer AOD values at approximately 15 min intervals. The XGB model shows slightly superior performance, achieving R2 values ranging from 0.97 to 0.99 across different layers when compared to CALIOP and from 0.59 to 0.87 when evaluated against EARLINET retrievals. Incorporating meteorological data such as T, P, Ws, and Wd, along with LC data, during model training significantly enhances the performance of the proposed frameworks. These additional features, often excluded in traditional physical AOD retrieval methods that rely solely on atmospheric radiative transfer models, greatly improve the accuracy of SEVIRI multi-layer AOD estimations. Among the meteorological variables, Ws and Wd are the most influential, resulting in higher R2 values and lower RMSE across all estimated layers.
A qualitative validation was conducted by comparing the spatial trends of the estimated AOD values with CALIOP AOD retrievals. The analysis focused on SEVIRI pixels corresponding to CALIOP overpasses on 3 March, 30 April, 13 June, and 31 October 2019, with temporal differences of less than 4 min. The results demonstrate strong agreement between SEVIRI estimates and CALIOP retrievals across varying AOD levels, highlighting the model's capability to provide reliable high-resolution AOD estimates that effectively complement CALIOP data. Additionally, the study successfully estimated multi-layer AOD at 15 min intervals for two real events – a Saharan dust plume that swept across western and central Europe between 13 and 18 March 2022 and the Mount Etna eruption on 14 August 2023. The results are consistent with the physical characteristics of these phenomena, such as Saharan dust long-range transport in the upper layers of the atmosphere and a gradual increase in AOD values over time from the lower to higher tropospheric layers during volcanic events. This approach enables detailed monitoring of aerosol behavior across vertical layers of the troposphere, providing valuable insights into the dynamics of such events. In conclusion, the XGB model can estimate detailed sub-hourly 3 × 3 km2 multi-layer AOD values, providing valuable insights into aerosol properties.
Our research, centered on the troposphere over Europe and validated with ground- and satellite-lidar-based AOD retrievals, provides a foundation for future studies to develop a more comprehensive approach for multi-layer AOD retrievals by incorporating an ensemble of geostationary meteorological satellites. Moreover, the current framework utilizes a limited range of input features, omitting important variables such as precipitation, NDVI, and land use, which significantly affect AOD dynamics. Future efforts will focus on improving model accuracy by including these additional factors and exploring the potential applications of the model's outputs in areas like aerosol transport analysis, air quality assessment, and climate studies to enhance its practical relevance.
Code and data will be made available on request.
The supplement related to this article is available online at https://doi.org/10.5194/amt-18-1415-2025-supplement.
MP conducted the investigation, designed the experiments, curated and processed the data, and was responsible for programming and evaluation. MP also wrote the original draft. MS was responsible for conceptualization, methodology, supervision, and validation and contributed to the review and editing of the paper. MMS contributed to the conceptualization, supervision, and validation of the work. All authors have read and approved the published version of the paper.
The contact author has declared that none of the authors has any competing interests.
Publisher's note: Copernicus Publications remains neutral with regard to jurisdictional claims made in the text, published maps, institutional affiliations, or any other geographical representation in this paper. While Copernicus Publications makes every effort to include appropriate place names, the final responsibility lies with the authors.
The authors extend their gratitude to the SEVIRI team (https://eoportal.eumetsat.int, last access: 28 October 2024) for their dedicated efforts in developing and continuously improving SEVIRI data products. They also acknowledge the MODIS Science Team for their invaluable work in processing and making available the Collection 6 MODIS Land Cover Dynamics (MCD12Q2) product (https://ladsweb.modaps.eosdis.nasa.gov/, last access: 23 October 2024). We also extend our heartfelt thanks to the CALIOP (https://asdc.larc.nasa.gov/, last access: 28 October 2024) and EARLINET (https://data.earlinet.org/earlinet/, last access: 14 February 2024) profile products for their crucial contribution as benchmarks, validating our model outputs and providing invaluable reference data. Additionally, we express our gratitude to the European Centre for Medium-Range Weather Forecasts (ECMWF) for granting us access to their meteorological dataset (https://cds.climate.copernicus.eu/, last access: 24 October 2024), which greatly enhanced our understanding and modeling of atmospheric conditions.
This paper was edited by Omar Torres and reviewed by two anonymous referees.
Ahmed, A., Song, W., Zhang, Y., Haque, M. A., and Liu, X.: Hybrid BO-XGBoost and BO-RF Models for the Strength Prediction of Self-Compacting Mortars with Parametric Analysis, Materials, 16, 4366, https://doi.org/10.3390/ma16124366, 2023.
Ajtai, N., Mereuta, A., Stefanie, H., Radovici, A., Botezan, C., Zawadzka-Manko, O., Stachlewska, I. S., Stebel, K., and Zehner, C.: SEVIRI Aerosol Optical Depth Validation Using AERONET and Intercomparison with MODIS in Central and Eastern Europe, Remote Sensing, 13, 844, https://doi.org/10.3390/rs13050844, 2021.
Amini, S., Momeni, M., and Monadjemi, A.: Sensitivity analysis of Look-up table for satellite-based aerosol optical depth retrieval, J. Aerosol Sci., 158, 105842, https://doi.org/10.1016/j.jaerosci.2021.105842, 2021.
Benesty, J., Chen, J., Huang, Y., and Cohen, I.: Pearson Correlation Coefficient, in: Noise Reduction in Speech Processing, Springer Topics in Signal Processing, Vol 2, Springer, Berlin, Heidelberg, https://doi.org/10.1007/978-3-642-00296-0_5, 2009.
Berhane, S. A., Althaf, P., Kumar, K. R., Bu, L., and Yao, M.: A Comprehensive Analysis of AOD and its Species from Reanalysis Data over the Middle East and North Africa Regions: Evaluation of Model Performance Using Machine Learning Techniques, Earth Systems and Environment, 1–26, https://doi.org/10.1007/s41748-024-00513-x, 2024.
Bösenberg, J., Ansmann, A., Baldasano, J. M., Balis, D., Böckmann, C., Calpini, B., Chaikovsky, A., Flamant, P., Hagard, A., Mitev, V., Papayannis, A., Pelon, J., Resendes, D., Schneider, J., Spinelli, N., Trickl, T., Vaughan, G., Visconti, G., and Wiegner, M.: EARLINET: a European Aerosol Research Lidar Network, in: Advances in Laser Remote Sensing, edited by: Dabas, A., Loth, C., and Pelon, J., Ecole Polytechnique, Palaiseau Cedex, France, 155–158, 2001.
Bösenberg, J., Matthias, V., Amodeo, A., Amoiridis, V., Ansmann, A., Baldasano, J. M., Balin, I., Balis, D., Böckmann, C., Boselli, A., Carlsson, G., Chaikovsky, A., Chourdakis, G., Comeron, A., Tomasi, F. D., Eixmann, R., Freudenthaler, V., Giehl, H., Grigorov, I., Hågård, A., Iarlori, M., Kirsche, A., Kolarov, G., Komguem, L., Kreipl, S., Kumpf, W., Larcheveque, G., Linné, H., Matthey, R., Mattis, I., Mekler, A., Mironova, I., Mitev, V., Mona, L., Müller, D., Music, S., Nickovic, S., Pandolfi, M., Papayannis, A., Pappalardo, G., Pelon, J., Pérez, C., Perrone, R. M., Persson, R., Resendes, D. P., Rizi, V., Rocadenbosch, F., Rodrigues, J. A., Sauvage, L., Schneidenbach, L., Schumacher, R., Shcherbakov, V., Simeonov, V., Sobolewski, P., Spinelli, N., Stachlewska, I., Stoyanov, D., Trickl, T., Tsaknakis, G., Vaughan, G., Wandinger, U., Wang, X., Wiegner, M., Zavrtanik, M., and Zerefos, C.: EARLINET project: A European Aerosol Research Lidar Network, Max-Planck Institute (MPI), Final Report No. 348, 1–250, 2003.
Breiman, L.: Random forests, Mach. Learn., 45, 5–32, https://doi.org/10.1023/A:1010933404324, 2001.
Ceamanos, X., Six, B., Moparthy, S., Carrer, D., Georgeot, A., Gasteiger, J., Riedi, J., Attié, J.-L., Lyapustin, A., and Katsev, I.: Instantaneous aerosol and surface retrieval using satellites in geostationary orbit (iAERUS-GEO) – estimation of 15 min aerosol optical depth from MSG/SEVIRI and evaluation with reference data, Atmos. Meas. Tech., 16, 2575–2599, https://doi.org/10.5194/amt-16-2575-2023, 2023.
Chen, B., Dong, L., Huang, J., Wang, Y., Jing, Z., Yan, W., Wang, X., Song, Z., Huang, Z., Guan, X., Dong, X., and Huang, Y.: Analysis of Long-Term Trends in the Vertical Distribution and Transport Paths of Atmospheric Aerosols in Typical Regions of China Using 15 Years of CALIOP Data, J. Geophys. Res.-Atmos., 128, e2022JD038066, https://doi.org/10.1029/2022JD038066, 2023.
Chen, B., Ye, Y., Tong, C., Deng, J., Wang, K., and Hong, Y.: A novel big data mining framework for reconstructing large-scale daily MAIAC AOD data across China from 2000 to 2020, GISci. Remote Sens., 59, 670–685, https://doi.org/10.1080/15481603.2022.2051382, 2022.
Chen, T. and Guestrin, C.: Xgboost: A scalable tree boosting system, arXiv [preprint], 785–794, https://doi.org/10.1145/2939672.2939785, 10 June 2016.
Chen, W., Ran, H., Cao, X., Wang, J., Teng, D., Chen, J., and Zheng, X.: Estimating PM2.5 with high-resolution 1-km AOD data and an improved machine learning model over Shenzhen, China, Sci. Total Environ., 746, 141093, https://doi.org/10.1016/j.scitotenv.2020.141093, 2020.
Chin, M., Diehl, T., Ginoux, P., and Malm, W.: Intercontinental transport of pollution and dust aerosols: implications for regional air quality, Atmos. Chem. Phys., 7, 5501–5517, https://doi.org/10.5194/acp-7-5501-2007, 2007.
Choobari, O. A., Zawar-Reza, P., and Sturman, A.: The global distribution of mineral dust and its impacts on the climate system: A review, Atmos. Res., 138, 152–165, 2014.
Copernicus Climate Change Service (C3S) Climate Data Store (CDS): In situ atmospheric harmonized temperature, relative humidity and wind from 1978 onward from baseline radiosonde networks, C3S CDS [data set], https://doi.org/10.24381/cds.f101d0bf, 2021.
Da, C.: Preliminary assessment of the Advanced Himawari Imager (AHI) measurement onboard Himawari-8 geostationary satellite, Remote Sens. Lett., 6, 637–646, https://doi.org/10.1080/2150704X.2015.1066522, 2015.
European Organization for the Exploitation of Meteorological Satellites: Conversion from radiances to reflectances for SEVIRI warm channels, Rep. EUM/MET/TEN/12/0332, 8 pp., https://user.eumetsat.int/dashboard (last access: 20 June 2023), 2012.
Fisher, D., Muller, J. P., and Yershov, V. N.: Automated stereo retrieval of smoke plume injection heights and retrieval of smoke plume masks from AATSR and their assessment with CALIPSO and MISR, IEEE T. Geosci. Remote, 52, 1249–1258, 2013.
Ge, B., Li, Z., Liu, L., Yang, L., Chen, X., Hou, W., Zhang, Y., Li, D., Li, L., and Qie, L.: A dark target method for Himawari-8/AHI aerosol retrieval: Application and validation, IEEE T. Geosci. Remote, 57, 381–394, https://doi.org/10.1109/TGRS.2018.2854743, 2018.
Georgoulias, A. K., Alexandri, G., Kourtidis, K. A., Lelieveld, J., Zanis, P., Pöschl, U., Levy, R., Amiridis, V., Marinou, E., and Tsikerdekis, A.: Spatiotemporal variability and contribution of different aerosol types to the aerosol optical depth over the Eastern Mediterranean, Atmos. Chem. Phys., 16, 13853–13884, https://doi.org/10.5194/acp-16-13853-2016, 2016.
Granados-Muñoz, M. J., Navas-Guzmán, F., Guerrero-Rascado, J. L., Bravo-Aranda, J. A., Binietoglou, I., Pereira, S. N., Basart, S., Baldasano, J. M., Belegante, L., Chaikovsky, A., Comerón, A., D'Amico, G., Dubovik, O., Ilic, L., Kokkalis, P., Muñoz-Porcar, C., Nickovic, S., Nicolae, D., Olmo, F. J., Papayannis, A., Pappalardo, G., Rodríguez, A., Schepanski, K., Sicard, M., Vukovic, A., Wandinger, U., Dulac, F., and Alados-Arboledas, L.: Profiling of aerosol microphysical properties at several EARLINET/AERONET sites during the July 2012 ChArMEx/EMEP campaign, Atmos. Chem. Phys., 16, 7043–7066, https://doi.org/10.5194/acp-16-7043-2016, 2016.
Grigas, T., Hervo, M., Gimmestad, G., Forrister, H., Schneider, P., Preißler, J., Tarrason, L., and O'Dowd, C.: CALIOP near-real-time backscatter products compared to EARLINET data, Atmos. Chem. Phys., 15, 12179–12191, https://doi.org/10.5194/acp-15-12179-2015, 2015.
Gupta, G., Ratnam, M. V., Madhavan, B. L., Prasad, P., and Narayanamurthy, C. S.: Vertical and spatial distribution of elevated aerosol layers obtained using long-term ground-based and space-borne lidar observations, Atmos. Environ., 246, 118172, https://doi.org/10.1016/j.atmosenv.2020.118172, 2021.
Han, B., Ding, H., Ma, Y., and Gong, W.: Improving retrieval accuracy for aerosol optical depth by fusion of MODIS and CALIOP data, Teh. Vjesn., 24, 791–800, https://doi.org/10.17559/TV-20160429044233, 2017.
Hollstein, A. and Fischer, J.: Retrieving aerosol height from the oxygen A band: a fast forward operator and sensitivity study concerning spectral resolution, instrumental noise, and surface inhomogeneity, Atmos. Meas. Tech., 7, 1429–1441, https://doi.org/10.5194/amt-7-1429-2014, 2014.
Hyslop, N. P.: Impaired visibility: the air pollution people see, Atmos. Environ., 43, 182–195, https://doi.org/10.1016/j.atmosenv.2008.09.067, 2009.
Kalluri, S., Gundy, J., Haman, B., Paullin, A., Van Rompay, P., Vititoe, D., and Weiner, A.: A high performance remote sensing product generation system based on a service oriented architecture for the next generation of Geostationary Operational Environmental Satellites, Remote Sensing, 7, 10385–10399, https://doi.org/10.3390/rs70810385, 2015.
Kaufman, Y. J., Tanré, D., Gordon, H. R., Nakajima, T., Lenoble, J., Frouin, R., Grassl, H., Herman, B. M., and Teillet, P. M.: Passive remote sensing of tropospheric aerosol and atmospheric correction for the aerosol effect, J. Geophys. Res.-Atmos., 102, 16815–16830, https://doi.org/10.1029/97JD01496, 1997.
Kittaka, C., Winker, D. M., Vaughan, M. A., Omar, A., and Remer, L. A.: Intercomparison of column aerosol optical depths from CALIPSO and MODIS-Aqua, Atmos. Meas. Tech., 4, 131–141, https://doi.org/10.5194/amt-4-131-2011, 2011.
Kocaman, S., Debaecker, V., Bas, S., Saunier, S., Garcia, K., and Just, D.: A comprehensive geometric quality assessment approach for MSG SEVIRI imagery, Adv. Space Res., 69, 1462–1480, https://doi.org/10.1016/j.asr.2021.11.018, 2022.
Lebo, Z. J.: The sensitivity of a numerically simulated idealized squall line to the vertical distribution of aerosols, J. Atmos. Sci., 71, 4581–4596, https://doi.org/10.1175/JAS-D-14-0068.1, 2014.
Lee, S., Park, S., Lee, M. I., Kim, G., Im, J., and Song, C. K.: Air quality forecasts improved by combining data assimilation and machine learning with satellite AOD, Geophys. Res. Lett., 49, e2021GL096066, https://doi.org/10.1029/2021GL096066, 2022.
Li, C., Li, J., Dubovik, O., Zeng, Z. C., and Yung, Y. L.: Impact of aerosol vertical distribution on aerosol optical depth retrieval from passive satellite sensors, Remote Sensing, 12, 1524, https://doi.org/10.3390/rs12091524, 2020.
Li, J., Carlson, B. E., Yung, Y. L., Lv, D., Hansen, J., Penner, J. E., Liao, H., Ramaswamy, V., Kahn, R. A., Zhang, P., Dubovik, O., Ding, A., Lacis, A. A., Zhang, L., and Dong, Y.: Scattering and absorbing aerosols in the climate system, Nature Reviews Earth & Environment, 3, 363–379, https://doi.org/10.1038/s43017-022-00296-7, 2022.
Lipponen, A., Mielonen, T., Pitkänen, M. R. A., Levy, R. C., Sawyer, V. R., Romakkaniemi, S., Kolehmainen, V., and Arola, A.: Bayesian aerosol retrieval algorithm for MODIS AOD retrieval over land, Atmos. Meas. Tech., 11, 1529–1547, https://doi.org/10.5194/amt-11-1529-2018, 2018.
Liu, B., Ma, Y., Gong, W., Zhang, M., Wang, W., and Shi, Y.: Comparison of AOD from CALIPSO, MODIS, and sun photometer under different conditions over Central China, Scientific Reports, 8, 10066, https://doi.org/10.1038/s41598-018-28417-7, 2018.
Liu, C., Shen, X., and Gao, W.: Intercomparison of CALIOP, MODIS, and AERONET aerosol optical depth over China during the past decade, Int. J. Remote Sens., 39, 7251–7275, https://doi.org/10.1080/01431161.2018.1466070, 2018.
Lyapustin, A., Wang, Y., Laszlo, I., Kahn, R., Korkin, S., Remer, L., and Reid, J. S.: Multiangle implementation of atmospheric correction (MAIAC): 2. Aerosol algorithm, J. Geophys. Res.-Atmos., 116, D03211, https://doi.org/10.1029/2010JD014986, 2011.
Marinescu, P. J., van den Heever, S. C., Saleeby, S. M., Kreidenweis, S. M., and DeMott, P. J.: The microphysical roles of lower-tropospheric versus midtropospheric aerosol particles in mature-stage MCS precipitation, J. Atmos. Sci., 74, 3657–3678, https://doi.org/10.1175/jas-d-16-0361.1, 2017.
Marshak, A. and Knyazikhin, Y.: The spectral invariant approximation within canopy radiative transfer to support the use of the EPIC/DSCOVR oxygen B-band for monitoring vegetation, J. Quant. Spectrosc. Ra., 191, 7–12, https://doi.org/10.1016/j.jqsrt.2017.01.015, 2017.
Mehta, M., Jain, A., and Chauhan, P.: Aerosol optical depth retrieval over land from OCEANSAT-2/OCM-2 data – A simple physics based approach, Atmos. Pollut. Res., 13, 101339, https://doi.org/10.1016/j.apr.2022.101339, 2022.
Muller, J. P., Mandanayake, A., Moroney, C., Davies, R., Diner, D. J., and Paradise, S.: MISR stereoscopic image matchers: Techniques and results, IEEE T. Geosci. Remote, 40, 1547–1559, 2002.
Nanda, S., de Graaf, M., Veefkind, J. P., Sneep, M., ter Linden, M., Sun, J., and Levelt, P. F.: A first comparison of TROPOMI aerosol layer height (ALH) to CALIOP data, Atmos. Meas. Tech., 13, 3043–3059, https://doi.org/10.5194/amt-13-3043-2020, 2020.
Nicolae, V., Talianu, C., Andrei, S., Antonescu, B., Ene, D., Nicolae, D., Dandocsi, A., Toader, V. E., Ştefan, S., Savu, T., and Vasilescu, J.: Multiyear typology of long-range transported aerosols over Europe, Atmosphere, 10, 482, https://doi.org/10.3390/atmos10090482, 2019.
Ortiz-Amezcua, P., Guerrero-Rascado, J. L., Granados-Muñoz, M. J., Benavent-Oltra, J. A., Böckmann, C., Samaras, S., Stachlewska, I. S., Janicka, Ł., Baars, H., Bohlmann, S., and Alados-Arboledas, L.: Microphysical characterization of long-range transported biomass burning particles from North America at three EARLINET stations, Atmos. Chem. Phys., 17, 5931–5946, https://doi.org/10.5194/acp-17-5931-2017, 2017.
Pashayi, M., Satari, M., and Shahraki, M. M.: Improvement of spatial-temporal resolution of aerosol profile by using multi-source satellite data over the Persian Gulf, Atmos. Environ., 292, 119410, https://doi.org/10.1016/j.atmosenv.2022.119410, 2023.
Pashayi, M., Satari, M., Shahraki, M. M., and Amini, S.: MAIAC AOD profiling over the Persian Gulf: A seasonal-independent machine learning approach, Atmos. Pollut. Res., 15, 102128, https://doi.org/10.1016/j.apr.2024.102128, 2024.
Pashayi, M., Satari, M., and Momeni Shahraki, M.: Sub-Hourly Multi-Layer AOD Estimations for Europe During the Saharan Dust Event (07:12–16:12, March 18, 2022), TIB AV-Portal [video], https://doi.org/10.5446/69730, 2025a.
Pashayi, M., Satari, M., and Momeni Shahraki, M.: Sub-Hourly Multi-Layer AOD Estimations for Europe During the Volcanic Eruption Event (from 07:27 to 15:57, August 14, 2023), TIB AV-Portal [video], https://doi.org/10.5446/69731, 2025a.
Pasternak, F., Lorsignol, J., and Wolff, L.: Spinning enhanced visible and infrared imager (SEVIRI): the new imager for meteosat second generation, in: Space Optics 1994: Earth Observation and Astronomy, SPIE, 2209, 86–94, https://doi.org/10.1117/12.185247, 1994.
Pérez, C., Nickovic, S., Baldasano, J. M., Sicard, M., Rocadenbosch, F., and Cachorro, V. E.: A long Saharan dust event over the western Mediterranean: Lidar, Sun photometer observations, and regional dust modeling?, J. Geophys. Res., 111, D15214, https://doi.org/10.1029/2005JD006579, 2006a.
Pérez, C., Nickovic, S., Pejanovic, G., Baldasano, J. M., and Özsoy, E.: Interactive dust-radiation modeling: A step to improve weather forecasts, J. Geophys. Res., 111, D16206, https://doi.org/10.1029/2005JD006717, 2006b.
Pope III, C. A., Lefler, J. S., Ezzati, M., Higbee, J. D., Marshall, J. D., Kim, S. Y., Bechle, M., Gilliat, K. S., Vernon, S. E., Robinson, A. L., and Burnett, R. T.: Mortality risk and fine particulate air pollution in a large, representative cohort of U.S. adults, Environ. Health Persp., 127, 77007, https://doi.org/10.1289/EHP4438, 2019.
Radosavljevic, V., Vucetic, S., and Obradovic, Z.: A data-mining technique for aerosol retrieval across multiple accuracy measures, IEEE Geosci. Remote S., 7, 411–415, https://doi.org/10.1109/LGRS.2009.2037720, 2010.
Redemann, J., Vaughan, M. A., Zhang, Q., Shinozuka, Y., Russell, P. B., Livingston, J. M., Kacenelenbogen, M., and Remer, L. A.: The comparison of MODIS-Aqua (C5) and CALIOP (V2 & V3) aerosol optical depth, Atmos. Chem. Phys., 12, 3025–3043, https://doi.org/10.5194/acp-12-3025-2012, 2012.
Rogozovsky, I., Ansmann, A., Althausen, D., Heese, B., Engelmann, R., Hofer, J., Baars, H., Schechner, Y., Lyapustin, A., and Chudnovsky, A.: Impact of aerosol layering, complex aerosol mixing, and cloud coverage on high-resolution MAIAC aerosol optical depth measurements: Fusion of lidar, AERONET, satellite, and ground-based measurements, Atmos. Environ., 247, 118163, https://doi.org/10.1016/j.atmosenv.2020.118163, 2021.
Rogozovsky, I., Ohneiser, K., Lyapustin, A., Ansmann, A., and Chudnovsky, A.: The impact of different aerosol layering conditions on the high-resolution MODIS/MAIAC AOD retrieval bias: the uncertainty analysis, Atmos. Environ., 309, 119930, https://doi.org/10.1016/j.atmosenv.2023.119930, 2023.
Schmetz, J., Pili, P., Tjemkes, S., Just, D., Kerkmann, J., Rota, S., and Ratier, A.: An introduction to Meteosat second generation (MSG), B. Am. Meteorol. Soc., 83, 977–992, https://doi.org/10.1175/1520-0477(2002)083<0977:AITMSG>2.3.CO;2, 2002.
Schmit, T. J., Lindstrom, S. S., Gerth, J. J., and Gunshor, M. M.: Applications of the 16 spectral bands on the Advanced Baseline Imager (ABI), Journal of Operational Meteorology, 6, 33–46, https://doi.org/10.15191/nwajom.2018.0604, 2018.
Seidel, F. C., Kokhanovsky, A. A., and Schaepman, M. E.: Fast retrieval of aerosol optical depth and its sensitivity to surface albedo using remote sensing data, Atmos. Res., 116, 22–32, https://doi.org/10.1016/j.atmosres.2011.03.006, 2012.
She, L., Zhang, H. K., Li, Z., de Leeuw, G., and Huang, B.: Himawari-8 aerosol optical depth (AOD) retrieval using a deep neural network trained using AERONET observations, Remote Sensing, 12, 4125, https://doi.org/10.3390/rs12244125, 2020.
Stebel, K., Stachlewska, I. S., Nemuc, A., Horálek, J., Schneider, P., Ajtai, N., Diamandi, A., Benešová, N., Boldeanu, M., Botezan, C., Marková, J., Dumitrache, R., Iriza-Burcă, A., Juras, R., Nicolae, D., Nicolae, V., Novotný, P., Ștefănie, H., Vaněk, L., Vlček, O., Zawadzka-Manko, O., and Zehner, C.: SAMIRA-Satellite based monitoring initiative for regional air quality, Remote Sensing, 13, 2219, https://doi.org/10.3390/rs13112219, 2021.
Sulla-Menashe, D. and Friedl, M. A.: User guide to collection 6 MODIS land cover (MCD12Q1 and MCD12C1) product, USGS, Reston, VA, USA, 1, 18 pp., https://lpdaac.usgs.gov/documents/101/MCD12_User_Guide_V6.pdf (last access: 23 October 2023), 2018.
Tang, D., Liu, D., Tang, Y., Seyler, B. C., Deng, X., and Zhan, Y.: Comparison of GOCI and Himawari-8 aerosol optical depth for deriving full-coverage hourly PM2.5 across the Yangtze River Delta, Atmos. Environ., 217, 116973, https://doi.org/10.1016/j.atmosenv.2019.116973, 2019.
Tesche, M., Ansmann, A., Mueller, D., Althausen, D., Mattis, I., Heese, B., Freudenthaler, V., Wiegner, M., Esselborn, M., Pisani, G., and Knippertz, P.: Vertical profiling of Saharan dust with Raman lidars and airborne HSRL in southern Morocco during SAMUM, Tellus B, 61, 144–164, https://doi.org/10.1111/j.1600-0889.2008.00390.x, 2009.
Tjemkes, S., Stuhlmann, R., Hewison, T., Müller, J., Gartner, V., and Rota, S.: The conversion from effective radiances to equivalent brightness temperatures, EUMETSAT, Technical report, Version 1, https://www-cdn.eumetsat.int/files/2020-04/pdf_effect_rad_to_brightness.pdf (last access: 20 April 2024), 2012.
Tsang, L., Kong, J. A., and Shin, R. T.: Radiative transfer theory for active remote sensing of a layer of nonspherical particles, Radio Sci., 19, 629–642, https://doi.org/10.1029/RS019i002p00629, 1984.
Val Martin, M., Kahn, R. A., and Tosca, M. G.: A global analysis of wildfire smoke injection heights derived from space-based multi-angle imaging, Remote Sensing, 10, 1609, https://doi.org/10.3390/rs10101609, 2018.
Veefkind, J. P., Aben, I., McMullan, K., Förster, H., De Vries, J., Otter, G., Claas, J., Eskes, H. J., de Haan, J. F., Kleipool, Q., van Weele, M., Hasekamp, O., Hoogeveen, R., Landgraf, J., Snel, R., Tol, P., Ingmann, P., Voors, R., Kruizinga, B., Vink, R., and Levelt, P. F.: TROPOMI on the ESA Sentinel-5 Precursor: A GMES mission for global observations of the atmospheric composition for climate, air quality and ozone layer applications, Remote Sens. Environ., 120, 70–83, https://doi.org/10.1016/j.rse.2011.09.027, 2012.
Wang, H., Sun, Z., Li, H., Gao, Y., Wu, J., and Cheng, T.: Vertical-distribution characteristics of atmospheric aerosols under different thermodynamic conditions in Beijing, Aerosol Air Qual. Res., 18, 2775–2787, https://doi.org/10.4209/aaqr.2018.03.0078, 2018.
Wei, X., Chang, N. B., Bai, K., and Gao, W.: Satellite remote sensing of aerosol optical depth: Advances, challenges, and perspectives, Crit. Rev. Env. Sci. Tec., 50, 1640–1725, https://doi.org/10.1080/10643389.2019.1665944, 2020.
Winker, D. M., Hunt, W., and Hostetler, C.: Status and performance of the Caliop lidar, Laser Radar Techniques for Atmospheric Sensing, 5575, 8–15, https://doi.org/10.1117/12.571955, 2004.
Winker, D. M., Hunt, W. H., and McGill, M. J.: Initial performance assessment of CALIOP, Geophys. Res. Lett., 34, L19803, https://doi.org/10.1029/2007GL030135, 2007.
Winker, D. M., Tackett, J. L., Getzewich, B. J., Liu, Z., Vaughan, M. A., and Rogers, R. R.: The global 3-D distribution of tropospheric aerosols as characterized by CALIOP, Atmos. Chem. Phys., 13, 3345–3361, https://doi.org/10.5194/acp-13-3345-2013, 2013.
Winker, D. M., Vaughan, M., and Hunt, W.: The CALIPSO mission and initial results from CALIOP, Proceedings of SPIE, 6409, https://doi.org/10.1117/12.698003, 2006.
Witthuhn, J., Hünerbein, A., and Deneke, H.: Evaluation of satellite-based aerosol datasets and the CAMS reanalysis over the ocean utilizing shipborne reference observations, Atmos. Meas. Tech., 13, 1387–1412, https://doi.org/10.5194/amt-13-1387-2020, 2020.
Wu, Y., de Graaf, M., and Menenti, M.: The impact of aerosol vertical distribution on aerosol optical depth retrieval using CALIPSO and MODIS data: Case study over dust and smoke regions, J. Geophys. Res.-Atmos., 122, 8801–8815, https://doi.org/10.1002/2016JD026355, 2017.
Xu, H., Ma, J., Luo, W., Wan, C., and Li, Z.: Research on the distribution and influencing factors of fine mode aerosol optical depth (AODf) in China, Atmos. Environ., 334, 120721, https://doi.org/10.1016/j.atmosenv.2024.120721, 2024.
Xu, X., Wang, J., Wang, Y., Zeng, J., Torres, O., Yang, Y., Marshak, A., Reid, J., and Miller, S.: Passive remote sensing of altitude and optical depth of dust plumes using the oxygen A and B bands: First results from EPIC/DSCOVR at Lagrange-1 point, Geophys. Res. Lett., 44, 7544–7554, https://doi.org/10.1002/2017GL073939, 2017.
Xu, X., Wang, J., Wang, Y., Zeng, J., Torres, O., Reid, J. S., Miller, S. D., Martins, J. V., and Remer, L. A.: Detecting layer height of smoke aerosols over vegetated land and water surfaces via oxygen absorption bands: hourly results from EPIC/DSCOVR in deep space, Atmos. Meas. Tech., 12, 3269–3288, https://doi.org/10.5194/amt-12-3269-2019, 2019.
Yu, H., Kaufman, Y. J., Chin, M., Feingold, G., Remer, L. A., Anderson, T. L., Balkanski, Y., Bellouin, N., Boucher, O., Christopher, S., DeCola, P., Kahn, R., Koch, D., Loeb, N., Reddy, M. S., Schulz, M., Takemura, T., and Zhou, M.: A review of measurement-based assessments of the aerosol direct radiative effect and forcing, Atmos. Chem. Phys., 6, 613–666, https://doi.org/10.5194/acp-6-613-2006, 2006.
Zakšek, K., Hort, M., Zaletelj, J., and Langmann, B.: Monitoring volcanic ash cloud top height through simultaneous retrieval of optical data from polar orbiting and geostationary satellites, Atmos. Chem. Phys., 13, 2589–2606, https://doi.org/10.5194/acp-13-2589-2013, 2013.
Zawadzka, O. and Markowicz, K.: Retrieval of aerosol optical depth from optimal interpolation approach applied to SEVIRI data, Remote Sensing, 6, 7182–7211, https://doi.org/10.3390/rs6087182, 2014.
Zawadzka-Manko, O., Stachlewska, I. S., and Markowicz, K. M.: Near-real-time application of seviri aerosol optical depth algorithm, Remote Sensing, 12, 1481, https://doi.org/10.3390/rs12091481, 2020.
Zege, E. P., Ivanov, A. P., and Katsev, I. L.: Image transfer through a scattering medium, Springer-Verlag, Heidelberg, Vol. 349, ISBN: 978-3-642-75288-9, 1991.
Zeng, Z. C., Natraj, V., Xu, F., Pongetti, T. J., Shia, R. L., Kort, E. A., Toon, G. C., Sander, S. P., and Yung, Y. L.: Constraining aerosol vertical profile in the boundary layer using hyperspectral measurements of oxygen absorption, Geophys. Res. Lett., 45, 10772–10780, https://doi.org/10.1029/2018GL079286, 2018.
Zhang, M. Z., Deng, X., Zhu, R. H., Ren, Y. Z., and Xue, H. W.: The impact of aerosol vertical distribution on a deep convective cloud, Atmosphere, 12, 675, https://doi.org/10.3390/atmos12060675, 2021.
Zhang, Z., Wu, W., Fan, M., Tao, M., Wei, J., Jin, J., Tan, Y., and Wang, Q.: Validation of Himawari-8 aerosol optical depth retrievals over China, Atmos. Environ., 199, 32–44, https://doi.org/10.1016/j.atmosenv.2018.11.024, 2019.
Zhao, C., Liu, Z., Wang, Q., Ban, J., Chen, N. X., and Li, T.: High-resolution daily AOD estimated to full coverage using the random forest model approach in the Beijing-Tianjin-Hebei region, Atmos. Environ., 203, 70–78, https://doi.org/10.1016/j.atmosenv.2019.01.045, 2019.