the Creative Commons Attribution 4.0 License.
the Creative Commons Attribution 4.0 License.
 | 25 Jun 2025
Triple oxygen isotope composition of CO2 in the upper troposphere and stratosphere
Gerbrand Koren
Neha Mehendale
Sergey Gromov
Maarten Krol
Thomas Röckmann
High-precision measurements of the triple oxygen isotope composition of CO2 (Δ′17O) can be used to estimate biosphere–atmosphere exchange of CO2, the residence time of tropospheric CO2, and stratosphere–troposphere exchange. In this study, we report measurements of the Δ′17O(CO2) from air samples collected during two aircraft-based programmes, CARIBIC and StratoClim. CARIBIC (Civil Aircraft for the Regular Investigation of the atmosphere Based on an Instrument Container) provided air samples from numerous transcontinental flights in the upper troposphere–lower stratosphere region. StratoClim (Stratospheric and upper tropospheric processes for better climate predictions) conducted intensive campaigns with the high-altitude aircraft M55 Geophysica during the Asian summer monsoon anticyclone (ASMA), providing air samples from altitudes up to 21 km.
Using high-precision Δ′17O measurements of the CARIBIC samples, we show that the N2O–Δ′17O correlation, previously observed in the stratosphere, extends to the upper troposphere. Moreover, we found no significant spatial or hemispheric differences in Δ′17O(CO2) for the upper-tropospheric samples collected during the CARIBIC programme. However, in many of the StratoClim samples, with significant stratospheric contributions, we observed a much lower N2O–Δ′17O slope compared to CARIBIC samples and previous publications. This deviation is attributed to change in eddy diffusion above the tropopause within the ASMA, confirming previously published model calculations. These samples provide the first experimental evidence that differences in vertical mixing/transport can lead to significantly different N2O–Δ′17O slopes. High-precision Δ′17O measurements can identify ejections of tropospheric air into the stratosphere based on the slope of the N2O–Δ′17O correlation, as both tracers have chemical lifetimes longer than their transport times.
Furthermore, we use the Δ′17O measurements from the lower stratosphere and the upper troposphere to estimate global stratospheric production and surface removal of the isotope tracer Δ′17O. The removal estimate is then used to derive an independent estimate of global vegetation exchange of CO2, confirming earlier estimates based on surface level Δ′17O measurements.
- Article
(3334 KB) - Full-text XML
-
Supplement
(1590 KB) - BibTeX
- EndNote


Measurements of the isotope composition of CO2 (δ13C and δ18O; see definition below) are used in many ways to understand sources and sinks of CO2 in the global carbon cycle (Farquhar et al., 1993; Welp et al., 2011; Cuntz et al., 2003b; Ciais et al., 1997a, 1995). The flux estimates of CO2 from the terrestrial biosphere are poorly constrained in current carbon cycle models (Piao et al., 2013). By using δ13C it is possible to differentiate between the ocean sink and biosphere activity. However, distinguishing respiration, photosynthesis, and combustion signals using δ13C of CO2 is impossible (Ciais et al., 1995). To address this challenge, δ18O of CO2 is a valuable tool for distinguishing respiration from photosynthesis. The δ18O value of CO2 is higher during photosynthesis than during respiration due to isotope exchange of CO2 with isotopically different leaf water and soil water pools, as leaf water typically has a higher δ18O value than soil water (Ciais et al., 1997a, b; Welp et al., 2011; Farquhar et al., 1993; Cuntz et al., 2003a, b; Francey and Tans, 1987; Yakir, 2020).
One of the limitations of using δ18O of CO2 to distinguish photosynthesis and respiration is the oxygen isotope exchange of CO2 with liquid water in surface water bodies or vegetation, since this isotope exchange affects δ18O of CO2, without contributing to a net flux. Numerous equilibrium and kinetic effects can alter the δ18O value of water and other molecules (Cuntz et al., 2003a, b; Peylin et al., 1999). Importantly, the isotopic composition of leaf water at the CO2–H2O exchange site in the mesophyll is not well understood, primarily due to fractionation associated with evaporation, transport, and diffusion (Adnew et al., 2020, 2021, 2023; Gan et al., 2002; Cousins et al., 2006; Song et al., 2015; Landais et al., 2006; Cernusak et al., 2016; Helliker and Ehleringer, 2000). These unknown physico-chemical fractionation processes introduce large uncertainty into estimates of gross fluxes of CO2 when using δ18O as quantitative tracer. This uncertainty can potentially be reduced using the triple oxygen isotopic composition of CO2, Δ′17O (see Eq. 4), which is a combination of the δ17O and δ18O isotopic composition (Hoag et al., 2005; Koren et al., 2019; Adnew et al., 2020).
Stratospheric CO2 has a high Δ′17O value, i.e. Δ′17O ≫ 0, due to isotope exchange with O(1D) produced from O3 photolysis (Thiemens et al., 1991, 1995a; Lyons, 2001; Lämmerzahl et al., 2002; Thiemens, 2006; Kawagucci et al., 2008; Wiegel et al., 2013; Yung et al., 1991, 1997; Shaheen et al., 2007). The main sink for this higher Δ′17O signal of CO2 is isotope exchange with leaf, soil, and ocean water at the Earth's surface, after Δ′17O-enriched CO2 has re-entered the troposphere via the large-scale Brewer–Dobson circulation and synoptic eddy diffusion (Boering et al., 2004; Thiemens et al., 2014; Liang and Mahata, 2015; Francey and Tans, 1987). With the exception of stratospheric CO2, Δ′17O variations in nature are much smaller compared to δ18O variations and are better defined, as conventional biogeochemical processes follow a well-defined three-isotope fractionation slope (Barkan and Luz, 2005, 2007, 2012; Landais et al., 2006; Angert et al., 2004, 2003). Furthermore, the triple oxygen isotope fractionation slopes for specific processes are independent of the source water isotope composition, insensitive to temperature, and process-specific (Landais et al., 2006; Hofmann et al., 2012). As a result, Δ′17O is less affected by the numerous physico-chemical fractionation processes mentioned above and may provide an additional constraint for quantifying the gross fluxes of the terrestrial carbon cycle than measuring δ18O alone (Koren et al., 2019; Hoag et al., 2005; Liang et al., 2017a, 2023; Hofmann et al., 2017; Adnew et al., 2020; Thiemens et al., 2014).
In addition to quantifying the gross fluxes of the terrestrial carbon cycle, Δ′17O can provide useful information concerning stratospheric intrusions (Liang and Mahata, 2015; Steur et al., 2024), stratosphere–troposphere exchange (Boering et al., 2004; Luz et al., 1999), atmospheric transport and chemistry in the mesosphere and stratosphere (Liang et al., 2007, 2008), and combustion processes (Laskar et al., 2016; Horváth et al., 2012) and for estimating the residence time of CO2 in the troposphere (Liang et al., 2017b; Laskar et al., 2019; Hoag et al., 2005).
High-precision measurements of Δ′17O(CO2) are particularly interesting in the tropical upper troposphere–lowermost stratosphere region, which is remote from the sources and sinks. Therefore, Δ′17O(CO2) can be used to study the influence of the stratosphere–troposphere exchange on the variations and dynamics of Δ′17O and its correlation with other long- and short-lived trace gases. Additionally, these measurements may be valuable for using Δ′17O as a tracer to quantify gross fluxes of CO2, as this region links the stratosphere, where Δ′17O of CO2 is produced, to the troposphere, where Δ′17O of CO2 is “washed out”. Furthermore, it is interesting to investigate whether Δ′17O varies spatially in the upper troposphere and whether it is possible to detect large-scale dynamic phenomena that happen in the Asian summer monsoon anticyclone (ASMA). The monsoon circulation system has a large variability in its spatial extent, and the ASMA can reach the Mediterranean, north-east Africa, and east Asia (Annamalai and Slingo, 2001; Garny and Randel, 2013; Pan et al., 2016; Vogel et al., 2019).
Here we present high-precision measurements of Δ′17O(CO2) from a total of 85 air samples collected in the upper troposphere and stratosphere as part of the CARIBIC and StratoClim aircraft air sampling projects. We investigate the spatial distribution (horizontal and vertical) of Δ′17O(CO2) signals associated with the ASMA and refine previous estimates of the net stratosphere–troposphere flux of Δ′17O(CO2) and constraints on surface CO2 emissions.
2.1 Definitions and notation
Variations in isotopic abundance are reported as deviations of a heavy-to-light isotope ratio in a sample relative to a reference material (Eq. 1). For oxygen the reference material is Vienna Standard Mean Ocean Water (VSMOW), whereas for carbon the reference material is Vienna Pee Dee Belemnite (VPDB). Since isotope variations are small, they are usually reported in per mill (‰) in δ notation.
where x can be 13, 17, and 18 (for 13C, 17O, and 18O, respectively). The indices sam and std stand for sample and standard, respectively, and R is the ratio between the heavy isotope and the light isotope of the respective element, for instance for 13C and 18O and 13R = and 18R = , respectively. The variations in δ17O and δ18O are closely related during most physico-chemical fractionation processes according to Eq. (2) (Matsuhisa et al., 1978; Young et al., 2002).
The exponent θp denotes a three-isotope slope that occurs from a single process. Equation (2) can be expressed in δ notation as
The deviation of the left-hand side of Eq. (3) from zero is defined as Δ′17O:
where the process-dependent exponent θp has been replaced by a three-isotope reference slope λref. Note that the choice of λref is arbitrary since in nature isotopic compositions rarely reflect fractionation from a single process but instead integrate multiple fractionating processes and several three-isotope values (Adnew, 2020; Barkan and Luz, 2005, 2007, 2012; Angert et al., 2004). For most natural processes, λref ranges from 0.5 to 0.5305 (Thiemens, 2006; Matsuhisa et al., 1978; Young et al., 2002; Cao and Liu, 2011; Thiemens et al., 1991; Kaiser, 2008) with some exceptions (Adnew et al., 2022; Hayles et al., 2017; Hayles and Killingsworth, 2022). In this study we use a λref value of 0.528, the value associated with meteoric water (Meijer and Li, 1998; Luz and Barkan, 2010).
2.2 Sampling
Air samples were collected from the upper troposphere and stratosphere during two different international projects, CARIBIC and StratoClim, which are shortly described below. Figure 1 shows the geographical coordinates of the sampling locations for the samples measured in this study.
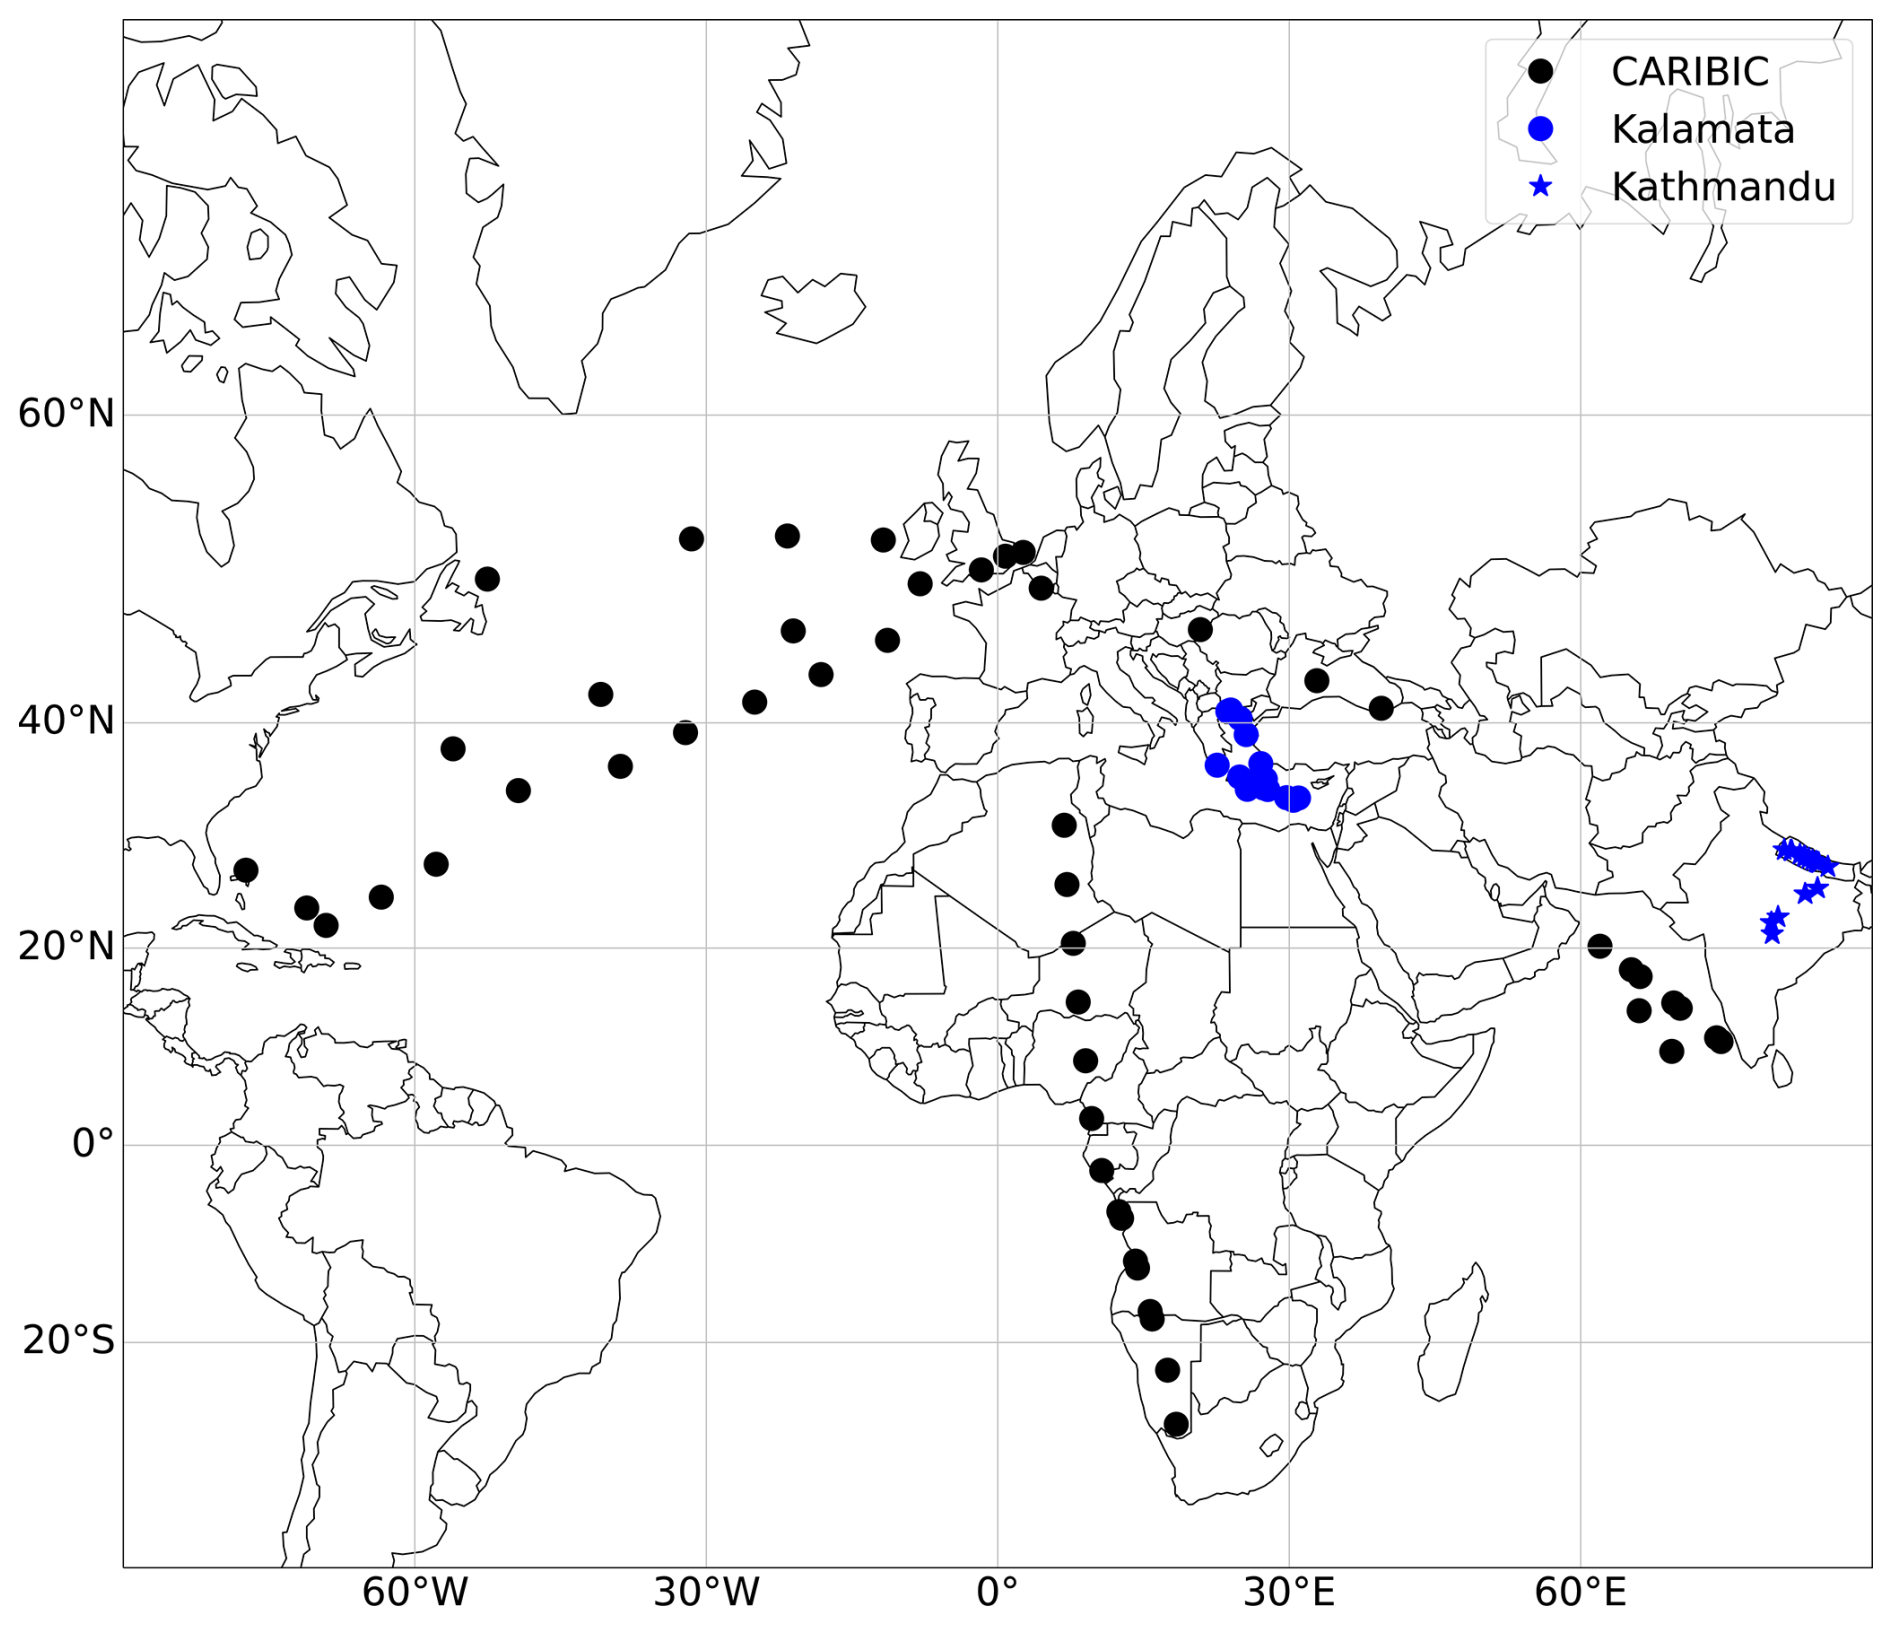
Figure 1Geographical location of the CARIBIC (black markers), StratoClim2016 (blue circles), and StratoClim2017 (blue stars) air samples measured in this study. Upper-tropospheric CARIBIC samples are categorized based on the geographical location where they are collected. These categories include Southern Hemisphere samples, Northern Hemisphere samples, African samples (longitude between 7 and 45°), Asian samples (longitude > 45°), and American samples (longitude < 0°).
2.2.1 CARIBIC samples
In the CARIBIC project (Civil Aircraft for the Regular Investigation of the atmosphere Based on an Instrument Container, CARIBIC, https://www.caribic-atmospheric.com/, last access: 20 September 2024), samples were collected using a Boeing 767 aircraft (LTU, Germany). The flights operated at typical commercial cruising altitude between 9 and 12 km, i.e. which is the upper troposphere–lower stratosphere region at higher latitudes and the upper-troposphere region in the mid-latitudes and tropics (Assonov et al., 2010). The details of the CARIBIC instrument container are described in Brenninkmeijer et al. (1999). The payload of the flights before 2003 included large stainless steel canisters for collecting whole-air samples (WAS) (sample size ≈ 340 L STP) at several locations along the flight path. On a single flight 12 discrete samples were collected. Each sample collection took about 20 min, which corresponds to a horizontal distance of 250 km (Brenninkmeijer et al., 1999). The samples collected are relatively dry since the ambient temperature was always below −30 °C, and the relative humidity was about 0.44 % at 20 °C (Assonov et al., 2009b). The air samples were processed soon after they returned to the Division of Atmospheric Chemistry, Max Planck Institute for Chemistry, Mainz, Germany (Pupek et al., 2005). The processing included the extraction of CO2 and CO for isotope analysis, including radiocarbon (Brenninkmeijer, 1993; Assonov et al., 2009b), as well as measurement of several other trace gases including N2O, CH4, and SF6 (Brenninkmeijer et al., 1999). The CARIBIC container was also equipped with an automated in situ analyser for O3 (UV absorption), CO (gas chromatography, GC), and other parameters (Brenninkmeijer et al., 1999). In this study we measured the Δ′17O value of 50 CARIBIC samples.
2.2.2 StratoClim samples
A total of 35 additional air samples were collected on the high-altitude M55 Geophysica aircraft during two campaigns of the StratoClim project (https://www.stratoclim.org/, last access: 10 September 2024) (Stefanutti et al., 1999; Cairo et al., 2010) in 2016 and 2017. In 2016, three flights were conducted over the Mediterranean region from Kalamata, Greece (37°2′ N, 22°7′ E), between 30 August and 6 September, and eight flights were conducted in 2017 over the Indian subcontinent from Kathmandu, Nepal (27°46′ N, 85°16′ E), between 27 July and 10 August. The whole-air sampler of the Institute for Marine and Atmospheric research Utrecht (IMAU), Utrecht University, was used to compress air into 2 L pre-evacuated stainless-steel canisters (Kaiser et al., 2006). We analysed 16 samples from the 2016 flights and 19 samples from the 2017 flights (Table S3 in the Supplement). Further details on sample collection using the Geophysica aircraft can be found in Kaiser et al. (2006) and Stefanutti et al. (1999).
2.3 Extraction of CO2
For the StratoClim samples, the CO2 was extracted from the whole-air samples using a cryogenic extraction system developed at Utrecht University (Adnew et al., 2020, 2023). The extraction system was made of electropolished stainless steel and has four traps. The first two traps remove moisture and condensable organics at dry ice temperature, whereas the third and fourth traps were used to collect CO2 at liquid nitrogen temperature. The extraction was performed at a flow rate of 55 mL min−1.
For the CARIBIC samples, the CO2 had previously been extracted at the Max Planck Institute for Chemistry, Mainz, as described in Assonov et al. (2009b) and Pupek et al. (2005). Two “Russian doll” cryogenic traps (Brenninkmeijer and Röckmann, 1996; Brenninkmeijer, 1991) immersed in liquid nitrogen trapped all condensable gases including CO2, N2O, H2O, and most organics. After pumping out non-condensables, the traps were slowly heated, and the evolving CO2 and N2O were trapped in a U trap cooled with liquid nitrogen, while the H2O remained trapped in the Russian doll traps. The collected CO2 was further dried using P2O5 and flame-sealed in clean vials made of borosilicate glass (Assonov et al., 2009b; Pupek et al., 2005).
2.4 Measurement of δ13C, δ18O, and Δ′17O of CO2
The δ18O and δ13C values presented below were measured using a Delta V PLUS isotope ratio mass spectrometer (ThermoFisher Scientific, Germany) in dual-inlet mode at Utrecht University. The interference of N2O was corrected using δ18O = δ18O and δ13C = δ13C (Friedli and Siegenthaler, 1988; Sirignano et al., 2004). Figure 2 shows a comparison of the δ18O and δ13C of CO2 of CARIBIC samples measured in this study with those previously measured at the Max Planck Institute for Chemistry and reported in Assonov et al. (2009b, a, 2010).
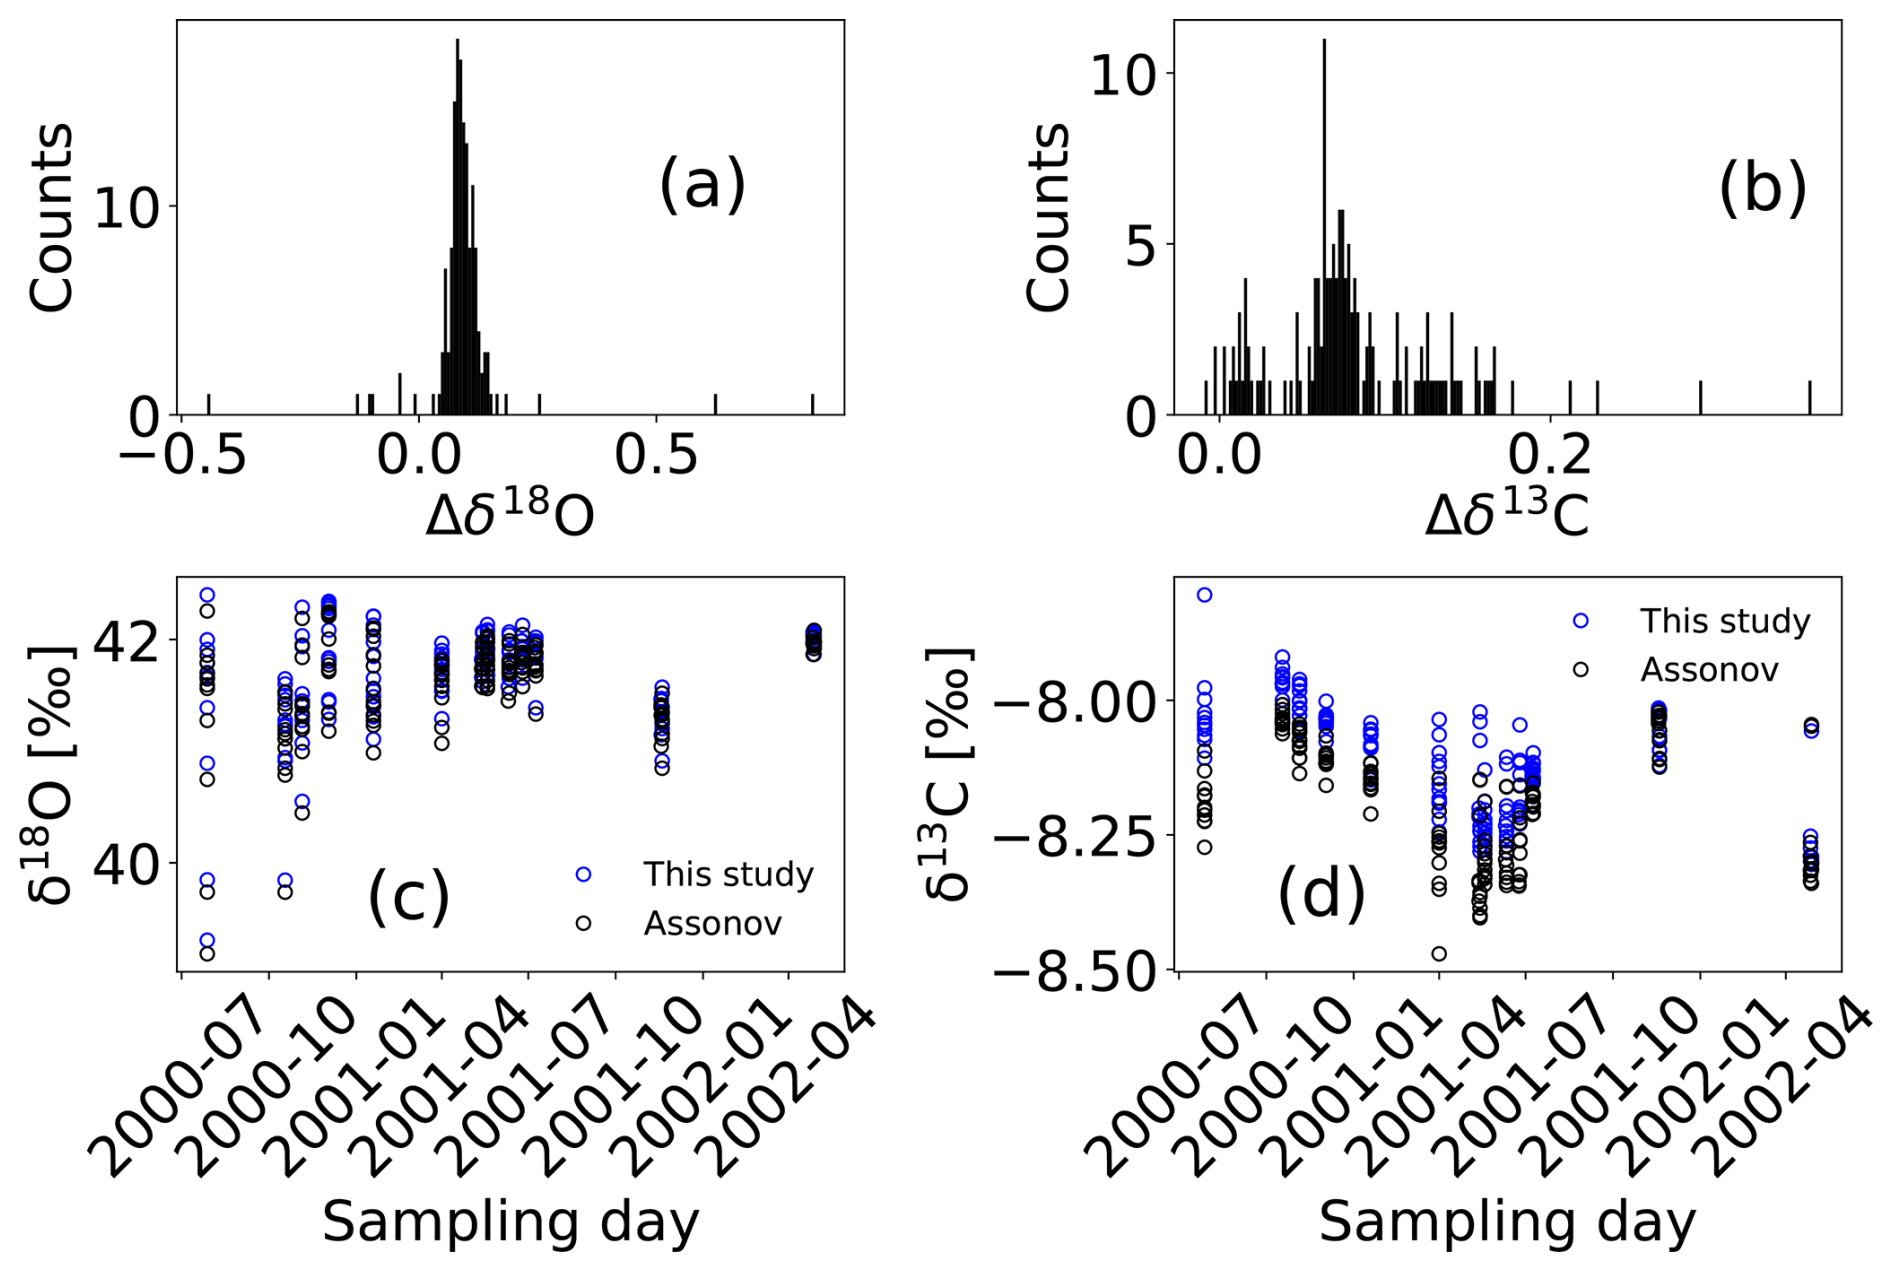
Figure 2The δ18O and δ13C of CARIBIC samples and comparison with values published in Assonov et al. (2009b, a, 2010).
The δ18O values measured in this study are systematically higher compared to the measurement by Assonov et al. (2010) by 0.096 ± 0.008 ‰. For δ13C values, our measurement is also higher by 0.089 ± 0.011 ‰. The reported error is the 95 % confidence limit (standard error of the mean multiplied by Student's t factor). The tight distribution of differences is of the order of the measurement precision, which suggests that the isotopic composition of the samples remained stable during long-term storage in borosilicate glass vials and that the mean offset is due to scale differences. These observed offsets are consistent with the scale uncertainty reported by Assonov et al. (2009a) and better than typical inter-laboratory uncertainties (Levin et al., 2009).
The Δ′17O of the CO2 was determined using the CO2–O2 exchange method (Adnew et al., 2019, 2022, 2023; Barkan et al., 2015) at Utrecht University. Equal amounts of CO2 sample and the laboratory reference O2 (with known isotopic composition) were allowed to exchange isotopes for 2 h in a quartz reactor at 750 °C in the presence of platinum sponge at the bottom of the reactor. After the reaction, the mixture was passed through a liquid-nitrogen-cooled trap to condense the CO2, and the O2 was collected in a separate trap on three pellets of 5Å molecular sieve (1.6 mm, Sigma-Aldrich, USA) at liquid nitrogen temperature. The O2 was then transferred to the bellows of the dual-inlet system of a Delta V PLUS isotope ratio mass spectrometer (ThermoFisher Scientific, Germany) and measured for its isotope composition. The Δ′17O value of the original CO2 was calculated from the change in the isotopic composition of the non-reacted and reacted O2, and knowledge of the precise steady-state O2–CO2 isotope fractionations (Adnew et al., 2019; Barkan et al., 2015). The precision of the CO2 isotope measurements was 0.007 ‰, 0.03 ‰, and 0.008 ‰ for δ13C, δ18O, and Δ′17O, respectively (Adnew et al., 2019, 2020, 2023).
2.5 Calculation of net isotope flux from stratosphere to troposphere
The isotopic composition of CO2 in the upper stratosphere and mesosphere provides a unique tool to study atmospheric transport and chemistry (Boering et al., 2004; Liang et al., 2007, 2008). The Δ′17O(CO2) is primarily modified by O(1D), which is produced photochemically by O3 photolysis. However, the relevant isotope effects occurring in the stratosphere are still not yet good enough (Wiegel et al., 2013; Liang et al., 2007, 2008). Nevertheless, an empirical estimate of the isotope flux from the stratosphere can be derived from measurements near the tropopause, like the ones presented here. As described in detail by Plumb and Ko (1992) and Plumb (2007), gases that are chemically long-lived relative to vertical and quasi-horizontal transport timescales exhibit compact correlations in the stratosphere, and the slope of the observed correlation between the two tracers is equal to the ratio of their net vertical fluxes. Following this approach, Luz et al. (1999) and Boering et al. (2004) determined the global annual mean net isotope flux (NIF) from the stratosphere (ST) to the troposphere (T) for Δ′17O of CO2 using the Δ′17O(CO2)–N2O correlation as described in detail by Garofalo et al. (2019).
The terms MF, , and m stand for the total air mass flux from the stratosphere to the troposphere, the global N2O loss rate, and the correlation slope between Δ′17O and N2O, respectively. In our analysis, this correlation slope is determined using a Williamson–York bivariate fit, accounting for uncertainties in both the Δ′17O(CO2) and N2O data (Mikkonen et al., 2019). There is a significant variation in estimates for the air mass flux from the stratosphere to the troposphere. For instance, the estimates by Holton et al. (1995) and Appenzeller et al. (1996) differ by a factor of 3 in their calculated cross-tropopause air mass fluxes, but note that the troposphere definitions are also different. As described in Garofalo et al. (2019), the net isotope flux is not strongly sensitive to the actual air mass fluxes. Since the mole fraction of CO2 in the lower stratosphere and troposphere is the same within about 1 %, Eq. (5) can be simplified to
The uncertainty in the estimated net annual mean flux of Δ′17O(CO2) depends on the uncertainty of m and . In our calculation, we used 370 ppm for [CO2], the average value for CARIBIC samples, most of them collected in the year 2001.
In the stratosphere the CO2 and N2O isotopes are influenced by different processes. N2O is mainly destroyed by N2O photolysis, but it is also affected by O(1D) in the lower stratosphere and upper troposphere. Since N2O photolysis and O3 photolysis occur at different wavelengths, the relationship between Δ′17O(CO2) and N2O contains valuable information about atmospheric chemistry and transport. The lifetime of N2O varies with altitude. In the upper stratosphere and mesosphere, the N2O lifetime decreases, leading to greater scatter. This scatter remains small until transport time becomes shorter than the N2O lifetime. The scatter in Δ′17O(CO2) vs. N2O mixing ratio plots of Δ′17O (CO2) vs. N2O is mainly caused by latitudinal variations in the age of the air in the stratosphere. Δ′17O(CO2) values increase with altitude as N2O mixing ratios decrease below ≈ 70 km. However, above 70 km, Δ′17O(CO2) begins to decrease with further decreases in N2O mixing ratios. However, in the lower stratosphere and upper troposphere, where the lifetime of N2O against photolysis is longer than the transport time, the scatter in N2O values remains low (Liang et al., 2007, 2008). The Δ′17O(CO2)–N2O correlation remains consistent both spatially and temporally in the lower stratosphere and the upper troposphere (Liang et al., 2007, 2008). Since the net isotope flux of Δ′17O(CO2) is derived from samples from the lower stratosphere and upper troposphere, the observed variability (scatter) in the stratosphere does not affect the global average Δ′17O(CO2)–N2O slope used to estimate the flux of Δ′17O(CO2) from the stratosphere to the troposphere.
2.6 Estimating gross surface flux using Δ′17O(CO2)
The CARIBIC samples analysed in this study cover latitudes from 30° south to 54° north (see Fig. 1). We used these samples to estimate surface emissions using a mass balance box model calculation. The box model used in this study is not suitable for simulating the spatial and temporal variability of Δ′17O(CO2) (Koren et al., 2019). Our box model is an extended version of those used by Hoag et al. (2005) and Liang et al. (2017b). Hoag et al. (2005) used a two-box model to explore the relative contributions to the production of Δ′17O(CO2) in the stratosphere, its flux to the troposphere, and its destruction or dilution by various surface carbon fluxes in the troposphere. Liang et al. (2017b) used a one-box model, in which the major surface resetting processes were explicitly included to distinguish terrestrial fluxes from oceanic fluxes. In our model, we incorporated an intermediate upper-troposphere (UT) box. Furthermore, our study includes measurements of Δ′17O from both hemispheres and different seasons. The Δ′17O(CO2) value in the UT depends on the Δ′17O(CO2) value of stratosphere (ST) and surface processes (assimilation/photosynthesis (A), respiration (R), soil invasion (SI), ocean (o), and anthropogenic emission (anth)) and the corresponding fluxes (F). In steady state, the mass balance equation for Δ′17O(CO2) in the upper troposphere is
where FA = Fal−Fla = 0.88×GPP (Ciais et al., 1997a), with al, la, and GPP being atmosphere-to-leaf flux, leaf-to-atmosphere flux, and gross primary production, respectively. ΔAΔ′17O is the discrimination against Δ′17O during assimilation and is calculated as ΔAΔ′17O = , as described by Adnew et al. (2020) (see the Supplement for more detail). This parameterization was derived from leaf cuvette studies using both C3 and C4 plants under different light conditions. cm and ca represent the CO2 mole fraction in the mesophyll and the atmosphere, respectively. Δ′17OM is the Δ′17O of CO2 in the mesophyll, calculated from the Δ′17O value of meteoric water (MW) (Landais et al., 2007; Barkan and Luz, 2012; Bottinga and Craig, 1968; Brenninkmeijer et al., 1983); see also the Supplement.
The estimates of soil invasion fluxes are highly uncertain; the reported values in the literature vary from < 10 PgC yr−1 (Stern et al., 2001) to 450 PgC yr−1 (Wingate et al., 2009). For this study, we assume that FSI and FR are equal, and FA = 0.88×GPP = (Liang et al., 2017b). Substituting this term in Eq. (7),
The Δ′17Oanth value is −0.446 ± 0.077 ‰ (Horváth et al., 2012; Laskar et al., 2016). The Δ′17Oo value is calculated from the Δ′17O value of ocean water (OW) (Table 1). Similarly, the Δ′17O values for soil invasion and respiration are derived from the Δ′17O value of meteoric water (Liang et al., 2023; Koren et al., 2019; Hofmann et al., 2017). For the calculations, we used a surface temperature of 15 °C and a relative humidity of 75 % (Dai, 2006). The sensitivity of ΔAΔ′17O to temperature and relative humidity is shown in Fig. S1 of the Supplement. The value of ΔAΔ′17O increases with an increase in relative humidity but decreases with increasing temperature. Using the parameters described above and provided in Table 1 and Eq. (8), we estimated the gross primary production (GPP), surface flux (including land and ocean), and the oxygen isotope residence time (turnover time) of CO2 in the atmosphere. The oxygen isotope residence time of CO2 in the atmosphere is defined by the ratio of the atmospheric CO2 mass loading (Ma) and the CO2 surface flux (Welp et al., 2011). The error for all estimated values is determined using a Monte Carlo simulation with 106 runs, where values of the input parameters are randomly picked from a normal distribution defined by their uncertainty.
Bottinga and Craig (1968)Brenninkmeijer et al. (1983)Farquhar and Lloyd (1993)Miller et al. (1999)Landais et al. (2007)Barkan and Luz (2012)Young et al. (2002)Ciais et al. (1997b)Farquhar et al. (1993)Farquhar et al. (1993)Farquhar et al. (1993)Stocker et al. (2013)Stocker et al. (2013)Stocker et al. (2013)Saugier et al. (2001)Barkan and Luz (2012)Barkan and Luz (2012)Table 1Summary of parameters used for the box model mass balance calculation in Eq. (8). T and RH represents temperature in kelvin and relative humidity near the Earth's surface, respectively.
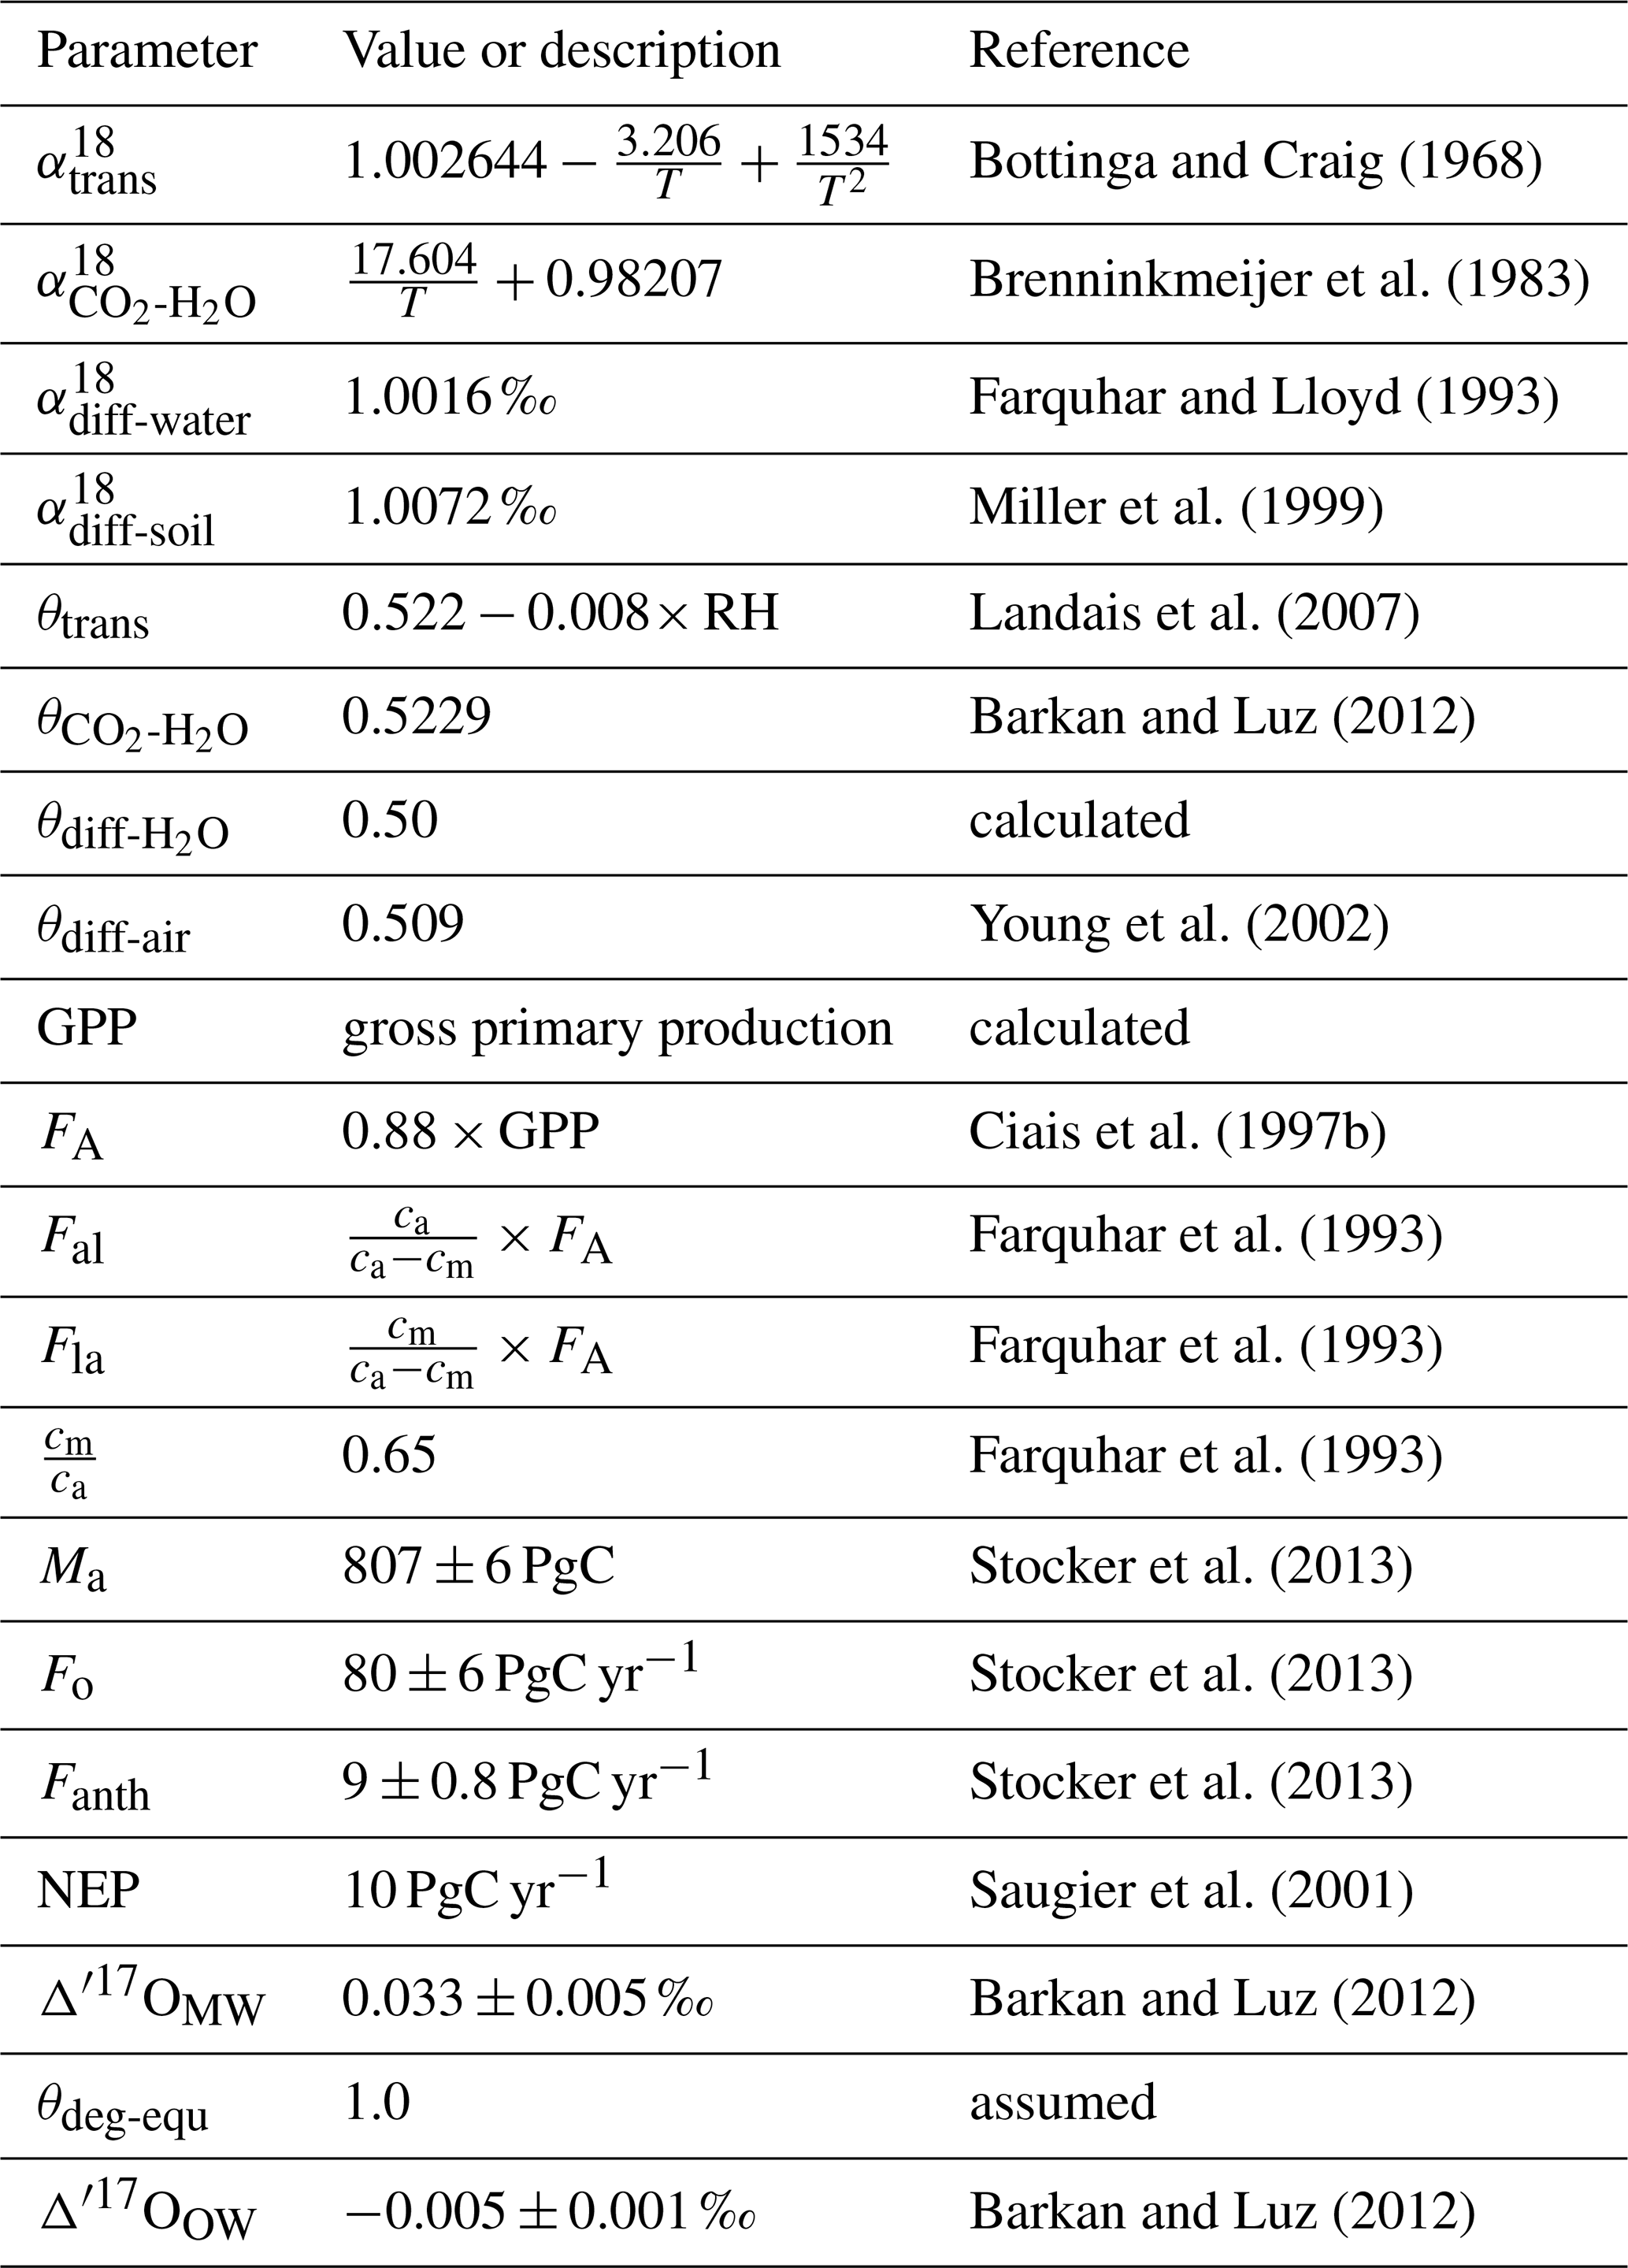
The sensitivity of GPP to relative humidity, temperature, the Δ′17O value of the upper troposphere, and the net flux of Δ′17O from the stratosphere to the troposphere is shown in Figs. S2 and S3. A higher net flux of Δ′17O to the troposphere leads to an increase in GPP to fulfil the isotope balance of Eq. (8). An increase in relative humidity leads to a decrease in GPP due to an increase in ΔAΔ′17O. Conversely, an increase in temperature results in an increase in GPP, as higher temperatures cause a decrease in ΔAΔ′17O, as described above. The parameters used in the mass balance calculations and their errors are provided in Table 1.
2.7 De-trending and classification of samples into the upper troposphere and stratosphere
To ensure comparability of previously published data and the CARIBIC and StratoClim samples measured in this study, all N2O measurements were trend-corrected to the year 2001 following a similar approach described in Koren et al. (2019).
Here, N2Oobs, N2Odet, N2Oref, and N2Ogrowthrate refer to the observed and detrended mole fractions of N2O, the mole fraction of N2O at the reference time, and the growth rate of N2O in the troposphere, respectively. The variables tobs and tref represent the time of observation and the reference time (1 July 2001). The growth rate of N2O in the troposphere, used in this study, is 0.75 ppb yr−1 (Stocker et al., 2013). The mole fraction of N2O at the reference time (1 July 2001) is 316.24 ppb (Lan et al., 2024).
The mole fraction of CH4 in the StratoClim data was detrended to 2007 using an average growth rate of 12 ppb yr−1 (Nisbet et al., 2019). The 2007 mole fraction of CH4 is assumed to be the same as the CH4 mole fraction in 2001, since the atmospheric CH4 mole fraction was stable between 2000 and 2007 (Nisbet et al., 2019).
We used the N2O–CO correlation to classify air samples into upper-tropospheric and upper-stratospheric samples, as described in detail by Assonov et al. (2013). N2O maintains a nearly constant tropospheric concentration, as it is minimally affected by chemical processes and has no significant atmospheric sources. This stability allows stratospheric influence to be more easily identified. The correlation between N2O and CO forms an L-shaped curve, similar to O3–CO correlations observed during stratosphere–troposphere air mass mixing events (Assonov et al., 2013). As a result, the troposphere corresponds to the horizontal branch (high N2O, variable CO), while the stratosphere, free from tropospheric influence, corresponds to the vertical branch (low CO, variable N2O). The CARIBIC samples are mostly from the upper troposphere (UT) and include a few from the lower stratosphere (see Fig. S4). Based on the mole fraction of N2O, we grouped the Δ′17O values into two categories: upper-troposphere (UT) samples (N2O ≥ 313.5 ppb) and lower-stratosphere (LS) samples (N2O < 313.5 ppb). We further divided the lower stratosphere into two subgroups: 313.5 > N2O > 306 ppb and N2O < 306 ppb. Furthermore, we used a zonal average tropopause pressure simulated using the TM5 model as outlined in Krol et al. (2018) and the age of air tracer, to support the classification of samples into upper tropospheric and upper stratospheric. The age of air was calculated using SF6 measurements, as described in Krol et al. (2018). Most of the samples classified as upper tropospheric based on the mole fraction of N2O were collected far below the tropopause, whereas the samples classified as stratospheric were collected above or close to the tropopause with a few exceptions (see Fig. S5).
Figure 3a shows Δ′17O(CO2) as a function of latitude for the CARIBIC samples. The samples classified as upper-tropospheric Δ′17O(CO2) do not show geographic variations between large regions referred to as America, Asia, and Africa, respectively (see Fig. 1), and no statistically significant difference in Δ′17O(CO2) between the hemispheres (see Fig. 3b). Table S2 presents the mole fraction of CO2, O3, CO, N2O, and CH4, along with the isotopic composition of CO2 (δ13C, δ18O and Δ′17O) for the analysed CARIBIC samples. Similarly, the mole fraction of CO2 and other trace gases (O3, CO, N2O, and CH4), along with the isotopic composition of CO2 for StratoClim samples, is shown in Table S3.
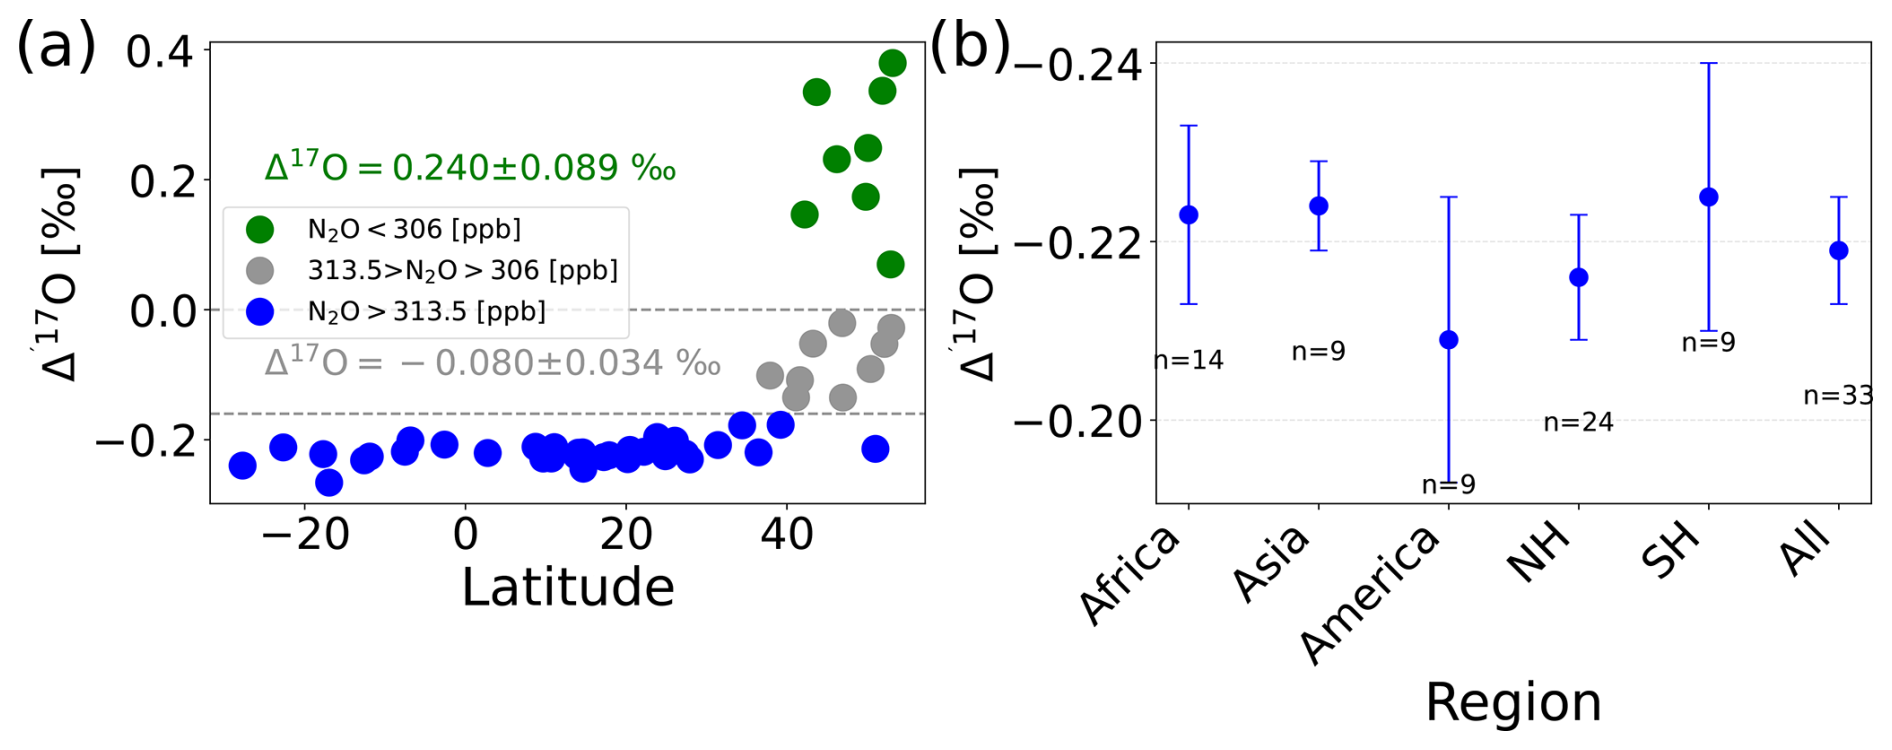
Figure 3(a) Δ′17O(CO2) values of CARIBIC samples as a function of latitude. The Δ′17O values are grouped into three categories based on the mole fraction of N2O as described in the text. (b) Average Δ′17O value of all upper-tropospheric CARIBIC air samples and larger geographical regions. The errors are the standard error of the mean multiplied by Student's t factor for the 95 % confidence limit. n, SH, and NH stands for the number of samples, Southern Hemisphere, and Northern Hemisphere, respectively.
Figure 4 shows the correlation of Δ′17O(CO2) measurements with the mole fractions of CH4 and N2O. For both sets of samples (CARIBIC and StratoClim), N2O and Δ′17O(CO2) are clearly correlated, with R2 values of ≥ 0.9, as shown in Fig. 4. Similar tight correlations between N2O and Δ′17O(CO2) were reported in the previous studies, as shown in Fig. 6. Interestingly, StratoClim samples plot in two distinct groups of N2O–Δ′17O(CO2) correlations. Most of the StratoClim samples with Δ′17O < 0.2 ‰ have a similar N2O–Δ′17O slope as the CARIBIC samples as shown in Fig. 4a. However, unexpectedly the N2O–Δ′17O correlation slope for most of StratoClim samples with Δ′17O > 0.2 ‰ is much lower (−0.017 ‰ ppb−1) (see Fig. 4a).
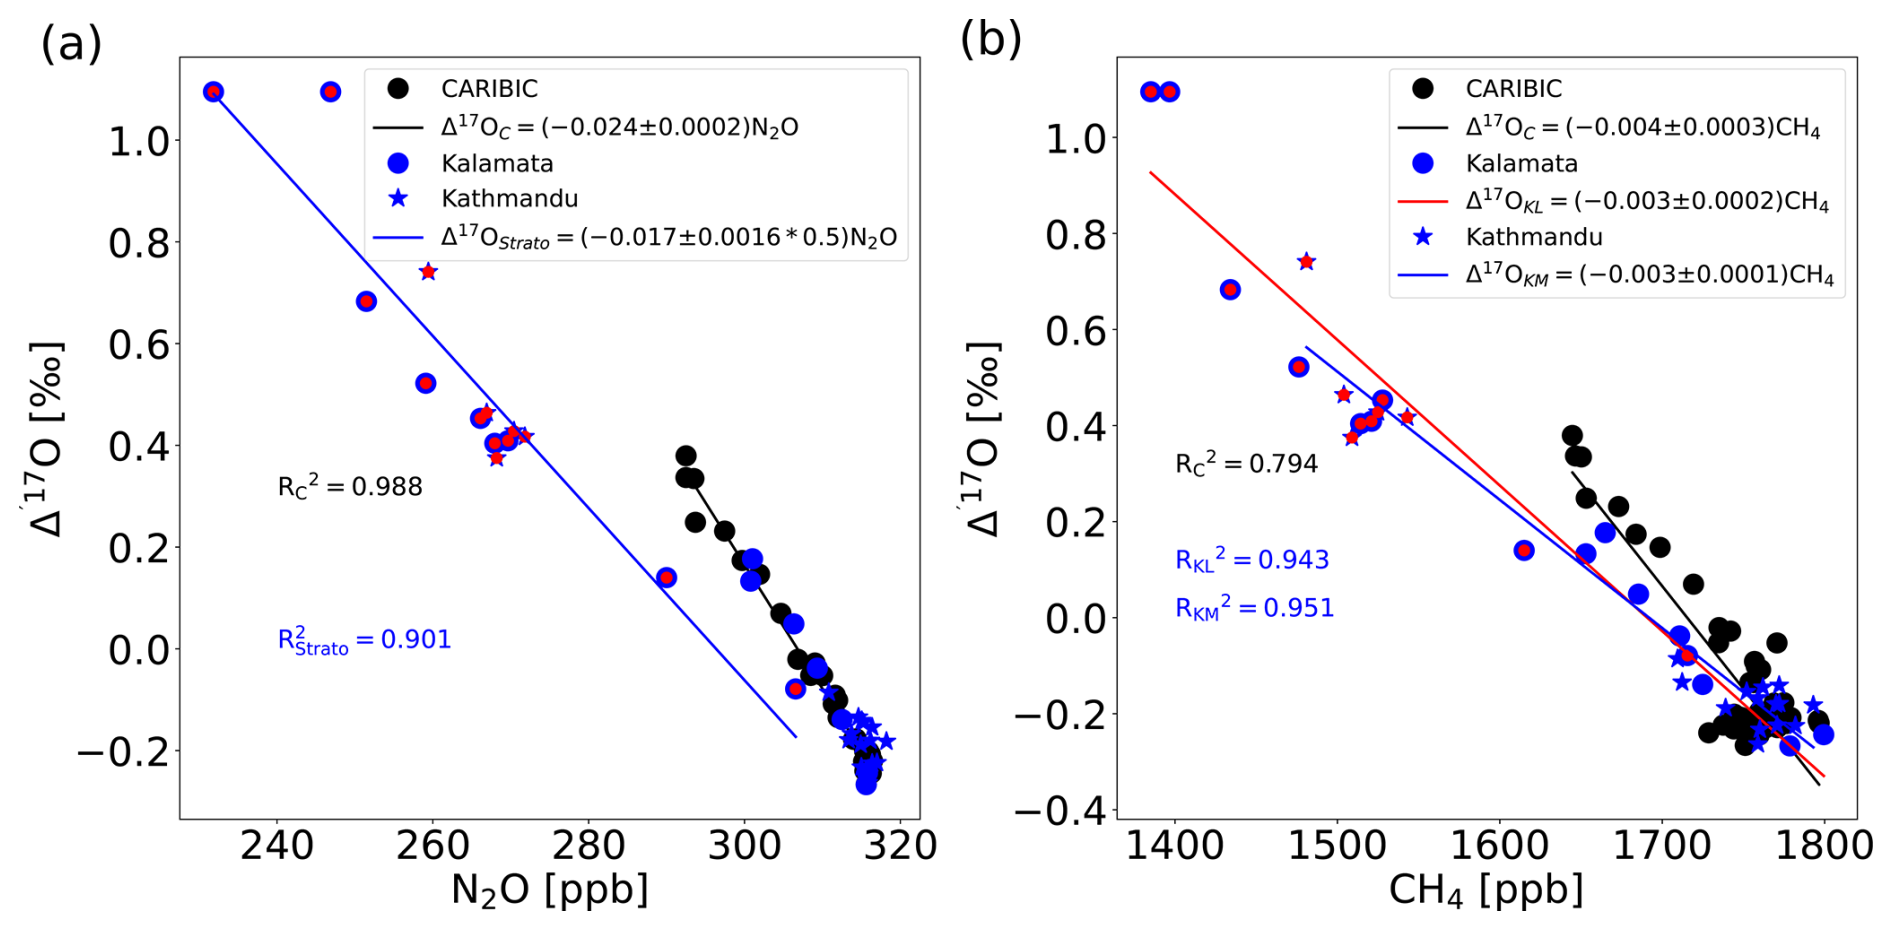
Figure 4Correlation of Δ′17O(CO2) with (a) N2O for StratoClim samples (StratoClim-2016 is Kathmandu (KT; blue stars) and StratoClim-2017 is Kalamata (KL; blue circles)) and CARIBIC samples (black circles) and (b) CH4. The errors of the linear regression slopes are the 95 % confidence interval. The data points marked in red indicate StratoClim samples with a low N2O–Δ17O correlation slope.
As shown in Fig. 4b, there is a strong inverse correlation between CH4 and Δ′17O. For the StratoClim samples, the correlation is higher compared to the CARIBIC samples, with R2 values of ≥ 0.9 and 0.79, respectively. For both CARIBIC and StratoClim samples with Δ′17O < −0.2 ‰, no clear correlation between CH4 and Δ′17O can be established (see Fig. 4b).
Figure 5 shows the three-isotope plot for both CARIBIC and StratoClim samples. The three-isotope plot of upper-tropospheric samples shows a tight correlation for both CARIBIC and StratoClim samples with slopes of 0.540 ± 0.005 and 0.556 ± 0.012, respectively (Fig. 5). For the StratoClim samples with higher stratospheric influence, the ln (δ17O+1) vs. ln (δ18O+1) is poorly correlated. It is apparent in Fig. 5a that the vertical offsets from the fit line defined by the upper-tropospheric samples get larger for larger stratospheric age, which is shown as colour coding. Figure 5b shows the correlation between the age of the air and Δ′17O(CO2). An increase in the age of the air correlates well with a progressive enrichment of Δ′17O(CO2).
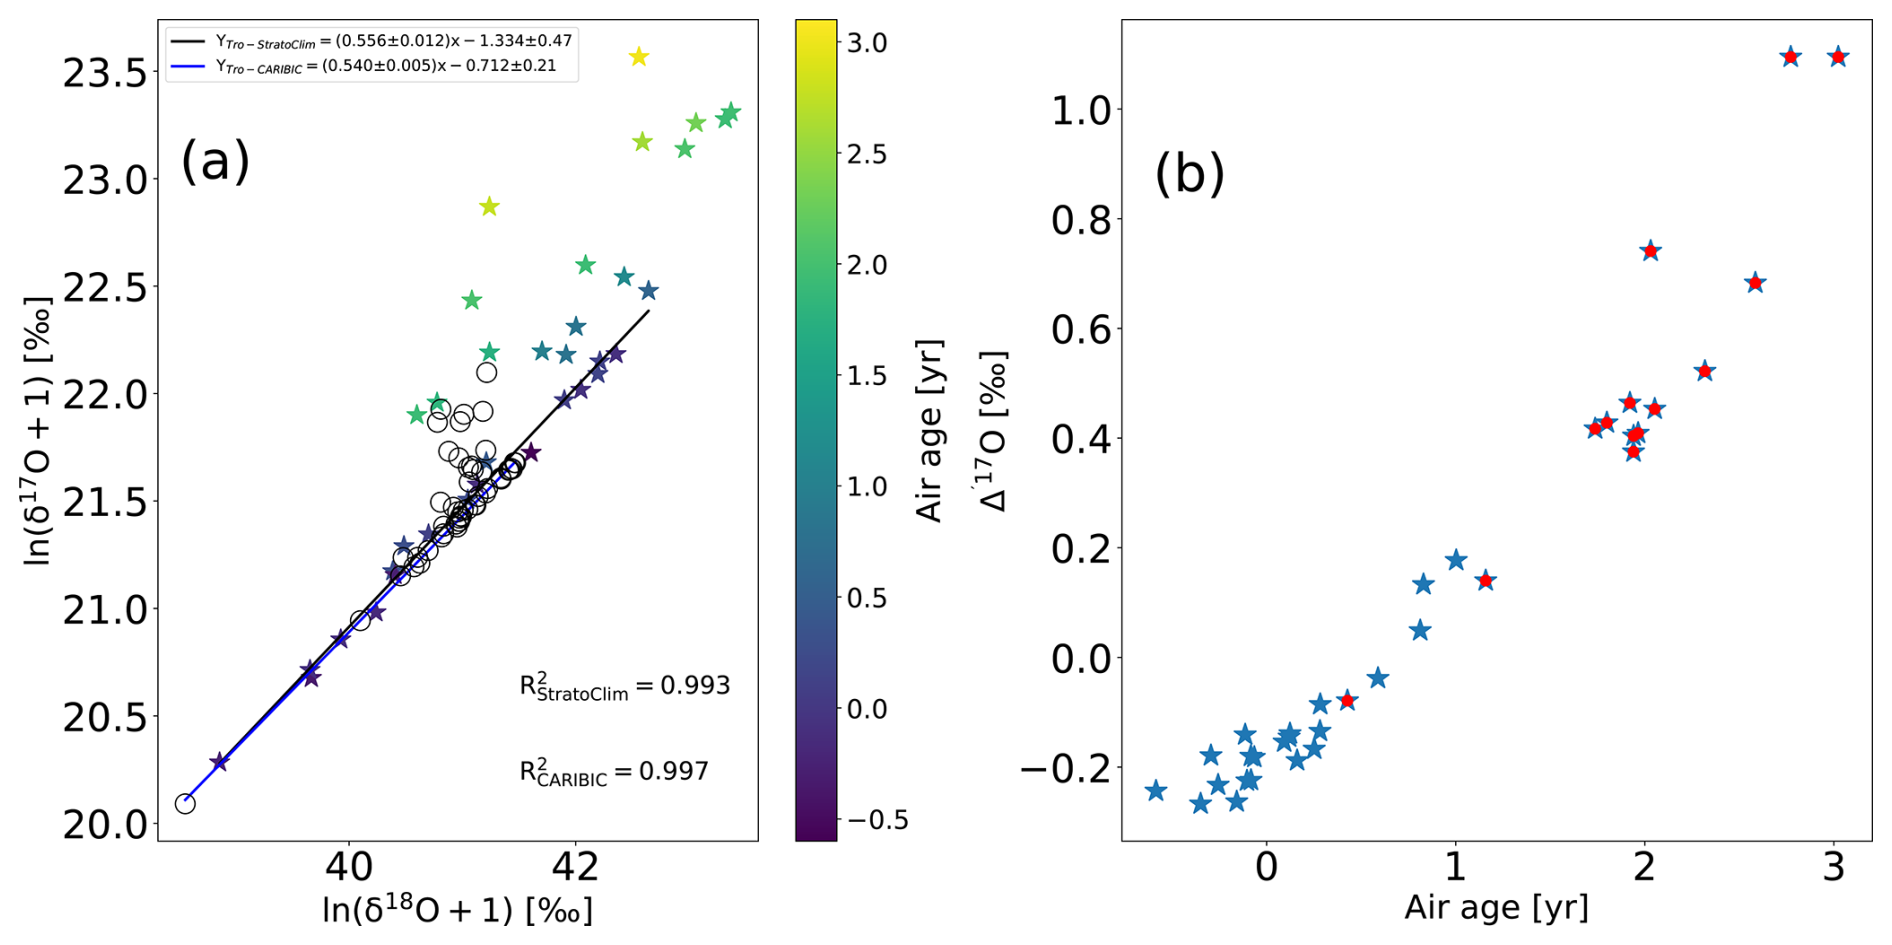
Figure 5(a) Three-isotope plot for StratoClim (stars) and CARIBIC (open circles) samples. The linear regression is a fit to the samples identified as upper tropospheric based on the N2O mole fraction. The colour bar indicates the age of the air mass for the StratoClim samples reported in Adcock et al. (2021). The stated errors for the linear regression parameters are the 95 % confidence intervals. (b) Relationship between the age of the air and Δ′17O(CO2) for StratoClim samples. The data points marked in red indicate samples with a low N2O–Δ17O correlation slope.
Figure 6 shows a comparison of our CARIBIC and StratoClim samples measured in this study with previously published Δ′17O measurements of upper-tropospheric and stratospheric CO2 (Thiemens et al., 1995a, b; Alexander et al., 2001; Lämmerzahl et al., 2002; Boering et al., 2004; Wiegel et al., 2013; Kawagucci et al., 2005; Yeung et al., 2009). Four different characteristics are shown: the three-isotope plot (Fig. 6a), Δ′17O as a function of altitude (only for StratoClim samples) (Fig. 6b), the N2O–Δ′17O correlation (Fig. 6c), and the CH4–Δ′17O correlation (Fig. 6d). In these overview plots of N2O–Δ′17O and CH4–Δ′17O plots, the new CARIBIC and StratoClim measurements are almost indistinguishable from the measurements reported in the literature. However, when we zoom in and compare the correlation slopes, clear differences for some of the measurements become apparent, such as those shown in Fig. 4a for the variation in the N2O–Δ′17O correlation between CARIBIC and StratoClim samples.
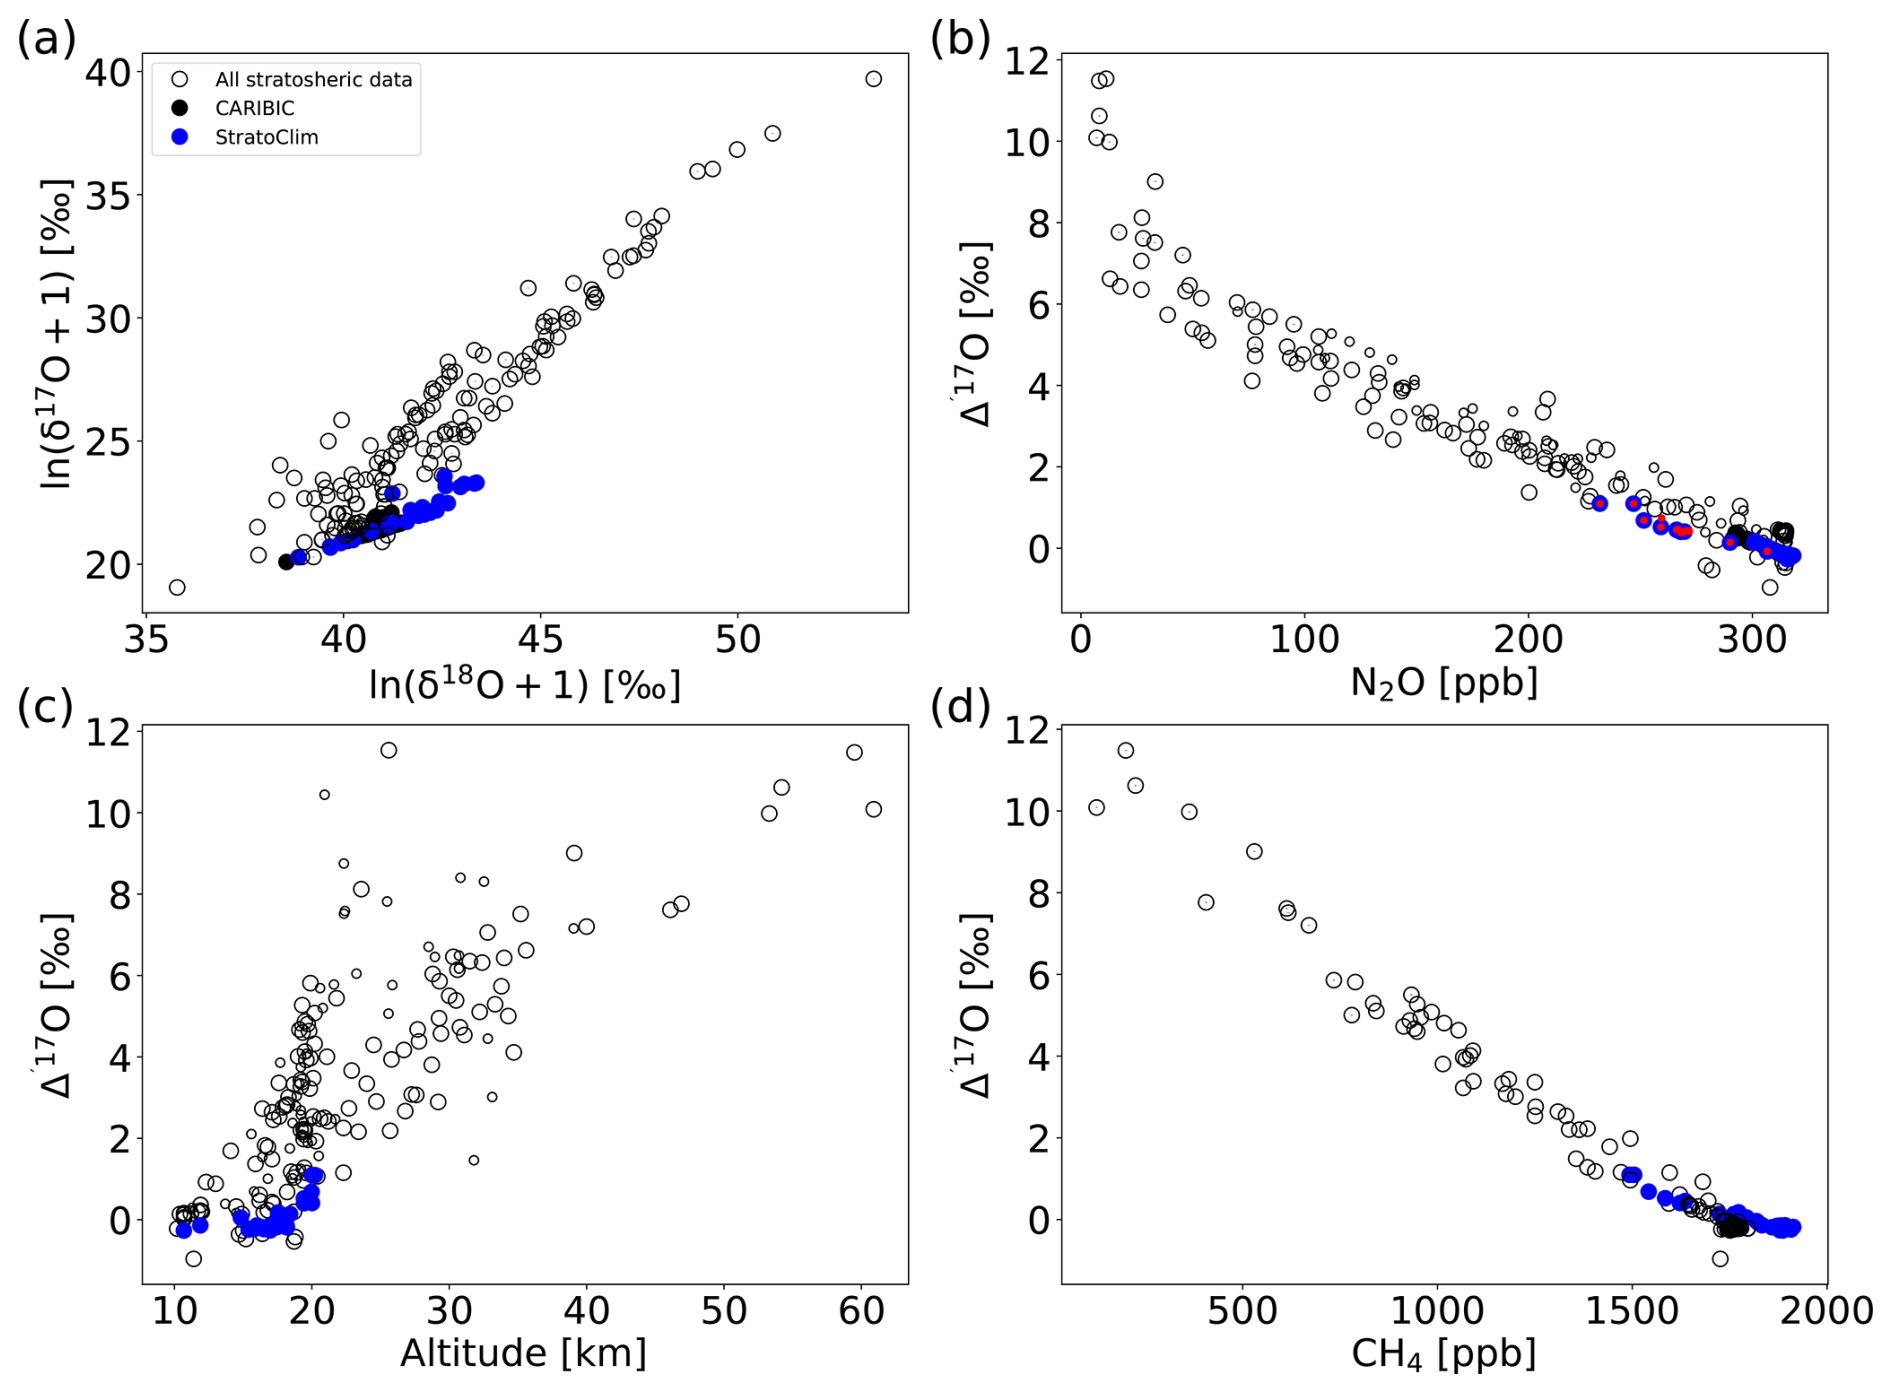
Figure 6Comparison of results from CARIBIC samples (black circles) and StratoClim samples (blue circles) to previous publications (open circles). (a) Three-isotope plot and (b) correlation of Δ′17O(CO2) with N2O. The data points marked in red indicate StratoClim samples with a low N2O–Δ17O correlation slope. (c) Correlation of Δ′17O(CO2) with altitude and (d) correlation of Δ′17O(CO2) with CH4. Previous stratospheric samples are from Thiemens et al. (1995a, b), Alexander et al. (2001), Lämmerzahl et al. (2002), Boering et al. (2004), Wiegel et al. (2013), Kawagucci et al. (2005), and Yeung et al. (2009).
When the CARIBIC and StratoClim samples presented here are separated into upper tropospheric and upper stratospheric based on N2O levels, these two groups exhibit distinct characteristics. The upper-tropospheric samples show a tight correlation on the three-isotope plot, whereas the stratospheric samples display significant variability without a clear correlation. Interestingly, the three-isotope slopes (from a linear fit to the data) for the upper-tropospheric samples are higher than the expected canonical range for tropospheric samples (λ > 0.5309). This indicates that upper-tropospheric air already has a stratospheric influence. The contribution of stratospheric air in the CARIBIC samples is evident from an excellent correlation between Δ′17O(CO2) and both 14C(CO) and O3, as illustrated in Fig. 7. Both 14CO and O3 are reliable tracers for stratospheric air (Brenninkmeijer et al., 1995). Similar correlations between 14CO and Δ′17O(CO2) have been previously reported for stratospheric CO2 (Thiemens et al., 1995b; Brenninkmeijer et al., 1995).
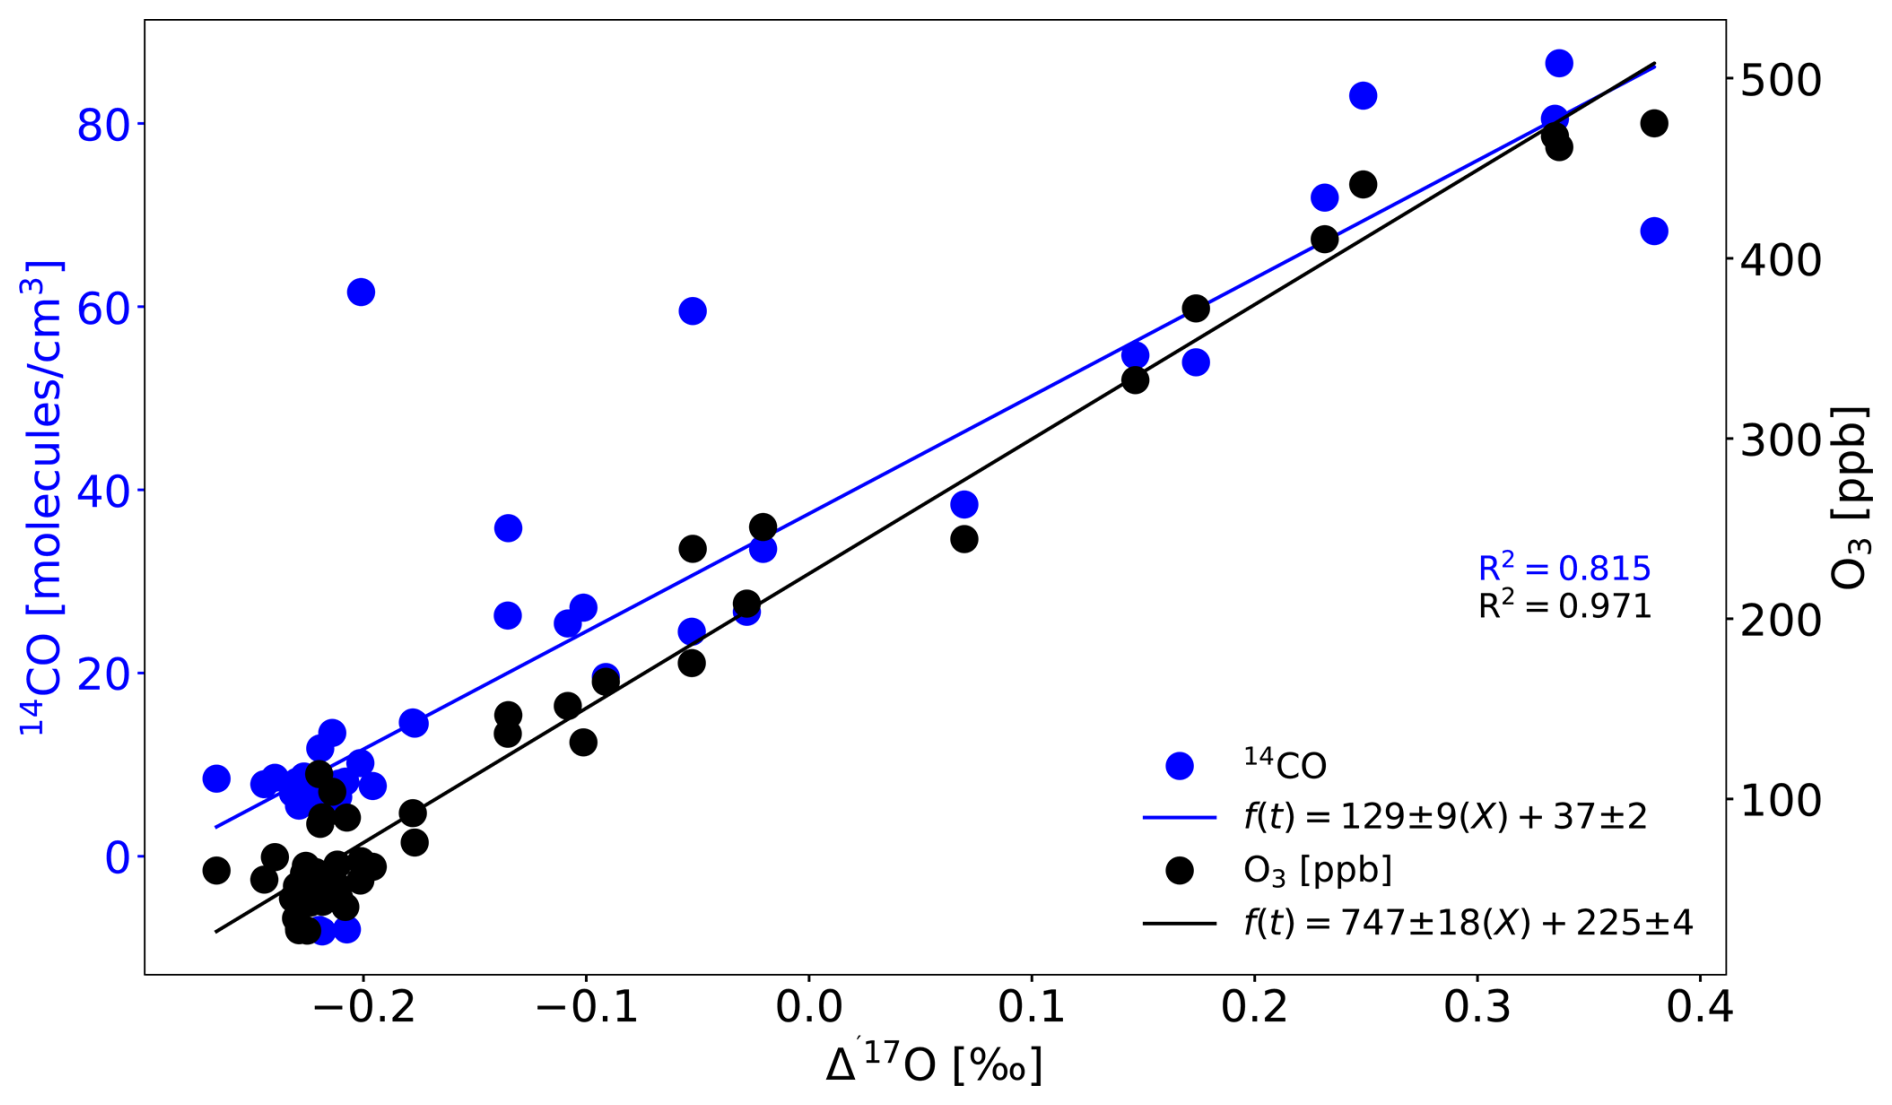
Figure 7Correlation of Δ′17O with stratospheric air tracers 14CO and O3 for CARIBIC samples.
The observed scatter in the three-isotope plot for the stratospheric samples is conceptually similar to the scatter reported in previous studies (Boering et al., 2004; Wiegel et al., 2013; Mrozek, 2017; Thiemens et al., 1995a). In these publications it was mostly assumed to be due to the low precision of the measurement method. However, in this study, with high-precision measurements, a similar scatter in the three-isotope plot is observed, demonstrating that the scatter observed in the three-isotope plot for stratospheric samples is a real signal of mixing, transport and production of Δ′17O(CO2) (i.e. exchange between O(1D) and CO2). The tight correlation with the age of air provides a clear clue to explain this lack of correlation. The longer CO2 has been exposed to the stratospheric CO2–O(1D) exchange, the higher the Δ′17O(CO2) signal is (Yung et al., 1997; Gamo et al., 1995; Yung et al., 1991). The fact that the different samples do not line up on a single three-isotope correlation line shows that we have sampled stratospheric air originating from different upper-tropospheric “entry values” before entering the stratosphere. These differences in entry values are likely driven by the seasonality of δ17O(CO2) and δ18O(CO2). Thus, different tropospheric air masses have entered the stratosphere from various points along the correlation line established by the upper-tropospheric samples. Once in the stratosphere, photochemical isotope exchange with O1D occurs, and the samples progressively acquire a higher Δ′17O(CO2) signature as the sampled air resided longer in the stratosphere. This is clearly demonstrated by the strong correlation between Δ′17O(CO2) and the age of air, and it was not clearly visible in previous studies because of the higher measurement uncertainty.
Interestingly, despite our high measurement precision, we did not observe significant geographic variations in Δ′17O(CO2) of CARIBIC air samples classified as upper troposphere (see Fig. 3b), which could potentially arise from varying stratospheric and tropospheric air mass influences in different geographical regions. The lack of geographic variability contrasts with the reported regional Δ′17O(CO2) variability at the surface (Liang et al., 2017a, 2023). Apparently, the variability at the surface, caused by sources and sinks of CO2, including isotope exchange with surface water reservoirs and anthropogenic emissions, is no longer visible in the upper troposphere, where the reservoir seems to be relatively well mixed in terms of Δ′17O(CO2). Air masses in the upper troposphere experience rapid horizontal mixing, which could explain the uniform stratospheric influence in the CARIBIC samples.
The slope of two tracers near the tropopause is a measure of their relative net fluxes between the troposphere and stratosphere (Plumb and Ko, 1992; Plumb, 2007). The slope of N2O–Δ′17O(CO2) was first used by Luz et al. (1999) and Boering et al. (2004) to quantify the so-called isoflux of Δ′17O(CO2) from the stratosphere into the troposphere. Previous measurements had a lower precision and could not define the slope close to the tropopause but only for older stratospheric air. Our high-precision measurements of Δ′17O(CO2) allow us to determine the N2O–Δ′17O(CO2) slope right down to the tropopause. Figure 8 shows that the slope for CARIBIC samples is indistinguishable from the correlations reported in the previous studies for stratospheric samples (−0.024 ‰ ppb−1) (Kawagucci et al., 2008; Wiegel et al., 2013; Boering et al., 2004). However, the regression lines have an offset. This offset likely arises from variations in the Δ′17O(CO2) measurement scales among different laboratories. Recently, Liang et al. (2023) reported a scale offset in Δ′17O(CO2) of 0.037 ‰ to 0.042 ‰ between two laboratories (Institute of Earth Sciences, Academia Sinica, and Institute of Earth Sciences, Hebrew University of Jerusalem). To optimize the application of Δ′17O(CO2) measurements, the implementation of interlaboratory calibration is crucial (Adnew and Röckmann, 2023). A recent study by Laskar et al. (2019) reported a higher slope (0.036 ‰ ppb−1) for the N2O–Δ′17O correlation of CARIBIC samples collected during two flights. The samples they analysed mostly represent upper-troposphere air, evident from a lower O3 mole fraction compared to the CARIBIC samples measured in this study. This is supported by the relatively low three-isotope slope of 0.48 reported by Laskar et al. (2019) compared to the samples measured in this study (> 0.54). Furthermore, their samples cover only a very small range of N2O (only 3.5 ppb difference, i.e. between 311.5 and 315 ppb), which likely leads to a high error in the determination of the N2O–Δ′17O(CO2) correlation slope.
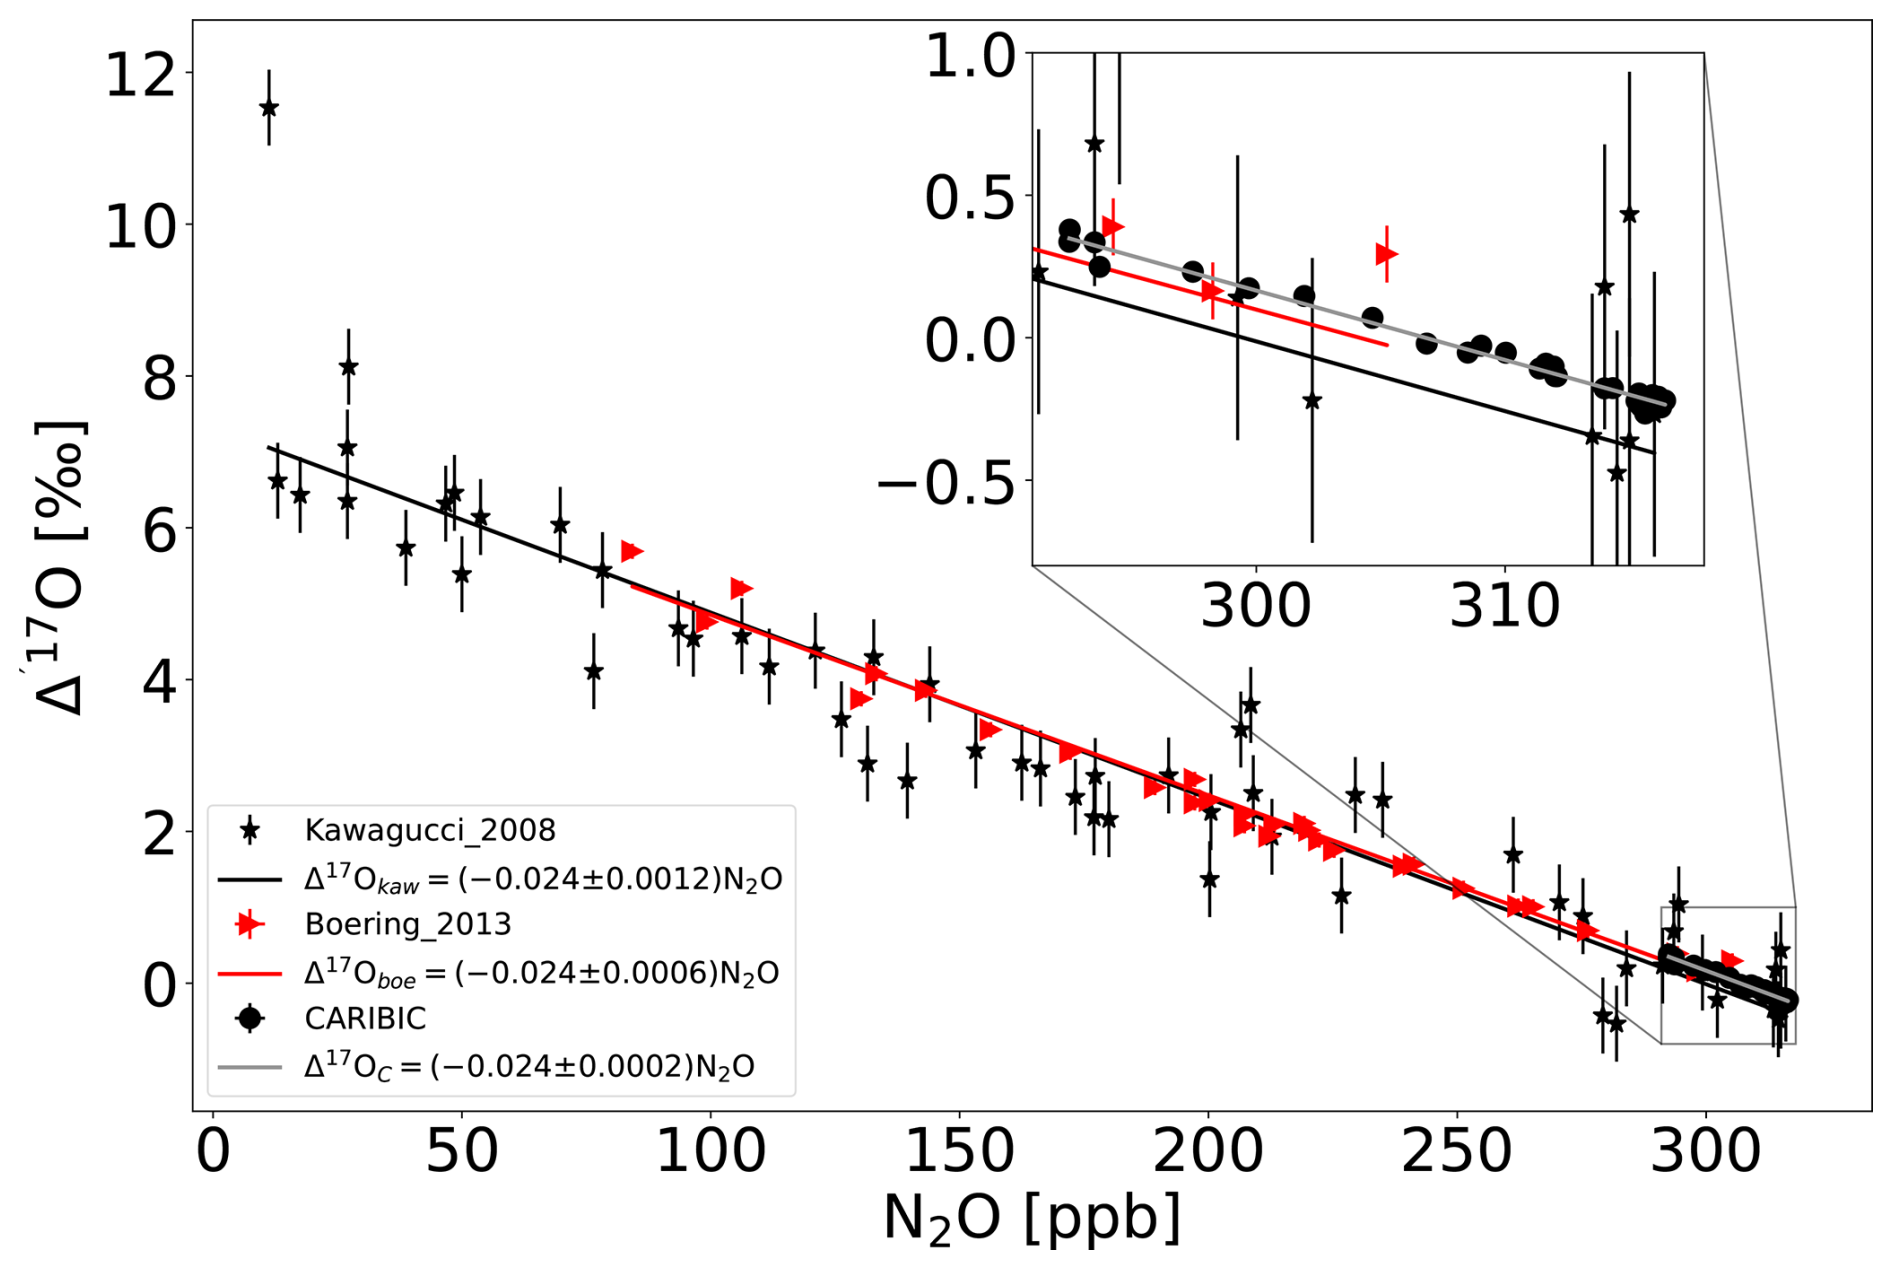
Figure 8Δ′17O–N2O correlation for CARIBIC samples and measurements of Kawagucci et al. (2008) and Boering et al. (2004). The inset shows the zoomed-in view of the data close to the tropopause. For the CARIBIC samples measured in this study, the error bars are smaller than the data markers. For the linear regression slopes, the errors are the 95 % confidence interval.
In contrast, for the StratoClim samples, the N2O–Δ′17O(CO2) correlation shows an unexpectedly low slope of −0.017 ‰ ppb−1, which is about 1.5 times lower than for the CARIBIC and other stratospheric samples (Fig. 4). All our samples were measured in the same laboratory and on the same analytical system. We suggest that the lower N2O–Δ′17O correlation slope for StratoClim samples is due to enhanced vertical mixing during the Asian summer monsoon anticyclone (ASMA), as these samples were collected during mid-June to early September. The ASMA causes deep convection and anticyclonic flow in the upper troposphere and lower stratosphere (UTLS) where tropospheric air masses are uplifted into the UTLS (Park et al., 2009; Vogel et al., 2015, 2016; Brunamonti et al., 2018). The lifetime for CO2 isotopic exchange is much slower than the transport time at all altitudes, whereas the photochemical production and quenching rates for O1(D) are much faster than transport processes. Therefore, the isotopic composition of stratospheric CO2 should reflect both the variety of transport histories of air parcels and the sources of O1(D) (Liang et al., 2007; Boering et al., 2004). Furthermore, throughout the entire atmosphere, the CO2 isotopic exchange time is longer than the transport time. However, the lifetime of N2O varies with altitude. In the lower stratosphere, the lifetime of N2O against photolysis is longer than the transport time, resulting in less variability in the region. In contrast, in the middle stratosphere the N2O lifetime decreases, resulting a different N2O–Δ′17O correlation slope (Liang et al., 2008). The influence of vertical mixing on N2O–Δ′17O correlations was investigated in a model study by Liang et al. (2007). Indeed, they found that an increase in the vertical eddy diffusion coefficient – thus more vigorous vertical mixing – leads to a lower slope of the N2O–Δ′17O correlation. This supports our hypothesis that the low correlation for the StratoClim samples is caused by intense vertical mixing in the ASMA. An independent indication for the enhanced mixing is the scatter observed in the three-isotope plot and air age variability for the samples classified as stratospheric (Fig. 5). Enhanced mixing, probably caused by deep convection and anticyclone flow in the upper troposphere and lower stratosphere, is consistent with the enhanced mole fraction of ozone-depleting substances in the samples collected in the same flight (Adcock et al., 2021).
A high-precision N2O–Δ′17O(CO2) correlation can thus help identify enhanced mixing of tropospheric air into the stratosphere and may be a measurable tracer to quantify the intensity of eddy diffusion/transport (Liang et al., 2007; Boering et al., 2004). There are many other indicators for enhanced mixing above the tropopause due to the ASMA including a 25 % increase in long-lived ozone-depleting substances in the upper troposphere–lower stratosphere from the same samples (Adcock et al., 2021) and a contribution of about 30 % of young tropospheric air in the extratropical lower stratosphere in the Northern Hemisphere due to the ASMA (Vogel et al., 2016). Recently, Ma et al. (2022) reported that 30 % to 50 % of the air mass in the UTLS above the ASMA region is mixed, with the highest mixing occurring around 16.5 km altitude. Moreover, for StratoClim samples collected over the Indian subcontinent in Kathmandu (2017) in the tropopause region, the three major chlorinated very short-lived substances were enhanced up to 136 % compared to typical tropical tropopause values in 2013–2014. In contrast, only a 10 % increase was observed in ground-based measurements from 2014 to 2017 (Adcock et al., 2021; Engel et al., 2019).
For the StratoClim samples, the CO mole fraction reached a stratospheric background value at a potential temperature of 420 K, and the N2O mole fraction remained similar to the tropospheric value up to 400 K, as described in detail by von Hobe et al. (2021) and Vogel et al. (2024). The deviation of the correlation between N2O and Δ′17O is observed for air samples where the potential temperature is higher, about 420 K and above (Fig. 9). At these potential temperatures, mixing processes become more significant, and the air inside the anticyclone is exported vertically and horizontally into the surrounding stratosphere (von Hobe et al., 2021; Ma et al., 2022). This enhanced mixing apparently causes the diminished slope for the N2O and Δ′17O correlation plot (Fig. 4) and also a very scattered three-isotope plot (Fig. 5). Up to a potential temperature of 400 to 415 K, the strong isolation of air inside the ASMA prevents significant mixing of the stratospheric air into the predominately tropospheric inner cyclone (von Hobe et al., 2021; Vogel et al., 2024). Mixing of air masses is evident from the correlation between CO and O3, as well as from the Δ17O–CO plots shown in Fig. 10. Consequently, the N2O–Δ17O correlation slope of the lowermost stratospheric StratoClim samples agrees with the slopes for CARIBIC samples and previously published measurements.
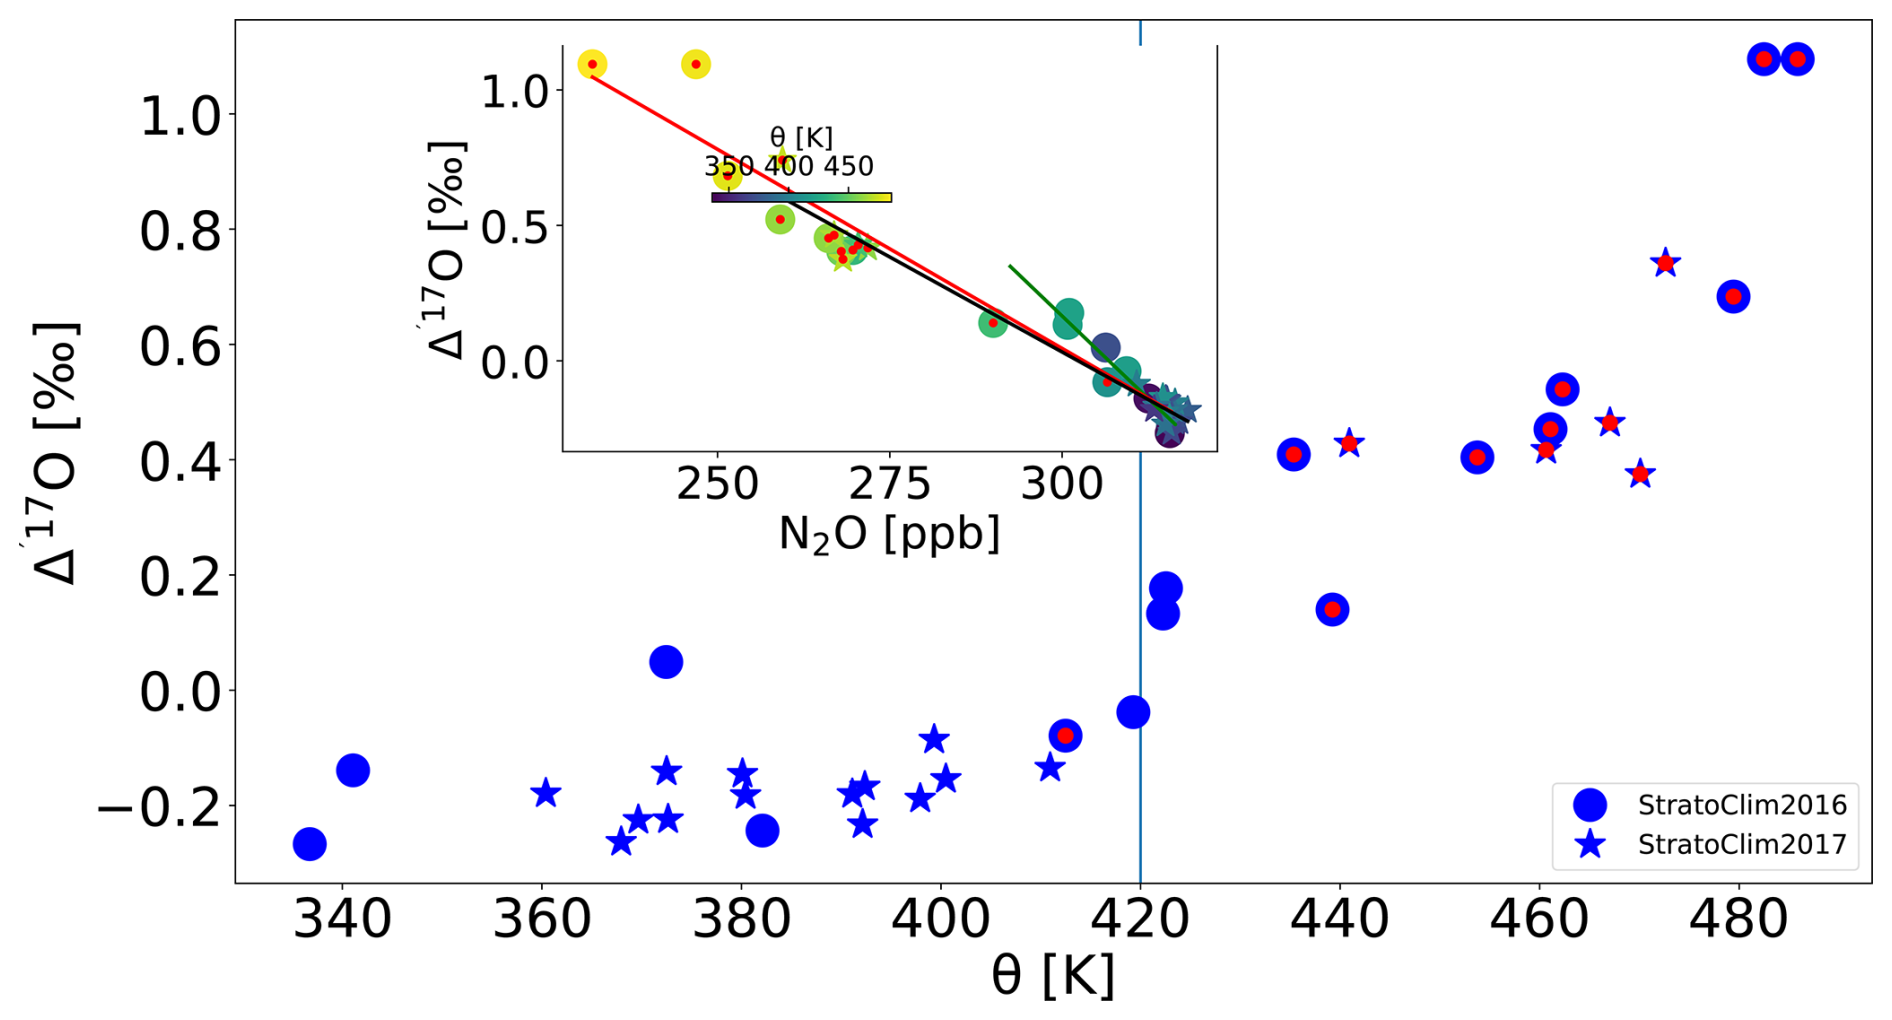
Figure 9Correlation between Δ′17O and potential temperature for StratoClim samples. The inset shows the N2O–Δ′17O correlation of StratoClim samples from Fig. 4. The colour bar for the inset is potential temperature. The data points marked in red indicate those with a low N2O–Δ17O correlation slope.
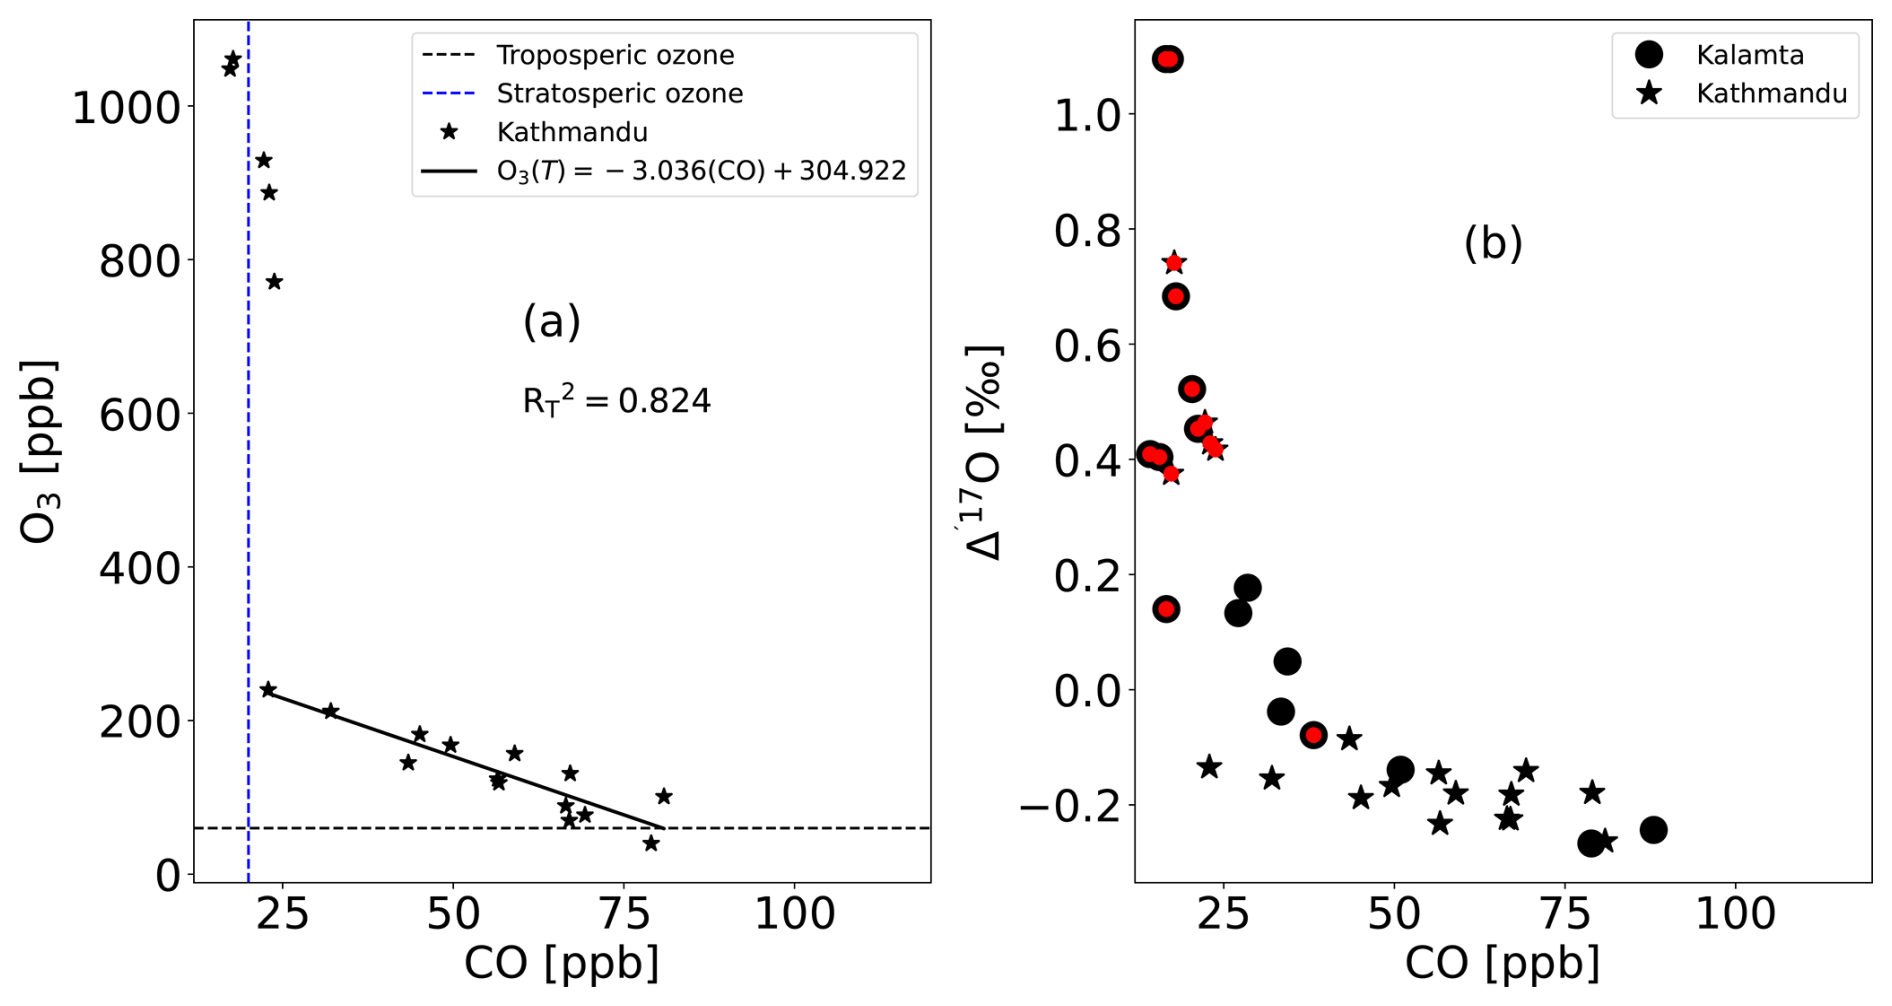
Figure 10(a) The correlation of two short-lived gases, ozone vs. CO for Kathmandu samples. (b) Correlation of Δ′17O with CO for both Kalamata and Katmandu samples. The data points marked in red indicate those with a low N2O–Δ17O correlation slope.
Air samples from the upper troposphere and lower stratosphere are well suited for studying stratosphere–troposphere exchange (Olsen et al., 2001). We used CARIBIC samples with Δ′17O(CO2) > −0.2 ‰ because for this group Δ′17O(CO2) and N2O have a very compact relationship with a slope of −0.024 ± 0.0002 ‰ ppb−1, despite the air samples being collected at different latitudes, in different seasons, and in different years (see Table S1, Figs. 1 and 3). The Δ′17O(CO2)–N2O correlation slope is similar to the values reported in the previous measurements (Boering et al., 2004; Wiegel et al., 2013; Kawagucci et al., 2008). However, the uncertainty of the correlation slope is 10 times smaller than in previous measurements (see Garofalo et al., 2019, for a detailed summary), and the new data confirm that the correlation actually extends down to the troposphere. Using the net vertical flux of N2O (which is equal to the global N2O loss rate, 13.43 TgN yr−1 ± 3 % Prather et al., 2023; see also Tian et al., 2020), the global mean net flux of Δ′17O(CO2) is 51.3 ± 1.6 ‰ PgC yr−1. This estimate aligns well with previous numerical model calculations (Liang et al., 2008) and falls within the range reported previously using a similar approach (Boering et al., 2004; Garofalo et al., 2019; Wiegel et al., 2013; Kawagucci et al., 2008), but the uncertainty in our estimate is much lower than the 10 to 20 ‰ PgC yr−1 uncertainty reported in the previous studies (Garofalo et al., 2019). The relatively precise estimate of the net Δ′17O(CO2) flux from the stratosphere to the troposphere results from the improved precision of Δ′17O(CO2) measurements (see Fig. 8) and the reduced uncertainty in the global N2O loss rate (3 % vs. 25 %).
Using the mass balance model described in Sect. 2.6 (see Eq. 8), we estimated a terrestrial flux of 749 ± 93 PgC yr−1. This estimate falls within the range, near the upper range of values, reported by previous studies (200–817 PgC yr−1) (Ciais et al., 1997a, b; Cuntz et al., 2003b, a; Farquhar et al., 1993; Liang et al., 2017b; Welp et al., 2011). The surface flux, which is the sum of terrestrial and ocean fluxes, is 829 ± 93 PgC yr−1 (see Fig. 11). This value is consistent with the range reported by Welp et al. (2008) using δ18O of CO2. The corresponding surface turnover time of CO2 is 0.98 ± 0.1 years, also within the range of previous estimates (i.e. 0.4 to 2.8 years) (Liang et al., 2017b, 2023; Laskar et al., 2019; Welp et al., 2011; Farquhar et al., 1993; Ciais et al., 1997a; Cuntz et al., 2003b) (see Fig. 11). As shown in Fig. 11, the estimated surface flux and turnover time of CO2 are sensitive to the Δ′17O(CO2) value in the upper troposphere. A higher Δ′17O(CO2) value in the upper troposphere results in a lower surface flux and a longer CO2 turnover time. The GPP value is 211 ± 26 PgC yr−1, which is in good agreement with the estimates (200 PgC yr−1) by Liang et al. (2023) and Hofmann et al. (2017) using Δ′17O(CO2) and higher than the estimate (150–175 PgC yr−1) by Welp et al. (2008) using δ18O of CO2. These estimates are very sensitive to the assumed cm ca ratio, the degree of equilibration (Cuntz, 2011; Farquhar et al., 1993), and the soil invasion flux (Wingate et al., 2009). For example, increasing the cm ca ratio by 0.05 (cm ca = 0.7) decreases the GPP from 212 to 189 PgC yr−1. Conversely, decreasing the cm ca ratio by 0.05 (cm ca = 0.6) will increase the GPP from 212 to 234 PgC yr−1. A detailed sensitivity analysis is provided in the Supplement. Although the approach involves a number of assumptions as detailed in the “Materials and method” section, it has the potential to be a valuable tool for quantifying and refining gross fluxes (Hoag et al., 2005; Koren et al., 2019). This will be especially true when more measurements become available from the lower stratosphere–upper troposphere and troposphere/surface. Additionally, understanding the effects of various processes on Δ′17O(CO2), such as soil invasion, and taking into account inter-laboratory calibration-scale differences (Adnew and Röckmann, 2023; Liang et al., 2023) and proper model assimilation (Koren et al., 2019) will further enhance its effectiveness.
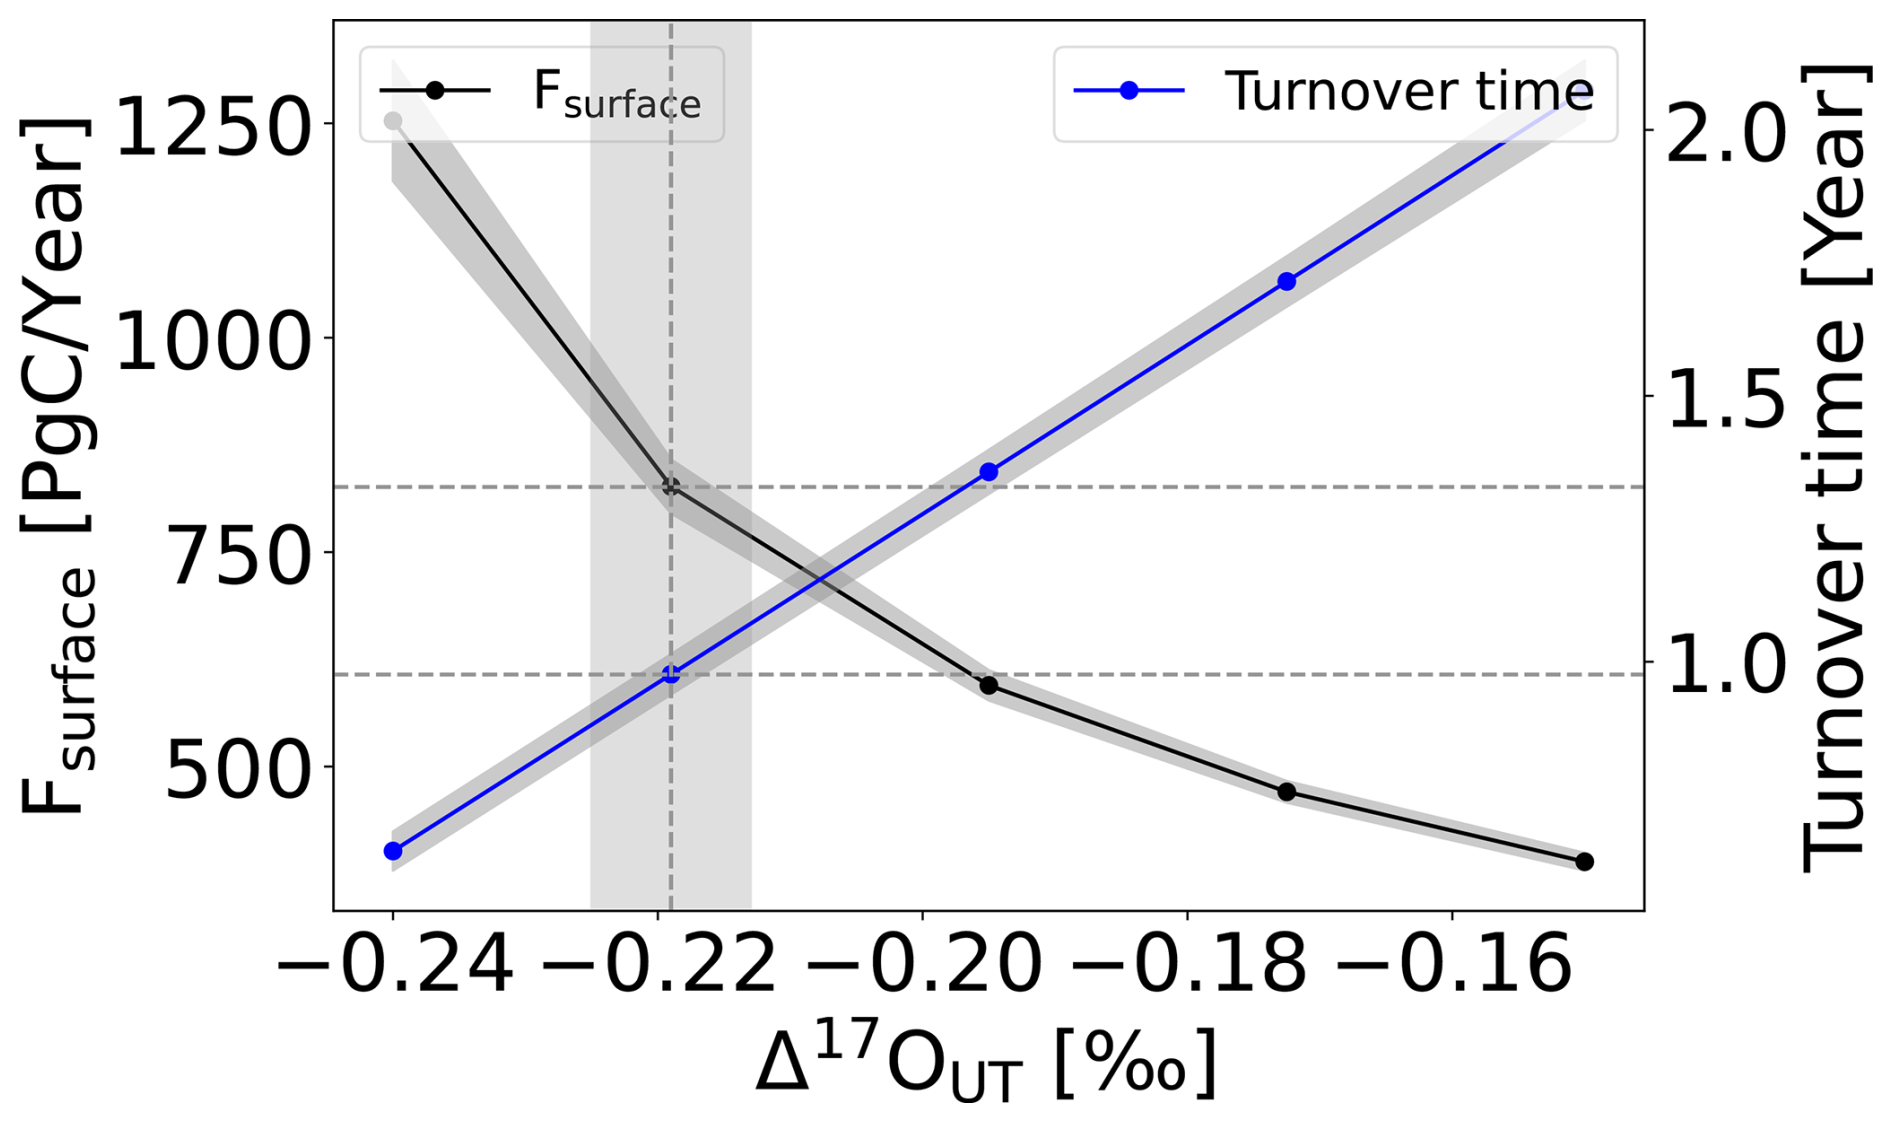
Figure 11Surface flux of CO2 (FSurf; left axis) and the oxygen isotope turnover time of CO2 (left axis) as a function of the Δ′17OUT value of upper-tropospheric CO2. The solid line indicates our best estimates of FSurf and the oxygen isotope turnover time of CO2 and the shaded area is the corresponding uncertainty calculated using error propagation.
High-precision measurements of Δ′17O(CO2) enable the identification of mixing, transport, and chemical processes in the stratosphere. Through the analysis of CARIBIC samples, this study showed that the N2O–Δ′17O(CO2) correlation reported previously from stratospheric samples extends down to the tropopause. Using the N2O–Δ′17O(CO2) correlation slope of CARIBIC samples, we estimated the net mean Δ′17O(CO2) flux from the stratosphere to the troposphere to be 51.3 ± 1.6 ‰ PgC yr−1. Notably, no significant spatial or hemispheric variability was observed in Δ′17O(CO2) values for the upper-tropospheric samples collected during the CARIBIC programme. The new measurements could be used in a mass balance approach to estimate that the surface turnover time of CO2 is approximately 1 year, and the GPP is estimated to between 185 and 237 PgC yr−1.
In contrast, StratoClim samples showed a much lower N2O–Δ′17O slope compared to CARIBIC samples and previous studies. This deviation is attributed to the increased mixing/eddy diffusion due to the ASMA. The N2O–Δ′17O slope may thus be a direct measurable tracer for the intensity of vertical mixing in the UTLS region.
The data are provided in the Supplement as a table. All the data used in this study can be found in Zenodo at https://doi.org/10.5281/zenodo.15665058 (Adnew, 2025).
The supplement related to this article is available online at https://doi.org/10.5194/amt-18-2701-2025-supplement.
GAA: conceptualization, data curation, formal analysis, investigation, methodology, software, visualization, writing (original draft and review and editing). GK: investigation, writing (review and editing). NM: data curation, writing (review and editing). SG: investigation. MK: data curation, writing (review and editing). TR: conceptualization, investigation, methodology, writing (review and editing).
At least one of the (co-)authors is a member of the editorial board of Atmospheric Measurement Techniques. The peer-review process was guided by an independent editor, and the authors also have no other competing interests to declare.
Publisher’s note: Copernicus Publications remains neutral with regard to jurisdictional claims made in the text, published maps, institutional affiliations, or any other geographical representation in this paper. While Copernicus Publications makes every effort to include appropriate place names, the final responsibility lies with the authors.
The StratoClim project was funded by the European Commission within Framework Program 7 under ENV.2013.6.1-2, grant agreement no. 603557. The authors acknowledge Carl Brenninkmeijer and his team for providing the CARIBIC samples and trace gas data. We also thank Carl Brenninkmeijer for his constructive feedback on the draft manuscript. Additionally, we appreciate the contributions of all staff involved in the regular maintenance of the IAGOS-CARIBIC container, flight preparation, handling of air sampling units, extraction of CO2 from whole-air samples, and analysis of trace gases used in this study. We are grateful to the staff who performed the sampling and trace gas analysis of StratoClim samples and provided us with the trace gas data. Furthermore, we acknowledge the technical support from Carina van der Veen, Marcel J. Portanger, and Henk Snellen. We acknowledge Amzad H. Laskar and Mao-Chang Liang for constructive discussion. We thank the two anonymous reviewers for very helpful, careful, and critical reviews of the original manuscript.
This research has been supported by the Dutch Science Foundation NWO (grant no. ALWPP.2016.013).
This paper was edited by Abhishek Chatterjee and reviewed by two anonymous referees.
Adcock, K. E., Fraser, P. J., Hall, B. D., Langenfelds, R. L., Lee, G., Montzka, S. A., Oram, D. E., Röckmann, T., Stroh, F., Sturges, W. T., Vogel, B., and Laube, J. C.: Aircraft-based observations of ozone-depleting substances in the upper troposphere and lower stratosphere in and above the Asian summer monsoon, J. Geophys. Res.-Atmos., 126, e2020JD033137, https://doi.org/10.1029/2020JD033137, 2021. a, b, c, d
Adnew, G. A.: The effect of photosynthetic gas exchange on Δ17O of atmospheric CO2, PhD thesis, Utrecht University, 1–174, https://doi.org/10.33540/412, ISBN: 978-90-393-7344-6, 2020. a
Adnew, G. A.: Triple oxygen isotope composition of CO2 in the upper troposphere and stratosphere, Version v1, Zenodo [data set], https://doi.org/10.5281/zenodo.15665058, 2025. a
Adnew, G. A. and Röckmann, T.: Urgent need for Δ17O (CO2) standardization, in: the 21st expert meeting on Greenhouse gas measurement techniques (GGMT), Wageningen, The Netherlands, 19–21 September 2022, ICOS ERIC – Carbon Portal, https://doi.org/10.18160/JCR1-2EBQ, 2023. a, b
Adnew, G. A., Hofmann, M. E. G., Paul, D., Laskar, A., Surma, J., Albrecht, N., Pack, A., Schwieters, J., Koren, G., Peters, W., and Röckmann, T.: Determination of the triple oxygen and carbon isotopic composition of CO2 from atomic ion fragments formed in the ion source of the 253 Ultra High‐Resolution Isotope Ratio Mass Spectrometer, Rapid Commun. Mass Sp., 33, 1363–1380, 2019. a, b, c
Adnew, G. A., Pons, T. L., Koren, G., Peters, W., and Röckmann, T.: Leaf-scale quantification of the effect of photosynthetic gas exchange on Δ17O of atmospheric CO2, Biogeosciences, 17, 3903–3922, https://doi.org/10.5194/bg-17-3903-2020, 2020. a, b, c, d, e, f
Adnew, G. A., Hofmann, M. E. G., Pons, T. L., Koren, G., Ziegler, M., Lourens, L. J., and Röckmann, T.: Leaf scale quantification of the effect of photosynthetic gas exchange on Δ47 of CO2, Sci. Rep., 11, 14023, https://doi.org/10.1038/s41598-021-93092-0, 2021. a
Adnew, G. A., Workman, E., Janssen, C., and Röckmann, T.: Temperature dependence of isotopic fractionation in the CO2-O2 isotope exchange reaction, Rapid Commun. Mass Sp., 36, e9301, https://doi.org/10.1002/rcm.9301, 2022. a, b
Adnew, G. A., Pons, T. L., Koren, G., Peters, W., and Röckmann, T.: Exploring the potential of Δ17O in CO2 for determining mesophyll conductance, Plant Physiol., 192, 1234–1253, https://doi.org/10.1093/plphys/kiad173, 2023. a, b, c, d
Alexander, B., Vollmer, M., Jackson, T., Weiss, R., and Thiemens, M.: Stratospheric CO2 isotopic anomalies and SF6 and CFC tracer concentrations in the Arctic polar vortex, Geophys. Res. Lett., 28, 4103–4106, 2001. a, b
Angert, A., Rachmilevitch, S., Barkan, E., and Luz, B.: Effects of photorespiration, the cytochrome pathway, and the alternative pathway on the triple isotopic composition of atmospheric O2, Global Biogeochem. Cy., 17, 1030, https://doi.org/10.1029/2002GB001933, 2003. a
Angert, A., Cappa, C. D., and DePaolo, D. J.: Kinetic 17O effects in the hydrologic cycle: Indirect evidence and implications, Geochim. Cosmochim. Ac., 68, 3487–3495, 2004. a, b
Annamalai, H. and Slingo, J.: Active/break cycles: Diagnosis of the intraseasonal variability of the Asian summer monsoon, Clim. Dynam., 18, 85–102, 2001. a
Appenzeller, C., Holton, J. R., and Rosenlof, K. H.: Seasonal variation of mass transport across the tropopause, J. Geophys. Res.-Atmos., 101, 15071–15078, 1996. a
Assonov, S., Taylor, P., and Brenninkmeijer, C.: A system for high-quality CO2 isotope analyses of air samples collected by the CARIBIC Airbus A340-600, Rapid Commun. Mass Sp., 23, 1347–1363, 2009a. a, b, c
Assonov, S. S., Brenninkmeijer, C. A. M., Koeppel, C., and Röckmann, T.: CO2 isotope analyses using large air samples collected on intercontinental flights by the CARIBIC Boeing 767, Rapid Commun. Mass Sp., 23, 822–830, 2009b. a, b, c, d, e, f
Assonov, S. S., Brenninkmeijer, C. A. M., Schuck, T. J., and Taylor, P.: Analysis of 13C and 18O isotope data of CO2 in CARIBIC aircraft samples as tracers of upper troposphere/lower stratosphere mixing and the global carbon cycle, Atmos. Chem. Phys., 10, 8575–8599, https://doi.org/10.5194/acp-10-8575-2010, 2010. a, b, c, d
Assonov, S. S., Brenninkmeijer, C. A. M., Schuck, T., and Umezawa, T.: N2O as a tracer of mixing stratospheric and tropospheric air based on CARIBIC data with applications for CO2, Atmos. Environ., 79, 769–779, 2013. a, b
Barkan, E. and Luz, B.: High precision measurements of and ratios in H2O, Rapid Commun. Mass Sp., 19, 3737–3742, https://doi.org/10.1002/rcm.2250, 2005. a, b
Barkan, E. and Luz, B.: Diffusivity fractionations of and in air and their implications for isotope hydrology, Rapid Commun. Mass Sp., 21, 2999–3005, 2007. a, b
Barkan, E. and Luz, B.: High-precision measurements of and ratios in CO2, Rapid Commun. Mass Sp., 26, 2733–2738, https://doi.org/10.1002/rcm.6400, 2012. a, b, c, d, e, f
Barkan, E., Musan, I., and Luz, B.: High-precision measurements of δ17O and 17-excess of NBS19 and NBS18, Rapid Commun. Mass Sp., 29, 2219–2224, https://doi.org/10.1002/rcm.7378, 2015. a, b
Boering, K. A., Jackson, T., Hoag, K. J., Cole, A. S., Perri, M. J., Thiemens, M., and Atlas, E.: Observations of the anomalous oxygen isotopic composition of carbon dioxide in the lower stratosphere and the flux of the anomaly to the troposphere, Geophys. Res. Lett., 31, L03109, https://doi.org/10.1029/2003GL018451, 2004. a, b, c, d, e, f, g, h, i, j, k, l, m, n
Bottinga, Y. and Craig, H.: Oxygen isotope fractionation between CO2 and water, and the isotopic composition of marine atmospheric CO2, Earth Planet. Sc. Lett., 5, 285–295, 1968. a, b
Brenninkmeijer, C. and Röckmann, T.: Russian doll type cryogenic traps: Improved design and isotope separation effects, Anal. Chem., 68, 3050–3053, 1996. a
Brenninkmeijer, C., Kraft, P., and Mook, W.: Oxygen isotope fractionation between CO2 and H2O, Chem. Geol., 41, 181–190, 1983. a, b
Brenninkmeijer, C., Lowe, D., Manning, M., Sparks, R., and Van Velthoven, P.: The 13C, 14C, and 18O isotopic composition of CO, CH4, and CO2 in the higher southern latitudes lower stratosphere, J. Geophys. Res.-Atmos., 100, 26163–26172, 1995. a, b
Brenninkmeijer, C., Crutzen, P., Fischer, H., Güsten, H., Hans, W., Heinrich, G., Heintzenberg, J., Hermann, M., Immelmann, T., Kersting, D., Maiss, M., Nolle, M., Pitscheider, A., Pohlkamp, H., Scharffe, D., Specht, K., and Wiedensohler, A.: CARIBIC—Civil aircraft for global measurement of trace gases and aerosols in the tropopause region, J. Atmos. Ocean. Tech., 16, 1373–1383, 1999. a, b, c, d
Brenninkmeijer, C. A.: Robust, high-efficiency, high-capacity cryogenic trap, Anal. Chem., 63, 1182–1184, 1991. a
Brenninkmeijer, C. A.: Measurement of the abundance of 14CO in the atmosphere and the and ratio of atmospheric CO with applications in New Zealand and Antarctica, J. Geophys. Res.-Atmos., 98, 10595–10614, 1993. a
Brunamonti, S., Jorge, T., Oelsner, P., Hanumanthu, S., Singh, B. B., Kumar, K. R., Sonbawne, S., Meier, S., Singh, D., Wienhold, F. G., Luo, B. P., Boettcher, M., Poltera, Y., Jauhiainen, H., Kayastha, R., Karmacharya, J., Dirksen, R., Naja, M., Rex, M., Fadnavis, S., and Peter, T.: Balloon-borne measurements of temperature, water vapor, ozone and aerosol backscatter on the southern slopes of the Himalayas during StratoClim 2016–2017, Atmos. Chem. Phys., 18, 15937–15957, https://doi.org/10.5194/acp-18-15937-2018, 2018. a
Cairo, F., Pommereau, J. P., Law, K. S., Schlager, H., Garnier, A., Fierli, F., Ern, M., Streibel, M., Arabas, S., Borrmann, S., Berthelier, J. J., Blom, C., Christensen, T., D'Amato, F., Di Donfrancesco, G., Deshler, T., Diedhiou, A., Durry, G., Engelsen, O., Goutail, F., Harris, N. R. P., Kerstel, E. R. T., Khaykin, S., Konopka, P., Kylling, A., Larsen, N., Lebel, T., Liu, X., MacKenzie, A. R., Nielsen, J., Oulanowski, A., Parker, D. J., Pelon, J., Polcher, J., Pyle, J. A., Ravegnani, F., Rivière, E. D., Robinson, A. D., Röckmann, T., Schiller, C., Simões, F., Stefanutti, L., Stroh, F., Some, L., Siegmund, P., Sitnikov, N., Vernier, J. P., Volk, C. M., Voigt, C., von Hobe, M., Viciani, S., and Yushkov, V.: An introduction to the SCOUT-AMMA stratospheric aircraft, balloons and sondes campaign in West Africa, August 2006: rationale and roadmap, Atmos. Chem. Phys., 10, 2237–2256, https://doi.org/10.5194/acp-10-2237-2010, 2010. a
Cao, X. and Liu, Y.: Equilibrium mass-dependent fractionation relationships for triple oxygen isotopes, Geochim. Cosmochim. Ac., 75, 7435–7445, 2011. a
Cernusak, L. A., Barbour, M. M., Arndt, S. K., Cheesman, A. K., English, N. B., Feild, T. S., Helliker, B. R., Holloway-Phillips, M. M., Holtum, J. A., Kahmen, A., McInerney, F. A., Munksgaard, N. C., Simonin, K. A., Song, X., Stuart-Williams, H., West, J. B., and Farquhar, G. D.: Stable isotopes in leaf water of terrestrial plants, Plant Cell Environ., 39, 1087–1102, https://doi.org/10.1111/pce.12703, 2016. a
Ciais, P., Tans, P. P., Trolier, M., White, J. W. C., and Francey, R. J.: A large northern hemisphere terrestrial CO2 sink indicated by the ratio of atmospheric CO2, Science, 269, 1098–1102, 1995. a, b
Ciais, P., Denning, A. S., Tans, P. P., Berry, J. A., Randall, D. A., Collatz, G. J., Sellers, P. J., White, J. W. C., Trolier, M., Meijer, H. A. J., Francey, R. J., Monfray, P., and Heimann, M.: A three-dimensional synthesis study of δ18O in atmospheric CO2: 1. Surface fluxes, J. Geophys. Res.-Atmos., 102, 5857–5872, 1997a. a, b, c, d, e
Ciais, P., Tans, P. P., Denning, A. S., Francey, R. J., Trolier, M., Meijer, H. A., White, J. W., Berry, J. A., Randall, D. A., Collatz, G. J., Sellers, P. J., Monfray, P., and Heimann, M.: A three-dimensional synthesis study of δ18O in atmospheric CO2: 2. Simulations with the TM2 transport model, J. Geophys. Res.-Atmos., 102, 5873–5883, 1997b. a, b, c
Cousins, A. B., Badger, M. R., and von Caemmerer, S.: Carbonic anhydrase and its influence on carbon isotope discrimination during C4 photosynthesis. Insights from antisense RNA in Flaveria bidentis, Plant Physiol., 141, 232–242, 2006. a
Cuntz, M.: A dent in carbon's gold standard, Nature, 477, 547–548, 2011. a
Cuntz, M., Ciais, P., Hoffmann, G., Allison, C. E., Francey, R. J., Knorr, W., Tans, P. P., White, J. W., and Levin, I.: A comprehensive global three-dimensional model of δ18O in atmospheric CO2: 2. Mapping the atmospheric signal, J. Geophys. Res.-Atmos., 108, 4528, https://doi.org/10.1029/2002JD003154, 2003a. a, b, c
Cuntz, M., Ciais, P., Hoffmann, G., and Knorr, W.: A comprehensive global three-dimensional model of δ18O in atmospheric CO2: 1. Validation of surface processes, J. Geophys. Res.-Atmos., 108, 4527, https://doi.org/10.1029/2002JD003153, 2003b. a, b, c, d, e
Dai, A.: Recent climatology, variability, and trends in global surface humidity, J. Climate, 19, 3589–3606, 2006. a
Engel, A., Rigby, M., Burkholder, J. B., Fernandez, R. P., Froidevaux, L., Hall, B. D., Hossaini, R., Saito, T., Vollmer, M. K., and Yao, B.: Update on ozone-depleting substances (ODSs) and other gases of interest to the Montreal Protocol, World Meteorological Organization, ISBN: 9781732931718, 2019. a
Farquhar, G. D. and Lloyd, J.: Carbon and oxygen isotope effects in the exchange of carbon dioxide between terrestrial plants and the atmosphere, Acadamic Press Inc, London, ISBN 978-0-12-233380-4, 1993. a
Farquhar, G. D., Lloyd, J., Taylor, J. A., Flanagan, L. B., Syvertsen, J. P., Hubick, K. T., Wong, S. C., and Ehleringer, J. R.: Vegetation effects on the isotope composition of oxygen in atmospheric CO2, Nature, 363, 439–443, 1993. a, b, c, d, e, f, g, h
Francey, R. J. and Tans, P. P.: Latitudinal variation in oxygen-18 of atmospheric CO2, Nature, 327, 495–497, 1987. a, b
Friedli, H. and Siegenthaler, U.: Influence of N2O on isotope analyses in CO2 and mass-spectrometric determination of N2O in air samples, Tellus B, 40, 129–133, 1988. a
Gamo, T., Tsutsumi, M., Sakai, H., Nakazawa, T., Machida, T., Honda, H., and Itoh, T.: Long-term monitoring of carbon and oxygen isotope ratios of stratospheric CO2 over Japan, Geophys. Res. Lett., 22, 397–400, 1995. a
Gan, K. S., Wong, S. C., Yong, J. W. H., and Farquhar, G. D.: 18O spatial patterns of vein xylem water, leaf water, and dry matter in cotton leaves, Plant Physiol., 130, 1008–1021, 2002. a
Garny, H. and Randel, W.: Dynamic variability of the Asian monsoon anticyclone observed in potential vorticity and correlations with tracer distributions, J. Geophys. Res.-Atmos., 118, 13421–13433, 2013. a
Garofalo, L., Kanu, A., Hoag, K. J., and Boering, K. A.: Chapter 7: The effects of stratospheric chemistry and transport on the isotopic compositions of long-lived gases measured at Earth's surface, in: Advances in Atmospheric Chemistry, 2, 529–587, 2019. a, b, c, d, e
Hayles, J. A. and Killingsworth, B. A.: Constraints on triple oxygen isotope kinetics, Chem. Geol., 589, 120646, https://doi.org/10.1016/j.chemgeo.2021.120646, 2022. a
Hayles, J. A., Cao, X., and Bao, H.: The statistical mechanical basis of the triple isotope fractionation relationship, Geochemical Perspectives Letters, 3, 1–11, 2017. a
Helliker, B. R. and Ehleringer, J. R.: Establishing a grassland signature in veins: 18O in the leaf water of C3 and C4 grasses, P. Natl. Acad. Sci. USA, 97, 7894–7898, 2000. a
Hoag, K. J., Still, C. J., and Fung, I. Y.: Triple oxygen isotope composition of tropospheric carbon dioxide as a tracer of terrestrial gross carbon fluxes, Geophys. Res. Lett., 32, L02802, https://doi.org/10.1029/2004GL021011, 2005. a, b, c, d, e, f
Hofmann, M. E. G., Horváth, B., and Pack, A.: Triple oxygen isotope equilibrium fractionation between carbon dioxide and water, Earth Planet. Sc. Lett., 319, 159–164, 2012. a
Hofmann, M. E. G., Horváth, B., Schneider, L., Peters, W., Schützenmeister, K., and Pack, A.: Atmospheric measurements of Δ17O in CO2 in Göttingen, Germany reveal a seasonal cycle driven by biospheric uptake, Geochim. Cosmochim. Ac., 199, 143–163, https://doi.org/10.1016/j.gca.2016.11.019, 2017. a, b, c
Holton, J. R., Haynes, P. H., McIntyre, M. E., Douglass, A. R., Rood, R. B., and Pfister, L.: Stratosphere-troposphere exchange, Rev. Geophys., 33, 403–439, 1995. a
Horváth, B., Hofmann, M., and Pack, A.: On the triple oxygen isotope composition of carbon dioxide from some combustion processes, Geochim. Cosmochim. Ac., 95, 160–168, 2012. a, b
Kaiser, J.: Reformulated 17O correction of mass spectrometric stable isotope measurements in carbon dioxide and a critical appraisal of historic 'absolute' carbon and oxygen isotope ratios, Geochim. Cosmochim. Ac., 72, 1312–1334, https://doi.org/10.1016/j.gca.2007.12.011, 2008. a
Kaiser, J., Engel, A., Borchers, R., and Röckmann, T.: Probing stratospheric transport and chemistry with new balloon and aircraft observations of the meridional and vertical N2O isotope distribution, Atmos. Chem. Phys., 6, 3535–3556, https://doi.org/10.5194/acp-6-3535-2006, 2006. a, b
Kawagucci, S., Tsunogai, U., Kudo, S., Nakagawa, F., Honda, H., Aoki, S., Nakazawa, T., and Gamo, T.: An analytical system for determining δ17O in CO2 using continuous flow-isotope ratio MS, Anal. Chem, 77, 4509–4514, 2005. a, b
Kawagucci, S., Tsunogai, U., Kudo, S., Nakagawa, F., Honda, H., Aoki, S., Nakazawa, T., Tsutsumi, M., and Gamo, T.: Long-term observation of mass-independent oxygen isotope anomaly in stratospheric CO2, Atmos. Chem. Phys., 8, 6189–6197, https://doi.org/10.5194/acp-8-6189-2008, 2008. a, b, c, d, e
Koren, G., Schneider, L., van der Velde, I. R., van Schaik, E., Gromov, S. S., Adnew, G. A., Mrozek, D. J., Hofmann, M. E. G., Liang, M.-C., Mahata, S., Bergamaschi, P., van der Laan-Luijkx, I. T., Krol, M. C., Röckmann, T., and Peters, W.: Global 3‐D Simulations of the Triple Oxygen Isotope Signature Δ17O in Atmospheric CO2, J. Geophys. Res.-Atmos., 124, 8808–8836, 2019. a, b, c, d, e, f, g
Krol, M., de Bruine, M., Killaars, L., Ouwersloot, H., Pozzer, A., Yin, Y., Chevallier, F., Bousquet, P., Patra, P., Belikov, D., Maksyutov, S., Dhomse, S., Feng, W., and Chipperfield, M. P.: Age of air as a diagnostic for transport timescales in global models, Geosci. Model Dev., 11, 3109–3130, https://doi.org/10.5194/gmd-11-3109-2018, 2018. a, b
Lämmerzahl, P., Röckmann, T., and Brenninkmeijer, C. A. M.: Oxygen isotope composition of stratospheric carbon dioxide, Geophys. Res. Lett., 29, 23-1–23-4, https://doi.org/10.1029/2001gl014343, 2002. a, b, c
Lan, X., Thoning, K. W., and Dlugokencky, E. J.: Trends in globally-averaged CH4, N2O, and SF6, Version 2024-08, NOAA Global Monitoring Laboratory [data set], https://doi.org/10.15138/P8XG-AA10, 2024. a
Landais, A., Barkan, E., Yakir, D., and Luz, B.: The triple isotopic composition of oxygen in leaf water, Geochim. Cosmochim. Ac., 70, 4105–4115, https://doi.org/10.1016/j.gca.2006.06.1545, 2006. a, b, c
Landais, A., Yakir, D., Barkan, E., and Luz, B.: The triple isotopic composition of oxygen in leaf water and its implications for quantifying biosphere productivity, Terrestrial Ecology, 1, 111–125, 2007. a, b
Laskar, A. H., Mahata, S., and Liang, M.-C.: Identification of anthropogenic CO2 using triple oxygen and clumped isotopes, Environ. Sci. Technol., 50, 18, https://doi.org/10.1021/acs.est.6b02989, 2016. a, b
Laskar, A. M., Mahata, S., Bhattacharya, S. K., and Liang, M.-C.: Triple oxygen and clumped isotope compositions of CO2 in the middle troposphere, Earth and Space Science, 6, 1205–1219, 2019. a, b, c, d
Levin, I., Allison, C., Brand, W., Conway, Delmotte, M., Facklam, C., Francey, R., Hammer, S., Huang, L., Jordan, A., Langenfelds, R., Machida, T., Meijer, H., Mukai, H., Neubert, R., Sabasch, M., Schmidt, M., Steele, P., Steinberg, B., Ramonet, M., Rothe, M., Vaughn, B., and Worthy, D.: Five Years of International Flask Intercomparison (Sausage Flask ICP) 2002–2007, 14th WMO/IAEA Meeting of Experts on Carbon Dioxide, Other Greenhouse Gases and Related Tracers Measurement Techniques, Helsinky, Finland, 10–13 September 2007, GAW Report No. 186, The World Meteorological Organization (WMO), 163 pp., 2009. a
Liang, M.-C. and Mahata, S.: Oxygen anomaly in near surface carbon dioxide reveals deep stratospheric intrusion, Sci. Rep., 5, 11352, https://doi.org/10.1038/srep11352, 2015. a, b
Liang, M.-C., Blake, G. A., Lewis, B. R., and Yung, Y. L.: Oxygen isotopic composition of carbon dioxide in the middle atmosphere, P. Natl. Acad. Sci. USA, 104, 21–25, 2007. a, b, c, d, e, f, g, h
Liang, M.-C., Blake, G. A., and Yung, Y. L.: Seasonal cycle of C16O16O, C16O17O, and C16O18O in the middle atmosphere: Implications for mesospheric dynamics and biogeochemical sources and sinks of CO2, J. Geophys. Res.-Atmos., 113, D12305, https://doi.org/10.1029/2007JD008392, 2008. a, b, c, d, e, f, g
Liang, M.-C., Mahata, S., Laskar, A. H., and Bhattacharya, S. K.: Spatiotemporal variability of oxygen isotope anomaly in near surface air CO2 over urban, semi-urban and ocean areas in and around Taiwan, Aerosol Air Qual. Res., 17, 706–720, 2017a. a, b
Liang, M.-C., Mahata, S., Laskar, A. H., Thiemens, M. H., and Newman, S.: Oxygen isotope anomaly in tropospheric CO2 and implications for CO2 residence time in the atmosphere and gross primary productivity, Sci. Rep., 7, 13180, https://doi.org/10.1038/s41598-017-12774-w, 2017b. a, b, c, d, e, f
Liang, M.-C., Laskar, A. H., Barkan, E., Newman, S., Thiemens, M. H., and Rangarajan, R.: New constraints of terrestrial and oceanic global gross primary productions from the triple oxygen isotopic composition of atmospheric CO2 and O2, Scientific Reports, 13, 2162, https://doi.org/10.1038/s41598-023-29389-z, 2023. a, b, c, d, e, f, g
Luz, B. and Barkan, E.: Variations of and in meteoric waters, Geochim. Cosmochim. Ac., 74, 6276-6286, 2010. a
Luz, B., Barkan, E., Bender, M. L., Thiemens, M. K., and Boering, K. A.: Triple-isotope composition of atmospheric oxygen as a tracer of biosphere productivity, Nature, 400, 547–550, 1999. a, b, c
Lyons, J. R.: Transfer of mass-independent fractionation in ozone to other oxygen-containing radicals in the atmosphere, Geophys. Res. Lett., 28, 3231–3234, https://doi.org/10.1029/2000gl012791, 2001. a
Ma, D., Bian, J., Li, D., Bai, Z., Li, Q., Zhang, J., Wang, H., Zheng, X., Hurst, D. F., and Vömel, H.: Mixing characteristics within the tropopause transition layer over the Asian summer monsoon region based on ozone and water vapor sounding data, Atmos. Res., 271, 106093, https://doi.org/10.1016/j.atmosres.2022.106093, 2022. a, b
Matsuhisa, Y., Goldsmith, J. R., and Clayton, R. N.: Mechanisms of hydrothermal crystallization of quartz at 250 °C and 15 kbar, Geochim. Cosmochim. Ac., 42, 173–182, 1978. a, b
Meijer, H. and Li, W.: The use of electrolysis for accurate δ17O and δ18O isotope measurements in water isotopes, Isot. Environ. Healt. S., 34, 349–369, 1998. a
Mikkonen, S., Pitkänen, M. R. A., Nieminen, T., Lipponen, A., Isokääntä, S., Arola, A., and Lehtinen, K. E. J.: Technical note: Effects of uncertainties and number of data points on line fitting – a case study on new particle formation, Atmos. Chem. Phys., 19, 12531–12543, https://doi.org/10.5194/acp-19-12531-2019, 2019. a
Miller, J. B., Yakir, D., White, J. W., and Tans, P. P.: Measurement of in the soil-atmosphere CO2 flux, Global Biogeochem. Cy., 13, 761–774, 1999. a
Mrozek, D. J.: Measurements and interpretation of oxygen isotopes in stratospheric carbon dioxide, PhD thesis, Utrecht University, ISBN: 978-90-393-6824-4, 2017. a
Nisbet, E. G., Manning, M., Dlugokencky, E., Fisher, R., Lowry, D., Michel, S., Myhre, C. L., Platt, S. M., Allen, G., Bousquet, P., Brownlow, R., Cain, M., France, J. L., Hermansen, O., Hossaini, R., Jones, A. E., Levin, I., Manning, A. C., Myhre, G., Pyle, J. A., Vaughn, B. H., Warwick, N. J., and White, J. W. C.: Very strong atmospheric methane growth in the 4 years 2014–2017: Implications for the Paris Agreement, Global Biogeochem. Cy., 33, 318–342, 2019. a, b
Olsen, S., McLinden, C., and Prather, M.: Stratospheric N2O–NOy system: Testing uncertainties in a three-dimensional framework, J. Geophys. Res.-Atmos., 106, 28771–28784, 2001. a
Pan, L. L., Honomichl, S. B., Kinnison, D. E., Abalos, M., Randel, W. J., Bergman, J. W., and Bian, J.: Transport of chemical tracers from the boundary layer to stratosphere associated with the dynamics of the Asian summer monsoon, J. Geophys. Res.-Atmos., 121, 14159–14174, 2016. a
Park, M., Randel, W. J., Emmons, L. K., and Livesey, N. J.: Transport pathways of carbon monoxide in the Asian summer monsoon diagnosed from Model of Ozone and Related Tracers (MOZART), J. Geophys. Res.-Atmos., 114, D08303, https://doi.org/10.1029/2008JD010621, 2009. a
Peylin, P., Ciais, P., Denning, A. S., Tans, P. P., Berry, J. A., and White, J. W.: A 3-dimensional study of δ18O in atmospheric CO2: contribution of different land ecosystems, Tellus B, 51, 642–667, 1999. a
Piao, S., Sitch, S., Ciais, P., Friedlingstein, P., Peylin, P., Wang, X., Ahlström, A., Anav, A., Canadell, J. G., Cong, N., Cong, N., Huntingford, C., Jung, M., Levis, S., Levy, P. E., Li, J., Lin, X., Lomas, M. R., Lu, M., Luo, Y., Ma, Y., Myneni, R. B., Poulter, B., Sun, Z., Wang, T., Viovy, N., Zaehle, S., and Zeng, N.: Evaluation of terrestrial carbon cycle models for their response to climate variability and to CO2 trends, Glob. Change Biol., 19, 2117–2132, 2013. a
Plumb, R. A.: Tracer interrelationships in the stratosphere, Rev. Geophys., 45, RG4005, https://doi.org/10.1029/2005RG000179, 2007. a, b
Plumb, R. A. and Ko, M. K.: Interrelationships between mixing ratios of long-lived stratospheric constituents, J. Geophys. Res.-Atmos., 97, 10145–10156, 1992. a, b
Prather, M. J., Froidevaux, L., and Livesey, N. J.: Observed changes in stratospheric circulation: decreasing lifetime of N2O, 2005–2021, Atmos. Chem. Phys., 23, 843–849, https://doi.org/10.5194/acp-23-843-2023, 2023. a
Pupek, M., Assonov, S., Mühle, J., Rhee, T., Oram, D., Koeppel, C., Slemr, F., and Brenninkmeijer, C.: Isotope analysis of hydrocarbons: trapping, recovering and archiving hydrocarbons and halocarbons separated from ambient air, Rapid Commun. Mass Sp., 19, 455–460, 2005. a, b, c
Saugier, B., Roy, J., and Mooney, H. A.: Estimations of global terrestrial productivity, in: Terrestrial Global Productivity, Academic Press, 543–557, https://doi.org/10.1016/b978-012505290-0/50024-7, 2001. a
Shaheen, R., Janssen, C., and Röckmann, T.: Investigations of the photochemical isotope equilibrium between O2, CO2 and O3, Atmos. Chem. Phys., 7, 495–509, https://doi.org/10.5194/acp-7-495-2007, 2007. a
Sirignano, C., Neubert, R. E., and Meijer, H. A.: N2O influence on isotopic measurements of atmospheric CO2, Rapid Commun. Mass Sp., 18, 1839–1846, 2004. a
Song, X., Simonin, K. A., Loucos, K. E., and Barbour, M. M.: Modelling non‐steady‐state isotope enrichment of leaf water in a gas‐exchange cuvette environment, Plant Cell Environ., 38, 10, 2015. a
Stefanutti, L., Sokolov, L., Balestri, S., MacKenzie, A., and Khattatov, V.: The M-55 Geophysica as a platform for the Airborne Polar Experiment, J. Atmos. Ocean. Tech., 16, 1303–1312, 1999. a, b
Stern, L. A., Amundson, R., and Baisden, W. T.: Influence of soils on oxygen isotope ratio of atmospheric CO2, Global Biogeochem. Cy., 15, 753–759, 2001. a
Steur, P. M., Scheeren, H. A., Koren, G., Adnew, G. A., Peters, W., and Meijer, H. A. J.: Interannual variations in the Δ(17O) signature of atmospheric CO2 at two mid-latitude sites suggest a close link to stratosphere–troposphere exchange, Atmos. Chem. Phys., 24, 11005–11027, https://doi.org/10.5194/acp-24-11005-2024, 2024. a
Stocker, T., Qin, D., Plattner, G.-K., Tignor, M., Allen, S., Boschung, J., Nauels, A., Xia, Y., Bex, V., and Midgley, P.: IPCC 2013: Climate Change 2013: The Physical Science Basis. Contribution of Working Group I to the Fifth Assessment Report of the Intergovernmental Panel on Climate Change, Cambridge University Press, Cambridge, United Kingdom and New York, NY, USA, 1535 pp., ISBN 978-1-107-66182-0, 2013. a, b, c, d
Thiemens, M. H.: History and Applications of Mass-Independent Isotope Effects, Annu. Rev. Earth Pl. Sc., 34, 217–262, https://doi.org/10.1146/annurev.earth.34.031405.125026, 2006. a, b
Thiemens, M. H., Jackso, T., Mauersberger, K., Schueler, B., and Morton, J.: Oxygen isotope fractionation in stratospheric CO2, Geophys. Res. Lett., 18, 669–672, 1991. a, b
Thiemens, M. H., Jackson, T., Zipf, E. C., Erdman, P. W., and van Egmond, C.: Carbon dioxide and oxygen isotope anomalies in the mesosphere and stratosphere, Science, 270, 969–972, 1995a. a, b, c, d
Thiemens, M. H., Jackson, T. L., and Brenninkmeijer, C. A.: Observation of a mass independent oxygen isotopic composition in terrestrial stratospheric CO2, the link to ozone chemistry, and the possible occurrence in the Martian atmosphere, Geophys. Res. Lett., 22, 255–257, 1995b. a, b, c
Thiemens, M. K., Chakraborty, S., and Jackson, T. L.: Decadal Δ17O record of tropospheric CO2: Verification of a stratospheric component in the troposphere, J. Geophys. Res.-Atmos., 119, 6221–6229, https://doi.org/10.1002/2013JD020317, 2014. a, b
Tian, H., Xu, R., Canadell, J. G., et al.: A comprehensive quantification of global nitrous oxide sources and sinks, Nature, 586, 248–256, 2020. a
Vogel, B., Günther, G., Müller, R., Grooß, J.-U., and Riese, M.: Impact of different Asian source regions on the composition of the Asian monsoon anticyclone and of the extratropical lowermost stratosphere, Atmos. Chem. Phys., 15, 13699–13716, https://doi.org/10.5194/acp-15-13699-2015, 2015. a
Vogel, B., Günther, G., Müller, R., Grooß, J.-U., Afchine, A., Bozem, H., Hoor, P., Krämer, M., Müller, S., Riese, M., Rolf, C., Spelten, N., Stiller, G. P., Ungermann, J., and Zahn, A.: Long-range transport pathways of tropospheric source gases originating in Asia into the northern lower stratosphere during the Asian monsoon season 2012, Atmos. Chem. Phys., 16, 15301–15325, https://doi.org/10.5194/acp-16-15301-2016, 2016. a, b
Vogel, B., Müller, R., Günther, G., Spang, R., Hanumanthu, S., Li, D., Riese, M., and Stiller, G. P.: Lagrangian simulations of the transport of young air masses to the top of the Asian monsoon anticyclone and into the tropical pipe, Atmos. Chem. Phys., 19, 6007–6034, https://doi.org/10.5194/acp-19-6007-2019, 2019. a
Vogel, B., Volk, C. M., Wintel, J., Lauther, V., Clemens, J., Grooß, J.-U., Günther, G., Hoffmann, L., Laube, J. C., Müller, R., Ploeger, F., and Stroh, F.: Evaluation of vertical transport in ERA5 and ERA-Interim reanalysis using high-altitude aircraft measurements in the Asian summer monsoon 2017, Atmos. Chem. Phys., 24, 317–343, https://doi.org/10.5194/acp-24-317-2024, 2024. a, b
von Hobe, M., Ploeger, F., Konopka, P., Kloss, C., Ulanowski, A., Yushkov, V., Ravegnani, F., Volk, C. M., Pan, L. L., Honomichl, S. B., Tilmes, S., Kinnison, D. E., Garcia, R. R., and Wright, J. S.: Upward transport into and within the Asian monsoon anticyclone as inferred from StratoClim trace gas observations, Atmos. Chem. Phys., 21, 1267–1285, https://doi.org/10.5194/acp-21-1267-2021, 2021. a, b, c
Welp, L. R., Lee, X., Kim, K., Griffis, T. J., Billmark, K. A., and Baker, J. M.: δ18O of water vapour, evapotranspiration and the sites of leaf water evaporation in a soybean canopy, Plant Cell Environ., 31, 1214–1228, 2008. a, b
Welp, L. R., Keeling, R. F., Meijer, H. A. J., Bollenbacher, A. F., Piper, S. C., Yoshimura, K., Francey, R. J., Allison, C. A., and Wahlen, M.: Interannual variability in the oxygen isotopes of atmospheric CO2 driven by El Niño, Nature, 477, 579–582, https://doi.org/10.1038/nature10421, 2011. a, b, c, d, e
Wiegel, A. A., Cole, A. S., Hoag, K. J., Atlas, E. L., Schauffler, S. M., and Boering, K. A.: Unexpected variations in the triple oxygen isotope composition of stratospheric carbon dioxide, P. Natl. Acad. Sci. USA, 110, 17680–17685, https://doi.org/10.1073/pnas.1213082110, 2013. a, b, c, d, e, f, g, h
Wingate, L., Ogée, J., Cuntz, M., Genty, B., Reiter, I., Seibt, U., Yakir, D., Maseyk, K., Pendall, E. G., Barbour, M. M., Mortazavi, B., Burlett, R., Peylin, P., Miller, J., Mencuccini, M., Shim, J. H., Hunt, J., and Grace, J.: The impact of soil microorganisms on the global budget of δ18O in atmospheric CO2, P. Natl. Acad. Sci. USA, 106, 22411–22415, 2009. a, b
Yakir, D.: Oxygen-18 of leaf water: a crossroad for plant-associated isotopic signals, in: Stable isotopes, Garland Science, Chap. 10, 147–168, https://doi.org/10.1201/9781003076865, 2020. a
Yeung, L. Y., Affek, H. P., Hoag, K. J., Guo, W., Wiegel, A. A., Atlas, E. L., Schauffler, S. M., Okumura, M., Boering, K. A., and Eiler, J. M.: Large and unexpected enrichment in stratospheric 16O13C18O and its meridional variation, P. Natl. Acad. Sci. USA, 106, 11496–11501, 2009. a, b
Young, E. D., Galy, A., and Nagahara, H.: Kinetic and equilibrium mass-dependent isotope fractionation laws in nature and their geochemical and cosmochemical significance, Geochim. Cosmochim. Ac., 66, 1095–1104, 2002. a, b, c
Yung, Y. L., DeMore, W., and Pinto, J. P.: Isotopic exchange between carbon dioxide and ozone via O(1D) in the stratosphere, Geophys. Res. Lett., 18, 13–16, 1991. a, b
Yung, Y. L., Lee, A. Y., Irion, F. W., DeMore, W. B., and Wen, J.: Carbon dioxide in the atmosphere: Isotopic exchange with ozone and its use as a tracer in the middle atmosphere, J. Geophys. Res.-Atmos., 102, 10857–10866, 1997. a, b
- Abstract
- Introduction
- Materials and method
- Results
- Discussion
- Implication for troposphere and stratosphere exchange and surface emissions of CO2
- Conclusions
- Data availability
- Author contributions
- Competing interests
- Disclaimer
- Acknowledgements
- Financial support
- Review statement
- References
- Supplement