the Creative Commons Attribution 4.0 License.
the Creative Commons Attribution 4.0 License.
 | 11 Jul 2025
Development and validation of a NOx+ ratio method for the quantitative separation of inorganic and organic nitrate aerosol using a unit-mass-resolution time-of-flight aerosol chemical speciation monitor equipped with a capture vaporizer (CV-UMR-ToF-ACSM)
Farhan R. Nursanto
Douglas A. Day
Roy Meinen
Rupert Holzinger
Harald Saathoff
Jinglan Fu
Jan Mulder
Ulrike Dusek
Particulate nitrate is a major component of ambient aerosol around the world, present in inorganic form, mainly as ammonium nitrate, and also as organic nitrate. It is of increasing importance to monitor ambient particulate nitrate, a reservoir of urban nitrogen oxides that can be transported downwind and harm ecosystems. The unit-mass-resolution time-of-flight aerosol chemical speciation monitor equipped with capture vaporizer (CV-UMR-ToF-ACSM) is designed to quantitatively monitor ambient PM2.5 composition. In this paper, we describe a method for separating the organic and ammonium nitrate components measured by CV-UMR-ToF-ACSM based on evaluating the ratio ( ratio). This method includes modifying the ACSM fragmentation table, time averaging, and data filtering. By using the measured ratio of NH4NO3 and a plausible range of ratio for organic nitrate aerosol, the measured particulate nitrate can be split into inorganic and organic fractions. Data pre-treatment filters concentrations of particulate nitrate below 0.6–2.0 µg m−3, depending on the time averaging. The method detection limit, when considering ±10 % absolute uncertainty of organic nitrate fraction, is found to be 2 µg m−3 (120 min averaging) to 10 µg m−3 (10 min averaging) for total particulate nitrate concentration and 10 % (120 min) to 20 % (10 min) for organic nitrate fraction. We show that this method is able to distinguish periods with inorganic or organic nitrate as major components at a rural site in the Netherlands. A comparison to a high-resolution time-of-flight aerosol mass spectrometer equipped with a standard vaporizer (SV-HR-ToF-AMS) and positive matrix factorization (PMF) method shows similar response of increasing particulate organic nitrate fraction with uncertainties mainly from sensitivity to fragmentation table correction when obtaining the signal. We propose that researchers use this ratio method for CV-UMR-ToF-ACSM (adapting the appropriate fragmentation table and data pre-treatment for each specific application) to quantify the particulate organic nitrate fraction at existing monitoring sites in order to improve understanding of nitrate formation and speciation.
- Article
(4504 KB) - Full-text XML
-
Supplement
(2825 KB) - BibTeX
- EndNote


In the current age of decreasing sulfur emissions, nitrate is becoming a principal aerosol component globally and regionally (Adams et al., 1999; Metzger, 2002; Liao et al., 2003; Rodriguez and Dabdub, 2004; Feng and Penner, 2007; Bauer et al., 2007; Paulot et al., 2016; Bian et al., 2017; Vasilakos et al., 2018; Drugé et al., 2019; Lu et al., 2021). In addition to an increasing aerosol fraction of ammonium nitrate (NH4NO3), ambient organic nitrates (ONs) produced through the oxidation of volatile organic compounds (VOCs) in the presence of nitrogen oxides (NOx) can condense into the particulate phase or grow new particles (Huang et al., 2019a, b; Song et al., 2024). The particulate organic nitrate (pON) contribution to total particulate nitrate mass (pNO3) is substantial (Ng et al., 2017), with an average fraction of 17 %–31 % in China (Yu et al., 2024) and 34 %–44 % in Europe (Kiendler-Scharr et al., 2016), with large differences between urban and rural areas (Fisher et al., 2016; Schlag et al., 2016; Romer Present et al., 2020; Yu et al., 2024). Improved understanding of pON fraction in different regions can provide insight into chemical mechanisms of secondary aerosol formation (Pye et al., 2015; Lee et al., 2016; Ng et al., 2017; Zare et al., 2018).
ON flux worldwide accounts for ∼25 % of the total nitrogen deposition (Jickells et al., 2013). Zare et al. (2018) estimated, via WRF-Chem simulations in the southeast United States, that 60 % of NOx loss is related to ON chemistry. Similar to inorganic nitrate, ON also can be regarded as a NOx reservoir, because thermal or photolysis processes can re-release NOx. The partitioning between gas-phase and particulate ON (Zare et al., 2018) can affect this reservoir lifetime and, thus, the spatial scale of transport of urban nitrogen emissions from their source, determining how far downwind these emissions can harm natural habitats (Fields, 2004; Bobbink and Hicks, 2014; Erisman et al., 2015; Melillo, 2021).
The ratio method, first described by Farmer et al. (2010), is a robust method to separate the total pNO3 signal measured by high-resolution aerosol mass spectrometer (AMS) into particulate ammonium nitrate (pAmN) and particulate organic nitrate (pON) using the variation of ion ratios (subsequently referred to as ratios) in the mass spectra observed. This method has been successfully used to analyze pON composition in several studies (Fry et al., 2013, 2018; Pye et al., 2015; Kiendler-Scharr et al., 2016; Ng et al., 2017; Huang et al., 2019a, b; Brownwood et al., 2021; Day et al., 2022a).
The basis of the ratio method comes from the different fragmentation patterns of chemical species due to the interaction of the mass spectrometer's vaporizer and ionizer with the analytes. The empirical observation shows that nitrates attached to an organic moiety have different fragmentation patterns compared to nitrate in the form of NH4NO3, as well as other less-volatile inorganic nitrates. Thus, each nitrate will have different ratios, Rν, as shown below in Eq. (1) (Day et al., 2002; Francisco and Krylowski, 2005; Farmer et al., 2010; Drewnick et al., 2015; Hu et al., 2016; Day et al., 2022a).
ν: nitrate compound or mixture measured,
: signal intensity of ,
: signal intensity of NO+.
The ratio of the observed air (Robs) falls between the ratios of pure pAmN (RpAmN) and pure pON (RpON). The time-varying mass fraction of particulate organic nitrate (fpON, referring to pNO3 existing as pON) and particulate ammonium nitrate (fpAmN, referring to pNO3 existing as pAmN) can be extracted from this time-varying Robs using Eqs. (2) and (3) (Farmer et al., 2010).
The aerosol chemical speciation monitor (ACSM, Aerodyne Inc.) is a unit-mass-resolution (UMR) mass spectrometry instrument intended for continuous ambient aerosol monitoring (Ng et al., 2011; Fröhlich et al., 2013), unlike its predecessor the aerosol mass spectrometer (AMS, Aerodyne Inc.) which is designed primarily for research (Drewnick et al., 2005). In this work, we explored whether the ACSM can be used to determine pAmN and pON in the same way as has been successfully demonstrated for the AMS. ACSMs are used extensively in monitoring networks, such as the sites in the Aerosol, Clouds and Trace Gases Research Infrastructure (ACTRIS) network in Europe (https://www.psi.ch/en/acsm-stations/overview-full-period, last access: 6 November 2024) and the Atmospheric Science and Chemistry mEasurement NeTwork (ASCENT) network in the USA (https://ascent.research.gatech.edu, last access: 6 November 2024).
For monitoring purposes, a capture vaporizer (CV) and an intermediate pressure lens (IPL) are recommended by Aerodyne for improved quantification of the PM2.5 fraction, relative to a standard vaporizer (SV) and standard lens (Zheng et al., 2020). Almost half of the ACSMs in the ACTRIS network in Europe use a CV. The CV is designed to increase particle collision events with the vaporizer surface by having a narrow entrance, resulting in a particle collection efficiency (CE) of 1 and better mass closure of PM2.5 monitoring (Jayne and Worsnop, 2016; Hu et al., 2017a; Xu et al., 2017; Liu et al., 2024). The enhanced thermal decomposition, however, shifts the fragmentation pattern toward smaller ion fragments (Hu et al., 2017a, 2018a; Xu et al., 2017; Zheng et al., 2020). Therefore, the ratio is substantially lower with CV compared to SV due to favored NO+ formation. As a consequence, the ratio method's applicability in CV-based measurements is limited by the detection limit (<0.1 µg m−3; Hu et al., 2017a).
While high-resolution mass spectrometers can separate non- peaks which are detected at the same nominal (mass-to-charge ratio) as peaks (30 for NO+ and 46 for ), UMR analysis requires estimations based on related ions at other . These estimations are incorporated into data workup by the implementation of a fragmentation table, which subtracts an estimated amount of organic at 30 and 46, based on the signal at another related organic-only values. The default fragmentation table typically applied for the analysis of UMR spectra is based on generalized fragment mass composition of ambient aerosol composition measured using SV-based instruments (Allan et al., 2004; Ulbrich et al., 2009) and, thus, is not suitable for CV-UMR-ToF spectra that have different fragmentation patterns. Using a CV-HR-ToF-AMS, Hu et al. (2017a) determined the organic fragment interference with NO+ at 30 and with at 46 for CV-UMR measurements in a biogenically dominated dataset, but no study has yet shown this calculation adapted to general ambient aerosol composition.
This work aims to adapt the method to separate pAmN and pON signals for CV-UMR-ToF-ACSM measurements. We first provide a revised fragmentation table for 30 and 46 that is compatible with CV-UMR-ToF-ACSM measurements with varying composition to better calculate NO+ and signal contributions. Second, we show the variation of experimental ratio for pAmN in CV-UMR-ToF-ACSM instruments and determine the ratio for pON. Third, we demonstrate the capability of data pre-treatments (filtering and time averaging) to overcome the low and noisy ratio signals produced by CV in ambient measurements. Fourth, the proposed ratio method is applied to an extended ambient dataset (at the Cabauw site of the Ruisdael Observatory network) to test its robustness for changing ambient aerosol mixtures. Lastly, the formation of pAmN and pON in a chamber experiment measured using CV-UMR-ToF-ACSM is used for method validation by comparing results with SV-HR-ToF-AMS.
2.1 Description of ToF-ACSM
A ToF-ACSM (Aerodyne Inc.) is the main instrument used in this study, allowing for the chemical analysis of non-refractory organics (Org), ammonium (NH4), nitrate (NO3), sulfate (SO4), and chloride (Chl) in the aerosol phase (Ng et al., 2011; Fröhlich et al., 2013). In comparison to compact time-of-flight (cToF)-AMS (Drewnick et al., 2005) and HR-ToF-AMS (DeCarlo et al., 2006), ToF-ACSM is more compact in size, lower in price and operational cost, simpler in analysis, and requires less user intervention, which makes this instrument practical for long-term monitoring but still comparable to the AMS (Fröhlich et al., 2013). ToF-ACSM uses a three-way valve system that allows automatic switching between the sample and filter mode, unlike ToF-AMS, which has a mechanical chopper that physically blocks the particle beam. The lack of a chopper (but with the use of particle time-of-flight chamber) in the ToF-ACSM, however, removes the particle sizing feature, which makes it similar to the quadrupole-ACSM (Q-ACSM) but with better mass resolution and detection limits.
To conduct the various analyses in this paper, we primarily use data from two ToF-ACSM instruments with identical setups. The instruments are managed by Utrecht University (UU) and University of Groningen (RUG), part of a larger monitoring network of Ruisdael Observatory in the Netherlands (https://ruisdael-observatory.nl, last access: 6 November 2024). We label the instruments as ACSM-UU and ACSM-RUG. The instrument setup for ambient measurements uses a combination of a PM2.5 size-cut cyclone, an intermediate-pressure lens (PM2.5 aerodynamic lens), and a capture vaporizer (CV, temperature ∼525 °C; Jayne and Worsnop, 2016) that has been aligned with the particle beam. Together, they configure the ToF-ACSM as a PM2.5 monitor (Xu et al., 2017) with unit mass resolution. The instrument provides UMR mass spectra with default 10 min time resolution, analyzed using Tofware v3.3 in Igor Pro 8. The fractions of the UMR signal are assigned to different aerosol species using the fragmentation table.
2.2 Ambient measurements with ACSM
We use an ambient dataset measured using ACSM-UU deployed in Cabauw, the Netherlands, for method development and case studies. The ambient data were measured between 18 April 2023 and 15 April 2024 with some gaps (net 205 d of data) as part of the continuous monitoring of the Ruisdael Observatory network. Aerosol measurements were carried out with an inlet height of 4.5 m above the ground at the Cabauw tower (51.97° N, 4.93° E), an infrastructure of the Royal Netherlands Meteorological Institute (KNMI, the Netherlands, https://www.knmi.nl/home, last access: 9 November 2024). The site is surrounded by agricultural lands in the province of Utrecht, the Netherlands, a relatively nitrogen-polluted rural site.
Ambient air is sampled through a stainless-steel inlet system with a PM2.5 size-cut cyclone (URG-2000-30ED) and a Nafion dryer with a sampling flow rate of ∼2 L min−1, of which on average 1.23 cm3 s−1 (0.07 L min−1) is sampled by the ACSM. The calibrations of ionization efficiency (IE) and relative IE (RIE) were performed using 300 nm particles from ammonium nitrate (NH4NO3) and ammonium sulfate ((NH4)2SO4) solutions (size-selected with a differential mobility analyzer, model TSI 3081, and co-sampled with a condensation particle counter, model TSI 3750). The average IE value for the instrument is 169 ions pg−1 for NO3, and RIE values are 1.40, 1.58, 1.30, and 3.37 for Org, SO4, Chl, and NH4, respectively. RIE values used for Org and Chl were not measured and were instead applied as default values, as is common practice. The detection limits at 10 min time resolution are 0.38 µg m−3 for Org, 0.12 µg m−3 for NH4, 0.07 µg m−3 for NO3, 0.07 µg m−3 for NO+ ( 30), 0.04 µg m−3 for ( 46), 0.11 µg m−3 for SO4, and 0.09 µg m−3 for Chl.
2.3 Chamber measurements with ACSM and AMS
ACSM-RUG was deployed to measure aerosol in chamber experiments conducted in the Aerosol Interaction and Dynamics in the Atmosphere (AIDA) chamber, a facility maintained by Karlsruhe Institute of Technology (KIT), Germany. Chamber experiments were conducted in 2023 and 2024 as part of the Cloud-Aerosol Interactions in a Nitrogen-dominated Atmosphere (CAINA) project (https://sites.google.com/view/cainaproject/, last access: 6 November 2024).
Chamber air is sampled using stainless-steel tubing equipped with a Nafion dryer and a sampling flow of ∼2 L min−1 of which on average 1.44 cm3 s−1 (0.09 L min−1) is sampled by the ACSM. The average IE value for the instrument is 152 ions pg−1 for NO3. The ACSM instrument is run with 2 min time resolution unlike the default setting to capture more variation in the aerosol composition. The detection limits at 2 min time resolution for the ACSM-RUG instrument are 0.20 µg m−3 for Org, 0.19 µg m−3 for NH4, 0.17 µg m−3 for NO3, 0.17 µg m−3 for NO+ ( 30), 0.03 µg m−3 for ( 46), 0.02 µg m−3 for SO4, and 0.05 µg m−3 for Chl.
In addition, a high-resolution time-of-flight aerosol mass spectrometer (HR-AMS, Aerodyne Research Inc.) from KIT is connected to the chamber via a 6 mm (4 mm internal diameter) stainless-steel tube. The instrument is equipped with a PM2.5 aerodynamic lens to measure the non-refractory PM2.5 components, at a time resolution of 1 min (DeCarlo et al., 2006; Canagaratna et al., 2007; Williams et al., 2013), averaged to 2 min for this comparison. The operation of the AMS is explained in previous publications (Huang et al., 2019a; Song et al., 2022). Briefly, chamber air is sampled with a flow of 1.08 L min−1, of which on average 84 cm3 min−1 is sampled by the AMS (Gao et al., 2022). The aerosol particles are then focused into a narrow beam by a PM2.5 aerodynamic lens with an effective complete transmission for particle sizes ranging from 70 to 2500 nm (vacuum aerodynamic diameter, Dva) and heated by a standard vaporizer at 600 °C. The resulting vapors are ionized by electron impact (70 eV) and characterized by a time-of-flight mass spectrometer. The AMS ionization efficiency is calibrated using 300 nm dried NH4NO3 aerosol particles to give an average IE for NO3 of 185.0 ions pg−1. The AMS data are analyzed using the software packages Squirrel 1.66E and PIKA 1.26E in Igor Pro 8. To account for the effect of particle bouncing loss, chemical-composition-based collection efficiency (0.5) was applied to calculate the particle mass concentration (Middlebrook et al., 2012).
3.1 General fragmentation table for typical ambient dataset
In the UMR-ACSM instruments, ions detected at 30 and 46 can originate from both nitrate (NO+ and ) and organic fragments. However, it is known that some fragments produced by processes in the vaporizer and ionizer can be related to one another (Allan et al., 2004). For instance, UMR peaks at 29, 42, 43, and 45 are mainly the product of further fragmentation of fragments at 30 and 46 and assumed to be exclusively of organic origin. The aim of the fragmentation table, with respect to the species, is to predict the signal contribution of organic fragments at 30 and 46 based on the masses measured at 29, 42, 43, and 45 and subsequently to extract the signal that can be attributed to NO+ and .
Our starting point is the default fragmentation table from Allan et al. (2004) (see Table 1). A fragmentation table consists of columns dividing the raw mass spectra into chemical species, with rows denoting entries for different UMR nominal masses. Thus, each entry consists of components which are added up to obtain the species concentration at a specific nominal mass. These components can be the whole peak of an x, referred to as an integer number (with square brackets in this paper, “[x]”), or the contribution of a certain species to x in the fragmentation table, denoted as “frag_species[x].” A multiplier a (positive or negative) is included if the addition or subtraction of the component is fractional. The fragmentation table for ToF-AMS and ToF-ACSM are identical, except that gas-phase species contribution must also be removed in ToF-AMS. For the ACSM, due to the automatic filter sampling cycle and subtraction, gas-phase species are already removed. The fragmentation table developed in this paper, therefore, is applicable to a CV-UMR aerosol mass spectrometer. Because the training dataset incorporated multiple chamber and ambient measurements with different instruments, it should be applicable for a range of typical measurement configurations, but users should be aware of the potential effects of the instrument condition (e.g., vaporizer temperature, particle beam alignment, measurement history).
Allan et al. (2004)Table 1Excerpt of fragmentation table for Org and NO3 species at 30 and 46. The second and third columns show entries originated from the default fragmentation table of Allan et al. (2004) (used in Tofware v3.3). The fourth and fifth columns show entries proposed to develop a revised CV-UMR-ToF-ACSM fragmentation table in this study.
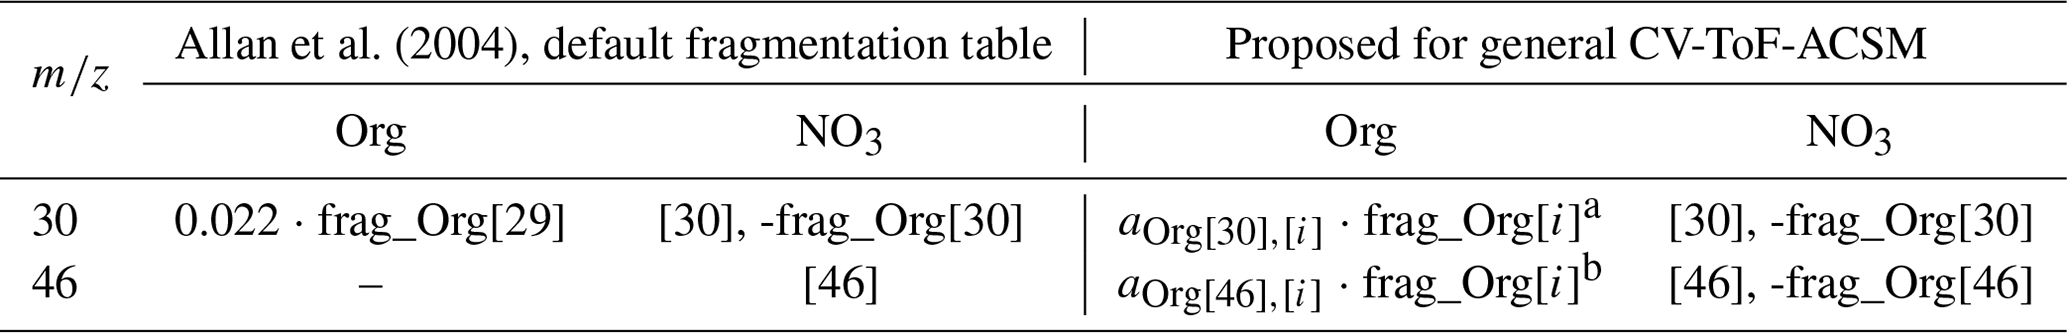
i represents UMR masses tested against 30 and 46 in this study, which includes frag_Org[29], frag_Org[42], frag_Org[43], and frag_Org[45]. See the list in the footnote of Table S3 in the Supplement.
a aOrg[30],[i] is the multiplier for frag_Org[30] component, obtained from the slope of ODR fit between frag_Org[30] and frag_Org[i].
b aOrg[46],[i] is the multiplier for frag_Org[46] component, obtained from the slope of ODR fit between frag_Org[46] and frag_Org[i].
In the default fragmentation table (which was developed using an SV-based instrument), the signal at 46 is assigned exclusively to , and the relationship of organic signal at 30 is found to be only 0.022 times the magnitude of organic signal at 29. Switching from SV to CV modifies the signal ratio between organic and inorganic fragments at 30 and 46 because of greater organic fragmentation in CV (Hu et al., 2018a). It also leads to greater nitrate fragmentation and consequently smaller signal, which makes the organic contribution at 46 more important. For instance, Fry et al. (2018) found larger contributions of organic fragments at 30 and 46 than the default fragmentation table in a semi-polluted biogenically influenced air analyzed with an SV-HR-ToF-AMS. Therefore, modifications to frag_NO3[46] and frag_NO3[30] entries (later referred to as and to calculate ratio outside fragmentation table context) must be established for CV-based instruments.
To make a revised fragmentation table applicable for general ambient organic aerosol (OA) mixtures, a variety of organic aerosol profiles is necessary. We use 25 CV-HR-ToF-AMS spectra (including both nitrates and non-nitrate organics) from the AMS spectral database (http://cires1.colorado.edu/jimenez-group/AMSsd_CV, last access: 6 November 2024) and 6 CV-UMR-ToF-ACSM spectra from chamber experiments. The CV-HR-ToF-AMS database mass spectra include 3 chamber experiments, 7 factors of positive matrix factorization (PMF) analysis from ambient measurements, and 15 laboratory standards measurements (Hu et al., 2025, 2017a, 2018a, b; Carlton et al., 2018), summarized in Table S1 in the Supplement. The CV-UMR-ToF-ACSM mass spectra were measured from experiments conducted in the AIDA chamber (see Sect. 2.3). These spectra were obtained using vaporizer temperature ranging from 525 to 600 °C (see Tables S1 and S2 in the Supplement). Therefore, the revised fragmentation table should be valid for CV-based instruments run in this temperature range.
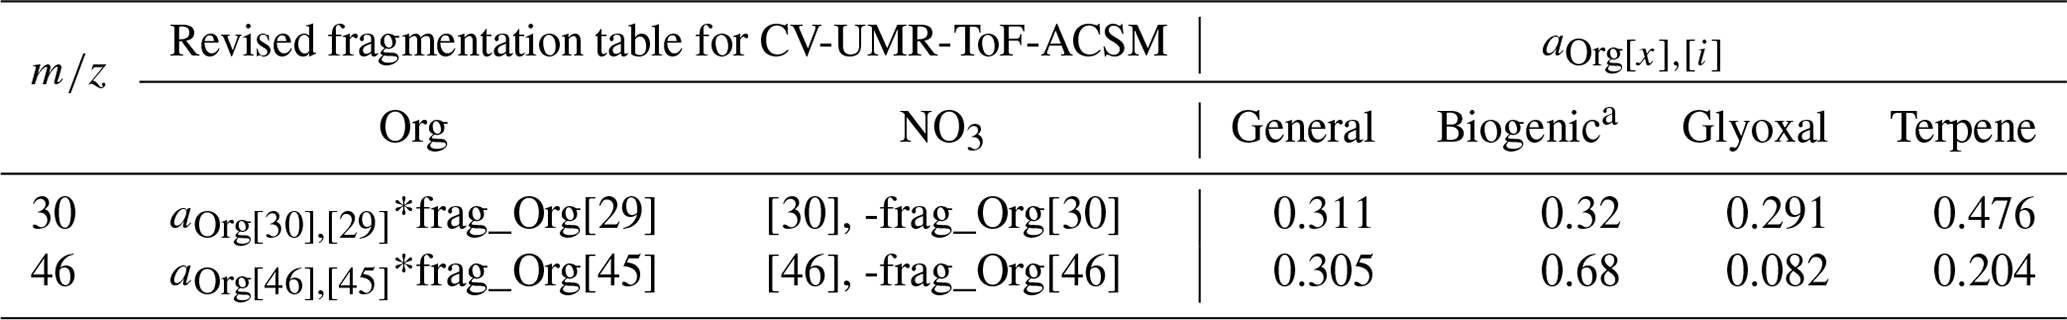
Using these data, we determine the multipliers a used in a revised calculation of frag_Org[30] and frag_Org[46] (see Table 1, fourth and fifth columns, and Table S1, third and fourth column). The new multipliers are determined by performing orthogonal distance regression (ODR) constrained to a zero intercept of mass spectra in UMR. For HR-AMS spectra, the dataset is “degraded” from HR into UMR spectra by summing HR Org fragments to their respective nominal mass in each AMS spectrum. Note that for UMR-ACSM spectra, because we cannot separate species at the same nominal , we only use chamber experiments that are assumed nitrate-free or to contain negligible nitrate (no seed or precursor for inorganic and organic nitrate). Therefore, all signals at 30 and 46 are exclusively organic fragments. We perform ODR fits of frag_Org[30] and frag_Org[46] against a list of chemically related masses (frag_Org[i]). The slope of the ODR fits to determine the multiplier aOrg[30],[i] and aOrg[46],[i] are summarized in Table S3, alongside the list of fragments of i that contribute to each nominal mass, in the footnote. It is found that frag_Org[30] is best correlated with frag_Org[29] (see Table S3), where aOrg[30],[29]=0.311 ± 0.016 (mean ± uncertainty, r2=0.88; see Fig. 1a). On the other hand, frag_Org[46] has the best correlation with frag_Org[45] (see Table S3), where aOrg[46],[45]=0.305 ± 0.037 (mean ± uncertainty, r2=0.43; see Fig. 1b). The final revised fragmentation table in CV-UMR-ToF-ACSM is summarized in the conclusions (see Table 4).
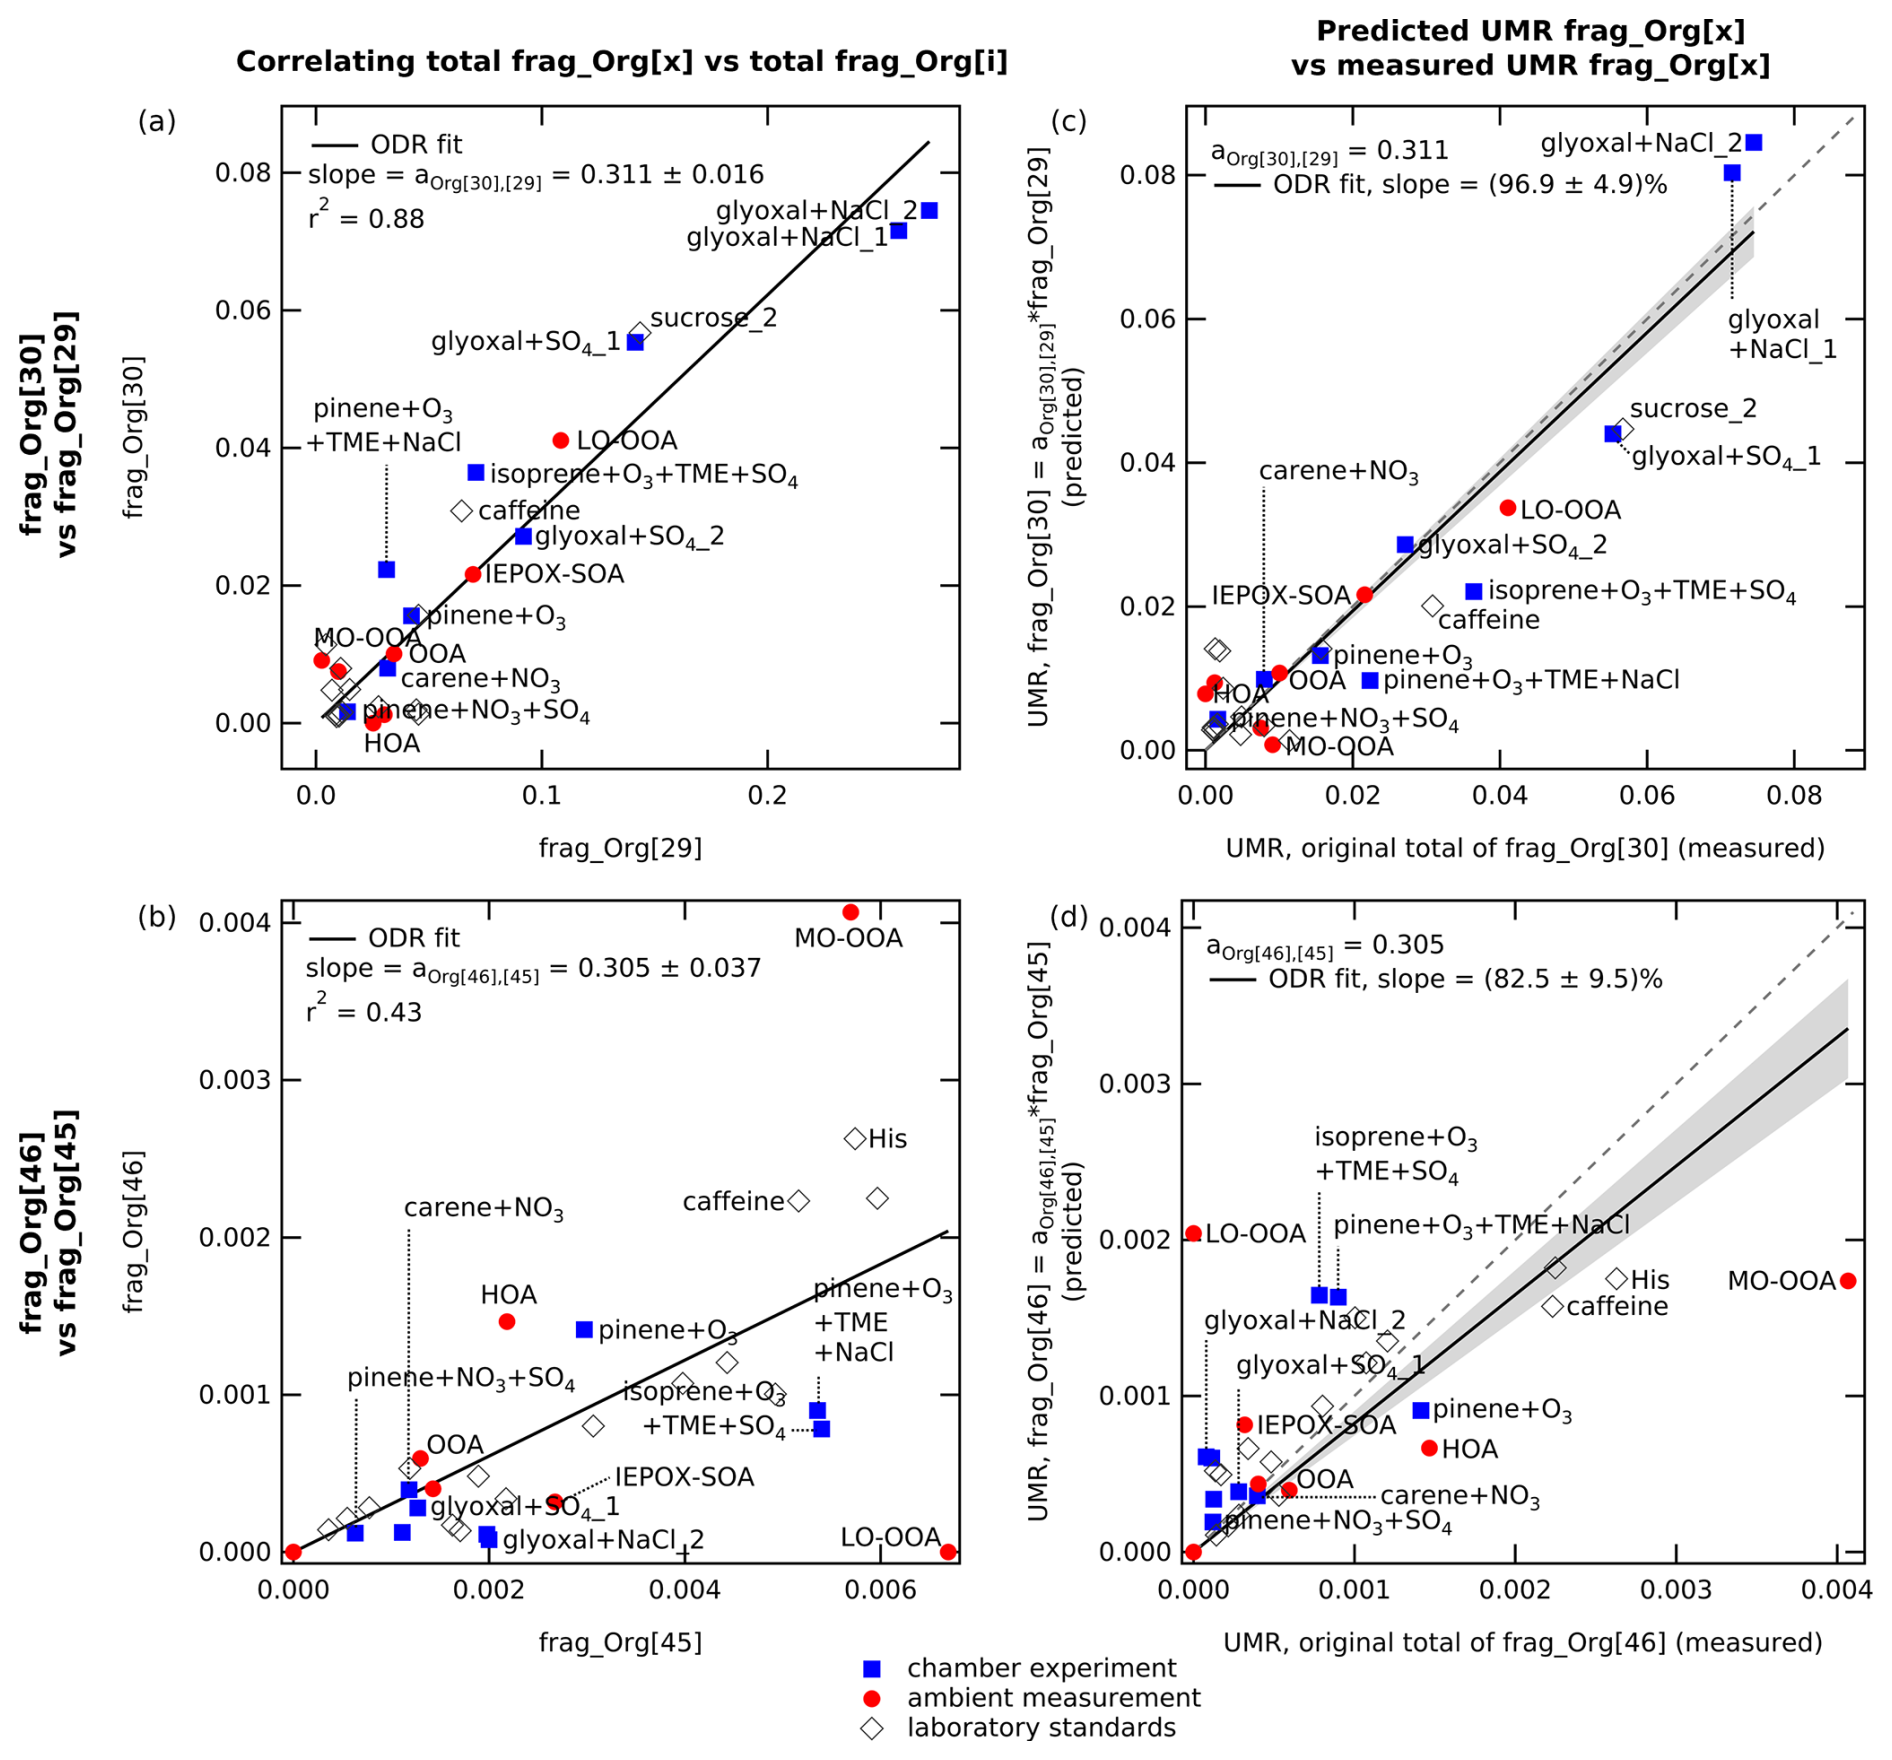
Figure 1The left-hand panels (a and b) show the best ODR fits (set to zero intercept) which are found in the relationship between the signal contributions of (a) frag_Org[30] vs. frag_Org[29] and (b) frag_Org[46] vs. frag_Org[45]. The correlations of all mass pairs are summarized in Table S3. The right-hand panels (c and d) show the predicted organic contributions (based on the new multipliers) at each versus the measured amount. Plot (c) shows the predicted UMR frag_Org[30] against the measured total Org fragments at 30, and plot (d) shows the predicted UMR frag_Org[46] against the measured total Org fragments at 46. The figure demonstrates that the predicted frag_Org[x] slightly underestimates (slope=0.83) but approached the measured frag_Org[x].
We apply these new multiplier values to the full dataset and compare the results with those from multipliers described in Allan et al. (2004), the SI of Fry et al. (2018), and the Supplement of Hu et al. (2017a) (see Table S4 in the Supplement). The result suggests that the multiplier aOrg[46],[45] determined here gives the best predicted frag_Org[46] over multipliers from other studies (see Table S4, third and seventh columns, in the Supplement). Meanwhile, the multiplier aOrg[30],[29] determined here performs similarly with the multipliers obtained from Hu et al. (2017a) (SV and CV) for a dataset dominated by biogenic secondary organic aerosol (SOA). The plot of predicted UMR frag_Org[30] against the measured total Org fragments at 30 (see Fig. 1c) shows that the multiplier determined here is able to estimate on average 96.9 % ± 4.9 % of the measured frag_Org[30]. Meanwhile, the similar plot for frag_Org[46] against the measured total Org fragments at 46 (see Fig. 1d) shows that the multiplier determined here estimates on average 82.5 % ± 9.5 % of the measured frag_Org[46]. The low signal intensity of both 46 and 45 may cause this underestimation and suggests that frag_Org[46] and frag_Org[45] may have a more complicated relationship; their correlation may vary substantially depending on the aerosol mixture. Therefore, it may be appropriate to modify the entry for frag_NO3[46] according to the type of aerosol mixture analyzed. On the other hand, for complex ambient mixtures, the ensemble composition may produce spectra that are more similar to the average determined here. Analysis of CV-HR spectra from a variety of ambient samples would be required to determine the actual variation of organic contributions at 46.
3.2 Composition-specific fragmentation table
The multipliers determined in Sect. 3.1 are designated for typical ambient aerosol composition. In some cases, a composition-specific fragmentation table may be more appropriate to use. For instance, from a field study with biogenically dominated composition, Hu et al. (2017a) reported aOrg[30],[29]=0.32 and aOrg[46],[45]=0.68. By using selected chamber experiments in the same dataset, we can explore different multipliers that are compatible for different composition profiles. For chamber experiments that involve glyoxal (and its oligomers), we obtain aOrg[30],[29]=0.291 ± 0.022 (mean ± uncertainty, n=4, r2=0.90) and aOrg[46],[45]=0.082 ± 0.036 (mean ± standard deviation, n=4, r2=0.35). For chamber experiments that involve only terpenes (e.g., isoprene, α-pinene), we obtain aOrg[30],[29]=0.476 ± 0.067 (mean ± uncertainty, n=5, r2=0.82) and aOrg[46],[45]=0.204 ± 0.055 (mean ± uncertainty, n=5, r2=0.33), which can be applied for chamber experiments with terpene as precursor. The ODR fit plots are given in Fig. S1 in the Supplement. The multipliers to revise the fragmentation table in CV-UMR-ToF-ACSM for specific aerosol composition subsets are summarized in the conclusions (see Table 4).
4.1 ratio of pure pAmN
To quantify the inorganic ratio typical value and variability produced by the CV, we use repeated measurements from regular pAmN calibration from the two ACSM instruments described in Sect. 2. The RpAmN of ACSM-UU is found to be 0.0237 ± 0.0009 (mean ± uncertainty, n=5), and RpAmN of ACSM-RUG is 0.0115 ± 0.0002 (mean ± uncertainty, n=3). The values are similar but lower than other studies where RpAmN with CV was found to be 0.04–0.07 (Hu et al., 2017b), and all are ∼10 times lower than the typical RpAmN measured with the SV, i.e., 0.3–0.7 (Day et al., 2022b). We found that RpAmN values are very consistent for each instrument over time. A summary of RpAmN values and regression fit parameters from each measurement can be found in Table S5 in the Supplement.
Hu et al. (2017a) found that the ratio is affected by the aerodynamic lens alignment. The influence is greater in the CV since the vaporizer opening diameter is ∼2.5 mm (SI of Hu et al., 2018b), smaller than that of SV, which is ∼3.8 mm (Drewnick et al., 2005). For optimum particle detection, the aerodynamic lens must point the particle beam at the center of the vaporizer. Directed into the center, the particles enter the CV cavity and experience augmented thermal decomposition, at which the signal intensity is at its minimum, while the NO+ signal intensity is highest. The signal intensity increases as the particle beam moves closer to the edge of the vaporizer, where the thermal decomposition is not as extensive as in the center, resembling how the SV works. Thus, it is important to consider performing lens alignment to obtain the correct result for the ratio method. Monitoring the behavior of 30 and 46 during pAmN calibration is a good way to determine whether the aerodynamic lens is aligned well. Combining the result of this study and the RpAmN range in Hu et al. (2017a), a value of RpAmN in the range of 0.01–0.07 can be used as reference to indicate properly aligned lens. Plotting the profile of the ratio with movement in both the vertical and horizontal directions obtained during the alignment is the best diagnostic.
4.2 ratio of pure pON
To obtain a ratio for pON, one would ideally measure pure atmospherically relevant ON, prepared through synthesis or in a chamber experiment. Often, such standards are not available; therefore, experimental RpON cannot be easily determined for each instrument. To overcome this challenge, Day et al. (2022a) used the strategy of a “ratio of ratios” (), which can be used to calculate RpON for any arbitrary instrument from its routinely measured RpAmN, and an average value for the RoR measured across many instruments under varying conditions. Day et al. (2022a) found that based on the relationship between RpAmN and RpON over a large range of measurement conditions, SV produces RoR of 2.75 ± 0.70 (mean ±25 % uncertainty).
There have not yet been enough studies that determined RpON values in CV-based instruments in order to determine a robust RoR estimate for CV instruments. In the work of Hu et al. (2017a), a chamber experiment producing pure pON yielded RpON=0.0045; with comparison to RpAmN=0.06 for their instrument, the value RoR=13.3 is obtained. With RpAmN being 0.01 in CV as found in this study, using this RoR of 13.3 means that RpON would be 0.0008 (approaching zero).
Similar to the approach of Kiendler-Scharr et al. (2016) that used the minimum measured value of ratio to set a fixed RpON value, to estimate RpON, we use the lowest measured ratio from a chamber experiment in which we expected to produce pON, with no inorganic nitrate present. The selected experiment used glyoxal as SOA precursor, NO2 and O3 to produce NO3 radical as the major oxidant, and sodium chloride (NaCl) seed to form SOA containing organic nitrates at 90 % relative humidity. This experiment was conducted in the AIDA chamber at IMK KIT, Germany, as part of CAINA project. For the spectrum analysis, we use the fragmentation table specific for glyoxal-related chamber experiment, as described in Sect. 3.2.
While this experiment should produce pure organic nitrate aerosol, during pON formation, we observe an increase in NH4 which could happen for two reasons. First, ammonium nitrate impurities can be formed from reactions or chamber wall repartitioning. Second, particulate water can be incorrectly assigned as NH4 through fragmentation table correction at 16 and 17 (see complete fragmentation table in Allan et al., 2004). Both can result in a higher ratio than we would have if the total nitrate were purely pON. Therefore, we derive two bounding RpON values from the glyoxal chamber experiment. First, we determine the RpON value from the experiment by assuming pure pON formation to obtain an upper limit. Second, to obtain the lower limit of RpON, we assume all observed NH4 increase is NH4NO3 aerosol, and we subtract this equivalent amount of inorganic nitrate, with the inorganic ratio, from the total NO3, in order to obtain a lower limit of pON time series and calculate the RpON. This strategy has been described as the “excess NH4” method in Takeuchi and Ng (2019). By rearranging Eq. (2) to Eq. (S2) in the Supplement, we can obtain RpON using fpON, RpAmN, and Robs for the lower limit experiment (see details in Sect. S3 in the Supplement).
The upper limit experiment gives RpON=0.0035 (see Fig. 2a). If we compare to RpAmN=0.0115 ± 0.0002 (measured separately with pure AmN), RpON=0.0035 obtained from the upper limit experiment gives RoR=3.29 (see Fig. 2a). This value is higher than RoR for SV-AMS but lower than RoR obtained from Hu et al. (2017a).
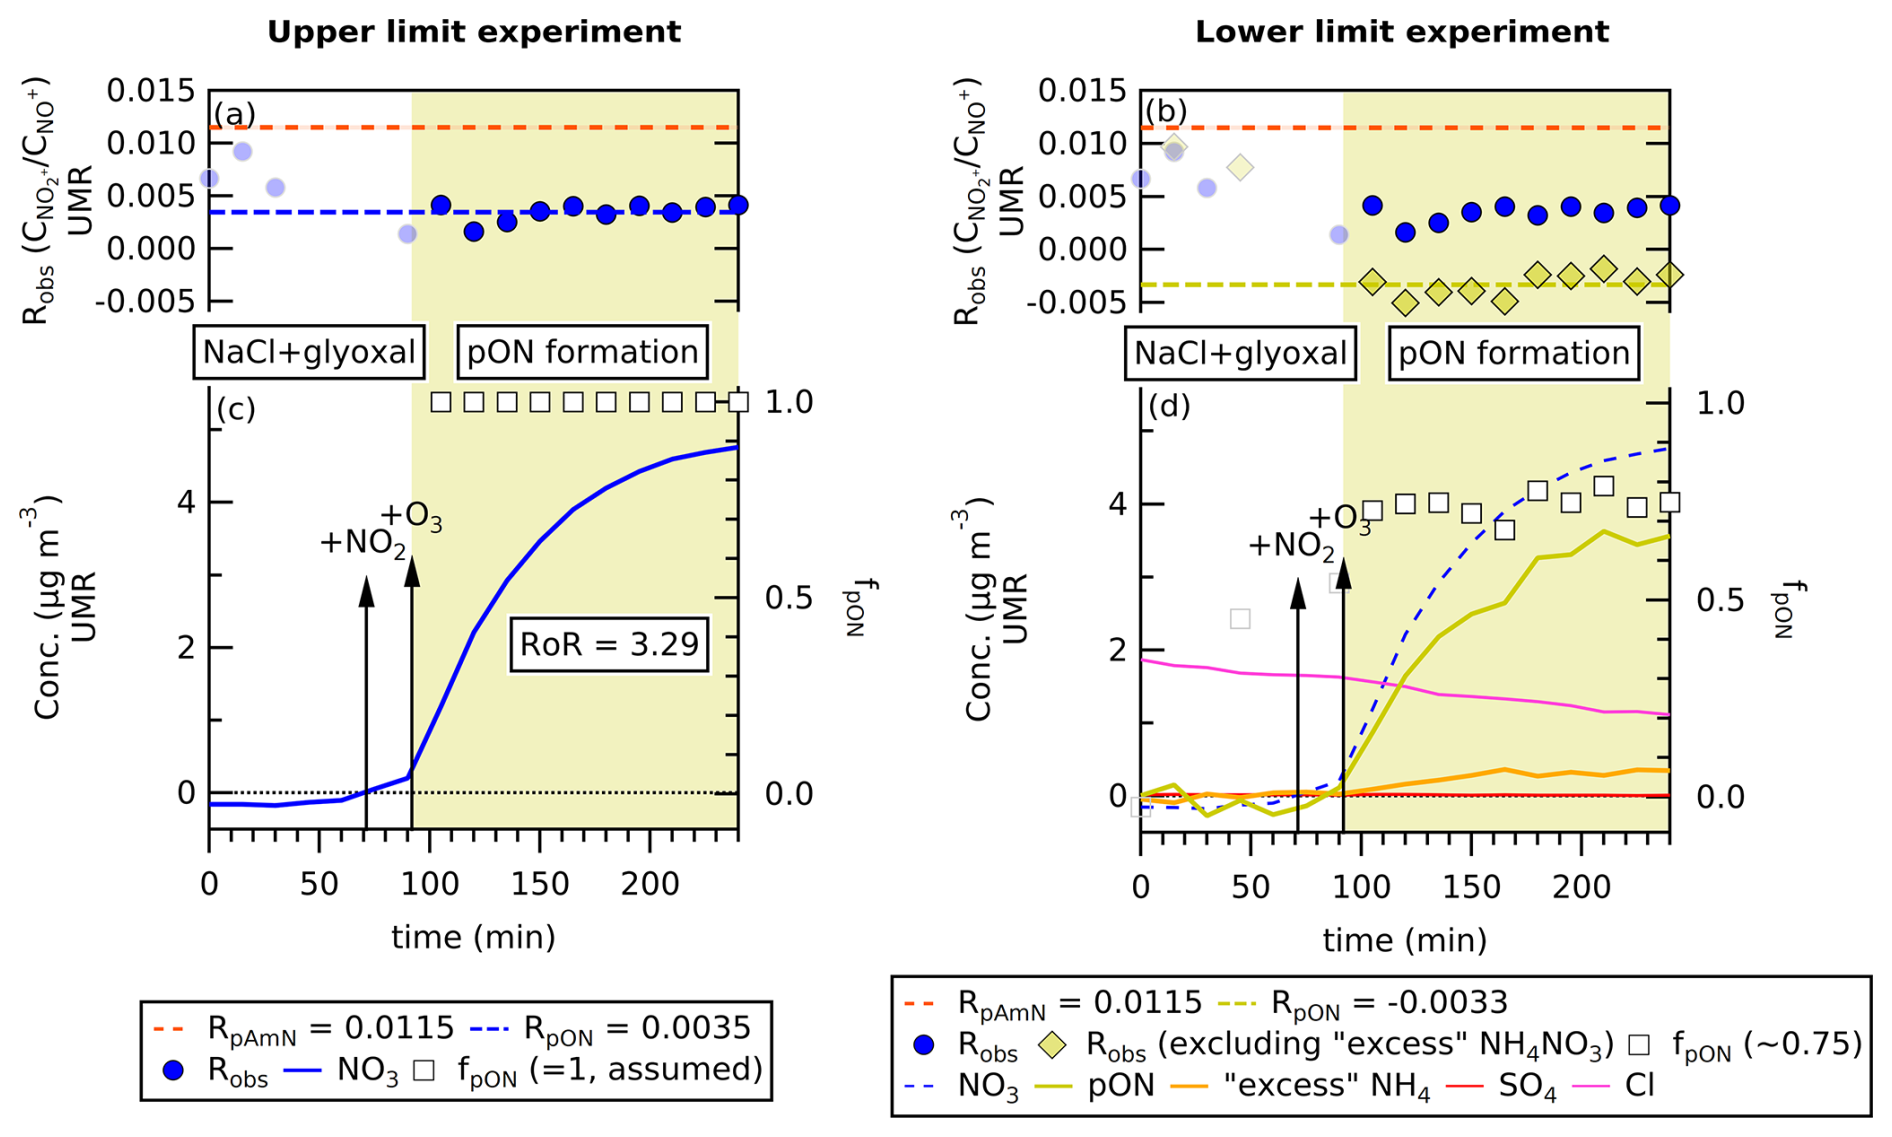
Figure 2The time series of (a, b) Robs, (c, d) ACSM species concentration (in µg m−3, left bottom axis), and fpON (right bottom axis) of glyoxal + NO3 chamber experiment at 15 min time averaging. The UMR fragmentation table specific for glyoxal is used to obtain and . Panels (c) and (d) show the progression of NO3 concentration compared to panels (a) and (b) for the ratio during the formation of pON. By averaging Robs after pON formation started, the left-hand panel shows that RpON=0.0035 is obtained when assuming fpON=1. When possible inorganic impurity is removed by assuming “excess” NH4 species are NH4NO3, the average fpON is found to be 0.75. The excess NH4 concentration is obtained by subtracting total NH4 concentration by the average NH4 concentration before the addition of NO2 and O3 (to exclude any possible NH4Cl contribution). By calculating RpON using the obtained fpON from the “excess NH4” method, RpAmN, and Robs, the value is obtained, suggesting an overcorrection (see text). The value RpON=0.0035 from the lower limit experiment and RpAmN=0.0115 ± 0.0002 (mean ± uncertainty) give a ratio of ratios () of 3.29.
On the other hand, the lower limit experiment gives (see Fig. 2b). A negative (or below zero) RpON value is not chemically possible for the ratio. This value indicates an overcorrection, or that RpON is varying around the zero value (small positive and negative) when the air mixture is strictly inorganic nitrate free. Thus, for calculation purposes, we use RpON=0.0001 to represent the smallest possible ratio for CV-ACSM measurements.
As the RoR from the experiments (including Hu et al., 2017a, RoR=13.3) are very different, we set the upper limit of RpON to be RpON obtained using RoR=3.29, and we set the lower limit to be RpON=0.0001 in CV. The calculated RpON values for two CV-ToF-ACSMs deployed in this study are summarized in Table 2. These limits are used to determine the uncertainty of the fpON calculation. Since we see a tendency for the 46 signal intensity (and thus ) to be produced in the vaporizer in relatively small quantities compared to NO+, the tendency of RpON, therefore, is also to approach zero (non-normal distribution). With only limited information about RpON in CV unlike SV, we use the geometric mean instead of arithmetic mean to establish the expected central value of RpON. We note that it is common to use geometric means to estimate averages of ratios.
Table 2Summary of measured RpAmN (including uncertainties) and calculated RpON (upper and lower limits as determined from pON in glyoxal + NO3 chamber experiment). The geometric mean is considered as the central value since RpON is likely approaching zero. Values are for ACSM-UU (employed for ambient measurements in Cabauw) and the ACSM-RUG (employed for AIDA chamber experiments).
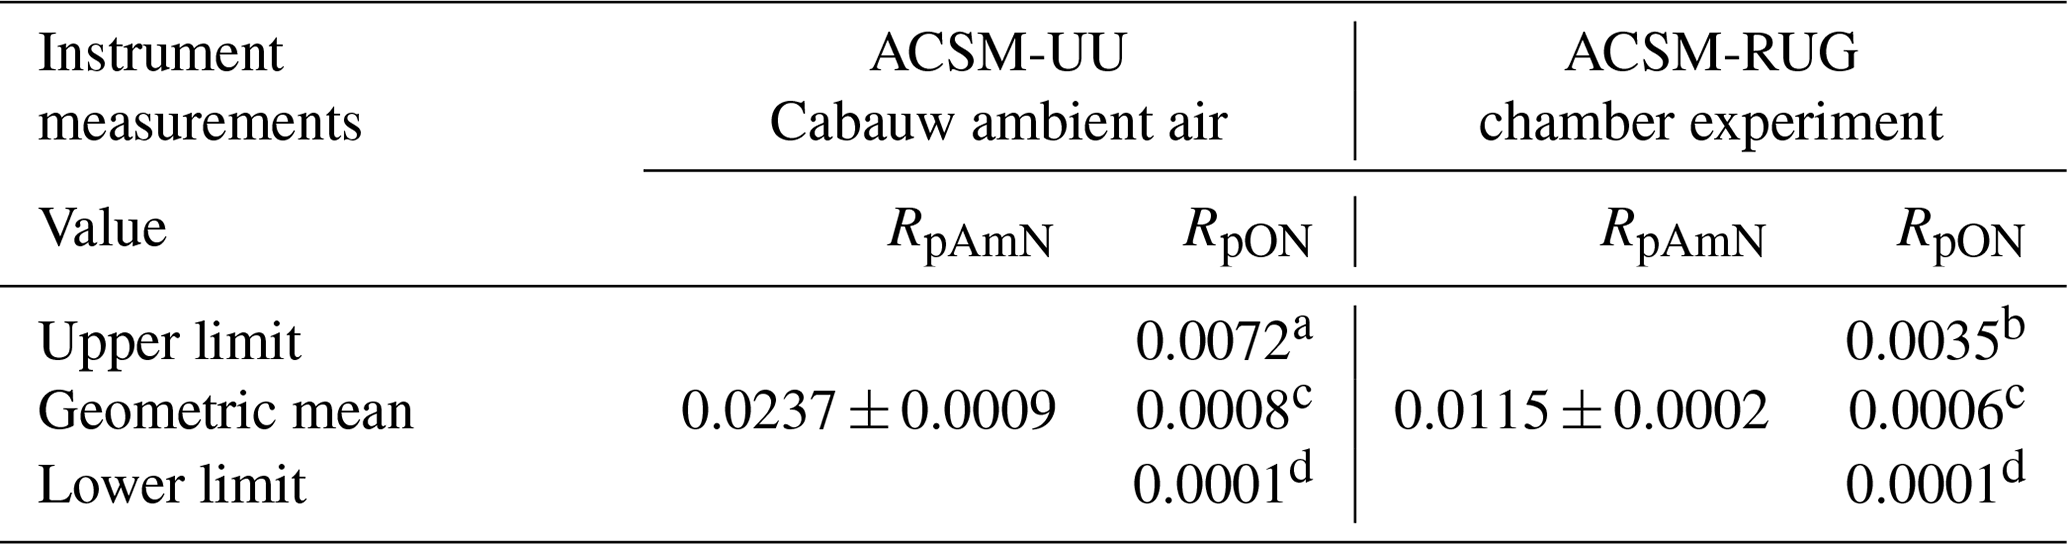
a Calculated using RoR=3.29. The RoR is obtained using RpON from the upper limit experiment of glyoxal + NO3 and measured RpAmN, using ACSM-RUG (see Fig. 2).
b Experimental ratio value from the lower limit experiment of glyoxal + NO3 using ACSM-RUG (see Fig. 2a).
c Geometric mean of the upper and lower limit of RpON.
d Set as the lowest possible ratio in CV-based instruments, approaching zero.
Since the RpAmN values are quite different for the two ACSMs used in this study (as we see in Table 2), the upper limit RpON values are also different by almost a factor of 2. However, since the lower limit of RpON approaches zero, the geometric means of the upper and lower limits for the two instruments differ by only 25 %. While calibrating every instrument with a pure organic nitrate aerosol standard would be a preferable way to establish RpON, we recognize the unlikeliness of that for all monitoring ACSMs. Therefore, we recommend this RoR-based approach. As will be shown in the following section, despite the uncertainties outlined here based on potential impurities in our “pure pON” chamber experiment, the nitrate splitting performs encouragingly well, with both ACSMs.
5.1 Challenges in the ratio method application to the CV-UMR-ToF-ACSM dataset
Applying the ratio method to separate pAmN and pON in CV-UMR-ToF-ACSM datasets is a greater challenge than with SV, due primarily to the higher detection limit of NO3. The detection limit of pNO3 in CV-UMR-ToF-ACSM is 0.01–0.08 µg m−3 (from this work and Zheng et al., 2020, converted), which is around 10–100 times higher compared to those in SV-cToF-AMS (∼0.6 ng m−3 from Drewnick et al., 2009) and SV-HR-ToF-AMS (0.1–4.0 ng m−3 from DeCarlo et al., 2006), all converted to 10 min time resolution.
The poor detection limit for ratios in CV-ToF-ACSM results from the low signal for 46 relative to 30 that are used to calculate frag_NO3[30] () and frag_NO3[46] (). For instance, using ACSM-UU, the detection limit of is comparable to the detection limit of NO+ at pNO3 concentration near the detection limit of pNO3 ( µg m−3; µg m−3; for µg m−3; all in 10 min time resolution). However, the magnitude of observed from ambient measurements is 25–500 times lower than NO+ in CV-ToF-ACSM. This means the signal intensity is regularly close to the detection limit, particularly when the total pNO3 concentration is low. This behavior also leads to noisy Robs, due to a computation of very low or negative signals, poor baseline, or both.
5.2 Data pre-treatment: time averaging and data filtering
To determine which data points are reliable for Robs calculation in the dataset, we could discard observed signal intensities that are below the detection limit. However, this would result in removing nearly all the data, including data that, while low and noisy, can still provide quantitative information with adequate averaging. Therefore, we use observed NO+ signals as the filtering parameter. The NO+ signal accounts for ∼95 % of the total concentration of NO3 species measured by ToF-ACSM (no RIE applied) and thus is a good indicator of when both NO+ and signals are too uncertain.
Equation (4) describes the NO+ signal limit () which assures reliable separation of fpON and fpAmN calculated using the detection limit of () and RpAmN as filter ratio. We choose the larger RpAmN value, which is a less strict limit relative to the RpON value but still keeps any data with sufficiently good signal-to-noise ratio. The measured data points with observed NO+ signal intensity below these criteria are replaced with “nan” (not a number).
On this basis, we recommend data pre-treatments by time averaging and data filtering using observed NO+ signal contribution as parameter. Time averaging over longer time periods allows for the reduction of the electronic noise coming from the instrument response and low counting statistics associated with sampling ambient air. Meanwhile, the data filtering serves to determine the minimum pNO3 concentration at which reliable Robs can be obtained to calculate fpON and fpAmN.
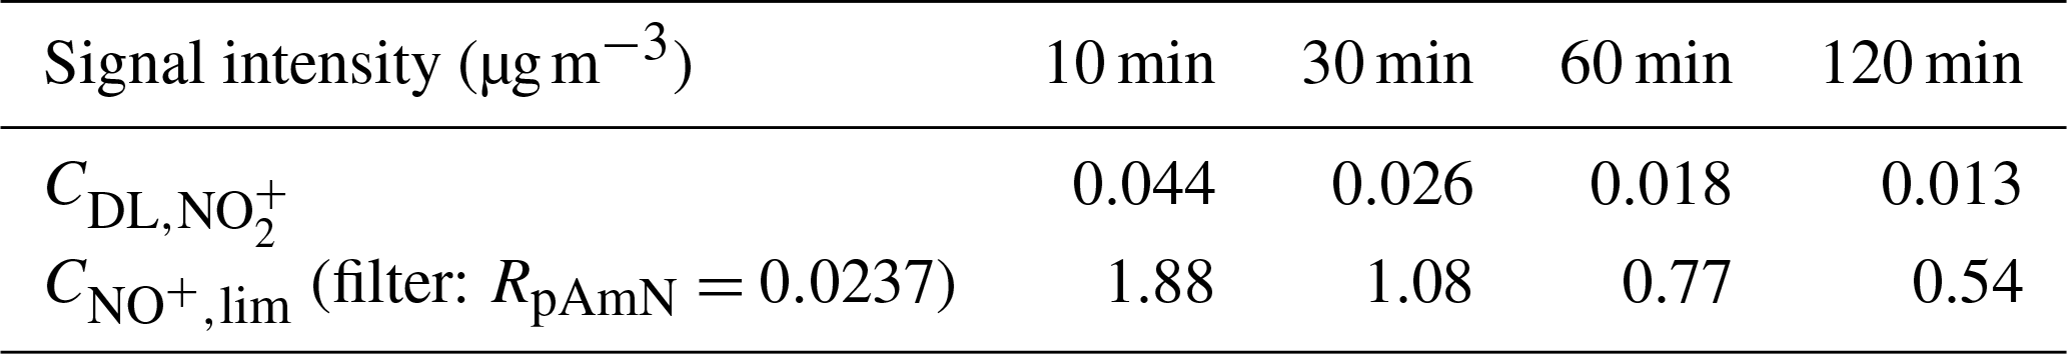
The values of and with different time averaging are evaluated in Table 3 for the CV-ToF-ACSM deployed for ambient measurements in Cabauw, the Netherlands. The signal limit is lower as the time resolution increases due to the improvement of detection limit with better statistics. For measurements in this study, the minimum reliable values for 10, 30, 60, and 120 min time resolutions are 1.88, 1.08, 0.77, and 0.54 µg m−3, respectively.
Table 3Detection limits of and signal limits for NO+ across different time averaging with RpAmN as filter ratio for the CV-UMR-ToF-ACSM deployed for ambient measurements in the rural site of Cabauw, the Netherlands (ACSM-UU).
With these values, we performed data filtering to the ambient measurement time series from Cabauw with different averaging of the time series. The time averaging (generated by Tofware v3.3) is applied first before the data filtering to maximize retained data in the concentration average.
Chemical coordinate plots of Robs and fpON against the total concentration of particulate nitrate () are shown in Fig. 3. These plots show the quantile average of the output variable on the y axis (i.e. Robs or fpON) as a function of concentration bins in the x axis (). Figure 3a and b show that data filtering removes extreme Robs and fpON values near the detection limit level. The fact that the chemical coordinate trends are consistent across different averaging times indicates that filtering to remove noisy data will not bias the interpretation of the ensemble dataset. The value of treating the data as a chemical coordinate plot is to allow for a robust characterization of the average trend, even using a method with substantial uncertainties. Importantly, the standard errors represent how well the averages are known. Their small uncertainty ranges support the result that the characterized trend is robust.
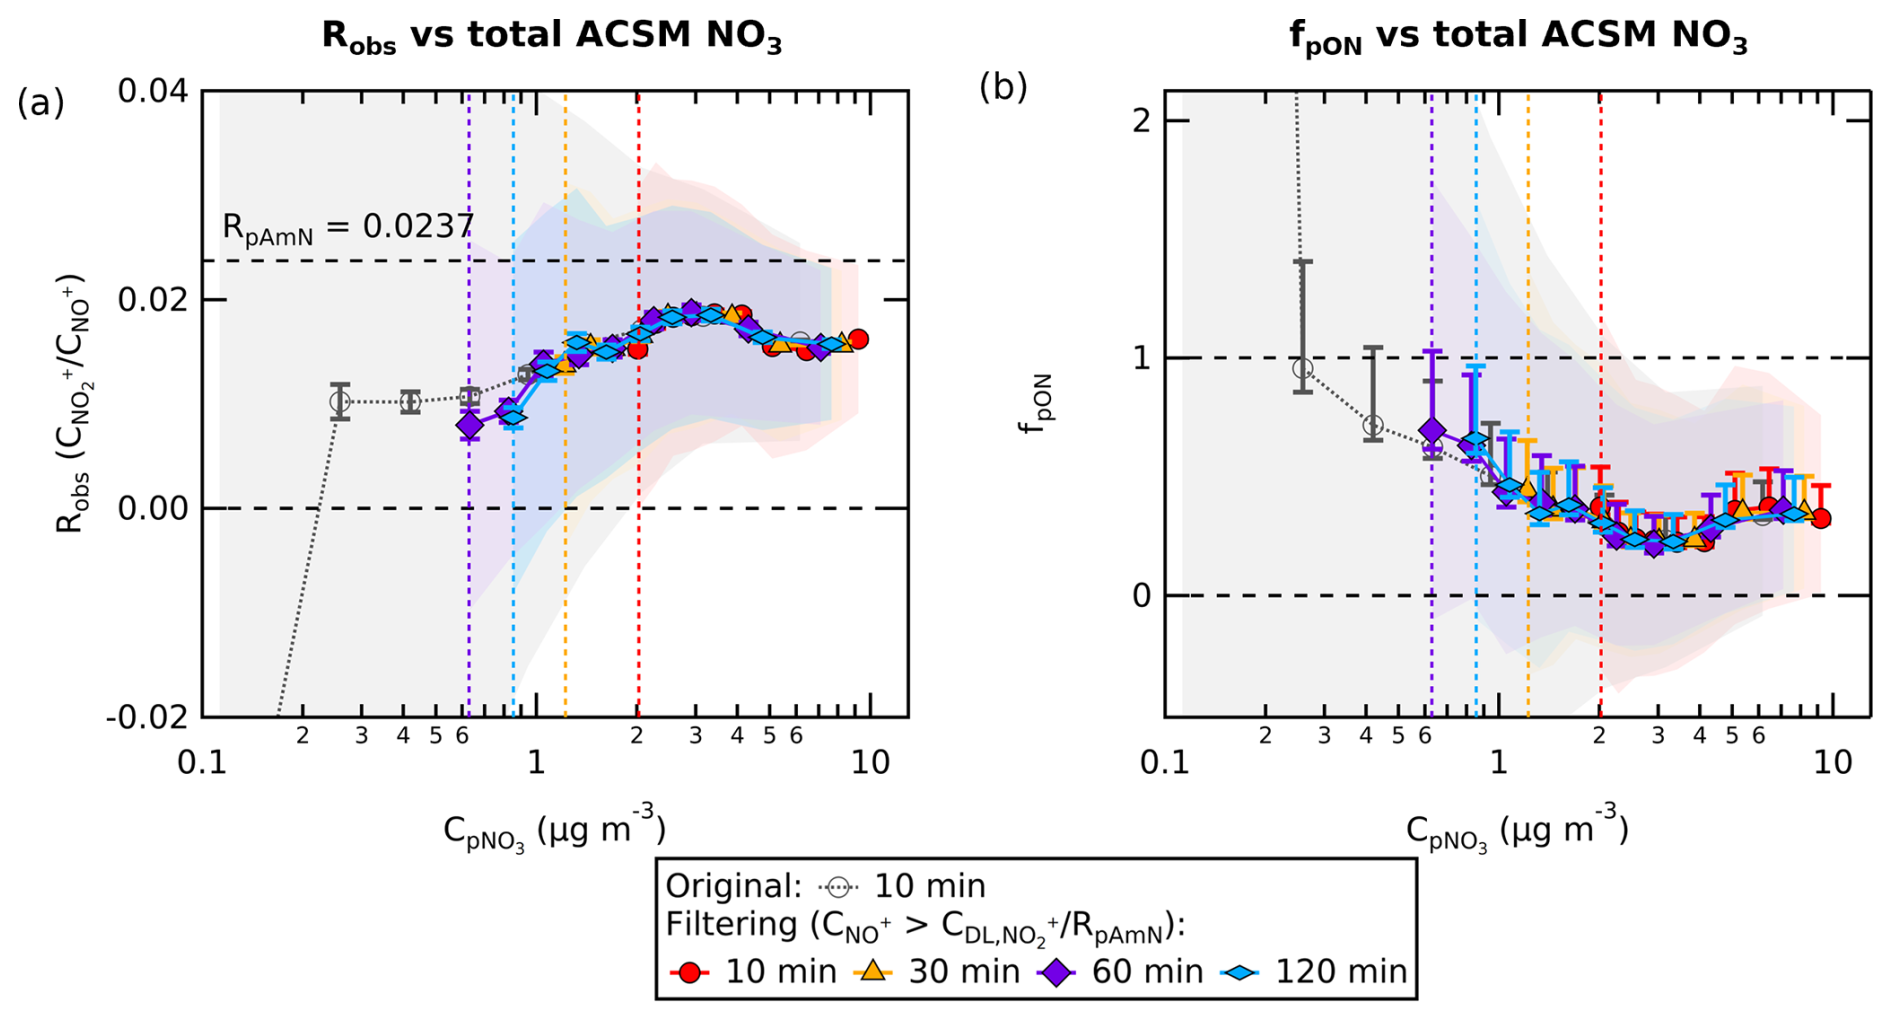
Figure 3Chemical coordinate plots (a) for Robs against in Cabauw (net 205 d of data) and (b) for the fpON calculated using geometric mean of RpON (RpON=0.0008) against . The revised fragmentation table for the typical ambient dataset is used to obtain and . The line and marker traces represent the quantile average. The colored shading represents the standard deviation of each quantile, while the whisker is the standard error. The standard deviation and standard error both include the uncertainty of ion counting statistics from measurements and the uncertainty from ODR fit slope of fragmentation table correction. For fpON (plot b), the standard deviation and standard error also include the uncertainty from the lower and upper limit of RpON (RpON=0.0001; RpON=0.0072). All analyses were done using the 10, 30, 60, and 120 min averaging of the time series, with data filtering. The original 10 min data without pre-treatment are also included for comparison. The combination of data filtering and time averaging reduces the noise compared to original data and improves the minimum concentration reliable for apportionment calculation (pNO3 concentration limit for each time average, as indicated with vertical dashed lines).
The combination of data filtering and time averaging shows different concentration cut-offs for calculation of the ratio. The concentration cut-off is lower for longer averaging times due to the improvement of . For measurements in this study, the cut-offs for 10, 30, 60, and 120 min time averaging are 2.0, 1.2, 0.9, and 0.6 µg m−3, respectively. Because there is a trade-off between time resolution and the concentration cut-off, for a given dataset, the timescale of typical variations should be assessed in order to determine the appropriate averaging time.
5.3 Propagation of uncertainty
We propagated uncertainties from the variables in fpON using simplified propagation of uncertainties using standard error (Day et al., 2023; see Sect. S4.3 in the Supplement for details). The uncertainty of the final function (sf) is calculated using the standard error () and partial derivative of the function () of each measurand (xi) using Eq. (5).
The uncertainty of fpON arises from three terms: Robs, RpAmN, and RpON. For Robs, the uncertainty is further composed of six components that make up NO+ and signals (the uncertainties of 29, 30, 45, and 46 related to precision uncertainty from electronic noise and ion counting statistics and the uncertainties of the fragmentation table multipliers, represented by the uncertainty of ODR fit slope). For RpAmN, we propagate the uncertainty of the mean ratio from repeated NH4NO3 measurements using ODR fit to consider the instrument stability in acquiring the ratio over time. For RpON, the uncertainty is set to zero. Instead, the lower and upper limits of RpON (see Table 2) serve to give a range of final propagated uncertainty, which includes Robs, RpAmN, and RpON.
Figure 4a shows that low pNO3 concentrations produce larger uncertainties in fpON () compared to higher concentrations. If we compare the analysis with and without data filtering, we observe that filtering targets data points with high absolute (above ±0.5). We avoid removing many data points in the low concentration range by performing time averaging, where the average uncertainty decreases by for each N-fold of averaging from 10 min. Meanwhile, the uncertainties from RpAmN and RpON (RoR) remain unaffected by time averaging because the values remain constant in the time series.
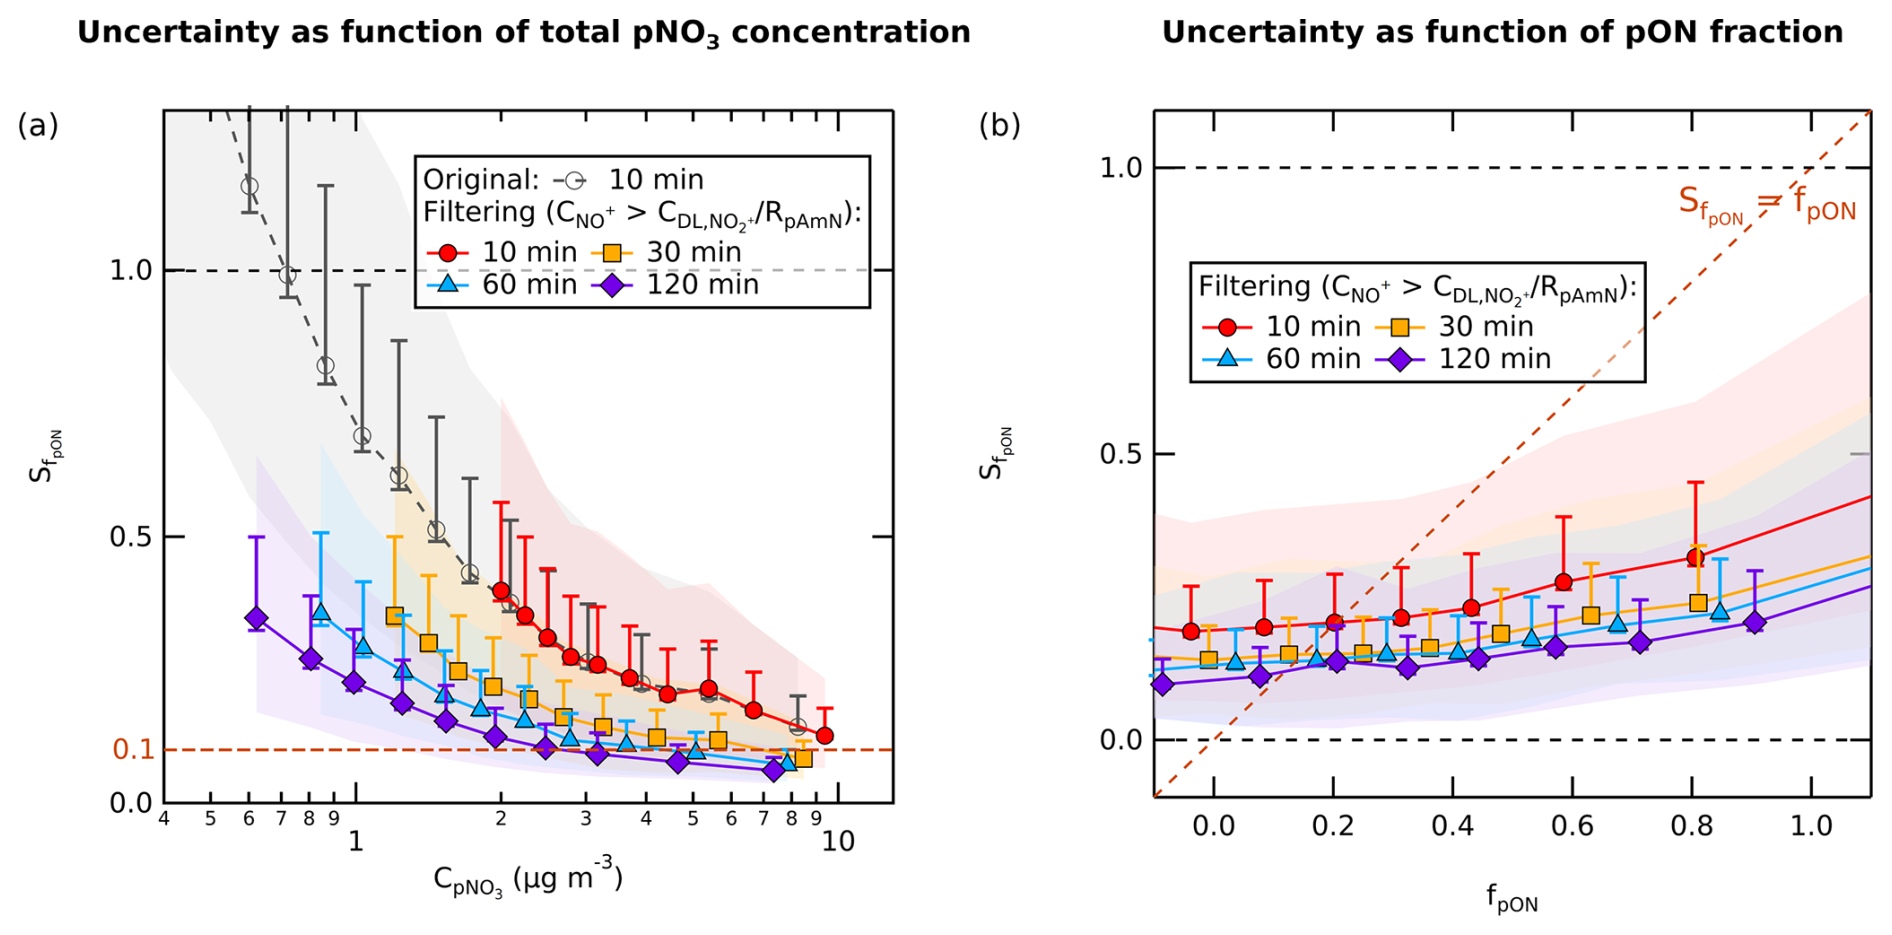
Figure 4The chemical coordinate plot (quantile average) between (a) and (logarithmic scale) and between (b) and fpON (linear scale), with RpAmN=0.0237 as filter ratio at various averaging times of the time series. The line and marker trace represent the average uncertainty produced from the geometric mean of fpON. The uncertainty consists of uncertainties of ion counting statistics from measurements, uncertainty from ODR fit slope of fragmentation table correction, and uncertainty of RpAmN. The colored shading represents the standard deviation of each quantile, while the whisker is the standard error. The shading and whisker both include the uncertainty of RpON coming from the lower and upper limit of RpON (RpON=0.0001 and RpON=0.0072), as well as the uncertainty of the average quantile. Uncertainties of fpON<0.1 (absolute value) are reached at pNO3 concentration >10 µg m−3 for 10 min time averaging, while at 60 min it is reached already at ∼4 µg m−3. In terms of fraction, uncertainties of fpON below the calculated fpON () is reached at fpON∼0.2 for 10 min averaging, while at 60 min it is reached at fpON∼0.17.
Several studies reported fpON lower than 20 %, which occur mainly in urban areas and during a colder period. Yu et al. (2024) observed a lower range of annual average of urban fpON in China to be ∼17 %, while Mohr et al. (2012) and Pandolfi et al. (2014) reported ∼13 % fraction in Barcelona, Spain, and Xu et al. (2021) reported 9.8 % fraction in wintertime Beijing, China. If we use the lower range of fpON of ∼10 % as reference for the minimum uncertainty needed to report reliable fpON, we can observe that the lowest pNO3 where we obtain below 0.1 absolute uncertainty in fpON decreases along with time averaging as well. Uncertainties below ±0.1 can only be reached at pNO3 concentrations higher than 10, 7, 4, and 2 µg m−3 at 10, 30, 60, and 120 min time averaging, respectively.
Figure 4b shows the relationship between the absolute and fpON. The limit at which the absolute value of is below or equal to fpON (minimum uncertainty) is found to be 20 %, 15 %, 14 %, and 12 % at 10, 30, 60, and 120 min time averaging, respectively. This result suggests that the ratio method in CV-UMR-ToF-ACSM is more reliable to analyze nitrate pollution episodes or chamber experiments and not for low background pNO3 concentrations. By combining both the concentration limit and the fraction limit, we suggest that in the region where pNO3 concentration is <10 µg m−3 and/or fpON<12 %, the method requires a longer time average to calculate fpON to achieve minimum uncertainty.
6.1 Ambient measurements at a rural site
In order to demonstrate the efficacy of this method, we investigate the trend of fpON and fpAmN in the dataset observed at Cabauw. The ambient concentration time series of pAmN and pON (using RpAmN=0.0237 and RpON=0.0008) are compared with the ACSM-measured Org and NH4 fractions, shown in Fig. 5. The time series are averaged to 60 min and filtered using RpAmN=0.0237 (values of are discarded). We observe that fpON increases with increasing fraction of organic aerosol concentration in total ACSM PM2.5 (, from 48 % to 64 %), whereas the fpAmN increases with increasing fraction of particulate ammonium concentration in total ACSM PM2.5 (, from 8 % to 15 %). This shows that the organic nitrate fraction is correlated with availability of organics (particularly at high organic fraction), while the inorganic fraction increases with available NH4 (particularly at low ammonium fraction).
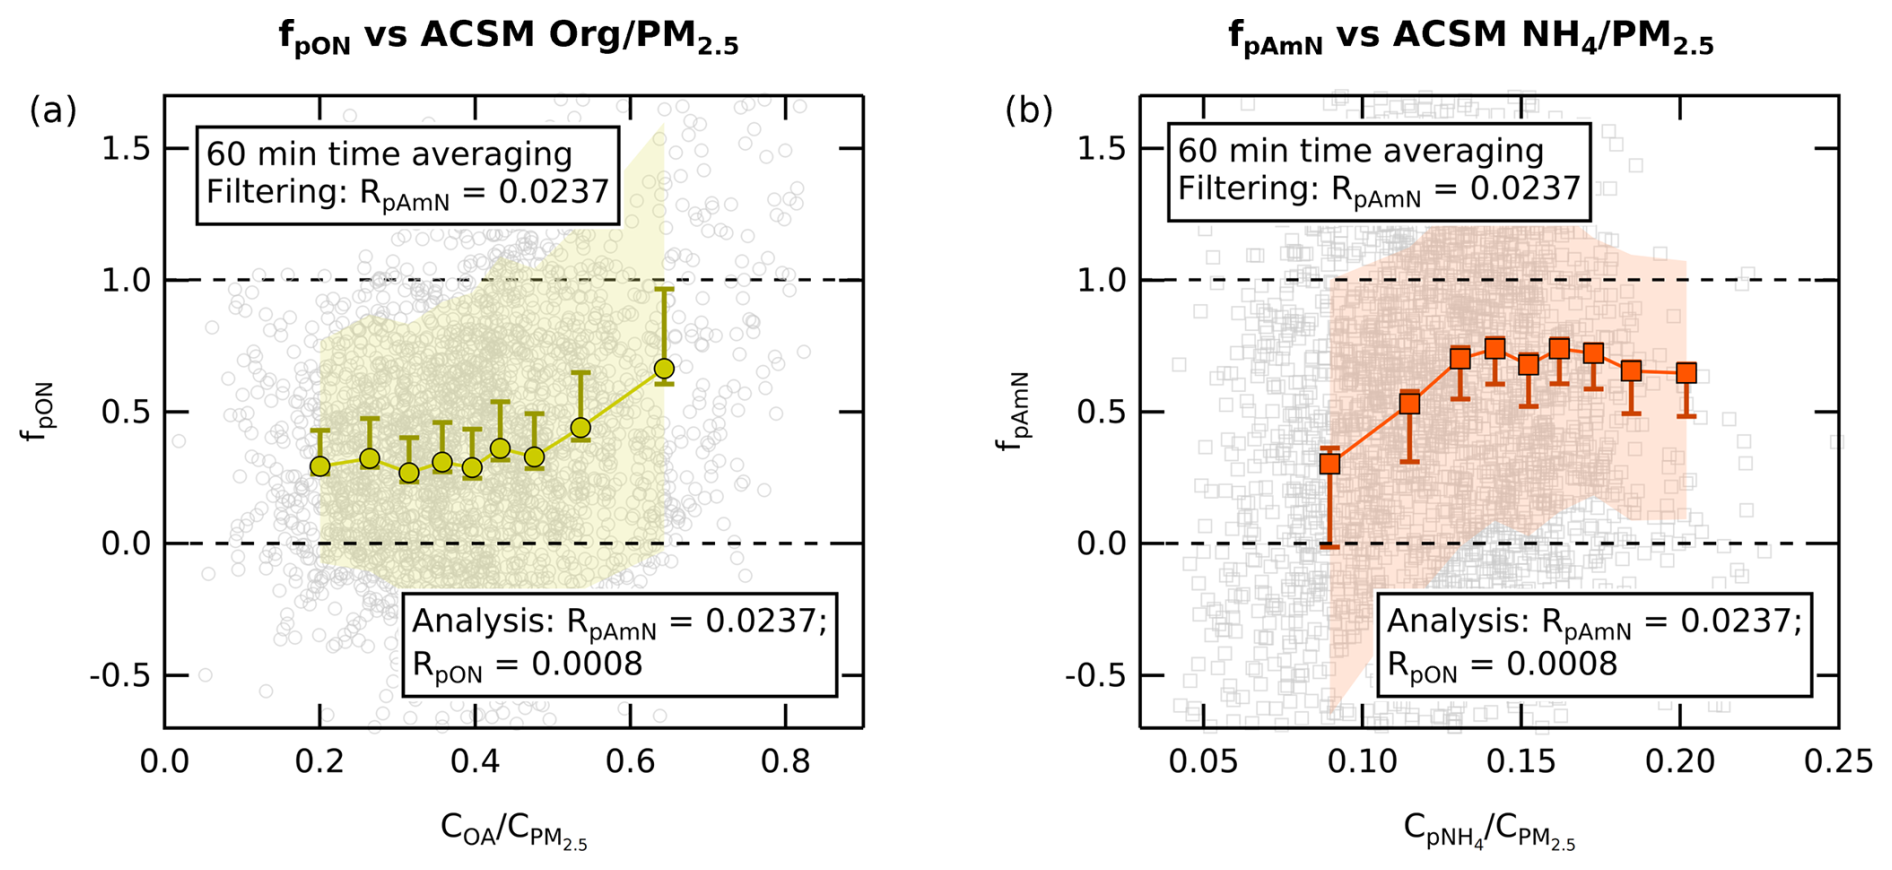
Figure 5(a) The chemical coordinate plot (quantile average) of fpON against shows an average increase in fpON as OA fraction increases from 48 % to 64 %, where the fpON varies from 33 % to 66 %. (b) The chemical coordinate plot (quantile average) of fpAmN against shows an average increase in fpAmN as pNH4 fraction increases from 8 % to 15 %, where fpAmN varies from 30 % to 74 %. Note that all quantile averages were calculated using the 60 min averaging of the time series. The colored shading is the standard deviation of each quantile average, while the whiskers represent the standard error. They include the uncertainties of ion counting statistics from measurements, uncertainty from ODR fit slope of fragmentation table correction, and the RpON range value.
We also investigate specific nitrate episodes to show the composition of pON and pAmN in ambient pollution events. The time series of the ratios, ACSM species concentrations (OA, pNH4, pNO3), and pAmN and pON concentrations are shown in Fig. 6. Four nitrate episodes from spring (15 May 2023), summer (23 June 2023), autumn (5–6 September 2023), and winter (11 January 2024) are shown. The uncertainty of the concentration is obtained by combining the uncertainty from the nitrate fraction (fpON or fpAmN), the total ACSM NO3, and the RpON value range (see Eqs. S14 and S15 in the Supplement). Note that the reported uncertainties are only related to precision uncertainty and not to concentration quantification (e.g., ionization efficiency) like the one described by Bahreini et al. (2009) (see details in Sect. S4.3). We observe that the adapted ratio method is able to separate contributions of pON and pAmN to the total pNO3 concentration. In Fig. 6i, ii, and iv, we can see that the time series of pON tracks with total OA, while pAmN tracks with pNH4 in the rural site. In Fig. 6iii, no significant trend is observed for pON due to lower mass loading of pNO3.
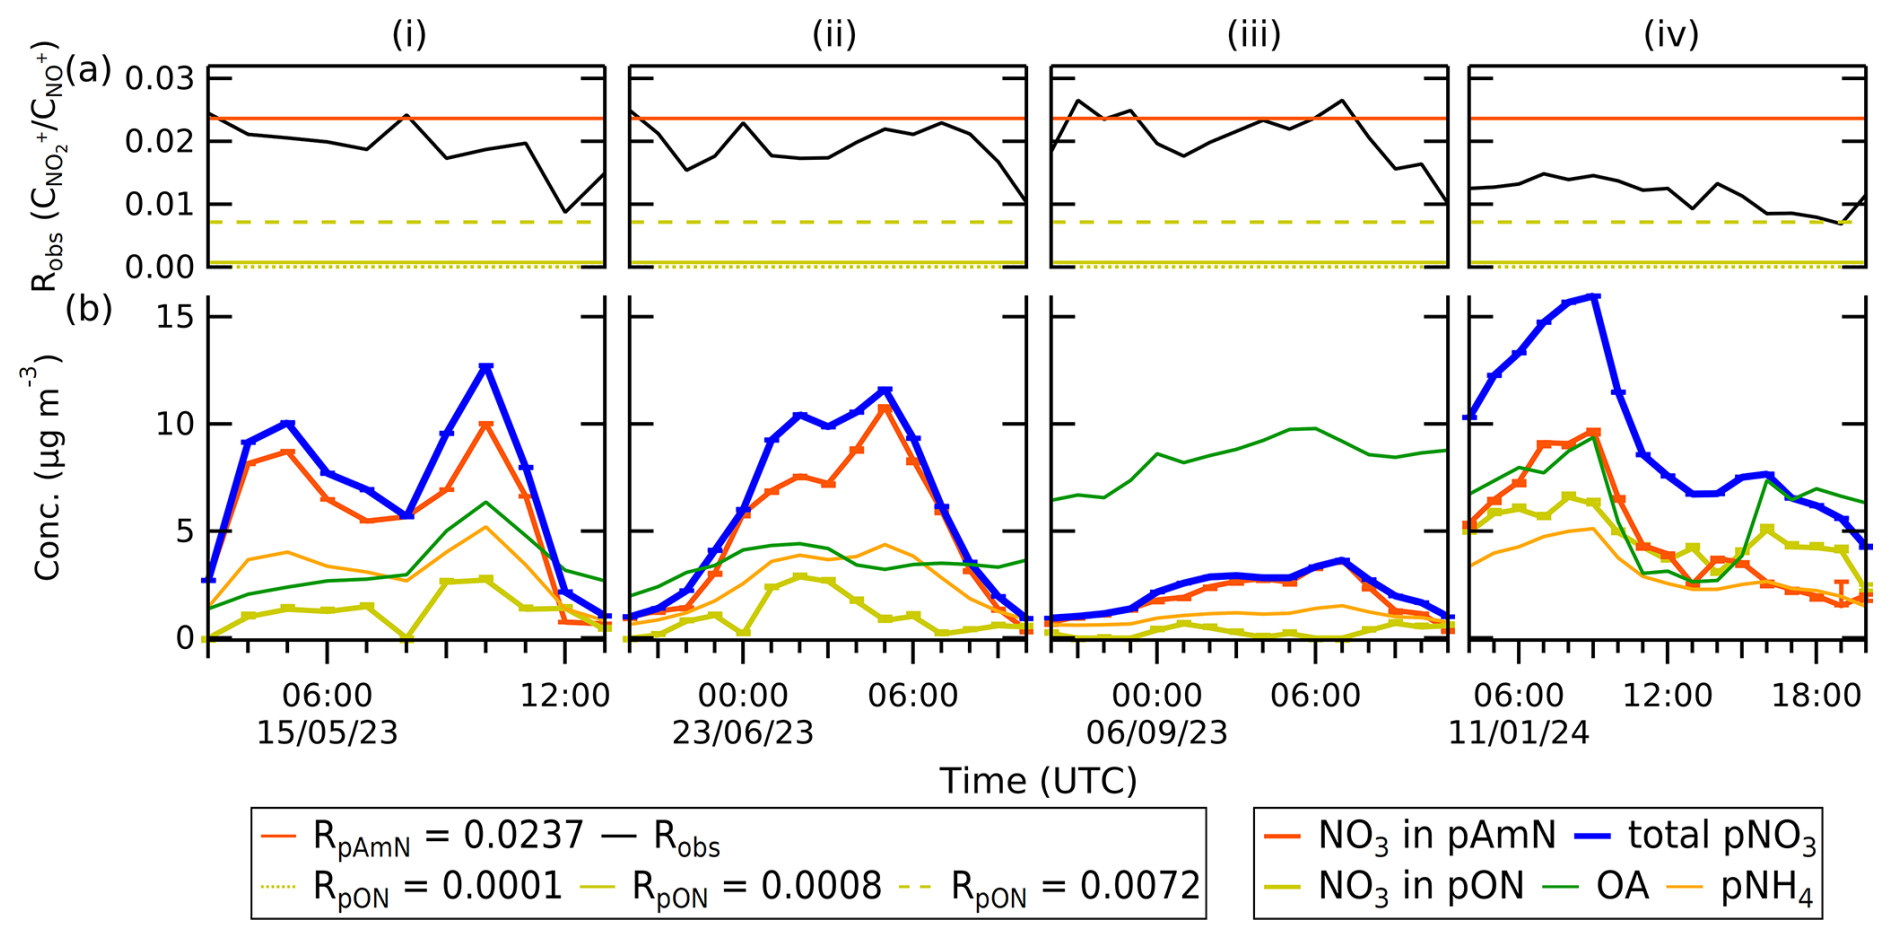
Figure 6The time series for select periods of (a) Robs, with horizontal lines indicating the values for RpAmN and RpON, and (b) mass concentration of ACSM-measured total OA, pNH4, and pNO3, as well as pAmN and pON. The separation of pAmN and pON is calculated using RpAmN=0.0237 and RpON=0.0008. The whiskers represent the uncertainty from nitrate fraction (fpON or fpAmN), precision uncertainty of total ACSM NO3 from Tofware v3.3, and the RpON value range. The time series (i), (ii), (iii), and (iv) represent representative compositions in spring, summer, autumn, and winter, respectively, all with 60 min time averaging.
Unless there are co-located ambient measurements of UMR and HR instruments, the reported concentration of NO3 in pON depends on the value of RpON and multipliers used to calculate NO+ and signal contribution in the fragmentation table. The sensitivity of these variables needs to be assessed to understand which parameter is the most critical in the separation of the inorganic and organic nitrate signal from ACSM.
In Fig. 7, we show the sensitivity analysis of RpON, aOrg[30],[29], and aOrg[46],[45]. We varied RpON from zero to RpON=0.0072 (calculated using RoR=3.29). Figure 7a suggests that for the reported pON concentrations are not significantly different and therefore confirm the lower limit of RpON approaching zero, as established in Table 2. The value of RpON calculated using RoR (in this case RpON=0.0072) shows relatively higher pON concentration, which is consistent with its use as the upper limit of RpON.
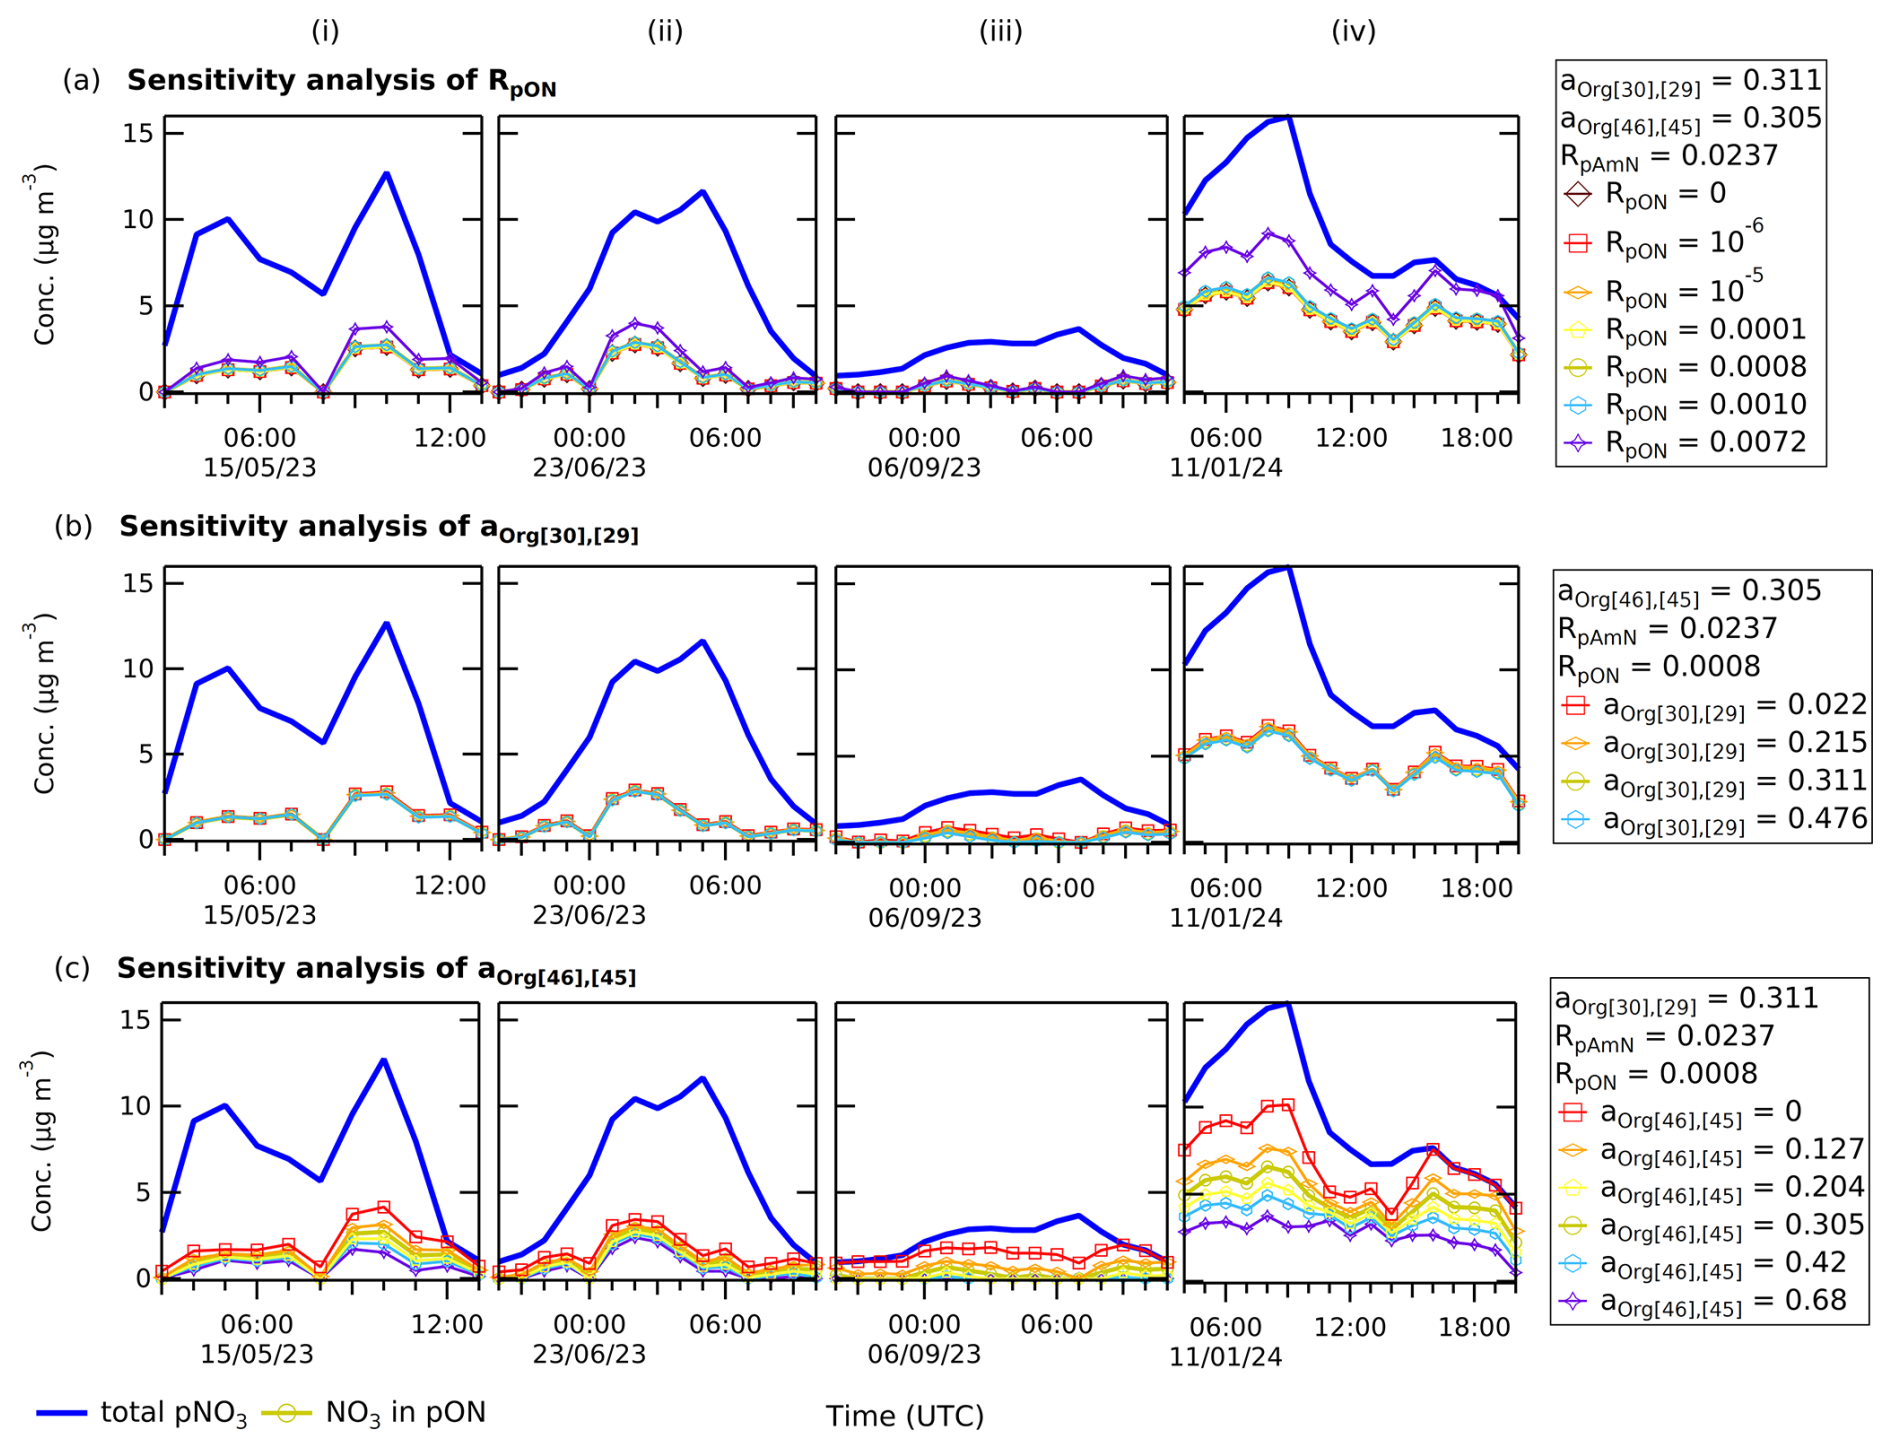
Figure 7Sensitivity analysis of (a) RpON, (b) aOrg[30],[29], and (c) aOrg[46],[45] to the pON concentration (NO3 in pON) calculated using adapted ratio method. The time series in each case is an ambient pollution episode in Cabauw, the Netherlands, during spring, summer, autumn, and winter period (i–iv). The results show that (a) does not show significant differences in reported pON concentration, and (b) the reported pON concentration is not sensitive to the change in aOrg[30],[29]. In contrast, the results (c) show a significant change in reported pON concentration when aOrg[46],[45] is varied, showing that this correction is the primary limitation of the ratio method in CV-ACSM, as it can be highly dependent on the calculation of signal contributions to 46.
We also varied aOrg[30],[29] and aOrg[46],[45] using the values listed in Table S4 and Fig. S1c and d. Figure 7b shows that the calculated pON concentration is sensitive to aOrg[46],[45], which is not the case for aOrg[30],[29]. It further demonstrates that the limitation of this adapted ratio method is its sensitivity towards aOrg[46],[45] to obtain the signal contribution. Chemically, this suggests that the organic contribution at 46 can vary and comprises a substantial portion of the total 46 signal. Therefore, an average correction for 46 may result in a high uncertainty of calculated fpON using the ratio method. This was considered in the propagation of uncertainty, where we take into account the changing aOrg[46],[45] in the reported fpON, therefore representing a range of the observed organic nitrate contribution.
6.2 pAmN and pON formation in a chamber experiment
We investigated the pAmN and pON formation in a chamber experiment using limonene precursor, NO3 oxidant, and AmN seed aerosol. The experiment was carried out in the AIDA chamber. Alongside CV-UMR-ToF-ACSM (ACSM-RUG), an SV-HR-ToF-AMS managed by IMK KIT was also deployed.
The ACSM data are analyzed using the revised fragmentation table specific for terpene chamber experiments (see Sect. 3.2), while the AMS data are analyzed using Squirrel 1.66E and PIKA 1.26E with the default ion list. Although the time resolution is 2 min, time averaging and data filtering are not necessary since the experiment involves high concentrations. The lower limit, geometric mean, and upper limit of RpON (RpON=0.0001; 0.0006; 0.0035, respectively) are employed to estimate the uncertainty of fpON, alongside RpAmN=0.0115 (see Table 2). For the AMS instrument, the measurements of pure pAmN give RpAmN=0.61 ± 0.05, and the RpON value is calculated using RoR=2.75 ± 0.70 (Day et al., 2022a), which gives RpON=0.18, 0.22, and 0.30 as lower limit, mean, and upper limit, respectively.
We also performed PMF analysis using the ACSM data including OA, , and ions, which has been similarly done in other studies (e.g., Day et al., 2022a, and references therein). The 2 min average matrices of UMR organic fragment mass spectra with an of 12 to 120, fragments of ammonium (NH4_16 and NH4_17, two main signals of NH4 which are and ), and fragments of nitrate (NO3_30 and NO3_46, two main signals of NO3 which are NO+, ) are used as variables in the PMF input matrix. Fragment contributions are calculated using the terpene-related fragmentation table (see Sect. 3.2). We choose a two-factor solution (see Fig. S2 in the Supplement) as we are interested in splitting the aerosol mass only into inorganic aerosol (pAmN) and organic aerosol (OA mixture, containing pON). From the organic aerosol factor, we calculate the fpON from the factor concentration time series. The details of the PMF method are described in Sect. S5 in the Supplement, including the statistical summary and the diagnostic plots of the PMF analysis.
The ratio and fpON time series for the limonene SOA experiment are shown in Fig. 8. The whiskers around the mean fpON represent the uncertainties coming from the value range of RpON combined with the uncertainties from ion counting statistics, electronic noise, fragmentation table (for UMR), and RpAmN (see Sect. 5.3). The initial mixture of NH4NO3 seed and NO3 radical from NO2 and O3 gives a ratio that matches RpAmN from an offline calibration, where fpON is close to zero for both instruments. Although nitric acid (HNO3) can be formed by nitrogen pentoxide (N2O5) hydrolysis under these humid conditions, experiments were run in excess NH3; therefore, we expect no substantial increase in HNO3 that can affect the ratio. After the limonene injection, the Robs rose to values in between RpAmN and RpON, indicating the formation of a mixture of pAmN and pON inside the chamber.
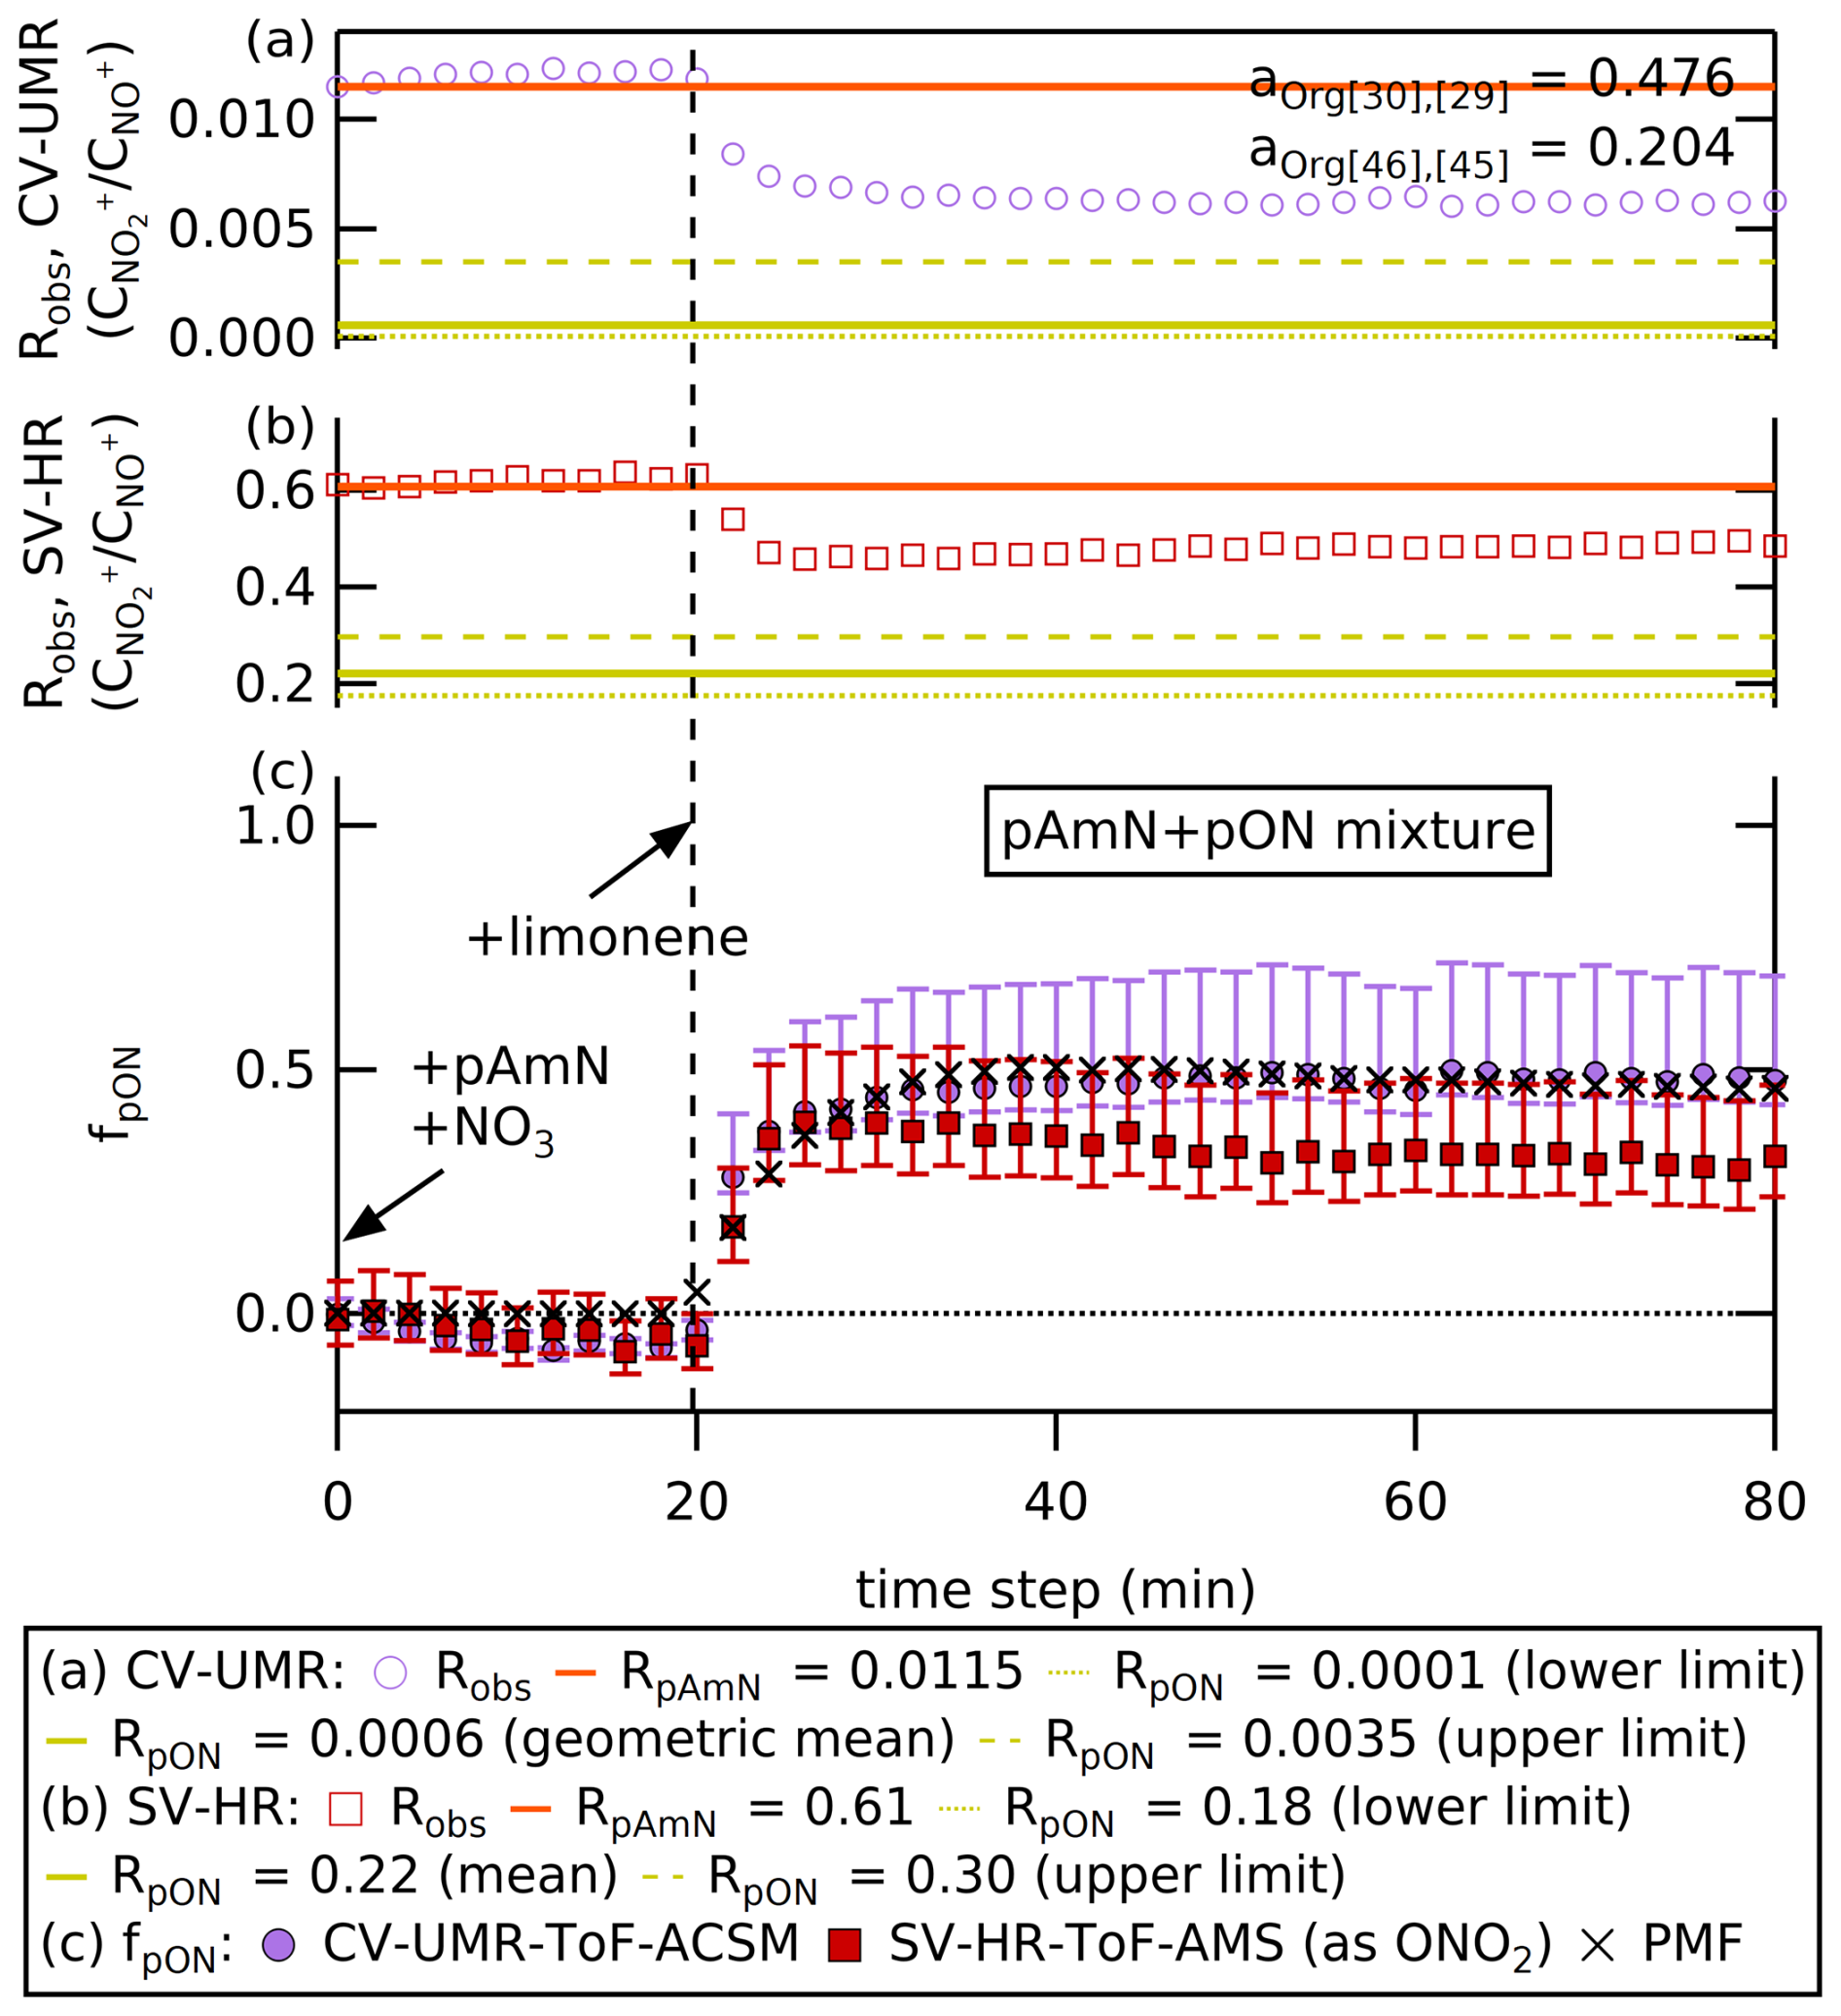
Figure 8(a, b) The time series with 2 min time averaging of Robs, RpAmN, and RpON measured by CV-UMR-ToF-ACSM (top) and SV-HR-ToF-AMS (middle). The fragmentation table specific for terpene is used to obtain the and of the chamber experiment. (c) The time series with 2 min time averaging of fpON from ratio method applied to SV-HR-ToF-AMS and CV-UMR-ToF-ACSM, as well as the PMF method applied to CV-UMR-ToF-ACSM. The markers represent geometric mean for the ratio method applied to CV-UMR-ToF-ACSM (circle), mean for ratio method of SV-HR-ToF-AMS (square), and for the PMF method of CV-UMR-ToF-ACSM (cross). The whiskers represent the uncertainties from the value range of RpON combined with the uncertainties from electronic noise, ion counting statistics, fragmentation table (for UMR), and RpAmN. The uncertainty from the PMF analysis is not shown for simplicity.
Based on observations of Takeuchi et al. (2024), pON measured with the SV-AMS is only quantitatively detected as −NO2 moiety, not −ONO2. The reasoning for this difference in detection of alkyl nitrate (RONO2) and NH4NO3 is thought to be due to thermal decomposition of pON producing NO2 gas in the vaporizer, while NH4NO3 would more likely decompose to HNO3 and thus dominantly ionizing gases of different molecular weights. The “missing oxygen” is generally retained bound to the carbon and thus accounted as an organic moiety. Thus, fpON needs to be corrected for this phenomenon using molar mass ratio of (62 g mol−146 g mol−1) to recalculate the pON mass. There is no study yet assessing the necessity of correcting fpON in CV, and we suggest that it is likely unnecessary due to the more complete thermal decomposition that shifts the fragmentation pattern of both NH4NO3 and RONO2 to NO2 and NO.
Both ratio methods (SV-AMS and CV-ACSM) and the PMF method (CV-ACSM) show a similar response to the injection of limonene, whereupon fpON increases rapidly from ∼0 to 0.3–0.5. The agreement between the two instruments on this initial pON production is encouraging. However, after this initial jump, the trend of fpON seems to vary. While mean fpON calculated using the ratio method from CV-ACSM remains steady after the injection, the other two results show a gradual decrease in fpON as the chamber dilutes.
The ratio method on CV-ACSM data shows a similar change in fpON relative to the PMF method immediately after limonene injection but then continues to decrease over time (see Fig. 8). The PMF method combines the variations of Org, , and ions to obtain the factor profiles, therefore allowing a more subtle change in the chamber composition to be taken into account. The ratio method in CV-UMR, in contrast, only takes into account fragments that are at 30 and 46 using a constant fragmentation table relationship.
Similarly, the SV-AMS also shows a gradual decrease in mean fpON unlike the ratio method from CV-ACSM (see Fig. 8). This suggests that changing contributions of organics at 30 and 46 may be taken into account by HR peak fitting and not by the UMR fragmentation table, causing a divergence as the chamber aerosol dilutes. Based on the sensitivity analysis in Fig. 7, the signal contribution of ( 46) is the largest source of uncertainty in the CV-ACSM, since the adapted method is sensitive to the change in aOrg[46],[45]. On the other hand, the uncertainty of RoR used to calculate RpON accounts for the largest contribution to the uncertainty calculated for SV-AMS. Since the RoR in Day et al. (2022a) relies on the average value of a broad range of organic nitrate, a chamber experiment that uses a specific precursor is likely to have RpON further away from the average value than, for instance, a complex ambient mixture.
Nevertheless, we are encouraged by the match in responses upon formation of organic nitrate, indicating that the ratio method is similarly sensitive to changing nitrate speciation in both instruments. When considering the propagation of uncertainty, we observe overlaps between the results of CV-ACSM and SV-AMS. Therefore, by considering the uncertainty from aOrg[46],[45] in CV-UMR and uncertainty from RoR in SV-AMS, the results for both instruments are comparable. Further investigation of the detailed response of each instrument to changing aerosol composition would be valuable.
We have shown the separation of particulate ammonium nitrate (pAmN) and particulate organic nitrate (pON) signals from the total particulate nitrate (pNO3) signal measured using a time-of-flight aerosol chemical speciation monitor equipped with a capture vaporizer with unit mass resolution (CV-UMR-ToF-ACSM), using an adapted ratio method with a revised fragmentation table and data pre-treatment. The shift of fragmentation pattern towards smaller ion fragments in the capture vaporizer (CV) compared to the standard vaporizer (SV) affects the signals of NO+ and fragments and interferences by Org fragments used to calculate the ratio in UMR. Therefore, we recommend updating the default fragmentation table from Allan et al. (2004) for entries shown in Table 4 before applying the ratio method, according to the aerosol composition. As noted previously, substantial corrections to the fragmentation table for these terms have been shown to be needed for measurements using the SV under some conditions (Fry et al., 2018).
Table 4Proposed 30 and 46 entries for Org and NO3 in the revised fragmentation table adapted for the ratio method in CV-UMR-ToF-ACSM. The multipliers (aOrg[x],[i]) are applied according to the aerosol composition. The entries that are not included in this table should follow the fragmentation table of Allan et al. (2004) for AMS and adapted without gas-phase corrections (frag_air) for ACSM.
The shift of fragmentation pattern in the CV towards more formation of NO+ fragments and less of fragments changes the magnitude of the ratio for both pure pAmN and pure pON. The ratio in CV is affected by the aerodynamic lens alignment; therefore, we recommend users to align their aerodynamic lens to obtain the correct ratio.
To separate the pAmN and pON signal from total pNO3 and calculate the particulate organic nitrate fraction (fpON), the regular ammonium nitrate calibration should be used to obtain the ratio for pure ammonium nitrate (RpAmN), where a value of 0.01–0.07 is expected. On the other hand, we observed from a chamber experiment that the RpON value approaches zero in the CV. Therefore, we recommend analyzing using three RpON values, to describe the upper limit (RpON calculated using RoR=3.29), geometric mean, and lower limit (RpON=0.0001), which also provides the fpON uncertainty. If possible, we recommend constraining the RoR for more accurate results (e.g., performing a chamber experiment to form pure organic nitrate). Through this study, we hope to inspire more research regarding RpON measurements in CV-based instruments to obtain more precision in analyzing organic nitrate concentrations.
The observed ratio (Robs) tends to have more noise in CV-based measurements compared to SV. Data filtering using the instrument's RpAmN and detection limit has shown that the adapted ratio method in the CV-UMR-ToF-ACSM is able to filter unreliable measurements with a concentration cut-off ranging from 0.6 to 2.0 µg m−3, depending on time averaging. This data pre-treatment filters data points with high fraction uncertainty (above ±0.5) and decreases the average uncertainty by for each N-fold of averaging from 10 min.
With a longer time averaging, the concentration limit and fraction limit improve, which allows more reliable determination of fpON and fpAmN. The method reports absolute uncertainty of particulate organic nitrate <10 % at the total particulate nitrate concentrations of 2 µg m−3 (120 min time averaging) to 10 µg m−3 (10 min time averaging) and organic nitrate fraction of 10 % (120 min time averaging) to 20 % (10 min time averaging). We recommend users to average the time series to 30 or 60 min to retain information about real ambient variation, while improving the reliable nitrate concentration limit. This may also be convenient when comparing to auxiliary data that are typically reported half-hourly or hourly. In the region where pNO3 concentration is <10 µg m−3 and/or fpON<12 %, longer time averaging may be necessary to achieve the absolute uncertainty <10 %. In studies where noise is not a problem (e.g., chamber experiments with high particle concentration), time averaging may be unnecessary. With a similar approach, this method could be used for SV-UMR-ToF-ACSM observations as well, with a fragmentation table suited for SV-based measurements.
The adapted ratio method on rural nitrate episodes can distinguish periods with pAmN or pON as the major component, confirmed by relation to the ammonium and organic aerosol composition, respectively. The adapted ratio method applied to CV-UMR-ToF-ACSM measurements in a chamber experiment is able to replicate the response to precursor injection observed from PMF analysis of the same measurements, as well as a co-located high-resolution time-of-flight aerosol mass spectrometer equipped with standard vaporizer (SV-HR-ToF-AMS). The largest uncertainties in this comparison come from aOrg[46],[45] (CV-UMR-ToF-ACSM) and RoR (SV-HR-ToF-AMS). The adapted ratio method for CV-UMR-ToF-ACSM demonstrated in this study can be used at monitoring sites to monitor regional fpON and improve understanding of particulate nitrate sources and evolution.
| Terms | Name |
| ACSM | aerosol chemical speciation monitor |
| ACTRIS | Aerosol, Clouds and Trace Gases Research Infrastructure |
| AIDA | Aerosol Interaction and Dynamics in the Atmosphere |
| AmN | ammonium nitrate |
| AMS | aerosol mass spectrometer |
| AmS | ammonium sulfate |
| aOrg[x],[i] | multiplier for calculating frag_Org[x] based on the relationship between frag_Org[x] and frag_Org[i] |
| Cν | concentration or signal of species ν |
| detection limit of NO+ | |
| detection limit of | |
| detection limit of pNO3 | |
| signal of NO+ | |
| signal limit of NO+ for reliable organic nitrate and ammonium nitrate separation |
|
| signal of | |
| COA | concentration of total organic aerosol |
| concentration of total PM2.5 | |
| concentration of total particulate ammonium | |
| concentration of total particulate nitrate | |
| CAINA | Cloud-Aerosol Interactions in a Nitrogen- dominated Atmosphere |
| CE | collection efficiency |
| Chl | chloride species in AMS/ACSM |
| cToF | compact time-of-flight |
| CV | capture vaporizer |
| fpAmN | fraction of particulate ammonium nitrate to the total nitrate |
| fpON | fraction of particulate organic nitrate to the total nitrate |
| frag_NO3[x] | total nitrate fragments in nominal x |
| frag_Org[x] | total organic fragments in nominal x |
| HR | high resolution |
| IE | ionization efficiency |
| IMK | Institute for Meteorology and Climate Research |
| IPL | intermediate pressure lens |
| KIT | Karlsruhe Institute of Technology |
| KNMI | Royal Netherlands Meteorological Institute |
| mass-to-charge ratio | |
| n | number of data |
| ratio | -to-NO+ signal ratio |
| obs | observed data (ambient or chamber) |
| OA | organic aerosol |
| ODR | orthogonal distance regression |
| ON | organic nitrate |
| Terms | Name |
| Org | total organic aerosol in AMS/ACSM |
| pAmN | particulate ammonium nitrate |
| PIKA | Peak Integration by Key Analysis |
| PM2.5 | particulate matter with size <2.5 µm |
| PMF | positive matrix factorization |
| pNH4 | particulate ammonium |
| pNO3 | particulate nitrate |
| pON | particulate organic nitrate |
| Q-ACSM | quadrupole ACSM |
| Rν | ratio of ν |
| Robs | ratio of observed data |
| RpAmN | ratio of particulate ammonium nitrate |
| RpON | ratio of particulate organic nitrate |
| r2 | coefficient of determination |
| RIE | relative ionization efficiency |
| RONO2 | alkyl nitrate |
| RoR | ratio of ratios |
| RUG | University of Groningen |
| sf | uncertainty of function f |
| uncertainty of particulate organic nitrate fraction to the total nitrate |
|
| standard error | |
| SI | supplementary information |
| SOA | secondary organic aerosol |
| Squirrel | Sequential Igor Data Retrieval |
| SV | standard vaporizer |
| ToF | time of flight |
| UMR | unit mass resolution |
| UU | Utrecht University |
| VOCs | volatile organic compounds |
| WRF-Chem | Weather Research and Forecasting model coupled with Chemistry |
| xi | measurand or measured value |
| partial derivative of the function f |
The CV-HR-ToF spectra used to build the revised fragmentation table are retrieved from the open-access AMS spectral database (https://cires1.colorado.edu/jimenez-group/AMSsd_CV/, Hu et al., 2018a, b). The CV-UMR-ToF-ACSM data were collected as part of the Ruisdael Observatory network monitoring (https://ruisdael-observatory.nl, Ruisdael Observatory, 2025) and are available upon request. The chamber experiment measurements using SV-HR-ToF-AMS and CV-UMR-ToF-ACSM (ACSM-RUG) were collected as part of the Cloud-Aerosol Interactions in a Nitrogen-dominated Atmosphere (CAINA) project (https://sites.google.com/view/cainaproject/, CAINA Project, 2024) in the Aerosol Interaction and Dynamics in the Atmosphere (AIDA) chamber, managed by the Institute of Meteorology and Climate Research (IMK) at Karlsruhe Institute of Technology (KIT), Germany.
The supplement related to this article is available online at https://doi.org/10.5194/amt-18-3051-2025-supplement.
FRN: conceptualization, investigation, writing, and editing. JLF and DAD: conceptualization, editing, and reviewing. RM, RH, SH, JF, JM, and UD: resources, reviewing, and editing.
The contact author has declared that none of the authors has any competing interests.
Publisher's note: Copernicus Publications remains neutral with regard to jurisdictional claims made in the text, published maps, institutional affiliations, or any other geographical representation in this paper. While Copernicus Publications makes every effort to include appropriate place names, the final responsibility lies with the authors.
The authors acknowledge valuable discussions with and technical help by Anandi Williams, Phil Croteau, Donna Sueper, Weiwei Hu, Yanxia Li, Jean-Eudes Petit, Olivier Favez, Evelyn Freney, Hasna Chebaicheb, and Laurent Meunier.
This work has been accomplished by using data generated in the Ruisdael Observatory as part of continuous monitoring and the Cloud-Aerosol Interactions in a Nitrogen-dominated Atmosphere (CAINA) project. The Ruisdael Observatory is a scientific infrastructure co-financed by the Dutch Research Council (NWO; grant no. 184.034.015). The CAINA project is a research consortium supported by NWO (grant no. OCENW.XL21.XL21.112). Douglas A. Day was supported by NASA grant 80NSSC21K1451 and NSF grant AGS-2131914.
This paper was edited by Anna Novelli and reviewed by four anonymous referees.
Adams, P. J., Seinfeld, J. H., and Koch, D. M.: Global concentrations of tropospheric sulfate, nitrate, and ammonium aerosol simulated in a general circulation model, J. Geophys. Res.-Atmos., 104, 13791–13823, https://doi.org/10.1029/1999JD900083, 1999. a
Allan, J. D., Delia, A. E., Coe, H., Bower, K. N., Alfarra, M., Jimenez, J. L., Middlebrook, A. M., Drewnick, F., Onasch, T. B., Canagaratna, M. R., Jayne, J. T., and Worsnop, D. R.: A generalised method for the extraction of chemically resolved mass spectra from Aerodyne aerosol mass spectrometer data, J. Aerosol Sci., 35, 909–922, https://doi.org/10.1016/j.jaerosci.2004.02.007, 2004. a, b, c, d, e, f, g, h, i
Bahreini, R., Ervens, B., Middlebrook, A. M., Warneke, C., De Gouw, J. A., DeCarlo, P. F., Jimenez, J. L., Brock, C. A., Neuman, J. A., Ryerson, T. B., Stark, H., Atlas, E., Brioude, J., Fried, A., Holloway, J. S., Peischl, J., Richter, D., Walega, J., Weibring, P., Wollny, A. G., and Fehsenfeld, F. C.: Organic aerosol formation in urban and industrial plumes near Houston and Dallas, Texas, J. Geophys. Res.-Atmos., 114, 2008JD011493, https://doi.org/10.1029/2008JD011493, 2009. a
Bauer, S. E., Koch, D., Unger, N., Metzger, S. M., Shindell, D. T., and Streets, D. G.: Nitrate aerosols today and in 2030: a global simulation including aerosols and tropospheric ozone, Atmos. Chem. Phys., 7, 5043–5059, https://doi.org/10.5194/acp-7-5043-2007, 2007. a
Bian, H., Chin, M., Hauglustaine, D. A., Schulz, M., Myhre, G., Bauer, S. E., Lund, M. T., Karydis, V. A., Kucsera, T. L., Pan, X., Pozzer, A., Skeie, R. B., Steenrod, S. D., Sudo, K., Tsigaridis, K., Tsimpidi, A. P., and Tsyro, S. G.: Investigation of global particulate nitrate from the AeroCom phase III experiment, Atmos. Chem. Phys., 17, 12911–12940, https://doi.org/10.5194/acp-17-12911-2017, 2017. a
Bobbink, R. and Hicks, W. K.: Factors Affecting Nitrogen Deposition Impacts on Biodiversity: An Overview, in: Nitrogen Deposition, Critical Loads and Biodiversity, edited by: Sutton, M. A., Mason, K. E., Sheppard, L. J., Sverdrup, H., Haeuber, R., and Hicks, W. K., Springer Netherlands, Dordrecht, 127–138, https://doi.org/10.1007/978-94-007-7939-6_14, 2014. a
Brownwood, B., Turdziladze, A., Hohaus, T., Wu, R., Mentel, T. F., Carlsson, P. T. M., Tsiligiannis, E., Hallquist, M., Andres, S., Hantschke, L., Reimer, D., Rohrer, F., Tillmann, R., Winter, B., Liebmann, J., Brown, S. S., Kiendler-Scharr, A., Novelli, A., Fuchs, H., and Fry, J. L.: Gas-Particle Partitioning and SOA Yields of Organonitrate Products from NO3-Initiated Oxidation of Isoprene under Varied Chemical Regimes, ACS Earth and Space Chemistry, 5, 785–800, https://doi.org/10.1021/acsearthspacechem.0c00311, 2021. a
CAINA Project: CAINA – Cloud-Aerosol Interactions in a Nitrogen-dominated Atmosphere, https://sites.google.com/view/cainaproject/, last access: 6 November 2024 a
Canagaratna, M., Jayne, J., Jimenez, J., Allan, J., Alfarra, M., Zhang, Q., Onasch, T., Drewnick, F., Coe, H., Middlebrook, A., Delia, A., Williams, L., Trimborn, A., Northway, M., DeCarlo, P., Kolb, C., Davidovits, P., and Worsnop, D.: Chemical and microphysical characterization of ambient aerosols with the aerodyne aerosol mass spectrometer, Mass Spectrom. Rev., 26, 185–222, https://doi.org/10.1002/mas.20115, 2007. a
Carlton, A. G., De Gouw, J., Jimenez, J. L., Ambrose, J. L., Attwood, A. R., Brown, S., Baker, K. R., Brock, C., Cohen, R. C., Edgerton, S., Farkas, C. M., Farmer, D., Goldstein, A. H., Gratz, L., Guenther, A., Hunt, S., Jaeglé, L., Jaffe, D. A., Mak, J., McClure, C., Nenes, A., Nguyen, T. K., Pierce, J. R., De Sa, S., Selin, N. E., Shah, V., Shaw, S., Shepson, P. B., Song, S., Stutz, J., Surratt, J. D., Turpin, B. J., Warneke, C., Washenfelder, R. A., Wennberg, P. O., and Zhou, X.: Synthesis of the Southeast Atmosphere Studies: Investigating Fundamental Atmospheric Chemistry Questions, B. Am. Meteorol. Soc., 99, 547–567, https://doi.org/10.1175/BAMS-D-16-0048.1, 2018. a
Day, D. A., Wooldridge, P. J., Dillon, M. B., Thornton, J. A., and Cohen, R. C.: A thermal dissociation laser-induced fluorescence instrument for in situ detection of NO2, peroxy nitrates, alkyl nitrates, and HNO3, J. Geophys. Res.-Atmos., 107, ACH4-1–ACH4-14, https://doi.org/10.1029/2001JD000779, 2002. a
Day, D. A., Campuzano-Jost, P., Nault, B. A., Palm, B. B., Hu, W., Guo, H., Wooldridge, P. J., Cohen, R. C., Docherty, K. S., Huffman, J. A., de Sá, S. S., Martin, S. T., and Jimenez, J. L.: A systematic re-evaluation of methods for quantification of bulk particle-phase organic nitrates using real-time aerosol mass spectrometry, Atmos. Meas. Tech., 15, 459–483, https://doi.org/10.5194/amt-15-459-2022, 2022a. a, b, c, d, e, f, g
Day, D. A., Fry, J. L., Kang, H. G., Krechmer, J. E., Ayres, B. R., Keehan, N. I., Thompson, S. L., Hu, W., Campuzano-Jost, P., Schroder, J. C., Stark, H., DeVault, M. P., Ziemann, P. J., Zarzana, K. J., Wild, R. J., Dubè, W. P., Brown, S. S., and Jimenez, J. L.: Secondary Organic Aerosol Mass Yields from NO3 Oxidation of α-Pinene and Δ-Carene: Effect of RO2 Radical Fate, J. Phys. Chem. A, 126, 7309–7330, https://doi.org/10.1021/acs.jpca.2c04419, 2022b. a
Day, D. A., Nault, B. A., Campuzano-Jost, P., and Jimenez, J. L.: Evaluation of Uncertainties and Introduction of Tools for Quantification of Bulk Particle-phase Organic Nitrates Using Real-time Aerosol Mass Spectrometry, Portland, Oregon, US, 2–6 October 2024, https://aaarabstracts.com/2023/view_abstract.php?pid=88 (last access: 9 July 2025), 2023. a
DeCarlo, P. F., Kimmel, J. R., Trimborn, A., Northway, M. J., Jayne, J. T., Aiken, A. C., Gonin, M., Fuhrer, K., Horvath, T., Docherty, K. S., Worsnop, D. R., and Jimenez, J. L.: Field-Deployable, High-Resolution, Time-of-Flight Aerosol Mass Spectrometer, Anal. Chem., 78, 8281–8289, https://doi.org/10.1021/ac061249n, 2006. a, b, c
Drewnick, F., Hings, S. S., DeCarlo, P., Jayne, J. T., Gonin, M., Fuhrer, K., Weimer, S., Jimenez, J. L., Demerjian, K. L., Borrmann, S., and Worsnop, D. R.: A New Time-of-Flight Aerosol Mass Spectrometer (TOF-AMS)–Instrument Description and First Field Deployment, Aerosol Sci. Tech., 39, 637–658, https://doi.org/10.1080/02786820500182040, 2005. a, b, c
Drewnick, F., Hings, S. S., Alfarra, M. R., Prevot, A. S. H., and Borrmann, S.: Aerosol quantification with the Aerodyne Aerosol Mass Spectrometer: detection limits and ionizer background effects, Atmos. Meas. Tech., 2, 33–46, https://doi.org/10.5194/amt-2-33-2009, 2009. a
Drewnick, F., Diesch, J.-M., Faber, P., and Borrmann, S.: Aerosol mass spectrometry: particle–vaporizer interactions and their consequences for the measurements, Atmos. Meas. Tech., 8, 3811–3830, https://doi.org/10.5194/amt-8-3811-2015, 2015. a
Drugé, T., Nabat, P., Mallet, M., and Somot, S.: Model simulation of ammonium and nitrate aerosols distribution in the Euro-Mediterranean region and their radiative and climatic effects over 1979–2016, Atmos. Chem. Phys., 19, 3707–3731, https://doi.org/10.5194/acp-19-3707-2019, 2019. a
Erisman, J. W., Dammers, E., Damme, V., and Soudzilovskaia, N.: Trends in EU nitrogen deposition and impacts on ecosystems, EM, Air and Waste Management Association's Magazine for Environmental Managers, 31–35 pp., https://www.louisbolk.nl/sites/default/files/publication/pdf/3070.pdf (last access: 10 July 2025), 2015. a
Farmer, D. K., Matsunaga, A., Docherty, K. S., Surratt, J. D., Seinfeld, J. H., Ziemann, P. J., and Jimenez, J. L.: Response of an aerosol mass spectrometer to organonitrates and organosulfates and implications for atmospheric chemistry, P. Natl. Acad. Sci. USA, 107, 6670–6675, https://doi.org/10.1073/pnas.0912340107, 2010. a, b, c
Feng, Y. and Penner, J. E.: Global modeling of nitrate and ammonium: Interaction of aerosols and tropospheric chemistry, J. Geophys. Res.-Atmos., 112, 2005JD006404, https://doi.org/10.1029/2005JD006404, 2007. a
Fields, S.: Global Nitrogen: Cycling out of Control, Environ. Health Persp., 112, A556–A563, https://doi.org/10.1289/ehp.112-a556, 2004. a
Fisher, J. A., Jacob, D. J., Travis, K. R., Kim, P. S., Marais, E. A., Chan Miller, C., Yu, K., Zhu, L., Yantosca, R. M., Sulprizio, M. P., Mao, J., Wennberg, P. O., Crounse, J. D., Teng, A. P., Nguyen, T. B., St. Clair, J. M., Cohen, R. C., Romer, P., Nault, B. A., Wooldridge, P. J., Jimenez, J. L., Campuzano-Jost, P., Day, D. A., Hu, W., Shepson, P. B., Xiong, F., Blake, D. R., Goldstein, A. H., Misztal, P. K., Hanisco, T. F., Wolfe, G. M., Ryerson, T. B., Wisthaler, A., and Mikoviny, T.: Organic nitrate chemistry and its implications for nitrogen budgets in an isoprene- and monoterpene-rich atmosphere: constraints from aircraft (SEAC4RS) and ground-based (SOAS) observations in the Southeast US, Atmos. Chem. Phys., 16, 5969–5991, https://doi.org/10.5194/acp-16-5969-2016, 2016. a
Francisco, M. A. and Krylowski, J.: Chemistry of Organic Nitrates: Thermal Chemistry of Linear and Branched Organic Nitrates, Ind. Eng. Chem. Res., 44, 5439–5446, https://doi.org/10.1021/ie049380d, 2005. a
Fröhlich, R., Cubison, M. J., Slowik, J. G., Bukowiecki, N., Prévôt, A. S. H., Baltensperger, U., Schneider, J., Kimmel, J. R., Gonin, M., Rohner, U., Worsnop, D. R., and Jayne, J. T.: The ToF-ACSM: a portable aerosol chemical speciation monitor with TOFMS detection, Atmos. Meas. Tech., 6, 3225–3241, https://doi.org/10.5194/amt-6-3225-2013, 2013. a, b, c
Fry, J. L., Draper, D. C., Zarzana, K. J., Campuzano-Jost, P., Day, D. A., Jimenez, J. L., Brown, S. S., Cohen, R. C., Kaser, L., Hansel, A., Cappellin, L., Karl, T., Hodzic Roux, A., Turnipseed, A., Cantrell, C., Lefer, B. L., and Grossberg, N.: Observations of gas- and aerosol-phase organic nitrates at BEACHON-RoMBAS 2011, Atmos. Chem. Phys., 13, 8585–8605, https://doi.org/10.5194/acp-13-8585-2013, 2013. a
Fry, J. L., Brown, S. S., Middlebrook, A. M., Edwards, P. M., Campuzano-Jost, P., Day, D. A., Jimenez, J. L., Allen, H. M., Ryerson, T. B., Pollack, I., Graus, M., Warneke, C., de Gouw, J. A., Brock, C. A., Gilman, J., Lerner, B. M., Dubé, W. P., Liao, J., and Welti, A.: Secondary organic aerosol (SOA) yields from NO3 radical + isoprene based on nighttime aircraft power plant plume transects, Atmos. Chem. Phys., 18, 11663–11682, https://doi.org/10.5194/acp-18-11663-2018, 2018. a, b, c, d
Gao, L., Song, J., Mohr, C., Huang, W., Vallon, M., Jiang, F., Leisner, T., and Saathoff, H.: Kinetics, SOA yields, and chemical composition of secondary organic aerosol from β-caryophyllene ozonolysis with and without nitrogen oxides between 213 and 313 K, Atmos. Chem. Phys., 22, 6001–6020, https://doi.org/10.5194/acp-22-6001-2022, 2022. a
Hu, W., Handschy, A., and Jimenez, J. L.: AMS Capture Vaporizer Spectral Database, http://cires1.colorado.edu/jimenez-group/AMSsd_CV/, last access: 9 July 2025. a
Hu, W., Hu, M., Hu, W., Jimenez, J. L., Yuan, B., Chen, W., Wang, M., Wu, Y., Chen, C., Wang, Z., Peng, J., Zeng, L., and Shao, M.: Chemical composition, sources, and aging process of submicron aerosols in Beijing: Contrast between summer and winter, J. Geophys. Res.-Atmos., 121, 1955–1977, https://doi.org/10.1002/2015JD024020, 2016. a
Hu, W., Campuzano-Jost, P., Day, D. A., Croteau, P., Canagaratna, M. R., Jayne, J. T., Worsnop, D. R., and Jimenez, J. L.: Evaluation of the new capture vaporizer for aerosol mass spectrometers (AMS) through field studies of inorganic species, Aerosol Sci. Tech., 51, 735–754, https://doi.org/10.1080/02786826.2017.1296104, 2017a. a, b, c, d, e, f, g, h, i, j, k, l, m, n
Hu, W., Campuzano-Jost, P., Day, D. A., Croteau, P., Canagaratna, M. R., Jayne, J. T., Worsnop, D. R., and Jimenez, J. L.: Evaluation of the new capture vapourizer for aerosol mass spectrometers (AMS) through laboratory studies of inorganic species, Atmos. Meas. Tech., 10, 2897–2921, https://doi.org/10.5194/amt-10-2897-2017, 2017b. a
Hu, W., Day, D. A., Campuzano-Jost, P., Nault, B. A., Park, T., Lee, T., Croteau, P., Canagaratna, M. R., Jayne, J. T., Worsnop, D. R., and Jimenez, J. L.: Evaluation of the new capture vaporizer for aerosol mass spectrometers: Characterization of organic aerosol mass spectra, Aerosol Sci. Tech., 52, 725–739, https://doi.org/10.1080/02786826.2018.1454584, 2018a (data available at: https://cires1.colorado.edu/jimenez-group/AMSsd_CV/, last access: 6 November 2024). a, b, c, d
Hu, W., Day, D. A., Campuzano-Jost, P., Nault, B. A., Park, T., Lee, T., Croteau, P., Canagaratna, M. R., Jayne, J. T., Worsnop, D. R., and Jimenez, J. L.: Evaluation of the New Capture Vaporizer for Aerosol Mass Spectrometers (AMS): Elemental Composition and Source Apportionment of Organic Aerosols (OA), ACS Earth and Space Chemistry [data set], 2, 410–421, https://doi.org/10.1021/acsearthspacechem.8b00002, 2018b. a, b, c
Huang, W., Saathoff, H., Shen, X., Ramisetty, R., Leisner, T., and Mohr, C.: Chemical Characterization of Highly Functionalized Organonitrates Contributing to Night-Time Organic Aerosol Mass Loadings and Particle Growth, Environ. Sci. Technol., 53, 1165–1174, https://doi.org/10.1021/acs.est.8b05826, 2019a. a, b, c
Huang, W., Saathoff, H., Shen, X., Ramisetty, R., Leisner, T., and Mohr, C.: Seasonal characteristics of organic aerosol chemical composition and volatility in Stuttgart, Germany, Atmos. Chem. Phys., 19, 11687–11700, https://doi.org/10.5194/acp-19-11687-2019, 2019b. a, b
Jayne, J. T. and Worsnop, D. R.: Particle Capture Device, https://patents.justia.com/patent/9267869 (last access: 9 July 2025), 2016. a, b
Jickells, T., Baker, A. R., Cape, J. N., Cornell, S. E., and Nemitz, E.: The cycling of organic nitrogen through the atmosphere, Philos. T. Roy. Soc. B, 368, 20130115, https://doi.org/10.1098/rstb.2013.0115, 2013. a
Kiendler-Scharr, A., Mensah, A. A., Friese, E., Topping, D., Nemitz, E., Prevot, A. S. H., Äijälä, M., Allan, J., Canonaco, F., Canagaratna, M., Carbone, S., Crippa, M., Dall Osto, M., Day, D. A., De Carlo, P., Di Marco, C. F., Elbern, H., Eriksson, A., Freney, E., Hao, L., Herrmann, H., Hildebrandt, L., Hillamo, R., Jimenez, J. L., Laaksonen, A., McFiggans, G., Mohr, C., O'Dowd, C., Otjes, R., Ovadnevaite, J., Pandis, S. N., Poulain, L., Schlag, P., Sellegri, K., Swietlicki, E., Tiitta, P., Vermeulen, A., Wahner, A., Worsnop, D., and Wu, H.: Ubiquity of organic nitrates from nighttime chemistry in the European submicron aerosol, Geophys. Res. Lett., 43, 7735–7744, https://doi.org/10.1002/2016GL069239, 2016. a, b, c
Lee, B. H., Mohr, C., Lopez-Hilfiker, F. D., Lutz, A., Hallquist, M., Lee, L., Romer, P., Cohen, R. C., Iyer, S., Kurtén, T., Hu, W., Day, D. A., Campuzano-Jost, P., Jimenez, J. L., Xu, L., Ng, N. L., Guo, H., Weber, R. J., Wild, R. J., Brown, S. S., Koss, A., de Gouw, J., Olson, K., Goldstein, A. H., Seco, R., Kim, S., McAvey, K., Shepson, P. B., Starn, T., Baumann, K., Edgerton, E. S., Liu, J., Shilling, J. E., Miller, D. O., Brune, W., Schobesberger, S., D'Ambro, E. L., and Thornton, J. A.: Highly functionalized organic nitrates in the southeast United States: Contribution to secondary organic aerosol and reactive nitrogen budgets, P. Natl. Acad. Sci. USA, 113, 1516–1521, https://doi.org/10.1073/pnas.1508108113, 2016. a
Liao, H., Adams, P. J., Chung, S. H., Seinfeld, J. H., Mickley, L. J., and Jacob, D. J.: Interactions between tropospheric chemistry and aerosols in a unified general circulation model, J. Geophys. Res.-Atmos., 108, AAC1-1–AAC1-23, https://doi.org/10.1029/2001JD001260, 2003. a
Liu, X., Alves Gouveia, D., Henzing, B., Apituley, A., Hensen, A., van Dinther, D., Huang, R., and Dusek, U.: Aerosol optical properties within the atmospheric boundary layer predicted from ground-based observations compared to Raman lidar retrievals during RITA-2021, Atmos. Chem. Phys., 24, 9597–9614, https://doi.org/10.5194/acp-24-9597-2024, 2024. a
Lu, Z., Liu, X., Zaveri, R. A., Easter, R. C., Tilmes, S., Emmons, L. K., Vitt, F., Singh, B., Wang, H., Zhang, R., and Rasch, P. J.: Radiative Forcing of Nitrate Aerosols From 1975 to 2010 as Simulated by MOSAIC Module in CESM2-MAM4, J. Geophys. Res.-Atmos., 126, e2021JD034809, https://doi.org/10.1029/2021JD034809, 2021. a
Melillo, J. M.: Disruption of the global nitrogen cycle: A grand challenge for the twenty-first century, Ambio, 50, 759–763, https://doi.org/10.1007/s13280-020-01429-2, 2021. a
Metzger, S.: Gas/aerosol partitioning 2. Global modeling results, J. Geophys. Res., 107, 4313, https://doi.org/10.1029/2001JD001103, 2002. a
Middlebrook, A. M., Bahreini, R., Jimenez, J. L., and Canagaratna, M. R.: Evaluation of Composition-Dependent Collection Efficiencies for the Aerodyne Aerosol Mass Spectrometer using Field Data, Aerosol Sci. Tech., 46, 258–271, https://doi.org/10.1080/02786826.2011.620041, 2012. a
Mohr, C., DeCarlo, P. F., Heringa, M. F., Chirico, R., Slowik, J. G., Richter, R., Reche, C., Alastuey, A., Querol, X., Seco, R., Peñuelas, J., Jiménez, J. L., Crippa, M., Zimmermann, R., Baltensperger, U., and Prévôt, A. S. H.: Identification and quantification of organic aerosol from cooking and other sources in Barcelona using aerosol mass spectrometer data, Atmos. Chem. Phys., 12, 1649–1665, https://doi.org/10.5194/acp-12-1649-2012, 2012. a
Ng, N. L., Herndon, S. C., Trimborn, A., Canagaratna, M. R., Croteau, P. L., Onasch, T. B., Sueper, D., Worsnop, D. R., Zhang, Q., Sun, Y. L., and Jayne, J. T.: An Aerosol Chemical Speciation Monitor (ACSM) for Routine Monitoring of the Composition and Mass Concentrations of Ambient Aerosol, Aerosol Sci. Tech., 45, 780–794, https://doi.org/10.1080/02786826.2011.560211, 2011. a, b
Ng, N. L., Brown, S. S., Archibald, A. T., Atlas, E., Cohen, R. C., Crowley, J. N., Day, D. A., Donahue, N. M., Fry, J. L., Fuchs, H., Griffin, R. J., Guzman, M. I., Herrmann, H., Hodzic, A., Iinuma, Y., Jimenez, J. L., Kiendler-Scharr, A., Lee, B. H., Luecken, D. J., Mao, J., McLaren, R., Mutzel, A., Osthoff, H. D., Ouyang, B., Picquet-Varrault, B., Platt, U., Pye, H. O. T., Rudich, Y., Schwantes, R. H., Shiraiwa, M., Stutz, J., Thornton, J. A., Tilgner, A., Williams, B. J., and Zaveri, R. A.: Nitrate radicals and biogenic volatile organic compounds: oxidation, mechanisms, and organic aerosol, Atmos. Chem. Phys., 17, 2103–2162, https://doi.org/10.5194/acp-17-2103-2017, 2017. a, b, c
Pandolfi, M., Querol, X., Alastuey, A., Jimenez, J. L., Jorba, O., Day, D., Ortega, A., Cubison, M. J., Comerón, A., Sicard, M., Mohr, C., Prévôt, A. S. H., Minguillón, M. C., Pey, J., Baldasano, J. M., Burkhart, J. F., Seco, R., Peñuelas, J., Van Drooge, B. L., Artiñano, B., Di Marco, C., Nemitz, E., Schallhart, S., Metzger, A., Hansel, A., Lorente, J., Ng, S., Jayne, J., and Szidat, S.: Effects of sources and meteorology on particulate matter in the Western Mediterranean Basin: An overview of the DAURE campaign, J. Geophys. Res.-Atmos., 119, 4978–5010, https://doi.org/10.1002/2013JD021079, 2014. a
Paulot, F., Ginoux, P., Cooke, W. F., Donner, L. J., Fan, S., Lin, M.-Y., Mao, J., Naik, V., and Horowitz, L. W.: Sensitivity of nitrate aerosols to ammonia emissions and to nitrate chemistry: implications for present and future nitrate optical depth, Atmos. Chem. Phys., 16, 1459–1477, https://doi.org/10.5194/acp-16-1459-2016, 2016. a
Pye, H. O. T., Luecken, D. J., Xu, L., Boyd, C. M., Ng, N. L., Baker, K. R., Ayres, B. R., Bash, J. O., Baumann, K., Carter, W. P. L., Edgerton, E., Fry, J. L., Hutzell, W. T., Schwede, D. B., and Shepson, P. B.: Modeling the Current and Future Roles of Particulate Organic Nitrates in the Southeastern United States, Environ. Sci. Technol., 49, 14195–14203, https://doi.org/10.1021/acs.est.5b03738, 2015. a, b
Rodriguez, M. A. and Dabdub, D.: IMAGES-SCAPE2: A modeling study of size- and chemically resolved aerosol thermodynamics in a global chemical transport model, J. Geophys. Res.-Atmos., 109, 2003JD003639, https://doi.org/10.1029/2003JD003639, 2004. a
Romer Present, P. S., Zare, A., and Cohen, R. C.: The changing role of organic nitrates in the removal and transport of NOx, Atmos. Chem. Phys., 20, 267–279, https://doi.org/10.5194/acp-20-267-2020, 2020. a
Ruisdael Observatory: Welcome to the Ruisdael Observatory, the facility to understand the future of our atmosphere, https://ruisdael-observatory.nl (last access: 6 November 2024), 2025. a
Schlag, P., Kiendler-Scharr, A., Blom, M. J., Canonaco, F., Henzing, J. S., Moerman, M., Prévôt, A. S. H., and Holzinger, R.: Aerosol source apportionment from 1 year measurements at the CESAR tower in Cabauw, the Netherlands, Atmos. Chem. Phys., 16, 8831–8847, https://doi.org/10.5194/acp-16-8831-2016, 2016. a
Song, J., Saathoff, H., Gao, L., Gebhardt, R., Jiang, F., Vallon, M., Bauer, J., Norra, S., and Leisner, T.: Variations of PM2.5 sources in the context of meteorology and seasonality at an urban street canyon in Southwest Germany, Atmos. Environ., 282, 119147, https://doi.org/10.1016/j.atmosenv.2022.119147, 2022. a
Song, J., Saathoff, H., Jiang, F., Gao, L., Zhang, H., and Leisner, T.: Sources of organic gases and aerosol particles and their roles in nighttime particle growth at a rural forested site in southwest Germany, Atmos. Chem. Phys., 24, 6699–6717, https://doi.org/10.5194/acp-24-6699-2024, 2024. a
Takeuchi, M. and Ng, N. L.: Chemical composition and hydrolysis of organic nitrate aerosol formed from hydroxyl and nitrate radical oxidation of α-pinene and β-pinene, Atmos. Chem. Phys., 19, 12749–12766, https://doi.org/10.5194/acp-19-12749-2019, 2019. a
Takeuchi, M., Wang, Y., Nault, B. A., Chen, Y., Canagaratna, M. R., and Ng, N. L.: Evaluating the response of the Aerodyne aerosol mass spectrometer to monoterpene- and isoprene-derived organic nitrate standards, Aerosol Sci. Tech., 58, 1371–1388, https://doi.org/10.1080/02786826.2024.2389183, 2024. a
Ulbrich, I. M., Canagaratna, M. R., Zhang, Q., Worsnop, D. R., and Jimenez, J. L.: Interpretation of organic components from Positive Matrix Factorization of aerosol mass spectrometric data, Atmos. Chem. Phys., 9, 2891–2918, https://doi.org/10.5194/acp-9-2891-2009, 2009. a
Vasilakos, P., Russell, A., Weber, R., and Nenes, A.: Understanding nitrate formation in a world with less sulfate, Atmos. Chem. Phys., 18, 12765–12775, https://doi.org/10.5194/acp-18-12765-2018, 2018. a
Williams, L. R., Gonzalez, L. A., Peck, J., Trimborn, D., McInnis, J., Farrar, M. R., Moore, K. D., Jayne, J. T., Robinson, W. A., Lewis, D. K., Onasch, T. B., Canagaratna, M. R., Trimborn, A., Timko, M. T., Magoon, G., Deng, R., Tang, D., de la Rosa Blanco, E., Prévôt, A. S. H., Smith, K. A., and Worsnop, D. R.: Characterization of an aerodynamic lens for transmitting particles greater than 1 micrometer in diameter into the Aerodyne aerosol mass spectrometer, Atmos. Meas. Tech., 6, 3271–3280, https://doi.org/10.5194/amt-6-3271-2013, 2013. a
Xu, W., Croteau, P., Williams, L., Canagaratna, M., Onasch, T., Cross, E., Zhang, X., Robinson, W., Worsnop, D., and Jayne, J.: Laboratory characterization of an aerosol chemical speciation monitor with PM2.5 measurement capability, Aerosol Sci. Tech., 51, 69–83, https://doi.org/10.1080/02786826.2016.1241859, 2017. a, b, c
Xu, W., Takeuchi, M., Chen, C., Qiu, Y., Xie, C., Xu, W., Ma, N., Worsnop, D. R., Ng, N. L., and Sun, Y.: Estimation of particulate organic nitrates from thermodenuder–aerosol mass spectrometer measurements in the North China Plain, Atmos. Meas. Tech., 14, 3693–3705, https://doi.org/10.5194/amt-14-3693-2021, 2021. a
Yu, X., Li, Q., Liao, K., Li, Y., Wang, X., Zhou, Y., Liang, Y., and Yu, J. Z.: New measurements reveal a large contribution of nitrogenous molecules to ambient organic aerosol, npj Clim. Atmos. Sci., 7, 72, https://doi.org/10.1038/s41612-024-00620-6, 2024. a, b, c
Zare, A., Romer, P. S., Nguyen, T., Keutsch, F. N., Skog, K., and Cohen, R. C.: A comprehensive organic nitrate chemistry: insights into the lifetime of atmospheric organic nitrates, Atmos. Chem. Phys., 18, 15419–15436, https://doi.org/10.5194/acp-18-15419-2018, 2018. a, b, c
Zheng, Y., Cheng, X., Liao, K., Li, Y., Li, Y. J., Huang, R.-J., Hu, W., Liu, Y., Zhu, T., Chen, S., Zeng, L., Worsnop, D. R., and Chen, Q.: Characterization of anthropogenic organic aerosols by TOF-ACSM with the new capture vaporizer, Atmos. Meas. Tech., 13, 2457–2472, https://doi.org/10.5194/amt-13-2457-2020, 2020. a, b, c
- Abstract
- Introduction
- Instrumentation
- Development of a fragmentation table for CV-UMR-ToF-ACSM from the AMS spectral database and ACSM chamber experiment spectra
- Determination of ratios for the CV-UMR-ToF-ACSM
- Development of the ratio method for CV-UMR-ToF-ACSM
- Case studies demonstrating the ratio method for CV-ToF-ACSM
- Conclusions and recommendations
- Appendix A: List of terms and abbreviations
- Data availability
- Author contributions
- Competing interests
- Disclaimer
- Acknowledgements
- Financial support
- Review statement
- References
- Supplement