the Creative Commons Attribution 4.0 License.
the Creative Commons Attribution 4.0 License.
 | 16 Jul 2025
Adaptation of RainGaugeQC algorithms for quality control of rain gauge data from professional and non-professional measurement networks
Katarzyna Ośródka
Anna Jurczyk
Agnieszka Kurcz
Rain gauge measurements are one of the primary techniques used to estimate a precipitation field, but they require careful quality control. This paper describes a modified RainGaugeQC system, which is applied to real-time quality control of rain gauge measurements made every 10 min. This system works operationally at the national meteorological and hydrological service in Poland. The RainGaugeQC algorithms, which have been significantly modified, are described in detail. The modifications were made primarily to control data from non-professional measurement networks, which may be of lower quality than professional data, especially in the case of personal stations. Accordingly, the modifications went in the direction of performing more sophisticated data control, applying weather radar data, and taking into account various aspects of data quality, such as consistency analysis of data time series and bias detection. The effectiveness of the modified system was verified based on independent measurement data from manual rain gauges, which are considered one of the most accurate measurement instruments, although they mostly provide daily totals. In addition, an analysis of two case studies is presented. This highlights various issues involved in using non-professional data to generate multi-source estimates of the precipitation field.
- Article
(6034 KB) - Full-text XML
- Companion paper
- BibTeX
- EndNote


1.1 Precipitation measurements
Precipitation is one of the most important meteorological parameters – due to its great practical importance in water management, flood control, and other issues (e.g. Loritz et al., 2021; Sokol et al., 2021). For this reason, conducting measurements and estimating the precipitation field are very important tasks, though they are also very challenging because of the very high temporal and spatial variability of precipitation and its intermittent nature. The shorter the accumulation time of measurements, the greater the spatial variability of an estimated precipitation field and the greater its uncertainty (Berndt and Haberlandt, 2018; Bárdossy et al., 2021). This is especially true when estimating sub-daily totals and even more the case for sub-hourly precipitation totals.
Currently, the basic measurements of precipitation are in situ measurements carried out by means of rain gauge networks, and this has not changed despite the intensive development of remote sensing techniques, such as radar and satellite, from which measurements are distorted. From a hydrological perspective, rain gauge measurements are considered the most accurate, although they are limited to specific, rather sparsely distributed points. Consequently, when estimating the precipitation field, measurement data provided by different techniques are treated as independent estimates of the same physical quantity. Thus, the final estimate of a precipitation field, which is often referred to as the quantitative precipitation estimation (QPE), is determined using various methods of combining data from different sources (multi-source estimation), taking into account the strengths and weaknesses of each of these techniques (McKee and Binns, 2016; Jurczyk et al., 2020b).
Since all measurement techniques are subject to significant errors, which have a different temporal and spatial structure, all rainfall measurements need advanced quality control (QC) (Szturc et al., 2022). This applies not only to weather radar measurements (Lanza and Vuerich, 2009; Ośródka et al., 2014; Ośródka and Szturc, 2022; Sokol et al., 2021), but also to rain gauge measurements. The latter are considered accurate at their locations; however, field experiments (Wood et al., 2000) and experiences with dual-sensor rain gauges (Ośródka et al., 2022) show that trust in rain gauges is often excessive – errors in their measurements can sometimes be very significant.
Quality control of rain gauge data is carried out using various approaches, most commonly by analysing the spatial and temporal distribution of measurements. As such information is insufficient for effective QC, especially in the case of sparse measurement networks, external data from other measurement techniques, most often weather radar and satellite, are used (Ośródka et al., 2022; Yan et al., 2024). Increasingly, deep learning techniques are also being applied for QC (Sha et al., 2021). It should be noted that QC applied to short rainfall totals, such as the 10 min employed in this work, is considerably more difficult than for longer totals, such as 1 h (Villalobos-Herrera et al., 2022).
Due to the particular importance of rain gauge measurements, especially for the adjustment (calibration) of radar and satellite measurements, it is crucial when estimating the precipitation field that rain gauge networks are as dense as possible (Hohmann et al., 2021). This implies a very high financial as well as technical and organizational effort so that a great deal of work is currently being done to deliver rain gauge data from other networks, not only from the national meteorological and hydrological services (NMHSs). A separate issue is the employment of “opportunistic” measurement techniques, i.e. precipitation data acquired from devices not dedicated to rainfall measurement, by analysing the attenuation of signals in commercial microwave links used in mobile phone networks, for example; see e.g. Chwala and Kunstmann (2019), Polz et al. (2020), Graf et al. (2021), and Pasierb et al. (2024).
1.2 Non-professional rain gauge networks
Apart from the rain gauge networks of the NMHSs, measurement networks set up and maintained by various institutions – usually state or local authorities taking measurements for their own purposes – can also be a source of rain gauge data. Another possibility is collecting meteorological measurements carried out by individual people with generally low-cost measuring stations, for whom taking measurements, analysing them, and comparing with data generated by meteorological services are hobby activities (Muller et al., 2015; Krennert et al., 2018; Zheng et al., 2018). These are so-called personal or citizen weather stations (PWSs or CWSs).
For the purposes of this paper, all measurements carried out by institutions other than NMHSs are considered “non-professional” because they do not guarantee compliance with the standards set by the World Meteorological Organization (WMO) (WMO-No. 488, 2015) to the same extent as NMHS measurements. A distinction between professional and non-professional rain gauges has been proposed by, among others, Garcia-Marti et al. (2023). In addition, the aforementioned personal stations set up by individual hobbyists need to be distinguished, as direct control of the location, technical conditions, or maintenance of such stations is impossible in practice. Such stations should be treated with less trust, and the uncertainty of the data is due to a number of reasons, which have been described in detail in the literature (e.g. Bell et al., 2015; Båserud et al., 2020; Hahn et al., 2022; Urban et al., 2024). Nevertheless, many studies show that such data can be a valuable source of precipitation information (de Vos et al., 2017, 2019; Horita et al., 2018; Nipen et al., 2020; Bárdossy et al., 2021) thanks to the relatively large number of these stations, especially in urban areas, bearing in mind that professional gauges are typically located outside city centres (Overeem et al., 2024).
The incorporation of non-professional data is associated with some overall increase in uncertainty in precipitation data. Consequently, QC algorithms for these data should include not only the filtering out of clearly erroneous measurements and a decrease in their quality metric in the form of e.g. a quality index (QI), but for less supervised networks it is also necessary to correct at least the systematic errors associated with the bias of these measurements.
1.3 Overview of approaches to QC of rain gauge data
The specificity of data from non-professional rain gauges is primarily due to the greater uncertainty of their measurements. This entails the development of more sophisticated, but also more restrictive quality control algorithms. These are generally extensions of the QC methods applied to data from NMHSs, but here they analyse the reliability of individual measurements in more depth. These methods most often rely on verification with professional rain gauges but also use other measurement data, especially weather radar data.
Spatial distribution of precipitation measurements. This includes the detection of inconsistencies with surroundings. The most common quality control techniques involve checking whether deviations from the reference measurements, which can also be data from nearby rain gauges, are within preset threshold values. If a measurement exceeds the threshold, then it is treated as an outlier and either its quality index QI (or quality flag) is decreased or the measurement is rejected (de Vos et al., 2017; Båserud et al., 2020). In addition, precipitation data from other sources, primarily weather radar, can be used to quantify the uncertainty of outlying measurement data (Ośródka and Szturc, 2022). Spatial consistency tests are very difficult to perform for a sparse rain gauge network, so the QC in terms of spatial consistency may not be carried out, and in the case of personal rain gauges, such data may simply be rejected (Nipen et al., 2020). Alerskans et al. (2022) used a cost function based on a contingency table, which optimizes the parameters of the spatial QC algorithm used to detect as many actually erroneous data as possible, while minimizing the number of correct data that were found to be erroneous.
Correlation of time series of precipitation measurements with reference data. The temporal consistency check involves detecting stations from which measurements often have relatively low reliability, but not so much that individual measurements do not pass a spatial consistency check. Analysis of the temporal consistency of rainfall data is most often carried out by analysing the correlation of the time series from the controlled rain gauge with the time series of reference data (Bárdossy et al., 2021; de Vos et al., 2019). Reference data can be either data from professional rain gauges of relatively high quality or from other measurement techniques, primarily weather radar (de Vos et al., 2019), but only after quality control (WMO-No. 1257, 2024). However, the use of radar data is associated with difficulties, most often due to errors in the estimation of the precipitation field (Ośródka et al., 2014; Ośródka and Szturc, 2022). Moreover, weather radar measurements are performed at certain heights above the ground surface – from a few hundred metres to as much as a few kilometres – and are then spatially averaged. Analysis of the correlation coefficient of a time series becomes difficult, especially in cases where the rain gauge reports false zero values (no precipitation) due to e.g. a sensor being blocked or some object obstructing the path of the rain (e.g. buildings, vegetation). Another difficulty is caused by non-rainfall periods – time series with predominantly very low rainfall can sometimes disturb the correlation, so a minimum precipitation threshold should be used to filter out data from such periods (Hahn et al., 2022).
Detection and removal of bias in precipitation measurements. The approaches to the issue of quality control of rain gauge data described above do not correct erroneously measured values but only reduce their QIs or remove them. However, data correction is an important part of data quality control. First of all, it is about bias correction (unbiasing), which most often results from rainfall underestimation related to rain gauge technology: rain gauge measurements are underestimating the true rainfall due to wind-induced errors, wetting losses, evaporation losses, and trace precipitation. The magnitude of the underestimation also depends on the construction of the rain gauge; in particular, tipping-bucket devices are subject to significant bias (Segovia-Cardozo et al., 2021). This bias can be eliminated, or at least reduced, by, for example, quantitatively analysing all underestimation factors and introducing all important corrections (Zhang et al., 2019). Such adjustments, however, are generally conservative because of the difficulty of considering all relevant factors and the lack of precise data on influencing parameters. Another way is to compare non-professional measurements with a benchmark as reliable as possible, which could be manual rain gauges, preferably lysimetric ones that measure at ground level (Haselow et al., 2019; Schnepper et al., 2023). However, such measurements are not common, so remote sensing data such as radar observations, which are more widely available, can be used as a benchmark, but they require QC to have been previously carried out. Unbiasing is also calculated on the basis of a larger data set collected during precipitation events typical of the local climate (e.g. from 14 d; see de Vos et al., 2019). The bias factor determined on this basis is treated as a climatological quantity.
1.4 Structure of the paper
This paper presents the RainGaugeQC system (Ośródka et al., 2022) after its adaptation for quality control of rain gauge data from non-professional stations. The paper is structured as follows: after Sect. 1, Sect. 2 briefly describes the different kinds of precipitation data on which the RainGaugeQC was developed and verified. Section 3 presents the algorithms of the RainGaugeQC system with an emphasis on solutions that are more advanced when compared to the earlier version of the system. Results obtained over several months, as well as analysis of two case studies, are discussed in Sect. 4. Section 5 summarizes the paper with a list of conclusions resulting from the use of the modified RainGaugeQC system.
2.1 Available networks of rain gauges
IMGW operationally utilizes telemetric rain gauge data from measurement networks operated by (Fig. 1) the following.
-
IMGW (Institute of Meteorology and Water Management – National Research Institute) – network of NMHS in Poland (https://hydro.imgw.pl/#/map, last access: 7 July 2025).
-
CHMU (Czech Hydrometeorological Institute) – network of NMHSs in the Czech Republic. IMGW uses data from stations near the Polish border (https://www.chmi.cz/files/portal/docs/meteo/ok/images/srazkomerne_stanice_en.gif, last access: 7 July 2025).
-
State Forests institution (LP) – network of the meteorological monitoring programme of forest areas (https://www.traxelektronik.pl/pogoda/las/, last access: 7 July 2025).
The above data are used to operationally generate (in real time) a multi-source precipitation field with high spatial resolution, which is the basis for generating nowcasting precipitation forecasts.
Synthetic information about the above networks is summarized in Table 1.
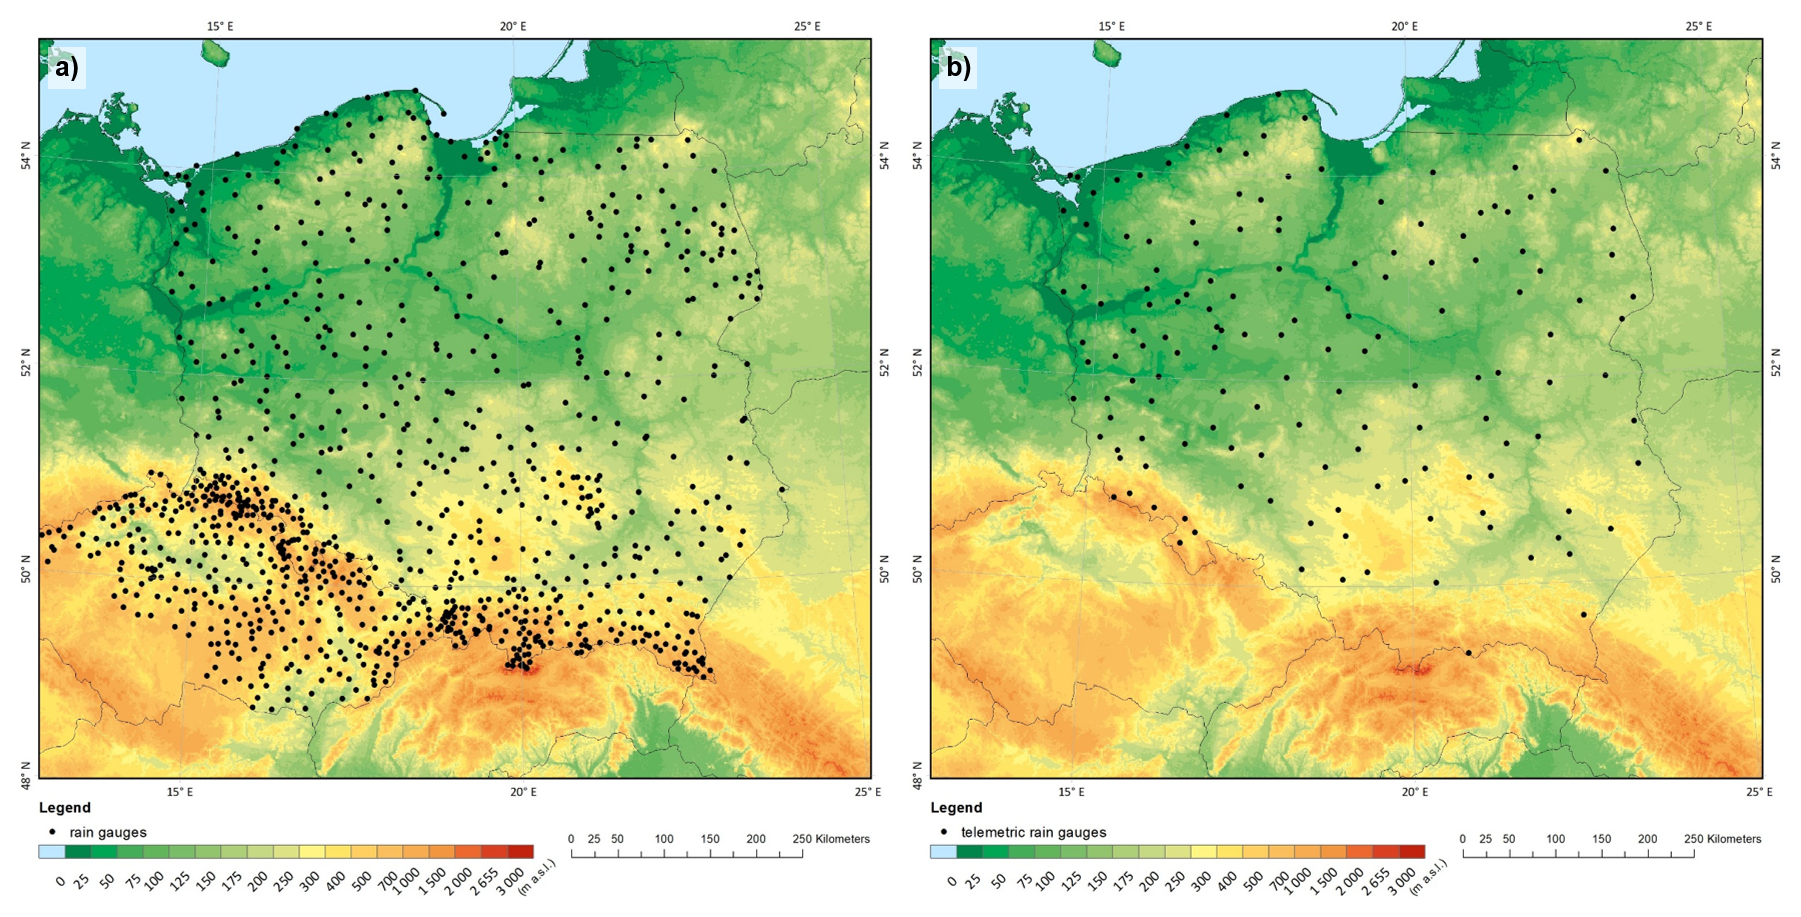
Figure 1Telemetric rain gauge networks: (a) IMGW and CHMU, (b) State Forests institution.
Table 1Rain gauge networks incorporated into operational processing by the RainGaugeQC system and the estimation of the precipitation field (as of October 2024).
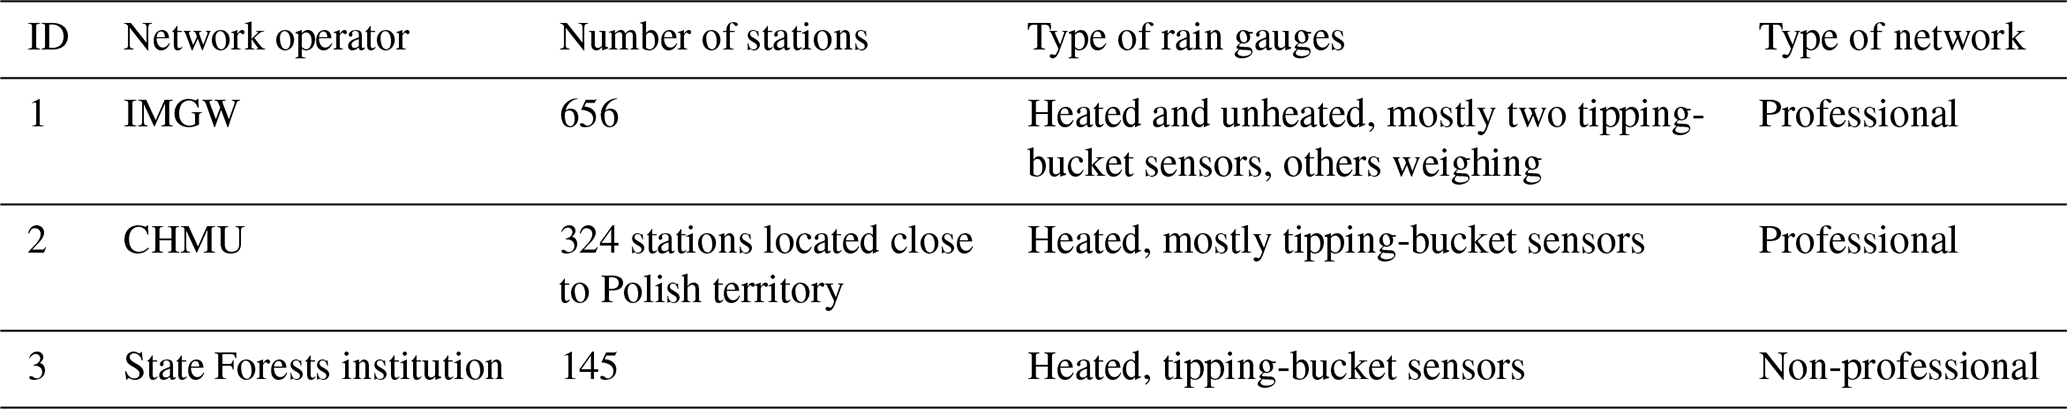
For the domain of Poland data from professional rain gauge networks operated by NMHSs in Poland (IMGW) and the Czech Republic (CHMU) are available. As the territory of the Czech Republic covers a large part of the analysed domain and, above all, a significant number of rain gauges are located close to mountainous areas on the border with Poland (Fig. 1), these data are very important for improving the reliability of the estimation of the precipitation field in southern Poland. The third network, belonging to the State Forests institution, is a non-professional research network so it is uncertain whether all the standards of the WMO recommendations are followed (WMO-No. 488, 2010).
The quality of precipitation data is highly dependent on the type of measuring devices being used. Currently, the IMGW network is still dominated by tipping-bucket-type rain gauges, which are considered significantly less accurate than weighing rain gauges (e.g. Colli et al., 2014; Hoffmann et al., 2016).
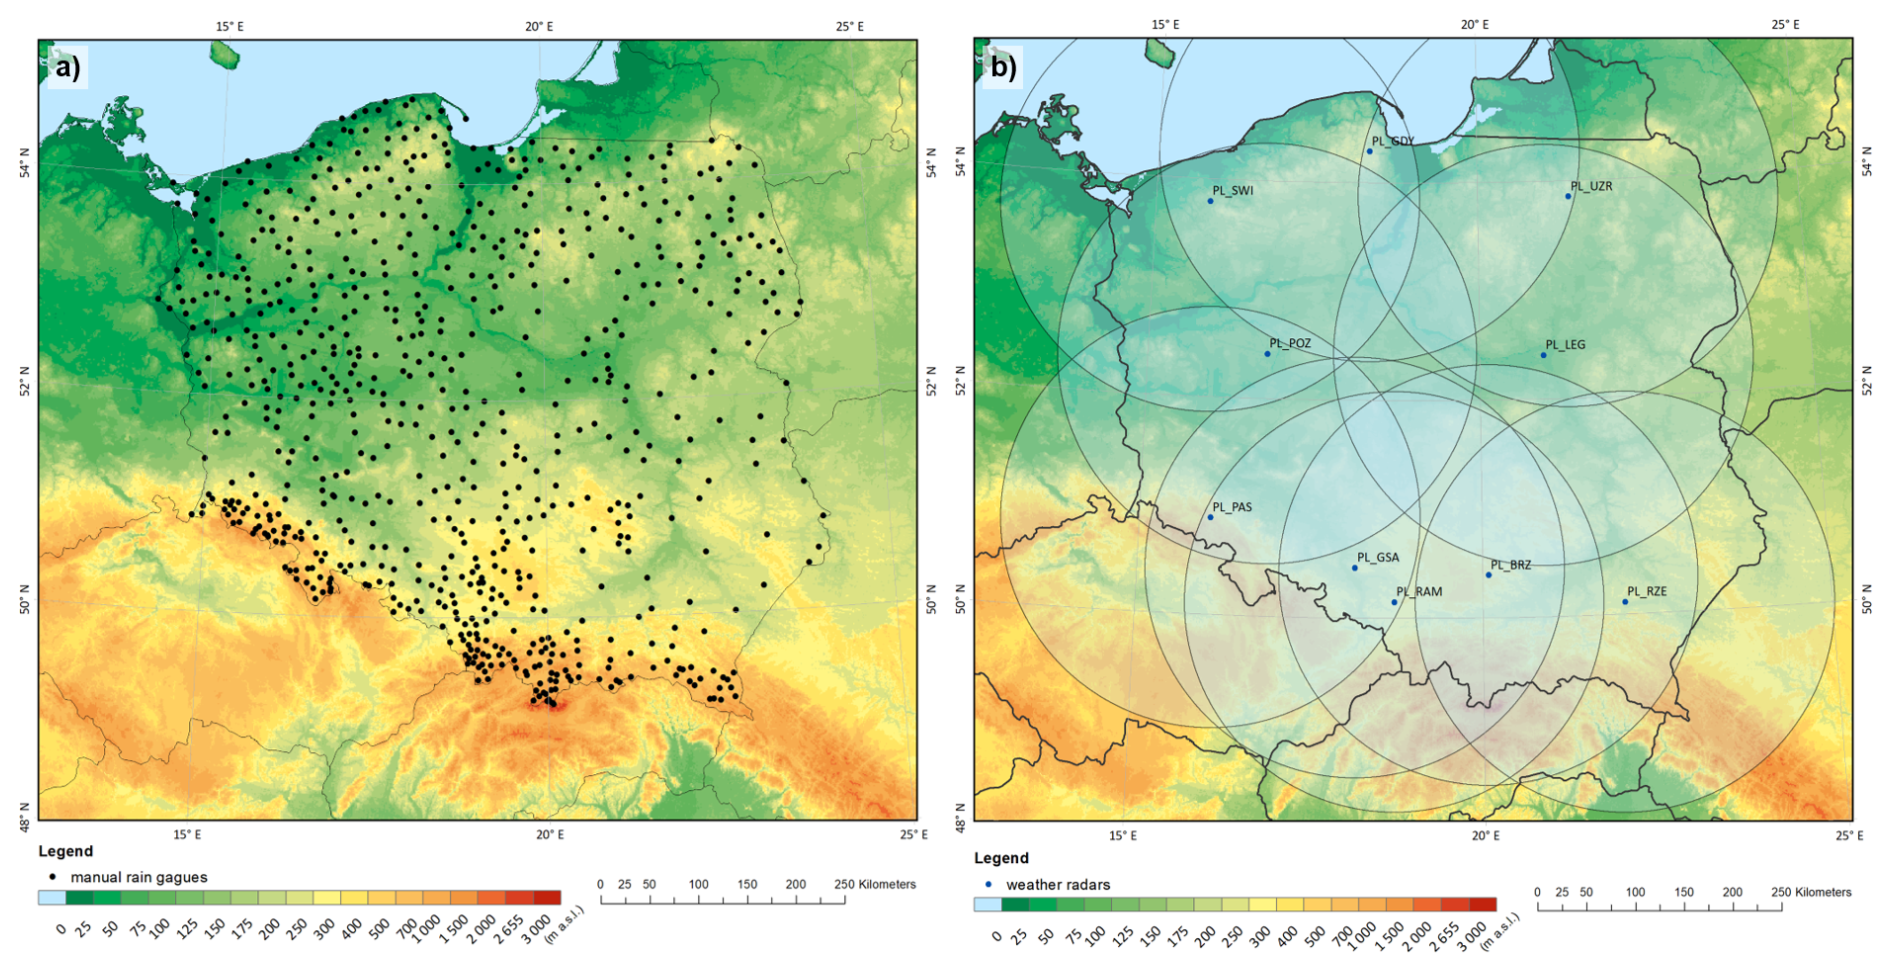
Figure 2Computational domain of Poland with (a) IMGW's network of manual rain gauges and (b) plotted 215 km ranges of weather radars of the Polish POLRAD radar network (as of July 2024).
A network of Hellmann-type manual rain gauges, providing independent reference data, is used in this study to verify the performance of the developed QC algorithms. As the data from these rain gauges are not available in real time, they cannot be used for rainfall field estimation or operational QC of telemetric data. The IMGW network consists of about 641 manual rain gauges, which provide daily rainfall accumulations (Fig. 2a). These data are believed to be much more accurate than measurements from telemetric rain gauges, which has been confirmed by extensive reliability analyses of different types of rain gauges at IMGW (Urban and Strug, 2021). They are subjected to manual QC before being used.
2.2 Weather radar precipitation data
Precipitation data from weather radars play a major role in the RainGaugeQC system for quality control of rain gauge data (Ośródka et al., 2022). The data used in this study are provided by the Polish POLRAD radar network operated by IMGW. The network consists of 10 Doppler polarimetric radars working in C-band, manufactured by Leonardo, Germany (Fig. 2b). Three-dimensional raw data and two-dimensional products are generated by the Rainbow 5 system every 5 min with 1 km spatial resolution and a range of 250 km. For the estimation of the precipitation field, data up to 215 km from the radar are used. This distance represents a balance between achieving the shortest possible range and ensuring complete coverage of the entire country with measurements.
The raw 3D radar data are quality-controlled and corrected by the RADVOL-QC system (Ośródka et al., 2014; Ośródka and Szturc, 2022). The product used to estimate the rainfall field is PseudoSRI (Pseudo Surface Rainfall Intensity): cut-off at 1 km altitude above ground and from the lowest elevation out of the SRI range, generated every 5 min and accumulated into 10 min sums taking into account spatio-temporal interpolation between two adjacent measurements. As a result of quality control with the RADVOL-QC system, the corresponding QI fields are also assigned to the individual estimated precipitation fields. In addition, some kind of quality control of radar precipitation takes place at the stage when data from individual radars are combined into composite maps. This is done by means of an algorithm that takes into account the time-varying spatial distribution of the quality index (Jurczyk et al., 2020a).
Due to the bias present in the weather radar observations, these data are adjusted with rain gauge data, but only from the professional networks, derived from the 1 h moving window. However, if a precipitation accumulation is below a preset threshold, then this period is extended accordingly up to a maximum of the seasonal accumulation. This adjustment is carried out from gauge–radar ratios determined at rain gauge locations, spatially interpolated over the entire domain.
2.3 Multi-source precipitation estimates by RainGRS
Multi-source precipitation field estimates are generated by the RainGRS system of IMGW. The system combines rain gauge, weather radar, and satellite precipitation data in real time (Szturc et al., 2018; Jurczyk et al., 2020b, 2023). The algorithm for combining these data is based on conditional merging according to an algorithm proposed by Sinclair and Pegram (2005), which attempts to enhance the strengths and reduce weaknesses of individual measurement techniques. This approach was modified in RainGRS by taking into account the quantitative information about the spatial distribution of the quality of the individual input data (quantified by QI). These estimates are produced every 10 min with a high spatial resolution of 1 km×1 km.
In the study, two versions of multi-source RainGRS precipitation estimates are generated in order to examine the impact of incorporating non-professional data. In the first version, rain gauge data only from the professional networks of IMGW and CHMU were taken, while in the second version, data from the non-professional network of the State Forests institution were added to this set.
3.1 RainGaugeQC system for QC of rain gauge data from a professional network
The RainGaugeQC system was originally designed to perform real-time quality control of rain gauge data from measurement networks maintained by IMGW. This system was described in detail in work by Ośródka et al. (2022), so in this study, after a very concise presentation of the algorithms, the following sections will describe only modifications made to adapt it to data from non-professional networks.
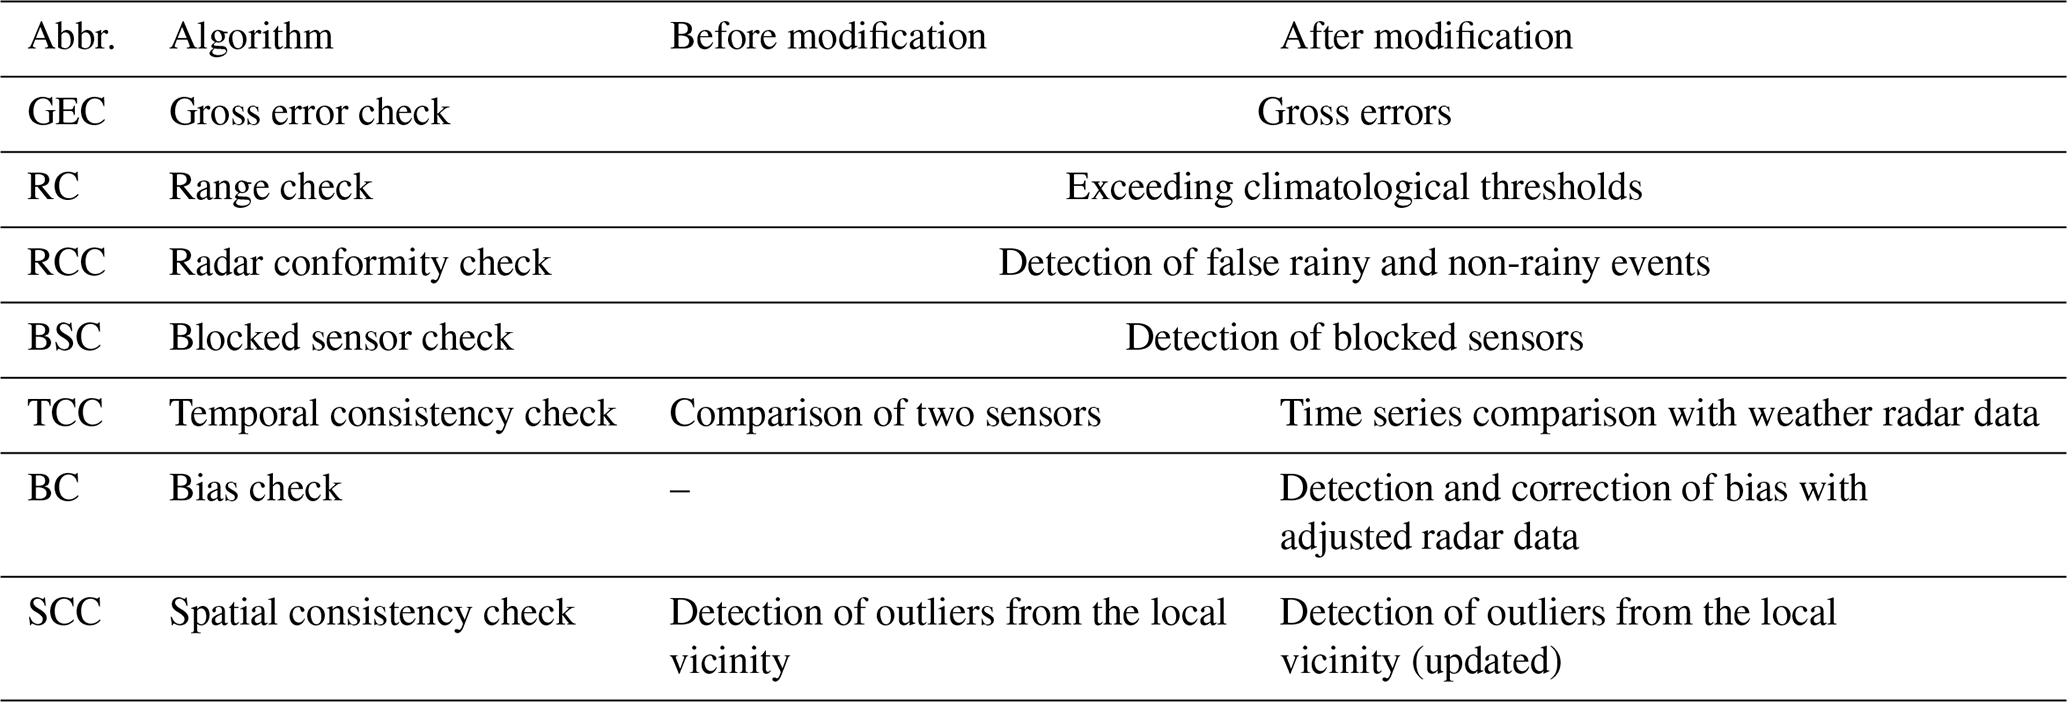
In the standard version of RainGaugeQC (Ośródka et al., 2022) (see column “Before modification” in Table 2), firstly the simple plausibility tests – the gross error check (GEC) and range check (RC) – were performed on individual measurements. The GEC involves detecting when natural limits are exceeded, while the RC focuses on identifying when climate-based thresholds are surpassed at an individual gauge.Then the more complex checks were conducted using a larger amount of rain gauge data from either a specific time range or a specific area, as well as using external data provided by weather radars. Firstly, the radar conformity check (RCC) was applied to identify false precipitation on the basis of the radar measurements. Obstruction or blocking of the sensors was also checked for. Next, the temporal consistency check (TCC) was performed, but this version was designed only for dual-sensor stations: data from the pairs of rain gauge sensors were tested for the existence of significant differences between them. The most advanced algorithm was the spatial consistency check (SCC), which identified outliers by comparing observed values with data from neighbouring stations.
An important outcome of the system was the determination of the quality index (QI) of analysed data, which is a unitless value with a range [0.0, 1.0], where “0.0” means extremely bad data and “1.0” means perfect data. At each time step this QI metric was determined by the RainGaugeQC for each sensor, and then the sensor with the highest quality was taken for further processing.
Table 2A summary of the quality control algorithms used in the RainGaugeQC system before and after modification.
3.2 Directions of development in RainGaugeQC
The possibility of incorporating non-professional data at IMGW became a motivation for more sophisticated data quality control. The QC algorithms in the previous version of RainGaugeQC turned out to be inadequate for non-professional data, as these gauges are generally not dual-sensor. On the other hand, the inclusion of new data significantly improved the performance of the SCC algorithm due to the higher density of the measurement network. Therefore, it was necessary to redesign the RainGaugeQC system in order to adapt it to rain gauge networks equipped with different types of sensors, supervised to various degrees, so that the system became more universal. The modified algorithms tailored to the new challenges associated with incorporating non-professional data are summarized in Table 2 in the “After modification” column. Here is a brief overview of the changes made to the RainGaugeQC algorithms, whereas detailed information can be found in Sect. 3.3 to 3.5.
TCC. In the new version of the TCC (time series comparison with adjusted weather radar data) algorithm, weather radar data are used to compare time series from a specific time interval to check the correlation between rain gauge measurements and radar observations. The correlation coefficient is used as a metric for the relevant component of the quality index of the rain gauge data. This allows for a reduction in the data quality index of rain gauges with measurements disturbed for a certain time period due to failure, poor maintenance, or bad locations.
BC. The above TCC algorithm is not sensitive to the bias of rain gauge measurements, so the BC (bias check with adjusted radar data) algorithm is used to detect bias in the data. It also works by analysing long-term data series, but in this case they are used to compare data accumulations from rain gauges with radar accumulations. The quantitative estimation of the bias of the rain gauge data allows relevant components of the quality index to be determined. In the case of personal rain gauges, unbiasing is carried out as well as reducing the QI value.
SCC. The SCC (detection of outliers from the local vicinity) algorithm was already introduced in the first version of the RainGaugeQC system, but significant modifications have been made to the current version. It detects outliers, i.e. the measurements at a given time step which deviate from the values from rain gauges located in a certain area. The increase in the number of rain gauges through incorporating non-professional data has made it easier to determine the degree to which individual data are outliers. The quality index reduction for outliers is quantified on the basis of the spatial variability of the precipitation field derived from the radar data.
All parameters of the algorithms described in Sect. 3.3 to 3.5 were chosen empirically by comparing the calculated QI values with the expected ones based on our assessment of the data reliability.
3.3 New version of the TCC algorithm (time series comparison with weather radar data)
The TCC algorithm is designed to eliminate erroneous rain gauge measurements (G) by analysing the correlation on time series. The reference is radar precipitation (R) after adjustment with rain gauge observations only from professional networks.
For the calculation, pairs of rain gauge (G) and radar (R) data are taken if at least one of the values is greater than 0.025 mm and their quality index (QI) is at least 0.7 for G and 0.8 for R. Two time series aggregated from 10 min accumulations, “short” and “long” comprising 5 and 10 d, respectively, are analysed in order to test correlations on time series that are as short as possible and, on the other hand, sufficiently representative. The number of non-precipitation pairs cdry for long series is determined provided that both values are less than 0.025 mm. For each series, hourly accumulations are determined and then the number of measurement pairs c and correlation coefficient r are calculated.
The procedure for assessing data quality is carried out by checking a list of conditions. For a given measurement these conditions are examined sequentially, and, depending on the result, further ones are checked or the quality index is reduced accordingly.
First, the 10 d radar precipitation total is checked. If this is too low, then the correlation coefficient is not calculated, as it may not be reliable in such a case. In addition, it is checked whether the rain gauge rainfall differs significantly from the radar data (Eqs. 1 and 2), and depending on this, the quality index of G is reduced.
If the both accumulations are below the assumed threshold values, then the quality index of the rain gauge data is not reduced and the check is stopped.
If the amount of radar precipitation for the long series is below the assumed threshold and the amount of rain gauge precipitation is above the corresponding threshold, indicating large differences between the two accumulations, then the check is also stopped and the quality index of the rain gauge data is reduced by 0.05.
The check is passed if the number of measurement pairs is above the preset threshold and the correlation coefficient r is above 0.3 for short or long series. Then the quality index is reduced on the basis of the relevant correlation coefficient, according to the following formula.
If there is an insufficient number of measurements for short series and at the same time the number of non-precipitation data pairs is above a preset threshold, indicating that there is a longer non-precipitation period, then the TCC is stopped and quality index is reduced.
Finally, the number of measurements and correlation coefficient with radar data for short and long periods are examined. If the condition in Eq. (5) is met then the check is stopped. If not, the check is failed:
else → TCC failed, and QI .
This formula applies to cases when there are too few measurements or the correlation coefficient could not be calculated or was below the assumed threshold for short or long series.
3.4 New algorithm BC (detection of bias with adjusted radar data)
The determination of bias in the BC algorithm is carried out by comparing the precipitation accumulations obtained from the time series recorded on a given rain gauge with adjusted radar rainfall as a reference. For the most recent 10 d using a 10 min temporal resolution, rain gauge and radar precipitation accumulations, denoted as ΣG and ΣR, respectively, are calculated from gauge–radar pairs, for which both measurements have a quality index of at least 0.7 for G and 0.8 for R.
The choice of the length of the precipitation accumulation period to determine the bias is not a trivial issue. Long accumulations better reflect the overall uncertainty of the measurements at a given station, but, on the other hand, short accumulations better follow the current precipitation characteristics during a particular precipitation event. Most often, bias is determined based on rainfall accumulations from up to a few dozen hours but sometimes on much longer accumulations – e.g. Yousefi et al. (2023) used seasonal totals to unbias radar data with rain gauge data.
The bias of the rain gauge measurements is calculated from the ratio of radar to rain gauge precipitation accumulations.
The bias determined in this way is used to reduce the QI of the controlled rain gauge data. If the precipitation accumulations ΣG and ΣR are similar, which is checked using the corresponding similarity function, the quality of the measurement remains unchanged. The similarity function is defined as follows.
If the radar and rain gauge precipitation accumulations for a given rain gauge are not similar, then depending on the bias determined from Eq. (6), the value of the QI of a given measurement is reduced, but to a varying extent, according to the following formula.
In the case that the bias cannot be estimated, the quality index of a particular measurement is reduced according to the following formula.
In terms of data from personal weather stations, they are considered to be subject to much greater uncertainty due to the lack of supervision of the technical condition of the rain gauges, poor maintenance, and bad locations. Such stations should therefore be treated more rigorously than stations supervised by the institutions responsible for the measurements. The similarity function (Eq. 7) is not applied, as their quality index values are always reduced by the following formula.
When bias cannot be estimated, the quality index value of a given measurement is reduced by the following formula.
In addition, unbiasing should be performed for data from personal stations, which is not done for other types of stations, as they only have a reduced QI. Unbiasing is performed on the basis of the bias determined from Eq. (6), but limiting its value to factor 4.
The above limitation on the value of the bias4 factor is to protect against too large a change in the value of the corrected precipitation (van Andel, 2021).
Finally, the unbiased precipitation accumulation Gcor is determined from the following formula.
As IMGW does not yet have a sufficiently dense network of cooperating personal stations (Droździoł and Absalon, 2023), tests have not been carried out to verify the algorithm designed in this study on data from such a network.
3.5 Updated SCC algorithm (detection of outliers from the local vicinity)
The spatial methods for quality control, such as the SCC, are especially effective for dense rain gauge networks because they utilize observations from nearby stations (Alerskans et al., 2022). Thus, when applied to sparse networks, it is more likely that a correct value measured by a rain gauge will be classified as erroneous in the case of intense convective rainfall of a very local nature.
Based on the analysis of the performance of the SCC algorithm – as published in a previous paper on the standard version of the RainGaugeQC system (Ośródka et al., 2022, Appendix C therein) – a modification was made in relation to the degree of QI reduction depending on the spatial variability of rainfall.
The algorithm has not changed in terms of assigning each rain gauge measurement to one of the three classes of outliers (strong, medium, and weak) or to the class of correct data. However, the algorithm for reducing the QI value of each measurement assigned to any of the outlier classes was modified. In the current version of the algorithm, the magnitude of QI reduction depends on whether a given rain gauge measurement is within an area of a high spatial variability of precipitation determined from weather radar data of sufficient quality QI(R). In this case, the outlier is treated less restrictively. The concept of spatial variability function (SVF) was introduced for this purpose, and is defined as follows.
The SVF consists of two components indicating the degree of spatial variability of the precipitation:
where Rmean is the mean radar precipitation (mm) for wet pixels in the 100 km×100 km sub-domain including 25 km margins (see Ośródka et al., 2022), and Rvar is the mean variance of radar precipitation (mm2) in the sub-domain calculated analogously to Rmean.
On the basis of the value of the SVF function, the reduction in the quality index for an individual rain gauge observation is determined according to its classification into a specific outlier class (see Ośródka et al., 2022).
3.6 Determination of QI
Before all the checks, each rain gauge observation is assigned the perfect QI value (1.0). Depending on the result of a particular QC algorithm, the QI of an examined measurement is decreased by a relevant value. If the final QI value, i.e. after all checks, is below a preset threshold, the observation is considered useless and is replaced with “no data”.
The performance of the RainGaugeQC system, designed to control the quality of precipitation data from professional and non-professional rain gauge networks, is shown through a comparison of the statistics calculated for these two rain gauge networks:
-
professional network of IMGW, the Polish NMHS, supplemented in the border region by data from CHMU, which is the Czech NHMS
-
non-professional network of the General Directorate of the State Forests
The most important characteristics of these networks are summarized in Table 1, and the locations of the rain gauges are shown in Fig. 1. Rain gauges from personal networks have not been included, as the establishment of their network at IMGW is still at a preliminary stage.
The analysis was carried out for four months – April, July, and October 2023 as well as January 2024 – considered typical of the four seasons. The summer season (July) is dominated by convective precipitation, which is often intense and highly variable in time and space, while the winter season (January) is dominated by stratiform precipitation, often in the form of snow. In the intermediate seasons (April, October) precipitation is less intense – it is generally rain and is rarely convective.
4.1 Verification metrics
The reliability of the precipitation estimates generated using the RainGaugeQC system was verified by comparison with the reference precipitation accumulations from manual rain gauges that are treated as the closest to the true precipitation at their locations. The following metrics were employed.
-
Pearson correlation coefficient:
-
root mean square error:
-
root relative square error:
-
statistical bias factor (BF):
Here, Ei is the estimated value, Oi is the reference value, i is the gauge number, n is the number of gauges, and and are the mean values of Ei and Oi, respectively.
4.2 Non-professional versus professional rain gauge data
A comparison of reliability metrics of precipitation estimates obtained from a network of professional and non-professional rain gauges, respectively, is shown in Fig. 3. Point measurements of rainfall were verified against values at rain gauge locations obtained from the interpolation of manual rain gauges using the inverse distance weighting method. Professional rain gauges situated at manual gauge locations, a relatively common situation in the IMGW network, were not included in the statistics in order not to favour this category of data. Therefore, around 200 professional rain gauges were used for verification instead of all 469. Days with precipitation accumulation below 0.5 mm were not included in the calculations (in total 21 d in these four months).
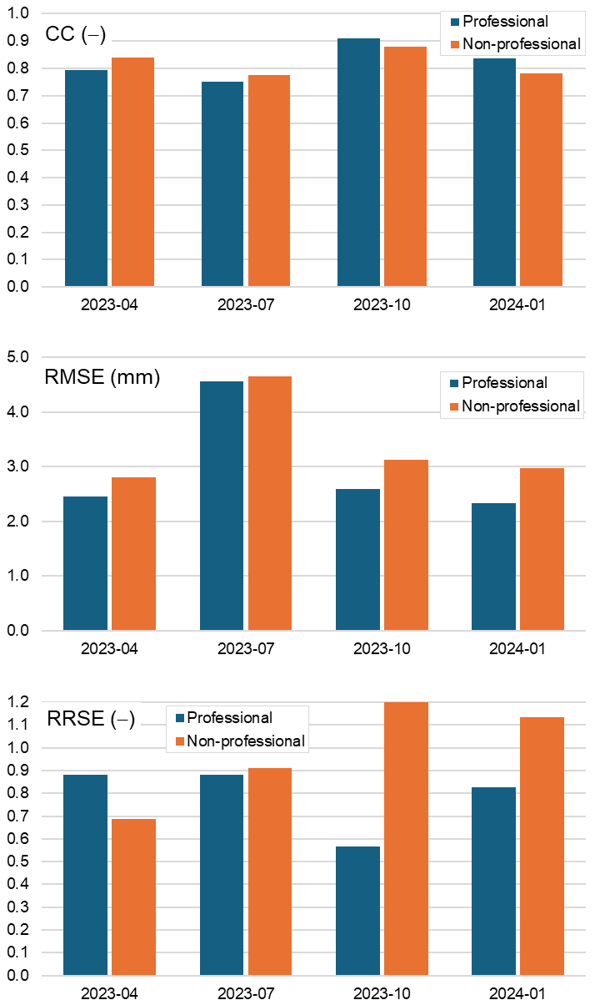
Figure 3Reliability statistics of rainfall estimates calculated for data obtained from the network of professional (navy) and non-professional (orange) rain gauges. Spatially interpolated manual rain gauges are used as a reference. Data are from April, July, and October 2023 as well as January 2024.
The reliability of the non-professional data in general is close to that of the professional data, especially as regards the correlation coefficient: on average for both it is about 0.82, and the differences between them are small, below 0.06. The RMSE metric related to the deviation from the reference data is already clearly worse for the non-professional data, by on average about 0.41 mm. The largest difference was found for January, when it reached 0.65 mm. Only in the summer period (July) is the difference between the non-professional and professional data small (0.09 mm), though the error values are highest at that time (4.65 and 4.55 mm, respectively). During this period, convective precipitation is frequent, more intense, and also more dynamic, and as a consequence, the comparison with spatially interpolated reference data can produce large differences. In contrast, a similar but relative RRSE metric gives less conclusive results: in April it is much better for the non-professional data (0.69 versus 0.88), while in the other months the non-professional data are worse than the professional, with a significant difference of 0.63 in October.
4.3 Comparison of the QC system performance on professional and non-professional data
In this section an examination is made of the extent to which the QI of rain gauge data for professional and non-professional stations is reduced by the RainGaugeQC system in different months of the year. The QI plays a key role in the multi-source precipitation field estimation performed by the RainGRS system as the QI is one of the most important weights during spatial interpolation of rain gauge data, and, most importantly, it is a weight when rain gauge data are combined with the other precipitation estimates – radar and satellite-based. As a result of this approach, the impact of low-quality data on the final precipitation field estimate can be reduced.
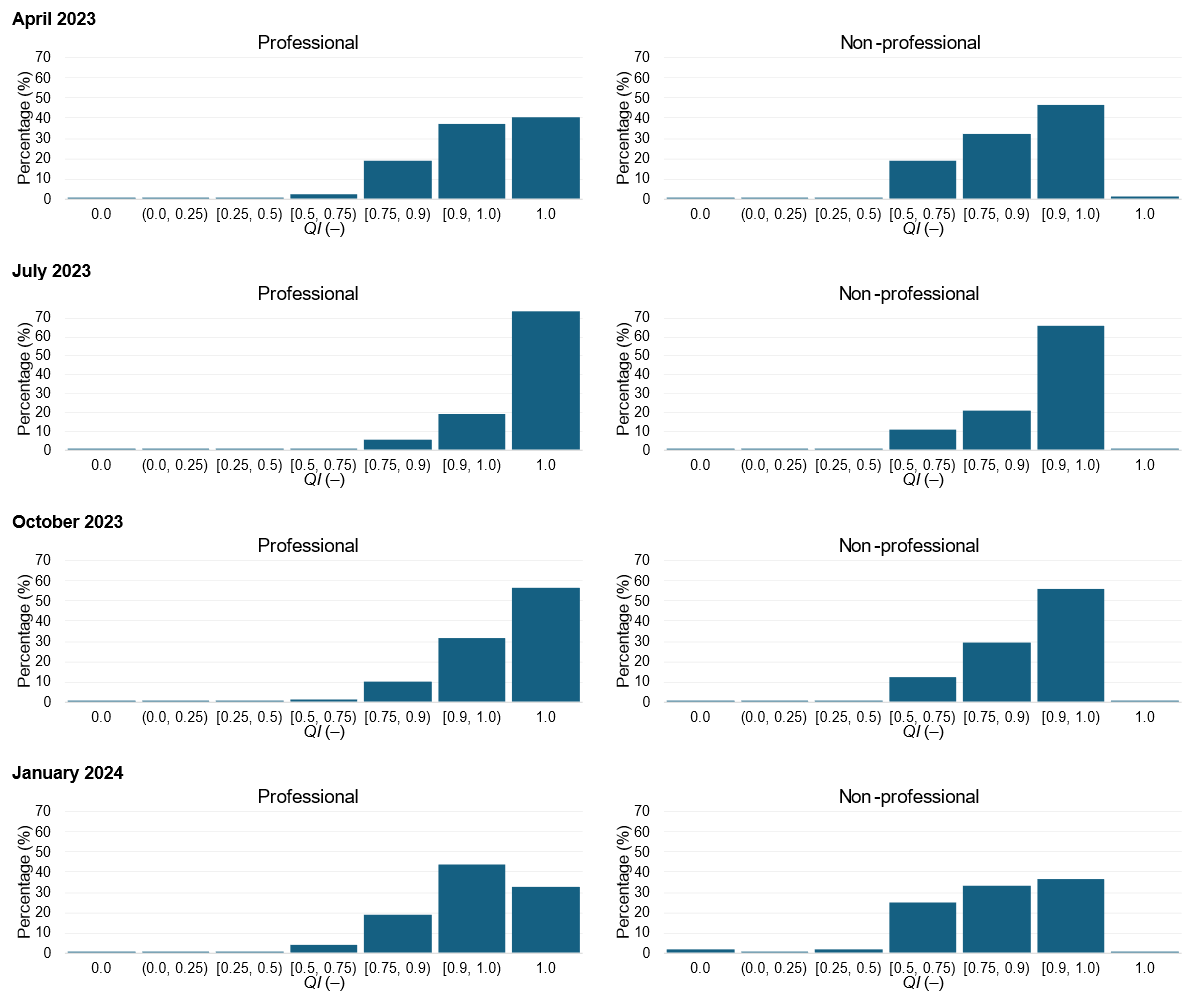
Figure 4Percentages of data with QI values in different ranges (histograms). Data from April, July, and October 2023 as well as January 2024.
Figure 4 summarizes the percentage of rain gauge data in different ranges of QI values assigned to individual measurements as a result of QI performed with a modified version of the RainGaugeQC system for four months representing different seasons, separately for professional and non-professional stations. It can be noted that, in general, QI values are significantly higher for professional data, meaning that QC algorithms indicate higher uncertainty in non-professional data. While unreduced quality (QI =1.0) characterizes 32.5 %–76.1 % of all professional data depending on the season, it is just 26.0 %–57.6 % of non-professional data. On the other hand, lower quality values (QI <0.75) in different seasons characterize 1.4 %–4.9 % of the professional data and 7.4 %–24.2 % of the non-professional data. Probably the reason for the worse results for January is the occurrence of snowfall, which is more challenging for radars to detect.
There is a noticeable seasonal dependence of the number of data with QI in specific value ranges, which is similar for professional and non-professional data. The highest percentage of data with a QI of exactly 1.0, i.e. perfect data according to the RainGaugeQC system, is observed in July (summer) and equals 76.1 % and 57.6 % for professional and non-professional data, respectively, while the percentage of data with poor qualities is also lowest in this month for both types of the data: 1.4 % and 7.2 %, respectively. Considering the distribution of QI values in the different ranges, the data from January proved to be the least reliable, when the percentage of data with low QI values, i.e. in the range between 0.0 and 0.75, is the highest, reaching 4.9 % for professional and 24.2 % non-professional data. The low percentage of QI =1.0 in January for both data types is due to the methodology used to determine these values in the SCC algorithm (Sect. 3.5). It uses the spatial variability function (SVF), which quantifies the spatial variability of precipitation at each time step. The high variability of precipitation is associated with convective precipitation, and the introduction of the SVF function is intended to prevent such precipitation from being treated too rigorously and decreasing the QI of good measurements. However, convective precipitation is very rare in winter in Poland, hence the frequent reduction of QI for weak outliers.
4.4 Impact of non-professional rain data on the reliability of precipitation estimates
The following data sets were applied to test the influence of non-professional rain data on the reliability of precipitation estimation: (i) professional only and (ii) professional and non-professional together after quality control with the modified version of RainGaugeQC. From both rain gauge data sets, 10 min multi-source estimates of precipitation accumulations were generated with the RainGRS system and then aggregated to daily accumulations. Table 3 shows the reliability metrics of the daily accumulations calculated for April, July, and October 2023 as well as January 2024 using the manual rain gauge data as a reference. Statistics were determined at the locations of the manual rain gauges.
Table 3Reliability metrics of estimates of daily RainGRS precipitation accumulations generated using rain gauge data: professional and professional with attached data from non-professional rain gauges after quality control with the modified version of RainGaugeQC. Measurements from manual rain gauges are used as a reference, and data are from April, July, and October 2023 as well as January 2024.
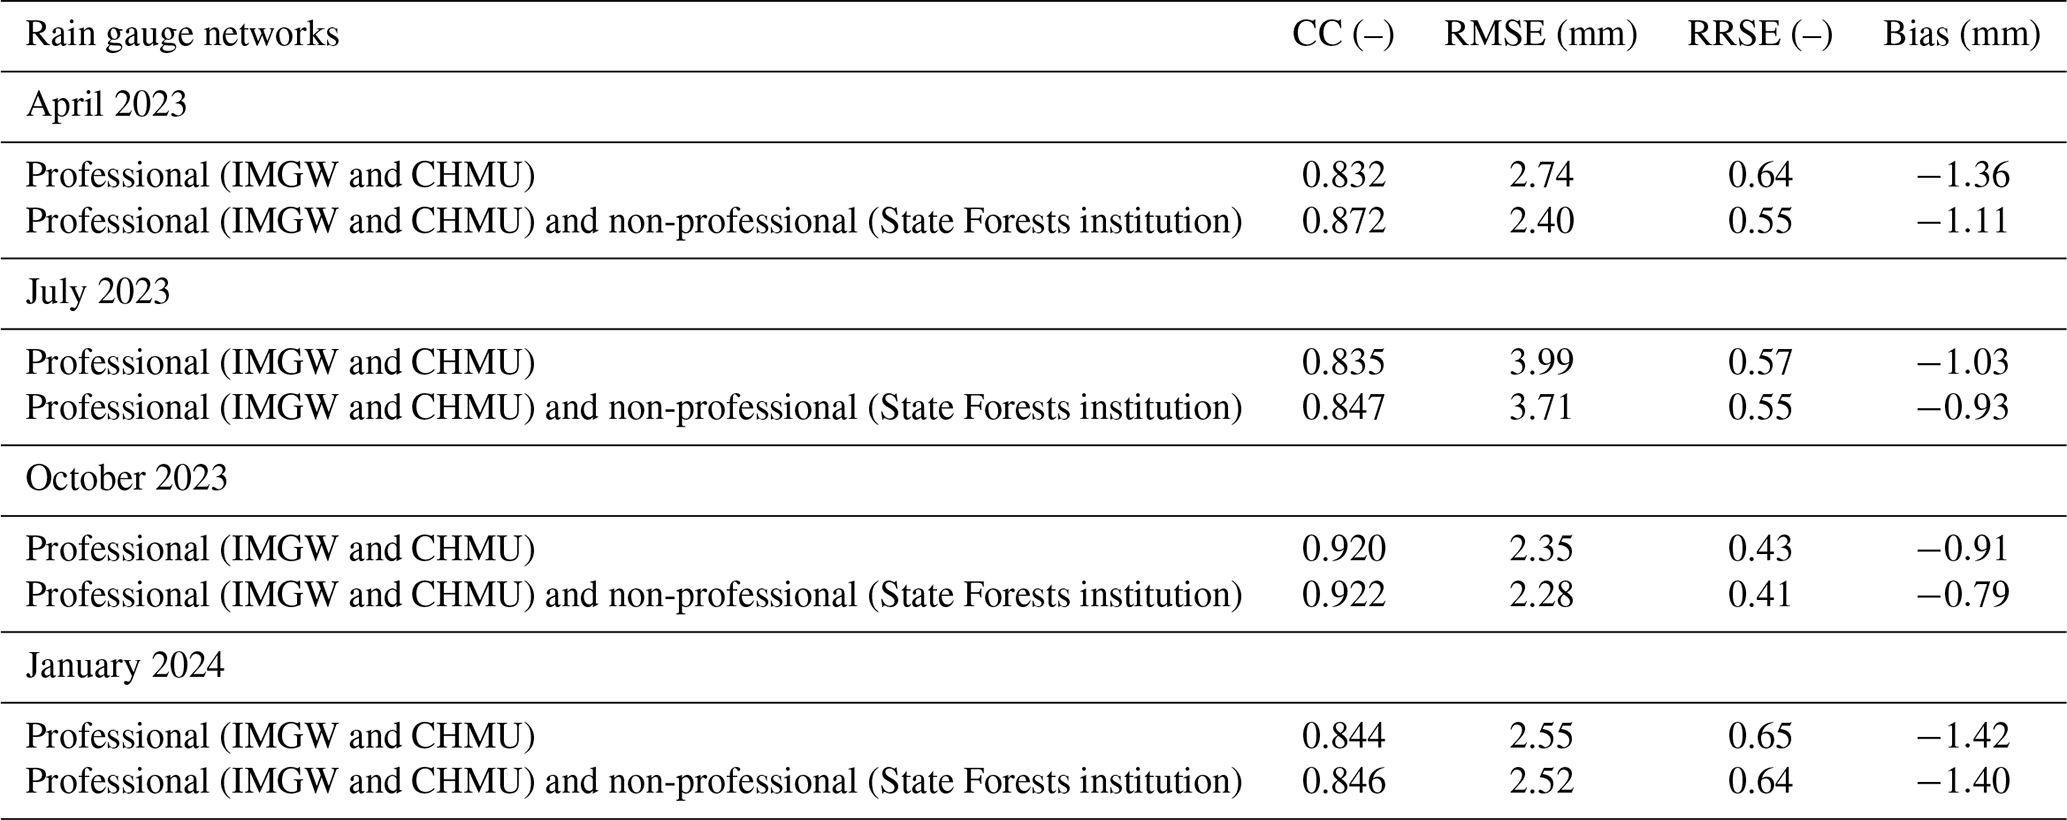
It can be seen from Table 3 that after the incorporation of non-professional data provided by the General Directorate of the State Forests into RainGRS, all reliability metrics improved. In the four months analysed on average, the correlation coefficient increased only marginally. Greater improvement after the inclusion of non-professional data can be seen in all metrics related to error magnitude: RMSE, RRSE, and BF, which on average decreased by 0.16, 0.03, and 0.12 mm, respectively.
Analysing the four metrics used, the most positive impact of incorporating non-professional data was found in April 2023, an intermediate month, when all characteristics improved. CC increased by 0.04, while metrics related to error magnitude also improved: RMSE by 0.34 mm, RRSE by 0.09, and BF by 0.35 mm. This observation is consistent with the results shown in Fig. 3, where in April the non-professional data were even more reliable than the professional data in terms of CC and RRSE metrics. The smallest impact of non-professional data was observed in January, when the improvement was negligible.
It should be pointed out that the number of non-professional rain gauges available for this study was not large: the ratio between the number of rain gauges in the non-professional and professional networks was about 1:4. Therefore, it can be expected that if there were more of these non-professional rain gauges, then the benefit from them in terms of improvement in the reliability of the precipitation estimates would be even more pronounced. This impact is not only due to the measurement information provided by these rain gauges, but also largely due to the fact that additional rain gauges make quality control of all rain gauges much more effective.
4.5 Impact of non-professional rain gauges on estimated multi-source precipitation field – varying impact in different locations
This section presents two case studies illustrating the influence of non-professional precipitation data on the reliability of precipitation estimates generated by the RainGRS system. The location of the study areas is shown on a map of Poland (Fig. 5). Locations in central Poland were chosen because the network of professional rain gauges is sparsest there (see Fig. 1), so the influence of non-professional data on the final estimate of the precipitation field can be expected to be more evident. Two different RainGRS precipitation field estimates were generated using rain gauge data: (i) from professional rain gauges only and (ii) from both professional and non-professional rain gauges. The impact of incorporating non-professional rain gauge data on multi-source field estimates was assessed using manual rain gauge measurements as reference data. The analyses were conducted on daily accumulations because only these kinds of data are available from manual rain gauges.
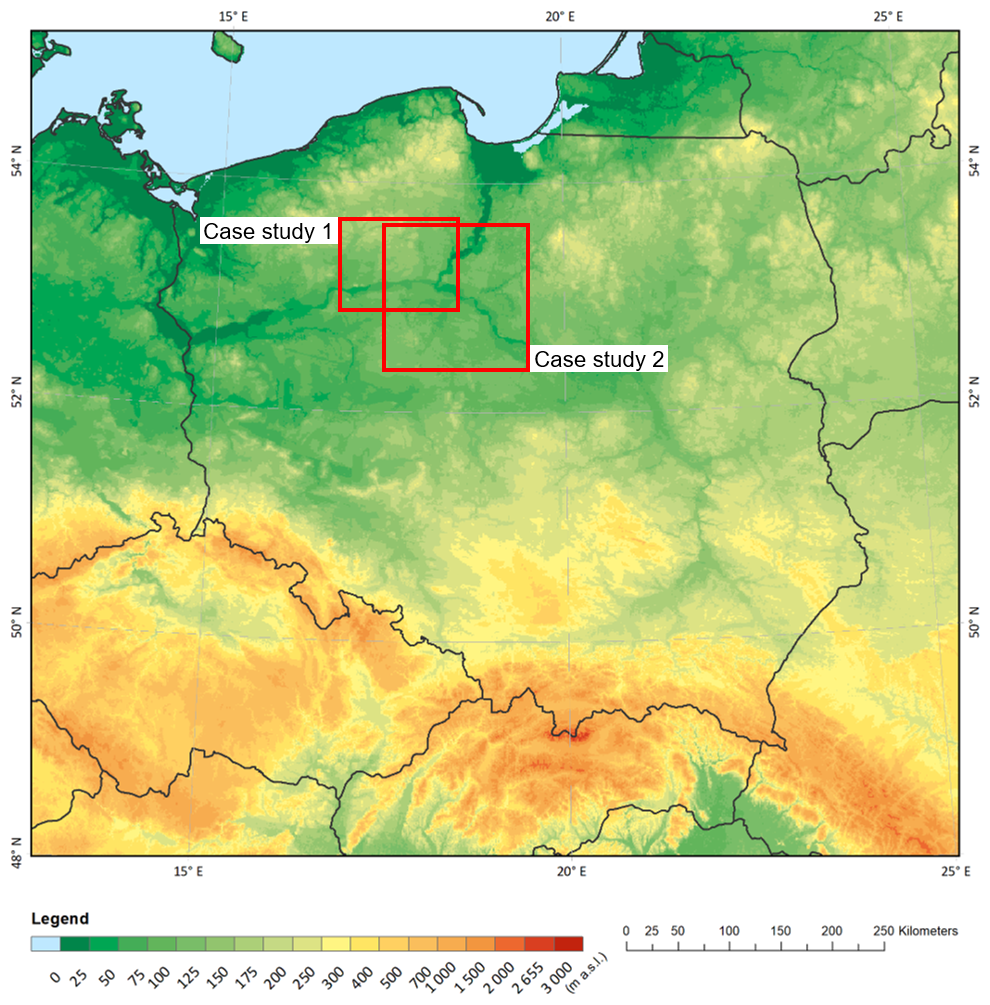
Figure 5Location of case studies on a map of Poland.
4.5.1 Case study 1: isolated convective precipitation (29–30 July 2023)
On 29 and 30 July 2023 Poland was under the influence of a trough of low pressure and atmospheric front systems moving from west to east. There were some showers and thunderstorms with precipitation locally reaching more than 60 mm d−1, which triggered flash flooding in major cities in the north of the country. Figure 6 presents the daily precipitation accumulations for this day, which shows the effect of including non-professional rain gauge data in the input data to the RainGRS model generating multi-source precipitation field estimates.
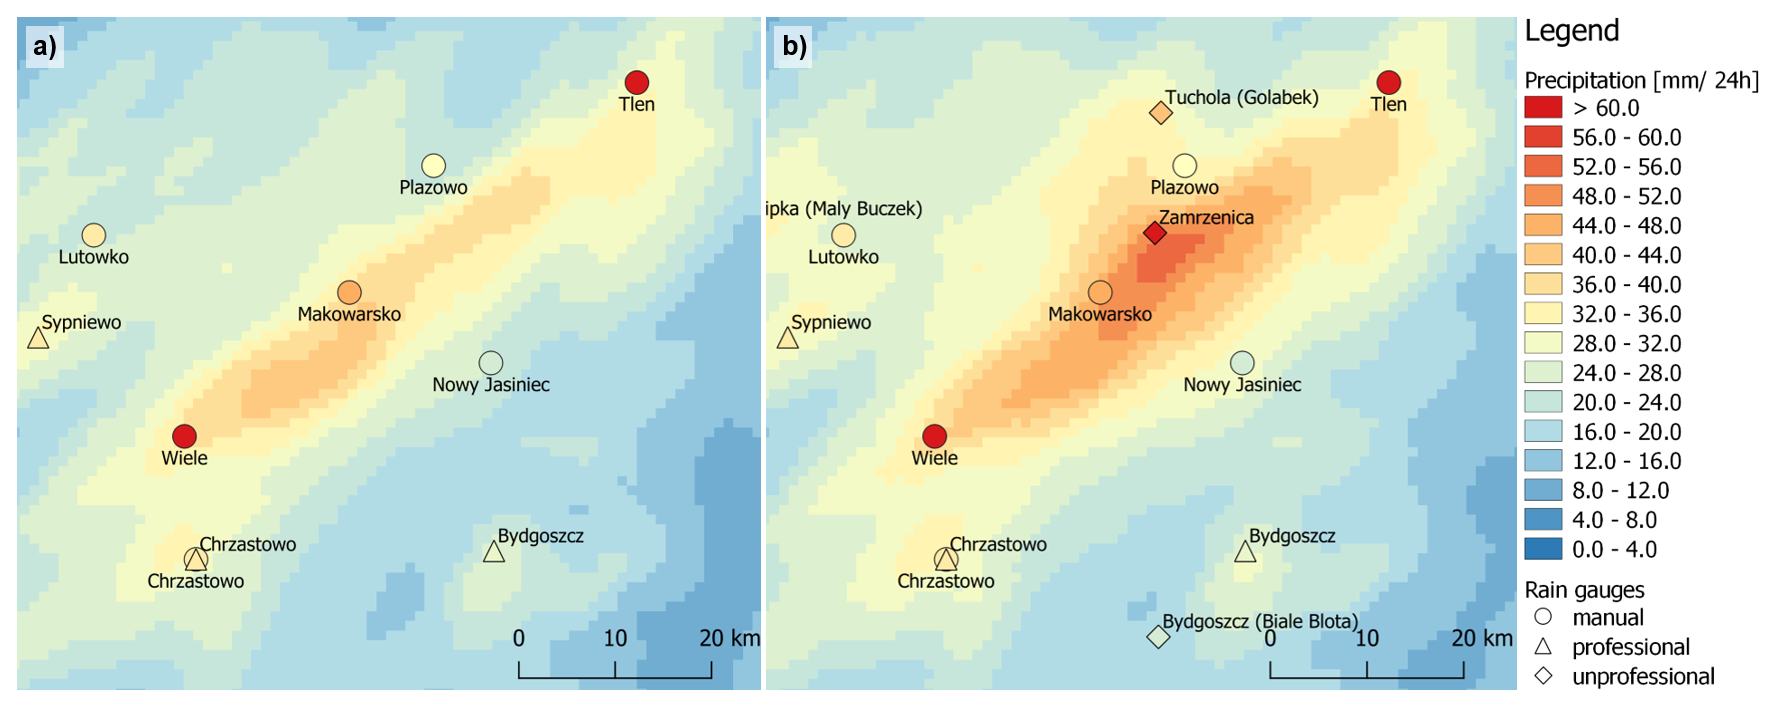
Figure 6Precipitation maps of multi-source RainGRS estimates from (a) professional and (b) professional and non-professional data. The symbols are filled with colours that correspond to the precipitation values measured by each rain gauge. A fragment of Poland with daily accumulations from 29 July at 06:00 UTC to 30 July 2023 at 06:00 UTC.
In the fields of estimated precipitation accumulations in the vicinity of the thunderstorm cell in Fig. 6, it can be seen that after incorporation of the non-professional data, the accumulations became noticeably higher, as the data from the non-professional rain gauges are generally higher than those from the professional ones – a general increase in values can be seen in Fig. 6b compared to Fig. 6a. Using the measurements from the manual rain gauges as reference data, it can be concluded that the obtained increase in the estimated RainGRS precipitation field is closer to the reference precipitation (this is confirmed by the results in Table 3). Regarding the thunderstorm cell moving through the study area, it was compact and small in size (its diameter was about 10 km), and no professional rain gauge was in its path. It was detected by weather radars, so it is visible in the multi-source estimate, but the precipitation values are underestimated compared to the reference precipitation recorded by the manual rain gauges located in the path of this cell.
When including the non-professional data, a rain gauge in Zamrzenica on the route of this storm cell measured a daily rainfall of 62.3 mm, resulting in a significant increase in the RainGRS precipitation estimate in this area: from 31.6 to 50.6 mm at the Zamrzenica location. However, due to the small number of rain gauges in the area, the high precipitation spread over a much larger region than the close vicinity of the cell. This is evidenced by the lower precipitation measured by the manual rain gauge at Nowy Jasiniec (23.3 mm), while the precipitation estimate increased here from 24.2 to 31.0 mm.
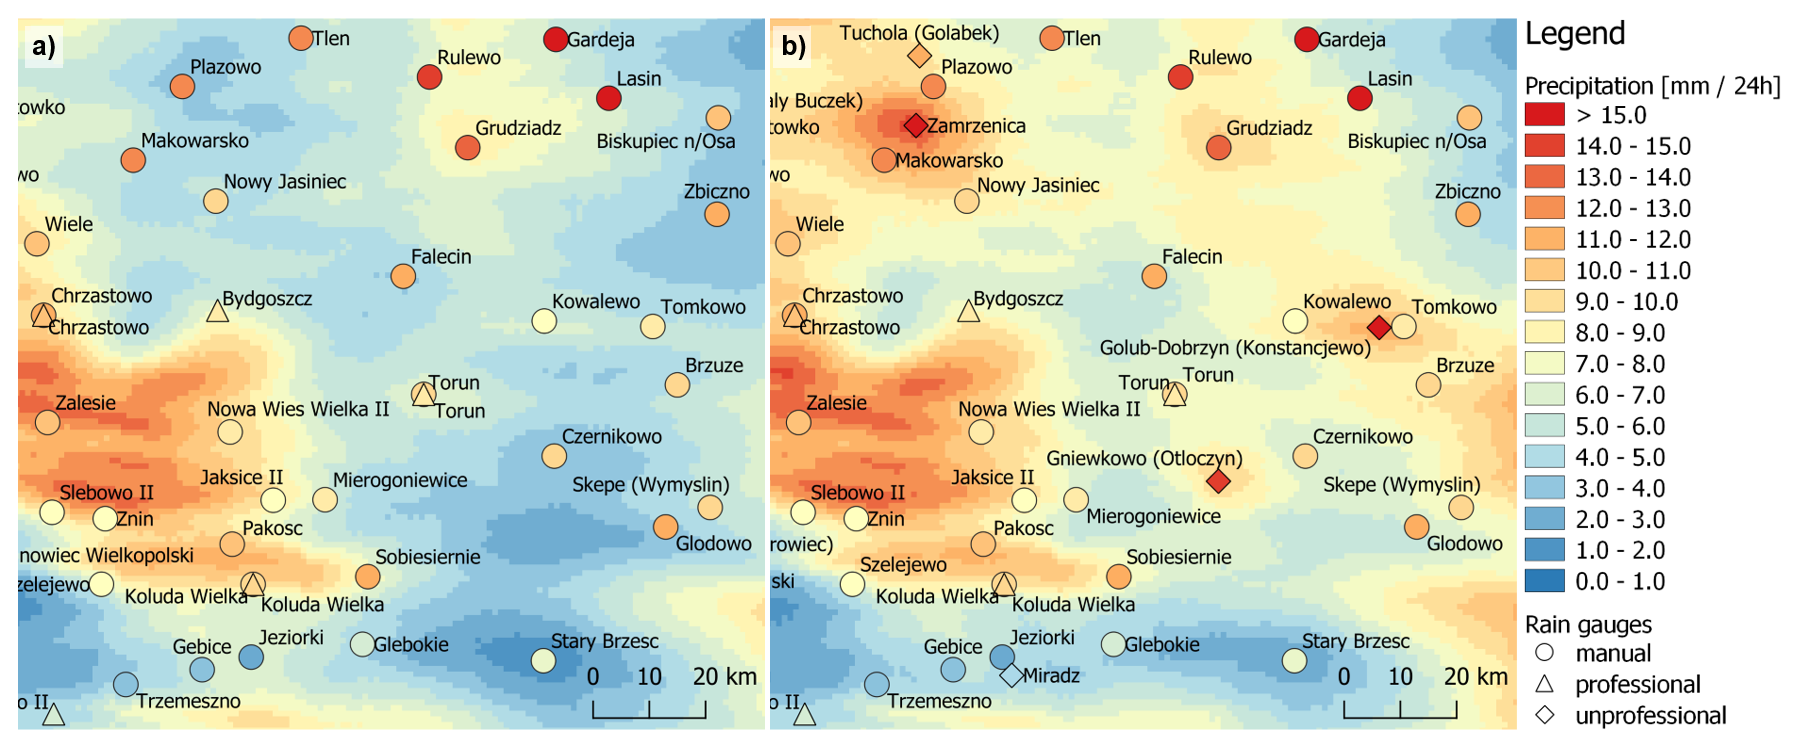
Figure 7Precipitation maps of multi-source RainGRS estimates from (a) professional and (b) professional and non-professional data. The symbols are filled with colours that correspond to the precipitation values measured by each rain gauge. A fragment of Poland with 24 h accumulations from 3 January at 06:00 UTC to 4 January 2024 at 06:00 UTC.
Closest to the path of the cell was the Makowarsko manual rain gauge, which measured 46.8 mm. The multi-source estimate after including the non-professional rain gauge increased from 37.8 to 47.1 mm, which is in very good agreement with the reference value. The precipitation estimate at the Płazowo manual rain gauge location also increased: from 22.4 to 33.5 mm, while this rain gauge measured 29.2 mm. The increase in estimates was therefore too high, but nevertheless, after data from non-professional rain gauges were added to the estimate, it was closer to the measurement from the reference rain gauge. The highest value of 68.5 was measured by the Tleń manual rain gauge, but the incorporation of the non-professional data only slightly improved the highly underestimated estimate from 31.5 to 33.7 mm.
4.5.2 Case study 2: winter stratiform precipitation (3–4 January 2024)
At the beginning of January 2024, Poland was in the range of low-pressure systems moving from west to east and associated atmospheric fronts. Rainfall and sleet were observed, with snowfall in the north-east of the country and in the mountains in the south. In the north and centre, there was also freezing rain, causing glaze. The example shown in Fig. 7 relates to a lowland area in central Poland, like in the first case study, but here there was stratiform precipitation, which was significantly lower but to a greater extent, as is typical for winter.
The RainGRS precipitation field estimation generated values that were underestimated compared to the manual rain gauge measurements: the estimated values were lower by 3.2 mm on average, while their daily accumulation averaged 9.5 mm at the locations of these rain gauges. This is mainly due to the underestimation of weather radar and, to a lesser extent, telemetric measurements.
The inclusion of data from non-professional rain gauges, despite their small number, increased the RainGRS estimate at manual rain gauge locations by an average of 1.3 mm. For example, it can be seen that the Zamrzenica non-professional rain gauge had a positive effect on the estimated daily precipitation accumulation (RainGRS) at the manual rain gauge located in Płazowo, where 12.1 mm was measured, and the estimates with and without the incorporation of non-professional data were 9.5 and 3.3 mm, respectively.
The impact of the Miradz non-professional rain gauge was slightly different. It measured a value of 3.1 mm and caused the estimates at the location of the two closest manual rain gauges to decrease at Jeziorki from 6.7 to 4.7 mm and at Gębice from 6.0 to 4.9 mm, approaching the values from the manual rain gauges of 1.7 and 3.0 mm, respectively. On the other hand, the influence of Miradz appeared to negatively affect the estimates at the manual rain gauge locations of Kołuda Wielka and Szelejewo, where values that had been underestimated compared to the reference rainfall were lowered even further.
The analysis of the two case studies indicates that data from non-professional rain gauges, despite their generally higher uncertainty, can positively contribute to estimating the precipitation field in many cases.
Data from non-professional rain gauge networks, as an additional source of precipitation data, increase the density of available rain gauge networks. In consequence they can improve precipitation field estimates at high spatial resolution and can be very helpful to NHMS for various meteorological and hydrological applications. However, advanced data quality control systems are required to make these data useful for operational applications. At the same time, it should be possible to objectively quantify the uncertainty associated with each individual measurement.
The RainGaugeQC system, applied to quality control of rain gauge data, was redesigned in order to adapt it to different rain gauge networks supervised to various degrees. In a modified version of the TCC algorithm, more sophisticated data control was developed by applying weather radar data and taking into account various aspects of data quality, such as consistency analysis of data time series. The new BC algorithm was introduced to detect bias of rain gauge measurements comparing rain gauge and radar long-term accumulations. In the SCC algorithm, significant modifications have been made to quantify the quality index reduction for outliers on the basis of the spatial variability of the precipitation field derived from the radar data. The performance of the modified system was verified based on independent measurement data from manual rain gauges, which are considered one of the most accurate measurement instruments. The influence of incorporating non-professional precipitation data on the reliability of multi-source precipitation estimates generated by the RainGRS system was also analysed.
The main conclusions derived from the analyses carried out in this study can be summarized as follows:
-
The incorporation of data from non-professional stations into professional rain gauge data, even if they are of poorer quality (Fig. 4), nevertheless improves the reliability of the estimated multi-source precipitation field (Table 3) but on the condition that advanced quality control is carried out.
-
Despite the quality control performed, the influence of individual rain gauges on the precipitation field estimates may sometimes not be positive, as can be seen from the examples shown in Sect. 4.5. Furthermore, the same rain gauge may have a different influence, positive or negative, on an estimated precipitation field in various places.
-
An important benefit of including data from non-professional networks is the improvement in performance of individual QC algorithms. This is especially true for the spatial consistency check (SCC), in which the density of a rain gauge network is crucial.
The development of the quality control system for telemetric rain gauge measurements will be continued. Plans include incorporating precipitation data from other non-professional networks to supplement the IMGW rain gauge network. This will increase the proportion of data with potentially lower reliability, which may require even more sophisticated algorithms for the quality control. Moreover, IMGW is in the process of establishing a network of personal rain gauges. Once this network is operational, it will be possible to test the quality control algorithms proposed in this paper using data from these rain gauges.
The data processing codes are protected through the economic property rights to the software and are not available for distribution. The codes used for processing follow the methodologies and equations described herein.
Out of the data used in this article, the following are publicly available. IMGW rain gauge data in the form of 10 min accumulations: https://danepubliczne.imgw.pl/pl/datastore?product=Meteo (IMGW-PIB, 2024a); tabs: “Dane archiwalne”/”Dane meteorologiczne”/“year”/“Meteo_year-month.zip”/“B00608S_year_month.csv” (B00608S is the code for the 10 min rainfall parameter). Radar data as 1 h files of precipitation accumulation (PAC) maps: https://danepubliczne.imgw.pl/pl/datastore?product=COMPO_PAC.comp.pac (IMGW-PIB, 2024b); tabs: “Dane archiwalne”/“Mapa zbiorcza sumy opadów za godzinę.”/“year”/“month”/COMPO_PAC.comp.pac_year-month-day.tar. Other data used in this article are available upon request, provided they are not restricted by the producer.
KO, JS, and AJ designed algorithms of the RainGaugeQC system. KO developed the software code and performed the simulations. JS, KO, AJ, and AK prepared the paper. JS made figures. AK carried out statistical calculations.
The contact author has declared that none of the authors has any competing interests.
Publisher’s note: Copernicus Publications remains neutral with regard to jurisdictional claims made in the text, published maps, institutional affiliations, or any other geographical representation in this paper. While Copernicus Publications makes every effort to include appropriate place names, the final responsibility lies with the authors.
The work described in this paper was carried out primarily within the COSMO consortium (Consortium for Small-scale Modelling) as Priority Task EPOCS, “Evaluate Personal Weather Station and Opportunistic Sensor Data Crowdsourcing”, during the period 2023–2024.
This paper was edited by Marloes Penning de Vries and reviewed by two anonymous referees.
Alerskans, E., Lussana, C., Nipen, T. N., and Seierstad, I. A.: Optimizing Spatial Quality Control for a Dense Network of Meteorological Stations, J. Atmos. Ocean. Tech., 39, 973–984, https://doi.org/10.1175/JTECH-D-21-0184.1, 2022.
Bárdossy, A., Seidel, J., and El Hachem, A.: The use of personal weather station observations to improve precipitation estimation and interpolation, Hydrol. Earth Syst. Sci., 25, 583–601, https://doi.org/10.5194/hess-25-583-2021, 2021.
Båserud, L., Lussana, C., Nipen, T. N., Seierstad, I. A., Oram, L., and Aspelien, T.: TITAN automatic spatial quality control of meteorological in-situ observations, Adv. Sci. Res., 17, 153–163, https://doi.org/10.5194/asr-17-153-2020, 2020.
Bell, S., Cornford, D., and Bastin, L.: How good are citizen weather stations? Addressing a biased opinion, Weather, 70, 75–84, https://doi.org/10.1002/wea.2316, 2015.
Berndt, C. and Haberlandt, U.: Spatial interpolation of climate variables in Northern Germany –Influence of temporal resolution and network density, J. Hydrol., 15, 184–202, https://doi.org/10.1016/j.ejrh.2018.02.002, 2018.
Chwala, C. and Kunstmann, H.: Commercial microwave link networks for rainfall observation: assessment of the current status and future challenges, Wiley Interdisciplinary Reviews: Water, 6, e1337, https://doi.org/10.1002/wat2.1337, 2019.
Colli, M., Lanza, L. G., La Barbera, P., and Chan, P. W.: Measurement accuracy of weighing and tipping-bucket rainfall intensity gauges under dynamic laboratory testing, Atmos. Res., 144, 186–194, https://doi.org/10.1016/j.atmosres.2013.08.007, 2014.
de Vos, L., Leijnse, H., Overeem, A., and Uijlenhoet, R.: The potential of urban rainfall monitoring with crowdsourced automatic weather stations in Amsterdam, Hydrol. Earth Syst. Sci., 21, 765–777, https://doi.org/10.5194/hess-21-765-2017, 2017.
de Vos, L. W., Leijnse, H., Overeem, A., and Uijlenhoet, R.: Quality control for crowdsourced personal weather stations to enable operational rainfall monitoring, Geophys. Res. Lett., 46, 8820–8829, https://doi.org/10.1029/2019GL083731, 2019.
Droździoł, R. and Absalon, D.: Evaluation of selected amateur rain gauges with Hellmann rain gauge measurements, Climate, 11, 107, https://doi.org/10.3390/cli11050107, 2023.
Garcia-Marti, I., Overeem, A., Noteboom, J. W., de Vos, L., de Haij, M., and Whan, K.: From proof-of-concept to proof-of-value: Approaching third-party data to operational workflows of national meteorological services, Int. J. Climatol., 43, 275–292, https://doi.org/10.1002/joc.7757, 2023.
Graf, M., El Hachem, A., Eisele, M., Seidel, J., Chwala, C., Kunstmann, H., and Bárdossy, A.: Rainfall estimates from opportunistic sensors in Germany across spatio-temporal scales, J. Hydrol., 37, 100883, https://doi.org/10.1016/j.ejrh.2021.100883, 2021.
Hahn, C., Garcia-Marti, I., Sugier, J., Emsley, F., Beaulant, A.-L., Oram, L., Strandberg, E., Lindgren, E., Sunter, M., and Ziska, F.: Observations from Personal Weather Stations – EUMETNET Interests and Experience, Climate, 10, 192, https://doi.org/10.3390/cli10120192, 2022.
Haselow, L., Meissner, R., Rupp, H., and Miegel, K.: Evaluation of precipitation measurements methods under field conditions during a summer season: A comparison of the standard rain gauge with a weighable lysimeter and a piezoelectric precipitation sensor, J. Hydrol., 575, 537–543, https://doi.org/10.1016/j.jhydrol.2019.05.065, 2019.
Hoffmann, M., Schwartengräber, R., Wessolek, W., and Peters, A.: Comparison of simple rain gauge measurements with precision lysimeter data, Atmos. Res., 174–175, 120–123, https://doi.org/10.1016/j.atmosres.2016.01.016, 2016.
Hohmann, C., Kirchengast, G., O, S., Rieger, W., and Foelsche, U.: Small catchment runoff sensitivity to station density and spatial interpolation: hydrological modeling of heavy rainfall using a dense rain gauge network, Water, 13, 1381, https://doi.org/10.3390/w13101381, 2021.
Horita, F. E. A., Vilela, R. B., Martins, R. G., Bressiani, D. A., Palma, G., and Porto de Albuquerque, J.: Determining flooded areas using crowd sensing data and weather radar precipitation: a case study in Brazil, in: ISCRAM 2018, Rochester, NY, USA, 20–23 May 2018, Proceedings of the 15th ISCRAM Conference – Rochester, NY, USA May 2018, 1040–1050, ISBN 9780692127605, 2018.
IMGW-PIB: Dane publiczne, https://danepubliczne.imgw.pl/pl/datastore?product=Meteo (last access: 7 July 2025), 2024a.
IMGW-PIB: Dane publiczne, https://danepubliczne.imgw.pl/pl/datastore?product=COMPO_PAC.comp.pac (last access: 7 July 2025), 2024b.
Jurczyk, A., Szturc, J., and Ośródka, K.: Quality-based compositing of weather radar QPE estimates, Meteorol. Appl., 27, e1812, https://doi.org/10.1002/met.1812, 2020a.
Jurczyk, A., Szturc, J., Otop, I., Ośródka, K., and Struzik, P.: Quality-based combination of multi-source precipitation data, Remote Sens., 12, 1709, https://doi.org/10.3390/rs12111709, 2020b.
Jurczyk, A., Ośródka, K., Szturc, J., Pasierb, M., and Kurcz, A.: Long-term multi-source precipitation estimation with high resolution (RainGRS Clim), Atmos. Meas. Tech., 16, 4067–4079, https://doi.org/10.5194/amt-16-4067-2023, 2023.
Krennert, T., Pistotnik, G., Kaltenberger, R., and Csekits, C.: Crowdsourcing of weather observations at national meteorological and hydrological services in Europe, Adv. Sci. Res., 15, 71–76, https://doi.org/10.5194/asr-15-71-2018, 2018.
Lanza, L. G. and Vuerich, E.: The WMO Field Intercomparison of Rain Intensity Gauges, Atmos. Res., 94, 534–543, https://doi.org/10.1016/j.atmosres.2009.06.012, 2009.
Loritz, R., Hrachowitz, M., Neuper, M., and Zehe, E.: The role and value of distributed precipitation data in hydrological models, Hydrol. Earth Syst. Sci., 25, 147–167, https://doi.org/10.5194/hess-25-147-2021, 2021.
McKee, J. L. and Binns, A. D.: A review of gauge–radar merging methods for quantitative precipitation estimation in hydrology, Can. Water Resour. J., 41, 186–203, https://doi.org/10.1080/07011784.2015.1064786, 2016.
Muller, C. L., Chapman, L., Johnston, S., Kidd, C., Illingworth, S., Foody G., Overeem, A., and Lei, R. R.: Crowdsourcing for climate and atmospheric sciences: current status and future potential, Int. J. Climatol., 35, 3185–3203, https://doi.org/10.1002/joc.4210, 2015.
Nipen, T. N., Seierstad, I. A., Lussana, C., Kristiansen, J., and Hov, Ø.: Adopting citizen observations in operational weather prediction, B. Am. Meteor. Soc., 101, E43–E47, https://doi.org/10.1175/BAMS-D-18-0237.1, 2020.
Ośródka, K. and Szturc, J.: Improvement in algorithms for quality control of weather radar data (RADVOL-QC system), Atmos. Meas. Tech., 15, 261–277, https://doi.org/10.5194/amt-15-261-2022, 2022.
Ośródka, K., Szturc J., and Jurczyk A.: Chain of data quality algorithms for 3-D single-polarization radar reflectivity (RADVOL-QC system), Meteorol. Appl., 21, 256–270, https://doi.org/10.1002/met.1323, 2014.
Ośródka, K., Otop, I., and Szturc, J.: Automatic quality control of telemetric rain gauge data providing quantitative quality information (RainGaugeQC), Atmos. Meas. Tech., 15, 5581–5597, https://doi.org/10.5194/amt-15-5581-2022, 2022.
Overeem, A., Leijnse, H., van der Schrier, G., van den Besselaar, E., Garcia-Marti, I., and de Vos, L. W.: Merging with crowdsourced rain gauge data improves pan-European radar precipitation estimates, Hydrol. Earth Syst. Sci., 28, 649–668, https://doi.org/10.5194/hess-28-649-2024, 2024.
Pasierb, M., Bałdysz, Z., Szturc, J., Nykiel, G., Jurczyk, A., Osródka, K., Figurski, M., Wojtczak, M., and Wojtkowski, C.: Application of commercial microwave links (CMLs) attenuation for quantitative estimation of precipitation, Meteorol. Appl., 31, e2218, https://doi.org/10.1002/met.2218, 2024.
Polz, J., Chwala, C., Graf, M., and Kunstmann, H.: Rain event detection in commercial microwave link attenuation data using convolutional neural networks, Atmos. Meas. Tech., 13, 3835–3853, https://doi.org/10.5194/amt-13-3835-2020, 2020.
Schnepper, T., Groh, J., Gerke, H. H., Reichert, B., and Pütz, T.: Evaluation of precipitation measurement methods using data from a precision lysimeter network, Hydrol. Earth Syst. Sci., 27, 3265–3292, https://doi.org/10.5194/hess-27-3265-2023, 2023.
Segovia-Cardozo, D. A., Rodríguez-Sinobas, L., Díez-Herrero, A., Zubelzu, S., and Canales-Ide, F.: Understanding the Mechanical Biases of Tipping-Bucket Rain Gauges: A Semi-Analytical Calibration Approach, Water, 13, 2285, https://doi.org/10.3390/w13162285, 2021.
Sha, Y., Gagne II, D. J., West, G., and Stull, R.: Deep-Learning-Based Precipitation Observation Quality Control, J. Atmos. Ocean. Tech., 38, 1075–1091, https://doi.org/10.1175/JTECH-D-20-0081.1, 2021.
Sinclair, S. and Pegram, G.: Combining radar and rain gauge rainfall estimates using conditional merging, Atmos. Sci. Lett., 6, 19–22, https://doi.org/10.1002/asl.85, 2005.
Sokol, Z., Szturc, J., Orellana-Alvear, J., Popová, J., Jurczyk, A., and Célleri, R.: The role of weather radar in rainfall estimation and its application in meteorological and hydrological modelling – A review, Remote Sens., 13, 351, https://doi.org/10.3390/rs13030351, 2021.
Szturc, J., Jurczyk, A., Ośródka, K., Wyszogrodzki, A., and Giszterowicz, M.: Precipitation estimation and nowcasting at IMGW (SEiNO system), Meteorology Hydrology and Water Management, 6, 3–12, https://doi.org/10.26491/mhwm/76120, 2018.
Szturc, J., Ośródka, K., Jurczyk, A., Otop, I., Linkowska, J., Bochenek, B., and Pasierb, M.: Quality control and verification of precipitation observations, estimates, and forecasts, in: Precipitation Science. Measurement, Remote Sensing, Microphysics and Modeling, edited by: Michaelides, S., Elsevier, 91–133, https://doi.org/10.1016/B978-0-12-822973-6.00002-0, 2022.
Urban, G. and Strug, K.: Evaluation of precipitation measurements obtained from different types of rain gauges, Meteorol. Z., 30, 445–463, https://doi.org/10.1127/metz/2021/1084, 2021.
Urban, G., Kowalewski, M. K., Sawicki, J., and Borowiecki, K.: Assessment of the quality of measurements from selected amateur rain gauges, Meteorol. Z., 33, 159–174, https://doi.org/10.1127/metz/2024/1199, 2024.
van Andel, N.: Quality control development for near real-time rain gauge networks for operational rainfall monitoring, Master Thesis, Faculty of Physics, Utrecht University, Utrecht, https://studenttheses.uu.nl/handle/20.500.12932/40939, 2021.
Villalobos-Herrera, R., Blenkinsop, S., Guerreiro, S. B., O'Hara, T., and Fowler, H. J.: Sub-hourly resolution quality control of rain gauge data significantly improves regional sub-daily return level estimates, Q. J. Roy. Meteor. Soc., 148, 3252–3271, https://doi.org/10.1002/qj.4357, 2022.
WMO-No. 488: Guide on the Global Observing System, World Meteorological Organization, updated in 2017, Geneva, 215 pp., ISBN 978-92-63-10488-5, 2015.
WMO-No. 1257: Guide to Operational Weather Radar Best Practices. Volume VI: Weather Radar Data Processing, World Meteorological Organization, Geneva, provisional edition, 166 pp., https://community.wmo.int/en/activity-areas/imop/new-provisional-2024-edition-guide-operational-weather-radar-best-practices (last access: 7 July 2025), 2024.
Wood, S. J., Jones, D. A., and Moore, R. J.: Accuracy of rainfall measurement for scales of hydrological interest, Hydrol. Earth Syst. Sci., 4, 531–543, https://doi.org/10.5194/hess-4-531-2000, 2000.
Yan, Q., Zhang, B., Jiang, Y., Liu, Y., Yang, B., and Wang, H.: Quality control of hourly rain gauge data based on radar and satellite multi-source data, J. Hydroinform., 26, 1042–1058, https://doi.org/10.2166/hydro.2024.272, 2024.
Yousefi, K. P., Yilmaz, M. T., Öztürk, K., Yucel, I., and Yilmaz, K. Y.: Time-independent bias correction methods compared with gauge adjustment methods in improving radar-based precipitation estimates, Hydrolog. Sci. J., 68, 1963–1983, https://doi.org/10.1080/02626667.2023.2248108, 2023.
Zhang, Y., Ren, Y., Ren, G., and Wang G.: Bias Correction of Gauge Data and its Effect on Precipitation Climatology over Mainland China, J. Appl. Meteorol. Clim., 58, 2177–2196, https://doi.org/10.1175/JAMC-D-19-0049.1, 2019.
Zheng, F., Tao, R., Maier, H. R., See, L., Savic, D., Zhang, T., Chen, Q., Assumpção, T. A., Yang, P., Heidari, B., Rieckermann, J., Minsker, B., Bi, W., Cai, X., Solomatine, D., and Popescu, I.: Crowdsourcing methods for data collection in geophysics: State of the art, issues, and future directions, Rev. Geophys., 56, 698–740, https://doi.org/10.1029/2018RG000616, 2018.
- Abstract
- Introduction
- Precipitation data
- RainGaugeQC system for QC of rain gauge data
- Analysis of the RainGaugeQC system performance on non-professional data
- Conclusions
- Code availability
- Data availability
- Author contributions
- Competing interests
- Disclaimer
- Acknowledgements
- Review statement
- References