the Creative Commons Attribution 4.0 License.
the Creative Commons Attribution 4.0 License.
Enhanced quantitative precipitation estimation through the opportunistic use of Ku TV-SAT links via a dual-channel procedure
Louise Gelbart
Laurent Barthès
François Mercier-Tigrine
Aymeric Chazottes
Cécile Mallet
Earth–satellite microwave links such as TV-SAT can help for rainfall monitoring and could be a complement or an alternative to ground-based weather radars, rain gauges or Earth observation satellites. Rain-induced attenuation which is harmful for telecommunication is exploited here as an opportunistic way to estimate rain rate along the link path. This technique provides rain measurements at a fine temporal resolution (a few tens of seconds) and with a spatial resolution of a few kilometres, which is a good compromise for human activities such as civil security (watershed monitoring, flash flood), agriculture or transport. The advantages of this technique include the low cost of the equipment used, as well as the cost of on-site maintenance. However, the measured attenuation does not directly provide rain intensity, requiring the estimation of additional parameters. These include the contribution of natural radiation from the atmosphere. In this paper, we detail a theoretical framework allowing us to estimate rainfall from the measurements of a low-cost sensor operating simultaneously over two parts of the Ku frequency band. This framework is assessed in a densely instrumented area in the south of France, where very good results are obtained when compared to rain gauge measurements, in terms of both overall rain accumulation and rainfall rate distribution. Then we apply this dual-channel method in Côte d'Ivoire, in the metropolitan area of Abidjan, where such an approach is very promising. It is shown that this technique when compared to rain gauge measurements gives far better results than a naive single-channel approach neglecting the natural radiation of atmosphere but that significant errors remain in rainfall assessment, leading to a persistent underestimation of rain accumulation. Finally we discuss various effects that could lead to this remaining underestimation, opening the door for further studies.
- Article
(5217 KB) - Full-text XML
- BibTeX
- EndNote
Accurately measuring rainfall intensity is crucial for understanding the water cycle, mitigating human and property damage, and managing water resources. Traditional techniques for rainfall measurement include weather radars, rain gauges, disdrometers and Earth observation satellites. While satellites can be used to monitor precipitation on a global scale, they require a low Earth orbit to achieve a resolution of a few kilometres, resulting in a low revisit time (typically 3 h average revisit time) compared to rainfall dynamics for which a few tens of minutes are required, especially in convective situations. Ground-based weather radars cover smaller areas with higher revisit times but are costly to implement and maintain, while rain gauges offer point observations and require dense networks to properly capture spatial variability, making deployment and maintenance complex and expensive, especially in difficult terrain.
Horizontal microwave telecommunication links such as cellular network stations have been widely studied for rainfall estimation (Messer et al., 2006; Goldshtein et al., 2009; Overeem and Uijlenhoet, 2016), notably in West Africa (Gosset et al., 2016; Turko et al., 2021) where such techniques are promising because few radars are available despite regular extreme rainfall and flooding events. However, they may face operational constraints (Chwala and Kunstmann, 2019; Polz et al., 2023) limiting their use, such as poor temporal resolution, coarse measurement levels or difficulties in accessing data owned by telecom operators. In addition, their deployment can be limited, particularly in rural areas. Geostationary satellites, and TV-SAT satellites in particular, offer continuous downlink microwave sources covering most continents. TV-SAT broadcasts mainly use frequencies between 10.7 and 12.7 GHz (Ku-band), which are affected by absorption and scattering phenomena during rainy episodes (Barthès and Mallet, 2013; Colli et al., 2018; Giannetti et al., 2019). These phenomena lead to attenuation of the wave along the radio link, thus reducing the power received by a ground-based station. The presence of rain on the path has a double effect: it attenuates the microwave signal from the satellite, as mentioned above, but it also increases the atmospheric emission through natural radiation from particles in the atmosphere (particularly raindrops) and hence the noise picked up by the receiving antenna. As a result, the received signal is a mixture of the satellite signal and background noise, which varies with atmospheric conditions. In the presence of light rain and strong satellite signal, the signal received from the satellite is much greater than that of the natural atmospheric radiation. Under this condition, the latter can be neglected and rain-induced attenuation can be easily deduced by the difference between the signal received during rainy episodes and the baseline signal measured during dry periods. In the presence of a high rainfall rates, the signal from the satellite decreases substantially (10 dB or more) while atmospheric noise increases, and the previous assumption is no longer valid, leading to an underestimation of rain-induced attenuation and, consequently, to an underestimation of the rainfall rate.
This study aims to enhance rainfall estimation by using dual-channel measurements of TV satellite signals to account for background noise. This study follows that of Mercier-Tigrine et al. (2023), which introduced the sensor used for this study and the theoretical framework detailed in the current paper. The objectives of this study are therefore to detail this theoretical framework and the assumptions it relies on, to validate it in a densely instrumented context in France, and then to study its applicability in Côte d'Ivoire in an operational context. We will also highlight the multiple sources of errors and inaccuracies inherent to rainfall estimation using Earth–satellite links.
Section 2 introduces the physical principles and defines the method used to estimate the transmissivity of rain by means of a dual-channel measurement. This section also presents the different sources of error to consider. In particular, we focus on a practical problem related to dual-channel measurement using a physical device whose characteristics may differ significantly depending on the channel used. Section 3 presents the dataset from two measurement campaigns, while Sect. 4 details the calibration procedures and the obtained results. Finally, we discuss in the last section the relative contribution of the different sources of errors and possible improvements.
This section specifies the physical context and the inversion method proposed for precipitation estimation from Earth–satellite links. The Ku receiver used in this study (hereafter Ku device) is similar to a low-cost total power microwave radiometer (TPR) in which an antenna collects natural radiation emitted by atmospheric particle within a specific microwave band. This electromagnetic radiation is then amplified and filtered. The total power PTot(t) measured at the device's output therefore includes the power received from the TV satellite Psat(t); the power of natural radiation Patm(t) from atmospheric particles, including rain droplet radiations; and the power of the sensor noise PN.
The variations in the signal received from the geostationary satellites PSat(t) are linked both to the signal emitted by the satellite PE(t) and to atmospheric transmissivity tatm(t), while the variation in the natural radiation is linked to the antenna radiation temperature TA. Additionally, the sensor noise PN varies with temperature and, therefore, with time. However, these variations are slow compared to the dynamics of the atmosphere. In this study, the sensor noise is considered constant despite its potential slow variation with the physical temperature of the sensor. The influence of TN is discussed in Sect. 4. Hence the total power can be expressed as follows:
where PE is satellite transmitter power (W), GE is the gain of the satellite antenna, GR is the gain of the Ku device antenna, Gi is the gain of the low-noise block converter (LNB) of the receiver for a given frequency band denoted i (for instance lower or upper Ku-band), is the free-space path loss (d: distance between the satellite and receiver (m); λ: wavelength (m)), tatm is the atmospheric transmissivity, TA is the antenna radiation temperature (K), is the Boltzmann constant (J K−1), B is the channel bandwidth of the Ku device (Hz), and is the noise temperature of the receiver for a given frequency band denoted i (K).
In the above equation, lFSPL and B are constants and the gains GE, GR and Gi are assumed to be constant over time. Furthermore, in this study we assume that tatm(t) and TA(t) do not vary significantly over the frequency band used (11 and 12 GHz) and can therefore be considered independent of frequency (Barthes et al., 2003). In Eq. (2) the atmospheric transmittivity tatm can be expressed as
in which tR is the transmittivity induced by rain droplets (tR=1 in non-rainy situations), and t0 is the transmittivity induced by other atmospheric components. The objective is to estimate the rain transmittivity tR to assess precipitation from the measurement of PTot.
The following section shows how Tatm and TA vary with precipitation, the latter having a twofold influence on the terms of Eq. (1) (see also Giannetti and Reggiannini, 2021, on this subject):
-
it reduces tR and hence the total transmissivity of the atmosphere tatm leading to a decrease in the received signal Psat(t);
-
simultaneously it increases the antenna radiation temperature TA resulting in an augmentation of the received signal Patm(t).
2.1 Atmospheric transmissivity tatm
Atmospheric transparency is influenced by various processes that affect the propagation of microwave signals along the satellite link. The total atmospheric absorption coefficient for frequency f at height z and time t consists of contributions from atmospheric gases, clouds and precipitation. From a zenith angle θ smaller than 70° (which is our case), a spherically stratified atmosphere can be approximated by a planar atmosphere. The optical depth τ of the atmosphere between ground altitude 0 and z is given by Mallet and Lavergnat (1992) (in Np):
and
where kR denotes the contribution of precipitation and k0 the other contributions (gases and clouds). The atmospheric transmissivity for the entire atmosphere is defined by
In decibels, the total atmospheric loss factor denoted is called atmospheric attenuation:
where AR(t) is the rain attenuation, and A0(t) is the other contributions.
Finally, rainfall reduces tR, thereby increasing rain attenuation AR and reducing the total atmospheric transmissivity tatm.
2.2 Antenna radiation temperature TA
In a non-scattering environment, a blackbody at a non-zero temperature T radiates in the microwave region electromagnetic energy at frequency f given by the brightness intensity , with k the Boltzmann's constant and c the velocity of light. This relation can be generalised to a non-blackbody environment as , in which TB defines the brightness temperature of the non-blackbody. By integrating over frequencies, these relations allow us to deduce the power P received in a bandwidth B by an antenna in a perfectly absorbing and emitting chamber as P=kBTB.
One can note that for a non-blackbody environment brightness intensity If is lower than that of the blackbody (If<Bbbf), and thus TB is lower than the physical temperature T. Assuming a plane-parallel atmosphere, the antenna radiation temperature TA is given by Ulaby et al. (1981):
Here TB is the brightness temperature of the atmosphere, TG the physical ground temperature, e ground emissivity and ν the fraction of the antenna's radiation pattern directed towards the atmosphere.
Practically antennas and receivers are not lossless. Considering losses, we obtain
where T0 is the physical temperature of the receiving system and ν′ the radiation efficiency. For an ideal antenna and receiving system with , Eq. (8) reduces to .
In a non-scattering atmosphere, the sky brightness temperature TB(f,θ) measured at the ground surface is given by the radiative transfer equation (in K) (Ulaby et al., 1981; Chandrasekhar, 2013):
Here T(z) is the physical temperature at height z and Tc is the cosmic background temperature. It can also be written as
Tm is the effective temperature and depends on the atmospheric profile and the frequency. In the literature, Tm is generally fixed at around 280 K, but as shown in Fig. 1 in Barthes et al. (2003) the effective temperature depends on atmospheric profiles. For the considered frequencies, neglecting the scattering effects in favour of absorption is only valid in a very limited range of (low) rain rates. Scattering effects of rain droplets are considered in simulations (Barthes et al., 2003), where the brightness temperature is studied in relation to atmospheric attenuation for different precipitation rates, showcasing the variability in natural radiation in the atmosphere. Figure 1 shows the variation in the brightness temperature at 11 and 12 GHz as well as the increase in the induced atmospheric signal at the LNB output and the corresponding atmospheric attenuations for a homogeneous rain layer at different precipitation rates for a zenith angle of 45°. Rainfall thus leads to an increase in the antenna radiation temperature. For rainfall rates exceeding approximately 40 mm h−1, a saturation of Patm is clearly observed while the attenuation continues to increase. This occurs as the optical depth (Eq. 4) of the lower layers increases, causing a significant attenuation of radiation from the upper layers of the atmosphere.
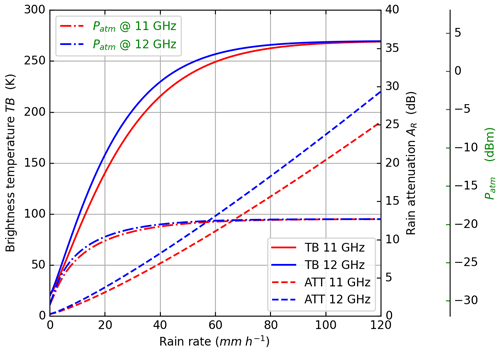
Figure 1Simulated sky brightness temperature TB (solid lines), atmospheric-induced power Patm at the LNB output (dashed–dotted lines) and atmospheric attenuation (dashed lines) at 11 and 12 GHz for a zenith angle of 45°, with a zero isotherm at 3 km as a function of rain rate for a standard commercial TV-SAT LNB (1 GHz bandwidth, 65 dB gain).
2.3 Dual-channel retrieval of rain transmissivity and the underlying hypotheses
In this study, the rain attenuation is derived using two channels, denoted A and B. These two channels are typically characterised by the use of two different frequencies or polarisations. To quantify the impact of rain on the received signal, we use the ratio of the differences of the received power between the two channels in rainy situations ( and ) to the differences observed in non-rainy situations (just before and/or after the rain event, and ). Our experience has shown that it is necessary to define two different gains GA and GB for each channel of the low-cost LNB, as they can be different from one channel to another. This is especially true if one channel is in the lower TV-SAT band (10.7–11.7 GHz) and the other in the upper TV-SAT band (11.7–12.7 GHz). These assumptions coupled with Eq. (2) lead to Eq. (11).
Figure 1 shows that in clear-sky conditions, for the frequencies considered in the study, the frequency dependencies of t0 and are negligible. For an ideal LNB with GA=GB and and for sufficiently close A and B channel centre frequencies and , this equation reduces to tR.
Equation (12) allows the estimation of rain transmissivity (tR) and consequently the attenuation due to rain (AR) through Eqs. (3) and (6), given the knowledge of the reference level , also referred to as the baseline signal or clear-sky reference. Due to the high temporal variability of rain, exhibits distinct temporal characteristics depending on whether rain is present on the link. Thus, it becomes possible to identify rainy and non-rainy periods and hence to deduce . In this study a method similar to the method developed in Barthès and Mallet (2013) is used to separate rainy and non-rainy periods (see details in Sect. 3.2). As cannot be observed during rainy conditions, interpolation is performed between values of observed just before or just after the rain during non-rainy conditions (see Fig. A2 in the Results section for an illustrative case).
We list the different factors that affect the estimate of tR, so we list the various effects as follows.
-
Baseline estimation error. Rain/no rain detection errors can be caused by a number of factors, like changes in atmospheric composition (gases and clouds) during rain event. Estimating the baseline is more difficult in the case of slight signal attenuation, for example, during long stratiform events.
-
Dual frequency. Equation (12) shows that it is necessary to use two channels with different characteristics. Ideally, one should receive a standard satellite signal level (), while the other should be tuned to a channel where it mainly receives atmospheric radiation and no (or almost no) satellite signal (). This approach helps mitigate any dependency on frequency differences and ensures accurate estimations. This also implies that tR defined in Eq. (12) corresponds to of Eq. (11) without needing the approximation regarding the dependency of tR on frequency.
-
Saturation. The power received from natural radiation during heavy rain events reaches a limiting value (Fig. 1), known as saturation. This due to the fact that only the lower part of the atmosphere contributes to the signals received by both channels and therefore is not representative of the complete state of the atmosphere. At the same time, satellite signals tend to fade because the attenuation is strong, leading to increased error in the tR estimation.
-
Gain channel. In practice, due to the use of low-cost LNB the gains between the two channels could be slightly different. In this case Eq. (12) should not be used directly (see Sect. 4.1). We introduce the calibration parameter αG such that , also referred as . For further details on αG, its estimation and the associated calibration procedure, see Sect. 4.1.
2.4 Rain retrieval
The estimation of rain rate from rain attenuation AR is based on International Telecommunication Union Radiocommucation (ITU-R) recommendations. The following relationship between specific path attenuation γR and rain rate is given by ITU (2005) (in dB km−1):
where k and α are two coefficients depending on frequency, polarisation and elevation angle, and R is the rain rate (mm h−1). The total attenuation along the link of length L crossing the rainy zone is therefore (in decibels)
If the rain layer is assumed to be homogeneous vertically and horizontally, then Eq. (14) reduces to
This relationship makes it possible to estimate the rain rate from the rain attenuation. Several sources of uncertainty exist. In Eq. (13), the coefficients k and α depend also on the microphysics of rain (i.e. raindrop size distribution), particularly below 9 GHz. In our case (11–12 GHz) we can expect a slight dependence. Another source of error concerns the use of Eq. (15) instead of Eq. (14). Indeed, Eq. (15) is based on the assumption of a homogeneous rain layer both horizontally and vertically. In practice, this assumption may not necessarily hold, and corrections need to be applied to Eq. (15). Therefore, ITU (2017) introduces an equivalent rain cell through the use of a horizontal reduction factor and a vertical adjustment factor in the calculation of L. The same concept is applied in Mello and Pontes (2012), where the authors introduce the idea of an effective rain rate determined empirically. Their conclusion points to a notable enhancement compared to the ITU approach. In Lu et al. (2018), the authors developed a model based on exponential rain cell profiles, integrating a rain rate adjustment factor. This factor is then determined using the DBSG3 database. Their results reveal that this new model outperforms other existing models, including the ITU model, over various latitudes, frequencies and elevation angles. For the numerical application, the T-matrix method (Mishchenko et al., 1996; Kait, 2019) is used to calculate the coefficients (α and k). Input parameters of this approach include the temperature, defined as 10 °C (mean over the rain column); the drop size distribution model, chosen as the Marshall–Palmer parameterisation (Marshall and Palmer, 1948); the frequency; the polarisation; and the zenith angle between the ground sensor and the satellite.
The estimation of the effective rain height leads to another source of uncertainty. Indeed, effective rain height is more or less assimilated to the altitude H0 of the 0 °C isotherm. The ITU (2022) recommends increasing H0 by a few hundred metres (360 m) to consider the melting layer, which is supposed to provoke a linear attenuation larger than the liquid rain layer (Giannetti and Reggiannini, 2021). Because most ITU models are based on an annual database in the Northern Hemisphere, significant variability in H0 and the melting layer height are not taken into account particularly in tropical regions. In Das and Maitra (2011), the authors propose to model H0 in the Indian region as a decreasing function of the rain rate, while other studies have shown that “the effective rain height in the tropics could well be above the zero-degree isotherm liquid water” (see Green, 2004, Sect. 4.2 for more details). In the present study, the slant path length L is simply estimated by (in kilometres)
where H0 is the altitude of the 0° isotherm, HS the altitude of the ground sensor and θ the elevation angle of the ground–satellite link. It would be unreasonable to use a unique climatological freezing level height, especially in mid-latitudes where the mean freezing level ranges for instance in northern Italy from 1.5 km in January to 4 km in August (Giannetti et al., 2017). Using a seasonal average freezing level height would lead to large errors as well. For instance, the effective daily mean freezing level simulated by the ARPEGE model of Météo France (Bouyssel et al., 2022) in January 2023 in the area of Nice, south of France, ranges from 1.0 up to 3.1 km, with 11 d above 2.5 km and 9 d below 1.5 km. This variability leads us in this study to choose to use a dynamical freezing level height, determined from the vertical profiles of temperature simulated by the ARPEGE model and accessible in real time from Météo France through an application programming interface (API).
Finally, we take into consideration the wet antenna effect, which is a well-known issue in ground microwave links (Leijnse et al., 2008). Our conducted experiments have demonstrated that an attenuation due to wet antenna ranges from 0.1 to 0.8 dB. So in this work, we will apply a fixed correction of 0.2 dB to mitigate this effect while acknowledging the necessity for further research. This effect is particularly relevant for a light and cold rain (minimal attenuation), but when attenuations are measured for tropical rainfall (typically greater than 10 dB), the phenomenon becomes negligible. In addition, this problem can be solved at least partially by placing a protective cap over the horn.
3.1 Sensors and raw measurements
The sensors we use in this paper operate in the Ku frequency band and are developed by the company HD Rain (https://www.hd-rain.com/, last access: 13 January 2025) for commercial purposes.
Figure 2 shows a Ku sensor installed in the south of France. It is composed of a commercial dish able to retrieve and concentrate the signal on a low-noise block converter (LNB) connected through a coaxial cable to an electronic box measuring the power arriving from the satellite. The data are transmitted in real time to a server using a SIM card and a GSM antenna. The entire system is powered by a solar panel and lithium-ion battery, providing 10 d of operation on cloudy days. Each sensor sequentially measures the power (in dBm) in four different modes (four channels) every 15 s: two polarisations – vertical and horizontal – and two frequency bands – lower frequency (10.7–11.7 GHz) and upper frequency (11.7–12.75 GHz). The measurement is the total power received over this 1 GHz width frequency band. Some commercial TV satellites emit no signal through an entire frequency band or polarisation. In this scenario, the sensor behaves like a radiometer, capable of measuring atmospheric radiation.
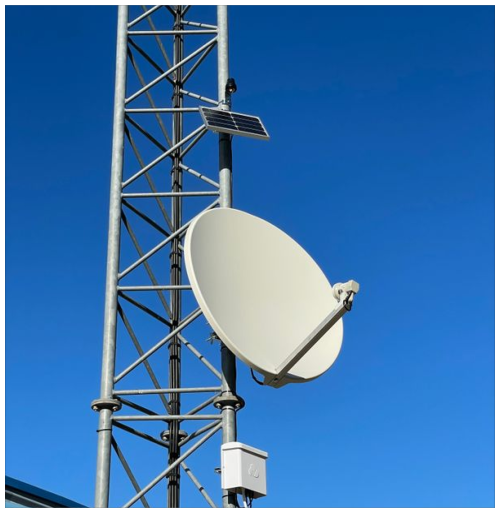
Figure 2Image of a sensor installed by HD Rain on a mast of a fire brigade building (commercial collaboration with the SDIS, the French departmental fire and rescue service) in the south of France.
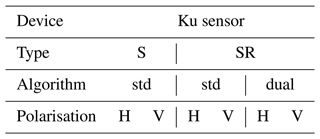
In this paper, these Ku sensors are identified by a number: Ku sensor no. x. Additionally, sensors can operate in different ways, summarised in Table 1. When the satellite targeted by the sensor emits a signal over all channels, we use Ku, S, where “Ku” signifies Ku sensor and “S” indicates that all four channels receive satellite signals. When two channels of one frequency band do not receive any signal, we use Ku, SR. The “R” refers to the channels without a signal that behave like radiometers. Moreover, two algorithms are used to retrieve rain rates from satellite signals (see Sect. 2). Firstly, the dual-channel method consists of applying Eq. (12). As seen in Sect. 2.3, this approach can be used exclusively for Ku, SR sensors because it is necessary to impose two channels having different characteristics, i.e. one mainly measuring the power received from a TV satellite and the other measuring atmospheric radiation. It will be referred to as “dual”. Secondly, the standard method currently employed for HD Rain's commercial products consists of applying Eq. (11) and neglecting atmospheric radiation components to directly calculate tr as . It will be called “std”. The two polarisations are named “H” for horizontal polarisation and “V” for vertical polarisation. When not specified, horizontal polarisation (H) is used. To name the rain gauges we use the following acronym: “RG”.
The results presented here come from such data from HD Rain Ku sensors (validation data) installed in Abidjan, Côte d'Ivoire, and Cadarache, France, compared with nearby rain gauges (reference data).
3.2 Data processing
The measurements made by the Ku sensors consist of power levels of signals received at the satellite dish. These signals are composed either of a satellite signal and a radiometric component or solely of a radiometric component. In any case, estimating signal variations due to rainfall from such raw signals requires determining a baseline, i.e. a signal level that would be measured in the absence of rain (see Eq. 12; this baseline is the component). This baseline estimation must be performed on both satellite (“S”) and radiometric (“SR”) signals. This baseline estimation challenge is common in the literature for both microwave links (Schleiss and Berne, 2010) and satellite measurements (Barthès and Mallet, 2013; Gianoglio et al., 2023). In this work, we employ a machine learning approach. The algorithm used is similar in its objectives to the one presented in Barthès and Mallet (2013) but in an improved version: the algorithm is a long short-term memory type (Hochreiter and Schmidhuber, 1997) taking 6 h of raw measurements as input and returning for each date a real number between 0 and 1 related to the probability that the given date is rainy. By applying a threshold to these values, we identify rainy periods and then assume that the baseline is a segment connecting the last measurement before the start of a rainy period to the first measurement following that rainy period.
However, physically inconsistent situations can occur. During strong rainy events, transmittance tends toward 0 because and tend to be equal, so attenuation tends towards infinity. To avoid physically impossible values or “NaN” (not a number), we define a threshold to force the transmittance not to go below this threshold value: if tR<0.005, then tR=0.005. It may also happen that the transmittance exceeds the value 1, in which case we force the result to 1.
3.3 Installation in Cadarache, France
In collaboration with the French Alternative Energies and Atomic Energy Commission (CEA), seven Ku sensors were installed in a 30 km zone in the south of France, in a Mediterranean climate, at the end of 2022. The group of Ku sensors is split into two groups in Fig. 3: three Ku, SR sensors (marked in red) aimed at the Eutelsat 5W (E5W) satellite, which does not transmit a signal on the upper frequency band (11.7–12.7 GHz), and four “S” sensors (marked in green) aimed at the Astra 19 satellite, which emits signals on all channels. Moreover six rain gauges, each recording data with a resolution of 1 h over a period of 2.5 months, from April to June 2023 (white points), are installed in the same area.
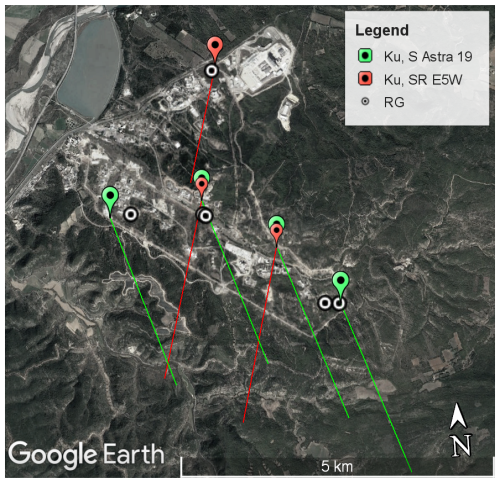
Figure 3Map displaying devices available within the CEA area. Ku sensors are differentiated by the satellite they target: Eutelsat 5W (red marker) and Astra 19 (yellow marker). The satellite link path is identified with coloured lines corresponding to the distance between the sensor and the 0° isotherm (here taken at 2000 m) in the satellite target. Additionally, 1 h resolution rain gauges are represented by points with an enclosed circle (© Google Earth Pro).
3.4 Installations in Abidjan, Côte d'Ivoire
The second area of interest is the metropolitan area of Abidjan in Côte d'Ivoire. About 156 Ku sensors were installed by HD Rain in this area (both in the city centre and in the eastward area in order to measure rainfall before it reaches Abidjan) in 2021 to produce real-time rain maps and nowcasts of the city. In this study, we will only focus on Ku sensors installed close to a rain gauge. To do so, two groups of rain gauges are available. The first group consists of a 1 d resolution rain gauge located at Abidjan airport, close to three Ku sensors (740 m). These data cover a period ranging from 230 to 470 d. Two Ku sensors target the satellite Eutelsat 36b, and the third Ku sensor targets the satellite SES 5. The beams of these satellites transmit in the upper frequency band of the Ku-band (11.75–12.75 GHz). No signal is emitted over the lower band, rendering this channel as a radiometer. The second group of rain gauges consists of four 30 min resolution rain gauges over a period of 84 d (from May to July, rainy season), strategically positioned in four different districts of Abidjan. Five Ku sensors targeting the satellite SES 5 and another six Ku sensors targeting the satellite Eutelsat 36b (E36b) are located close to these rain gauges. Figure 4 displays all the instruments: Ku sensors are distinguished by red and blue colours, corresponding to the targeted satellite, while rain gauges are represented in green (1 d resolution over an extended time period) or white (30 min resolution over a shorter time period).
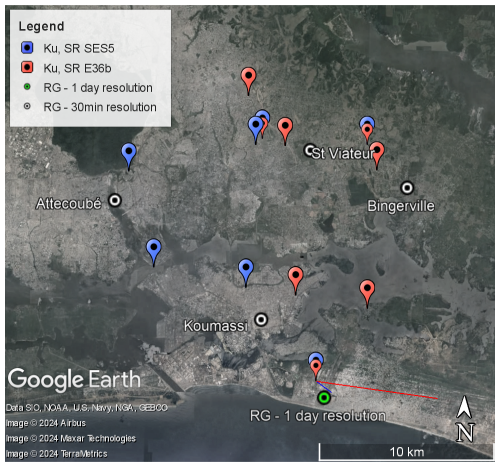
Figure 4Map of available devices in the Abidjan area. Ku sensors are coloured according to the satellite they target: E36b (red marker) and SES 5 (blue marker). The link path is identified by coloured lines corresponding to the distance between the sensor and the 0 °C isotherm (here taken to be 4500 m) in the satellite target (for legibility reasons, only two paths have been drawn as examples). Rain gauges are represented by points with an enclosed circle: in white for the four 30 min resolution rain gauges and in green for the Abidjan airport rain gauge at 1 d resolution (© Google Earth Pro).
This section is devoted to validating the two-channel algorithm for calculating precipitation by comparing the results of the Ku sensors with reference data (rain gauges) and with the results of the algorithm using one channel (standard method). We first detail the calibration procedure used to estimate the LNB gain between two channels needed to apply the dual-channel approach. As explained previously in Sect. 2.3, for the low-cost LNB, there is a gain offset ΔG between the two channels. When the Ku sensor does not receive any signal from the satellite (PSat=0), it is rather simple to estimate this parameter. Under this condition, we can derive this from Eq. (2) by neglecting the receiver noise. Then we show the interest of the approach over the densely instrumented site of Cadarache before finally applying the method in Côte d'Ivoire, where the use of such an approach is critical for rain assessments.
4.1 Calibration procedure
As explained previously in Sect. 2.3, for the low-cost LNB there is a gain offset ΔG between the two channels. When the Ku sensor does not receive any signal from the satellite (PSat=0), it is rather simple to estimate this parameter.
Under this condition, we can derive from Eq. (12)
Then, in Eq. (12) becomes .
Then ΔG can be easily evaluated by subtracting the two channels' received powers (in decibels):
Three procedures are developed for which the satellite signal is cancelled (PSat=0). The first procedure involves shifting the antenna slightly so that it points away from the direction of the satellite. The second procedure consists of interposing a radio frequency absorber in front of the LNB, while the third procedure consists of waiting for a sufficiently strong rain event when tR≈0 (the satellite signal being strongly attenuated by the atmosphere). Note that the first two procedures require human intervention, while this is not necessary for procedure 3. On the other hand, the latter requires a strong rain event and waiting a time before it occurs. In the next two subsections we illustrate how ΔG was estimated for our datasets using procedures 1 and 3.
4.1.1 From direct measurements in Cadarache, France
At Cadarache, procedure 1 has been performed on the three available Ku sensors. As explained previously we point the antenna towards clear sky without any satellite signal. In this way, the two channels receive the same atmospheric emissions and the difference between the channels allows us to estimate ΔG (in dB). This procedure has been carried out once for two Ku sensors and twice for one Ku sensor (no. 749).
For this Ku sensor no. 749, the operation was carried out twice in December 2022 and in February 2023 by aiming for clear sky for around 5 min. Figure 5 shows the signals associated with these two evaluations of ΔG. Channel A (blue) corresponds (before the experiment) to the measurements over the lower Ku-band for satellite Eutelsat 5W, while channel B (red) corresponds to the upper band. While we expect that the signal over both channels becomes equal when targeting clear sky, there is a remaining offset corresponding to the ΔG. A numerical analysis of this experiment leads to these values for ΔG: 1.89 dB on 20 December and 1.87 dB on 20 February. Even if measured at two different times, we can see that these two values hardly vary. We are thus confident that the difference between the two signals corresponds to the expected theoretical value of ΔG.
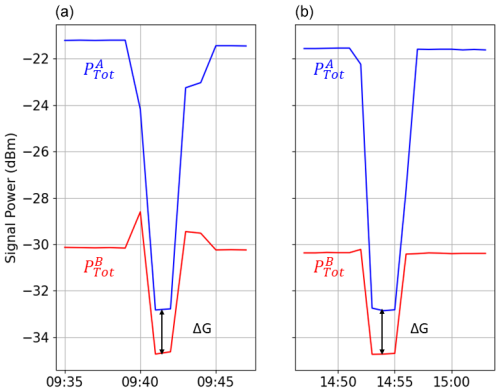
Figure 5Raw signals measured by a Ku sensor in France over two channels on 20 December 2022 (a) and on 20 February 2023 (b), allowing us to assess the value of the gain offset.
To compare two of the three procedures described above, we also look for a saturation event over the area and found one occurring on 30 October 2023. By assuming in the same way that this should lead to the same signals being recorded on both channels, modulo the value of ΔG, we can estimate again ΔG. Following procedure 3, we get ΔG=1.0 for Ku sensor no. 749. Similarly, we get the following values for the other two sensors in the area:
-
no. 748 – ΔGp1 = 1.0 dB and ΔGp3 = 0.7 dB;
-
no. 749 – ΔGp1 = 1.87 dB and ΔGp3 = 1.0 dB;
-
no. 750 – ΔGp1 = 2.3 dB and ΔGp3 = 1.6 dB.
Here ΔGp1 is the value obtained with procedure 1 and ΔGp3 with procedure 3.
The difference between both procedures varies from 0.9 to 0.2 dB. Equation (12) assumes that and are equal and that the radiation produced by the sensor is negligible, except that this assumption is wrong, and after a few experiments we estimate the difference between and (=ΔTN) to be < 15 K. Furthermore, it can be seen that when the brightness temperature TA is very low, as in procedure 1, the channel-dependent brightness temperatures of the noise are no longer negligible, whereas in procedures 2 and 3, TA is high (> 170 K), so the difference ΔTN is negligible. We therefore use the value from procedure 3.
4.1.2 From long-term data with saturation in Abidjan, Côte d'Ivoire
For a remote sensor network already deployed on another continent it is not simple to apply either procedure 1 or procedure 2. Since they were not applied during the installation of the Abidjan Ku sensors, procedure 3 will be used for these sensors. Like in the previous section and as can be seen in Fig. 6, one channel (A, red) receives the signal emitted by the satellite, while the other channel (B, blue) receives almost no signal and so works in a radiometric mode. When it starts raining (around 20:00 UTC in Fig. 6), the blue signal, composed only of atmospheric radiation, increases as TA increases, while the red signal, mainly composed of satellite emissions, decreases as tr decreases. Around 20:05 UTC, both signals reach a plateau, and almost no signal variation occurs during the next 10 min. This event occurs during very heavy rainfall: tr≈0, while TA reaches a plateau, as can be seen in Fig. 1. Then we can estimate ΔG as shown in the figure.
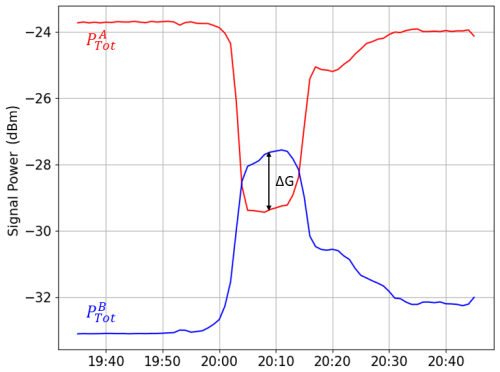
Figure 6Raw signals from a Ku sensor during a saturating rainy event: in red, the channel with satellite signal attenuated by the rain; in blue, the channel with very little signal and an increase in atmospheric noise due to the rain. The difference between these two signals in decibels corresponds to ΔG.
Over a prolonged period in Côte d'Ivoire, there were several occurrences of saturation. In theory, by calculating the difference between the two signals, we can identify a plateau with a minimum value corresponding to ΔG. Nevertheless to avoid noise effects or punctual bugs in the received time series and to ensure that the calculated ΔG is consistent and corresponds to saturation events, we define it as the 1st percentile of daily minimums of the signal difference over a period of at least 3 months.
Figure 7 illustrates this method. The upper graph shows the raw signals measured over two channels. The green curve represents the difference between both channels, considering only rainy periods. The value of ΔG calculated with the 1st percentile approach described above is superimposed in black. As expected, we can see that it corresponds to a plateau (the calculated value is reached several times during the period). Furthermore, due to the dry season in August and September with almost no rain, it is necessary to collect data over a period of several months (3 months in this case) to calculate the ΔG.
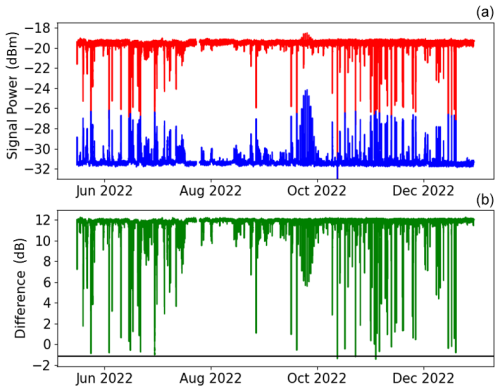
Figure 7(a) Raw signals from Ku sensor no. 162. Red: , meaning channel A including satellite emissions and corresponding to the upper part of the Ku-band in horizontal polarisation. Blue: , meaning channel B including only atmospheric radiation and corresponding to the lower part of the Ku-band in horizontal polarisation. (b) ΔG analysis. Green: difference between and . Black: estimated ΔG (see details in the text).
We then apply this procedure to 40 Ku sensors in Côte d'Ivoire, which leads to values of ΔG between +2 and −3 dB, centred around −1.5 dB. Then it is important to assess the sensitivity of rain estimations to errors made in the estimation of ΔG. To do so, we estimate cumulative rainfall for these 40 Ku sensors (using Sect. 2.3) for the calculated ΔG, as well as for this ΔG plus an offset varying in the range −0.9 to +0.9 dB. We choose this order of magnitude after testing the method and quantifying possible errors, especially by observing the difference we obtain in France between procedures 1 and 3.
Figure 8 shows for each offset applied to the calculated ΔG the corresponding distributions of rainfall accumulations (in mm) for the 40 Ku sensors. As expected, if ΔG is underestimated (negative offset), the gap between the signals received over both channels is overestimated and the rainfall is underestimated. On the other hand, if the ΔG is overestimated (positive offset), the two signals overlap more often, leading to unrealistic heavy rain intensities. Figure 8 shows the quite linear relationship between the increase in the ΔG and the increase in the cumulative rainfall. We nevertheless notice that the variations are significant but not critical. For instance, an offset of +0.5 dB leads to a median rain overestimation of around 10 %, while an offset of +0.9dB leads to a median rain overestimation of around 16 %.
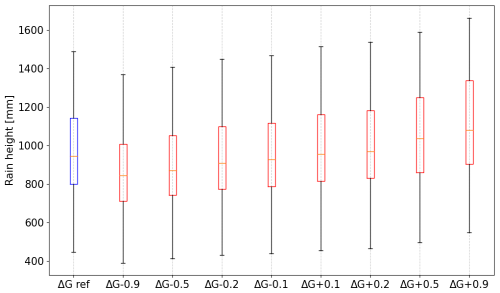
Figure 8Distributions of cumulative rainfall obtained for 40 Ku sensors in Côte d'Ivoire over 8 months (May to December 2022). Blue: rain estimations made with calculated ΔG. Red: rain estimations made when adding an offset to the calculated ΔG.
For the rest of the study, ΔG is estimated for each sensor using calibration procedure 3 based on a selection of heavy rain events leading to signal saturation.
4.2 Statistical results in Cadarache, France (30 min rain gauges)
In this section, we present the results obtained in Cadarache, France, from April to mid-June 2023, using the instruments described in Sect. 3 to compare the different types of Ku sensors (SR and S).
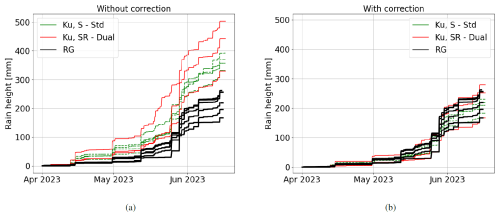
Figure 9Cumulative rainfall measured in Cadarache, France, from April to mid-June 2023 by various instruments and algorithms. (a) The rain gauges (black), the Ku, SR sensors using the dual-channel method (red) and the Ku, S sensors using the standard method (green). (b) The same, but with corrections applied to Ku sensor measurements in order to take into account the impact of the melting layer and the wet antenna (see Sect. 2.3).
To begin with, we look at the rain accumulations for the Ku sensors and the rain gauges. Figure 9b shows the results when applying corrections to account for the effects of the melting layer and wet antenna, as detailed in Sect. 2.3 and 2.4. Figure 9a provides, for reference, the results we would have obtained without considering these phenomena. The measurements from the Ku sensors appear similar to those of the rain gauges. In a scenario like this one, where the freezing level is not very high and rain intensities are not always very strong, it emphasises the necessity to account for both of the mentioned phenomena. It is also noticeable that all rain accumulations are relatively dispersed (170 to 250 mm for rain gauges, 180 to 260 mm for Ku sensors), considering the short distance between the instruments, indicative of highly heterogeneous storms encountered in the south of France. Finally, it seems that the rain accumulations measured by the dual-channel Ku sensors (Ku, SR) are slightly better than those measured in standard mode (Ku, S), which could correspond to the fact that we neglect the radiometric signal in the standard mode. We will revisit this point, which at this stage could also be attributed to the natural variability in rainfall.
Given the difference in spatial resolution between rain gauges and Ku sensors, we cannot expect similar values for both instruments. We assume that this difference in spatial resolution can be mitigated by integrating over time the precipitation rates measured by each device.
Figure 10 shows the correlation between the times series recorded simultaneously by the different devices as a function of their distance and type (indicated by various elements and colours). It can be seen that the correlation between the Ku sensors is mainly above the trend line (84 %), indicating consistency between the sensors. On the other hand, and as expected given the point measurements of the rain gauges, the correlation is fairly heterogeneous, falling below 0.5 for a distance of 4 km. We also found a better correlation between rain gauges and Ku, S–std stations than with Ku, SR–dual stations (58 % of points below the trend line compared with 72 %). But the correlation between rain gauges and S–std stations is more heterogeneous: as shown in Fig. 10 the gap between the green points (correlation Ku, S–std vs. RG) and the trend line is on average wider than the red points (correlation Ku, SR–dual vs. RG). Overall, the devices follow the expected trend and the correlation falls below 0.5 when the devices are separated by more than 4 km.
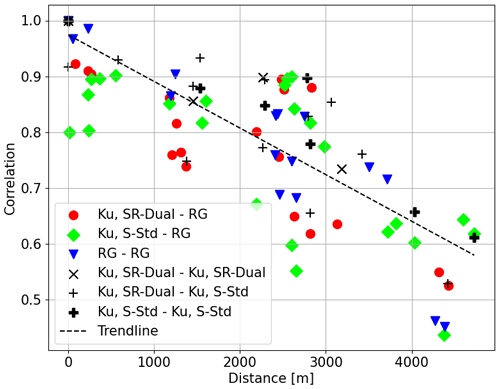
Figure 10Correlations between all the measurements taken at Cadarache as a function of the distance between the measuring instruments. The data compared are time series of precipitation rates with a resolution of 30 min for 2.5 months, without correction for outliers.
Figure 11 shows examples of the quantiles of the 30 min rain time series recorded by different Ku sensors in comparison to the quantiles deduced from measurements near rain gauges.
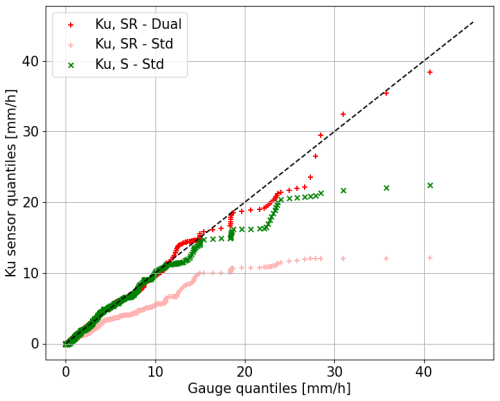
Figure 11Quantiles (mm h−1) from the 1st to the 100th percentile (coloured points) of 30 min resolution records for Ku sensors using the dual algorithm (red) and std algorithm (green and light red) vs. rain gauges (after excluding days when none of the devices detect rainfall).
The first observation made from Fig. 11 is the important difference resulting from the application of the dual-channel method (red dots). The results of the Ku sensors are drastically improved when compared with the one of the standard method (light red dots). When applying the standard method, we see that rain is strongly underestimated compared to rain gauges (light red curve far below the diagonal). For instance, the quantile corresponding to 20 mm h−1 with rain gauges is measured at around 7 mm h−1 for the Ku sensors. This is not surprising knowing that the satellite targeted by these sensors (Eutelsat 5W) emits a very low signal, leading to the poorest signal-to-noise ratio (SNR). In this case, to not take into account the atmospheric radiation leads to strong underestimation, especially for strong rain. In contrast, the quantiles of the Ku, SR–dual sensors behave in a similar way to those of the rain gauges (red dots). The slope of the linear regression is 0.93, which is very close to the trend line (ideal curve in dotted black lines). This proves the ability of the method developed in this paper to improve the results for such satellites where radiometry is directly accessible, and the very good results we obtain. Concerning the Ku, SR–std sensors they show consistent results for rainfall < 10 mm h−1, but they tend to underestimate heavy rainfall. Again, this is not a surprise. For such sensors, atmospheric radiation is not taken into account (as for the SR–std records), but we use a satellite that emits a strong signal (generally around 16 to 20 dB of SNR in the case of clear sky) so that the atmospheric radiation is largely negligible, except when the rain intensity becomes too high. Finally, we conclude from this figure that the dual-channel method is capable of reliably reproducing the essential characteristics of the quantiles of rain gauge values and that this method improves the results of sensors with a radiometric channel and gives better results than Ku, S sensors.
It should be noted that the nature of the measurements made by both instruments is very different (punctual and sampled for rain gauge, integrated and continuous for Ku sensor). Even if we work here at 30 min resolution to smooth these differences, we should be careful to not misinterpret any difference found in the final distributions. Nevertheless, for the Ku, S sensors, we can see that heavy rainfall (> 15 mm h−1) is underestimated with Ku sensor data, as seen before, due to the impact of the atmospheric radiation becoming significant. The atmospheric background noise is neglected, while it significantly compensates for the decrease in the signal when rain starts being heavy, leading to rain underestimation. For SR sensors for which atmospheric background noise is taken into account using the dual-channel algorithm, results very close to those recorded by the rain gauges are obtained.
Finally, we conclude the following from this analysis:
-
The effects of wet antenna and melting layer appear to be adequately addressed with straightforward corrections. This would nevertheless need to be further investigated in future works to assess it and even to improve its parameterisation. This would also allow us to ensure that other effects are not mitigated by these corrections.
-
The dual-channel algorithm leads to very good results that are consistent with rain gauge measurements, unbiased and quite equally distributed throughout the rain intensity range. When applied to satellites with low signal strength, this algorithm significantly improves the results.
-
The standard method (with atmospheric radiation not taken into account) applied to satellites with good SNR shows quite good results as well (no significant long-term bias visible in our dataset). However, it seems to underestimate heavy rainfall, which is logical since atmospheric radiation which is not negligible anymore is discarded in this case.
4.3 Results in Côte d'Ivoire
Once our approach is validated in a highly instrumented environment, we will apply it to a case study where it is much needed. Indeed, in Côte d'Ivoire, the signals received from the satellites are much weaker, so the standard method needs to be improved.
4.3.1 Long-term comparison (1 d rain gauges, Abidjan)
In this section, we compare two nearby Ku sensors with the Abidjan airport rain gauge at a 1 d resolution. The goal is to observe the long-term behaviour of the results using the dual-channel method applied to the sensors in a tropical zone.
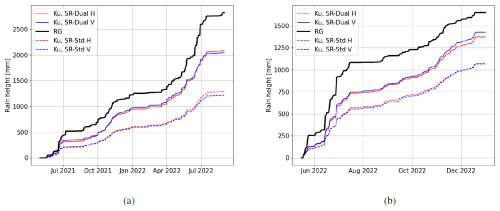
Figure 12Rain accumulations using Ku sensors with both methods (dual-channel and standard) and polarisations compared to rain gauge measurements. (a) Ku sensor no. 36 compared to Abidjan airport rain gauge over 484 d. (b) Ku sensor no. 162 compared to the same rain gauge over 244 d. Rain gauge data are plotted with dashed black lines, Ku sensors with dual-channel method are plotted with solid lines, and the standard method with dashed lines; blue indicates horizontal polarisation, and red indicates vertical polarisation.
In Fig. 12 the standard method (Ku, SR–std) is applied to both polarisations (dashed red and blue lines) and the dual-channel method is applied to both polarisations as well (solid red and blue lines), and they compared with the Abidjan airport rain gauge (solid black line). Figure 12a shows the rainfall accumulations for Ku sensor no. 36 and the rain gauge over a year and a half (484 d), revealing a clear improvement in the results when using the dual-channel method. Specifically, the relative bias of Ku sensors' rainfall compared to the rain gauge decreases from 53 % (Ku, SR–std H) to 24 % (Ku, SR–dual H) for horizontal polarisation and from 55 % (Ku, SR–std V) to 25 % (Ku, SR–dual V) for vertical polarisation. Similarly, Figure 12b represents the accumulations for Ku sensor no. 162 compared to the rain gauge over 8 months (244 d). The dual-channel method now exhibits a bias of 17 % for horizontal polarisation (Ku, SR–dual H) and 14 % for vertical polarisation (Ku, SR–dual V), indicating an improvement over the standard method biases of 36 % for horizontal polarisation and 35 % for vertical polarisation.
Using both channels (SR–dual in Fig. 12) strongly reduces the discrepancy with rain gauge measurements of total rainfall accumulations. A remaining underestimation is nevertheless still present. However, we did not detect any improvement in performance as a function of one polarisation or the other, we cannot state that one polarisation is better than the other, and we assume that the impact is negligible in relation to the biases between the sensors and the rain gauges.
It is important to notice that both devices, the rain gauge and the Ku sensor, do not observe the same phenomena. The Ku sensor indirectly measures rainfall integrated over a link a few kilometres long, whereas the rain gauge directly measures rainfall at a given point on the ground. This difference is all the more important in the case of mainly convective and heterogeneous events.
Table 2 displays the confusion matrix for sensors no. 162 and no. 36 in relation to the rain gauge. Each day is classified as “rain” or “no rain”. First, the confusion matrix shows consistency in rainfall detection between both devices, with most days being classified in the same category by both instruments (no. 162: 191 d out of 229 d are classified well, and accuracy is 85.2 %; no. 36: 399 d out of 488 d are classified well, and accuracy is 81.8 %). Nevertheless, about 15 % of the days show discrepancies between the instruments. For example, for station no. 162, there are 32 d when the Ku sensor detects rainfall but the rain gauge does not. This is probably due to both the heterogeneity of the rain (rain passing somewhere above the link but not at the location of the rain gauge) and one-off errors in the rain detection algorithm leading to false positives and 7 d with rain gauge rainfall without Ku sensor rainfall.
Table 2Confusion matrices comparing all days with less than 50 % NaN data on the two devices, the rain gauge and Ku sensor no. 162, over a period of 229 d and the rain gauge and Ku sensor no. 36 over a period of 488 d. A rainy day is a day on which the device detected precipitation; conversely, a non-rainy day is a day on which there was no rain. The matrix is normalised over the true conditions.
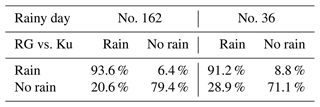
Such a behaviour was expected: Ku sensors measure rainfall integrated over a link a few kilometres long, while rain gauges give punctual measurements. If we suppose that both instruments are located at the same place, a shower can easily affect a portion of the link covered by a Ku sensor without touching the rain gauge, while the reverse phenomenon is impossible (if the rain gauge is touched by a rain event, at least a part of the link will be touched as well). However, since this behaviour is clearly not expected to be systematic (most rainfall events, especially the larger ones, should be large enough to affect both instruments), it should not affect the overall rainfall accumulation. Finally despite the improved results with the dual-channel method, there is still an overall underestimation relative to the rain gauges. The differences in measurements highlighted by Table 2 are further discussed in the Appendix.
To conclude, the standard method applied to a weak satellite signal leads to a very significant underestimation of rainfall (of the order of 50 %). However, by using the two frequencies of these satellites via the dual-channel method, the error is reduced but still present (15 % to 25 % in these cases). The impact of the different nature of the two instruments is analysed in Appendix A. These results suggest that this difference in nature makes temporal comparisons between the measurements impossible but does not explain the persistent difference observed between the instruments. The next section will then consist of a statistical study using 30 min resolution data.
4.3.2 Statistical results (30 min gauges, Abidjan)
In this section the measurements from four rain gauges and 12 Ku sensors at a 30 min resolution are compared (see Fig. 4). Each rain gauge (Koumassi, St Viateur, Bingerville and Attécoubé) is compared with all Ku sensors located in a 4 km circle around the rain gauge. In all cases, 85 d of data is available, spanning April to July 2021. We first observe the general behaviour of the sensors in Fig. 13.
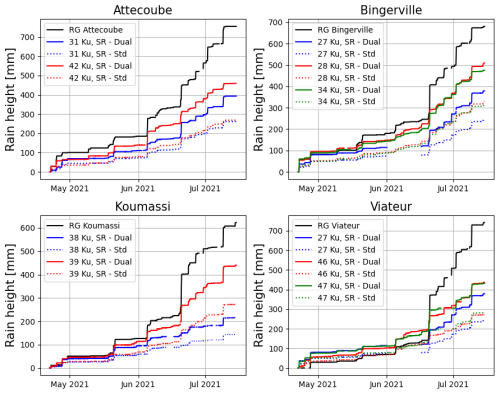
Figure 13Cumulative rainfall recorded by rain gauges and Ku sensors in Abidjan from late April to mid-July 2021. Each plot shows the records from a rain gauge and from all the Ku sensors available at less than 4 km from the rain gauge. For each Ku sensor, both the standard and the dual-channel method are applied.
As in the previous section we compare the cumulative data of four rain gauges to the values estimated from Ku sensors. Similarly we note that the dual-channel method (solid colour line, Fig. 13) reduces the error compared to the standard method (dashed colour line, Fig. 13) but still falls short of the rain gauge results. Despite similar trends it is noticeable that the gaps between the curves widen during very intense events.
Table 3Comparison of different rain sensors in Abidjan from late April to mid-July 2021. Each part of the table (Attécoubé, Bingerville, etc.) corresponds to a rain gauge. The total rainfall indicated for each area (for instance 756 mm in Attécoubé) corresponds to the total rainfall measured by this rain gauge. When compared to a Ku sensor (each line of the table), all dates when this sensor had missing values are excluded from the analysis, which leads to rain gauge accumulations that are different from the overall total (for instance 700 mm for Attécoubé when compared to Ku sensor no. 42). For each Ku sensor the percentage of missing values, the bias when compared to the rain gauge (negative means underestimation by the Ku sensor) and the root mean square error (RMSE) are indicated, as well as the distance from the Ku sensor to the rain gauge and the satellite it targets. We notice that targeting SES 5 implies a 5 km link, while targeting E36b implies a 7 km link.
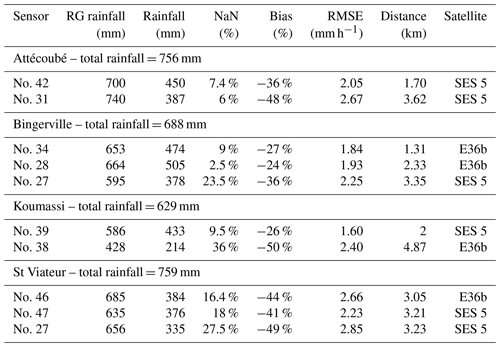
In Table 3, we gather recorded accumulations by the rain gauges and values estimated through several Ku sensors. It allows us to assess quantitatively the results provided by the dual-channel method. We note the influence of distance on the RMSE: for instance for Bingerville sensors, RMSE is increasing from 1.84 mm h−1 for Ku sensor no. 34 located 1.3 km from the rain gauge up to 2.25 mm h−1 for Ku sensor no. 35 located 3.4 km away.
Distance seems to increase the error as well, which is less expected: sensor no. 42 exhibits a relative bias of −36 % at a distance of 1.7 km, while sensor no. 31 shows a relative bias of −48 % at a distance of 3.62 km. It is important to notice that the biases recorded here with the dual-channel approach seem larger than the ones recorded in the previous section with long-term daily measurements. This could be due to the fact that here we concentrate on the rainy season in Abidjan (May to July) when most rain occurs as strong convective events with high rain intensities. As seen in France, these kind of events are more likely to lead to errors and saturation in Ku sensor measurements and so to stronger underestimation. The biases recorded here (25 % to 50 %) are then not incompatible with the long-term biases recorded at the airport (15 % to 25 %).
Figure 14 shows the correlation between the instruments according to the distance between them. The Ku sensors are split according to the satellite they target to emphasise the importance of the length of the satellite link. A consistent trend is recorded, showing a decrease in correlation as the devices move further apart. The correlation between the different Ku sensors, regardless of which satellite they are pointed at, is good (black crosses, Fig. 14). The trend in the correlation between the SES 5 Ku sensors and the rain gauges is the same as the global one (blue dots, Fig. 14), with 55 % of the points below the trend line. In contrast, correlations between E36b Ku sensors and rain gauges show 63 % of points below the trend line. In other words, correlations between Ku sensors targeting E36b seem weaker than those of Ku sensors targeting SES 5, which could be explained by the fact that ET36B is lower in the sky than SES 5, leading to longer path links (more than 7 km).
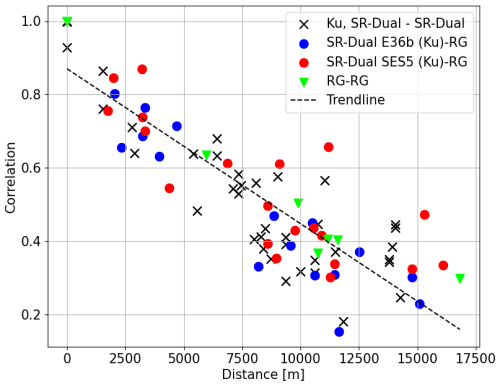
Figure 14Correlations between instrument records according to their distance in Abidjan. Black crosses: Ku sensors among themselves. Green triangles: rain gauges among themselves. Blue dots: rain gauges vs. Ku sensors targeting E36b. Red dots: rain gauges vs. Ku sensors targeting SES 5. The trend curve for all instruments using linear regression is plotted as a dotted black line.
Figure 15 shows the quantiles of the 30 min rain time series recorded by several Ku sensors relative to the quantiles resulting from rain gauge measurements at the same resolution. For the standard and the dual-channel methods, each of the two curves corresponds to an aggregate response of Ku sensors targeting the same satellite. Figure 16 shows the ratio of rain gauge quantiles to the quantiles from the Ku sensors for both the standard and the dual-channel methods, allowing us to see the differences between both instruments at different rainfall scales.
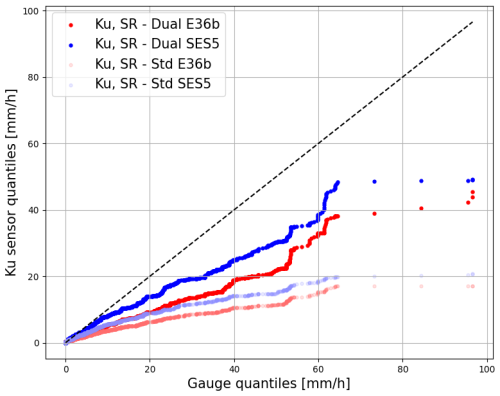
Figure 15Quantiles (mm h−1) from the 1st to the 100th percentile (coloured points) of 30 min resolution records for Ku sensors vs. rain gauges in Abidjan for both the standard and dual-channel methods. All points are coloured according to the satellite targeted by the Ku sensors.
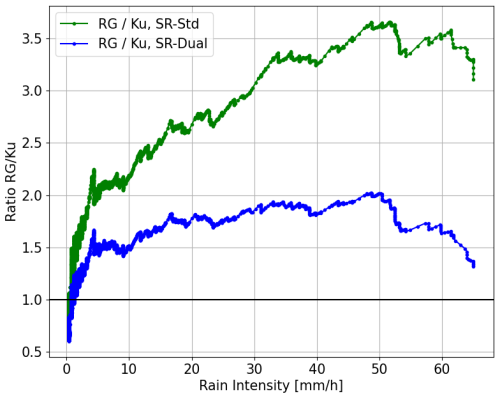
Figure 16Ratio between the intensity quantiles of the rain gauges and the intensity quantiles of the stations using the dual-channel method (blue) and the ratio between the intensity quantiles of the rain gauges and the intensity quantiles of the stations using the standard method in green, expressed as a function of the rain gauge intensities. A point above the 1.0 line at a given rain intensity means that for the gauge quantile corresponding to this intensity, the same quantile for the Ku sensor is smaller.
An enhancement in results is clear with the dual-channel method compared to the standard method (Fig. 15), particularly for precipitation exceeding 20 mm h−1 and even more prominently for rainfall surpassing 60 mm h−1. These results are similar to those obtained in France (see Sect. 4.2): taking into account radiometric effects in the dual-channel method strongly improves the results.
In addition, we can see from Fig. 15 that up to 10 mm h−1 there is very good agreement between the rain gauges and the Ku sensors targeting SES 5. Above this intensity, the error increases, but we note that it increases less for the sensors targeting SES 5 than those targeting E36b. This can be explained by the shorter link being under the rain, likely leading to a more homogeneous rainfall distribution along the path.
Finally, the results obtained from the dual-channel method (SR–dual) shows a general underestimation when compared to the rain gauges, which confirms the underestimation already recorded for long-term rain accumulations (Fig. 13). Because the instruments are different, we expect not to strictly follow the diagonal line; because of the spatial integration, Ku sensor measurements are expected to be smoother than rain gauge measurements and to underestimate high quantiles. Nevertheless, knowing that the data have been integrated at a 30 min time resolution, these differences are expected to be small, as they are in France (see Sect. 4.2). Figure 16 shows that the lowest quantiles are overestimated by Ku sensors with the dual-channel method (until about 1 mm h−1), which is probably normal given their difference in nature: Ku sensors record the mean rainfall over a link a few kilometres long, while rain gauges do punctual measurements. This will lead to smoother records for Ku sensors, with more rain occurrence and so larger small quantiles, as well as less heavy rainfall and so smaller high quantiles. However, this pattern swiftly shifts as intensities increase. We can see that the standard method leads to quantiles between 2 and 5 times weaker than the values recorded by the rain gauges as the rain intensity increases, indicating an underestimation that increases with rainfall intensity. The dual-channel method, on the other hand, shows a much more constant underestimation, never exceeding a factor of 2. This confirms the remaining underestimation of the dual-channel method. However, it also demonstrates that while the sensor error initially showed a strong dependence on rainfall intensity (as seen in the increasing green curve in Fig. 16), this dependency is significantly reduced after correction, with the blue curve remaining relatively stable between 1.5 and 2. There is nevertheless a specific case that still needs to be treated: the saturation effect. We can see from Fig. 15 that the dual-channel method cannot record rain intensities larger than about 40 mm h−1 (ET36B) or 50 mm h−1 (SES 5). This is due to the fact that there is no more signal available in this case. Nevertheless this concerns only a few extreme rain events and is probably not the cause of the overall underestimation, which concerns the entire rainfall intensity spectrum (Polz et al., 2023).
In this paper we proposed a dual-channel method taking into account the radiometric component of the signal received by low-cost Ku sensors measuring the power received over the Ku-band from geosynchronous satellites emitting over an incomplete part of the Ku spectrum. The method makes it possible to obtain a good estimate of the rain rate even when receiving a weak signal from the satellite.
After studying the theoretical implications of such an approach, this method has been validated in a highly instrumented environment. In Cadarache, south of France, three Ku sensors were set to measure the signals received from a low-powered satellite. Four other Ku sensors targeting high-powered satellites were already installed in the same area, together with five rain gauges. It has been shown that applying a standard algorithm (without taking into account the radiometric component of the signal) to the low-power satellites led to a strong underestimation of rainfall, while using the dual-channel approach allowed us to retrieve the rain rate very well when compared to rain gauges. When compared to Ku sensors targeting high-power satellites with a standard approach, it has been shown that while the differences were very small for low rain rates, the dual-channel method outperforms the other for high rain rates when the radiometric component starts to be non-negligible even for high-power satellites.
Then, the dual-channel method was applied in Côte d'Ivoire, where such a method is critical to provide low-cost, decentralised, robust rain measurements and where high-power satellites are not available. Despite recurring errors leading to an underestimation of rain accumulations when compared with rain gauge measurements, we have considerably improved the results by taking into account the atmospheric background noise. We have shown the impact of the targeted satellite on the results, with better results when using a quasi-vertically pointing satellite. We have shown that a standard method leads to a strong underestimation that is very sensitive to rain intensity (with underestimation increasing as the intensity increases). When using the dual-channel approach, the underestimation is weaker and not clearly dependent on rain intensity.
However and regardless of the main subject of the article, or at least in addition to it, two points remain to be clarified.
In France, it has been demonstrated that accounting for the effects due to wet antenna and the melting layer cannot be overlooked. Although errors related to precipitation estimation seem to be explained in order of magnitude by what is known about these phenomenon, further studies are needed to parameterise these phenomena more precisely, which are relatively under-explored in satellite measurements.
In Côte d'Ivoire, the approach presented in this paper significantly reduced the underestimation of rainfall but did not completely explain it – far from it. After correction, underestimations of the order of 15 % to 45 % in cumulative rainfall are observed, seemingly evenly distributed across rainfall intensities. Therefore, it is necessary to investigate the causes that could explain this persistent underestimation.
As a conclusion to this paper, we will in the following paragraphs propose a set of possible causes of this underestimation. This will be done by referring to studies already conducted on the subject, assessing the likelihood that it is a plausible explanation, and/or suggesting experimental or numerical studies to test these causes.
Non-linearity of k–R relationship. To convert attenuations into rainfall rates, we assume that rain is distributed homogeneously over the Earth–satellite link. Without considering for now the vertical and horizontal structure of rain, this is naturally not true over the horizontal plane for links a few kilometres long (a part of the link may experience heavy rainfall, while another part remains dry), causing an error as the attenuation-to-rainfall rate relationship is not linear (because of the power law with a power coefficient slightly greater than 1 at 12 GHz). However, it can be shown, on the one hand, that the error should lead to an overestimation of rainfall and, on the other hand, for a relatively extreme case (rainfall changing from 0 to 100 mm h−1 and then back to 0 over a 7 km link), that an overestimation of around 9 % is expected. On average, in the long term, we therefore expect a significantly lower effect. This point, however, deserves consideration, which can be done, especially statistically, through the use of a rainfall simulator like Féral et al. (2003).
Error in freezing height. The conversion of measured total attenuation to rainfall rate is directly linked to the altitude of the 0°C isotherm (freezing height). A bias of 10 % in this height should lead to a bias of the same order in rainfall retrievals. This is independent of other associated errors (vertical inhomogeneity of rainfall, melting layer effects). The heights of the freezing level used in this study are those predicted by the ARPEGE NWP model of Météo France. Although it seems unlikely that this effect alone explains the observed underestimation, especially in a region like the tropics where the height of the 0 °C isotherm is relatively stable over time, it is worth testing this parameter. This can be done by comparing these estimates with measurements from vertically pointing radars, such as BASTA (Delanoë et al., 2016) or ROXI (Lemaître et al., 2016).
Error in vertical structure of rain and associated effects. In this study, rain is supposed to be vertically homogeneous from the ground up to the freezing height. Many phenomena that occur over the atmosphere column can affect this hypothesis.
First the upper cloud limit can be under the freezing level, leading to a path length lower than expected and so to real rain rates larger than calculated. Examples can be found in the literature about such events (Feng et al., 2014). It is unlikely that such events are sufficiently systematic to produce strong biases in the tropics (strong convective events being generally associated with high-altitude clouds), but the occurrence of such phenomena can be explored more deeply.
Another phenomenon, probably more frequent and affecting mostly convective rain, is the fact that the freezing level is not always a clear limit (see for instance Giannetti et al., 2017, notably their Fig. 6 and associated text): there can be liquid rain above the freezing height and solid ice below due to strong vertical winds. This could lead to systematic errors, especially in areas subject to heavy rainfall like the tropics. Another noticeable phenomenon is the variation in the vertical (gravitational) velocity of raindrops with height: droplets fall faster at high altitudes, where the air density is low, and slow down as they approach the ground (Foote and Du Toit, 1969; Atlas et al., 1973). If we suppose that the rain rate is conserved through the column, this leads to a greater droplet density close to the ground and so to a larger specific attenuation close to the ground when compared to higher altitudes. The average attenuation over the column is then lower than the real attenuation at the ground level, leading to an underestimation of the rain rate. This phenomenon is more important in the case of high freezing level like in the tropics and should be taken into consideration in future works. The last potential phenomenon of interest is the variation in the rain rate among the column under the effect of evaporation or condensation, as well as a variation in the droplet size distribution (under these effects or other ones like coalescence or break-up; see for instance Mercier et al., 2016). This phenomenon could explain (a part of) the underestimation we notice only in the case of systematic condensation (leading to a ground rain rate higher than the average one), occurring only in Côte d'Ivoire, which is unlikely.
Error in k–R relationship. In this work, we use the Marshall–Palmer parameterisation for the drop size distribution. Many other parameterisations have been assessed – some of them dedicated to tropical systems (Moumouni et al., 2018).
Even if it is hard to robustly compare the different relationships that can be found in the literature, it would be useful to quantify the uncertainty associated with this phenomenon by applying several parameterisations and to estimate the variability it introduces in resulting rainfall.
Radiometric saturation. The last phenomenon already mentioned that leads to underestimation is the signal saturation. This occurs when the satellite signal becomes negligible compared to atmospheric radiation, causing the dual-channel approach to lead to a rain transmittance tending to 0, making it no longer usable. A systematic assessment of the underestimation due to this phenomenon, which occurs more often in Côte d'Ivoire, is needed even if it is not able to explain the underestimation noticed for all rain intensities.
We saw in Sect. 4.3.1 that there are differences between the instruments, and here we seek to detail and understand these differences. Knowing that in this experiment both instruments are not located exactly at the same place makes the analysis more complex but should not lead to any long-term differences, as long as there are no climatological variations in rainfall over the area of interest (which is not likely over a few kilometres in this plain area) and as long as the overall long-term rain accumulation is not critically determined by a few strong event (that could affect one instrument and not the other one).
So it is important to closely analyse these discrepancies. The aims of this analysis are
-
to see if these discrepancies lead to important errors
-
to analyse for days with significant discrepancies whether the discrepancies stem from very localised events affecting one instrument but not the other or from errors in the analysis algorithms.
More precisely, we examine in Fig. A1 the distribution of Ku sensor daily rainfall for the days when the Ku sensors detect rain but the rain gauge does not. Most differences correspond to daily rain accumulations from 0.25 to 5 mm (low rainfall): the median is 0.55 mm. However, we observe 2 d with rainfall above 5 mm, namely 9.34 and 22.32 mm. Similarly, among the 6 d when only the rain gauge detects rain, only two large values (> 10 mm) are noticeable. This shows that the long-term bias between the two instruments, which for Ku sensor no. 162 corresponds to a rain accumulation difference of around 300 mm, cannot be explained solely by specific events measured by one of the sensors and not by the other.
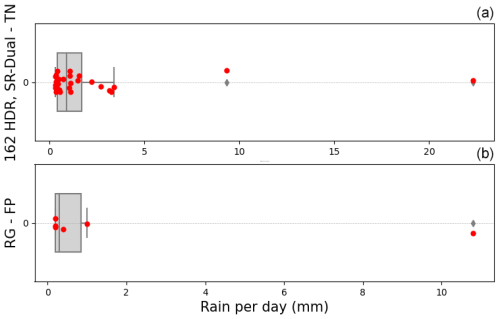
Figure A1(a) Distribution of Ku sensor no. 162 daily rainfall for the days when the Ku sensors detect rain but the rain gauge does not (using the dual-channel method and horizontal polarisation). The 32 rainy days are marked in red, and their distribution is represented by the grey box plot. (b) Same for the rain gauge rainfall for the days when KU sensor no. 162 does not record any rain.
Finally, we show in Fig. A2 the raw signals from Ku sensor no. 162 corresponding to the strong rain events measured by this sensor but not by the rain gauge seen in Fig. A1. It is clear from the raw measurements that there is rain occurring over the link for both cases, which confirms that most of the discrepancies between both instruments are likely due to physical differences (rain heterogeneity) and not algorithm issues. This will convince us in the rest of the analysis to not directly compare time-to-time measurements (with indicators like RMSE) but to statistically compare the results in terms of overall rain accumulation and rain intensity distributions.
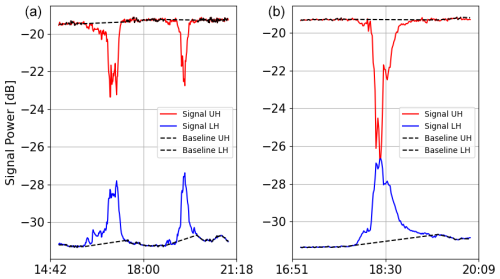
Figure A2Raw signal measured by Ku sensor no. 162 for the 2 d when this sensor measured more than 5 mm of rain but the rain gauge recorded no precipitation. (a) 2 November 2022. Total measured rainfall is 9 mm. (b) 18 November 2022. Total measured rainfall is 22 mm. Red: raw signal of the upper frequency band in H polarisation. Blue: raw signal of the lower frequency band in H polarisation. Dotted black: estimated baseline.
For more information on the codes and the data, contact Louise Gelbart at louise.gelbart@hd-rain.com.
LB, FMT, AC, CM and LG designed the study. LG and FMT carried out the study with the contribution of LB, AC and CM. LG prepared the article with contributions from all co-authors. More precisely AC, CM and LB wrote the Introduction and the “Physical principles” section; LG wrote the entire Results and Datasets sections; and FMT wrote the Conclusions section. All co-authors revised and approved the latest version.
The authors François Mercier-Tigrine and Louise Gelbart are employees of HD Rain, a company that develops and builds the sensor used in this article and sells products notably based on its measurements.
Publisher's note: Copernicus Publications remains neutral with regard to jurisdictional claims made in the text, published maps, institutional affiliations, or any other geographical representation in this paper. While Copernicus Publications makes every effort to include appropriate place names, the final responsibility lies with the authors.
First of all, we would like to thank the CEA at Cadarache, and Thierry Hedde in particular, for funding the installations of HD Rain stations, sharing rain gauge data and carrying out calibration procedure 1 on the Ku sensors.
We would also like to thank the National Weather Service of Ivory Coast – Sodexam – and especially Aristide Aguia, Daouda Konaté and Jean-Louis Moulot for sharing rain gauge data and collaborating with HD Rain on deploying opportunistic rain measurement systems in Abidjan. We thank as well the French DG Trésor, which funded the deployment of HD Rain stations in Côte d'Ivoire through a FASEP project in partnership with Météo France International, and the Lifi-LED company, which installed HD Rain sensors in Abidjan.
We finally thank Ruben Hallali and Maxime Turko for their advice and proofreading of this paper.
This paper was edited by Alexis Berne and reviewed by two anonymous referees.
Atlas, D., Srivastava, R., and Sekhon, R. S.: Doppler radar characteristics of precipitation at vertical incidence, Rev. Geophys., 11, 1–35, 1973. a
Barthès, L. and Mallet, C.: Rainfall measurement from the opportunistic use of an Earth–space link in the Ku band, Atmos. Meas. Tech., 6, 2181–2193, https://doi.org/10.5194/amt-6-2181-2013, 2013. a, b, c, d
Barthes, L., Mallet, C., and Gole, P.: Neural network model for atmospheric attenuation retrieval between 20 and 50 GHz by means of dual-frequency microwave radiometers, Radio Sci., 38, 3–1, 2003. a, b, c
Bouyssel, F., Berre, L., Bénichou, H., Chambon, P., Girardot, N., Guidard, V., Loo, C., Mahfouf, J.-F., Moll, P., Payan, C., and Raspaud, D.: The 2020 Global Operational NWP Data Assimilation System at Météo-France, Data Assimilation for Atmospheric, Oceanic and Hydrologic Applications, Springer International Publishing, vol. IV, 645–664, https://doi.org/10.1007/978-3-030-77722-7_25, 2022. a
Chandrasekhar, S.: Radiative transfer, Q. J. Roy. Meteor. Soc., 76, 498–498, https://doi.org/10.1002/qj.49707633016, 2013. a
Chwala, C. and Kunstmann, H.: Commercial microwave link networks for rainfall observation: Assessment of the current status and future challenges, WIREs: Water, 6, e1337, https://doi.org/10.1002/wat2.1337, 2019. a
Colli, M., Stagnaro, M., Caridi, A., Lanza, L. G., Randazzo, A., Pastorino, M., Caviglia, D. D., and Delucchi, A.: A field assessment of a rain estimation system based on satellite-to-earth microwave links, IEEE T. Geosci. Remote, 57, 2864–2875, 2018. a
Das, S. and Maitra, A.: Some melting layer characteristics at two tropical locations in Indian region, in: 2011 XXXth URSI General Assembly and Scientific Symposium, 13–20 August 2011, Istanbul, Turkey,, IEEE, 1–4, https://doi.org/10.1109/URSIGASS.2011.6050805, 2011. a
Delanoë, J., Protat, A., Vinson, J.-P., Brett, W., Caudoux, C., Bertrand, F., Parent du Chatelet, J., Hallali, R., Barthes, L., Haeffelin, M. H., and Dupont, J.-C.: BASTA: A 95-GHz FMCW Doppler radar for cloud and fog studies, J. Atmos. Ocean. Tech., 33, 1023–1038, 2016. a
Feng, Z., McFarlane, S. A., Schumacher, C., Ellis, S., Comstock, J., and Bharadwaj, N.: Constructing a merged cloud–precipitation radar dataset for tropical convective clouds during the DYNAMO/AMIE experiment at Addu Atoll, J. Atmos. Ocean. Tech., 31, 1021–1042, 2014. a
Féral, L., Sauvageot, H., Castanet, L., and Lemorton, J.: HYCELL – A new hybrid model of the rain horizontal distribution for propagation studies: 1. Modeling of the rain cell, Radio Sci., 38, 1056, https://doi.org/10.1029/2002RS002802, 2003. a
Foote, G. B. and Du Toit, P.: Terminal velocity of raindrops aloft, J. Appl. Meteorol., 8, 249–253, 1969. a
Giannetti, F. and Reggiannini, R.: Opportunistic rain rate estimation from measurements of satellite downlink attenuation: A survey, Sensors, 21, 5872, https://doi.org/10.3390/s21175872, 2021. a, b
Giannetti, F., Reggiannini, R., Moretti, M., Adirosi, E., Baldini, L., Facheris, L., Antonini, A., Melani, S., Bacci, G., Petrolino, A., and Vaccaro, A: Real-time rain rate evaluation via satellite downlink signal attenuation measurement, Sensors, 17, 1864, https://doi.org/10.3390/s17081864, 2017. a, b
Giannetti, F., Moretti, M., Reggiannini, R., and Vaccaro, A.: The NEFOCAST system for detection and estimation of rainfall fields by the opportunistic use of broadcast satellite signals, IEEE Aero. El. Sys. Mag., 34, 16–27, 2019. a
Gianoglio, C., Colli, M., Zani, S., and Caviglia, D. D.: An Online Training Procedure for Rain Detection Models Applied to Satellite Microwave Links, IEEE Geosci. Remote S., 20, 1002405, https://doi.org/10.1109/LGRS.2023.3328718, 2023. a
Goldshtein, O., Messer, H., and Zinevich, A.: Rain Rate Estimation Using Measurements From Commercial Telecommunications Links, IEEE T. Signal Process., 57, 1616–1625, https://doi.org/10.1109/TSP.2009.2012554, 2009. a
Gosset, M., Kunstmann, H., Zougmore, F., Cazenave, F., Leijnse, H., Uijlenhoet, R., Chwala, C., Keis, F., Doumounia, A., Boubacar, B., Kacou, M., Alpert, P., Messer, H., Rieckermann, J., and Hoedjes, J.: Improving rainfall measurement in gauge poor regions thanks to mobile telecommunication networks, B. Am. Meteorol. Soc., 97, ES49–ES51, 2016. a
Green, H. E.: Propagation impairment on Ka-band SATCOM links in tropical and equatorial regions, IEEE Antenn. Propag. M., 46, 31–45, 2004. a
Hochreiter, S. and Schmidhuber, J.: Long short-term memory, Neural Computat., 9, 1735–1780, 1997. a
International Telecommunication Union (ITU): ITU-R P.838-3: Propagation data and prediction methods required for the design of terrestrial broadband millimetric radio communication systems, ITU-R Recommendation P.838-3, https://www.itu.int/dms_pubrec/itu-r/rec/p/R-REC-P.838-3-200503-I!!PDF-E.pdf (last access: 13 January 2025), 2005. a
International Telecommunication Union (ITU): ITU-R P.618-12: Propagation data and prediction methods required for the design of terrestrial broadband millimetric radio communication systems, ITU-R Recommendation P.618-12, https://www.itu.int/dms_pubrec/itu-r/rec/p/R-REC-P.618-12-201507-S!!PDF-E.pdf (last access: 13 January 2025), 2017. a
International Telecommunication Union (ITU): ITU-R P.839-4: ITU-R P.839-4: Specific Attenuation Model for Rain for Use in Prediction Methods, ITU-R Recommendation P.839-4, https://www.itu.int/dms_pubrec/itu-r/rec/p/R-REC-P.839-4-201309-I!!PDF-E.pdf (last access: 13 January 2025), 2022. a
Kait, M. A.: Contribution à l'observation des précipitations en Afrique avec un radar polarimétrique et des liens microondes commerciaux, PhD thesis, Toulouse 3, https://theses.fr/2019TOU30238?utm_source (last access: 13 January 2025), 2019. a
Leijnse, H., Uijlenhoet, R., and Stricker, J.: Microwave link rainfall estimation: Effects of link length and frequency, temporal sampling, power resolution, and wet antenna attenuation, Adv. Water Resour., 31, 1481–1493, 2008. a
Lemaître, Y., Pauwels, N., and Le Gac, C.: Micro-rain radar en bande X pour la climatologie des propriétés microphysiques des systèmes précipitants: ROXI (Rain Observation with an X-band Instrument), in: Journée Scientifique SIRTA 2016, 2016. a
Lu, C.-S., Zhao, Z.-W., Wu, Z.-S., Lin, L.-K., Thiennviboon, P., Zhang, X., and Lv, Z.-F.: A new rain attenuation prediction model for the earth-space links, IEEE T. Antenn. Propag., 66, 5432–5442, 2018. a
Mallet, C. and Lavergnat, J.: Beacon calibration with a multifrequency radiometer, Radio Sci., 27, 661–680, 1992. a
Marshall, J. S. and Palmer, W. M. K.: The Distribution Of Raindrops With Size, J. Atmos. Sci., 5, 165–166, https://doi.org/10.1175/1520-0469(1948)005<0165:TDORWS>2.0.CO;2, 1948. a
Mello, L. and Pontes, M. S.: Unified method for the prediction of rain attenuation in satellite and terrestrial links, Journal of Microwaves, Optoelectronics and Electromagnetic Applications, 11, 1–14, 2012. a
Mercier, F., Chazottes, A., Barthès, L., and Mallet, C.: 4-D-VAR assimilation of disdrometer data and radar spectral reflectivities for raindrop size distribution and vertical wind retrievals, Atmos. Meas. Tech., 9, 3145–3163, https://doi.org/10.5194/amt-9-3145-2016, 2016. a
Mercier-Tigrine, F., Barthès, L., and Mallet, C.: Opportunistic Rainfall Measurements from Dual Channel KU-Band Receiver, in: 2023 IEEE International Conference on Acoustics, Speech, and Signal Processing Workshops (ICASSPW), 4–10 June 2023, Rhodes Island, Greece, IEEE, 1–5, https://doi.org/10.1109/ICASSPW59220.2023.10193748, 2023. a
Messer, H., Zinevich, A., and Alpert, P.: Environmental monitoring by wireless communication networks, Science, 312, 713–713, 2006. a
Mishchenko, M. I., Travis, L. D., and Mackowski, D. W.: T-matrix computations of light scattering by nonspherical particles: A review, J. Quant. Spectrosc. Ra., 55, 535–575, https://doi.org/10.1016/0022-4073(96)00002-7, 1996. a
Moumouni, S., Adjikpe, L. S., Massou, S., and Lawin, A. E.: Parameterization of drop size distribution with rainfall rate: comparison of the N (D) and R (D) functions; and relationship between gamma and lognormal laws, Int. J. Res. Innov. Earth Sci., 5, 116–123, 2018. a
Overeem, A., Leijnse, H., and Uijlenhoet, R.: Retrieval algorithm for rainfall mapping from microwave links in a cellular communication network, Atmos. Meas. Tech., 9, 2425–2444, https://doi.org/10.5194/amt-9-2425-2016, 2016. a
Polz, J., Graf, M., and Chwala, C.: Missing rainfall extremes in commercial microwave link data due to complete loss of signal, Earth Space Sci., 10, e2022EA002456, https://doi.org/10.1029/2022EA002456, 2023. a, b
Schleiss, M. and Berne, A.: Identification of dry and rainy periods using telecommunication microwave links, IEEE Geosci. Remote S., 7, 611–615, 2010. a
Turko, M., Gosset, M., Kacou, M., Bouvier, C., Chahinian, N., Boone, A., and Alcoba, M.: Rainfall measurement from commercial microwave links for urban hydrology in Africa: a simulation framework for sensitivity analysis, J. Hydrometeorol., 22, 1819–1834, 2021. a
Ulaby, F. T., Moore, R. K., and Fung, A. K.: Microwave remote sensing: Active and passive. volume 1-microwave remote sensing fundamentals and radiometry, Addison-Wesley Publishing Company, Advanced Book Program/World Science Division, https://books.google.fr/books?id=56AsAQAAMAAJ (last access: 13 January 2025), 1981. a, b


