the Creative Commons Attribution 4.0 License.
the Creative Commons Attribution 4.0 License.
 | 13 Aug 2025
Aircraft evaluation of MODIS cloud drop number concentration retrievals
Scarlet R. Passer
Mikael K. Witte
Cloud drop number concentration (Nd) can be retrieved through passive satellite observation. These retrievals are useful due to their wide spatial and temporal coverage. However, the accuracy of the retrieved values is not well understood. In this study, we seek to understand why the retrievals agree or disagree with in situ measurements by examining the various cloud properties that underlie the retrievals. To do so, we compare satellite Nd derived from the Moderate Resolution Imaging Spectroradiometer (MODIS) instrument with in situ aircraft measurements made using a phase Doppler interferometer on board three flight campaigns sampling marine stratocumulus clouds. Intercomparison of Nd values shows that the discrepancy between retrieved and in situ Nd can be ± 50 % or more. In the mean, there is evidence of an overestimation bias by MODIS retrievals, although the sample size is insufficient for statistical certainty. We find that MODIS Nd is best interpreted as representative of the mid-cloud region, as there is almost always a greater discrepancy from in situ values near the cloud top and cloud base. We also find evidence of cases where Nd is accurately retrieved but the effective radius is not, presumably due to offsetting errors in other retrieval parameters. Vertical profiles of the extinction coefficient β, liquid water content L, and effective radius re measured during sawtooth-pattern flight legs through the cloud top are also compared to implicit MODIS retrieval profiles. For the two cases with Nd agreement, all profiles match well. For the six cases with significant disagreement, there is no consistent underlying cause. The discrepancy originates from one of the following: (a) discrepancy in the re profile, (b) discrepancy in the β and L profiles, or (c) discrepancy in both.
- Article
(5944 KB) - Full-text XML
- BibTeX
- EndNote


Cloud drop number concentration (Nd) is a fundamental property of clouds. This property is relevant to numerous effects that clouds have on weather and climate. For example, clouds with higher Nd will have a larger albedo (assuming all else equal), which in turn will lead to a larger solar reflectance (Twomey, 1977). The ability of a warm (i.e., ice-free) cloud to form precipitation is also dependent on Nd. A cloud with very high Nd will not produce appreciable rainfall rates because the drops are unable to grow to the required sizes to efficiently sediment, while at the other extreme of very low Nd, warm clouds produce precipitation very effectively (Sorooshian et al., 2009). Understanding and evaluating aerosol–cloud interactions frequently involves Nd, as activation of particulate matter is one of the strongest connections between aerosol and clouds (Bellouin et al., 2020; Quaas et al., 2020; Gordon et al., 2023).
Passive satellite observation is one of the primary methods that we have to measure and understand the climatology of Nd at large spatial and temporal scales (e.g., Bennartz, 2007; McCoy et al., 2018, 2020; Christensen et al., 2022). The Moderate Resolution Imaging Spectroradiometer (MODIS) instrument on board the Terra and Aqua satellites is one important source of satellite observations of Nd. A review paper by Grosvenor et al. (2018) comprehensively surveys our understanding of Nd derived from remote sensing, so we focus this Introduction only on aspects that are directly relevant for this study. A theoretical analysis by Bennartz (2007) suggests that, for cloud fractions over 80 % and a liquid water path (LWP) > 30 g m−2, i.e., conditions relevant to the stratocumulus (Sc) clouds observed in this study, MODIS Nd retrievals should exhibit relative errors < 80 %, a value which Grosvenor et al. (2018) is in agreement with. These errors are mainly due to uncertainties in retrieving the effective radius re, LWP, cloud optical depth τc, and cloud fraction.
There are a handful of past studies that assess the agreement between in situ aircraft measurements and satellite retrievals of Nd. Painemal and Zuidema (2011) use data from the National Center for Atmospheric Research (NCAR) C-130 aircraft measuring Sc in the Southeast Pacific during the Variability of the American Monsoon Systems Ocean-Cloud-Atmosphere-Land Study (VOCALS). They find good agreement in the mean for the 19 cases that they examined, with the assumption that the liquid water profile is adiabatic. Of the 19 cases, two had large discrepancies (30 % to 50 % discrepancy) that they attribute to sub-adiabaticity. Their cases span a wide range, from < 50 cm−3 to > 300 cm−3. They also find that the assumption that Nd is constant with height is valid for their cases. However, Grosvenor et al. (2018) point out that their strong agreement occurs not necessarily because the underlying measurements are accurate but is due to an overestimate of the effective radius almost exactly offsetting an overestimate of the cloud adiabaticity. Min et al. (2012) also analyze data from VOCALS but combine NCAR C-130 and U.S. Department of Energy (DOE) G-1 aircraft data and find that, without accounting for adiabaticity, MODIS overestimates Nd relative to aircraft measurements, with a mean bias of 25 %. If measured adiabaticity is used, then no statistically significant bias is detected, with most of their 17 cases appearing to agree to within 50 % (two outliers are noted). A third study (Bennartz and Rausch, 2017) compares results from their updated algorithm to the same VOCALS results from Painemal and Zuidema (2011). They find a modest bias (less than 20 cm−3) between aircraft and MODIS and an average uncertainty of ∼ 35 cm−3. McCoy et al. (2018) utilize a much larger data set, but in order to do so, they greatly relax the requirements for the co-location of aircraft and satellite observations in both space and time. They compare aircraft measurements with the satellite retrieval averaged over 3 d for the closest 3° × 3° area. They find the average agreement to be much poorer than that of these previous studies (r2 = 0.46), but this may simply be a matter of not measuring the same cloud at the same time.
Gryspeerdt et al. (2022) compare many aircraft field campaigns with satellite-retrieved Nd, although only a subset of these focused on stratiform clouds. Their data set is a mixture of different instruments and different aircraft platforms. If we examine only their results from Sc projects, they find r2 values between 0.5 and 0.75. Restricting the data using different filters can somewhat increase r2, though the range for Sc-only campaigns remains about the same. The best-fit slope of the in situ vs. MODIS data for Sc-only campaigns is, with one exception (discussed next), close to 1, suggesting no mean bias. Variability of the data is high, however, with many measurements disagreeing by a factor of 2 or more. The one project that is the exception, i.e., the project that exhibits significant bias between in situ and satellite-derived Nd, is, surprisingly, from the analysis of NCAR C-130 data from VOCALS. The slope is very noticeably different from 1, with MODIS exhibiting larger values relative to the aircraft. This result appears to disagree with the three other studies that focus on VOCALS (described above). The source of this disagreement is unclear.
Broadly speaking, these comparisons, with some exceptions, paint a rather optimistic picture for Nd retrievals. Most of these studies suggest that MODIS retrievals are better than the theoretical 80 % relative uncertainty proposed by Bennartz (2007), albeit these are not all the same retrievals (many of the studies filter the data in various ways to assess which conditions are most favorable for an accurate retrieval). However, given that many of these studies focus on the VOCALS field campaign and utilize in situ cloud probes with the same operating principle (with Gryspeerdt et al., 2022, being the exception to both), it would be informative to broaden the type of cloud and instrument used for evaluating satellite Nd retrievals. There are reasons to believe that the in situ measurements on board the C-130 from the VOCALS campaign may have biases. Past studies (e.g. Painemal and Zuidema, 2011) attribute biases between the in situ and MODIS-retrieved effective radius from VOCALS to issues with the satellite retrievals (e.g., due to three-dimensional radiative effects or unresolved horizontal heterogeneity). However, Witte et al. (2018), using aircraft data from a phase Doppler interferometer (PDI) during three different Sc field campaigns, find no bias between in situ and MODIS re. They instead find that the bias when using the older cloud probes is correlated with the breadth of the drop size distribution, which they attribute to difficulties that such probes have measuring larger drops. However, this issue may affect the estimation of re differently than for Nd, so it is unclear what the consequences are, if any, of such instrument limitations.
The focus of this study is to compare MODIS retrievals against in situ measurements from three Sc-focused field campaigns using PDI data from the Twin Otter in order to evaluate the accuracy of the satellite Nd product. These are the same data sets as used in Witte et al. (2018). Importantly, we also evaluate the validity of the assumptions underlying the retrievals through an analysis of the vertical profiles of cloud properties, which, to our knowledge, previous studies have not examined in detail. When we find good agreement, is it because the underlying properties are also in agreement, or are there cases of canceling errors? When we find poor agreement, is there one consistent reason for it, or is there a diversity of reasons?
1.1 Satellite Nd retrieval
The most common method for retrieving the number concentration utilizes the following equation (Grosvenor et al., 2018):
Cloud optical depth τc and cloud top effective radius re are the two (mostly) independently retrieved quantities used in the Nd retrieval, where re is defined as
where n(r) is the drop size distribution as a function of the drop radius r. Retrieved Nd is more sensitive to the same relative uncertainty in retrieved re than τc due to the difference in the magnitude of the exponents ( versus ) in Eq. (1). Density of water ρw is known, and the remaining variables (adiabatic fraction fad, water content lapse rate cw, a constant that relates the mean-volume and effective radii k, and the extinction efficiency factor Qext) are considered fixed as described below. To produce an estimate of re from aircraft suitable for comparison with that from MODIS, a weighting function is used to weight the impact of the cloud vertical structure on the aircraft-derived variables (Platnick, 2000):
Here, b=2, a is a normalization constant, and μ and μ0 are the cosine of the sensor and solar zenith angles, respectively. The weighting function describes, as a function of the cloud optical depth, how much influence the measurement from a given region of a cloud has on satellite-derived variables. This function peaks within a few tens of meters of cloud top (Platnick, 2000; Witte et al., 2018), and therefore the effective radius reflects values in this cloud top region.
Cloud optical depth τc is defined as the vertical integral of the extinction coefficient β(z):
where ztop and zbase are the altitude of the cloud top and cloud base, respectively.
At any altitude, β(z) is related to the cloud drop size distribution n(r,z), for which we now include the dependence on altitude z:
The remaining variables in the Nd retrieval (Eq. 1) are described as follows.
-
Nd is assumed to be a constant with respect to height in the cloud; i.e., Nd(z) = constant.
-
k is defined as
where rv is the volume-mean drop radius. The MODIS retrieval assumes that k=0.8. Previous studies suggest that k is well-constrained in stratocumulus clouds, typically ranging between 0.7 and 0.9 (Miles et al., 2000; Lebsock and Witte, 2023).
-
Qext is the extinction efficiency (dimensionless) and represents the ratio between the extinction and geometric cross sections of a drop. It is a function of the drop radius r, but because the radius of the drops of interest is usually much larger than the wavelengths of light used for the retrievals, it can be assumed that Qext=2 (the limit for geometric optics) (Platnick, 2000).
-
cw is the adiabatic gradient of liquid water content L with respect to height and is a weak function of temperature and pressure. From Eq. (14) in Grosvenor et al. (2018), we compute a value of cw = 2.3 × 10⁻⁶ kg m−4. We assume cw to be constant vertically through a cloud, which should introduce an error that is less than 1 % because the stratocumulus clouds observed in this study are quite geometrically thin (< 500 m) (Grosvenor et al., 2018).
-
fad is defined as the fraction of cloud liquid water content relative to its adiabatic value at a given height above the cloud base. The MODIS retrieval assumes fad=0.6. Combining the definitions of cw and fad yields the profile of liquid water content:
Implicit retrieval profiles
The MODIS retrieval implicitly assumes specific vertical profiles of re, β, and L. These profiles, along with the cloud base height, can be derived as follows.
-
The cloud top liquid water content is computed as
-
The liquid water content profile L(z) is defined above (Eq. 7).
-
Cloud base height zbase is determined by the altitude where L(z)=0. By re-arranging Eq. (7) and applying it at z=ztop, we get
-
re(z) is derived starting from the definition of rv:
This can be re-arranged in terms of re:
-
β(z) is derived by substituting the definitions of re and L into Eq. (5), which yields (Grosvenor et al., 2018)
In order to better identify the source of any discrepancies between MODIS and in situ Nd, the vertical profiles re(z), β(z), and L(z) that are inherent in the MODIS algorithm for estimating Nd will be compared to in situ observations of the same quantities, along with cloud base height zbase. There are a number of potential sources of uncertainty, including the MODIS retrievals of re and τc, as well as the validity of the above assumptions.
2.1 In situ observations of Nd
2.1.1 Aircraft observations
In situ data were acquired during three different flight campaigns that sampled marine stratocumulus clouds: the Marine Stratus/Stratocumulus Experiment (MASE; Lu et al., 2007), the Physics of Stratocumulus Top experiment (POST; Carman et al., 2012; Gerber et al., 2013), and VOCALS (Mechoso et al., 2014; Zheng et al., 2011). All three of these campaigns used a phase Doppler interferometer (PDI) on board the CIRPAS Twin Otter (TO) aircraft to derive cloud microphysical properties. See Chuang et al. (2008) for details about the PDI measurement method and data processing.
The MASE campaign was flown in the Northeast Pacific near Monterey, California, during July 2005. VOCALS was centered off the coast of Chile in the Southeast Pacific and was flown from October to November of 2008. Flights during the MASE and VOCALS campaigns utilized level legs (i.e., flight segments flown at constant altitude and heading for a sustained period, usually 10 min for the flights analyzed in this work), which sampled from below the cloud base to near the cloud top. POST was flown slightly farther offshore in a similar location as for MASE, during July and August of 2008. From the POST campaign, we analyze flight legs that were flown in a sawtooth pattern, flying repeatedly up and down between ∼ 100 m below the cloud top to ∼ 100 m above. Overall, we analyze four flight days from MASE, 10 from VOCALS, and eight from the POST campaign, as these flights coincide with a MODIS overpass. More details on matching the aircraft flights with MODIS overpasses can be found in Witte et al. (2018).
The PDI measurements from these three field campaigns have been used to analyze the retrieval of the cloud effective radius from MODIS. Previous studies (Painemal and Zuidema, 2011; Min et al., 2012; Noble and Hudson, 2015) have suggested that MODIS retrievals of re are biased high by 2 to 5 µm relative to in situ measurements, but using the same data set as in this study, Witte et al. (2018) found no such bias, with MODIS and in situ measurements agreeing within 0.7 µm in the mean. They attribute observed bias to issues with the in situ aircraft instrumentation used in previous studies. This consideration suggests that, in the mean, there is no bias in retrievals of Nd due to a bias in retrieved re, an assertion that we will evaluate as part of our analysis.
2.1.2 In situ Nd and re calculations
To estimate the cloud drop number concentration from PDI, in-cloud sampling legs are analyzed for each flight. To be consistent with MODIS, data from near the cloud top are used to derive re. In contrast, because the satellite retrieval assumes Nd is constant throughout the cloud, mid-cloud data are used to derive the number concentration, as this location is more representative of the mean cloud Nd value relative to the cloud top values (as will be shown below).
For the VOCALS and MASE campaigns, we analyze the mid-cloud and cloud top level legs. However, the POST campaign primarily used a sawtooth flight pattern. Therefore, we define cloud top as the altitude where liquid water content crosses a threshold of L = 0.05 g m−3, a commonly used threshold in the airborne science community. The effective radius is calculated from within 10 m of this cloud top. We use the range between 60 to 90 m below the cloud top as an analog to level mid-cloud legs to calculate a representative value of Nd during POST. While this altitude range does not correspond to “mid-cloud” in the sense of cloud geometric thickness, this region is typically far enough from the cloud top to avoid the impacts of entrainment mixing.
For ease in comparing MODIS implicit cloud profile estimations to observation, we create a shifted altitude (zshift) for POST, which is defined by zshift=0 at the cloud top; i.e., . To perform this coordinate transformation, we determine the altitude of the cloud top (ztop) for each individual ascent or descent (or “leg”) of the sawtooth flight path (using the threshold L = 0.05 g m−3). All in situ measurements for each leg are referenced to zshift for that leg. More details about the altitude shifting process can be found in Carman et al. (2012).
For the purpose of making a more like-to-like comparison between PDI and MODIS, the number concentration and effective radius measured along their respective legs are averaged over 1 km (20 s) intervals to match the MODIS spatial resolution. The mean and variability of Nd and re for each 10 min (or ≈ 30 km at a mean true airspeed of 55 m s−1) flight leg are calculated from these 1 km average values, which is the uncertainty that we show in the results (below). This variability does not reflect any uncertainty due to differences in the spatial domain sampled, as well as any temporal differences in the sampling, which are difficult to assess.
The main source of instrumental uncertainty is the uncertainty in the instrument view volume. The view volume, in units of volume of air sampled per second, is the product of three values. The first is the probe “length”, which is calculated for each flight from the collected data itself (using the method from Chuang et al., 2008), so day-to-day variation should be accounted for to well within 5 %. The second value is the aircraft true air speed, which is known quite accurately, almost certainly to within 5 %. The third value is the probe “width”, which is fixed by the optical hardware. Recent in-depth laboratory examination of this subject (Leandro, 2023) suggests that this width may be smaller than the theoretical value for very small drops, which would lead to an under-estimation of Nd, but mostly affects larger values of Nd (which tend to exhibit smaller drop sizes). We estimate that this bias could be as large as 10 % for Nd > 400 cm−3 and decreases to less than 1 % for Nd < 100 cm−3. Counting uncertainty is unlikely to be significant because many thousands of drops are observed for any given data point, so the Poisson standard deviation of would suggest an uncertainty of < 1 %. These instrumental uncertainties, when combined, produce an uncertainty of less than 20 %, which is almost always smaller than the observed spatiotemporal variability, which is why we report the latter.
2.1.3 Profile calculations
The Nd retrieval combines measurements of τc and cloud top re with assumptions about the cloud vertical structure (see Sect. 1.1). Therefore, specific vertical profiles of the effective radius, liquid water content, and extinction coefficient are implicitly assumed. Due to the sawtooth sampling strategy during the POST campaign, we can compare these assumed profiles with observations. We also evaluate the assumptions that k and fad are constant.
The profiles of L, re, and β are derived directly from cloud drop size distributions measured by the PDI and binned over 5 m increments within zshift space. Consistent with the satellite retrieval (Eq. 1), we also assume Qext=2 when calculating β. To determine the adiabatic liquid water content Lad(z), first, the mean altitude for the near-cloud base is identified using a threshold liquid water content of L = 0.1 g m−3. Next, cw is used to extrapolate downward to L = 0 g m−3, associated with the true cloud base zbase.
2.2 Satellite retrieval details and sampling methodology
We utilize MODIS collection 6.1 level 2 retrievals of re and τc using the 2.1 µm band (“Cloud_Effective_Radius” and “Cloud_Optical_Thickness” products, respectively) from both Aqua and Terra, consistent with the approach of Witte et al. (2018). Over the small sample size considered here, we find no evidence of systematic differences between satellites. Number concentration Nd is then calculated from re and τc using Eq. (1). A full description of the MODIS sampling methodology is given in Witte et al. (2018). Briefly, we analyze flight legs that occurred within 90 min of MODIS overpasses that covered the flight sampling area (most retrievals were within 30 min of their associated aircraft leg). We then select a 25 km2 (5 pixels × 5 pixels) area centered on the mean coordinates of the aircraft leg to compare with in situ measurements.
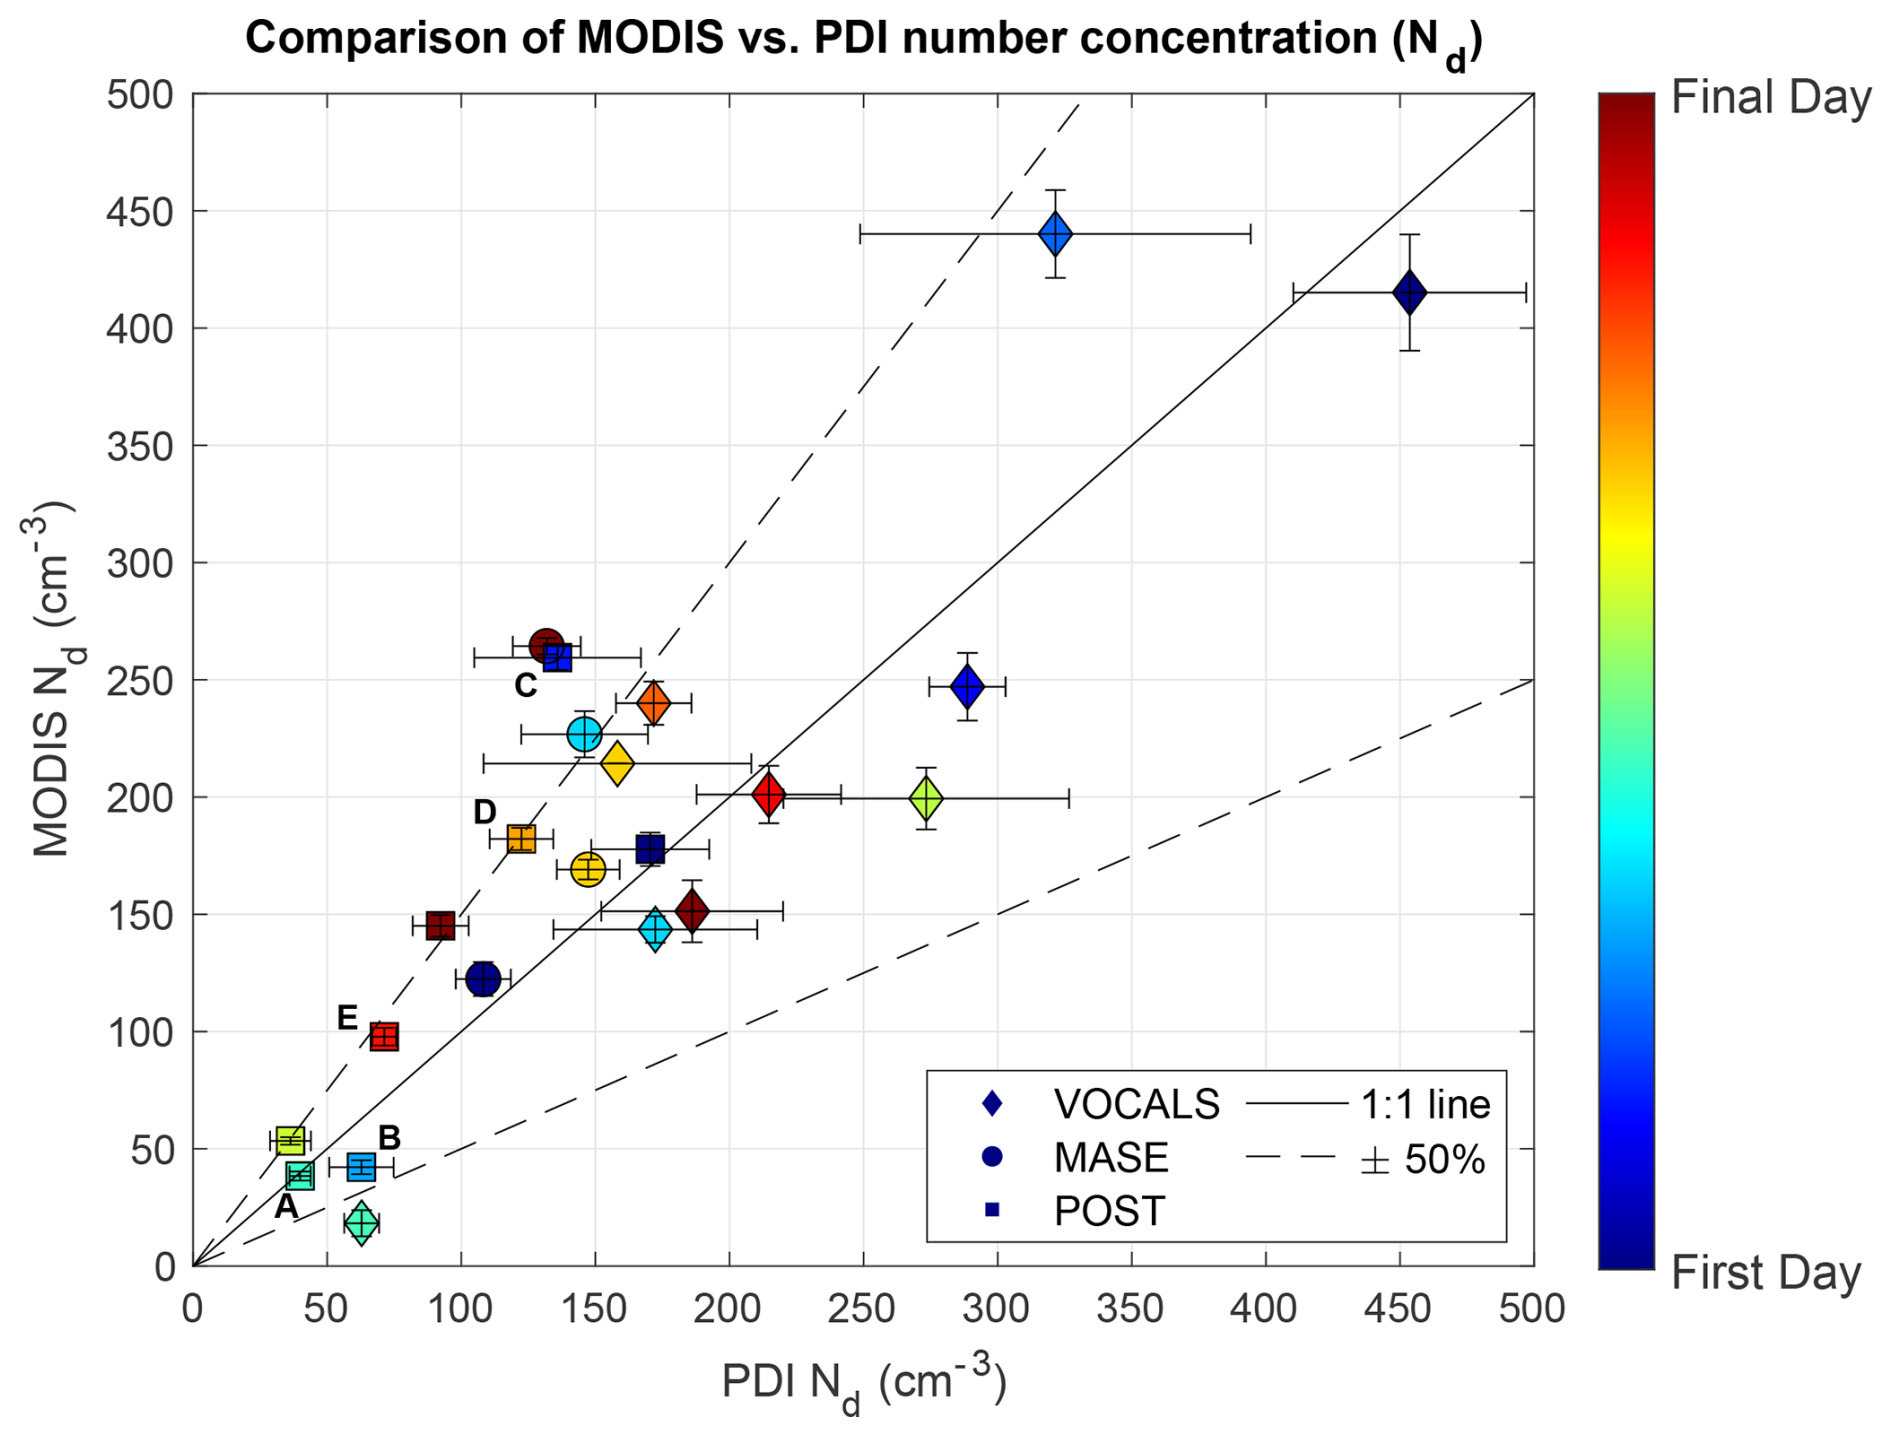
Figure 1Comparison of MODIS number concentration vs. PDI number concentration. PDI values are Nd averaged at mid-cloud for all flight legs on that day, and the uncertainty bar represents the 1σ variability of 1 km averaged values. Each flight campaign is marked by a symbol with a color ranging from the first day of the campaign to the last. Several POST days are labeled A to E, which represent specific cases discussed in Sect. 3.3. The MODIS Nd value is a 1 km average of a 5 km × 5 km swath (with 1σ variability uncertainty bars) obtained using Eq. (1), where the effective radius and optical depth are taken from the satellite products. A linear fit of the data produces a slope of 1.1 ± 0.14.
2.3 Uncertainty calculations
The uncertainty of any variable x is expressed as the 95 % margin of error:
where σx is the standard deviation of x, nx represents the total number of measurements, and the quantity z(0.95) is the z score for the 95 % confidence interval and has a value of 1.96. We choose margin of error versus standard error to reflect uncertainty in unsampled spatial variability because the aircraft samples a narrow transect through a 1 km × 1 km box, while MODIS senses photons arriving from the entire area.
The MODIS uncertainty is calculated from 1 km measurements over a 25 km2 area. PDI uncertainty is calculated from downsampled 1 km measurements over the relevant time interval of a given flight leg. Both the MODIS and PDI uncertainties are a reflection of spatial variability at 1 km. This measurement does not reflect instrumental uncertainty or error in the assumptions.
We first analyze Nd and re for all three campaigns. After that, we capitalize on the sawtooth legs from the POST flights to compare the profiles of k, fad, re, β, and L.
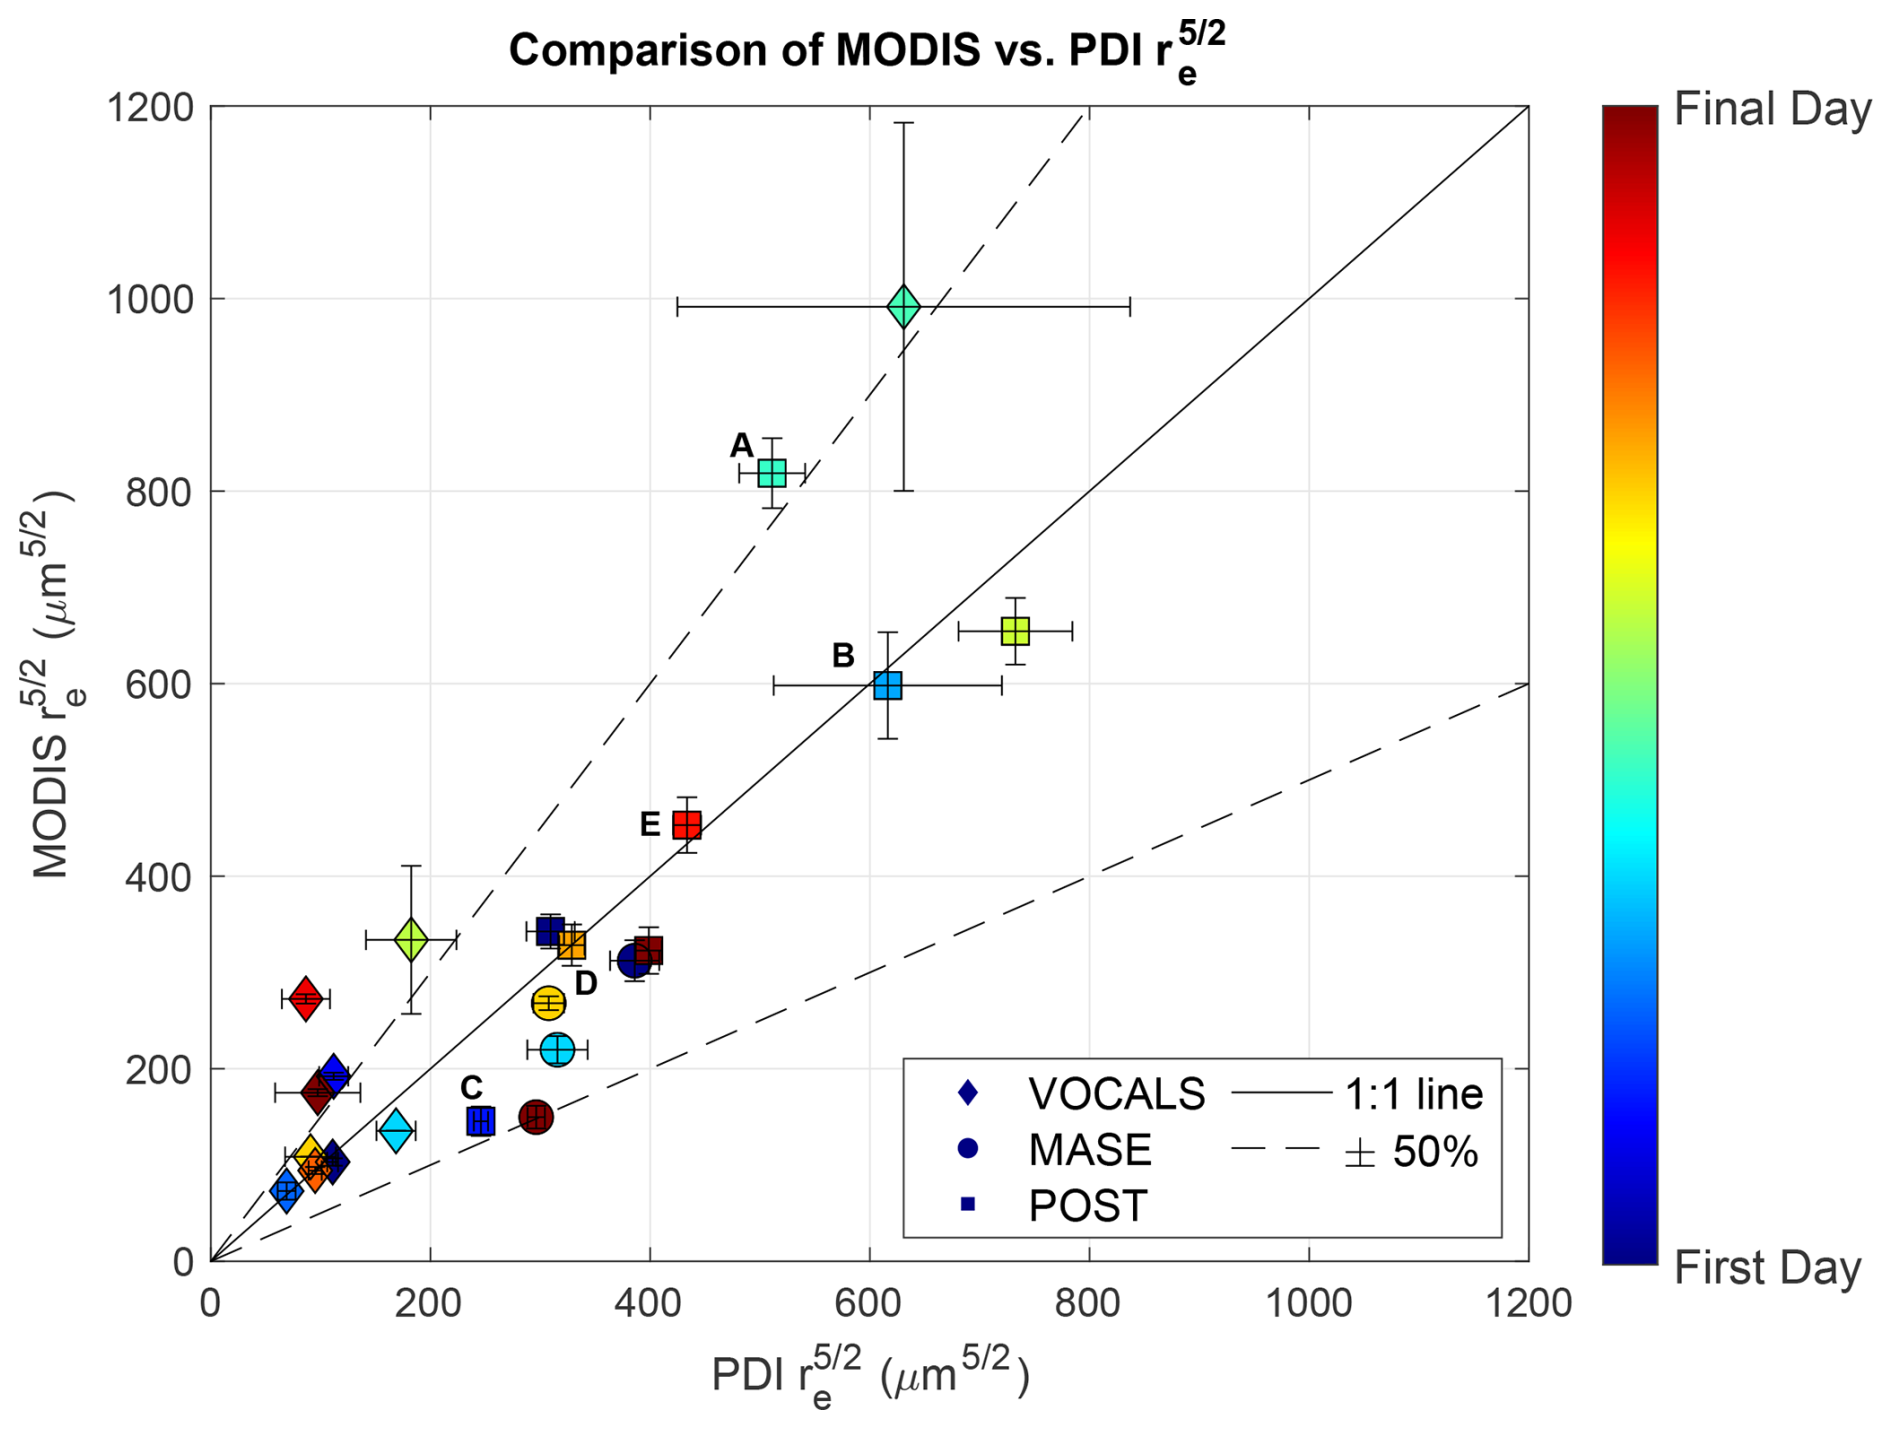
Figure 2Comparison of between PDI measurements and the MODIS-retrieved values. Satellite effective radius is the average of 5 km × 5 km swaths of the MODIS re product. The PDI value is re averaged for all cloud top flight legs on that day. A linear fit of the data produces a slope of 1.0 ± 0.07. Labels and uncertainty bars are the same as in Fig. 1.
3.1 Comparison between MODIS and PDI Nd
Figure 1 compares MODIS and PDI Nd for all three flight campaigns. Though the majority of flights agree to within 50 % (accounting for variability), there are several cases that exceed this range. Of those cases, most are overestimates by MODIS, with the one exception being VOCALS day 1 November 2008 (teal diamond in Fig. 1). At a population level, linear regression yields a slope of 1.1 ± 0.14 (95 % confidence interval). Although the one-to-one line is included in this confidence interval, there is a suggestion of an overestimation bias. However, because of the limited sample size, it is unclear if this is statistically significant.
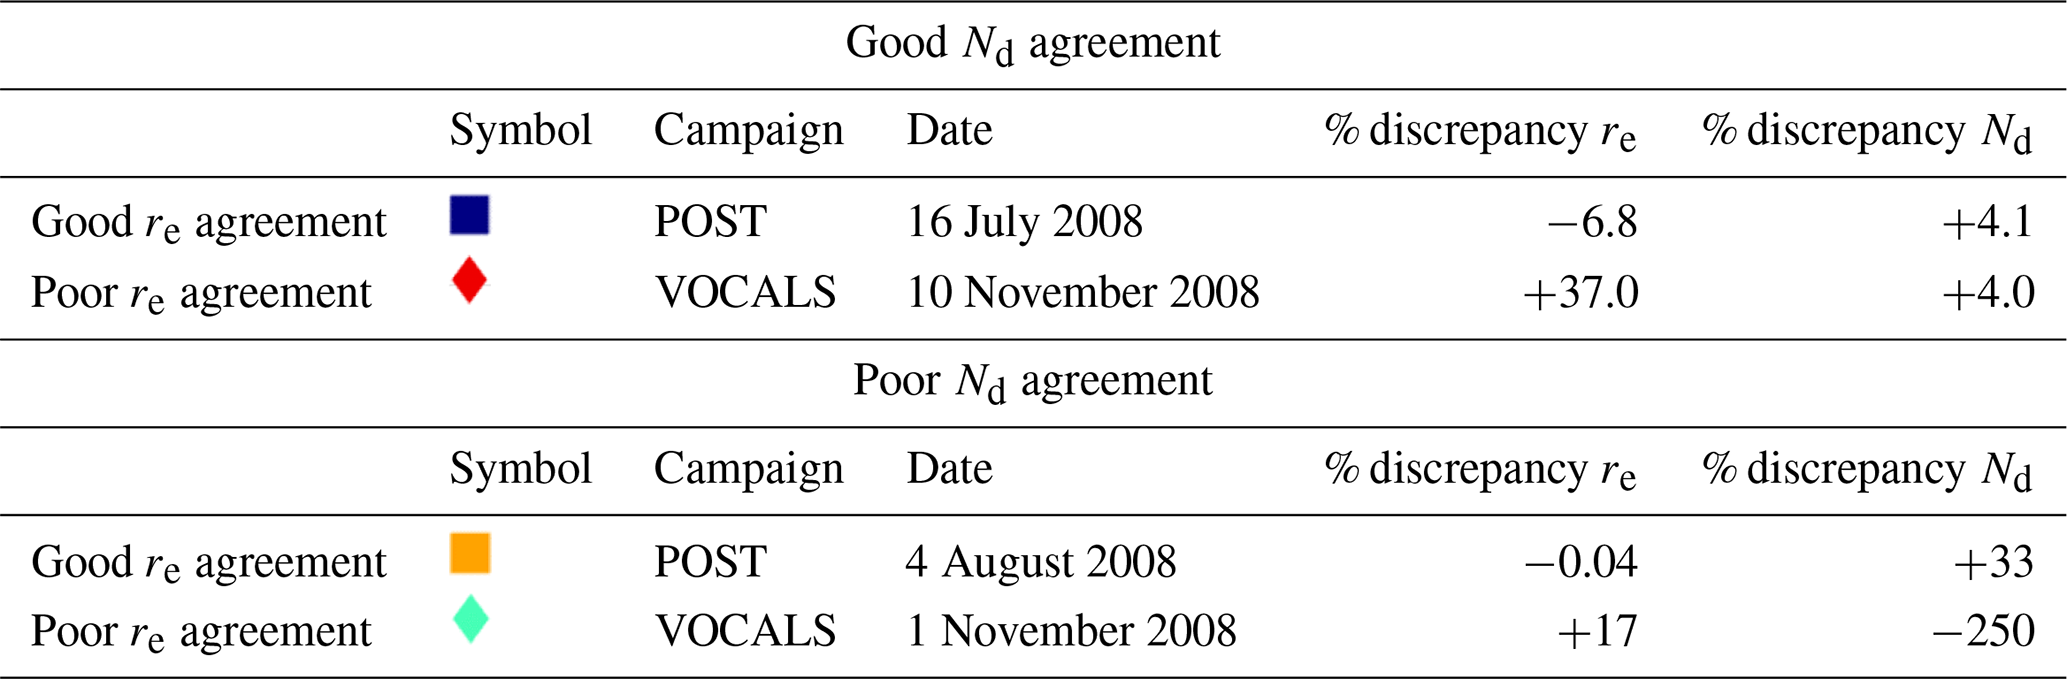
Table 1Examples of each of the four possible combinations of Nd and re agreement with their associated campaign, day, discrepancy, and corresponding symbol from Figs. 1 and 2. The finding that at least one case has a large discrepancy (37 %) in effective radius with a small discrepancy (4 %) in Nd implies that there are compensating errors in other retrieval parameters. In other words, it is possible to retrieve the right Nd for the wrong underlying reasons.
There are several questions that arise from this result. First, when the MODIS and PDI number concentration are in very good agreement (i.e., within sampling uncertainty of each other), is the satellite-retrieved Nd correct for the right underlying reasons, or are there multiple errors that offset each other? Second, when MODIS disagrees with PDI, which MODIS retrieval products and/or assumptions are responsible for the discrepancy? To investigate these questions, we further analyze and compare the underlying variables in the MODIS Nd retrieval.
3.2 Comparison between MODIS and PDI
Effective radius is the most influential term in the Nd calculation, and thus it is logical to speculate that good agreement between satellite and in situ re values would manifest as good agreement between the PDI and MODIS number concentration. Because MODIS (Eq. 1), Fig. 2 compares MODIS and in situ values across the three campaigns.
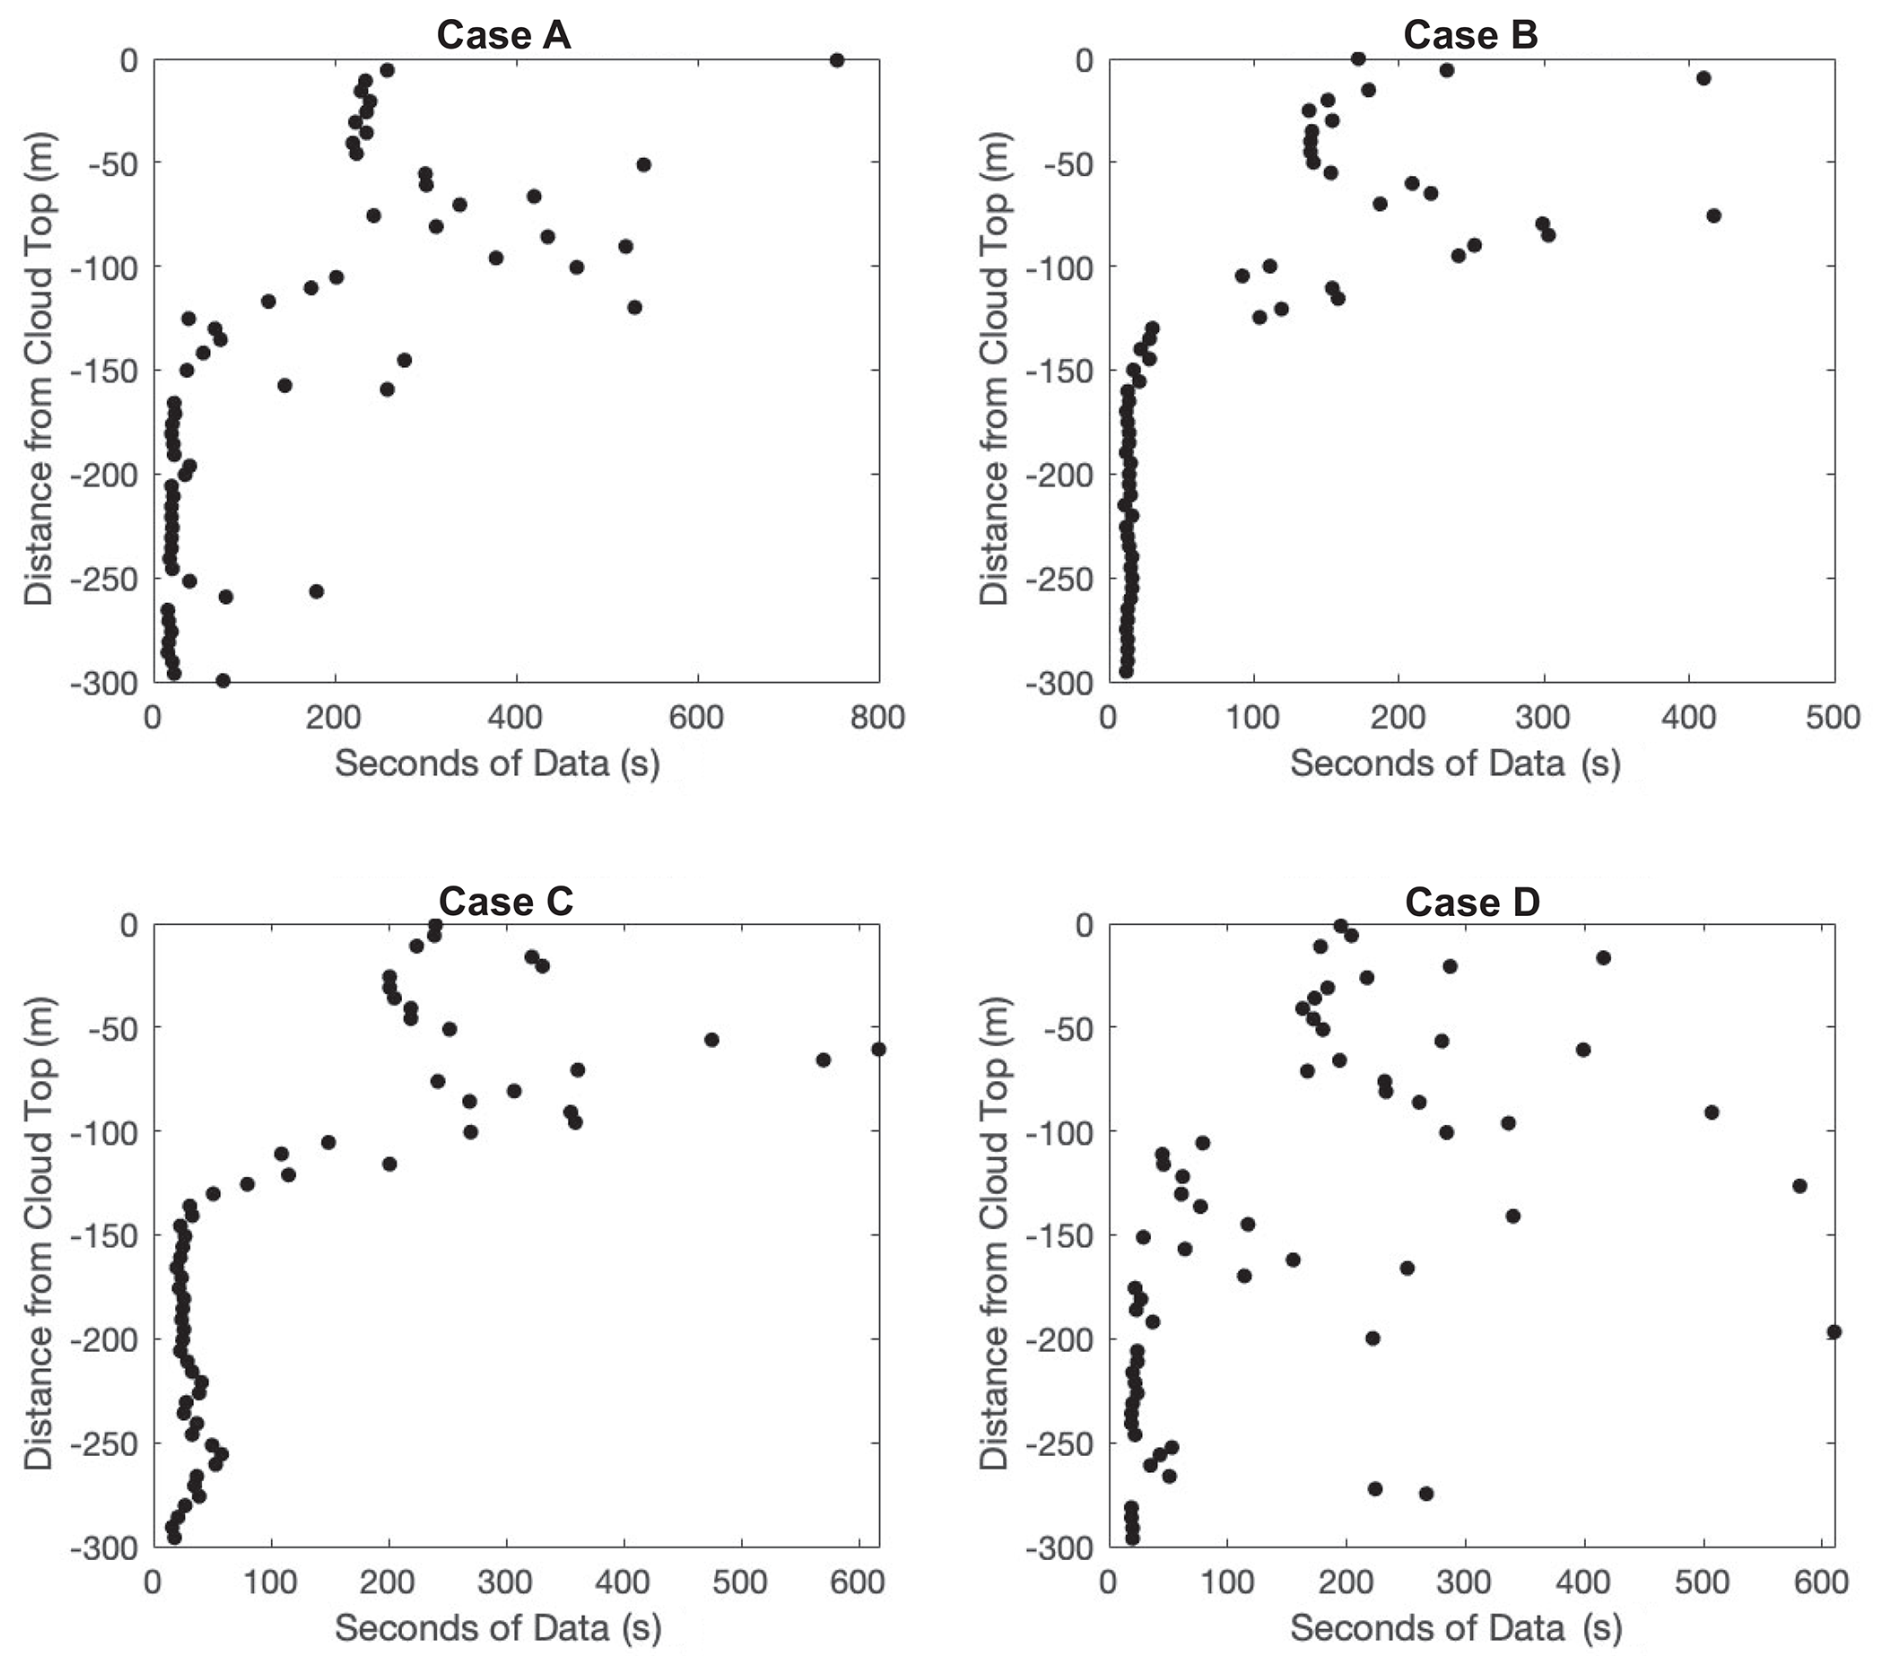
Figure 3Amount of data for four of the five POST flights selected for additional analysis. Points represent seconds of non-zero data within each 5 m zshift altitude bin and are concentrated within ∼ 150 m of the cloud top.
Figure 2 shows that there is a range of agreement between PDI and MODIS, with most of the days agreeing to within 25 %. A linear regression of the data produces a slope of 1.0 ± 0.07 (95 % confidence interval). This result is consistent with Witte et al. (2018), who found no significant bias between MODIS- and PDI-measured re. Additionally, if re was the determining factor in the accuracy of MODIS Nd retrievals, it would be expected that the potential high bias of MODIS Nd (Fig. 1) would correspond to a low bias in MODIS re. The data do not support this hypothesis, implying that the problem with the satellite estimation cannot solely be attributed to the effective radius.
On an individual flight basis, comparing Fig. 2 and Fig. 1 shows that agreement in Nd does not necessarily equate to agreement in and vice versa. In fact, there are four different scenarios that occur:
-
agreement in with agreement in Nd,
-
agreement in with disagreement in Nd,
-
disagreement in with agreement in Nd,
-
disagreement in with disagreement in Nd.
We illustrate one example of each case in Table 1. The finding that the re retrieval does not govern agreement of MODIS Nd leads us to further investigate the other variables in the MODIS Nd calculation.
3.3 Specific POST cases
The MODIS calculation for the number concentration implicitly relies on the vertical profiles of L , re, and β. These profiles combine MODIS measurements of τc and re with assumptions of cloud vertical structure (see Sect. 1.1). We compare these profiles with those measured by aircraft during the POST campaign. The sawtooth flight plan of POST allows for detailed profile comparisons. Five POST cases are selected to illustrate the range of behaviors observed across all eight POST flights analyzed in this manner. Figure 3 illustrates the amount of data for four of the cases. Most of the data is concentrated within 150 m of the cloud top. It is difficult to make statistically robust conclusions at altitudes below this region. Within these eight cases, we find two with excellent agreement between all observed and retrieved properties (one of which is explored in depth; see Case A). The other six are cases where Nd is not accurately retrieved. Among these cases, none represents an accurate retrieval of Nd with significant errors in the underlying retrieval properties that compensate for each other, although such cases do exist (see Table 1).
3.3.1 Case A: POST day 30 July 2008
Case A (Fig. 4) is an example of the best-case scenario for agreement between MODIS and in situ profiles. The PDI observed number concentration (open circles) calculated at mid-cloud is Nd = 40 ± 2 cm−3, while MODIS estimates Nd = 38 ± 4 cm−3 (solid red line). The satellite assumes that this number concentration is fixed throughout the vertical cloud profile. In reality, Nd is not constant with height but instead gradually drops off towards the cloud base and cloud top. We attribute lower values of Nd near the cloud top to cloud drop evaporation due to turbulent entrainment of warm, dry air from above the boundary layer. Low values near the cloud base may be an effect of an uneven cloud base, which affects the altitude range over which activation causes Nd to increase with height. In addition, the cloud base is typically higher in those portions of the cloud layer that experience downdrafts due to lower adiabaticity (Zhou and Bretherton, 2019), which can affect Nd in the cloud base region. Through the middle of the cloud, Nd does appear reasonably constant on average. Because constant Nd is consistent with the MODIS assumption, we use this as justification for the use of mid-cloud level legs for the MODIS–PDI Nd comparison.
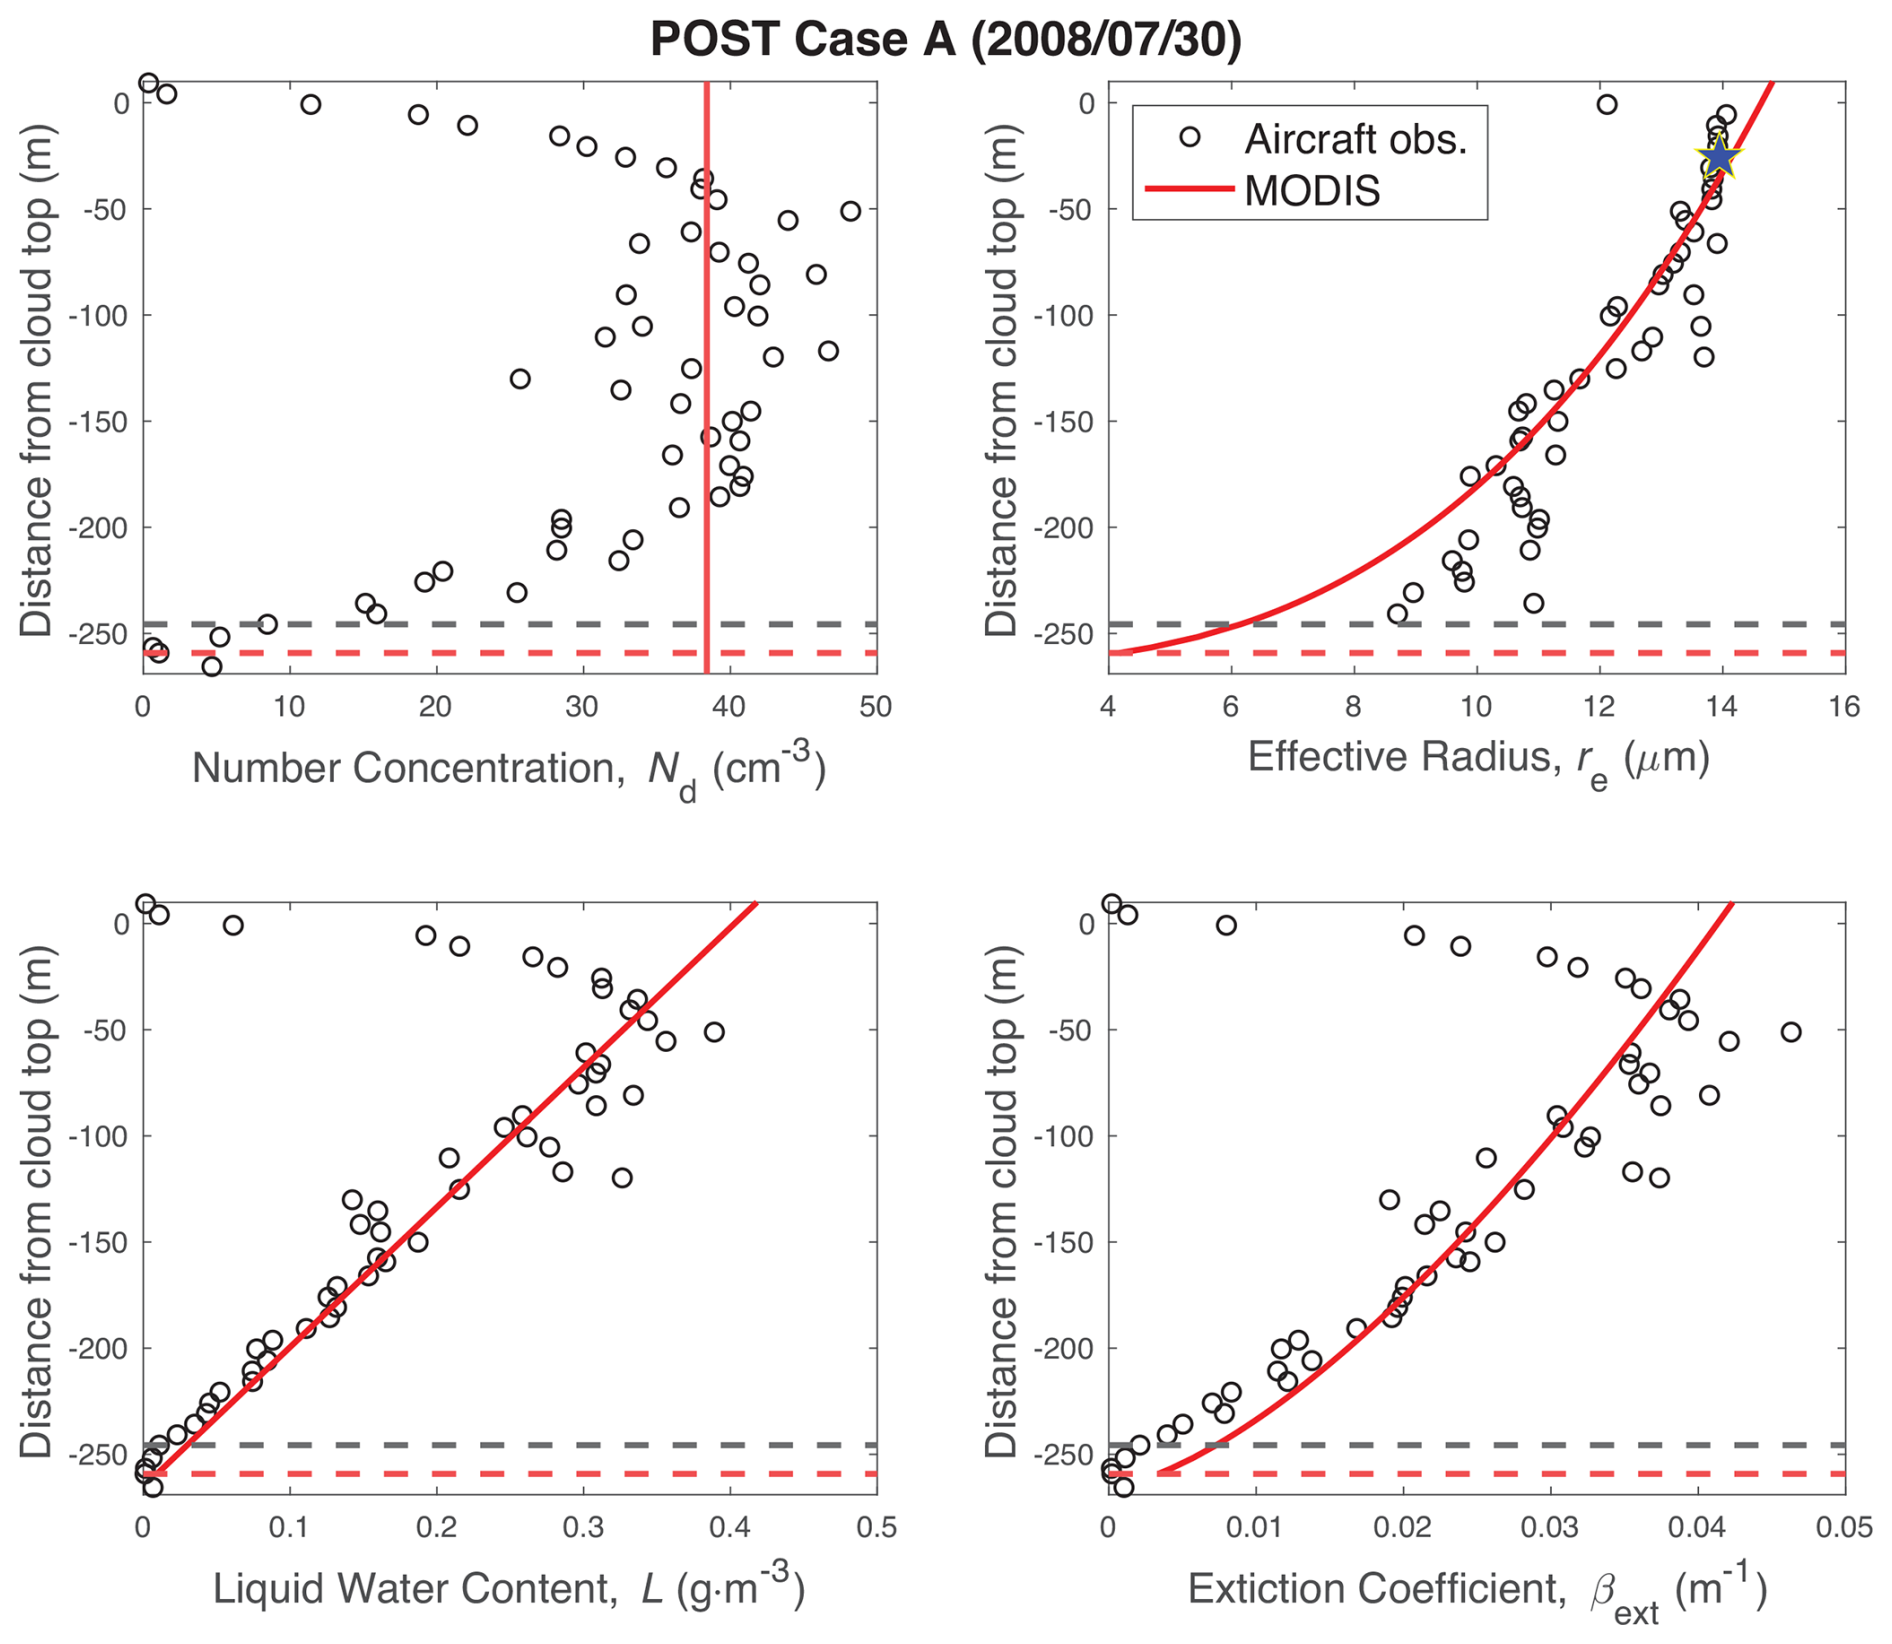
Figure 4Profiles of Nd, re, L, and β for POST Case A (30 July 2008) comparing aircraft data (circles) and MODIS retrieval profiles (red lines). The aircraft-measured cloud base is the black dashed line, while the MODIS-estimated cloud base is the red dashed line. Aircraft-derived re that most closely corresponds to the MODIS cloud top value is indicated by the blue star and is placed at an altitude determined by the max weight from Eq. (3). The MODIS retrieval profiles of Nd, re, L, and β are based on Eqs. (1), (10), (7), and (11), respectively.
The vertical profiles of L, re, and β all agree very closely during this flight. The MODIS estimate of the cloud top re (blue star) is plotted at an altitude determined by the weighting function (Eq. 3) and is consistent with the aircraft measurements. Lastly, the cloud base altitudes estimated by MODIS and the aircraft (red and black dashed lines, respectively) also agree well. The alignment between this full set of MODIS and aircraft observations results in an accurate estimate of Nd as long as we interpret this value as a mid-cloud estimate. However, this day represents only two of the flights where agreement across all quantities occurs.
3.3.2 Case B: POST day 21 July 2008
Unlike the strong agreement between MODIS and PDI seen in Case A, Case B (Fig. 5) illustrates a day in which all of the profiles have very poor agreement. The MODIS-retrieved number concentration is Nd = 42 ± 12 cm−3, while the in situ value is Nd = 63 ± 3 cm−3. This disagreement occurs despite the fact that the satellite cloud top effective radius (blue star) is well-matched to the PDI estimate (13.0 ± 0.9 µm vs. 13.0 ± 0.5 µm), indicating that cloud top re is not the source of the Nd disagreement.
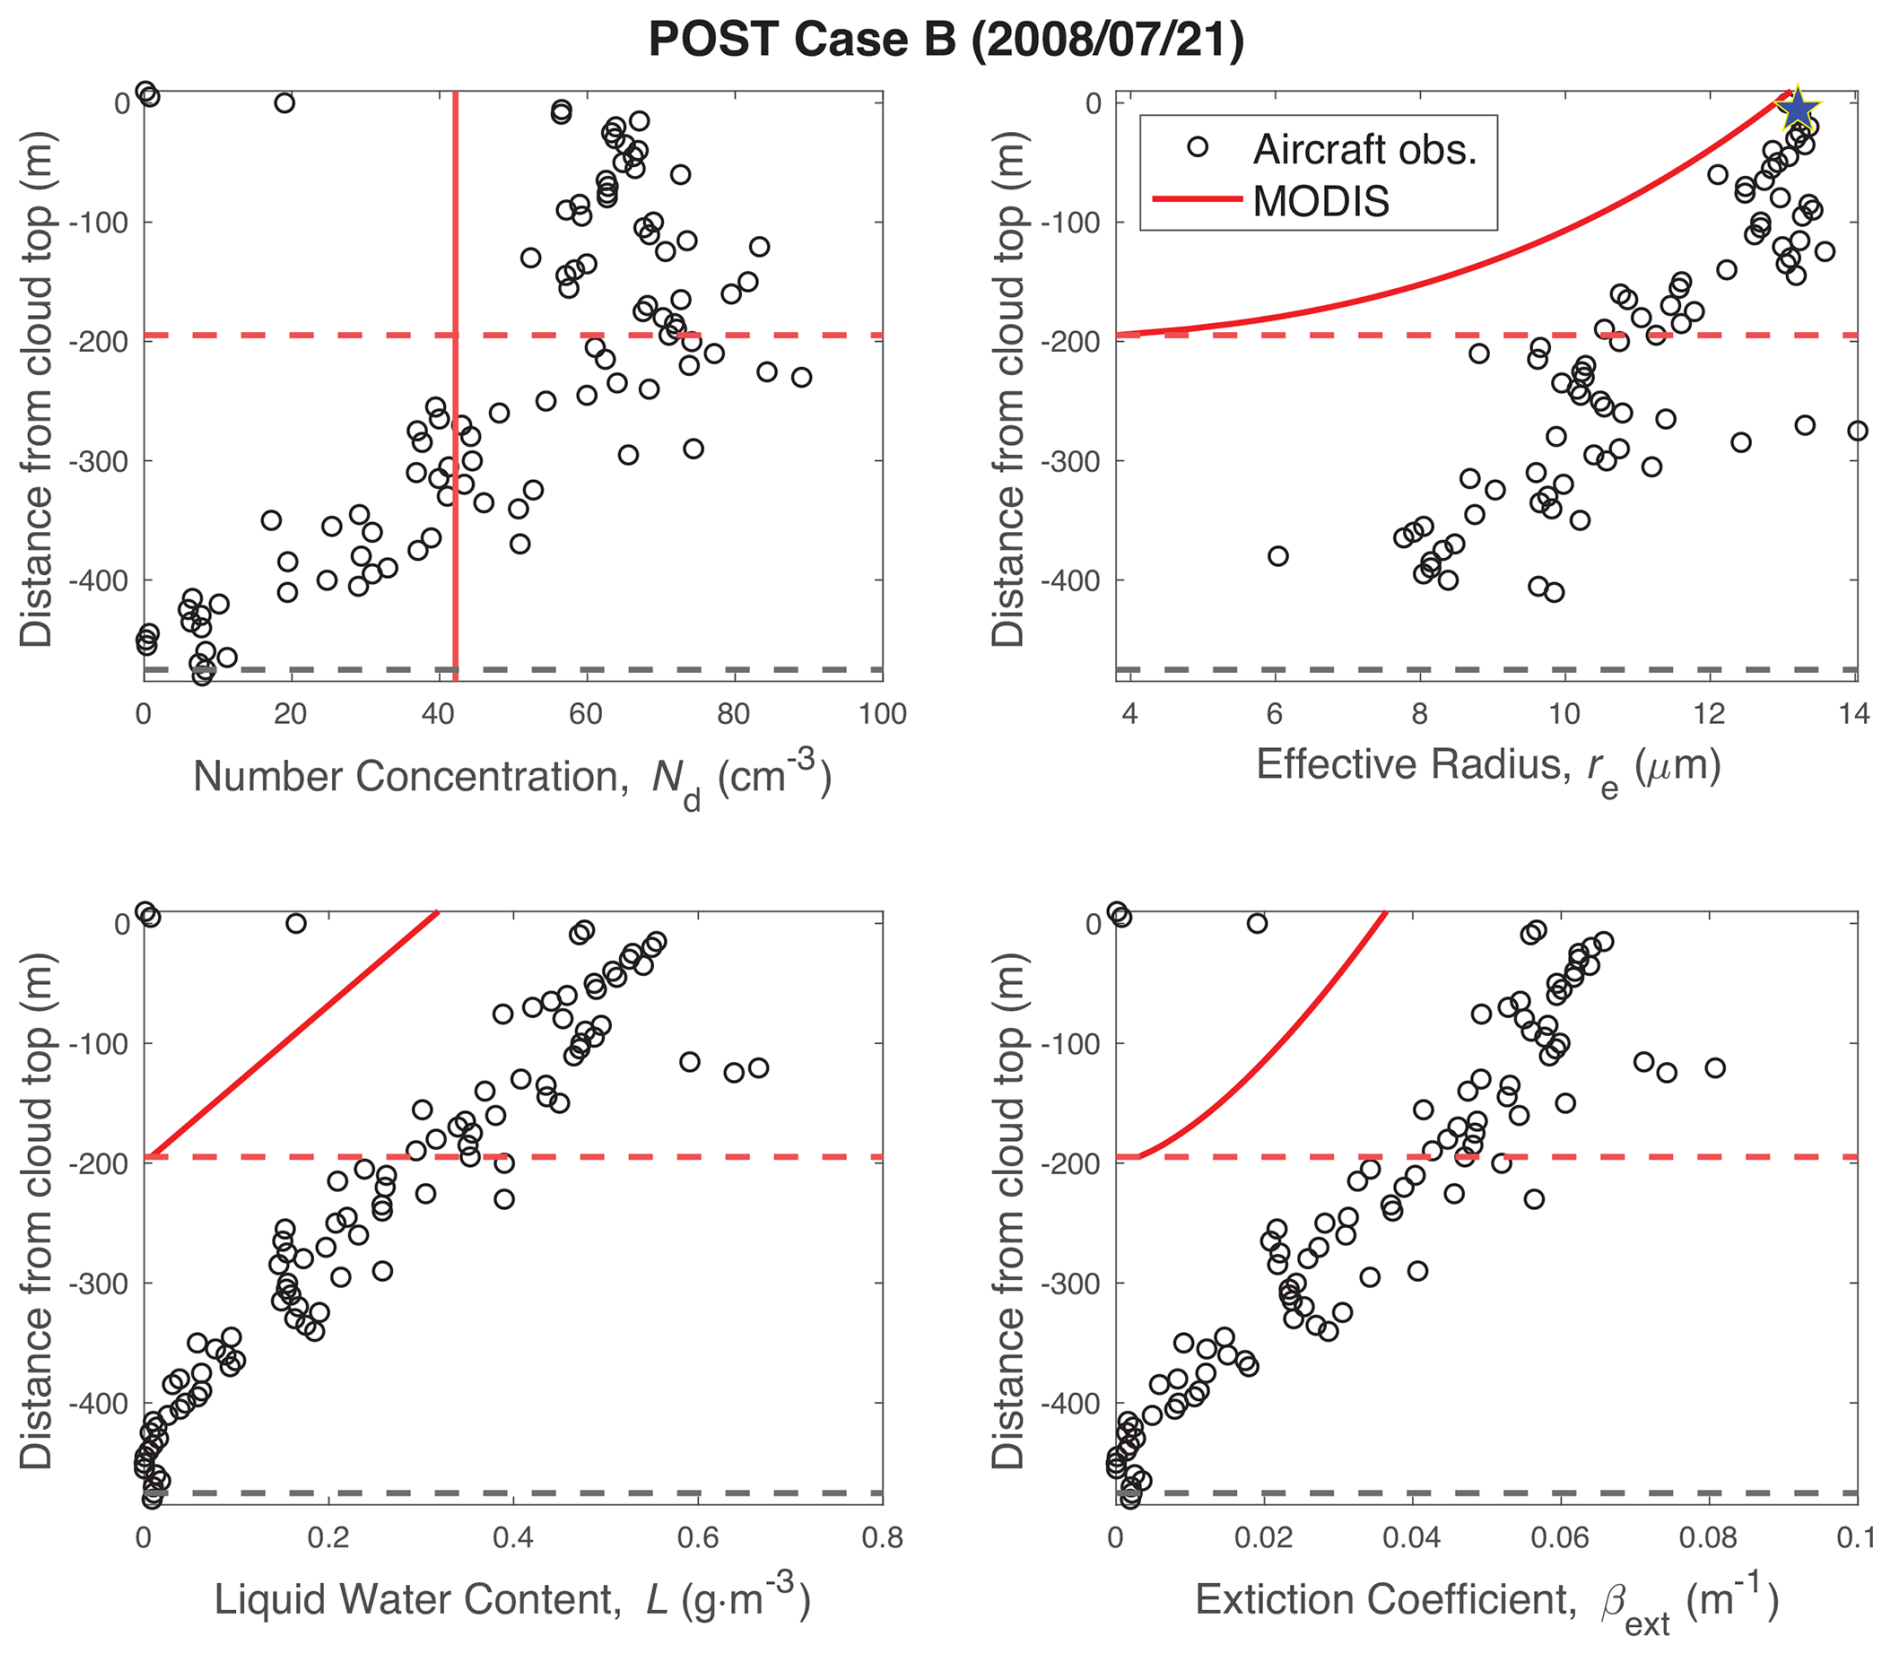
Figure 5Comparison of profiles of Nd, re, L, and β from aircraft observations (circles) and MODIS retrievals (red lines) for POST Case B (21 July 2008). See Fig. 4 for more details.
While the MODIS and PDI re profiles agree at the cloud top, at all other altitudes, MODIS greatly underestimates the effective radius. All else being equal, this should lead to an overestimation of Nd, which is not what we see. Instead, we attribute the MODIS Nd underestimation to disagreement with the MODIS τc retrieval. Any error in MODIS τc propagates to both the β and L profiles. Integration of the MODIS β profile results in a τc value smaller than observed, leading to an underestimation of Nd (), as seen in Fig. 5, as well as a cloud base that is too high, which is equivalent to a cloud that is too thin.
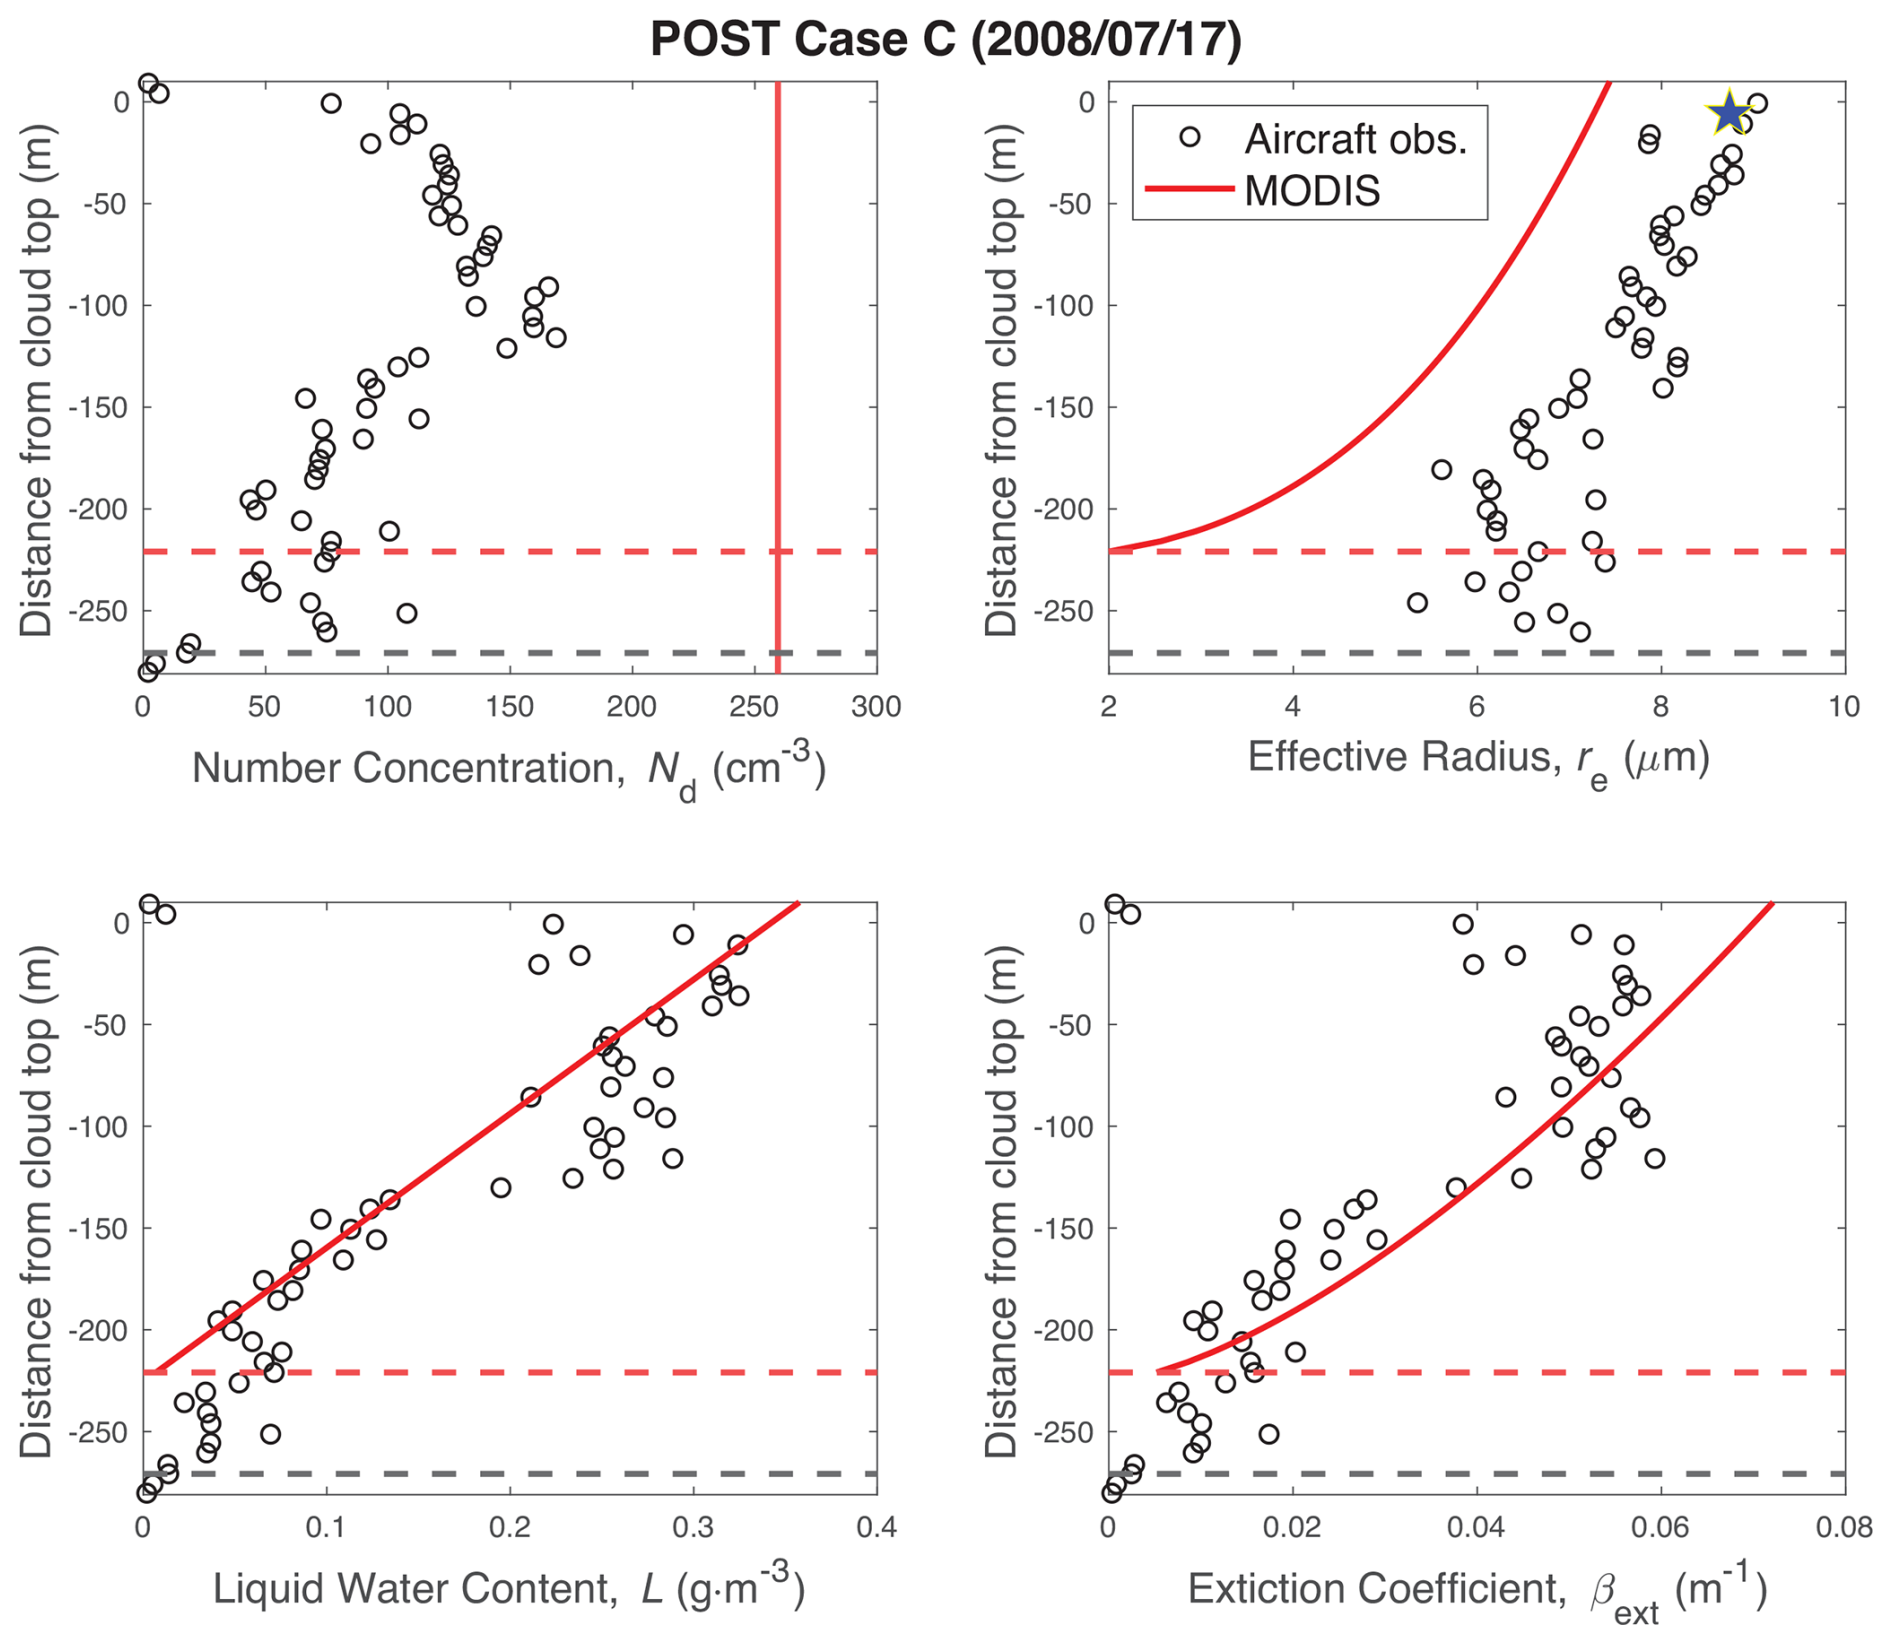
3.3.3 Case C: POST day 17 July 2008
During POST flight 2008/17/07, the MODIS number concentration is Nd = 260 ± 31 cm−3, almost twice the PDI value of Nd = 140 ± 5 cm−3 (Fig. 6). In contrast to Case B, we attribute the cause of this disagreement to the MODIS-retrieved cloud top re. The β and L profiles are in close agreement, presumably because the MODIS- and PDI-derived τc are in agreement. However, both the PDI cloud top re and the PDI re vertical profile are greater than the MODIS estimates, leading to the large overestimation of Nd.
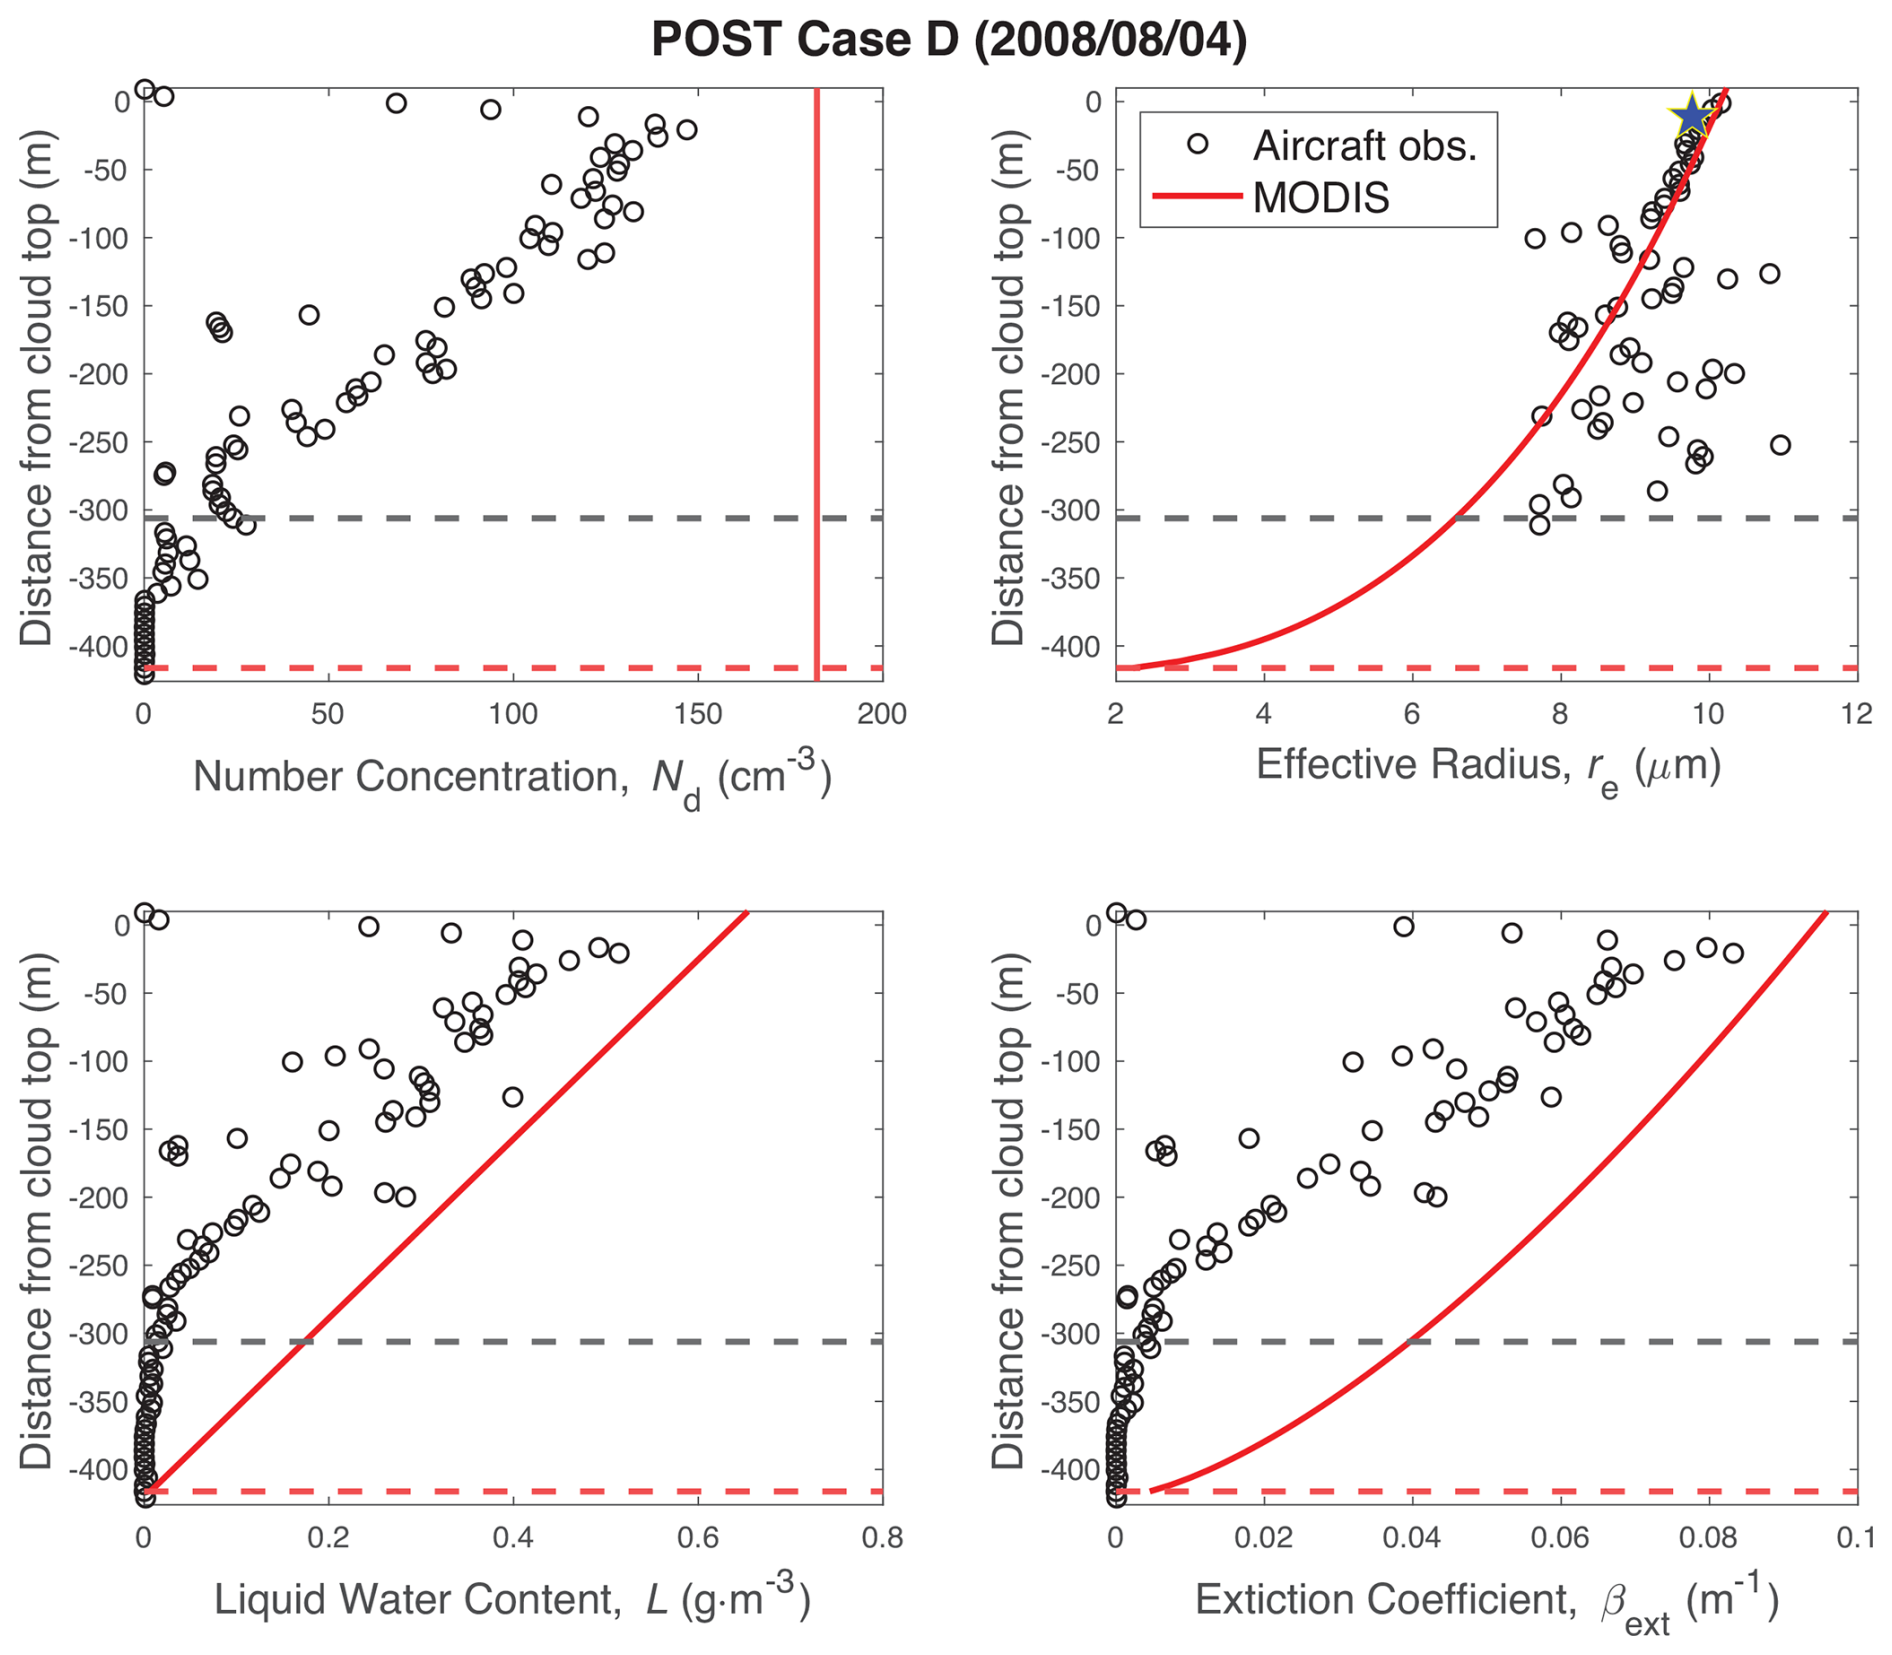
3.3.4 Case D: POST day 4 August 2008
MODIS overestimates the number concentration during POST Case D (4 August 2008), finding an Nd = 180 ± 12 cm−3 compared to a PDI value of Nd = 122 ± 5 cm−3 (Fig. 7). This case illustrates a day when the assumption that Nd is constant with altitude is not accurate, with the retrieval overestimating Nd at all altitudes. The re subplot shows that there is good agreement between PDI and MODIS in both the cloud top re value and the re vertical profile (in the region of most influence, i.e., within 50 m of the cloud top). However, the MODIS β and L profiles differ to a substantial degree from the PDI profiles. The MODIS β profile is greater than what is observed, meaning that the MODIS τc is also greater than the PDI value. Due to the relationship between τc and Nd, it follows that an overestimation of MODIS optical depth should lead to an overestimation of Nd, which is indeed what we see in Fig. 7.
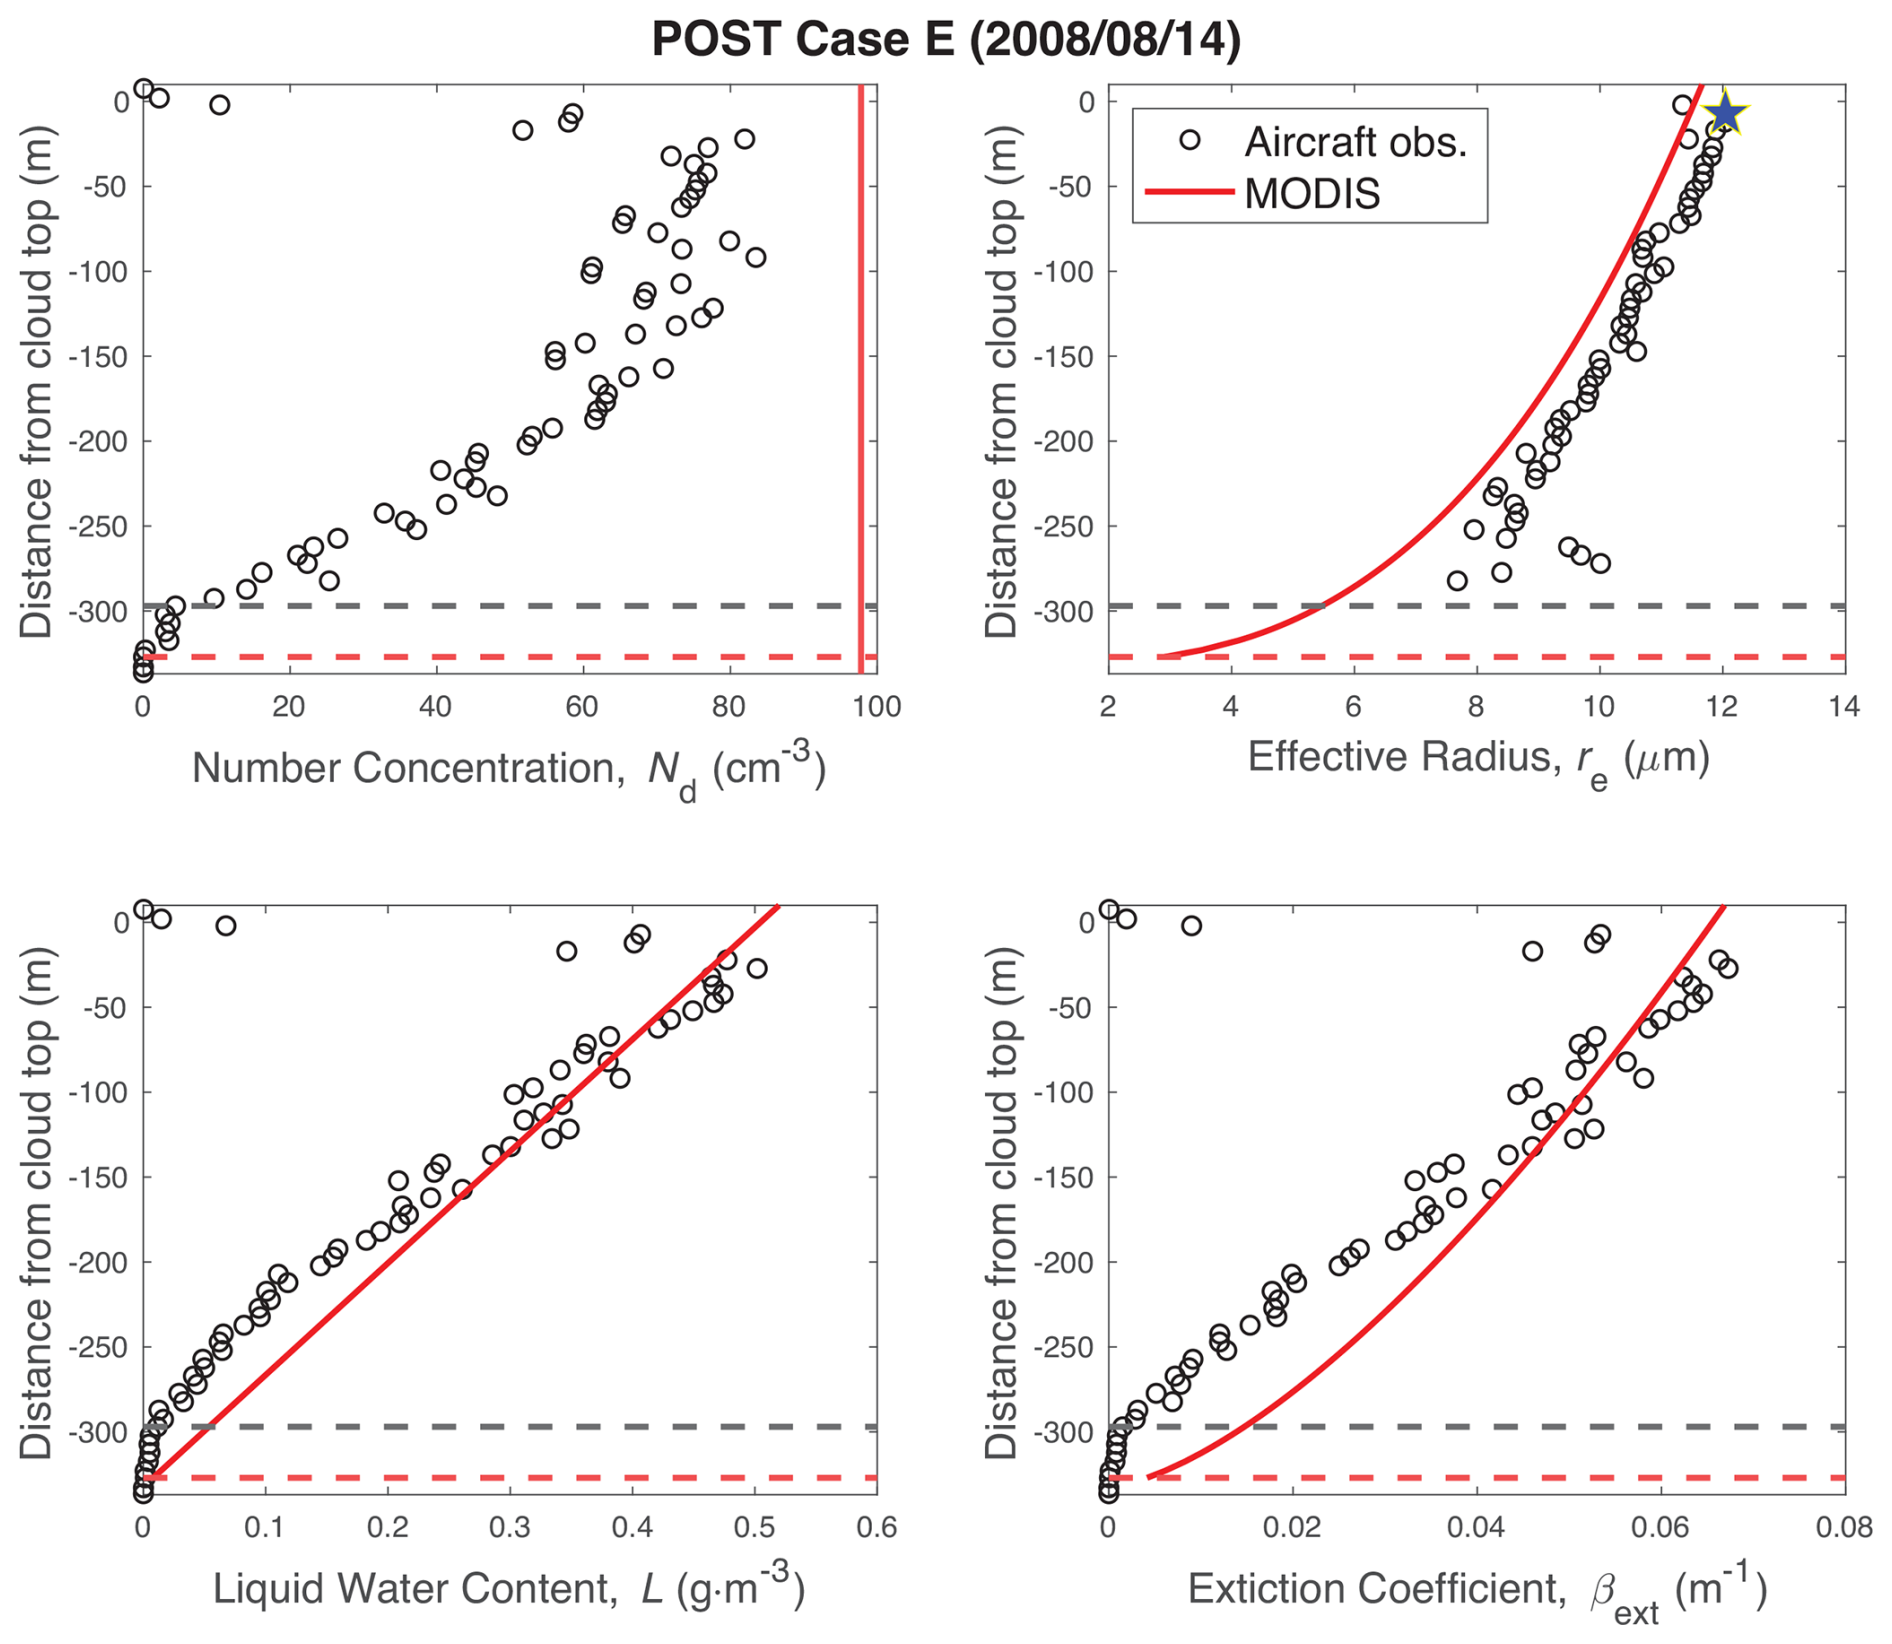
3.3.5 Case E: POST day 14 August 2008
POST Case E (14 August 2008) illustrates the degree of sensitivity in the MODIS Nd retrieval. Although the agreement between the profiles of re, L, and β is not perfect, it is reasonably close (Fig. 8). Despite this, MODIS significantly overestimates the number concentration (Nd = 98 ± 5 cm−3 compared to the PDI value of Nd = 71 ± 4 cm−3). Even small errors in the effective radius manifest as a large error in the number concentration, presumably due to the non-linear relationship between the two. This result suggests that satellite profile estimates must be fairly accurate in order to successfully retrieve Nd.
3.3.6 Summary of POST cases
Based on POST profile analysis of the important variables that determine the MODIS number concentration, we find that there are cases in which all variables agree well with PDI observations as well as cases where one or more variables disagree. However, out of all eight days considered, there are no cases in which the MODIS Nd was correct due to compensating errors in the underlying variables (i.e., β, L, and re). If the satellite number concentration matches the in situ value, it is due to correct estimations in all variables. Conversely, if even one variable disagrees with the observation, Nd is also inaccurate. Fairly good agreement in all three profiles can also still yield a significant discrepancy in Nd.
3.4 Analysis of k and fad
The accuracy of the MODIS assumptions concerning fad and k can also affect the retrieved number concentration. The MODIS retrieval assumes that fad has a constant value of 0.6. If fad was significantly different from this assumed value, we would find that the assumed MODIS slope of L(z) would disagree with observations. We find that for each of the eight POST flights, the in situ L(z) slopes are well matched to MODIS, even if the absolute values are in disagreement. This leads us to conclude that fad has little effect on the Nd retrieval for the cases that we analyzed.
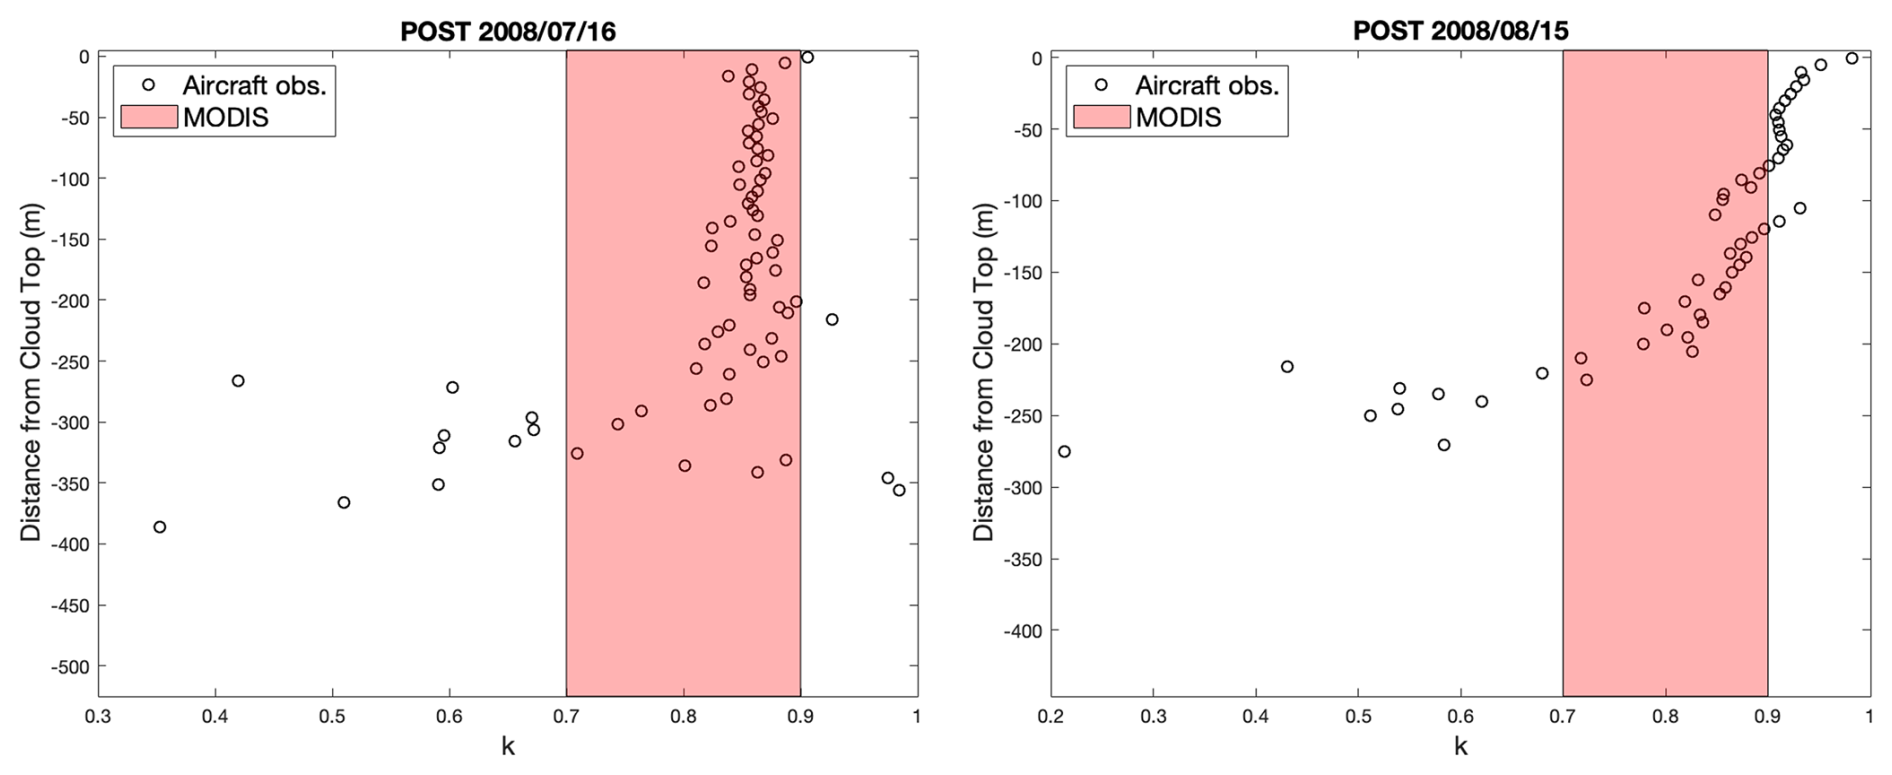
The MODIS Nd retrieval assumes k is a constant of value 0.8. The analysis by Grosvenor et al. (2018) concludes that k ranges from 0.7 to 0.9 (see also Lebsock and Witte, 2023). We evaluate this conclusion using the POST data (two examples shown in Fig. 9). Through the bulk of the cloud profiles, the MODIS algorithm assumption is found to be generally reasonable. An uncertainty in k of ± 0.1 will lead to an uncertainty in Nd of 10 % to 15 %. Near the cloud base, k can be much smaller. However, this can be considered inconsequential, as this region contributes little to the MODIS retrievals. There are also cases in which k exceeds this range near the cloud top. However, occasional outlying behavior should not have a large impact on the retrieval and, by default, Nd as well.
3.5 Determination of cloud base
As illustrated by Fig. 5, the large inaccuracies in the MODIS profile assumptions for POST Case B are accompanied by a large satellite overestimation of the cloud base altitude (an over 200 m difference from that observed). Figure 10 compares the MODIS-derived cloud base to the observed cloud base altitude for all eight of the POST flights. MODIS estimates a cloud base height within 50 m of the aircraft observations in five of the eight cases. For the remaining three cases, the MODIS cloud base differs by over 100 m, which is particularly notable because this is a significant fraction of the cloud depth. Due to the small sample size, however, it is difficult to quantify the frequency of accurate MODIS estimations of the cloud base.
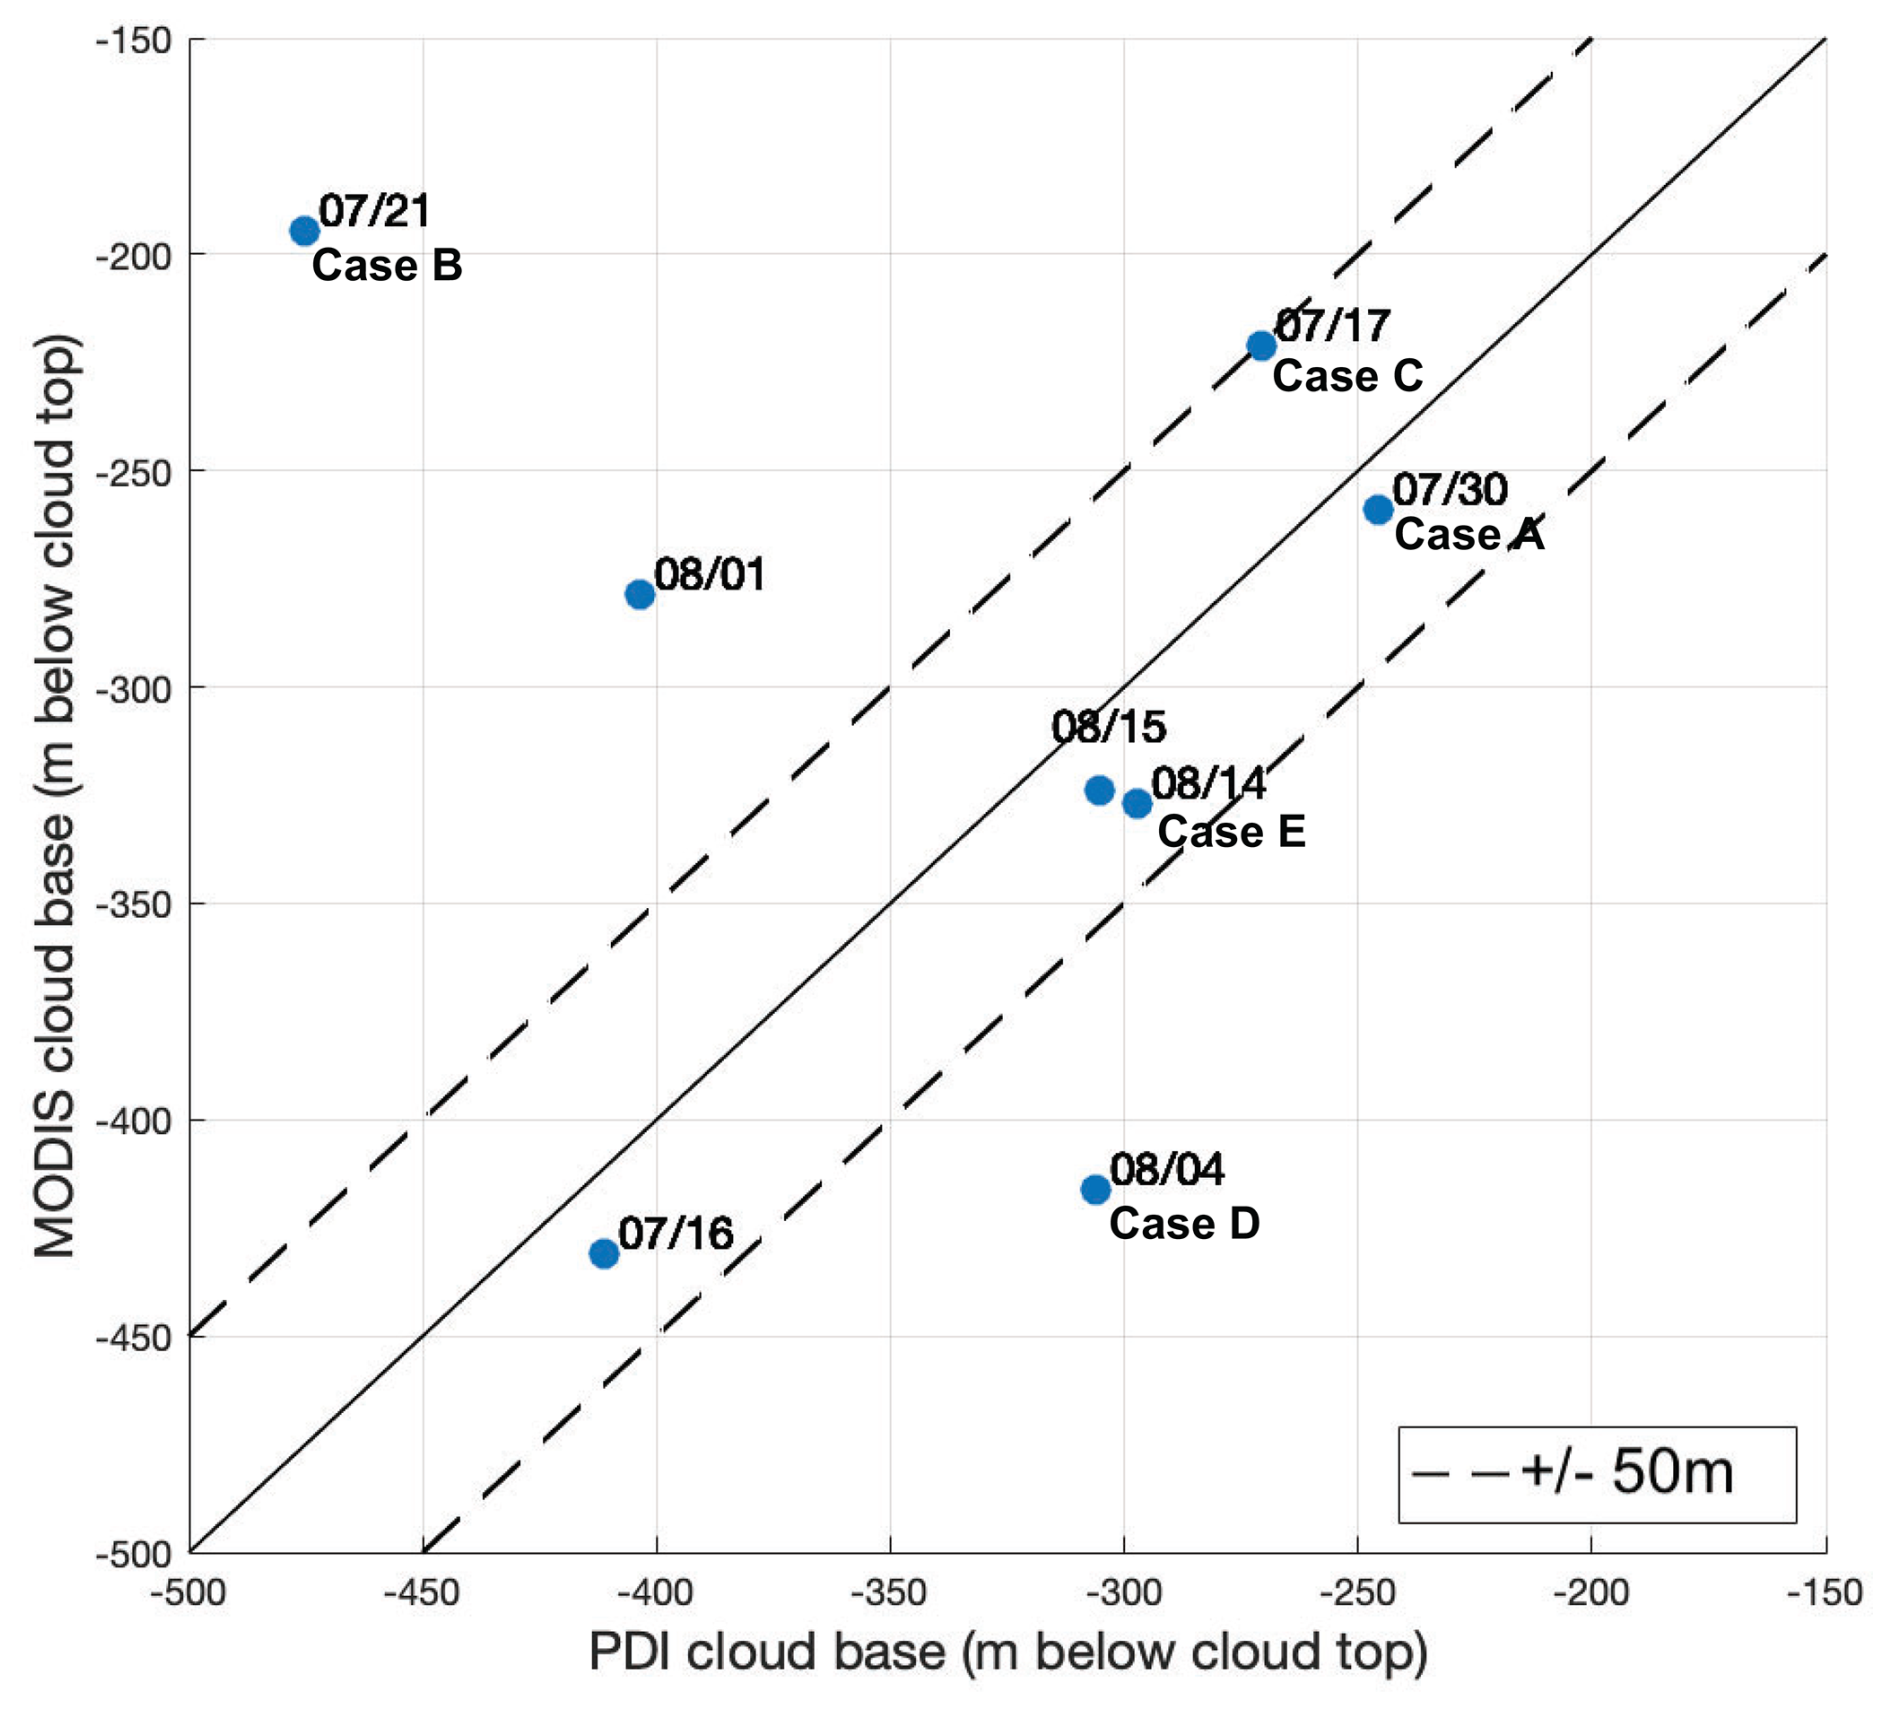
Figure 10Comparison of the MODIS and aircraft-estimated cloud base altitude for each day of the POST campaign. The 1:1 line (solid) and ± 50 m lines (dashed) are also shown.
In this study, we compare Nd derived from MODIS products with in situ observations recorded by the PDI instrument over three different field campaigns (MASE, VOCALS, and POST) sampling marine stratocumulus clouds. We also compare cloud microphysical and radiative variables relevant to the calculation of Nd using observations from the POST campaign. These variables include the vertical profiles of re, L, and β.
Our results show that, while there are instances in which the MODIS retrieval predicts a number concentration within sampling variability, there are a significant number of cases in which the satellite overestimates Nd. Our results suggest that the discrepancy between retrieved and in situ Nd can be greater than ±50 %, roughly in line with the ±80 % overall uncertainty previously proposed (Bennartz, 2007; Grosvenor et al., 2018). We find that the apparent overestimation bias in the number concentration does not originate as a bias in the MODIS re. This finding is consistent with the conclusions of Witte et al. (2018), who found no obvious bias between the MODIS- and PDI-derived effective radius. We also find that it is possible for Nd to be accurately retrieved with a poor retrieval of re, presumably due to compensating errors in other retrieval parameters.
Two out of the eight POST cases studied exhibit good agreement in Nd, as well as in the profiles of re, L, and β. For the remaining six cases, we do not attribute Nd discrepancy to a single error source. Instead, we show that there are several different cases that result in an incorrect number concentration:
-
MODIS incorrectly predicts the profiles of re, L, and β.
-
MODIS incorrectly predicts the profiles of L and β but accurately estimates re (either the full re profile or at the most influential altitude near the cloud top).
-
MODIS incorrectly predicts the profiles of re but accurately estimates the L and β profiles.
We also show a case where all profiles appear to exhibit reasonably good but imperfect agreement, but the resulting Nd does not agree well at all due to compounding errors.
Accurate Nd retrievals are representative of mid-cloud values. Although MODIS assumes the number concentration is constant through a cloud's vertical profile, it appears to be a poor reflection of cloud top and cloud base conditions even in the best-case scenarios. We also show one case where the assumption that Nd is constant with altitude is not accurate.
In order to improve the MODIS Nd retrieval, it would be beneficial to acquire more data collected in a manner similar to the POST campaign, i.e., with repeated sawtooth-like penetrations through the cloud top. Multiple profiles near the cloud top allow for deeper analysis of the underlying variables in the retrieval, which can be used to more accurately quantify sources of error.
The PDI data from POST and VOCALS are freely available at https://data.eol.ucar.edu/project/96 (UCAR/NCAR – Earth Observing Laboratory, 2024) and https://data.eol.ucar.edu/project/215 (UCAR/NCAR - Earth Observing Laboratory, 2024), respectively, and those from MASE are available at https://doi.org/10.5281/zenodo.1035928 (Witte, 2017). Terra MODIS L2 data are available at http://dx.doi.org/10.5067/MODIS/MOD06_L2.061 (Platnick et al., 2015b) and Aqua MODIS L2 data are available at http://dx.doi.org/10.5067/MODIS/MYD06_L2.061 (Platnick et al., 2015a).
SRP performed the data analysis and wrote the manuscript. MKW and PYC designed the study concept, obtained data, and edited the manuscript.
The contact author has declared that none of the authors has any competing interests.
Publisher's note: Copernicus Publications remains neutral with regard to jurisdictional claims made in the text, published maps, institutional affiliations, or any other geographical representation in this paper. While Copernicus Publications makes every effort to include appropriate place names, the final responsibility lies with the authors.
We thank the CIRPAS Twin Otter pilots, crew, and instrument scientists for their efforts to collect the data used in this study.
Mikael K. Witte has been supported by the Office of Naval Research Marine Meteorology program under funding documents N0001424WX00817 and N0001424WX02198.
This paper was edited by Alexander Kokhanovsky and reviewed by Zachary Lebo and three anonymous referees.
Bellouin, N., Quaas, J., Gryspeerdt, E., Kinne, S., Stier, P., Watson-Parris, D., Boucher, O., Carslaw, K. S., Christensen, M., Daniau, A.-L., Dufresne, J.-L., Feingold, G., Fiedler, S., Forster, P., Gettelman, A., Haywood, J. M., Lohmann, U., Malavelle, F., Mauritsen, T., McCoy, D. T., Myhre, G., Mülmenstädt, J., Neubauer, D., Possner, A., Rugenstein, M., Sato, Y., Schulz, M., Schwartz, S. E., Sourdeval, O., Storelvmo, T., Toll, V., Winker, D., and Stevens, B.: Bounding Global Aerosol Radiative Forcing of Climate Change, Rev. Geophys., 58, e2019RG000660, https://doi.org/10.1029/2019RG000660, 2020. a
Bennartz, R.: Global assessment of marine boundary layer cloud droplet number concentration from satellite, J. Geophys. Res.-Atmos., 112, D02201, https://doi.org/10.1029/2006JD007547, 2007. a, b, c, d
Bennartz, R. and Rausch, J.: Global and regional estimates of warm cloud droplet number concentration based on 13 years of AQUA-MODIS observations, Atmos. Chem. Phys., 17, 9815–9836, https://doi.org/10.5194/acp-17-9815-2017, 2017. a
Carman, J. K., Rossiter, D. L., Khelif, D., Jonsson, H. H., Faloona, I. C., and Chuang, P. Y.: Observational constraints on entrainment and the entrainment interface layer in stratocumulus, Atmos. Chem. Phys., 12, 11135–11152, https://doi.org/10.5194/acp-12-11135-2012, 2012. a, b
Christensen, M. W., Gettelman, A., Cermak, J., Dagan, G., Diamond, M., Douglas, A., Feingold, G., Glassmeier, F., Goren, T., Grosvenor, D. P., Gryspeerdt, E., Kahn, R., Li, Z., Ma, P.-L., Malavelle, F., McCoy, I. L., McCoy, D. T., McFarquhar, G., Mülmenstädt, J., Pal, S., Possner, A., Povey, A., Quaas, J., Rosenfeld, D., Schmidt, A., Schrödner, R., Sorooshian, A., Stier, P., Toll, V., Watson-Parris, D., Wood, R., Yang, M., and Yuan, T.: Opportunistic experiments to constrain aerosol effective radiative forcing, Atmos. Chem. Phys., 22, 641–674, https://doi.org/10.5194/acp-22-641-2022, 2022. a
Chuang, P. Y., Saw, E. W., Small, J. D., Shaw, R. A., Sipperley, C. M., Payne, G. A., and Bachalo, W. D.: Airborne phase doppler interferometry for cloud microphysical measurements, Aerosol Sci. Tech., 42, 685–703, https://doi.org/10.1080/02786820802232956, 2008. a, b
Gerber, H., Frick, G., Malinowski, S. P., Jonsson, H., Khelif, D., and Krueger, S. K.: Entrainment rates and microphysics in POST stratocumulus, J. Geophys. Res.-Atmos., 118, 12094–12109, https://doi.org/10.1002/jgrd.50878, 2013. a
Gordon, H., Glassmeier, F., and T. McCoy, D.: An Overview of Aerosol-Cloud Interactions, chap. 2, in: Clouds and Their Climatic Impacts: Radiation, Circulation, and Precipitation, edited by: Sullivan, S. C. and Hoose, C., American Geophysical Union (AGU), 13–45, https://doi.org/10.1002/9781119700357.ch2, 2023. a
Grosvenor, D. P., Sourdeval, O., Zuidema, P., Ackerman, A., Alexandrov, M. D., Bennartz, R., Boers, R., Cairns, B., Chiu, J. C., Christensen, M., Deneke, H., Diamond, M., Feingold, G., Fridlind, A., Hunerbein, A., Knist, C., Kollias, P., Marshak, A., McCoy, D., Merk, D., Painemal, D., Rausch, J., Rosenfeld, D., Russchenberg, H., Seifert, P., Sinclair, K., Stier, P., van Diedenhoven, B., Wendisch, M., Werner, F., Wood, R., Zhang, Z., and Quaas, J.: Remote sensing of droplet number concentration in warm clouds: A review of the current state of knowledge and perspectives, Rev. Geophys., 56, 409–453, https://doi.org/10.1029/2017RG000593, 2018. a, b, c, d, e, f, g, h, i
Gryspeerdt, E., McCoy, D. T., Crosbie, E., Moore, R. H., Nott, G. J., Painemal, D., Small-Griswold, J., Sorooshian, A., and Ziemba, L.: The impact of sampling strategy on the cloud droplet number concentration estimated from satellite data, Atmos. Meas. Tech., 15, 3875–3892, https://doi.org/10.5194/amt-15-3875-2022, 2022. a, b
Leandro, M. D.: Phase-Doppler Interferometry: Characterization and Emerging Applications, University of California, Santa Cruz, https://escholarship.org/uc/item/2df8w1zt (last access: 1 July 2025), 2023. a
Lebsock, M. D. and Witte, M.: Quantifying the dependence of drop spectrum width on cloud drop number concentration for cloud remote sensing, Atmos. Chem. Phys., 23, 14293–14305, https://doi.org/10.5194/acp-23-14293-2023, 2023. a, b
Lu, M.-L., Conant, W. C., Jonsson, H. H., Varutbangkul, V., Flagan, R. C., and Seinfeld, J. H.: The Marine Stratus/Stratocumulus Experiment (MASE): Aerosol-cloud relationships in marine stratocumulus, J. Geophys. Res.-Atmos., 112, D10209, https://doi.org/10.1029/2006JD007985, 2007. a
McCoy, D. T., Bender, F. A.-M., Grosvenor, D. P., Mohrmann, J. K., Hartmann, D. L., Wood, R., and Field, P. R.: Predicting decadal trends in cloud droplet number concentration using reanalysis and satellite data, Atmos. Chem. Phys., 18, 2035–2047, https://doi.org/10.5194/acp-18-2035-2018, 2018. a, b
McCoy, I. L., McCoy, D. T., Wood, R., Regayre, L., Watson-Parris, D., Grosvenor, D. P., Mulcahy, J. P., Hu, Y., Bender, F. A.-M., Field, P. R., Carslaw, K. S., and Gordon, H.: The hemispheric contrast in cloud microphysical properties constrains aerosol forcing, P. Natl. Acad. Sci. USA, 117, 18998–19006, https://doi.org/10.1073/pnas.1922502117, 2020. a
Mechoso, C. R., Wood, R., Weller, R., Bretherton, C. S., Clarke, A. D., Coe, H., Fairall, C., Farrar, J. T., Feingold, G., Garreaud, R., Grados, C., McWilliams, J., Szoeke, S. P. d., Yuter, S. E., and Zuidema, P.: Ocean Cloud Atmosphere Land Interactions in the Southeastern Pacific: The VOCALS Program, B. Am. Meteor. Soc., 95, 357–375, https://doi.org/10.1175/BAMS-D-11-00246.1, 2014. a
Miles, N. L., Verlinde, J., and Clothiaux, E. E.: Cloud droplet size distributions in low-level stratiform clouds, J. Atmos. Sci., 57, 295–311, https://doi.org/10.1175/1520-0469(2000)057<0295:CDSDIL>2.0.CO;2, 2000. a
Min, Q., Joseph, E., Lin, Y., Min, L., Yin, B., Daum, P. H., Kleinman, L. I., Wang, J., and Lee, Y.-N.: Comparison of MODIS cloud microphysical properties with in-situ measurements over the Southeast Pacific, Atmos. Chem. Phys., 12, 11261–11273, https://doi.org/10.5194/acp-12-11261-2012, 2012. a, b
Noble, S. R. and Hudson, J. G.: MODIS comparisons with northeastern Pacific in situ stratocumulus microphysics, J. Geophys. Res.-Atmos., 120, 8332–8344, https://doi.org/10.1002/2014JD022785, 2015. a
Painemal, D. and Zuidema, P.: Assessment of MODIS cloud effective radius and optical thickness retrievals over the Southeast Pacific with VOCALS-REx in situ measurements, J. Geophys. Res.-Atmos., 116, D24206, https://doi.org/10.1029/2011JD016155, 2011. a, b, c, d
Platnick, S.: Vertical photon transport in cloud remote sensing problems, J. Geophys. Res.-Atmos., 105, 22919–22935, https://doi.org/10.1029/2000JD900333, 2000. a, b, c
Platnick, S., Ackerman, S., King, M., et al.: MYD06_L2 – MODIS/Aqua Clouds 5-Min L2 Swath 1km and 5km, NASA MODIS Adaptive Processing System [data set], Goddard Space Flight Center, USA, http://dx.doi.org/10.5067/MODIS/MYD06_L2.061, 2015a. a
Platnick, S., Ackerman, S., King, M., et al.: MOD06_L2 – MODIS/Terra Clouds 5-Min L2 Swath 1km and 5km, NASA MODIS Adaptive Processing System [data set], Goddard Space Flight Center, USA, http://dx.doi.org/10.5067/MODIS/MOD06_L2.061, 2015b. a
Quaas, J., Arola, A., Cairns, B., Christensen, M., Deneke, H., Ekman, A. M. L., Feingold, G., Fridlind, A., Gryspeerdt, E., Hasekamp, O., Li, Z., Lipponen, A., Ma, P.-L., Mülmenstädt, J., Nenes, A., Penner, J. E., Rosenfeld, D., Schrödner, R., Sinclair, K., Sourdeval, O., Stier, P., Tesche, M., van Diedenhoven, B., and Wendisch, M.: Constraining the Twomey effect from satellite observations: issues and perspectives, Atmos. Chem. Phys., 20, 15079–15099, https://doi.org/10.5194/acp-20-15079-2020, 2020. a
Sorooshian, A., Feingold, G., Lebsock, M. D., Jiang, H., and Stephens, G. L.: On the precipitation susceptibility of clouds to aerosol perturbations, Geophys. Res. Lett., 36, L13803, https://doi.org/10.1029/2009GL038993, 2009. a
Twomey, S.: The Influence of Pollution on the Shortwave Albedo of Clouds, J. Atmos. Sci., 34, 1149–1152, https://doi.org/10.1175/1520-0469(1977)034<1149:TIOPOT>2.0.CO;2, 1977. a
UCAR/NCAR – Earth Observing Laboratory (EOL): VOCALS: VAMOS Ocean-Cloud-Atmosphere-Land Study, UCAR/NCAR – EOL, https://data.eol.ucar.edu/project/215 (last access: 2 August 2024), 2024. a
UCAR/NCAR – Earth Observing Laboratory (EOL): POST: Physics of Stratocumulus Top (POST), UCAR/NCAR – EOL [data set], https://data.eol.ucar.edu/project/96 (last access: 2 August 2024), 2024. a
Witte, M.: MASE cabin and cloud probe data, Version v1, Zenodo [data set], https://doi.org/10.5281/zenodo.1035928, 2017. a
Witte, M. K., Yuan, T., Chuang, P. Y., Platnick, S., Meyer, K. G., Wind, G., and Jonsson, H. H.: MODIS retrievals of cloud effective radius in marine stratocumulus exhibit no significant bias, Geophys. Res. Lett., 45, 10,656–10,664, https://doi.org/10.1029/2018GL079325, 2018. a, b, c, d, e, f, g, h, i
Zheng, X., Albrecht, B., Jonsson, H. H., Khelif, D., Feingold, G., Minnis, P., Ayers, K., Chuang, P., Donaher, S., Rossiter, D., Ghate, V., Ruiz-Plancarte, J., and Sun-Mack, S.: Observations of the boundary layer, cloud, and aerosol variability in the southeast Pacific near-coastal marine stratocumulus during VOCALS-REx, Atmos. Chem. Phys., 11, 9943–9959, https://doi.org/10.5194/acp-11-9943-2011, 2011. a
Zhou, X. and Bretherton, C. S.: Simulation of Mesoscale Cellular Convection in Marine Stratocumulus: 2. Nondrizzling Conditions, J. Adv. Model. Earth Sy., 11, 3–18, https://doi.org/10.1029/2018MS001448, 2019. a