the Creative Commons Attribution 4.0 License.
the Creative Commons Attribution 4.0 License.
 | 24 Sep 2025
Validation of the Aeolus L2A products with the eVe reference lidar measurements from the ASKOS/JATAC campaign
Nikolaos Siomos
Eleni Marinou
Antonis Gkikas
Samira M. Idrissa
Daniel T. Quaye
Désiré D. Fiogbe Attannon
Kalliopi Artemis Voudouri
Charikleia Meleti
David P. Donovan
George Georgoussis
Tommaso Parrinello
Thorsten Fehr
Jonas von Bismarck
Vassilis Amiridis
Aeolus was an ESA Earth Explorer satellite mission launched in 2018 with a lifetime of almost five years. The mission carried the Atmospheric Laser Doppler Instrument (ALADIN), a Doppler wind lidar for providing wind profiles on global scale and also vertically resolved optical properties of particles (aerosols and clouds) using the high spectral resolution lidar technique. To validate the particles' optical properties obtained from Aeolus as Level 2A products, the eVe lidar, ESA's reference system for the calibration and validation of Aeolus mission, has been deployed at the ASKOS campaign in the framework of the Joint Aeolus Tropical Atlantic Campaign (JATAC). ASKOS is the ground-based component of JATAC where ground-based remote sensing and in-situ instrumentation for aerosols, clouds, winds and radiation observations has been deployed at Cado Verde during summer 2021 and 2022 for the validation of the Aeolus products. The eVe lidar is a combined linear/circular polarization and Raman lidar specifically designed to mimic the operation of Aeolus and provide ground-based reference measurements of the optical properties for aerosols and thin clouds. The eVe lidar measurements can be used for the validation of the Aeolus L2A products while taking into consideration the ALADIN's limitation of misdetection of the cross-polar component of the backscattered signal. As such, in this validation study the cloud-free Aeolus L2A profiles obtained from the Standard Correct Algorithm (SCA), the Maximum Likelihood Estimation (MLE), and the AEL–PRO algorithms of Baseline 16 are compared against the corresponding cloud-free Aeolus-like profiles from eVe lidar, which are calculated using the retrieved particle circular depolarization ratio profile from eVe in order to account for the lack of the detection of the circular cross-polar backscatter component from Aeolus. The analysis focuses on the 14 collocated measurements between eVe and Aeolus during the nearest Aeolus overpass from the ASKOS site passing within a radius of 100 km from the site and within a temporal window of ± 1.5 h from the overpass time. The validation results reveal good performance for the co-polar particle backscatter coefficient, being the most accurate L2A product from Aeolus with absolute systematic and random errors up to 0.37 and 2 Mm−1 sr−1, respectively. The particle extinction coefficient also performs good with absolute systematic and random errors up to 53 and 183 Mm−1, respectively. The co-polar lidar ratio seems to be the noisiest L2A product with extreme error values and variability. The observed discrepancies between eVe and Aeolus L2A profiles increase at lower altitudes where higher atmospheric loads (molecules and aerosols) are encountered leading to increased noise levels in the Aeolus retrievals due to enhanced laser beam attenuation, and greater atmospheric variability (e.g. Planetary Boundary Layer inhomogeneities) are typically encountered. Overall, this study underlines the strengths of the optimal estimation algorithms (MLE and AEL–PRO) with consistent performance and reduced uncertainties, while the standard inversion algorithm (SCA), which was originally developed, could be further improved particularly in the retrieval of the particle extinction coefficient and lidar ratio. In addition, the SCAmid-bin resolution profiles outperform the corresponding SCAnormal-bin as expected, since mid-bin resolution is obtained when averaging the values from two consecutive SCAnormal height bins.
- Article
(5770 KB) - Full-text XML
- BibTeX
- EndNote


The ESA's Earth Explorer satellite mission named Aeolus was a polar orbiting satellite that was flying from August 2018 to July 2023 in a sun-synchronous dawn–dusk orbit at about 320 km altitude with a repeat cycle of 7 d1. Aeolus carried the first Doppler wind lidar in space, the so-called ALADIN lidar (Atmospheric LAser Doppler Instrument), providing vertical profiles of the wind vector component along the instrument's Horizontal Line of Sight (HLOS), at a global scale, from the ground up to ∼ 30 km in the stratosphere (Kanitz et al., 2019; Reitebuch et al., 2020). The main goal of the Aeolus satellite mission was to improve the level of knowledge on atmospheric dynamics and numerical weather prediction (Tan et al., 2007; Weissmann and Cardinali, 2007). The mission successfully fulfilled its objective to demonstrate the Doppler wind lidar technique for measuring wind profiles from space. Already, the Aeolus wind dataset have been used in applications such as demonstrating the benefits of assimilating the Aeolus wind profiles in Numerical Weather Prediction (NWP) models (e.g. Hagelin et al., 2021; Rennie et al., 2021; Rani et al., 2022; Kiriakidis et al., 2023; Martin et al., 2023), studying atmospheric circulation systems like the quasi-biennial oscillation – QBO and the El Niño–Southern Oscillation – ENSO (Ern et al., 2023; Martin et al., 2023), and investigating the impact of Aeolus wind data assimilation in aerosol transport events (e.g. a volcanic ash forecast from an Etna eruption case (Amiridis et al., 2023a)).
Additionally, Aeolus contributed to the monitoring of the optical properties of aerosols and thin clouds since ALADIN was also a High Spectral Resolution Lidar (HSRL) instrument (Shipley et al., 1983). ALADIN was equipped with a diode-pumped Nd:YAG laser for the emission of circularly polarized laser pulses at 355 nm in a continuous mode operation with nominal pulse energy of ∼ 80 mJ and pulse repetition rate of 50 Hz, pointing at 37.6° off-nadir (Flamant et al., 2022; Flament et al., 2021; Lolli et al., 2013). The backscattered signals from molecules and particles were collected with a Cassegrain type telescope of 1.5 m diameter and a FOV of 18 µrad (Flamant et al., 2022; Reitebuch, 2012) and directed to a multiple interferometer receiver unit. The multiple interferometers receiver splits the atmospheric signals into a Rayleigh channel and a Mie channel according to the difference in scattered spectra by molecules and particles attributed to the Doppler effect (Ansmann et al., 2007; Imaki et al., 2005; Shipley et al., 1983). The Rayleigh channel deployed a dual Fabry-Pérot interferometer for the detection of the broadband molecular backscattered signal and the Mie channel a Fizeau interferometer for the detection of the narrowband backscatter signal from particles (Ansmann et al., 2007; Flamant et al., 2022; Flament et al., 2021). However, the separation of the pure molecular and particle contribution in the received backscattered signal in the Rayleigh and the Mie channels, respectively, is not ideal due to the transmission curves of the interferometers leading to a cross-talk effect in both channels, which, however can be compensated by applying cross-talk correction factors (Flamant et al., 2022; Flament et al., 2021).
The Rayleigh channel is used for the retrieval of the particle extinction coefficient and the combination of the Rayleigh and Mie channels for the retrieval of the particle backscatter coefficient; the lidar ratio is calculated from the ratio of the two products (extinction-to-backscatter ratio). The particle extinction and backscatter coefficients, the lidar ratio as well as scattering ratio, and the aerosol optical depth (AOD) constitute the Level 2A (L2A) spin-off products. However, the transmit/receive design of ALADIN allows the detection of only the co-polar component of the collected backscattered signal (ESA, 2008; Flamant et al., 2022) which affects the retrieval of the particle backscatter coefficient resulting to the derivation of a parameter which will be referred to as the co-polar particle backscatter coefficient from now on in this paper (Appendix A; Paschou et al., 2022). In cases where depolarizing particles are present in the measured atmospheric scene, the co-polar particle backscatter coefficient obtained from Aeolus is highly underestimated compared to the total particle backscatter coefficient that is measured from the depolarization lidars detecting both the co- and the cross-polar components of the backscattered lidar signal. Similarly, under the presence of depolarizing particles the co-polar lidar ratio (i.e. the ratio of the particle extinction coefficient to the co-polar particle backscatter coefficient; see Appendix A in Paschou et al., 2022) from Aeolus is overestimated compared to the lidar ratio. The particle extinction coefficient is not affected by this limitation arising from the ALADIN design since it is retrieved using only the molecular backscattered lidar signals (Rayleigh channel) (Flamant et al., 2022; Flament et al., 2021).
The spectrometers in the Rayleigh and Mie channels record the analyzed lidar signals by accumulating 20 consecutive laser pulses. This average of 20 laser pulses corresponds to a single Aeolus profile, which is called measurement, and determines Aeolus' finest resolution of 3 km horizontal distance. The optical products are retrieved using an average of 30 such measurements in the observation level (also called as Basic Repeat Cycle; BRC) resulting to a resolution of ∼ 87 km horizontal distance. During the Aeolus lifetime, the horizontal resolution in measurement level and consequently the number of accumulated laser pulses has been changed three times (∼ 3 km until December 2021; ∼ 6 km until April 2022; ∼ 18 km until end of mission) allowing improved L2A radiometric efficiency due to higher atmospheric path signal and decrease of the noise effects on the L2A product. Moreover, the lidar signals are detected in both channels with a ranging resolution of 24 vertical bins. The resolution of each vertical bin varies from 0.25 to 2 km (always a multiple of 0.25 km). The altitude limits (lower and upper) and the thickness of each bin can be adjusted, separately for each channel, through the Range Bin Settings (RBS) that are decided depending on the sampling strategy and the desired reduction of the signal noise levels. For example, thin bins with thickness of e.g. 0.25 km are preferred close to the surface where the variability of the aerosols and the wind components is expected to be higher (Flamant et al., 2022; Flament et al., 2021), while different RBS have been used in the tropics, mid latitude, polar regions, during cal/val campaign periods, and special events such as volcanic eruptions depending on the scientific and Aeolus mission objectives.
Like every satellite mission with a lidar onboard, e.g. CALIPSO (Winker et al., 2010) and CATS (Yorks et al., 2014), Aeolus has to undergo thorough validation of its products to evaluate its overall performance. This process is essential for identifying potential observational biases introduced by the lidar design and its limitations and/or the retrieval algorithms, all of which could influence the quality of the products. For the Aeolus wind product, a plethora of validation studies have been performed using ground-based and airborne wind lidar measurements (Abril-Gago et al., 2023; Lux et al., 2022; Witschas et al., 2020, 2022), radiosondes (Baars et al., 2020; Borne et al., 2024; Ratynski et al., 2023), or NWP model equivalent data (Liu et al., 2022; Martin et al., 2021; Zuo et al., 2022). The outcome of these Cal/Val studies revealed a very good performance of the wind products, as a result of upgrades in the wind retrieval algorithm with corrections and calibration improvements. More specifically, the systematic errors for both products (Rayleigh and Mie winds) and the random error for Mie winds fall within the mission requirements and the ESA recommendations (i.e. systematic errors up to 0.7 ms−1 and random errors up to 2.9 ms−1 for both products) while random errors up to 4.8 ms−1 are found for Rayleigh winds in Borne et al. (2024).
On the contrary, for the L2A aerosol products, a limited number of studies have been performed focusing mainly on the validation of the L2A particle backscatter coefficient obtained from the Standard Correct Algorithm (SCA) in two vertical resolutions, the native resolution of the Rayleigh channel (hereafter SCAnormal-bin) and a coarser resolution after averaging (binning) the values from two neighboring bins (hereafter SCAmid-bin). More specifically, Baars et al. (2021) reported very good agreement between the Aeolus L2A particle backscatter coefficient (i.e. the Aeolus co-polar particle backscatter coefficient) and the ground-based Aeolus-like particle backscatter coefficient and good agreement for the particle extinction coefficient. The validation study was performed using as reference a PollyXT lidar operating in Leipzig during a Californian wildfire smoke transport event over Europe. However, larger differences were observed between Aeolus and the ground-based profiles inside the Planetary Boundary Layer (PBL). These differences were attributed to the Aeolus coarser horizontal resolution and to the spatiotemporal inhomogeneous conditions of the boundary layer. In addition, a statistical validation study was performed by Abril-Gago et al. (2022) on the Aeolus L2A particle backscatter coefficient. In their analysis they compared Aeolus profiles from the SCA algorithm (Baseline 10) with ground-based lidar observations under cloud-free conditions at three ACTRIS/EARLINET (Aerosol, Clouds and Trace Gases Research Infrastructure/European Aerosol Lidar Network) lidar stations in the Iberian Peninsula; a region mainly affected by dust and continental/anthropogenic aerosols. The statistical analysis applied for each lidar station with the maximum reported mean bias to be −0.16 ± 0.04 Mm−1 sr−1 with RMSE of 0.6 ± 0.2 Mm−1 sr−1 for the SCAnormal-bin profiles (Granada) and 0.11 ± 0.08 Mm−1 sr−1 with RMSE of 0.25 ± 0.11 Mm−1 sr−1 for the SCAmid-bin (Evora). Gkikas et al. (2023) performed a statistical validation study of the Aeolus L2A particle backscatter coefficient using ground-based lidar observations from three lidar stations in the Eastern Mediterranean contributing to the Greek national research infrastructure PANACEA (PANhellenic infrastructure for Atmospheric Composition and climatE chAnge). The location of lidar stations in the eastern Mediterranean region allowed the validation of the Aeolus L2A aerosol products from the SCA algorithm (Baseline 11) under different aerosol species originating from natural (e.g. marine, dust, biogenic, and volcanic particles) or anthropogenic sources. The comparison between the Aeolus L2A co-polar particle backscatter coefficient and the ground-based total particle backscatter coefficient for cloud-free collocated measurements (removal of cloud contaminated cases using auxiliary MSG-SEVIRI data) from all stations revealed better agreement between Aeolus and the ground-based profiles compared to the comparison using the full set of collocated measurements, where the cloud contaminated cases were not excluded. The overall absolute bias has been reduced due to the removal of cloud-contaminated profiles from 0.45 to 0.27 and from 0.69 to 0.37 Mm−1 sr−1 for the Aeolus SCAnormal- and SCAmid-bin profiles, respectively, and the overall Root Mean Square Error (RMSE) has been reduced from 2 to 1.65 and from 1.88 to 1 Mm−1 sr−1 for the Aeolus SCAnormal- and SCAmid-bin profiles, respectively. Additionally, the vertically resolved statistical analysis by Gkikas et al. (2023) showed that the performance of the SCA retrievals is decreased at the lowermost bins probably due to the contamination from surface return signals or the increased Signal-to-Noise Ratio (SNR) levels close to the surface, which is in line with the findings of Abril-Gago et al. (2022). Finally, all three studies (Abril-Gago et al., 2022; Baars et al., 2021; Gkikas et al., 2023) conclude that the SCAmid-bin profiles demonstrate better agreement with the ground-based reference profiles in contrast with the SCAnormal-bin due to the averaging of two neighbouring height bins. However, the above studies are focused on evaluating mainly the Aeolus L2A backscatter coefficient from earlier versions (Baselines 10 and 11) and they lack of a validation of the Aeolus L2A profiles from the optimal estimation algorithms of Aeolus (e.g. the Maximum Likelihood Estimation (MLE) and the AEL–PRO, as, historically, they only became available in later versions of the L2A processors). The latest available version of Aeolus algorithms is Baseline 16. Oonly recently a validation study for the MLE profiles obtained at higher horizontal resolution (MLEsub provided at ∼ 18 km horizontal resolution) has been performed by Trapon et al. (2025). Trapon et al. (2025) used airborne and ground-based lidar observations above Cabo Verde during September 2022 in the framework of the Joint Aeolus Tropical Atlantic Campaign (JATAC) for the comparison with Aeolus, reporting better performance of MLEsub that outperforms the noisier SCA profiles which are provided in coarser resolution and are more sensitive to signal attenuation, cloud contamination and horizontal aerosol inhomogeneity.
In this study, we use the eVe lidar, the ESA's reference lidar, designed specifically to mimic the operation of ALADIN and provide reference measurements of the aerosol optical properties for the validation of the corresponding Aeolus L2A products (particle backscatter coefficient, particle extinction coefficient, and particle lidar ratio) as obtained from the SCA, the MLE, and the AEL–PRO processors using the latest released version (Baseline 16). More specifically, we use a dataset of 14 collocated eVe lidar measurements with Aeolus overpasses during the JATAC experimental campaign that was held in summer of 2021 and 2022 at the Cabo Verde islands.
2.1 The ASKOS/JATAC campaign
A dedicated large-scale experimental campaign with the participation of groups from European organizations and National Aeronautics and Space Administration – NASA has been organized by ESA to support the validation of Aeolus and the preparation of the ESA missions EarthCARE (Illingworth et al., 2015; Wehr et al., 2023) and WIVERN. The so-called Joint Aeolus Tropical Atlantic Campaign (JATAC) included both ground-based and airborne deployments on Cabo Verde (2021/2022) and the US Virgin Islands (2021). The joint activities resulted in high-quality and comprehensive dataset of aerosol, clouds and wind measurements from multiple in-situ and remote sensing instruments to support: (i) the validation of Aeolus and other satellites as well as the development of future Earth Observation missions and (ii) a wide range of scientific objectives related to the Saharan Aerosol Layer, Inter-Tropical Convergence Zone, and tropical jet streams and their impact on convective systems, long range dust transport events and air quality (Fehr et al., 2023). The ground-based component of JATAC, named ASKOS, was held at the Ocean Science Centre of Mindelo (OSCM) on the island of São Vicente in Cabo Verde and implemented in three intense phases (September 2021, June 2022, September 2022) (Marinou et al., 2023). The Cabo Verde environment is ideal for aerosol studies and desert dust specifically. Situated downwind of the Sahara Desert, Cabo Verde receives a large influx of dust, particularly in summer during the peak of the dust season (e.g. Gkikas et al., 2021), thus constituting a suitable location for the evaluation of the Aeolus performance under dust-rich environments.
For the ASKOS operations, a remote sensing facility for wind, aerosols, and clouds was set up comprising of aerosol and wind lidars, a sun-photometer, a cloud radar, and a radiometer. One of the ASKOS lidars was the ESA's eVe reference lidar that was deployed to provide reference measurements of the optical properties of aerosols and thin clouds serving as ground-truth for the Aeolus L2A products. Next to these remote sensing facilities, additional instrumentation has been deployed for providing measurements on particle orientation and characterization, meteorological parameters, atmospheric electricity, and solar radiation. More details about the full ASKOS instrumentation is provided in Marinou et al. (2023). Moreover, according to Marinou et al. (2023), the aerosol conditions above Mindelo, São Vicente during the ASKOS period as observed from the deployed instrumentation included particles within the marine boundary layer at altitudes up to 1 km and a Saharan Air Layer (SAL) extending up to 6 km. The macrophysical characteristics of the SAL (e.g. base height, depth) and the amount of desert dust particles fluctuated throughout the campaign, comprising an environment with a wide range of aerosol conditions. More than nine dust transport events have been observed during ASKOS (preparatory and intense phases) usually comprising of pure SAL layers, while two of them formed a layer with desert dust and pollution mixture and a layer with desert dust and volcanic aerosols mixture. The volcanic aerosols, originated from the Cumbre Vieja volcano (19 September 2021; Córdoba-Jabonero et al., 2023) at La Palma Island, Canary Islands, were observed within the marine boundary layer, where it was mixed with marine aerosols, and also within the SAL, where they were mixed with dust particles (Gebauer et al., 2024).
2.2 The eVe lidar
The eVe lidar is a combined linear/circular polarization lidar system with Raman capabilities designed to be the ESA's ground reference system for the calibration and validation of the aerosol products from the ESA Aeolus satellite mission. A detailed description about the system design and specifications can be found in Paschou et al. (2022). The lidar configuration consists of two emission units with Nd-YAG lasers with pulse energies of 89 and 100 mJ at 355 nm and a repetition rate of 20 Hz, and two detection units. Each detection unit features a Cassegrain type telescope of 200 mm aperture and Field-Of-View (FOV) of 2.4 mm for recording the optically separated backscatter signals into five PhotoMultiplier Tubes (PMTs). The optical separation is done in terms of the state of the polarization and the type of backscattering (elastic or Raman). This dual-laser/dual-telescope configuration enables the simultaneous emission of linearly and circularly polarized light pulses at 355 nm and the detection of the elastically backscattered light with polarization sensitive channels as well as the inelastic (Raman) backscattered light at 387 nm. Each detection unit (one featuring a linear and the other featuring a circular polarization analyzer) separates and records the signals into two polarization sensitive channels, one channel for detecting the cross-polar and the other channel for detecting the co-polar component of the elastically backscattered light. In addition, a Raman channel is equipped and placed in the unit with the linear polarization analyzer, enabling the detection of the inelastic backscattering from both linearly and circularly polarized emission since each telescope receives return signals from both lasers. Hence, eVe derives vertical profiles of the aerosol backscatter coefficient, the aerosol extinction coefficient (nighttime product), the lidar ratio (nighttime product), the volume and particle linear depolarization ratios, and the volume and particle circular depolarization ratios at 355 nm. Moreover, the system allows the adjustment of the measurement zenith and azimuth angles. This feature along with its dual-laser/dual-telescope configuration constitute the lidar capable of reproducing the operation and the pointing geometry of any ground- or space-based lidar that uses either linearly or circularly polarized emission.
The eVe lidar performed lidar measurements during the whole ASKOS period including also the preparatory phase of ASKOS in July 2021. The acquired eVe dataset during ASKOS includes testing and routine measurements at multiple pointing angles (vertical and off-zenith) during daytime and nighttime as well as measurements implementing the dual-FOV lidar measurements technique (Paschou et al., 2023). In the current study we use the routine linear/circular depolarization measurements performed during the nearest Aeolus overpasses from the OSCM/ASKOS site, which occurred every Friday evening around 19:35 UTC. The distance of the nearest Aeolus BRC from the ASKOS site varied from 9 to 48 km. During each overpass, eVe was measuring while pointing at 37.6° off-zenith towards the Aeolus track in order to reproduce the Aeolus pointing geometry from the ground. In total, 14 collocated eVe – Aeolus measurements were collected under multiple aerosol conditions such as pure dust, pure marine, marine and dust mixtures, and volcanic mixtures with marine and dust aerosols (Marinou et al., 2023) for the validation of the Aeolus L2A products.
For these 14 linear/circular depolarization measurements from the eVe lidar, the profiles of the Aeolus-like particle backscatter coefficient and Aeolus-like lidar ratio were retrieved additionally to the routine eVe products mentioned above (i.e. particle extinction and backscatter coefficients, lidar ratio, and depolarization ratios). The term “Aeolus-like” is used to describe the ground-based lidar products that have been harmonized with the Aeolus Level 2A products, taking into account the misdetection of the cross-polar component of the backscattered signal from Aeolus (Appendix A; Paschou et al., 2022). As such, the eVe profiles of the particle extinction coefficient, the Aeolus-like particle backscatter coefficient, and the Aeolus-like lidar ratio were used as the reference in this study for the comparison of the eVe profiles with the corresponding Aeolus L2A profiles.
2.3 The Aeolus Level 2A processors
During the development phase of Aeolus, two independent processors have been developed, one for the retrieval of the wind profiles as L2B products (Tan et al., 2008), and one for the retrieval of the optical properties of aerosols and thin clouds as L2A products (Flamant et al., 2008; Flament et al., 2021). The L2A processor uses as input: (i) the pre-processed signals from the Mie and Rayleigh channels corrected from noise sources and instrumental effects (i.e., the L1B profiles), (ii) auxiliary meteorological profiles such as temperature, pressure, humidity, etc., provided from the European Centre for Medium Range Weather Forecasts – ECMWF, and (iii) auxiliary calibration coefficients about the radiometric efficiency of the receiver. More details about the inputs for the L2A processor can be found at Flamant et al. (2022) and Rennie et al. (2020).
In the beginning of the mission, the L2A processor included the historical algorithms for the Aeolus L2A products, namely the Standard and the Mie Correct Algorithms (SCA and MCA; Flamant et al., 2008; Flament et al., 2021). After launch, the L2A processors have undergone updates and improvements under releases of newer versions (i.e. Baselines) and, also, new algorithms have been added in the L2A processors such as the AEL–PRO in Baseline 12. AEL–PRO is an adaptation of the ATmospheric LIDar (ATLID) retrieval algorithm for aerosol properties for Earth Cloud Aerosols and Radiation Explorer (EarthCARE) mission to the needs of Aeolus (Donovan et al., 2024a; Wang et al., 2024). In addition, the Maximum Likelihood Estimation (MLE; Ehlers et al., 2022) has been added in Baseline 14. In this validation study, the Aeolus L2A profiles have been obtained from the SCA, the MLE and the AEL–PRO algorithms from Baseline 16 of the L2A processor. The Baseline 16 dataset during the JATAC period that is used in this study is part of the fourth reprocessing campaign conducted by the Aeolus Data, Innovation and Science Cluster (DISC), with the aim of delivering a homogenized Aeolus dataset covering the full operational period from 1 September 2018 to 30 March 2023 under a consistent processor version. A brief description on the main principles of each algorithm is provided in the following subsections.
2.3.1 Standard Correct Algorithm – SCA
The Standard Correct Algorithm (SCA) has been developed by the Institute Pierre Simon Laplace (IPSL) and Météo-France. The SCA algorithm uses both the measured signals from the Rayleigh and the Mie channel for the retrieval of the optical properties (co-polar particle backscatter and extinction coefficients, co-polar lidar ratio). A detailed description of SCA is provided in the Algorithm Theoretical Basis Document for the Aeolus L2A products (Flamant et al., 2022) and in Flament et al. (2021).
In brief, the measured signals from the Rayleigh (Sray) and Mie (Smie) channels depend on the instrument calibration constants (e.g. radiometric calibration coefficients Kray and Kmie, pulse energy, number of accumulated pulses for a BRC), the cross-talk coefficients , the lidar range R, the pure molecular and particle backscattering contributions to the signals (X and Y), and the atmospheric transmission from the lidar to the target and back (Eqs. 1–6; Flament et al., 2021). The measured signals are corrected from the cross-talk effect and the pure molecular (X) and particle (Y) signals are obtained. Then, the Aeolus particle backscatter coefficient is obtained from the ratio multiplied with the molecular backscatter coefficient as calculated from the auxiliary meteorological data (Eqs. 9 and 10; Flament et al., 2021). The particle extinction coefficient is retrieved using the molecular signal X in an iterative process from the top of the profile to the bottom taking into account the attenuation from the overlying height bins while assuming that the particle extinction in the uppermost bin (i.e. first bin) is zero (Eqs. 11–14; Normalized Integrated Two-Way Transmission method; Flament et al., 2021) and that the aerosol load is uniformly distributed within each bin. However, the normalization of the molecular signal in the first bin makes the retrieval of the extinction coefficient susceptible to the noise of the first bin. More specifically, the first bin is located usually between 20–25 km, where the molecular signal is the lowest compared to the rest height bins. As such, the differentiation of two consecutive bins can lead to unrealistic high extinction values (positive or negative) due to the level of attenuation in the simulated molecular signals (Flament et al., 2021). To mitigate the propagation of the large error of the first bin to the underlying bins due to the negative extinction values (Flamant et al., 2022; Flament et al., 2021) and create a more reliable and less biased extinction retrieval, a new particle extinction profile is created after averaging the extinction values (including negative values) of two consecutive height bins, called as SCAmid-bin particle extinction. The averaging of values from two consecutive height bins is also applied in the retrieved backscatter profile in order to obtain the SCAmid-bin particle backscatter coefficient and lidar ratio. As such, the optical properties from SCA are provided in BRC level with two different vertical resolution scales: (i) 24 vertical bins of the Rayleigh channel (SCAnormal-bin) and (ii) 23 vertical bins (SCAmid-bin) after averaging the values of two consecutive bins.
2.3.2 Maximum Likelihood Estimation – MLE
The Maximum Likelihood Estimation method has been developed aiming to improve the Aeolus L2A retrievals by taking into account the different noise levels in the Rayleigh and Mie channels, the coupled retrieval of the backscatter and extinction coefficients, and the physical constrains on the values of the retrieved optical properties. A detailed description on the MLE approach is provided in Ehlers et al. (2022) and in the Algorithm Theoretical Basis Document for the Aeolus L2A products (Flamant et al., 2022).
In brief, the MLE concept uses an optimal estimation retrieval method with a forward model y=F(x) that maps the optical properties of co-polar particle backscatter coefficient and lidar ratio (state vector x) onto the signals Sray and Smie (measurement vector y) (Eq. 11; Ehlers et al., 2022). The retrieval problem is a nonlinear regression problem and to obtain an accepted physical solution of the true optical properties, a minimization of a cost function (Eqs. 13–15; Ehlers et al., 2022) is required, which describes the deviations between the measured signals (measurement state) and the forward-modelled signals. The minimization of the cost function is performed using a Limited–Memory Broyden–Fletcher–Goldfarb–Shanno (BFGS) algorithm with box constraints (L-BFGS-B; Zhu et al., 1997). The applied constraints include the lidar ratio values ranging from 2 to 200 sr and positive values of backscatter and extinction coefficients. Moreover, the initialization of the cost function (i.e. the first guess) consists of an aerosol-free atmosphere with zero optical depth and a co-polar lidar ratio of 60 sr. According to Ehlers et al. (2022), the MLE retrievals may suffer from noise amplification, thus an iterative approach is followed where the cost function minimization problem is being solved iteratively until the average cost function value per bin reaches values below 1. Finally, the MLE retrievals are provided in BRC level with a vertical resolution of 24 bins similar to SCAnormal-bin. Following the updates on the horizontal resolution in measurement level (from ∼ 3 to ∼ 18 km) an additional MLE product branch has been introduced (MLEsub) which retrieves the L2A products with the MLE approach but in higher resolution (∼ 18 km; measurement level) compared to the MLE retrievals that are provided in BRC level.
2.3.3 AEL–PRO
The AEL–PRO algorithm consists an adaptation of the aerosol profile retrieval algorithm (A–PRO) that has been developed in the Royal Netherlands Meteorological Institute (KNMI) for ATLID lidar onboard the EarthCARE satellite mission (Donovan et al., 2024b). In the same context, the ATLID Feature Mask (A–FM; van Zadelhoff et al., 2023) algorithm developed to provide a probability mask for the presence of atmospheric features in the ATLID lidar profiles (e.g. clear conditions, clouds, aerosols) has been adapted to Aeolus measuring principles named as AEL–FM. The main differences between A–PRO/A–FM and AEL–PRO/AEL–FM lay in the detection of only the co-polar component of backscattered signal, the adjustable range bin settings and the coarser and variable size of the height bins, the large along-track pixel size, and the large viewing angle of 37.6° off-nadir in the Aeolus measurements (Wang et al., 2024). A detailed description on the AEL–PRO algorithm is provided in the corresponding Aeolus L2A Algorithm Theoretical Basis Document for AEL–FM and AEL–PRO (Donovan et al., 2024a) and in Wang et al. (2024).
In contrast to SCA and MLE algorithms using the signals from both Rayleigh and Mie channels, the AEL–PRO algorithm uses only the Mie channel for the separation of the measured signal into the cross-talk corrected “pure” molecular (Rayleigh) and particle (Mie) attenuated backscatter profiles (Fig. 2; Donovan et al., 2024a). More specifically, the measured Mie signal is derived from the detector's central region pixels where the Mie response is located, whereas the Rayleigh signal is derived from the pixels in the wing areas of the Mie response (Fig. 1; Wang et al., 2024). The cross-talk effect in the measured Rayleigh and Mie signals still exists, thus the signals have to be cross-talk corrected before being used (as pure Rayleigh and Mie signals) in the retrieval of the optical properties. The advantages of this approach are (i) the degrees of freedom in the system are reduced since only the calibration parameters related to the Mie channel have to be taken into account (i.e. cross-talk coefficients and radiometric calibration coefficient Kmie) allowing the constrain of the error magnification in lower levels, and (ii) the thickness and height range of each bin are common for both signals since the signals are derived solely from the Mie channel.
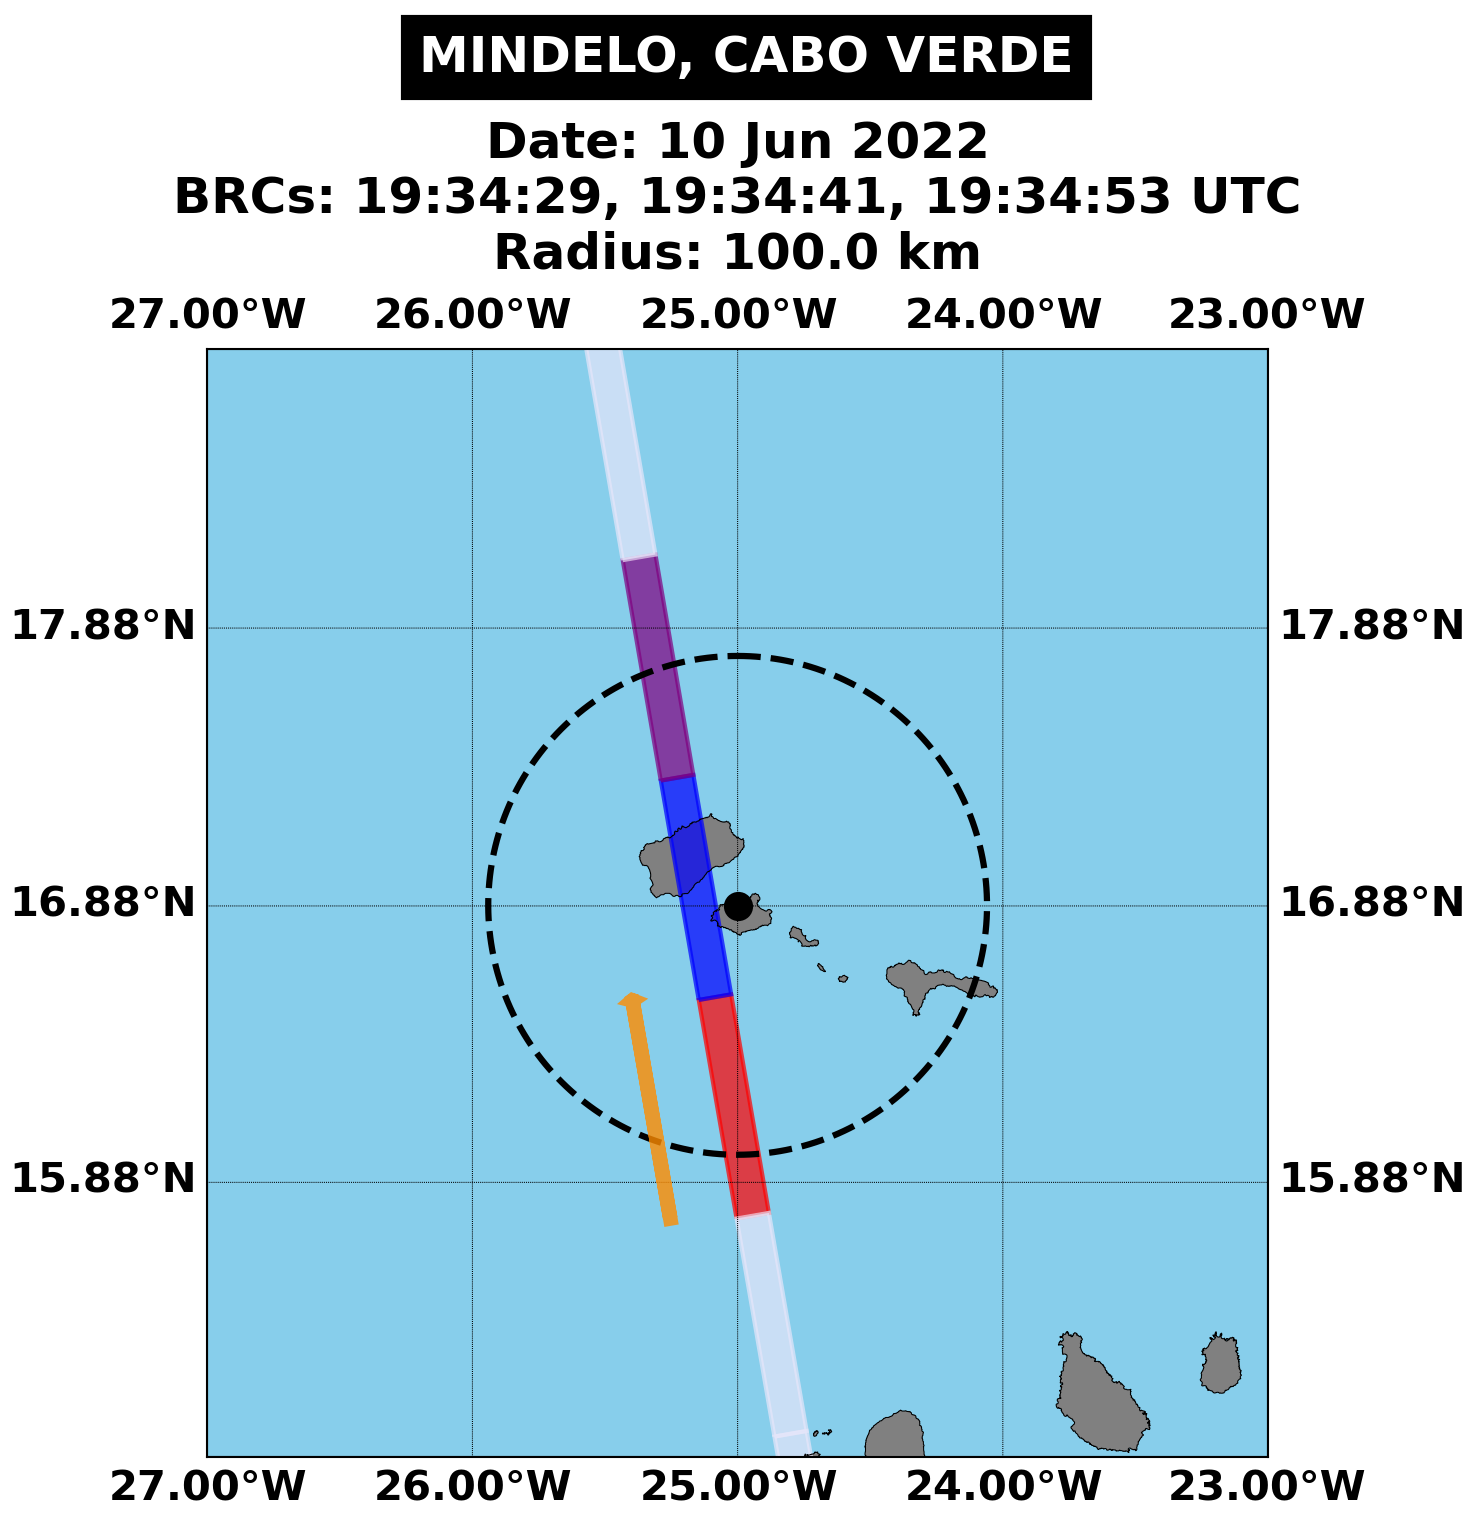
Figure 1Example of selection of the nearest Aeolus overpass (blue rectangle) from the ASKOS site on 10 June 2022. The white stripe indicates the Aeolus measurement track, the orange arrow denotes the Aeolus flight direction (ascending orbit), and the coloured rectangles correspond to the maximum three Aeolus observations (BRCs) that can be recorded falling within a radius of 100 km (dashed black line) of the ASKOS location (Mindelo, Cabo Verde; black dot). The BRC timeframes are given in the plot's title.
As described in Donovan et al. (2024a), the algorithm follows a multiscale, forward modelling optimal estimation approach which is implemented in two iterative stages (Fig. 3; Wang et al., 2024) and the cost function is minimized using the BFGS quasi-Newton numerical minimization procedure (Press et al., 2007). The measurement vector y includes the cross-talk corrected pure Rayleigh and Mie attenuated backscatter signals and the state vector x includes the log base 10 of the particle extinction coefficient, the co-polar lidar ratio, the particle effective radius, and a factor for calibration errors. The log form is used as a positivity constrain for the state vector's elements. Here, the cost function is composed by the sum of two terms, one describing the deviations between the measurement state and the forward-modelled measurements and one describing the deviations between the state and an a-priori state (Eqs. 1–5; Wang et al., 2024). The two-pass approach is used to process both strong (i.e. clouds) and weak (i.e. aerosols) features. In the first pass, the algorithm separates the strong and weak features using the pure Mie and Rayleigh signals, the auxiliary meteorological profiles and the AEL–FM outputs and solves the optimal estimation problem for the weak features in a BRC level (horizontal resolution of about ∼ 87 km). The retrievals of weak features from the first pass are then used as an a-priori state for every measurement in the second pass where the optimal estimation problem is being solved again to obtain the final L2A products (including strong features/cloudy regions) at measurement level with vertical resolution of 24 bins of the Mie channel.
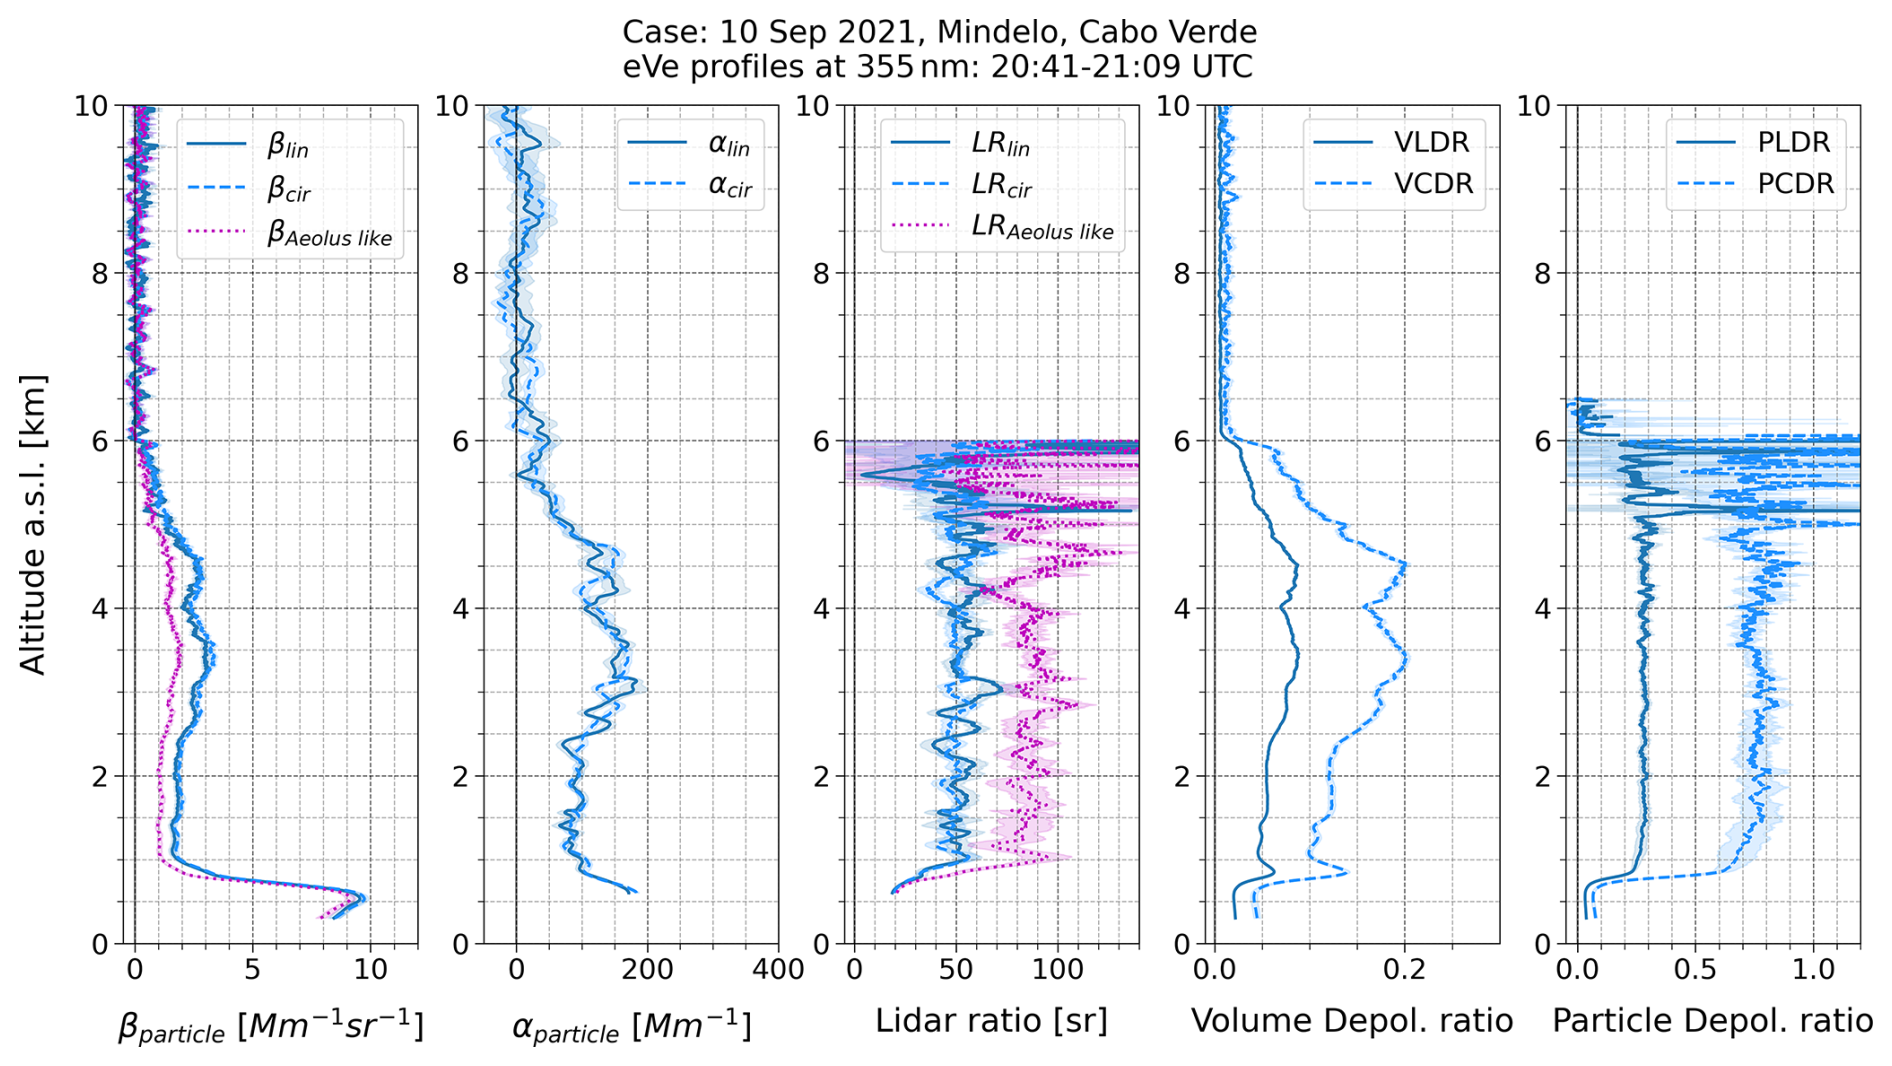
Figure 2Averaged and cloud-free eVe L2 profiles of particle backscatter (β particle) and extinction (α particle) coefficients, lidar ratio, volume linear/circular depolarization ratios (VLDR/VCDR), and particle linear/circular depolarization ratios (PLDR/PCDR) at 355 nm from linear (solid; dark blue) and circular (dashed; blue) emission, during the Aeolus overpass on 10 September 2021. The Aeolus-like profiles (dotted; purple) of backscatter coefficient and lidar ratio have been calculated using the circular polarization profiles.
The validation results include one case study for the one-by-one comparison between the eVe L2 and the Aeolus L2A profiles and the outcome of the statistical analysis that has been performed on the eVe – Aeolus comparison using all the 14 collocated measurements. The collocation between eVe and Aeolus is performed by selecting the nearest Aeolus BRC from the ASKOS site falling within a radius of 100 km from the site (Fig. 1) within a temporal window of ± 1.5 h from the overpass time. The distance of the nearest BRC from the ASKOS site spans from 9 to 48 km for the 14 available overpasses during ASKOS.
In both one-by-one comparison case and statistical analysis, the averaged eVe L2 profiles are obtained from lidar signals from cloud-free timeframes favoring nighttime conditions for the availability of the particle extinction coefficient and lidar ratio retrievals. As such the used eVe dataset contains four daytime cloud-free retrievals where only the Aeolus-like particle backscatter coefficient is available for the comparison with the corresponding Aeolus L2A product and 10 nighttime cloud-free retrievals where the full suite of the eVe products (i.e. particle extinction coefficient and Aeolus-like particle backscatter coefficient and lidar ratio) is available for the comparison with the corresponding Aeolus L2A products. In the same context, the cloud flag provided per bin and in BRC level from the SCA algorithm has been applied to all available Aeolus L2A profiles from SCA, MLE, and AEL–PRO algorithms aiming for cloud-free Aeolus profiles using a common cloud masking approach. The SCA cloud flag product is derived using the ice and liquid water content information from the auxiliary meteorological data from ECMWF (Sect. 8; Flamant et al., 2022). On the other hand, the Aeolus quality assurance flags, which however are available only for SCA and MLE, are not taken into account in the current study, since the application of further flagging in our statistical analysis results in significant reduction of the available bins per profile per BRC for the comparisons (Appendix A).
3.1 A pure dust case study
On 10 September 2021 Aeolus overpassed ∼ 24 km westwards from Mindelo, Cabo Verde around 19:37 UTC while eVe lidar was measuring from the ground. For the comparison with the corresponding Aeolus L2A profiles, the eVe L2 profiles have been retrieved inside a cloud-free time window (20:41 to 21:09 UTC) of the nighttime measurement, approximately 1 h after the overpass, aiming to obtain not only the particle backscatter coefficient but also the particle extinction coefficient and lidar ratio profiles using the Raman inversion method. According to Fig. 2, the aerosol conditions above Mindelo during the Aeolus overpass on 10 September 2021 indicate presence of marine aerosols inside the planetary boundary layer (PBL) which are topped with a pure desert dust layer up to 6 km. The marine aerosols layer, which extending up to 1 km, has an average lidar ratio of 18 sr and PLDR of 0.03 while the pure dust layer that reaches up to 6 km, has a mean lidar ratio of around 50 sr and PLDR of 0.27.
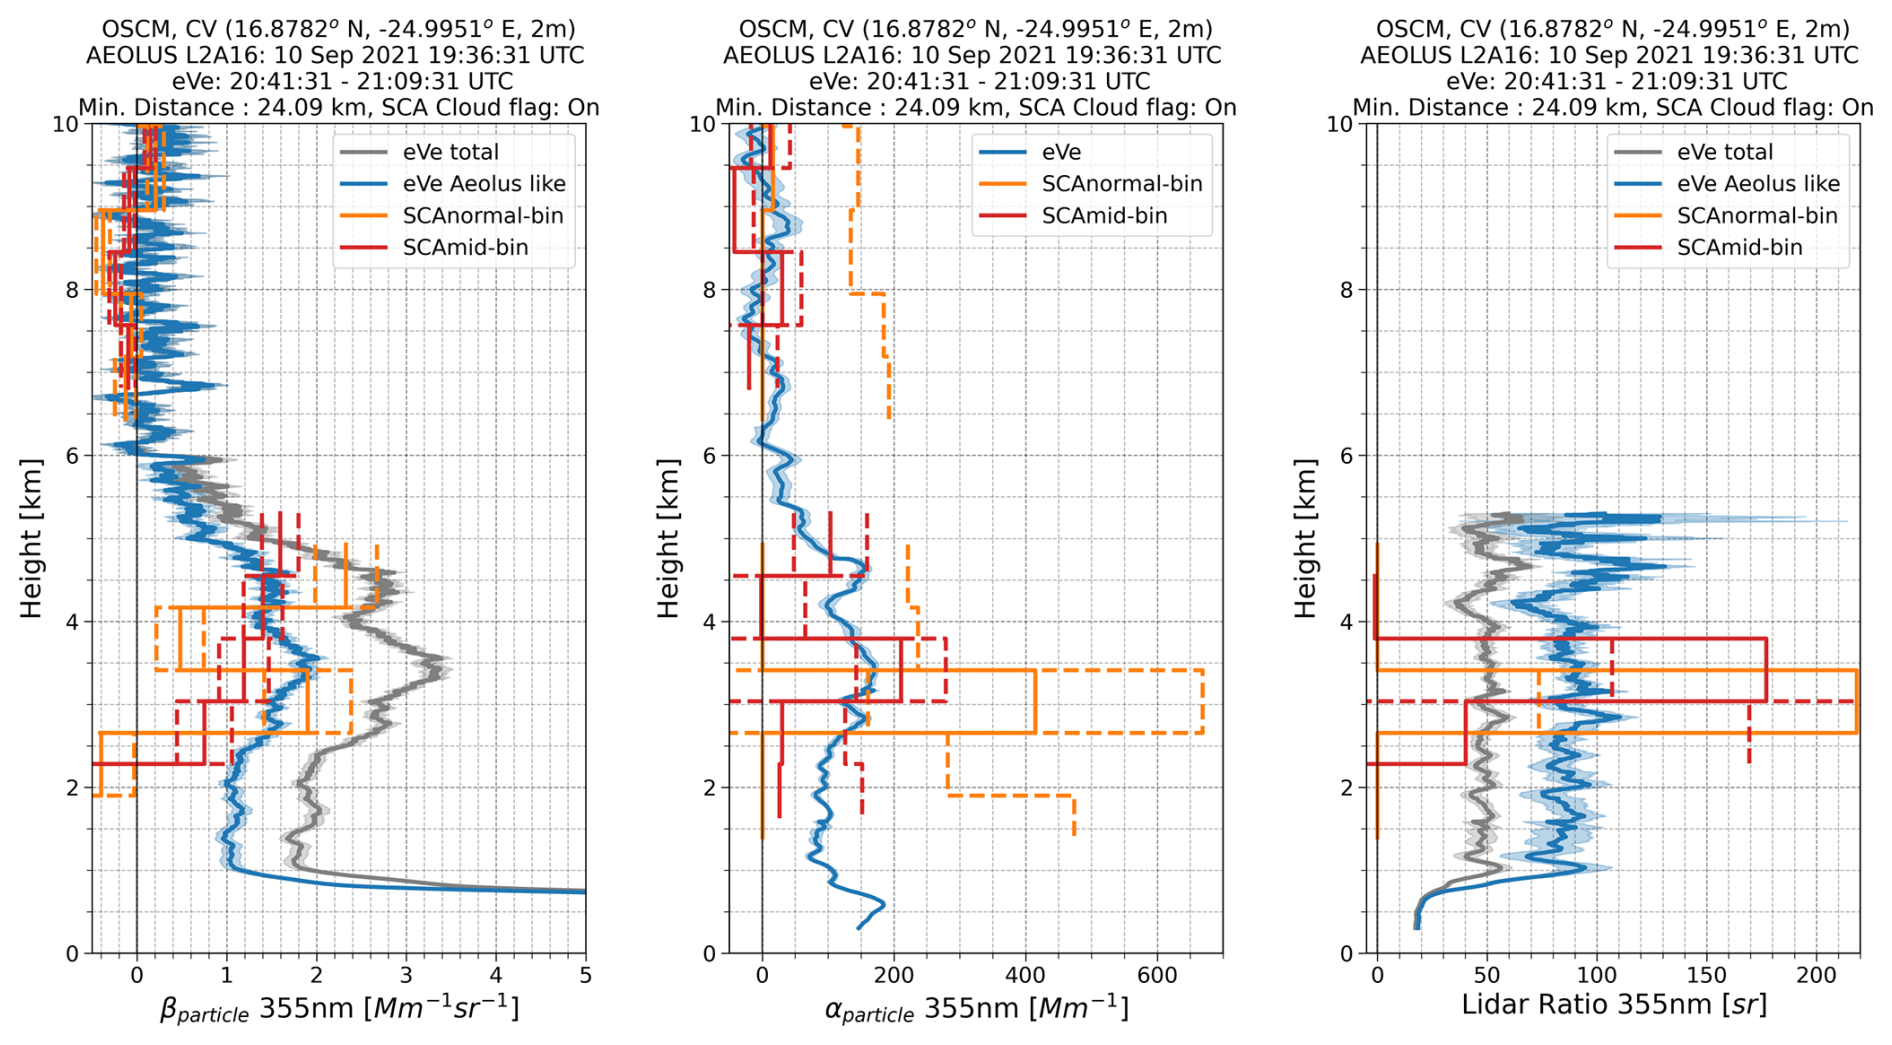
Figure 3Comparison of the cloud masked SCA Aeolus L2A profiles (SCAnormal-bin in orange; SCAmid-bin in red) from Baseline 16 against eVe L2 lidar products for the Aeolus overpass on 10 September 2021. The averaged eVe lidar profiles of the Aeolus-like particle backscatter (Aeolus-like βparticle), particle extinction coefficient (αparticle), and Aeolus-like lidar ratio were retrieved within the timeframe 20:41 to 21:09 UTC. The uncertainty of retrievals is denoted with shaded regions in the eVe profiles and with dashed lines in the Aeolus profiles.
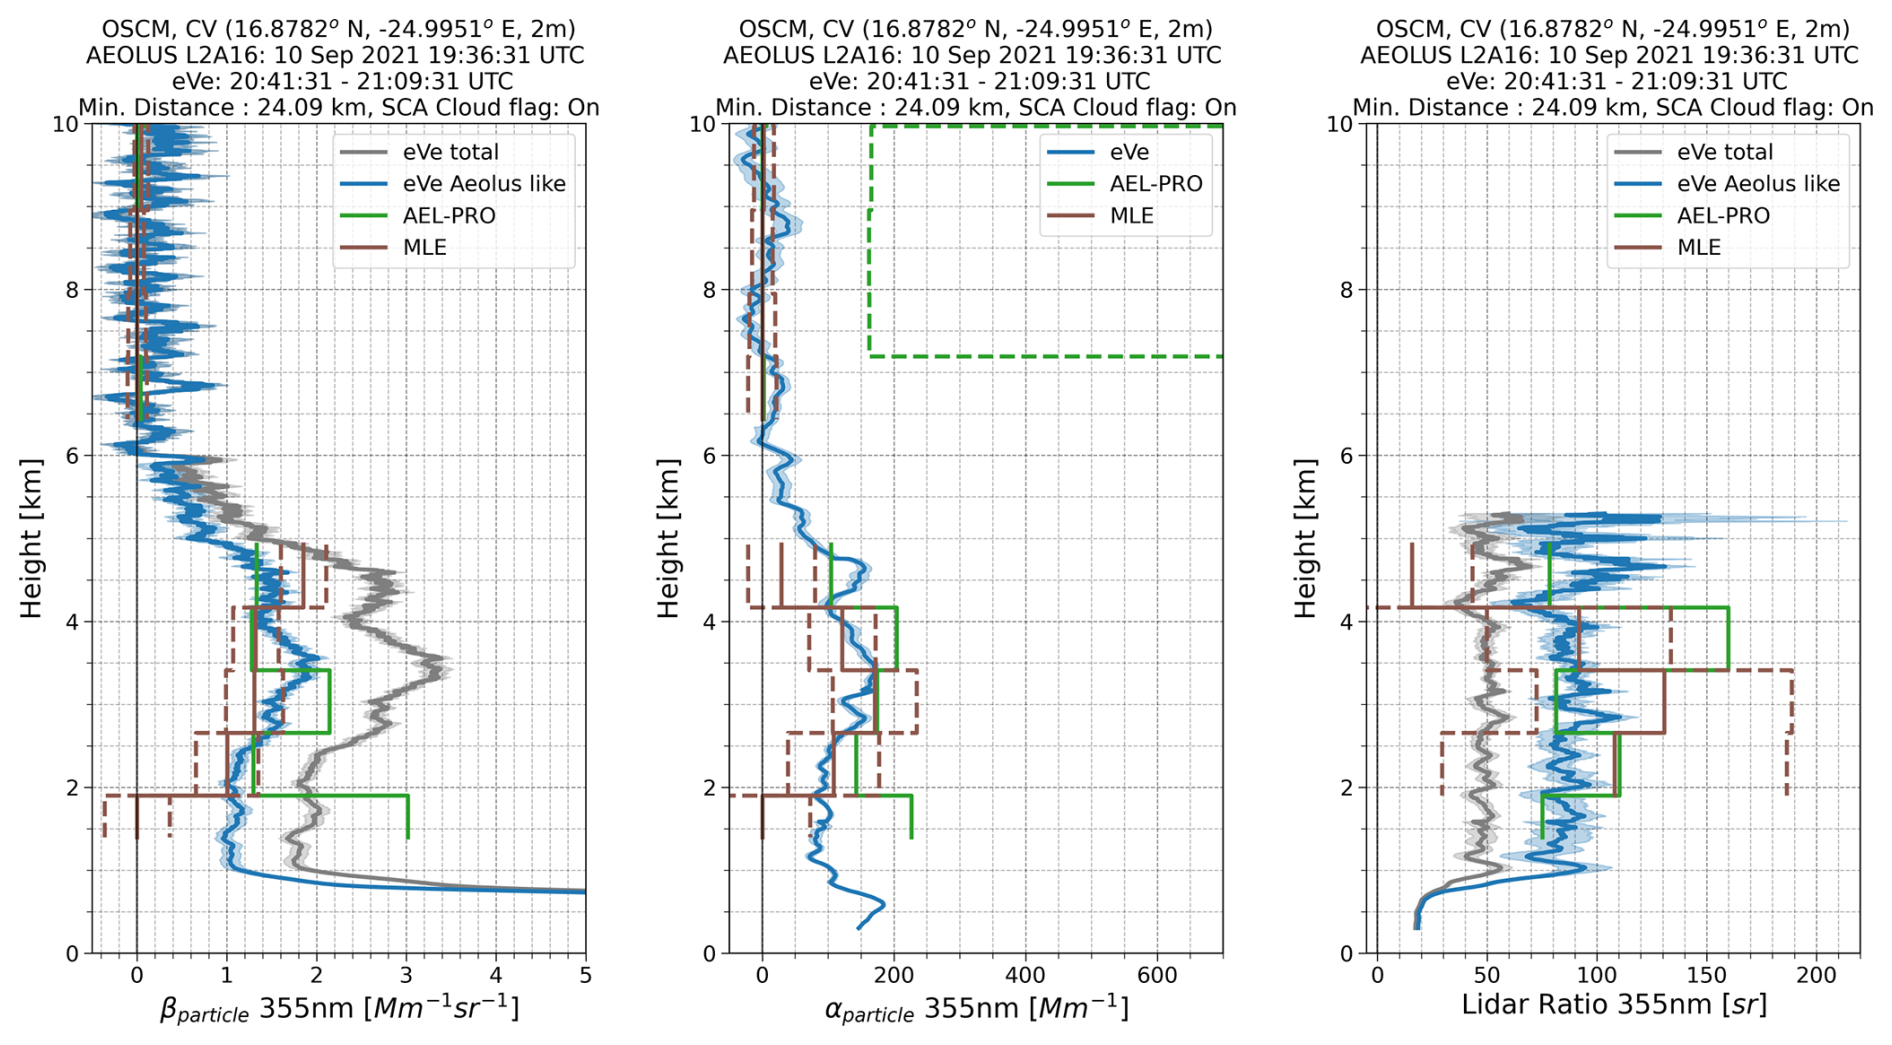
Figure 4Comparison of the cloud masked Aeolus L2A profiles as obtained from the optimal estimation algorithms AEL–PRO (green) and MLE (brown) with Baseline 16 against eVe L2 lidar products for the Aeolus overpass on 10 September 2021. The averaged eVe lidar profiles of the Aeolus-like particle backscatter (Aeolus-like βparticle), particle extinction coefficient (αparticle), and Aeolus-like lidar ratio were retrieved within the timeframe 20:41 to 21:09 UTC. The uncertainty of retrievals is denoted with shaded regions in the eVe profiles and with dashed lines in the Aeolus profiles.
The eVe L2 profiles of the Aeolus-like particle backscatter coefficient, the particle extinction coefficient, and the Aeolus-like lidar ratio are used in the one-by-one comparison of the corresponding cloud masked Aeolus L2A products from the SCA algorithm (Fig. 3) and the MLE and AEL–PRO optimal estimators (Fig. 4). It has to be noted that the applied cloud flagging from SCA algorithm results in the comparison between eVe and Aeolus L2A in heights above 2 km where the dust layer resides (1.5 to 6 km; Fig. 2), since in lower heights the Aeolus bins are flagged as cloud contaminated from the SCA cloud flag product, indicating that clouds are present within the broad BRC horizontal resolution (∼ 90 km), and have been excluded from the comparisons.
For the comparison in the particle (co-polar) backscatter coefficient, the Aeolus profile from all three algorithms is in good agreement with the Aeolus-like backscatter coefficient from eVe within the altitude range spanning from 2.5 to 5.5 km. The SCAmid-bin backscatter demonstrates better performance compared to the SCAnormal-bin since the maximum deviation (Aeolus – eVe) found for the SCAmid-bin is 0.56 Mm−1 sr−1 while for the SCAnormal-in is 1.2 Mm−1 sr−1 in absolute values (Fig. 3; left plot). However, the Aeolus backscatter values from SCA in the height bin at ∼ 2 km are below zero resulting to an increased deviation of −0.59 Mm−1 sr−1 for the SCAmid-bin and −1.53 Mm−1 sr−1 for the SCAnormal-bin. According to Flament et al. (2021) the negative values in the SCA profiles are most probably attributed to the fact that signals with low SNR levels, which oscillate around zero, are being processed and averaged from measurement to BRC level. For the optimal estimators, the maximum deviation found for AEL–PRO is 0.6 Mm−1 sr−1 and for MLE is 0.41 Mm−1 sr−1 (Fig. 4; left plot). For the comparison of the particle extinction coefficient inside the dust layer, larger deviations are found between the SCA and eVe profile reaching up to 272.8 Mm−1 for SCAnormal-bin and 124.2 Mm−1 for SCAmid-bin in absolute values (Fig. 3; middle plot). The comparison is improved when the optimal estimators are used against eVe, with the absolute deviation for MLE and AEL–PRO profiles varying from 13.1 to 98.9 Mm−1 and from 23.6 to 55.2 Mm−1, respectively (Fig. 4; middle plot). Finally, for the comparison of the (co-polar) lidar ratio, the Aeolus profiles are considerably noisier (larger bin to bin variability) than the corresponding Aeolus-like lidar ratio from eVe (Figs. 3 and 4; right plots). The absolute deviation values for the SCA profiles inside the dust layer are considerably high since they range from 30 to 127 sr, thus no good agreement can be observed between Aeolus and the eVe Aeolus-like profile (Fig. 3; right plot). For the AEL–PRO and the MLE profiles the departures from the eVe Aeolus-like profile are smaller than those for the SCA profiles and a good agreement can be noted only at certain height bins, at ∼ 3 and ∼ 4.5 km for AEL–PRO with a deviation of 11 sr and at ∼ 3.7 km for MLE with a deviation of 4 sr (Fig. 4; right plot).
3.2 Statistical Analysis
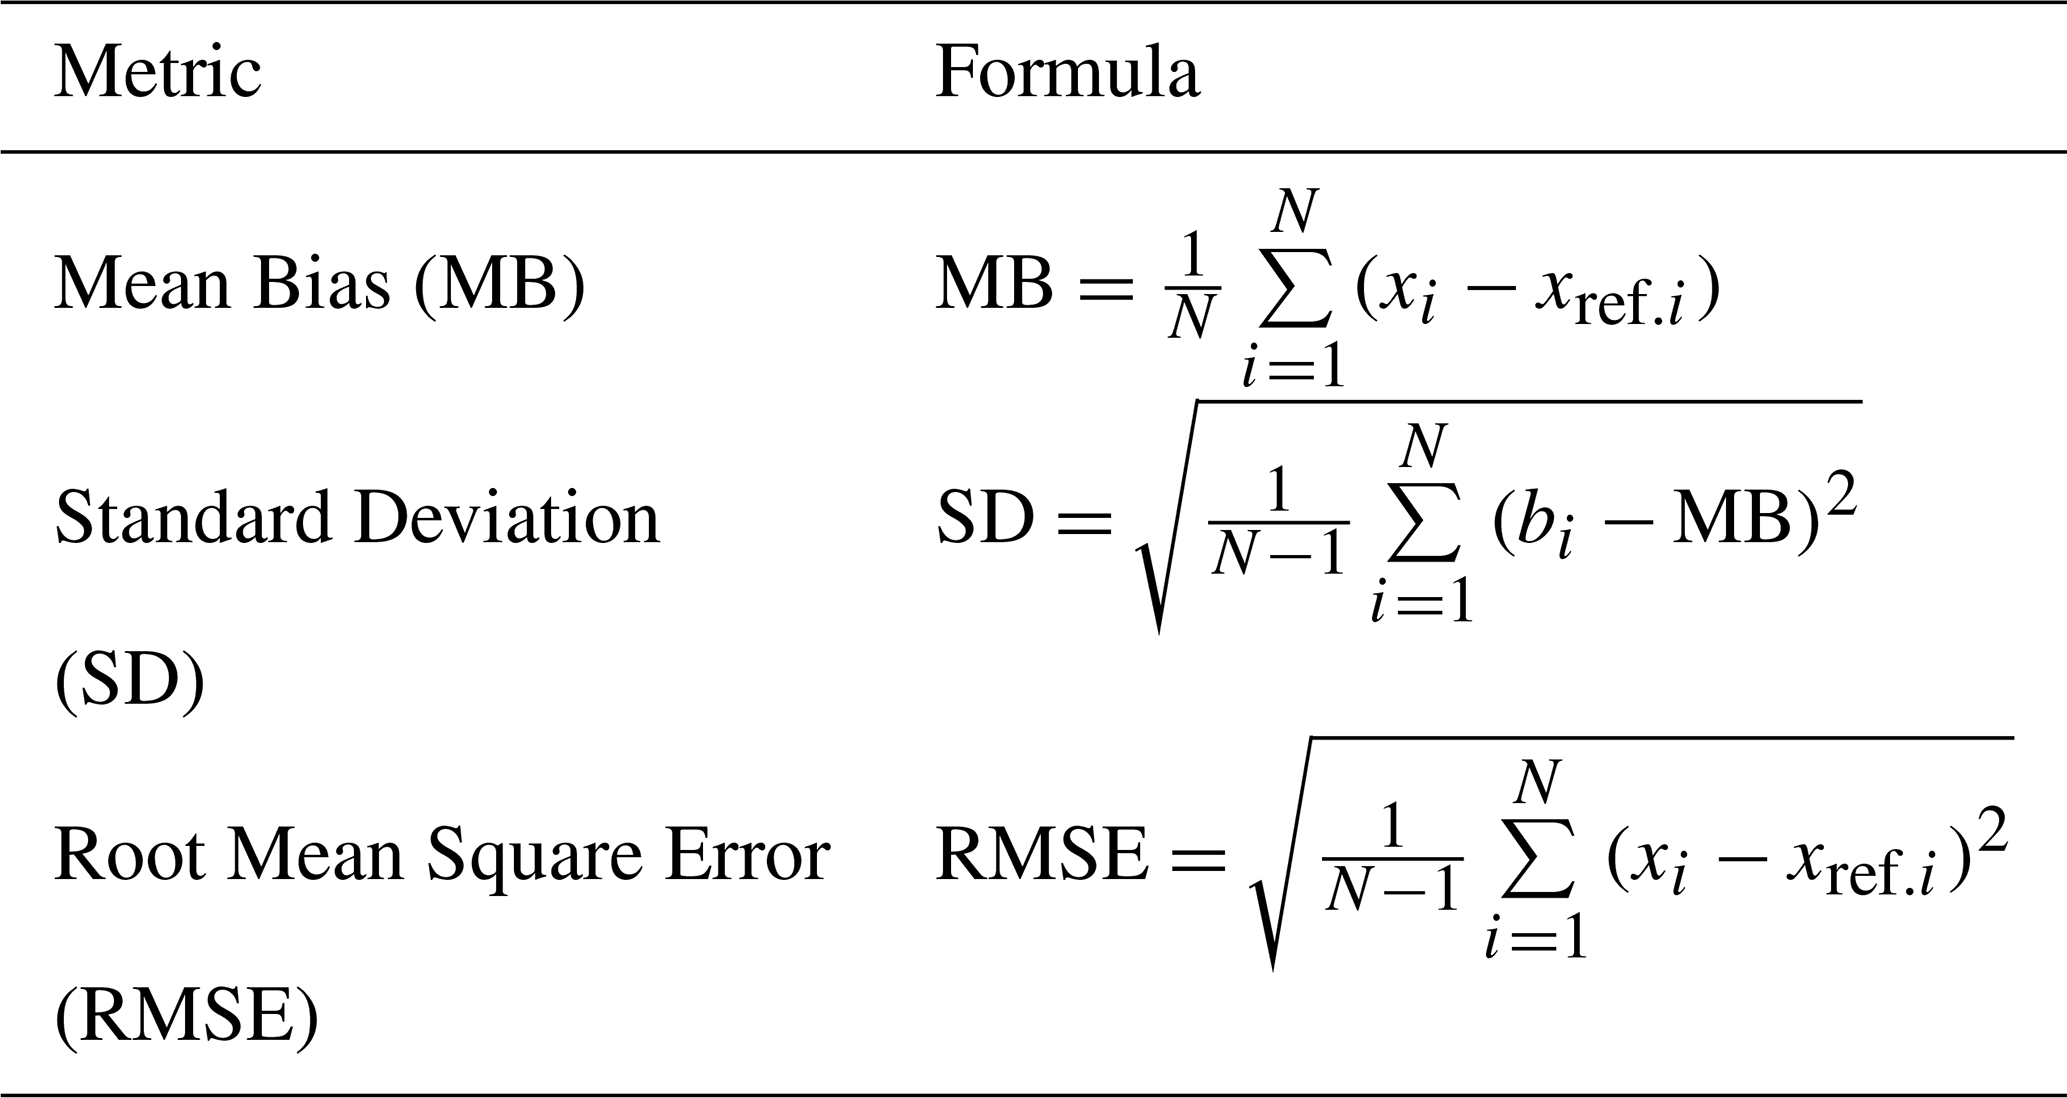
A statistical analysis has been performed using the 14 eVe – Aeolus collocations aiming to assess the overall performance of Aeolus during the ASKOS period. For the statistical analysis, the eVe profiles have been rescaled to the Aeolus binning resolution to account for the fact that the number of the vertical bins provided from Aeolus is fixed but the height that corresponds to each bin changes along the orbit (for each orbit's BRC) and from orbit to orbit. Moreover, an upper threshold in the retrieved statistical uncertainty of each eVe profile (βuncer<1 Mm−1sr−1, αuncer<50 Mm−1, LRuncer<50 sr) has been applied for excluding height bins with high statistical uncertainty (e.g. regions with low signal-to-noise ratio) from the analysis. Then, for each L2A product the vertically resolved biases have been calculated and then sorted into groups based on three different parameters which served as the classifiers in each respective classification scheme: (i) the bin height since the retrieved optical properties are a function of the height, (ii) the overlying total optical depth (OOD) which is indicative of the thickness of the measured air masses from Aeolus from the topmost bin until the ground, and (iii) the scattering ratio (i.e., the total-to-molecular backscatter ratio) indicative for the presence and amount of suspended particles. The statistical metrics calculated from the grouped biases, organized by altitude ranges, scattering ratio classes and OOD classes, for the cloud masked Aeolus L2A profiles are provided in Table 1. These metrics include the mean bias (MB), standard deviation (SD), and root mean square error (RMSE). Based on the literature review from Walther and Moore (2005), the MB of each distribution corresponds to the systematic error for each class, the SD is representative of the random error which can be due either to noise in the data or to natural variability since the ground-based and satellite lidars are not probing the same air mass, and the RMSE corresponds to the overall magnitude of error. The calculated errors (systematic, random, overall) refer to the error characteristics per Aeolus bin, with the classification into altitude ranges, scattering ratio classes, and OOD classes serving to increase the sample size per bin, thereby improving the statistical robustness of the analysis. The metrics calculated from groups with sample size of N<5 are not taken into consideration in the results. The eVe profiles that have been used as reference in the statistical metrics are the Aeolus-like particle backscatter coefficient, the particle extinction coefficient, and the Aeolus-like lidar ratio.
Table 1The metrics of mean bias, standard deviation, and root mean square error where N is the sample size, xi is the measured value from Aeolus, xref,i is the reference/true value from eVe, bi is the calculated bias (, MB is the mean bias, and Σ is the summation formula.
With respect to the classification criteria, the scattering ratio has been calculated for each overpass and Aeolus bin using the eVe particle backscatter coefficient profiles, rescaled to the Aeolus binning resolution, and the corresponding molecular backscatter coefficient, estimated from modeled temperature and pressure profiles above Mindelo. The meteorological profiles were provided on an hourly basis from dedicated Weather Research and Forecasting (WRF) model runs during the ASKOS period. The same WRF derived temperature and pressure profiles were also used in the retrieval of the eVe lidar products used in this study. The OOD has been calculated for each Aeolus bin by integrating the total (particle and molecular) extinction coefficient from the topmost Aeolus bin downwards to each successive bin. The particle extinction coefficient used for the OOD calculation has been calculated using the rescaled eVe particle backscatter coefficient multiplied by a mean lidar ratio value of 45.4 sr that has been calculated from the eVe lidar ratio profiles in the height range 2–4 km. The molecular extinction coefficient profiles have been estimated relying on the same WRF model outputs. To account also the molecular extinction contribution above the topmost WRF height bin (∼ 18 km) in the OOD calculation, the U.S. Standard Atmosphere model (initialized with ground-level WRF values) was used to extend the profiles up to ∼ 85 km. As a result, an offset value in the order of ∼ 0.048 has been considered in the OOD calculations that corresponds to the overlying molecular optical depth between the upper altitude limit in U.S. standard atmosphere model (∼ 85 km) and the WRF model top.
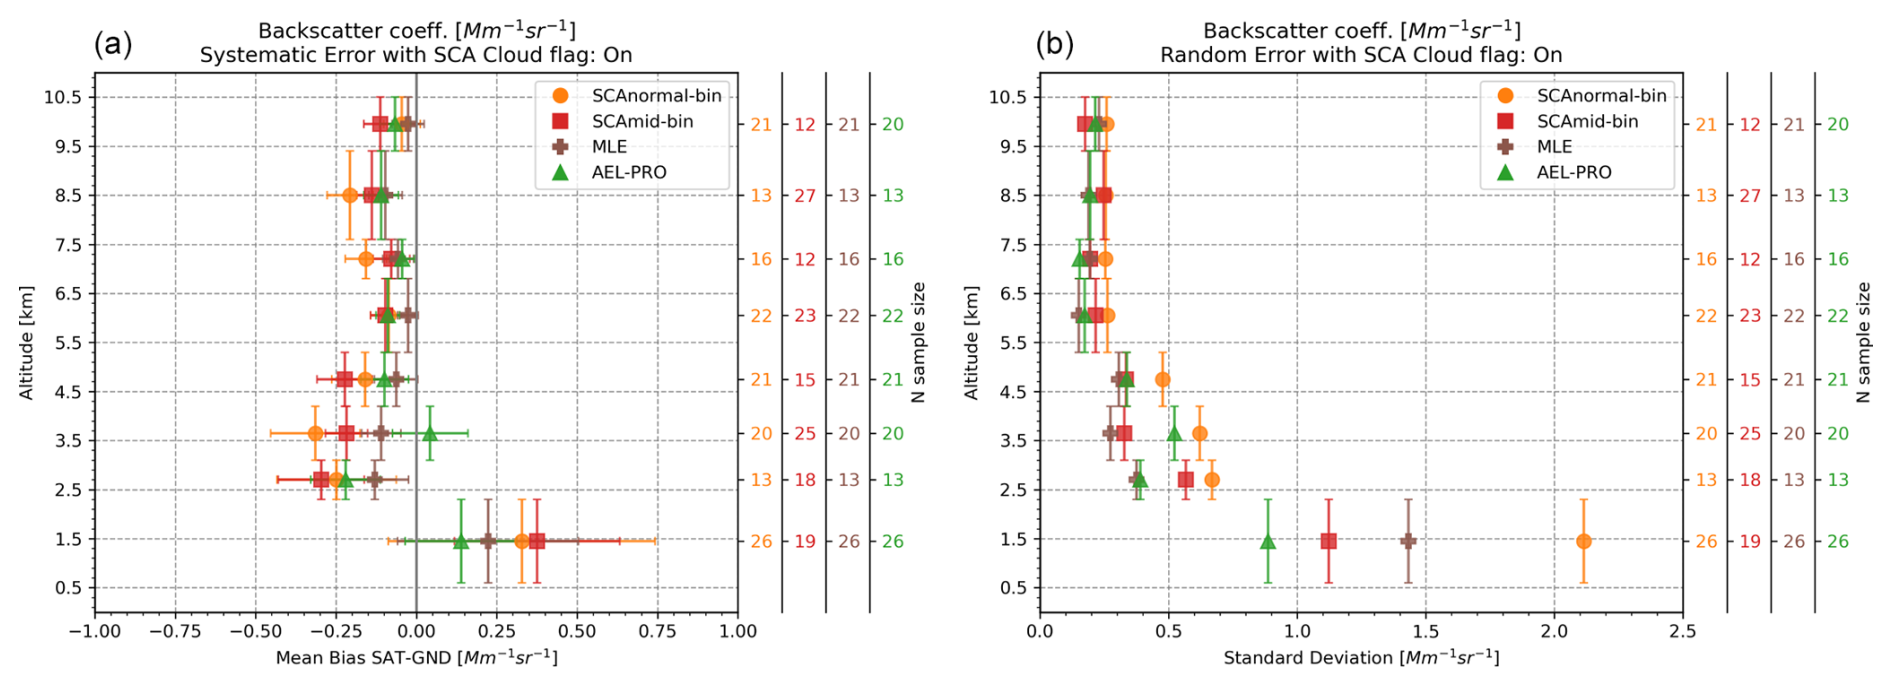
Figure 5The systematic (a) and random (b) errors of the Aeolus backscatter coefficient from SCA (normal bin in orange circles; mid bin in red squares), AEL–PRO (green triangles), and MLE (brown crosses) as a function of eight altitude ranges based on the Aeolus bin height. The error bars in the horizontal axis for systematic error correspond to the standard error of the mean (sem) for the mean bias. The error bars in the vertical axis indicate the extend of each altitude range (i.e. class boundaries at 0.6, 2.3, 3.1, 4.2, 5.3, 6.8, 7.6, 9.4, 10.5 km). The secondary y-axis indicates the sample size N per class for each algorithm. Metrics with N<5 are not taken into consideration.
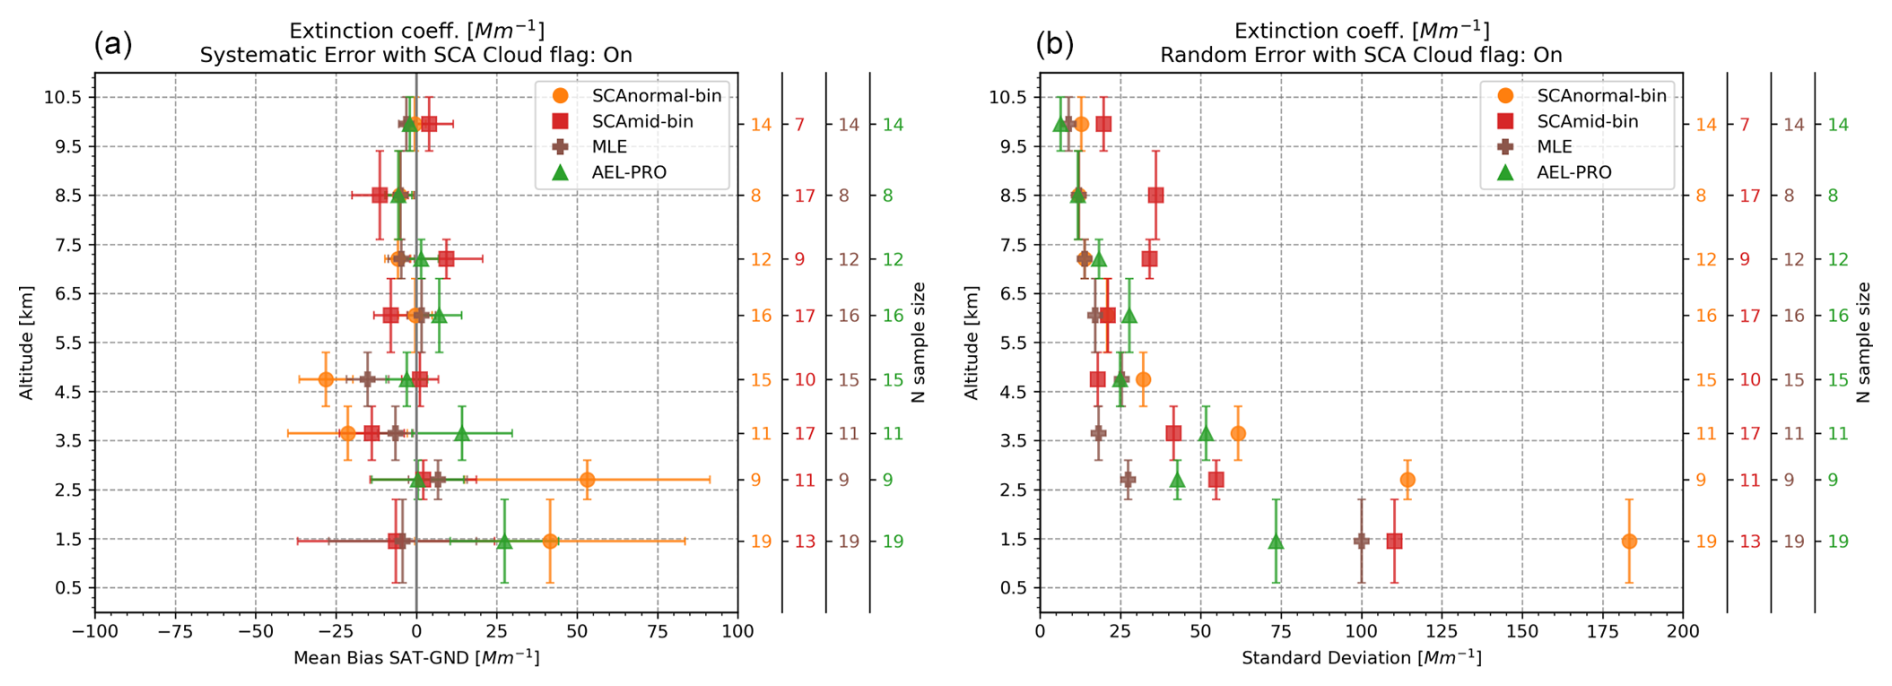
Figure 6The systematic (a) and random (b) errors of the Aeolus extinction coefficient from SCA (normal-bin in orange circles; mid-bin in red squares), AEL–PRO (green triangles), and MLE (brown crosses) as a function of eight altitude ranges based on the Aeolus bin height. The error bars in the horizontal axis for systematic error correspond to the standard error of the mean (sem) for the mean bias. The error bars in the vertical axis indicate the extend of each altitude range (i.e. class boundaries at 0.6, 2.3, 3.1, 4.2, 5.3, 6.8, 7.6, 9.4, 10.5 km). The secondary y-axis indicates the sample size N per class for each algorithm. Metrics with N<5 are not taken into consideration.
Summarized tables with all calculated metrics per Aeolus product for each classification parameter (altitude range, OOD class, and scattering ratio class) are provided in Appendix B. The results from the statistical analysis using eight altitude ranges to group the biases between Aeolus and eVe Aeolus-like profiles to derive the systematic and random errors per bin per Aeolus product are presented in Fig. 5 for the backscatter coefficient, in Fig. 6 for the extinction coefficient, and in Fig. 7 for the lidar ratio.
For the backscatter coefficient (Fig. 5), Aeolus tends to slightly overestimate the co-polar backscatter coefficient in the first altitude range (0.6–2.3 km) with the maximum systematic error value to be found for SCAnormal-bin with 0.33 Mm−1 sr−1 and the minimum random error value to be 0.14 Mm−1 sr−1 for AEL–PRO among the four algorithms. The corresponding random error values in the first altitude class vary from 0.88 (AEL–PRO) to 2.1 Mm−1 sr−1 (SCAnormal-bin). In the rest altitude ranges, negative systematic error values are observed indicating underestimation of the Aeolus (co-polar) backscatter coefficient. More specifically, in the height classes from 2.3 to 5.3 km where the dust particles mostly reside during ASKOS (Marinou et al., 2023), the systematic and random errors are up to −0.31 and 0.61 Mm−1 sr−1, respectively, for the SCAnormal-bin, up to −0.3 and 0.57 Mm−1 sr−1, respectively, for the SCAmid-bin, up to −0.13 and 0.38 Mm−1 sr−1, respectively, for the MLE, and up to −0.22 ± 0.39 Mm−1 sr−1, respectively, for the AEL–PRO. Finally, the overall error values (Appendix B) are similar to the corresponding random error values that are obtained in all altitude ranges for all algorithms, with their difference to be observed in the second decimal place, indicating that the overall error is primarily driven by random variability rather than systematic bias. Overall, a decreasing trend is observed for systematic, random, and overall errors with increasing of the height with the overall error decreasing from 2.1 to 0.26 Mm−1 sr−1 for the SCAnormal-bin, from 1.2 to 0.2 Mm−1 sr−1 for the SCAmid-bin, from 0.88 to 0.22 Mm−1 sr−1 for the AEL–PRO, and from 1.4 to 0.23 Mm−1 sr−1 for the MLE. A decreasing trend of the absolute values of the errors with altitude increase is also reported in past related studies (Abril-Gago et al., 2022; Baars et al., 2021; Gkikas et al., 2023).
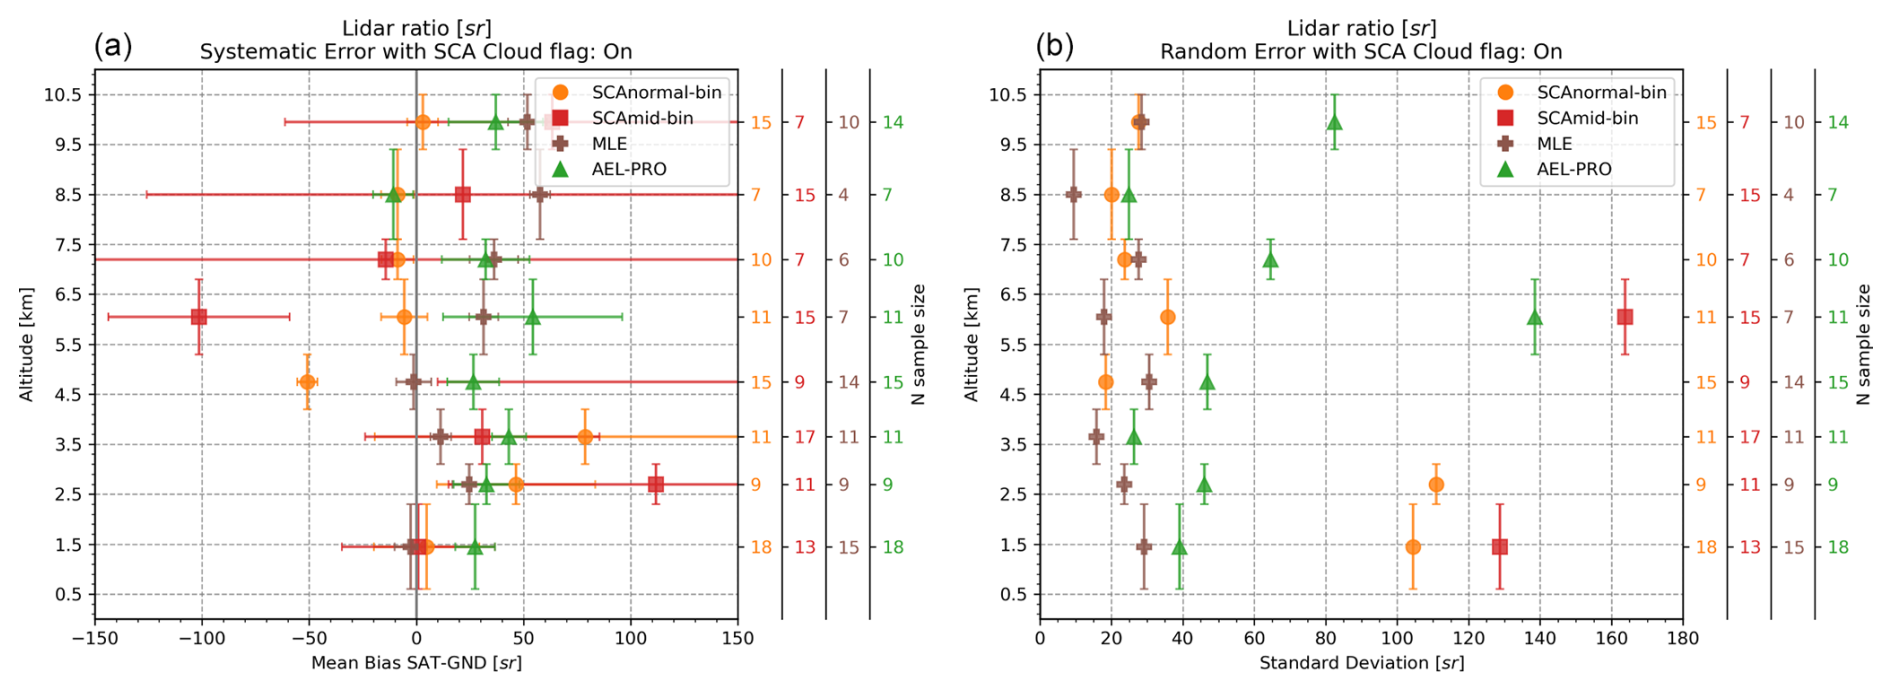
Figure 7The systematic (a) and random (b) errors of the Aeolus lidar ratio from SCA (normal-bin in orange circles; mid-bin in red squares), AEL–PRO (green triangles), and MLE (brown crosses) as a function of eight altitude ranges based on the Aeolus bin height. The error bars in the horizontal axis for systematic error correspond to the standard error of the mean (sem) for the mean bias. The error bars in the vertical axis indicate the extend of each altitude range (i.e. class boundaries at 0.6, 2.3, 3.1, 4.2, 5.3, 6.8, 7.6, 9.4, 10.5 km). The secondary y-axis indicates the sample size N per class for each algorithm. Metrics with N<5 are not taken into consideration.
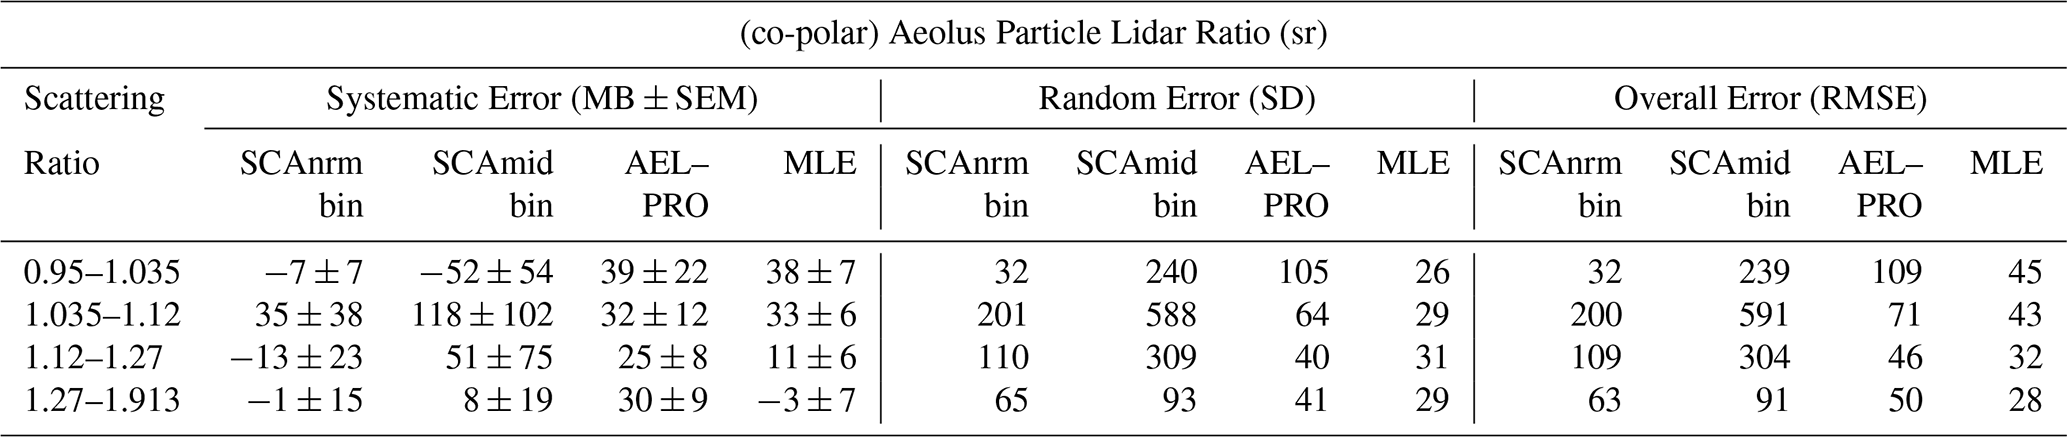
The statistical analysis into eight altitude ranges for the Aeolus extinction coefficient and lidar ratio profiles reveals higher errors variability due to the noisier Aeolus retrievals compared to the Aeolus backscatter coefficient retrievals and the limited sample size (analysing only cases where nighttime eVe observations are available) makes the identification of clear patterns in the behavior of the systematic and random errors more challenging. Focusing on the extinction coefficient (Fig. 6), unlike the backscatter coefficient, the systematic errors are less consistent across algorithms: the SCAnormal-bin overestimates the extinction coefficient up to 53 Mm−1 within the height ranges from 0.6 to 3.1 km and underestimates it up to 28 Mm−1 from 3.1 to 10.5 km, the AEL–PRO overestimates the extinction up to 27 Mm−1 in the height range 0.6–4.2 km and exhibits systematic error absolute values up to 7 Mm−1 in the rest altitude ranges, while the SCAmid-bin and the MLE demonstrate a systematic error variability up to 14 and up to 15 Mm−1 in absolute terms, respectively, without profound trend of under or overestimation. Moreover, the random errors, which are again similar to the overall errors differing only by few Mm−1 (Appendix B), decrease (mostly gradually) with increasing of altitude, namely from 183 to 12 Mm−1 for the SCAnormal-bin, from 110 to 20 Mm−1 for the SCAmid-bin, from 73 to 6 Mm−1 for the AEL–PRO, and from 100 to 9 Mm−1 for the MLE. Nevertheless, the fact that the random error values are relatively high indicate high random variability of the biases (Aeolus – eVe) for the extinction coefficient and their similar values to the overall error values indicate that the systematic errors are overshadowed by the random errors. For the lidar ratio (Fig. 7), the corresponding systematic, random, and overall errors for the eight altitude ranges present extremely large values and variability due to higher variability and noise levels in the Aeolus lidar ratio retrievals from all the available algorithms. However, the MLE algorithm seems to be in better agreement with the corresponding eVe Aeolus-like lidar ratio retrievals in the heights where aerosols are more frequently detected (0.6–5.3 km) since the systematic and random errors reach up to 25 sr and 33 sr, respectively, followed by the AEL–PRO (systematic errors up to 43 sr and random errors up to 54 sr) and then the SCA with extreme values (systematic errors up to 266 sr and random errors up to 771 sr). Similar to the backscatter and extinction coefficients, the random and overall error values differ only by few sr also for the lidar ratio in all altitude classes indicating that the random variability is the main driver for the overall error for the three Aeolus L2A retrievals (backscatter, extinction, and lidar ratio). Nevertheless, the variability and the deviations are extremely high for the Aeolus lidar ratio from all algorithms, thus it should be used with caution in studies for the exploitation of the Aeolus L2A products.
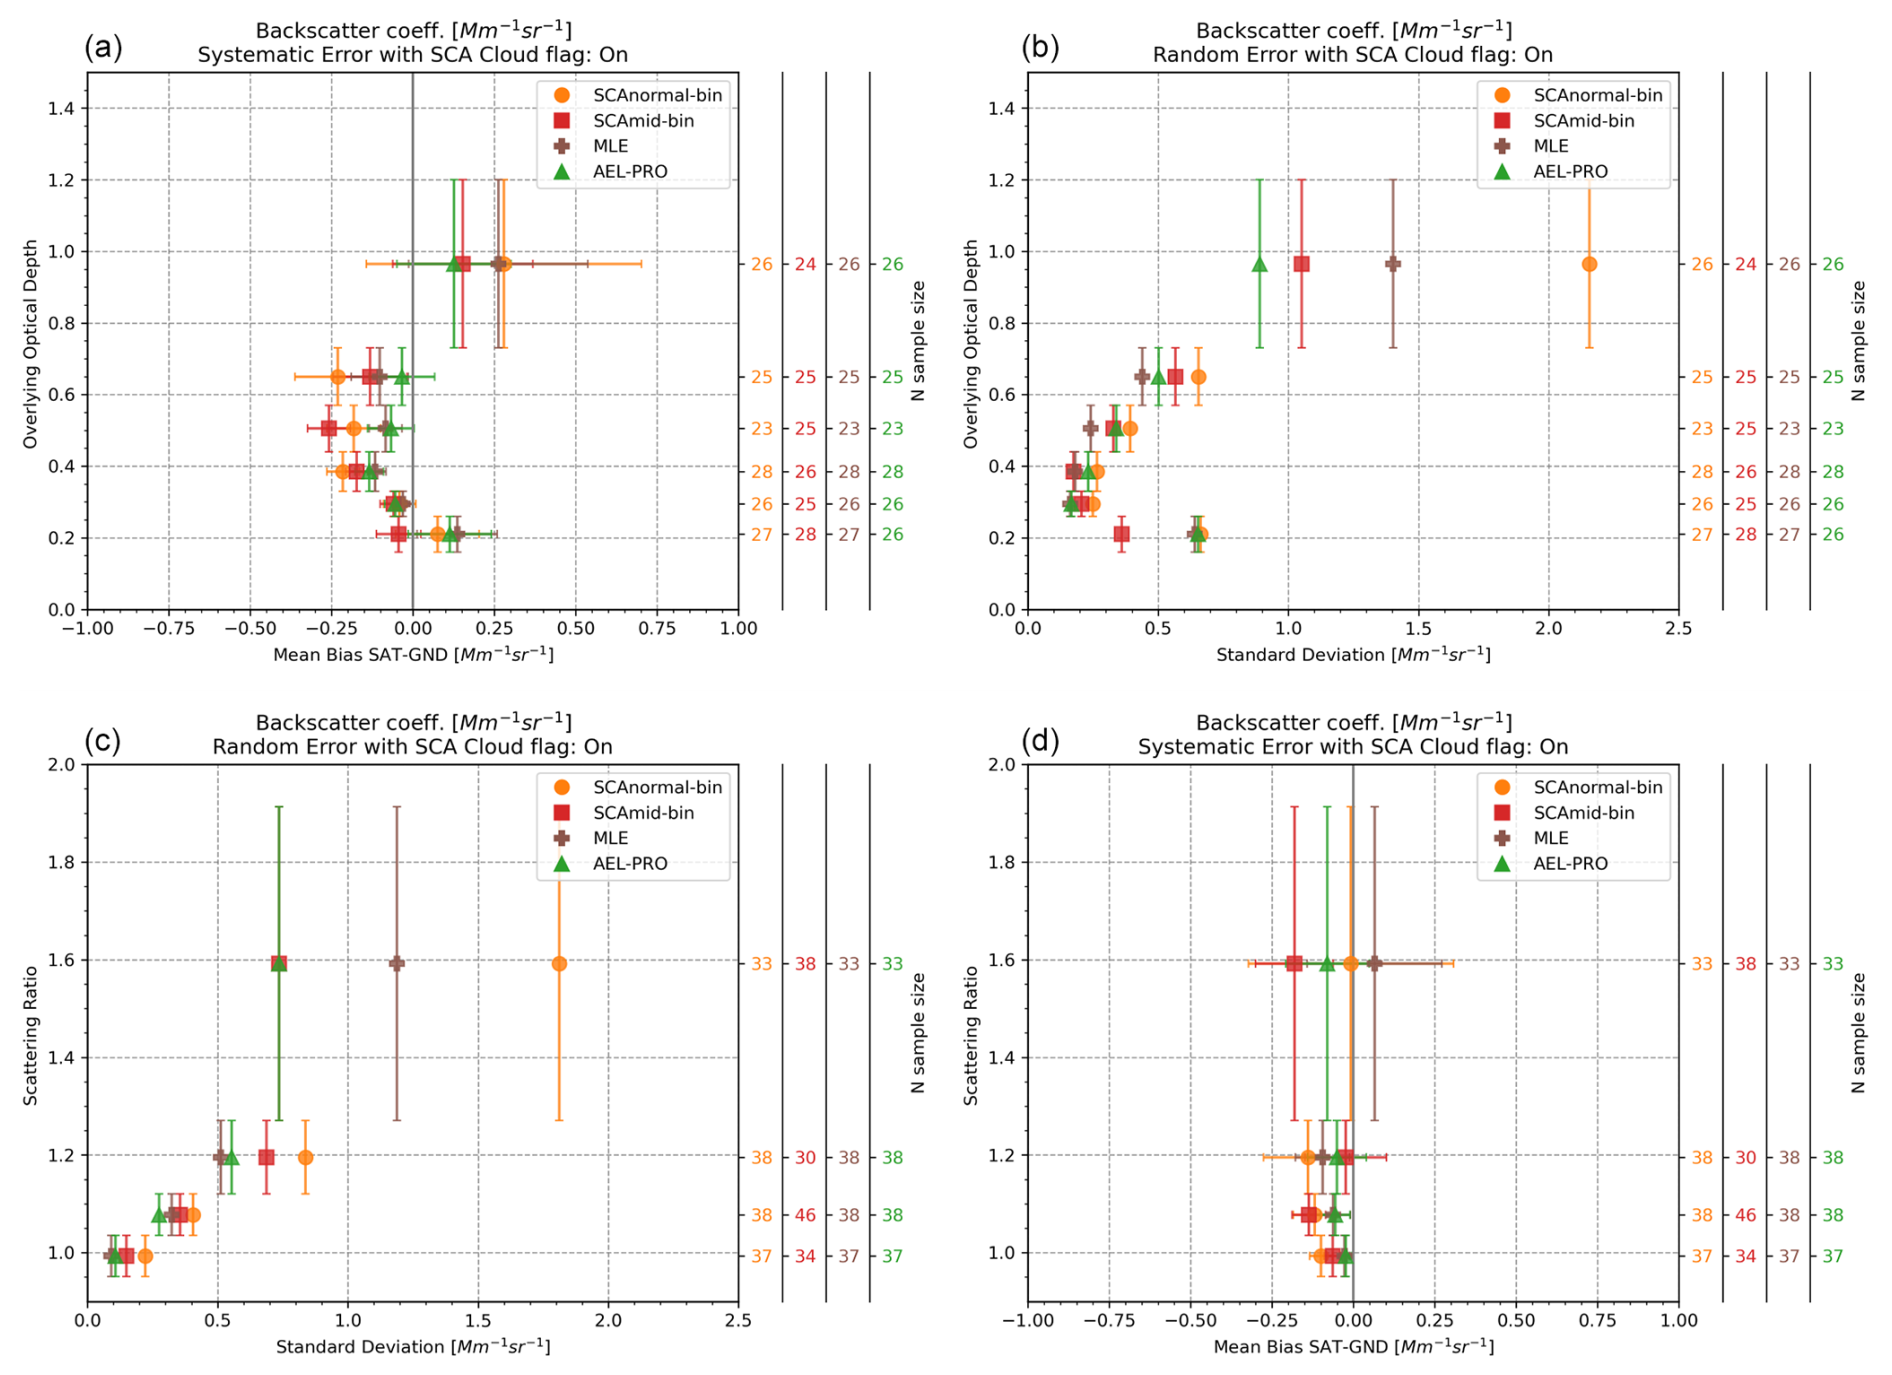
Figure 8The systematic (a, c) and random (b, d) errors of the Aeolus backscatter coefficient from SCA (normal-bin in orange circles; mid-bin in red squares), AEL–PRO (green triangles), and MLE (brown crosses) as a function of six OOD classes (a, b) and four scattering ratio classes (c, d). The error bars in the horizontal axis for the systematic error correspond to the standard error of the mean (sem) for the mean bias. The error bars in the vertical axis indicate the extend of each class: class boundaries at 0.16, 0.26, 0.33, 0.44, 0.57, 0.73, 1.2 for the OOD and 0.95, 1.04, 1.12 , 1.27, 1.91 for the scattering ratio. The secondary y-axis indicates the sample size N per class for each algorithm.
The results from the statistical analysis using six OOD classes and four scattering ratio classes using the biases between Aeolus and eVe Aeolus-like profiles falling within the height range 0.5–10.5 km are presented herein, for the backscatter coefficient in Fig. 8 and for the extinction coefficient in Fig. 9. The corresponding results for the lidar ratio are not shown here, since extremely large error values and variability are again observed in the statistics, as already reported in the statistical analysis of the biases based on eight altitude ranges, highlighting the low accuracy of the Aeolus lidar ratio retrievals. The extra analysis using the overlying optical depth and the scattering ratio classes has been applied to the data for providing additional insights in the behavior of the biases under different atmospheric and aerosol loads. In general, the overlying optical depth increases as we reach lower heights (i.e. thicker air masses) in the atmosphere where higher scattering ratio values are typically encountered due to presence of aerosols, as such, the attenuation of the Aeolus laser beam is expected to be higher in the lower heights leading to larger discrepancies (random errors; reduction of signal-to-noise ratio) of the Aeolus profiles against the reference ones acquired by eVe. Indeed, the statistical results from the OOD and scattering ratio classes indicate that the overall errors, which are primarily driven by the random variability since random and overall error values are again similar, increase with increasing of the OOD and the scattering ratio.
For the backscatter coefficient, an underestimation tendency is observed in the classes with OOD less than 0.73 (Fig. 8; top row) where the systematic errors reach up to −0.23 Mm−1 sr−1, with the MLE and the AEL–PRO to have better agreement with eVe (systematic errors up to −0.17 Mm−1 sr−1). The random errors in the classes with OOD from 0.26 to 0.73 increase with increasing OOD reaching up to 0.66 Mm−1sr−1 for the SCAnormal-bin, 0.57 Mm−1 sr−1 for the SCAmid-bin, and 0.5 Mm−1 sr−1 for the AEL–PRO and MLE. The OOD class 0.73–1.2 is the class with the maximum systematic and random errors indicating slight overestimation, which, however comes with large variability, of the backscatter in the lower heights where the overlying optical depth is high. Complementary, the systematic errors calculated within the different scattering ratio classes (Fig. 8; bottom row) range from −0.18 to −0.01 Mm−1 sr−1 for the SCA, from −0.08 to −0.02 Mm−1 sr−1 for the AEL–PRO, and from −0.1 to 0.07 Mm−1 sr−1 for the MLE. Moreover, for all algorithms the random error increases with increase of the scattering ratio, e.g. up to 1.81 Mm−1 sr−1 for the SCAnormal-bin, up to 0.74 Mm−1 sr−1 for the SCAmid-bin, up to 0.74 Mm−1sr−1 for the AEL–PRO, and up to 1.19 Mm−1 sr−1 for the MLE. Again, similar values for the random and overall errors are observed when using the scattering ratio classes.
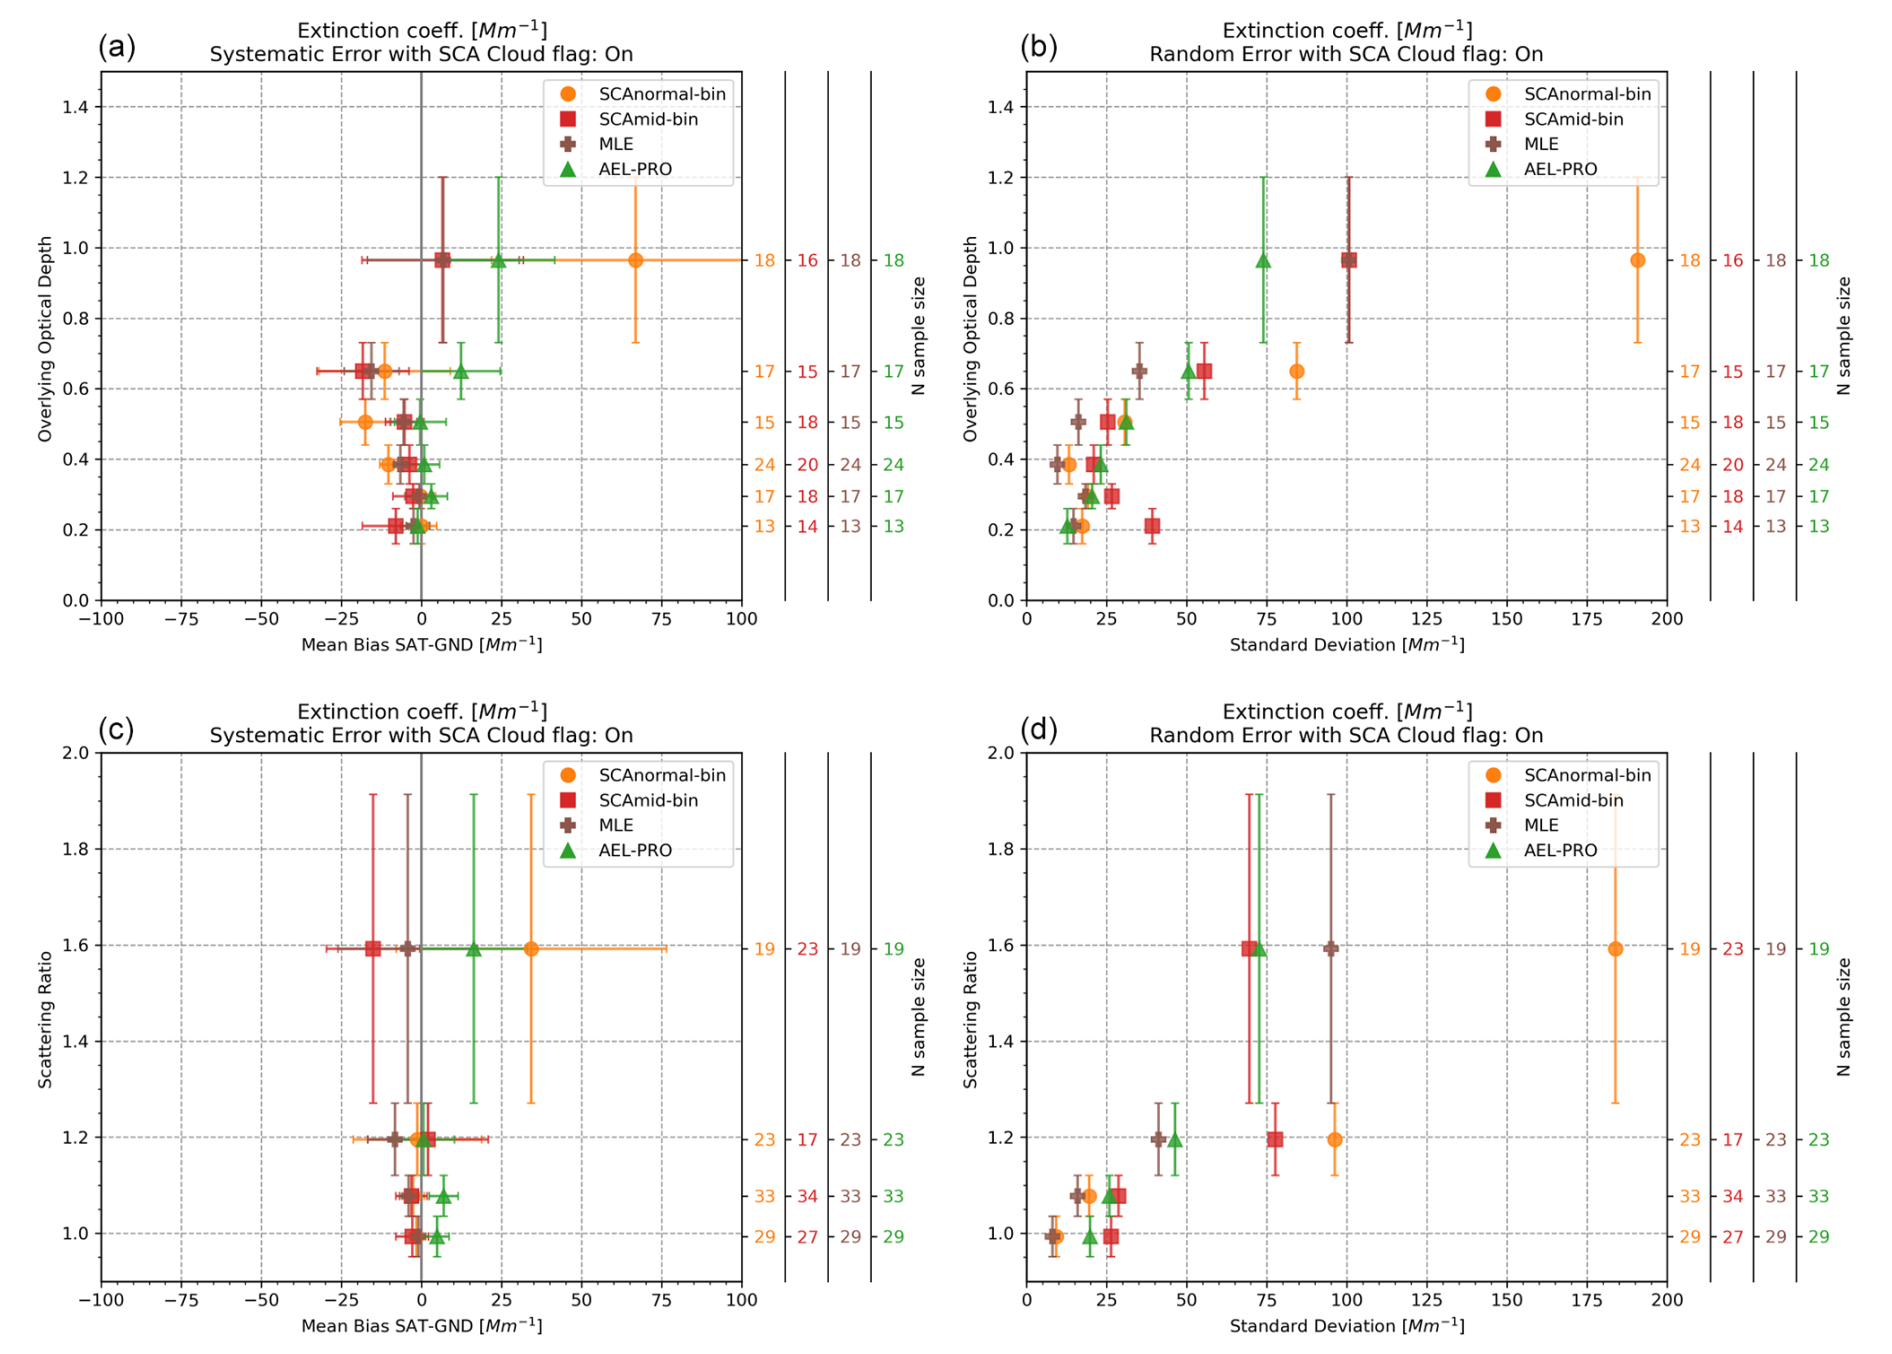
Figure 9The systematic (a, c) and random (b, d) errors of the Aeolus extinction coefficient from SCA (normal-bin in orange circles; mid-bin in red squares), AEL–PRO (green triangles), and MLE (brown crosses) as a function of six OOD classes (a, b) and four scattering ratio classes (c, d). The error bars in the horizontal axis for the systematic error correspond to the standard error of the mean (sem) for the mean bias. The error bars in the vertical axis indicate the extend of each class: class boundaries at 0.16, 0.26, 0.33, 0.44, 0.57, 0.73, 1.2 for the OOD and 0.95, 1.04, 1.12 , 1.27, 1.91 for the scattering ratio. The secondary y-axis indicates the sample size N per class for each algorithm.
For the extinction coefficient (Fig. 9), similar behavior as for the backscatter coefficient is observed for the SCAnormal-bin, SCAmid-bin and the MLE algorithms but with larger discrepancies due to the noisier extinction retrievals from Aeolus, i.e., underestimation tendency in the OOD classes with OOD values up to 0.73. More specifically, for the SCA (normal- and mid-bin) the systematic errors mainly increase with increasing OOD reaching up to −18 Mm−1 and increasing random errors up to 84 Mm−1, while for the MLE the systematic errors reach up to −16 Mm−1 and the random errors up to 35 Mm−1. In the OOD class 0.73–1.2, the SCA systematic and random errors are found to be 67 and 191 Mm−1 in the normal-bin resolution and 7 and 101 Mm−1 in the mid-bin resolution, respectively, indicating overestimation of the extinction in height bins with significant atmospheric load in the overlying layers. For the MLE retrievals, in the OOD class 0.73–1.2, the systematic error is 7 Mm−1 and the random error is 98 Mm−1. In AEL–PRO, the systematic errors range from −1 to 24 Mm−1 and the random errors range from 12 to 74 Mm−1. Again, similar behavior of increasing systematic, random, and overall errors with increase of the OOD is observed also with increase of the scattering ratio.
The eVe lidar has been deployed in the ASKOS/JATAC campaign in Cabo Verde with the main aim of providing reference measurements for the validation of the Aeolus L2A products. Leveraging 14 collocated observations between eVe and Aeolus, this validation study evaluates the performance of the SCA, MLE, and AEL–PRO algorithms (Baseline 16) in retrieving the Aeolus L2A aerosol optical properties focusing on an environment with desert dust, marine aerosols, and dust mixtures as the predominant aerosol types. The Aeolus L2A profiles used in the analysis are cloud-free, since the cloud contaminated bins have been removed based on the cloud flag product from the SCA algorithm that uses the ECMWF auxiliary data for defining the cloud screening thresholds. As such, the cloud-free Aeolus L2A profiles are compared against the corresponding Aeolus-like products from suborbital cloud-free eVe lidar measurements.
The results from the performed validation study reveal that the co-polar particle backscatter coefficient is the most accurate Aeolus L2A product with random (and overall) errors up to 2 Mm−1 sr−1 and systematic errors up to 0.37 Mm−1 sr−1 in absolute values indicating overestimation trend below 2.3 km and underestimation trend above that height. The particle extinction coefficient with random (and overall) errors up to 183 Mm−1 and systematic errors up to 53 Mm−1 in absolute values reveals an underestimation trend mainly within the altitude range 3.1–4.2 km. The statistical results for the co-polar particle backscatter coefficient are expected to be more representative and less prone to atmospheric related biases compared to those for the particle extinction coefficient, as the sample size for the particle extinction coefficient analysis is limited only to 10 (out of the total 14) cases with nighttime cloud-free eVe measurements available while for the co-polar particle backscatter coefficient all the 14 available cases (nighttime and daytime) have been used. A common behavior for the Aeolus backscatter and extinction coefficients is that the biases decrease with increase of altitude, reflecting improved performance in higher altitudes as already reported in similar validation studies for the co-polar backscatter coefficient (Abril-Gago et al., 2022; Baars et al., 2021; Gkikas et al., 2023). In the 2.3–5.3 km range where the dust particles mostly resided during ASKOS (Marinou et al., 2023), slight underestimation of the (co-polar) Aeolus backscatter coefficient has been observed with systematic errors up to −0.31 Mm−1 sr−1 and random errors up to 0.67 Mm−1 sr−1. In the same heights, the particle extinction coefficient exhibited larger discrepancies from the eVe extinction profiles, which is reflected in the systematic and random errors per bin, due to the fact that the extinction retrieval is more susceptible to the noise in the Aeolus signals. The lidar ratio remains the noisiest product, with extreme error values per bin compounded in both systematic and random components. Moreover, looking the systematic and random errors per bin for the Aeolus co-polar particle backscatter and extinction coefficients, the discrepancies from the corresponding eVe profiles generally increase in lower altitudes where higher OOD and scattering ratio values are obtained, reflecting the higher atmospheric variability (e.g. PBL inhomogeneities) that is typically encountered in lower altitudes (i.e. <2.5 km), as well as the greater loads of aerosols and molecules at lower altitudes that lead to enhanced laser beam attenuation for Aeolus (i.e. higher noise levels). Additionally, the discrepancies related to increased atmospheric variability in the PBL are further amplified by the coarse horizontal resolution of the Aeolus L2A products provided in BRC level (∼ 90 km), which limits the instrument's ability to capture small-scale aerosol structures and gradients typically present in the lower troposphere and justifies our approach of selecting only the nearest eVe-Aeolus collocations per overpass for our analysis. The benefits of proving the Aeolus L2A profiles at a finer horizontal resolution (e.g. at ∼ 18 km from MLEsub products) are being discussed in Trapon et al. (2025).
Overall, the results underline the strengths of the optimal estimators (MLE and AEL–PRO) while the SCA algorithm could be further improved, particularly in the retrieval of the extinction and lidar ratio products. The MLE algorithm demonstrates consistent performance across metrics, reducing both systematic and random errors, closely followed by the AEL–PRO algorithm which performs well particularly for the extinction coefficient retrievals. For SCA, the mid-bin profiles outperform the corresponding normal-bin ones reflecting the reduction of the bias and noise levels in the L2A profiles when averaging the values from two consecutive height bins. The systematic errors in all algorithms are overshadowed by the random errors concluding that the discrepancies between eVe and Aeolus profiles are driven by the variability in atmospheric conditions and the inherent noise in Aeolus profiles, especially at lower altitudes where the aerosol layers mostly resided above Cabo Verde Islands during the ASKOS/JATAC operations. As such, we recommend the Aeolus L2A co-polar particle backscatter and particle extinction coefficients obtained from the optimal estimators (MLE and AEL–PRO) to be favored against SCA profiles when targeting for studies on the aerosol optical properties, while for studies focusing on the identification and vertical extent of aerosol layers the SCAmid-bin profiles could be also used due to the operational stability and simplicity of SCA approach. Importantly, our findings demonstrate that the Aeolus L2A aerosol products and particularly the co-polar particle backscatter coefficient can provide reliable information for aerosol characterization even in complex environments such as those dominated by mineral dust and dusty marine mixtures. Although the mission was originally designed for wind profiling, Aeolus contributes with valuable aerosol profiling data that could complement other satellite and ground-based observations, especially when used in synergy with other aerosol profiling oriented satellite missions such as of CALIPSO and EarthCARE. Nevertheless, when using the Aeolus L2A backscatter coefficient, especially in regions or cases where depolarizing particles are present, one should take into account the misdetection of the cross-polar component of the collected backscattered signal from Aeolus, and convert the retrieved (co-polar) particle backscatter coefficient to the total particle backscatter coefficient for their analysis. As such, these polarization sensitive limitations, together with the constraints imposed by the coarse horizontal resolution of the Aeolus L2A products, underscore the need for higher spatial resolution (both horizontal and vertical) and full-polarization detection capabilities in the follow-up mission of Aeolus-2 by EUMETSAT, to improve the accuracy and representativeness of aerosol retrievals in complex environments and in regions with small-scale aerosol structures and gradients (e.g. within the PBL).
Finally, while our study is geographically limited to the Cabo Verde region during the boreal summer dust season, the findings are likely applicable to other subtropical regions influenced by Saharan dust outflows and dusty marine mixtures. However, additional validation efforts across different aerosol regimes, such as biomass burning, urban pollution, or continental mixed layers, are necessary to fully assess the robustness and global applicability of the Aeolus L2A aerosol products.
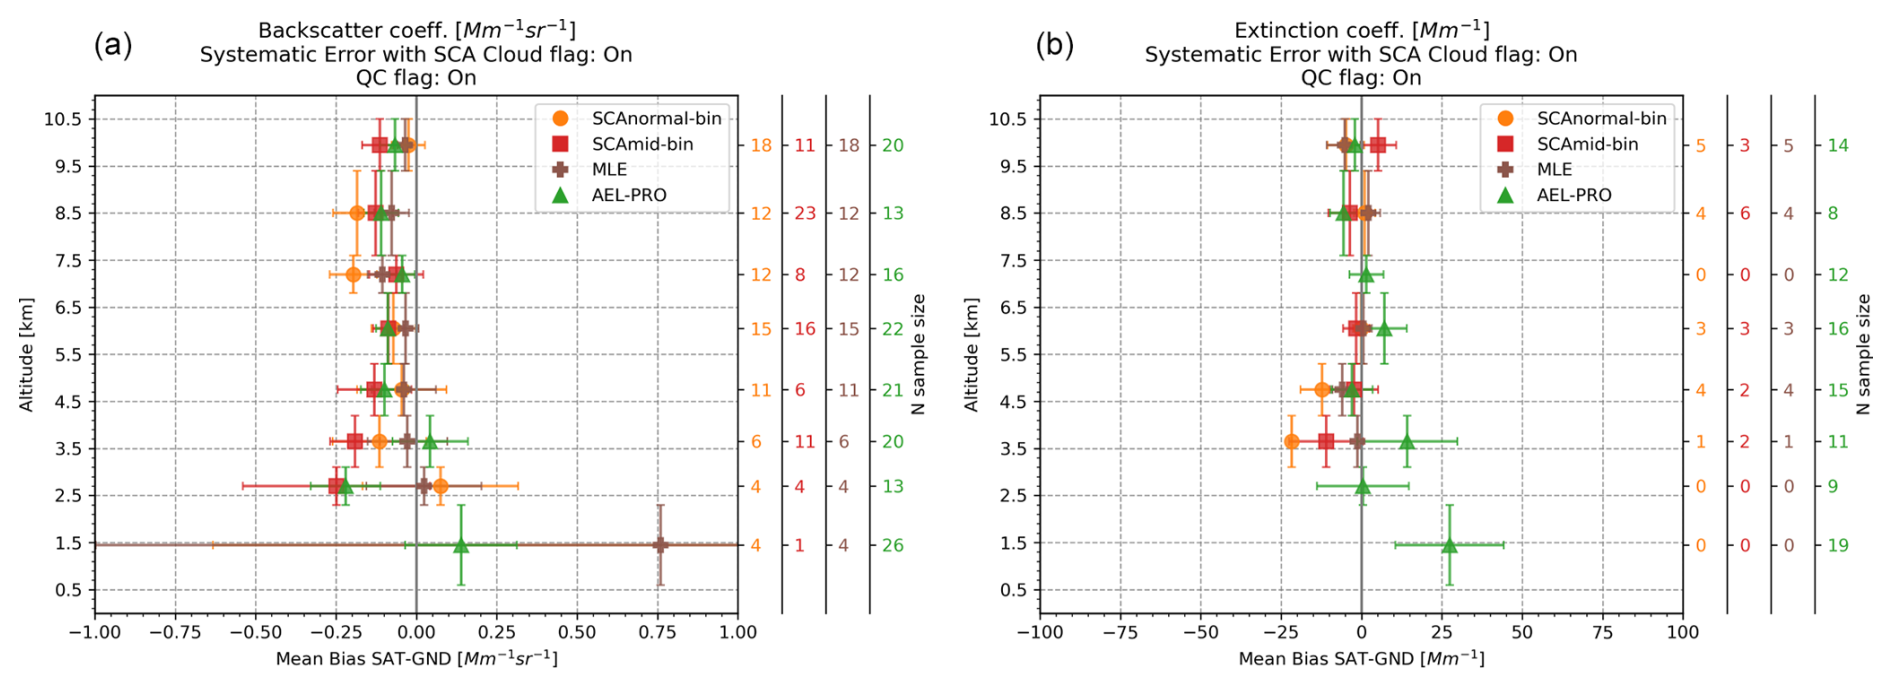
Figure A1The systematic errors from the statistical analysis of the biases into eight altitude classes for the Aeolus particle backscatter (a) and extinction (b) coefficients from the available algorithms (SCAnormal-bin in orange circles; SCAmid-bin in red squares; AEL–PRO in green triangles; MLE in brown crosses) while taking into account the quality assurance flag (QC flag). The QC flag is available only for the SCA and MLE retrievals. Similar to figures 5 and 6, the error bars in the horizontal axis correspond to the standard error of the mean (sem) for the mean bias and the error bars in the vertical axis correspond to the classes' boundaries (0.6, 2.3, 3.1, 4.2, 5.3, 6.8, 7.6, 9.4, 10.5 km). The secondary y-axis indicates the sample size N per class for each algorithm.
Table B1Systematic, random, and overall errors for the (co-polar) Aeolus particle backscatter coefficient from SCAnormal-bin (SCAnrm bin), SCAmid-bin (SCAmid bin), AEL–PRO, and MLE calculated from the statistical analysis of the biases (Aeolus – eVe) on eight altitude classes for the 14 eVe – Aeolus collocated measurements.
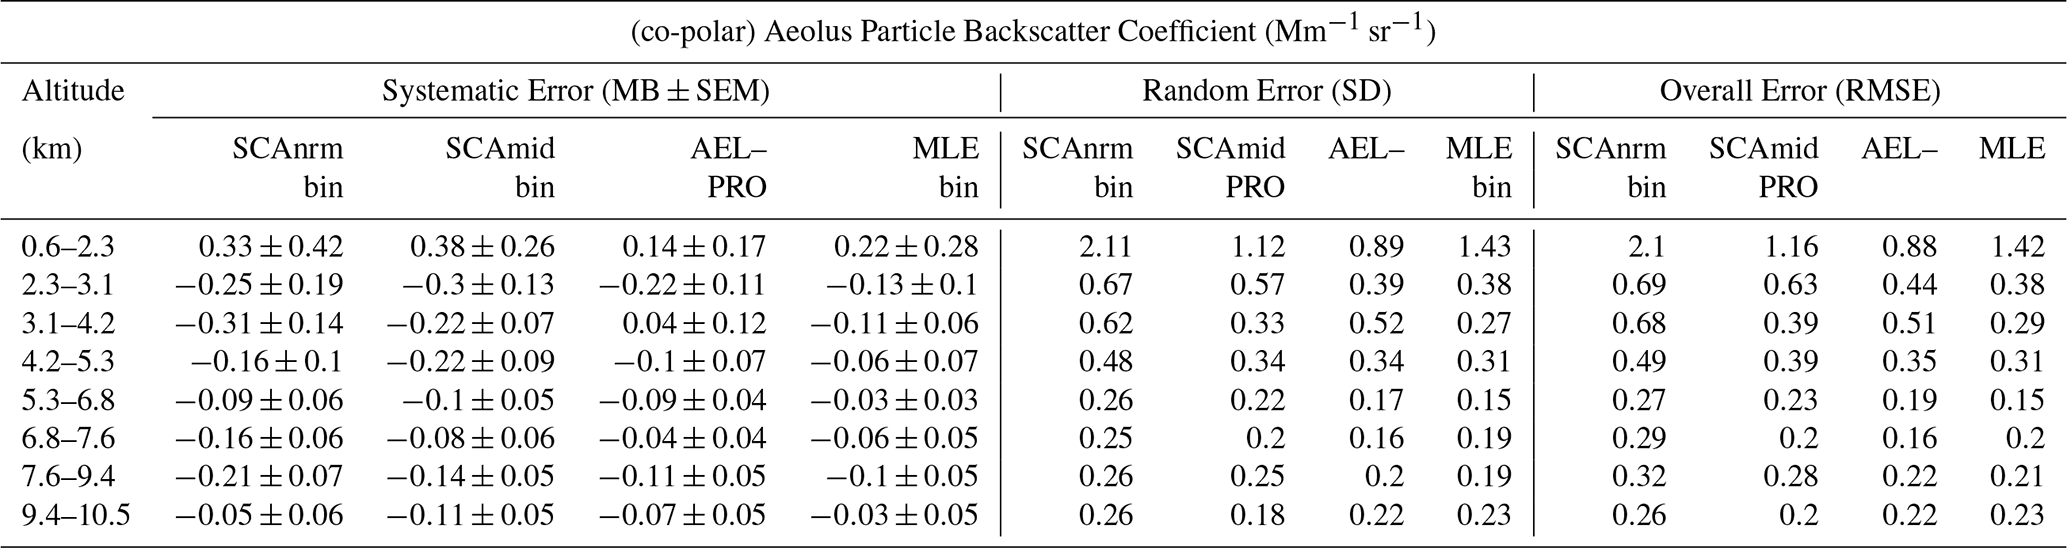
Table B2Systematic, random, and overall errors for the Aeolus particle extinction coefficient from SCAnormal-bin (SCAnrm bin), SCAmid-bin (SCAmid bin), AEL–PRO, and MLE calculated from the statistical analysis of the biases (Aeolus – eVe) on eight altitude classes for the 14 eVe – Aeolus collocated measurements.
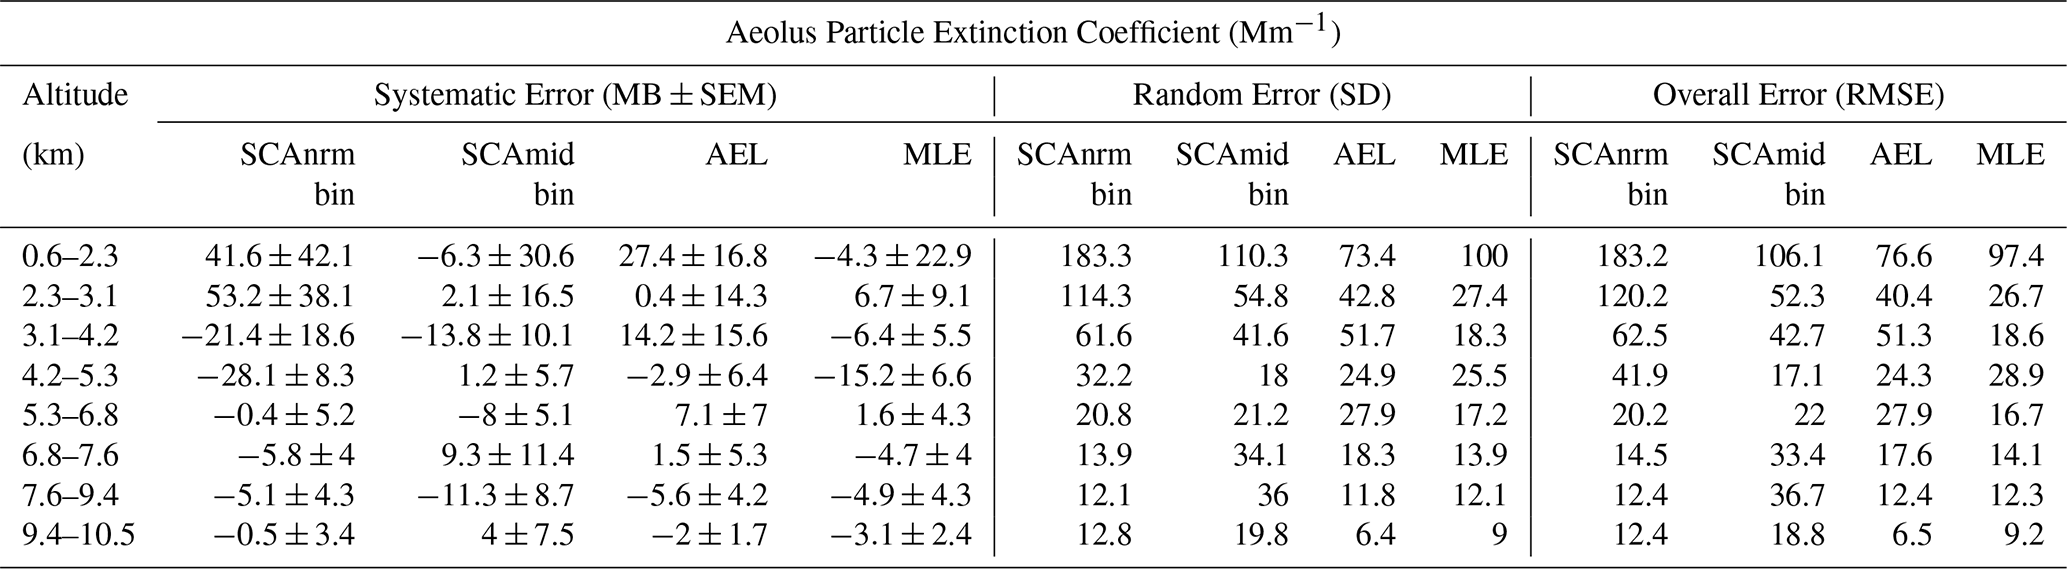
Table B3Systematic, random, and overall errors for the (co-polar) Aeolus particle lidar ratio calculated from SCAnormal-bin (SCAnrm bin), SCAmid-bin (SCAmid bin), AEL–PRO, and MLE from the statistical analysis of the biases (Aeolus – eVe) on eight altitude classes for the 14 eVe – Aeolus collocated measurements.
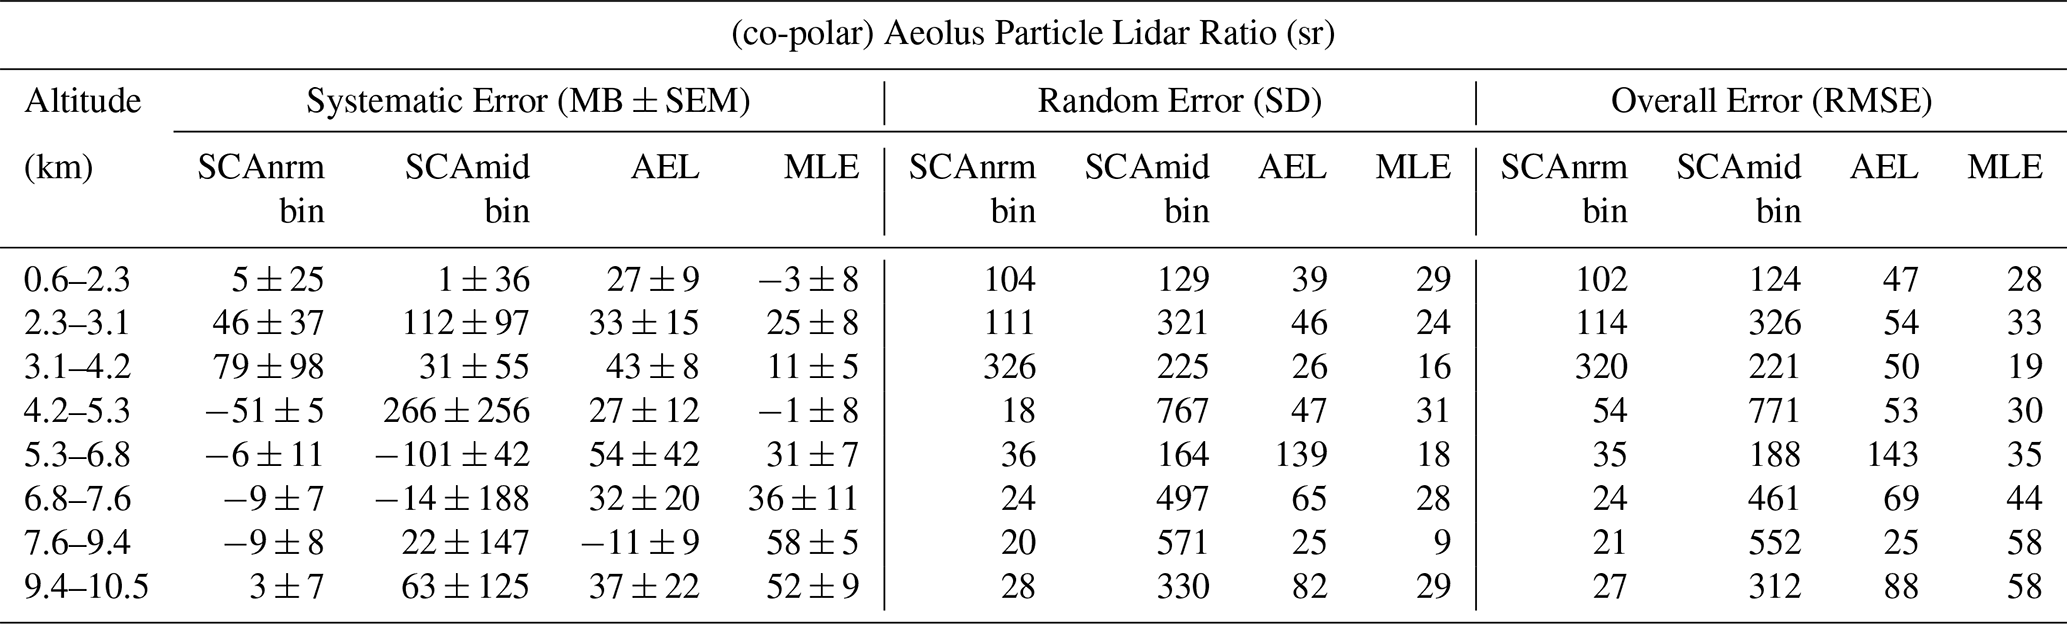
Table B4Systematic, random, and overall errors for the (co-polar) Aeolus particle backscatter coefficient calculated from SCAnormal-bin (SCAnrm bin), SCAmid-bin (SCAmid bin), AEL–PRO, and MLE from the statistical analysis of the biases (Aeolus – eVe) on six overlying optical depth classes for the 14 eVe – Aeolus collocated measurements.
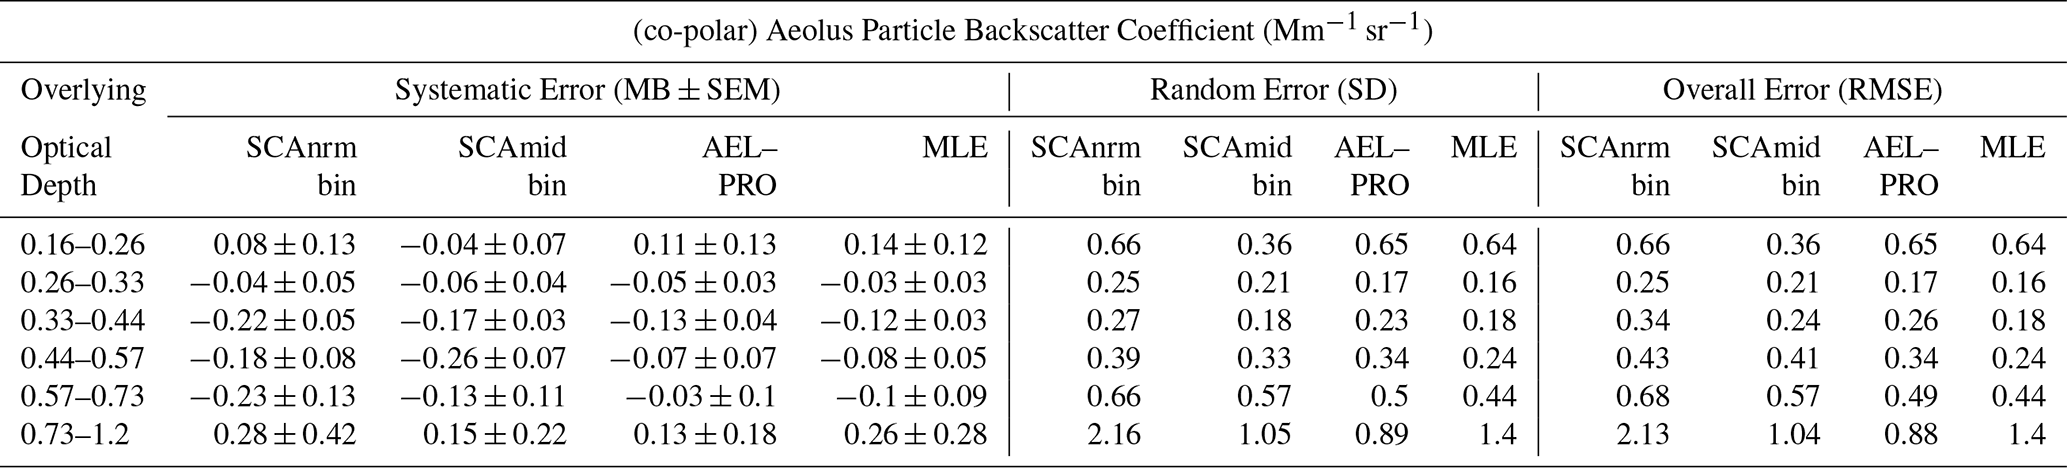
Table B5Systematic, random, and overall errors for the Aeolus particle extinction coefficient calculated from SCAnormal-bin (SCAnrm bin), SCAmid-bin (SCAmid bin), AEL–PRO, and MLE from the statistical analysis of the biases (Aeolus – eVe) on six overlying optical depth classes for the 14 eVe – Aeolus collocated measurements.
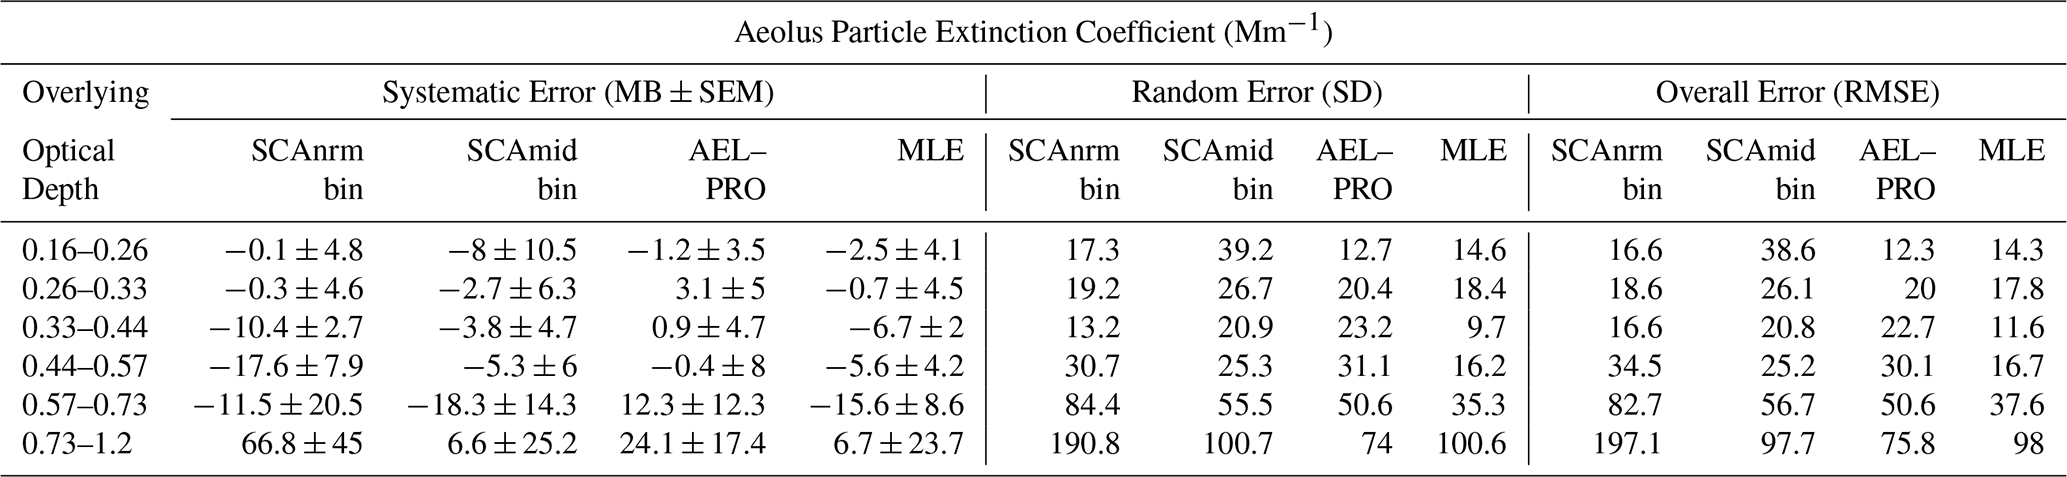
Table B6Systematic, random, and overall errors for the (co-polar) Aeolus particle lidar ratio calculated from SCAnormal-bin (SCAnrm bin), SCAmid-bin (SCAmid bin), AEL–PRO, and MLE from the statistical analysis of the biases (Aeolus – eVe) on six overlying optical depth classes for the 14 eVe – Aeolus collocated measurements.
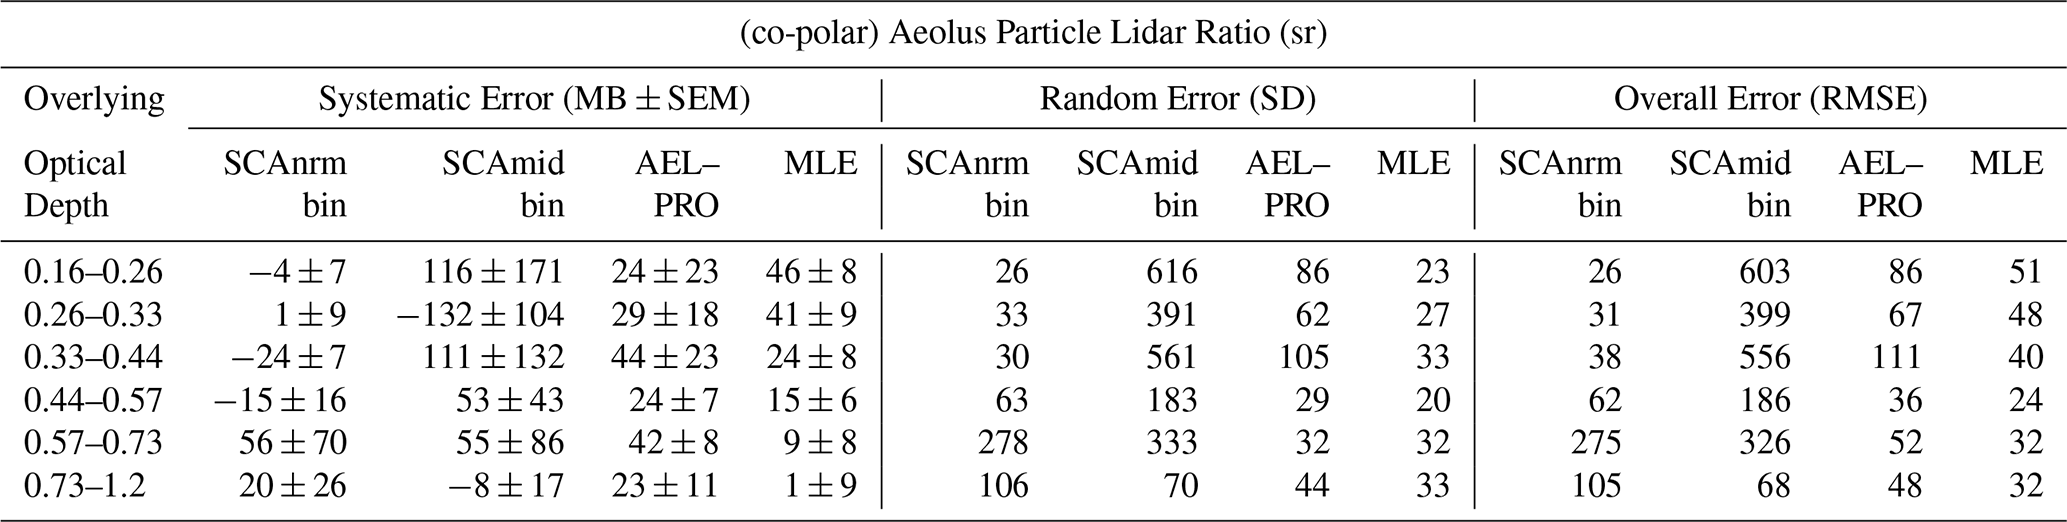
Table B7Systematic, random, and overall errors for the (co-polar) Aeolus particle backscatter coefficient calculated from SCAnormal-bin (SCAnrm bin), SCAmid-bin (SCAmid bin), AEL–PRO, and MLE from the statistical analysis of the biases (Aeolus – eVe) on four scattering ratio classes for the 14 eVe – Aeolus collocated measurements.
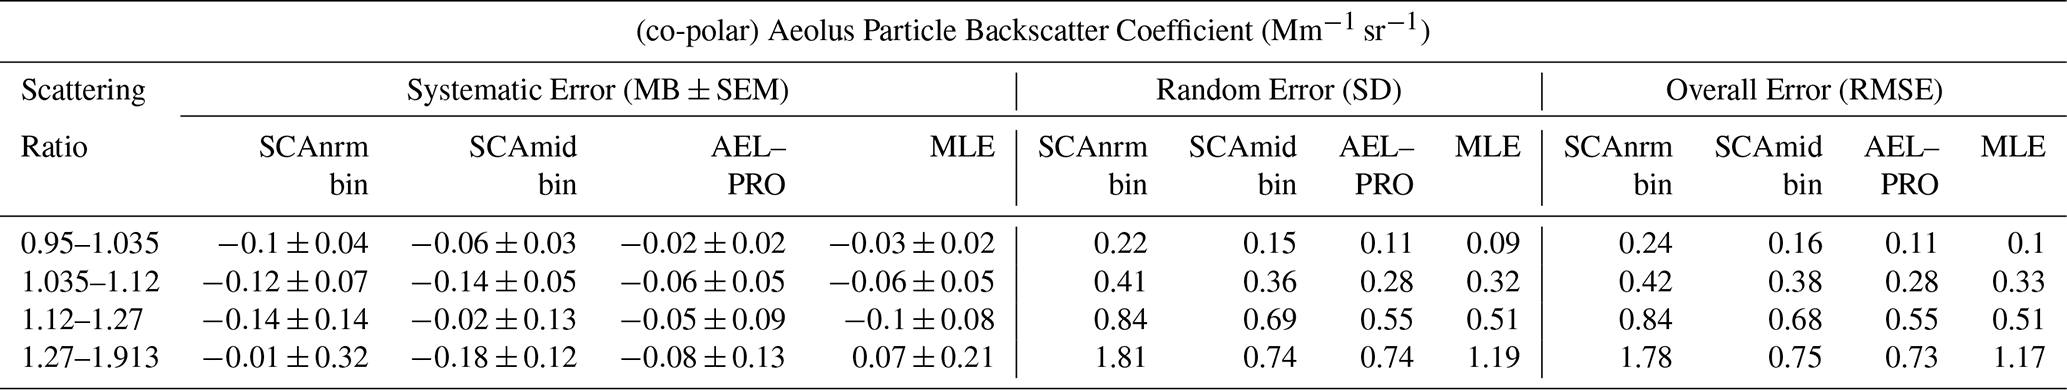
Table B8Systematic, random, and overall errors for the Aeolus particle extinction coefficient calculated from SCAnormal-bin (SCAnrm bin), SCAmid-bin (SCAmid bin), AEL–PRO, and MLE from the statistical analysis of the biases (Aeolus – eVe) on four scattering ratio classes for the 14 eVe – Aeolus collocated measurements.
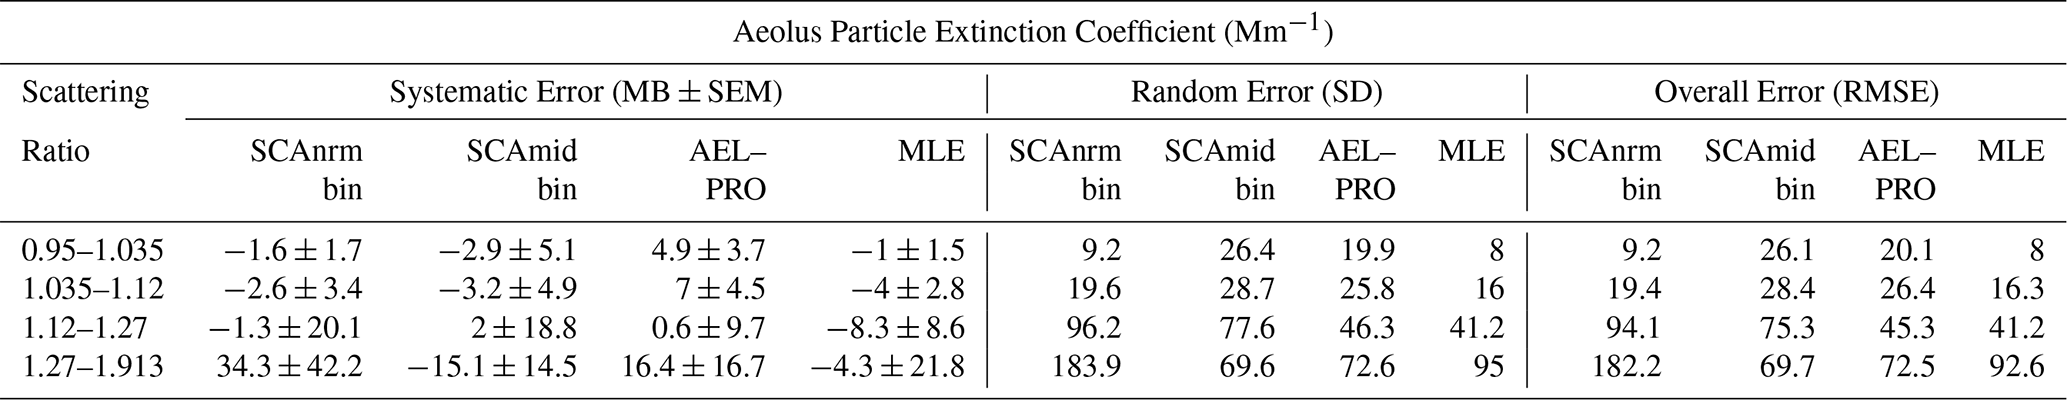
Table B9Systematic, random, and overall errors for the (co-polar) Aeolus particle lidar ratio calculated from SCAnormal-bin (SCAnrm bin), SCAmid-bin (SCAmid bin), AEL–PRO, and MLE from the statistical analysis of the biases (Aeolus – eVe) on four scattering ratio classes for the 14 eVe – Aeolus collocated measurements.
The software code used in this work is available upon request.
The reprocessed Aeolus L2A products with Baseline 16 are provided by the European Space Agency (ESA) Earth Explorer Program and are available from the online Aeolus Data Dissemination Facility (https://aeolus-ds.eo.esa.int/oads/access/collection/Level_2A_aerosol_cloud_optical_products_Reprocessed, ESA, last access: 15 January 2025). The eVe dataset is publicly available through the ASKOS repository in the EVDC data portal (https://evdc.esa.int/publications/askos-campaign-dataset/, Amiridis et al., 2023b).
PP and NS collected and analysed the eVe lidar measurements shown herein with the support of SMI, DTQ, DDFA, GG in the operation of the eVe lidar. PP performed the analysis of the acquired measurements for the validation exercise on the Aeolus L2A products and the manuscript preparation with the support of NS, EM, AG, KV. DPD provided support in the processing of the Aeolus L2A products obtained from the AEL-PRO algorithm. VA supervised and directed the whole project. All authors provided critical feedback and helped shape the research, analysis and manuscript.
At least one of the (co-)authors is a member of the editorial board of Atmospheric Measurement Techniques. The peer-review process was guided by an independent editor, and the authors also have no other competing interests to declare.
Publisher’s note: Copernicus Publications remains neutral with regard to jurisdictional claims made in the text, published maps, institutional affiliations, or any other geographical representation in this paper. While Copernicus Publications makes every effort to include appropriate place names, the final responsibility lies with the authors. Also, please note that this paper has not received English language copy-editing. Views expressed in the text are those of the authors and do not necessarily reflect the views of the publisher.
This article is part of the special issue “The Joint Aeolus Tropical Atlantic Campaign (JATAC) (AMT/ACP inter-journal SI)”. It is not associated with a conference.
The authors gratefully acknowledge the support of the Ocean Science Centre Mindelo, the ESA and the ASKOS/JATAC teams, which has been decisive in the success of the campaign. Peristera Paschou would like to thank Dimitri Trapon for his support on the processing of the Aeolus data.
This research study has been financially supported by the PANGEA4CalVal project (Grant Agreement 101079201) funded by the European Union; the ASKOS project funded by the European Space Agency (contract No. 4000131861/20/NL/IA); the Hellenic Foundation for Research and Innovation (Project Acronym: StratoFIRE, Project grant no. 3995); and the project “PANhellenic infrastructure for Atmospheric Composition and climatE change” (MIS 5021516), implemented under the Action “Reinforcement of the Research and Innovation Infrastructure”, funded by the Operational Programme “Competitiveness, Entrepreneurship and Innovation” (NSRF 2014-2020) and co-financed by Greece and the European Union (European Regional Development Fund).![]()
This paper was edited by Edward Nowottnick and reviewed by two anonymous referees.
Abril-Gago, J., Guerrero-Rascado, J. L., Costa, M. J., Bravo-Aranda, J. A., Sicard, M., Bermejo-Pantaleón, D., Bortoli, D., Granados-Muñoz, M. J., Rodríguez-Gómez, A., Muñoz-Porcar, C., Comerón, A., Ortiz-Amezcua, P., Salgueiro, V., Jiménez-Martín, M. M., and Alados-Arboledas, L.: Statistical validation of Aeolus L2A particle backscatter coefficient retrievals over ACTRIS/EARLINET stations on the Iberian Peninsula, Atmos. Chem. Phys., 22, 1425–1451, https://doi.org/10.5194/acp-22-1425-2022, 2022.
Abril-Gago, J., Ortiz-Amezcua, P., Bermejo-Pantaleón, D., Andújar-Maqueda, J., Bravo-Aranda, J. A., Granados-Muñoz, M. J., Navas-Guzmán, F., Alados-Arboledas, L., Foyo-Moreno, I., and Guerrero-Rascado, J. L.: Validation activities of Aeolus wind products on the southeastern Iberian Peninsula, Atmos. Chem. Phys., 23, 8453–8471, https://doi.org/10.5194/acp-23-8453-2023, 2023.
Amiridis, V., Kampouri, A., Gkikas, A., Misios, S., Gialitaki, A., Marinou, E., Rennie, M., Benedetti, A., Solomos, S., Zanis, P., Vasardani, O., Eleftheratos, K., Paschou, P., Georgiou, T., Scollo, S., Mona, L., Papagiannopoulos, N., Retscher, C., Parrinello, T., and Straume, A. G.: Aeolus winds impact on volcanic ash early warning systems for aviation, Sci. Rep., 13, 7531, https://doi.org/10.1038/s41598-023-34715-6, 2023a.
Amiridis, V., Marinou, E., Paschou, P., Baars, H., Pirloaga, R., Engelmann, R., Tsekeri, A., Daskalopoulou, V., Kazadzis, S., Skupin, A., Marenco, F., Kezoudi, M., Kouklaki, D., Siomos, N., Floutsi, A., Metallinos, S., Spanakis Misirlis, V., Raptis, P., Althausen, D., Seifert, P., Nemuc, A., Antonescu, B., Papetta, A., and Wandinger, U.: ASKOS Campaign Dataset, ESA Atmospheric Validation Data Centre [data set], https://doi.org/10.60621/jatac.campaign.2021.2022.caboverde, 2023b.
Ansmann, A., Wandinger, U., Le Rille, O., Lajas, D., and Straume, A. G.: Particle backscatter and extinction profiling with the spaceborne high-spectral-resolution Doppler lidar ALADIN: methodology and simulations, Appl. Opt., 46, 6606, https://doi.org/10.1364/AO.46.006606, 2007.
Baars, H., Herzog, A., Heese, B., Ohneiser, K., Hanbuch, K., Hofer, J., Yin, Z., Engelmann, R., and Wandinger, U.: Validation of Aeolus wind products above the Atlantic Ocean, Atmos. Meas. Tech., 13, 6007–6024, https://doi.org/10.5194/amt-13-6007-2020, 2020.
Baars, H., Radenz, M., Floutsi, A. A., Engelmann, R., Althausen, D., Heese, B., Ansmann, A., Flament, T., Dabas, A., Trapon, D., Reitebuch, O., Bley, S., and Wandinger, U.: Californian Wildfire Smoke Over Europe: A First Example of the Aerosol Observing Capabilities of Aeolus Compared to Ground-Based Lidar, Geophys. Res. Lett., 48, e2020GL092194, https://doi.org/10.1029/2020GL092194, 2021.
Borne, M., Knippertz, P., Weissmann, M., Witschas, B., Flamant, C., Rios-Berrios, R., and Veals, P.: Validation of Aeolus L2B products over the tropical Atlantic using radiosondes, Atmos. Meas. Tech., 17, 561–581, https://doi.org/10.5194/amt-17-561-2024, 2024.
Córdoba-Jabonero, C., Sicard, M., Barreto, Á., Toledano, C., López-Cayuela, M. Á., Gil-Díaz, C., García, O., Carvajal-Pérez, C. V., Comerón, A., Ramos, R., Muñoz-Porcar, C., and Rodríguez-Gómez, A.: Fresh volcanic aerosols injected in the atmosphere during the volcano eruptive activity at the Cumbre Vieja area (La Palma, Canary Islands): Temporal evolution and vertical impact, Atmos. Environ., 300, 119667, https://doi.org/10.1016/J.ATMOSENV.2023.119667, 2023.
Donovan, D. P., van Zadelhoff, G.-J., and Wang, P.: Aeolus/ALADIN Algorithm Theoretical Basis Document Level 2A products AEL-FM, AEL-PRO, 64 pp., https://www.aeolus.esa.int/confluence/spaces/CALVAL/pages/2621881/L2A+product+and+processor?preview=/2621881/94601239/Aeolus%20Level%202A%20Algorithm%20Theoretical%20Baseline%20Document%20%E2%80%93%20AEL-FM%20and%20AEL-PRO%20products.pdf (last access: 4 November 2024), 2024a.
Donovan, D. P., van Zadelhoff, G.-J., and Wang, P.: The EarthCARE lidar cloud and aerosol profile processor (A-PRO): the A-AER, A-EBD, A-TC, and A-ICE products, Atmos. Meas. Tech., 17, 5301–5340, https://doi.org/10.5194/amt-17-5301-2024, 2024b.
Ehlers, F., Flament, T., Dabas, A., Trapon, D., Lacour, A., Baars, H., and Straume-Lindner, A. G.: Optimization of Aeolus' aerosol optical properties by maximum-likelihood estimation, Atmos. Meas. Tech., 15, 185–203, https://doi.org/10.5194/amt-15-185-2022, 2022.
Ern, M., Diallo, M. A., Khordakova, D., Krisch, I., Preusse, P., Reitebuch, O., Ungermann, J., and Riese, M.: The quasi-biennial oscillation (QBO) and global-scale tropical waves in Aeolus wind observations, radiosonde data, and reanalyses, Atmos. Chem. Phys., 23, 9549–9583, https://doi.org/10.5194/acp-23-9549-2023, 2023.
ESA: ADM-Aeolus science report, https://esamultimedia.esa.int/docs/EarthObservation/SP-1311ADM-Aeolus_Final.pdf (last access: 17 December 2024), 2008.
European Space Agency (ESA): Aeolus Level 2A products reprocessed with Baseline 16, ESA [data set], https://aeolus-ds.eo.esa.int/oads/access/collection/Level_2A_aerosol_cloud_optical_products_Reprocessed, last access: 15 January 2025.
Fehr, T., McCarthy, W., Amiridis, V., Baars, H., von Bismarck, J., Borne, M., Chen, S., Flamant, C., Marenco, F., Knipperz, P., Koopman, R., Lemmerz, C. L., Marinou, E., Močnik, G., Parrinello, T., Piña, A., Reitebuch, O., Skofronick-Jackson, G., Zawislak, J., and Zenk, C.: The Joint Aeolus Tropical Atlantic Campaign 2021/2022 Overview- Atmospheric Science and Satellite Validation in the Tropics, EGU General Assembly 2023, Vienna, Austria, 23–28 April 2023, EGU23-7249, https://doi.org/10.5194/egusphere-egu23-7249, 2023.
Flamant, P., Cuesta, J., Denneulin, M.-L., Dabas, A., and Huber, D.: ADM-Aeolus retrieval algorithms for aerosol and cloud products, Tellus A, 60, 273–288, https://doi.org/10.1111/j.1600-0870.2007.00287.x, 2008.
Flamant, P., Lever, V., Martinet, P., Flament, T., Cuesta, J., Dabas, A., Olivier, M., Huber, D., Trapon, D., and Lacour, A.: AE-TN-IPSL-GS-001 v6.0: ADM-Aeolus L2A Algorithm Theoretical Baseline Document., 95 pp., https://earth.esa.int/eogateway/documents/20142/37627/Aeolus-L2A-Algorithm-Theoretical-Baseline-Document.pdf/73aac3e2-8812-565c-e787-9a31011d5b06 (last access: 22 October 2024), 2022.
Flament, T., Trapon, D., Lacour, A., Dabas, A., Ehlers, F., and Huber, D.: Aeolus L2A aerosol optical properties product: standard correct algorithm and Mie correct algorithm, Atmos. Meas. Tech., 14, 7851–7871, https://doi.org/10.5194/amt-14-7851-2021, 2021.
Gebauer, H., Floutsi, A. A., Haarig, M., Radenz, M., Engelmann, R., Althausen, D., Skupin, A., Ansmann, A., Zenk, C., and Baars, H.: Tropospheric sulfate from Cumbre Vieja (La Palma) observed over Cabo Verde contrasted with background conditions: a lidar case study of aerosol extinction, backscatter, depolarization and lidar ratio profiles at 355, 532 and 1064 nm, Atmos. Chem. Phys., 24, 5047–5067, https://doi.org/10.5194/acp-24-5047-2024, 2024.
Gkikas, A., Proestakis, E., Amiridis, V., Kazadzis, S., Di Tomaso, E., Tsekeri, A., Marinou, E., Hatzianastassiou, N., and Pérez García-Pando, C.: ModIs Dust AeroSol (MIDAS): a global fine-resolution dust optical depth data set, Atmos. Meas. Tech., 14, 309–334, https://doi.org/10.5194/amt-14-309-2021, 2021.
Gkikas, A., Gialitaki, A., Binietoglou, I., Marinou, E., Tsichla, M., Siomos, N., Paschou, P., Kampouri, A., Voudouri, K. A., Proestakis, E., Mylonaki, M., Papanikolaou, C.-A., Michailidis, K., Baars, H., Straume, A. G., Balis, D., Papayannis, A., Parrinello, T., and Amiridis, V.: First assessment of Aeolus Standard Correct Algorithm particle backscatter coefficient retrievals in the eastern Mediterranean, Atmos. Meas. Tech., 16, 1017–1042, https://doi.org/10.5194/amt-16-1017-2023, 2023.
Hagelin, S., Azad, R., Lindskog, M., Schyberg, H., and Körnich, H.: Evaluating the use of Aeolus satellite observations in the regional numerical weather prediction (NWP) model Harmonie–Arome, Atmos. Meas. Tech., 14, 5925–5938, https://doi.org/10.5194/amt-14-5925-2021, 2021.
Illingworth, A. J., Barker, H. W., Beljaars, A., Ceccaldi, M., Chepfer, H., Clerbaux, N., Cole, J., Delanoë, J., Domenech, C., Donovan, D. P., Fukuda, S., Hirakata, M., Hogan, R. J., Huenerbein, A., Kollias, P., Kubota, T., Nakajima, T., Nakajima, T. Y., Nishizawa, T., Ohno, Y., Okamoto, H., Oki, R., Sato, K., Satoh, M., Shephard, M. W., Velázquez-Blázquez, A., Wandinger, U., Wehr, T., and Van Zadelhoff, G. J.: The EarthCARE Satellite: The Next Step Forward in Global Measurements of Clouds, Aerosols, Precipitation, and Radiation, Bull. Am. Meteorol. Soc., 96, 1311–1332, https://doi.org/10.1175/BAMS-D-12-00227.1, 2015.
Imaki, M., Takegoshi, Y., and Kobayashi, T.: Ultraviolet High-Spectral-Resolution Lidar with Fabry–Perot Filter for Accurate Measurement of Extinction and Lidar Ratio, Jpn. J. Appl. Phys., 44, 3063–3067, https://doi.org/10.1143/JJAP.44.3063, 2005.
Kanitz, T., Lochard, J., Marshall, J., McGoldrick, P., Lecrenier, O., Bravetti, P., Reitebuch, O., Rennie, M., Wernham, D., and Elfving, A.: Aeolus first light: first glimpse, Proceedings Volume 11180, International Conference on Space Optics – ICSO 2018, https://doi.org/10.1117/12.2535982, 2019.
Kiriakidis, P., Gkikas, A., Papangelis, G., Christoudias, T., Kushta, J., Proestakis, E., Kampouri, A., Marinou, E., Drakaki, E., Benedetti, A., Rennie, M., Retscher, C., Straume, A. G., Dandocsi, A., Sciare, J., and Amiridis, V.: The impact of using assimilated Aeolus wind data on regional WRF-Chem dust simulations, Atmos. Chem. Phys., 23, 4391–4417, https://doi.org/10.5194/acp-23-4391-2023, 2023.
Liu, H., Garrett, K., Ide, K., Hoffman, R. N., and Lukens, K. E.: A statistically optimal analysis of systematic differences between Aeolus horizontal line-of-sight winds and NOAA's Global Forecast System, Atmos. Meas. Tech., 15, 3925–3940, https://doi.org/10.5194/amt-15-3925-2022, 2022.
Lolli, S., Delaval, A., Loth, C., Garnier, A., and Flamant, P. H.: 0.355-micrometer direct detection wind lidar under testing during a field campaign in consideration of ESA's ADM-Aeolus mission, Atmos. Meas. Tech., 6, 3349–3358, https://doi.org/10.5194/amt-6-3349-2013, 2013.
Lux, O., Lemmerz, C., Weiler, F., Marksteiner, U., Witschas, B., Rahm, S., Geiß, A., Schäfler, A., and Reitebuch, O.: Retrieval improvements for the ALADIN Airborne Demonstrator in support of the Aeolus wind product validation, Atmos. Meas. Tech., 15, 1303–1331, https://doi.org/10.5194/amt-15-1303-2022, 2022.
Marinou, E., Paschou, P., Tsikoudi, I., Tsekeri, A., Daskalopoulou, V., Kouklaki, D., Siomos, N., Spanakis-Misirlis, V., Voudouri, K. A., Georgiou, T., Drakaki, E., Kampouri, A., Papachristopoulou, K., Mavropoulou, I., Mallios, S., Proestakis, E., Gkikas, A., Koutsoupi, I., Raptis, I. P., Kazadzis, S., Baars, H., Floutsi, A., Pirloaga, R., Nemuc, A., Marenco, F., Kezoudi, M., Papetta, A., Močnik, G., Díez, J. Y., Ryder, C. L., Ratcliffe, N., Kandler, K., Sudharaj, A., and Amiridis, V.: An Overview of the ASKOS Campaign in Cabo Verde, Environ. Sci. Proc., 26, 200, https://doi.org/10.3390/ENVIRONSCIPROC2023026200, 2023.
Martin, A., Weissmann, M., Reitebuch, O., Rennie, M., Geiß, A., and Cress, A.: Validation of Aeolus winds using radiosonde observations and numerical weather prediction model equivalents, Atmos. Meas. Tech., 14, 2167–2183, https://doi.org/10.5194/amt-14-2167-2021, 2021.
Martin, A., Weissmann, M., and Cress, A.: Investigation of links between dynamical scenarios and particularly high impact of Aeolus on numerical weather prediction (NWP) forecasts, Weather Clim. Dynam., 4, 249–264, https://doi.org/10.5194/wcd-4-249-2023, 2023.
Paschou, P., Siomos, N., Tsekeri, A., Louridas, A., Georgoussis, G., Freudenthaler, V., Binietoglou, I., Tsaknakis, G., Tavernarakis, A., Evangelatos, C., von Bismarck, J., Kanitz, T., Meleti, C., Marinou, E., and Amiridis, V.: The eVe reference polarisation lidar system for the calibration and validation of the Aeolus L2A product, Atmos. Meas. Tech., 15, 2299–2323, https://doi.org/10.5194/amt-15-2299-2022, 2022.
Paschou, P., Siomos, N., Marinou, E., Idrissa, S. M., Quaye, D. T., Attannon, D. D. F., Meleti, C., Bismarck, J. von, Fehr, T., and Amiridis, V.: eVe Lidar Measurements during the ASKOS/JATAC Campaign, Environ. Sci. Proc., 26, 168, https://doi.org/10.3390/ENVIRONSCIPROC2023026168, 2023.
Press, W. H., Teukolsky, S. a, Vetterling, W. T., and Flannery, B. P.: Numerical Recipes 3rd Edition: The Art of Scientific Computing, Sample page from Numberical recipes C, Cambridge University Press40 W. 20 St. New York, NY, United States, 1, 1262, ISBN 978-0-521-88068-8, 2007.
Rani, S. I., Jangid, B. P., Kumar, S., Bushair, M. T., Sharma, P., George, J. P., George, G., and Das Gupta, M.: Assessing the quality of novel Aeolus winds for NWP applications at NCMRWF, Q. J. R. Meteorol. Soc., 148, 1344–1367, https://doi.org/10.1002/QJ.4264, 2022.
Ratynski, M., Khaykin, S., Hauchecorne, A., Wing, R., Cammas, J.-P., Hello, Y., and Keckhut, P.: Validation of Aeolus wind profiles using ground-based lidar and radiosonde observations at Réunion island and the Observatoire de Haute-Provence, Atmos. Meas. Tech., 16, 997–1016, https://doi.org/10.5194/amt-16-997-2023, 2023.
Reitebuch, O.: The Spaceborne Wind Lidar Mission ADM-Aeolus, edited by: Schumann, U., Springer Berlin Heidelberg, Berlin, Heidelberg, 815–827, https://doi.org/10.1007/978-3-642-30183-4_49, 2012.
Reitebuch, O., Lemmerz, C., Lux, O., Marksteiner, U., Rahm, S., Weiler, F., Witschas, B., Meringer, M., Schmidt, K., Huber, D., Nikolaus, I., Geiss, A., Vaughan, M., Dabas, A., Flament, T., Stieglitz, H., Isaksen, L., Rennie, M., de Kloe, J., Marseille, G.-J., Stoffelen, A., Wernham, D., Kanitz, T., Straume, A.-G., Fehr, T., von Bismarck, J., Floberghagen, R., and Parrinello, T.: Initial Assessment of the Performance of the First Wind Lidar in Space on Aeolus, EPJ Web Conf., 237, 01010, https://doi.org/10.1051/epjconf/202023701010, 2020.
Rennie, M., Tan, D., Andersson, E., Poli, P., Dabas, A., De Kloe, J., Marseille, G.-J., and Stoffelen, A.: Aeolus Level-2B algorithm theoretical basis document (mathematical description of the Aeolus Level-2B processor), 12–23 pp., https://earth.esa.int/documents/d/earth-online/aeolus_l2b_algorithm_tbd-pdf (last access: 22 October 2024), 2020.
Rennie, M. P., Isaksen, L., Weiler, F., de Kloe, J., Kanitz, T., and Reitebuch, O.: The impact of Aeolus wind retrievals on ECMWF global weather forecasts, Q. J. R. Meteorol. Soc., 147, https://doi.org/10.1002/qj.4142, 2021.
Shipley, S. T., Tracy, D. H., Eloranta, E. W., Trauger, J. T., Sroga, J. T., Roesler, F. L., and Weinman, J. A.: High spectral resolution lidar to measure optical scattering properties of atmospheric aerosols 1: Theory and instrumentation, Appl. Opt., 22, 3716, https://doi.org/10.1364/AO.22.003716, 1983.
Tan, D. G. H., Andersson, E., Fisher, M., and Isaksen, L.: Observing-system impact assessment using a data assimilation ensemble technique: Application to the ADM – Aeolus wind profiling mission, Q. J. R. Meteorol. Soc., 133, https://doi.org/10.1002/qj.43, 2007.
Tan, D. G. H., Andersson, E., Kloe, J. De, Marseille, G.-J., Stoffelen, A., Poli, P., Denneulin, M.-L., Dabas, A., Huber, D., Reitebuch, O., Flamant, P., Rille, O. Le, and Nett, H.: The ADM-Aeolus wind retrieval algorithms, Tellus A Dyn. Meteorol. Oceanogr., 60, 191–205, https://doi.org/10.1111/j.1600-0870.2007.00285.x, 2008.
Trapon, D., Baars, H., Floutsi, A. A., Bley, S., Haarig, M., Lacour, A., Flament, T., Dabas, A., Nehrir, A. R., Ehlers, F., and Huber, D.: Cross-validations of the Aeolus aerosol products and new developments with airborne high-spectral-resolution lidar measurements above the tropical Atlantic during JATAC, Atmos. Meas. Tech., 18, 3873–3896, https://doi.org/10.5194/amt-18-3873-2025, 2025.
Walther, B. A. and Moore, J. L.: The concepts of bias, precision and accuracy, and their use in testing the performance of species richness estimators, with a literature review of estimator performance, Ecography (Cop.)., 28, 815–829, https://doi.org/10.1111/J.2005.0906-7590.04112.X, 2005.
Wang, P., Donovan, D. P., van Zadelhoff, G.-J., de Kloe, J., Huber, D., and Reissig, K.: Evaluation of Aeolus feature mask and particle extinction coefficient profile products using CALIPSO data, Atmos. Meas. Tech., 17, 5935–5955, https://doi.org/10.5194/amt-17-5935-2024, 2024.
Wehr, T., Kubota, T., Tzeremes, G., Wallace, K., Nakatsuka, H., Ohno, Y., Koopman, R., Rusli, S., Kikuchi, M., Eisinger, M., Tanaka, T., Taga, M., Deghaye, P., Tomita, E., and Bernaerts, D.: The EarthCARE mission – science and system overview, Atmos. Meas. Tech., 16, 3581–3608, https://doi.org/10.5194/amt-16-3581-2023, 2023.
Weissmann, M. and Cardinali, C.: Impact of airborne Doppler lidar observations on ECMWF forecasts, Q. J. R. Meteorol. Soc., 133, https://doi.org/10.1002/qj.16, 2007.
Winker, D. M., Pelon, J., Coakley, J. A., Ackerman, S. A., Charlson, R. J., Colarco, P. R., Flamant, P., Fu, Q., Hoff, R. M., Kittaka, C., Kubar, T. L., Le Treut, H., McCormick, M. P., Mégie, G., Poole, L., Powell, K., Trepte, K., Vaughan, M. A., and Wielicki, B. A.: The Calipso Mission: A Global 3D View of Aerosols and Clouds, Bull. Am. Meteorol. Soc., https://doi.org/10.1175/2010BAMS3009.1, 2010.
Witschas, B., Lemmerz, C., Geiß, A., Lux, O., Marksteiner, U., Rahm, S., Reitebuch, O., and Weiler, F.: First validation of Aeolus wind observations by airborne Doppler wind lidar measurements, Atmos. Meas. Tech., 13, 2381–2396, https://doi.org/10.5194/amt-13-2381-2020, 2020.
Witschas, B., Lemmerz, C., Geiß, A., Lux, O., Marksteiner, U., Rahm, S., Reitebuch, O., Schäfler, A., and Weiler, F.: Validation of the Aeolus L2B wind product with airborne wind lidar measurements in the polar North Atlantic region and in the tropics, Atmos. Meas. Tech., 15, 7049–7070, https://doi.org/10.5194/amt-15-7049-2022, 2022.
Yorks, J. E., McGill, M. J., Scott, V. S., Wake, S. W., Kupchock, A., Hlavka, D. L., Hart, W. D., and Selmer, P. A.: The Airborne Cloud–Aerosol Transport System: Overview and Description of the Instrument and Retrieval Algorithms, J. Atmos. Ocean. Technol., 31, 2482–2497, https://doi.org/10.1175/JTECH-D-14-00044.1, 2014.
van Zadelhoff, G.-J., Donovan, D. P., and Wang, P.: Detection of aerosol and cloud features for the EarthCARE atmospheric lidar (ATLID): the ATLID FeatureMask (A-FM) product, Atmos. Meas. Tech., 16, 3631–3651, https://doi.org/10.5194/amt-16-3631-2023, 2023.
Zhu, C., Byrd, R. H., Lu, P., and Nocedal, J.: Algorithm 778: L-BFGS-B: Fortran Subroutines for Large-Scale Bound-Constrained Optimization, ACM Trans. Math. Softw., 23, 550–560, https://doi.org/10.1145/279232.279236 , 1997.
Zuo, H., Hasager, C. B., Karagali, I., Stoffelen, A., Marseille, G.-J., and de Kloe, J.: Evaluation of Aeolus L2B wind product with wind profiling radar measurements and numerical weather prediction model equivalents over Australia, Atmos. Meas. Tech., 15, 4107–4124, https://doi.org/10.5194/amt-15-4107-2022, 2022.
The satellite Aeolus reentered from space on the 28 July 2023 but the mission continues to be funded until end 2028 with the objective to improve the products with new evolutions and better quality
- Abstract
- Introduction
- Datasets and campaign
- Results
- Discussion and Conclusions
- Appendix A: Systematic Errors for the Aeolus (co-polar) backscatter and extinction coefficients with SCA cloud mask and Quality Status flags
- Appendix B: Summarizing tables for the systematic, random, and overall errors for the Aeolus L2A using eVe profiles as reference
- Code availability
- Data availability
- Author contributions
- Competing interests
- Disclaimer
- Special issue statement
- Acknowledgements
- Financial support
- Review statement
- References