the Creative Commons Attribution 4.0 License.
the Creative Commons Attribution 4.0 License.
 | 01 Oct 2025
Intercomparison of IAGOS-CORE, IAGOS-CARIBIC and WMO/GAW-WCCOS Ozone Instruments at the Environmental Simulation Facility at Jülich, Germany
Torben Galle
Romain Blot
Florian Obersteiner
Philippe Nédélec
Andreas Zahn
Jean-Marc Cousin
Ulrich Bundke
Andreas Petzold
Valerie Thouret
Hannah Clark
As part of the Quality Assurance (QA) plan of the In-service Aircraft for a Global Observation System (IAGOS), IAGOS-CORE and IAGOS-CARIBIC UV-photometer instruments have been compared with the dual-beam UV- Ozone (O3) PhotoMeter (OPM) of the World Calibration Center of Ozone Sondes (WCCOS) at the Forschungszentrum Jülich in an environmental simulation chamber. The WCCOS is established since about 30 years ago as part of the WMO-GAW measurement quality program of the global ozonesonde network, in which the OPM instrument serves as the ozone reference standard. In the simulation chamber, pressure, temperature, and ozone concentration can be controlled at quasi-realistic flight conditions between the Earth surface (∼ 1000 hPa) and ∼ 35 km altitude (5 hPa). During the intercomparison, different ascent/descent and cruise altitude profiles of ozone, pressure and temperature have been simulated between the surface and ∼ 12.5 km altitude (200 hPa).
In general, the two O3 instruments P1-O3 (IAGOS-CORE) and CAR-O3 (IAGOS-CARIBIC) showed good agreement with the OPM reference standard within 5 %–6 %. At a pressure of 400–500 hPa the agreement was even within 2 %. The observed differences are small but systematic and reproducible during this experiment. CAR-O3 showed a small, pressure-independent deviation of −2 ± 1.5 % compared to the OPM. P1-O3 revealed O3 deviation to the OPM which changes with pressure of about +2 % at 1000 hPa to −3 % at 400 hPa, which might be an artefact on the experimental set-up and subject for further investigations. This intercomparison is a first step of the long-term goal to make the global ozone sonde data (GAW-NDACC-SHADOZ-GRUAN) and IAGOS-O3 (CORE: P1-O3, CARIBIC: CAR-O3) data traceable to one common reference, the OPM instrument of WCCOS. Recommendations are made for further regular (every two to three years) intercomparison of the operational instruments to ensure external consistency in general and specifically towards the synergy of IAGOS-O3 and ozonesonde data. An important gap in such intercomparison studies is the lack of a reference ozone instrument operated at reduced pressures at any National Metrological Institute in the world. For observation networks measuring vertical ozone profiles, it is essential to close this gap to enable the traceability of ozone measurements from different platforms to one reference standard. This is crucial to harmonize long-term ozone records to detect any changes of ozone in the free atmosphere.
- Article
(5778 KB) - Full-text XML
-
Supplement
(2742 KB) - BibTeX
- EndNote


Ozone (O3) is both chemically and radiatively one of the most important trace gases in the atmosphere. It forms the stratospheric ozone layer shielding the Earth's surface from harmful UV sunlight (WMO/UNEP, 2023) and is the major precursor of the hydroxyl radical (OH), the principal chemical detergent controlling the oxidation capacity (e.g. Thompson, 1992) and air quality in the troposphere (e.g. Cooper et al., 2014). Tropospheric ozone is also a potent natural and anthropogenically influenced greenhouse gas (IPCC, 2023). Monitoring the vertical ozone distribution on a regional as well as a global scale is essential for understanding long-term changes in both tropospheric and stratospheric ozone, as each may be affected by changes in the dynamics or chemistry of the atmosphere.
Besides the traditional balloon borne ozonesonde network (Smit et al., 2021) to sample tropospheric ozone, in the 1990's new ozone measuring platforms started their routine operations such as Lidar (e.g. McDermid et al., 1991; Ancellet and Ravetta, 1998), FTIR (e.g. Schneider et al., 2005; Vigouroux et al., 2008) and the in-service aircraft programs of MOZAIC (Measurement of OZone and water vapor by Airbus In-service airCraft) (Marenco et al., 1998) and CARIBIC (Civil Aircraft for the Regular Investigation of the atmosphere based on an Instrumented Container) (Brenninkmeijer et al., 1999). Both in-service aircraft programs have been joined since 2011 into the IAGOS (In-service Aircraft in a Global Observing System) long-term monitoring programme (https://www.iagos.org, last access: 20 September 2025; Petzold et al., 2015) as part of the European Research Infrastructure for global observations of atmospheric composition (Petzold et al., 2024). During normal scheduled flight operation, IAGOS measures in situ ozone mixing ratios at cruise altitude (10–12.5 km) and provides vertical profiles of ozone from the surface to cruise altitude during take-off and landing. Since August 1994 over more than 70 000 flights are archived in the IAGOS-database (https://iagos.aeris-data.fr, last access: 20 September 2025). The data are widely used for climatological and trends analysis (e.g. Petetin et al., 2016; Cohen et al., 2018; Gaudel et al., 2020; Wang et al., 2022; Van Malderen et al., 2025) as well as for model evaluations (e.g. Hu et al., 2017; Wagner et al., 2021).
Crucial for such long-term observations is to prove and monitor their long-term stability as well as the traceability of the instruments to a reference instrument on a regular basis. This can be done by checking the flown instruments on their internal and external consistency. The internal consistency of the IAGOS ozone instruments and their long-term measurements have been evaluated by Blot et al. (2021) and regular procedures have been developed to ensure the internal consistency over time. External consistency checks have been done in the past through in-flight comparison with ozonesonde measurements within a certain coincidence of space and time (Thouret et al., 1998; Staufer et al., 2013, 2014; Tanimoto et al., 2015; Tarasick et al., 2019; Wang et al., 2024). Over more than 25 years of observations, good agreement (within 5 %–10 %) has been achieved between the observing platforms, although ozonesondes tend to consistently measure about 5 % more than the aircraft instruments do.
In this study, the external consistency of the IAGOS (CORE and CARIBIC) ozone UV photometer instruments has been investigated through intercomparison with the ozone photometer (OPM) of the World Calibration Centre of Ozone Sondes (WCCOS, https://www.wccos-josie.org/en, last access: 20 September 2025) at the Forschungszentrum Jülich (FZJ) at their environmental simulation facility to calibrate airborne ozone and water vapor sensors. The WCCOS is established as part of the WMO-GAW measurement quality assurance plan of the global ozonesonde network, whereby the OPM instrument serves as the ozone reference instrument. In the GAW-WCCOS simulation chamber, pressure, temperature, and ozone concentration can be controlled to produce quasi-realistic atmospheric conditions between 1000 hPa (surface) and 5 hPa (upper stratosphere) (Smit et al., 2000). The IAGOS-CORE O3 instrument (here called “P1-O3”) is part of the so-called IAGOS-CORE package P1 that is approved as EASA certified aeronautical equipment. Several Package P1 units are operated on commercial Airbus A340 and A330 aircraft (in 2024: 14 P1-units on 10 different aircraft of 8 international airlines). O3 volume mixing ratio (VMR) measurements are performed for every flight from take-off to landing, including cruise legs at about 180–250 hPa. The tested CARIBIC instrument (here called “CAR-O3”) is part of the CARIBIC container laboratory and flown since 2010 on board an Airbus A340 by Lufthansa (Brenninkmeijer et al., 2007). This intercomparison is a first step of the long-term goal to get the global ozone sonde data (GAW-NDACC-SHADOZ-GRUAN) and IAGOS-O3 (CORE: P1-O3 & CARIBIC: CAR-O3) data traceable to one common reference (i.e. OPM of WCCOS).
The key objective of the intercomparison is to investigate the performance of the three ozone UV-photometer instruments (OPM, P1-O3, CAR-O3) under controlled laboratory conditions in the ESC, thereby, simulating typical flight conditions of atmospheric pressure, temperature and ozone concentration between the surface and cruise altitude (Z = 10–12.5 km). During the intercomparison different ascent/descent and cruise altitude profiles of ozone have been simulated. This paper presents and discusses the major results of the observed performance of the different instruments in quantitative terms. An outlook will be given on how to have ozone measurements of IAGOS and ozonesondes both traceable to one common ozone reference instrument, i.e. the OPM of the WCCOS chamber.
2.1 Ozone UV-Photometer Instruments of IAGOS and WCCOS
The principle of the three UV-ozone photometer instruments involved in the intercomparison is based on the spectroscopic UV-absorption measurement of ozone at a wavelength around 254 nm at a well-defined sample path length according to Beer-Lambert absorption law:
where I0 (= zero mode) and It (= sample mode) are the lamp intensities at the detector when the absorption cell contains the sampled gas with and without removal of the ozone, respectively. L is the length of the absorption cell, is the molecular absorption cross section of ozone at a wavelength of about 254 nm, and is the average concentration of ozone in the absorption cell. Since L and are well known quantities, and the transmittance of the absorption cell is determined by the ratio of the two observed signal intensities of the photo detectors in sample and zero mode, respectively, then the ozone concentration can be derived (Eq. 1). Through additional measurement of the pressure PC and temperature TC inside the absorption cell the volume mixing ratio of ozone can be derived from .
where k is the Boltzmann constant.
All instruments use the same widely applied UV-absorption cross section ( = (1147 ± 0.024) × 10−17 cm2 molec.−1) determined by Hearn (1961). In 2025 a new cross section ( = (11 329 ± 0.0035) × 10−17 cm2 molec.−1: CCQM.O3.2019 (https://www.bipm.org/en/gas-metrology/ozone, last access: 20 September 2025), by Hodges et al., (2019) will be introduced in the global ozone ground-based monitoring networks (CCQM-GAWG, 2024) which is about 1.29 % lower, however, this will have no impact on the results of the present intercomparison.
Table 1Specifications of the P1-O3, CAR-O3 and OPM ozone UV-photometer instruments participating in the intercomparison. n/a: not applicable.
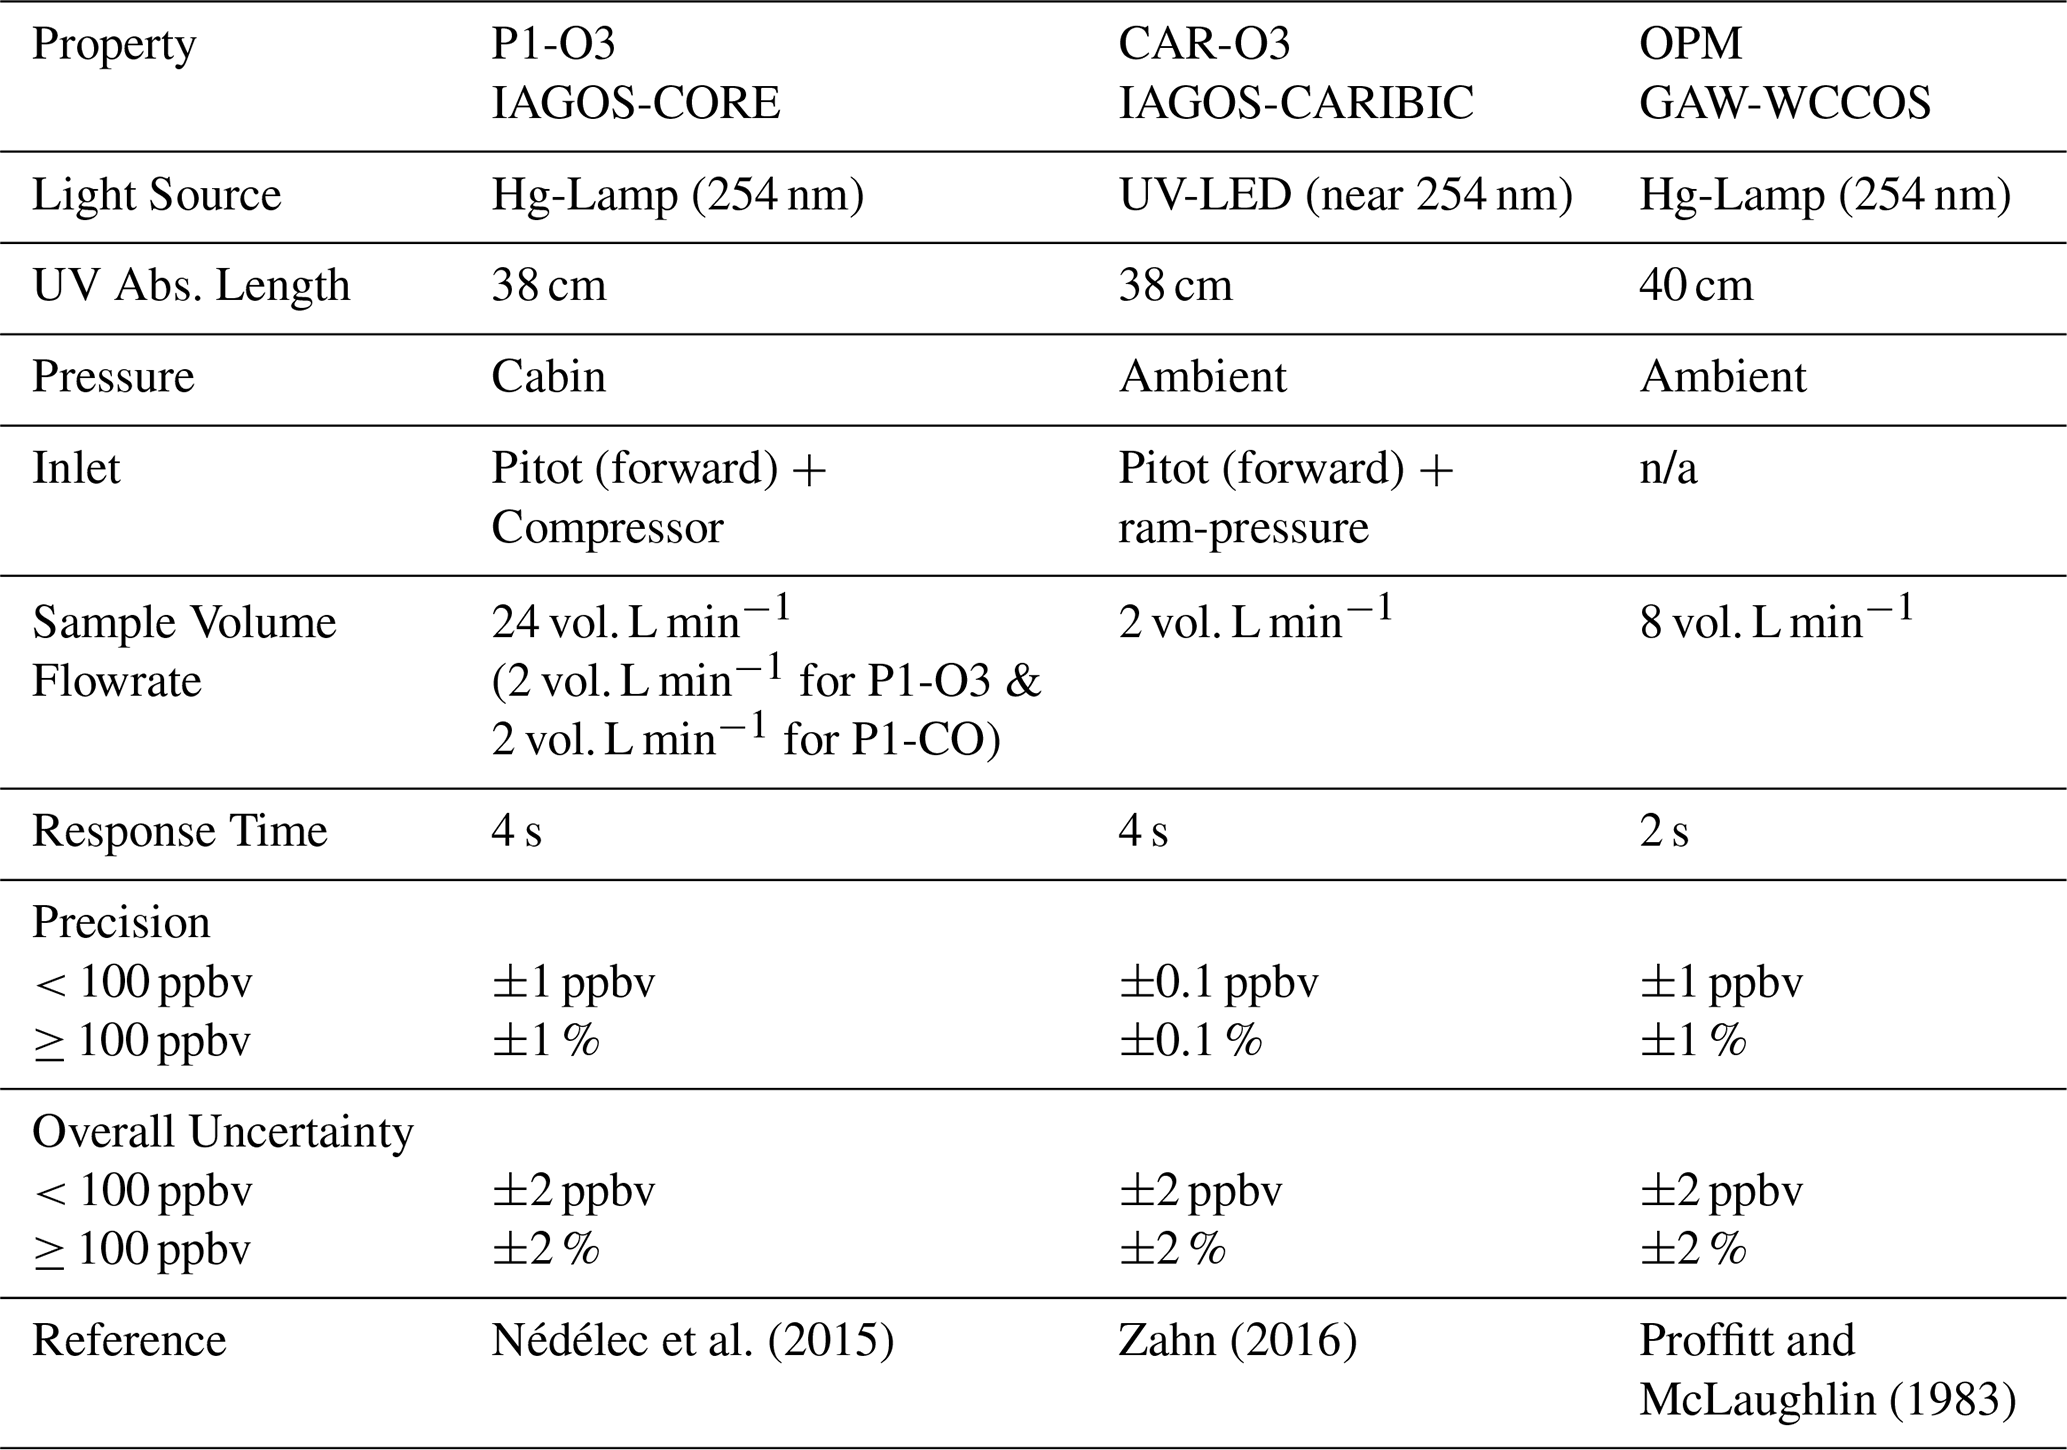
All three ozone instruments are dual-beam UV-photometers that have two identical UV-absorption cells, each alternating between reference mode (ozone-free air generated by directing it through an ozone scrubber being CuO/MnO2) and sample mode. A valve assembly alternates the scrubbed air between the two cells, such that one cell is in null mode while the other cell is in sample mode or vice versa. The mode alternation compensates for changes in the light transmission through the absorption cells (e.g. due to temperature driven mechanical changes or changes of the reflectivity of the cells due to changing surface coatings) and finally doubles the measurement frequency. Although the principle of operation is similar for all three photometer types, the instrumental layouts have significant differences. Specifications of the P1-O3, CAR-O3 and OPM ozone UV-photometer instruments participating in the intercomparison are summarised in Table 1. In general, the overall instrumental relative uncertainty is predominantly determined by the uncertainty of the molecular absorption cross section of ozone. For in situ measurements, sampling uncertainty must be considered. This uncertainty depends on the design of the air sampling (use of pump in inlet line or not), the use of proper material (e.g. PTFE) to avoid ozone losses at the walls, and the thermal concept and the electronic design. Therefore, regular pre- and post-flight tests and characterization of the instruments are essential.
2.1.1 GAW-WCCOS Ozone Photometer (OPM)
The dual-beam UV-absorption ozone photometer (OPM) of the WCCOS serves as the reference instrument. It was developed by Proffitt and McLaughlin (1983) for use on stratospheric balloons. A low-pressure Hg-lamp serves as a UV light source. The overall uncertainty is ±2 % at P = 1000–10 hPa. The instrument serves as reference (standard) of the GAW global ozonesonde network. The OPM is enclosed in a Styrofoam box, mounted inside a cylindrical vacuum tank which is connected to the simulation chamber and thus operates at the same pressure level as inside the simulation chamber. Details of the instrument and the data processing, including uncertainty budget are described in Proffitt and McLaughlin (1983).
No ozone reference instrument running at reduced pressures exists at any NMI (National Metrological Institute) in the world. This means that before and after the intercomparison, the OPM could only be compared at laboratory pressure conditions (1000 hPa) with a commercial, NIST-traceable “surface” ozone UV photometer of Thermo Electron Instruments (Model TEI-49) at volume mixing ratios between 0 and 200 ppbv. The agreement was within ±1 ppbv below 100 ppbv and ±1 % above. No systematic bias was observed. Validation of the performance of the OPM at reduced pressures could only be done based on the evaluation of the measured physical parameters of the OPM as described in Proffitt and McLaughlin (1983).
2.1.2 IAGOS-CORE Ozone Instrument (P1-O3)
The ozone monitor P1-O3 in IAGOS-CORE is a modified Thermo Scientific (Model 49i) dual beam UV-photometer integrated together with a CO-infrared monitor in a special aeronautic flight box (Nédélec et al., 2015). The P1-O3 monitor measures ozone at cabin air pressure conditions. Hereby, one UV-absorption cell is in measuring-mode and the second cell is in zero-mode. In zero mode the ozone is removed from the sampled air by an ozone scrubber (MnO2-catalyst filter) before the air sample enters the cell that is in zero-mode. Alternating, every 4 s (3 s for air flushing the cells and 1s for the measurement), the cells are switched from sample into zero-mode and vice versa. The pressure and temperature in the absorption cells are measured to derive the ozone volume mixing ratio from the measured amount of light absorbed by ozone using Beer's absorption law. Similar as in the OPM a low-pressure Hg-discharge lamp serves as UV-light source.
During flight, ambient air is sampled through a forward-facing pitot tube and compressed to cabin air pressure by the pump (Thomas 118ZC20/24) located in the Pump Box and then fed into the manifold at the inlet of P1-O3, dividing the total airflow into the nominal sample flow of 4 vol. L min−1 for the O3 and CO monitors and an excess flow, respectively. Thereby, the excess air flow is continuously monitored to ensure that the minimum required volume-flow of Pump Box (25 vol. L min−1 at ground, 5 vol. L min−1 at cruise altitude) is obtained. To prevent ozone losses due to physical and chemical interactions on the walls of the sampling lines, the pitot inlet tube and the interior of the pumps of the Pump Box are coated with PTFE and all tubing are made of PTFE too.
Before and after aircraft operation (or each ∼ 6 months, respectively), each P1-O3-instrument is checked (without the Pump Box) against a Thermo Scientific model 49PS reference instrument at several concentration levels to evaluate the instrument is responding linearly to ozone within 1 %. In addition, each P1-O3 instrument is sent once a year to the French Laboratoire National d'Essais (LNE) for comparison with an instrument with measurements traceable to the National Institute of Standards and Technology (NIST). The overall uncertainty is better than ±2 ppbv for O3 < 100 ppbv and ±2 % for O3 ≥ 100 ppbv (Nédélec et al., 2015).
Each flown P1-Package (P1-O3 plus Pump Box) for IAGOS-CORE is compared before and after flight periods with the same MOZAIC-aircraft system that is used to check the performance of the flown packages since the beginning of the program (Marenco et al., 1998). Therefore, it is possible to remove systematic biases in the long-term time series and the resulting measurement uncertainty should represent only the contribution from random errors (Blot et al., 2021). More details of Package IAGOS-P1 (Pump Box and P1-O3 instrument) and its operation are given by Nédélec et al. (2015) and Blot et al. (2021).
2.1.3 IAGOS-CARIBIC Ozone Instrument (CAR-O3)
The IAGOS-CARIBIC (CAR-O3) UV-photometer ozone instrument is fully custom-made and likewise applies a dual beam configuration. In zero-mode the ozone is removed using a MnO2-scrubber controlled at 38 °C for maximum efficiency of 100 %. Two three-way valves toggle each 4 s to guide sample air and zero air alternatively between the two absorption cells. Each measurement takes 2 s and is preceded by flushing the cells for 2 s.
In contrast to commercial ozone monitors, the instrument uses a UV-LED (Seti, TUD59H1B) as a light source (see Sect. 2.1 of Zahn, 2016). The LED light is guided into the two sample cells (to ∼ 47 % each) using a beam-splitter. The remaining 6 % is measured by the opposing reference diode to actively control the LED (further stabilized at 20 °C using a Peltier-element) to constant light emission with an uncertainty of ∼ 10−4 (which is not possible with the conventionally used low-pressure Hg discharge lamps). However, since the UV-LED emission spectrum has a full-width half-mean (FWHM) of ∼ 11 nm and may age, it is regularly (about every 3 months) calibrated against a reference UV photometer using a low-pressure Hg discharge lamp as UV light source and applying the UV absorption cross section of Hearn (1961).
Two photodiodes (Hamamatsu S1226) at the end of the cells measure the UV light intensity using a two-channel (not multiplexing) 24-bit sigma-delta amplifier. Temperature is measured on the outside and the inside of the cells. Pressure is measured directly at the exhaust of the cells. Sample flow during aircraft operation of CAR-O3 is determined by the ram-pressure through the CARIBIC inlet system. This guarantees a minimum flow of 1.5 vol. L min−1 at cruise altitude. During the experiments reported here (without the ram-pressure on aircraft), a flow of ∼ 2 vol. L min−1 was enforced by a pump downstream of the instrument in combination with a needle valve for manual control of the flow. The main specifications are listed in Table 1. Further details of handling and data processing are described in Zahn (2016) as well as Obersteiner (2024, https://doi.org/10.5281/zenodo.11104076).
The measured precision (1σ) is 0.06 ppb at 1000 hPa and the response time of 4s. A simple calculation based on the photon flux reaching the photodiodes (inferred from its photosensitivity and the measured photo current) and the detected photo current noise indicate that this precision exactly agrees (to within 10 %–15 %) with the measured shot noise, that is, CAR-O3 is quantum-noise limited and higher precision can only be reached with a stronger UV-LED or a longer absorption path length.
The total uncertainty of 2 ppb or 2 % (whatever is higher) is dominated by the uncertainty of the O3 cross section around 255 nm (Zahn, 2016). After the initial calibration the CAR-O3 instrument is regularly (typically each 3–4 months) compared in the laboratory with a reference photometer and once a year with a 2.7 m long-path UV photometer (by UMEG).
2.2 Environmental Simulation Facility: GAW-WCCOS
2.2.1 GAW-WCCOS Simulation Chamber
The GAW-WCCOS simulation chamber established at the Forschungszentrum Jülich (FZJ) is designed to investigate the performance of different types of balloon-borne ozone sensors as well as airborne humidity sensors to measure the vertical distribution of atmospheric ozone and water vapor, respectively (Smit et al., 2000). The key component of the facility is a simulation chamber with a test room volume of about 500 L (80 × 80 × 80 cm) whose pressure as well as temperature can be dynamically regulated between 5 and 1000 hPa and between 200 and 300 K at temperature rates between −2 and +5 K min−1. The volume mixing ratio of ozone can be dynamically regulated between 5 and 10 000 ppbv to simulate typical atmospheric ozone levels between the surface and 35 km altitude. Since 1994, the facility has been established as the World Calibration Centre for Ozone Sondes (WCCOS) as part of the QA/QC-management plan of the Global Atmosphere Watch (GAW) program of the World Meteorological Organization (WMO). In the scope of this framework since 1996, international JOSIE (Jülich Ozone Sonde Intercomparison Experiment) campaigns have been conducted to assess the performance of the major types of ozone sondes used within the global network of ozone sounding stations (Smit et al., 2007, 2024; Thompson et al., 2019). The dual beam UV-photometer OPM (Sect. 2.1.1) serves thereby as an ozone reference. The entire simulation process is automated by computer control to guarantee reproducible ambient conditions. JOSIE observations have demonstrated that the experimental set-up of the WCCOS simulation chamber experiment has a reproducibility of about ±1 %. Details of the facility and its use as WCCOS are given by Smit et al. (2000).
2.2.2 Ozone Profile Simulator (OPS)
The Ozone Profile Simulator (OPS) unit of GAW-WCCOS (Smit et al., 2000) is used to simulate reproducible pressure dependent ozone profiles dynamically in time. Therefore, a separate gas mixing system is installed to supply equivalent air samples to up to five ozone sensors plus the UV-photometer (OPM) with pre-set ozone concentrations. Ozone is photolytically generated by UV-irradiation in a zero-grade airflow through a quartz glass (Suprasil) cuvette using a low-pressure Hg-discharge lamp. Via the photodissociation of oxygen molecules at a wavelength of 185 nm, ozone is produced at high levels of 0.1 %–0.2 % in a constant flow of 50 cm3 min−1 through the quartz glass cuvette (pressurized at 4000 hPa, volume: ∼ 40 cm3). To vary the ozone volume mixing ratio between 10 and 10 000 ppbv at different air pressures, the high-ozone airflow is dynamically diluted by a two-staged mixing with zero-grade air flows. All air flows are regulated by mass-flow controllers (Smit et al., 2000). The air used is dried and purified such that any sensitivities of the UV-Photometers to humidity or sudden changes of it (Wilson and Birks, 2006) can be excluded. The sample flow is connected to a glass manifold inside the simulation chamber to feed the different O3-instruments, whereby excess air can flow via an exhaust, such that the inlet tubes of all connected instruments are at the same pressure condition as inside the WCCOS-chamber.
2.3 Experimental Design Intercomparison
2.3.1 Experimental Setup
The schematic of the experimental setup is shown in Fig. 1. Ozone-containing air is produced in the OPS and fed into a gas manifold located inside the simulation chamber. The inlet tubes of the three ozone instruments are connected to the manifold via gas-feed through (all made of PTFE). CAR-O3 uses a 2 m tube (ID = 4 mm), while the P1-O3 the inlet line goes via the P1-Pump Box that compresses the sample air to cabin or (here) laboratory pressure before entering the P1-O3 instrument. The OPM, mounted in a vacuum tank connected to the simulation chamber, is at the same pressure condition as inside the chamber.
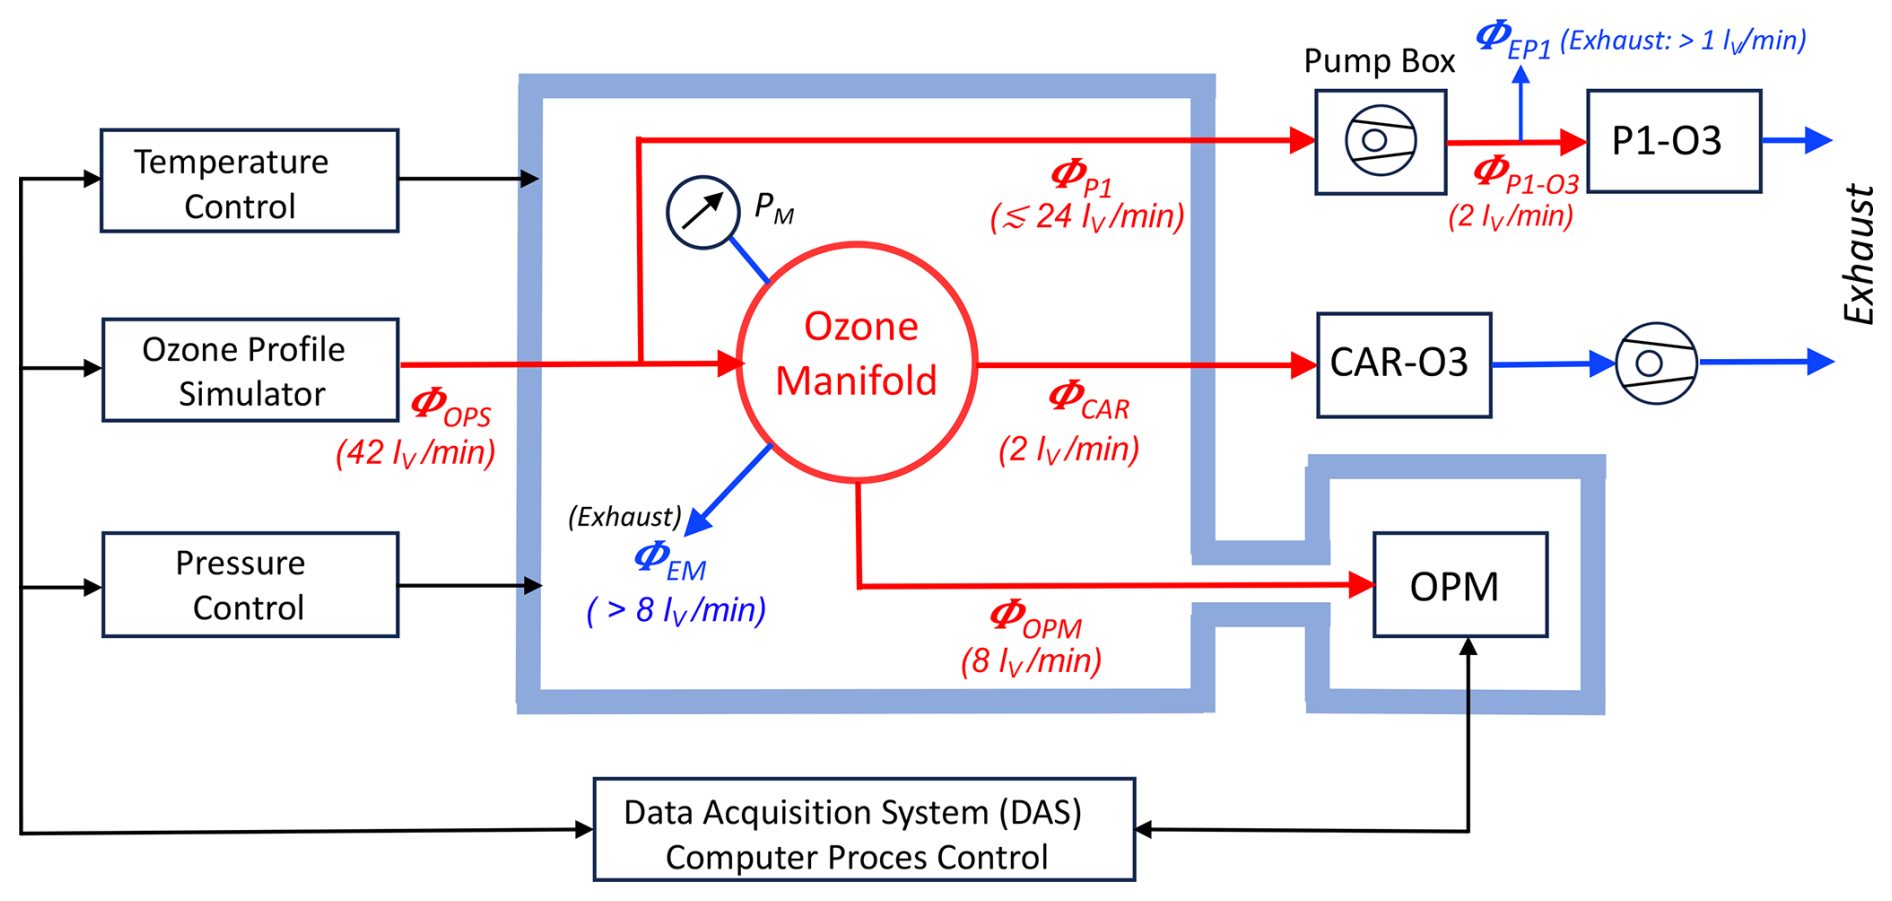
Figure 1Schematics of the experimental setup for the intercomparison at the WCCOS, showing the ESC with OPM of the WCCOS, the connection to the IAGOS-CORE and IAGOS-CARIBIC ozone instruments, the ozone manifold located inside the simulation chamber and its control systems, including the computer-controlled DAS.
The sample manifold consists of a spherical glass vessel with a volume of about 150 cm3 with radially arranged connections to the individual ozone instruments with the inlet of the simulated ozone air flow ΦOPS being in the centre of the manifold. Excess air is exhausted via an additional tube such that the manifold is kept to the sample volume pressure (measured by a pressure sensor) and to prevent the inlet lines of the ozone instruments from overpressure effects that may cause measurement artefacts.
For the JOSIE experiments (for testing ozone sondes), the volume flow rate of the simulated ozone air flow ΦOPS is kept constant at 12 vol. L min−1 which is sufficient to provide four ozone sondes (maximum 4 × 0.25 vol. L min−1) and the OPM (maximum 8 vol. L min−1). For the IAGOS-ozone intercomparison higher flow rates were required, sufficient to supply all instruments (see Sample Volume Flowrate in Table 1). The total volume flow rate is at least 36 vol. L min−1. To ensure a significant exhaust flow at the manifold, we thus increased the typical volume flow of 12 vol. L min−1 by an additional 30 vol. L min−1 flow controller to obtain a total volume flow ΦOPS of 42 vol. L min−1 and thus an exhaust flow of the manifold of 6 vol. L min−1 (Fig. 1). The pressure PM inside the manifold was monitored to ensure to keep it a few hPa higher than the pressure in the simulation chamber itself to avoid any leakage effects of air from the chamber into the manifold. The P1-O3 sample flow we had to branch off from the ozone profile simulator flow before entering the manifold (Fig. 1), because it was shown that the high sampling volume rate of P1-O3 pump box would otherwise cause leakage effects when P1-O3 was directly connected with a Teflon fitting at the inlet glass tube of the manifold.
2.3.2 Simulation of Realistic Flight Conditions
It is essential to operate the chamber at appropriate pressure conditions to simulate realistic flight conditions that the IAGOS instruments experience when connected to the air inlets. Both air-sample inlets (of IAGOS-CORE and IAGOS-CARIBIC) are facing forwards and thus use the dynamic (ram) air pressure generated by the high speed of the aircraft. On IAGOS-CARIBIC a special inlet configuration hinders (aerosol and cloud) particles larger than ∼ 2 µm to enter the sampling line. At the maximum cruise altitude of about 12.5 km, the lowest static air pressure is 180 hPa at a typical aircraft speed of Mach = 0.81 ± 0.02 causing an adiabatic compression factor of about 1.6. In an ideal case, this leads to a dynamic rem air pressure of about 100 hPa. However, in practice some pressure losses of about 30 hPa have to be considered, such that the lowest total air pressure inside the inlets is about 250 hPa. Note, however, as P1-O3 runs a pump to compress sampled air to cabin pressure (here laboratory pressure) before entering P1-O3 instrument, the pressure ranges of P1-O3 and CAR-O3 covered by our tests are different, but for both instruments span the relevant pressure ranges between surface and cruise altitude.
- a.
IAGOS-CORE = P1-O3
The P1-Pump Box supplied with sample air from the forward-facing inlet system compresses the sampled air to cabin air pressure. The cabin air pressure is prescribed by civil aviation regulations to be above 750 hPa and usually ranges at 800–850 hPa at cruising altitude. In-flight, the maximum pressure difference between cabin and the inlet of P1-PU thus is 850–250 = 600 hPa. For the present laboratory intercomparison we thus must cover the pressure range between 1000 and 400 hPa (= 1000–600 hPa). - b.
IAGOS-CARIBIC = CAR-O3
The CAR-O3 instrument does not use a pump, and its inlet pressure is the ambient static pressure, plus the ram-pressure minus some pressure loss in the sampling line (see above), that is, 250 hPa at maximum cruise altitude. To simulate the ram-pressure effect (exhaust at 180 hPa), during this laboratory intercomparison the CAR-O3 instrument does not use a pump at the exhaust to force an air flow of about 2 vol. L min−1 (Fig. 1).
3.1 Introduction
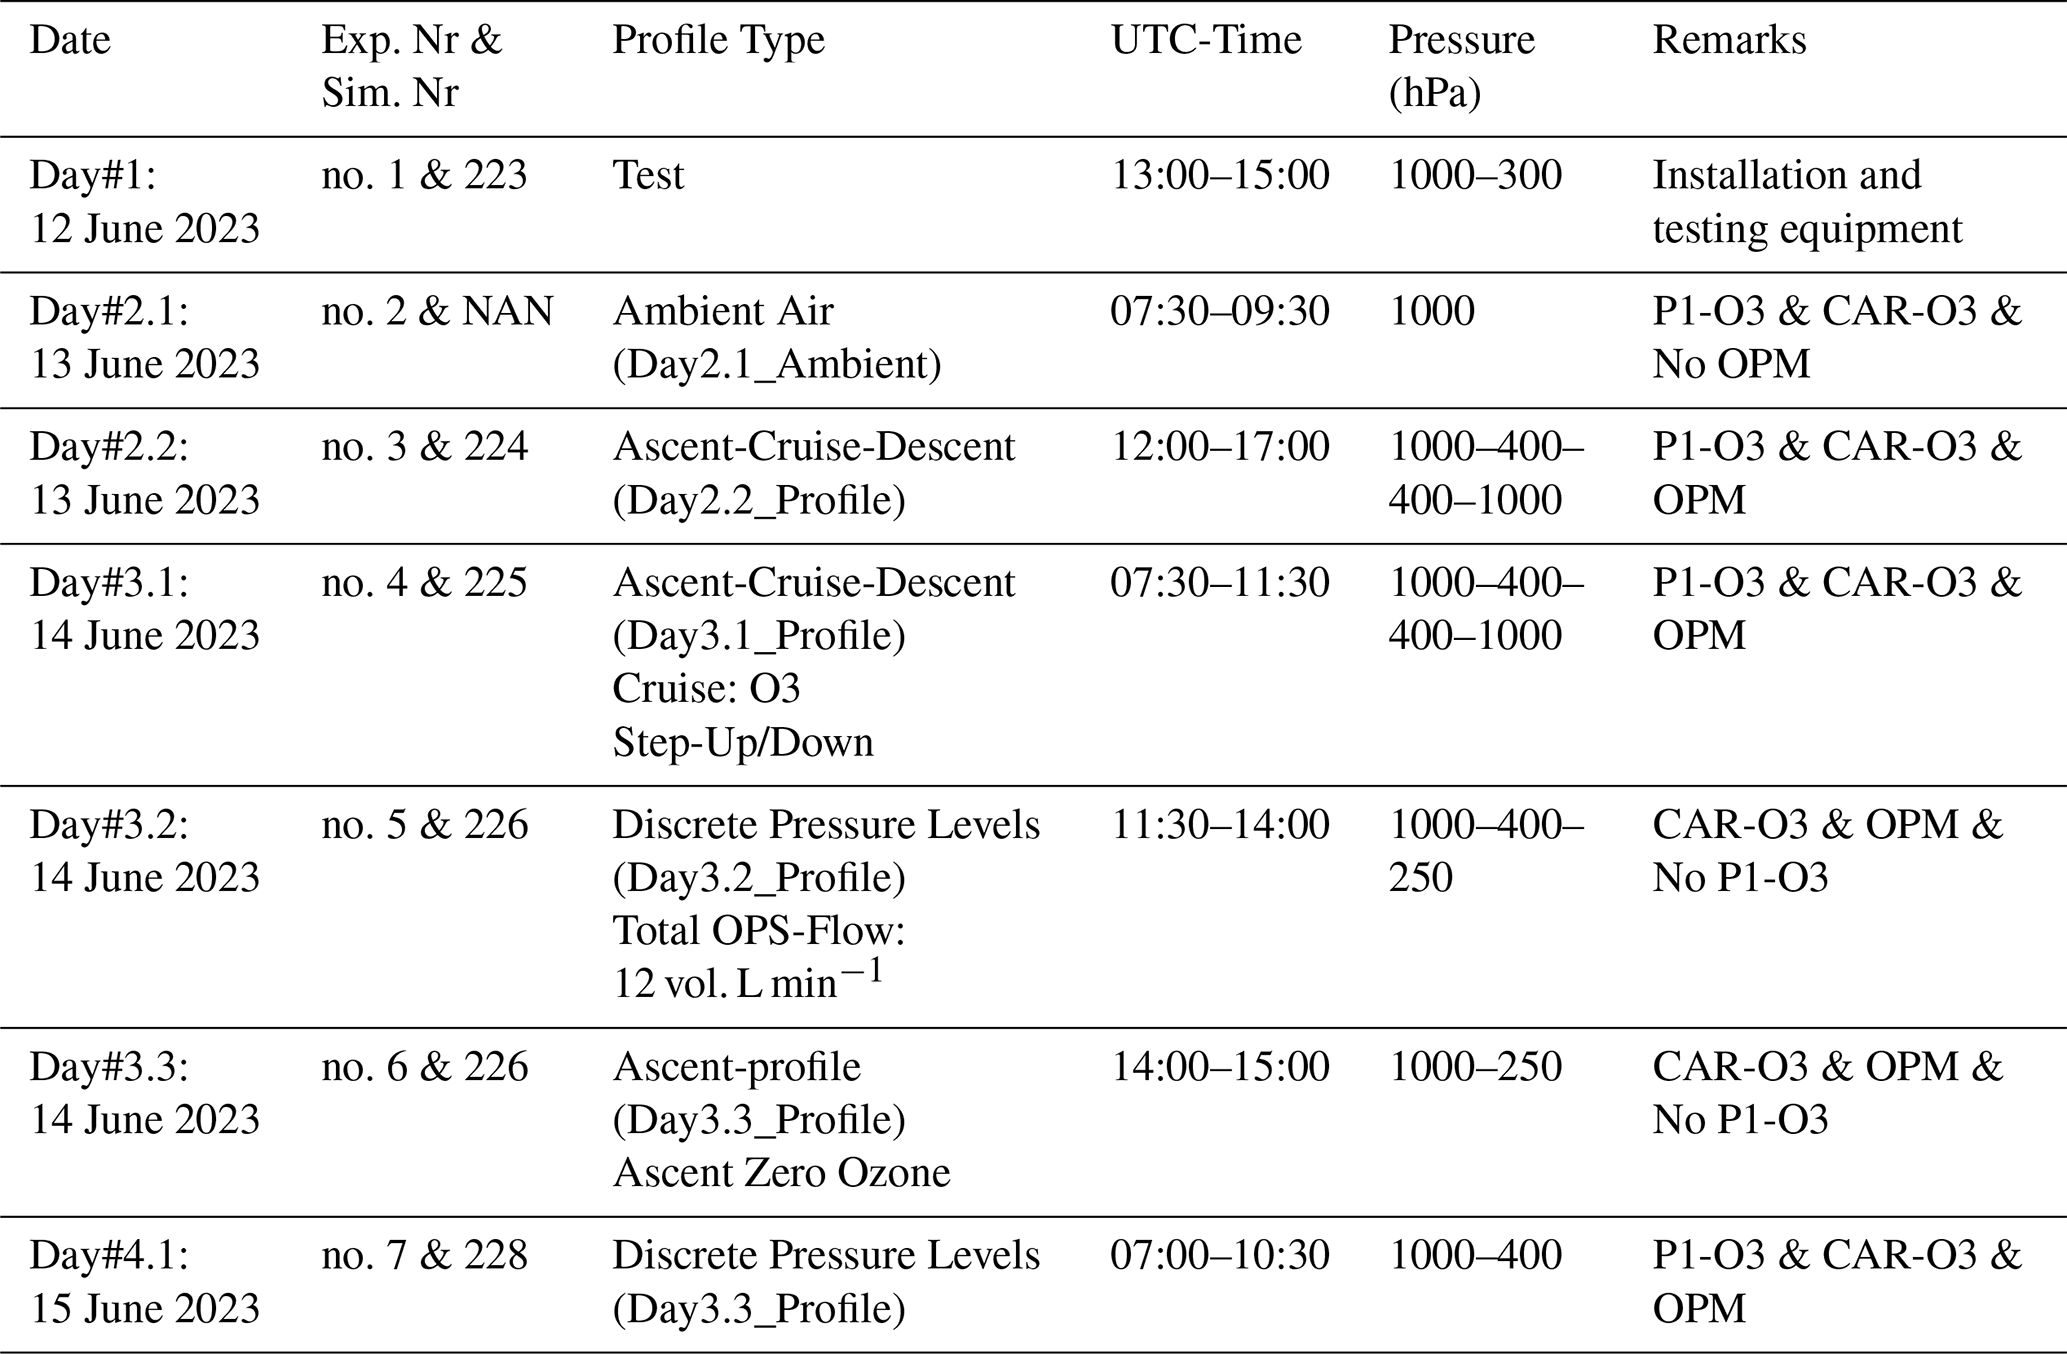
Table 2 gives an overview of the simulation experiments performed. The first day (12 June 2023) was reserved for installation of the equipment and for a short test run to ensure proper functioning of equipment and data acquisition of the different instruments. On the second day (13 June 2023) another test of the P1-O3 and CAR-O3 instruments followed by sampling outside ambient air. The results of these two tests are beyond the scope of this report. The core of the intercomparison itself took place on 13 until 15 June 2023 with the four simulation experiments, numbered 3 to 7, which will be presented here in more detail.
Table 2List of intercomparison experiments performed during the IAGOS-WCCOS Ozone Intercomparison (IWOI) campaign between 12 and 15 June 2023 at WCCOS (FZJ/IEK-8, Jülich, Germany).
3.2 Comparison of P1-O3, CAR-O3 and OPM at a pressure of 400–1000 hPa
3.2.1 Experiment no. 3: Ascent-Cruise-Descent
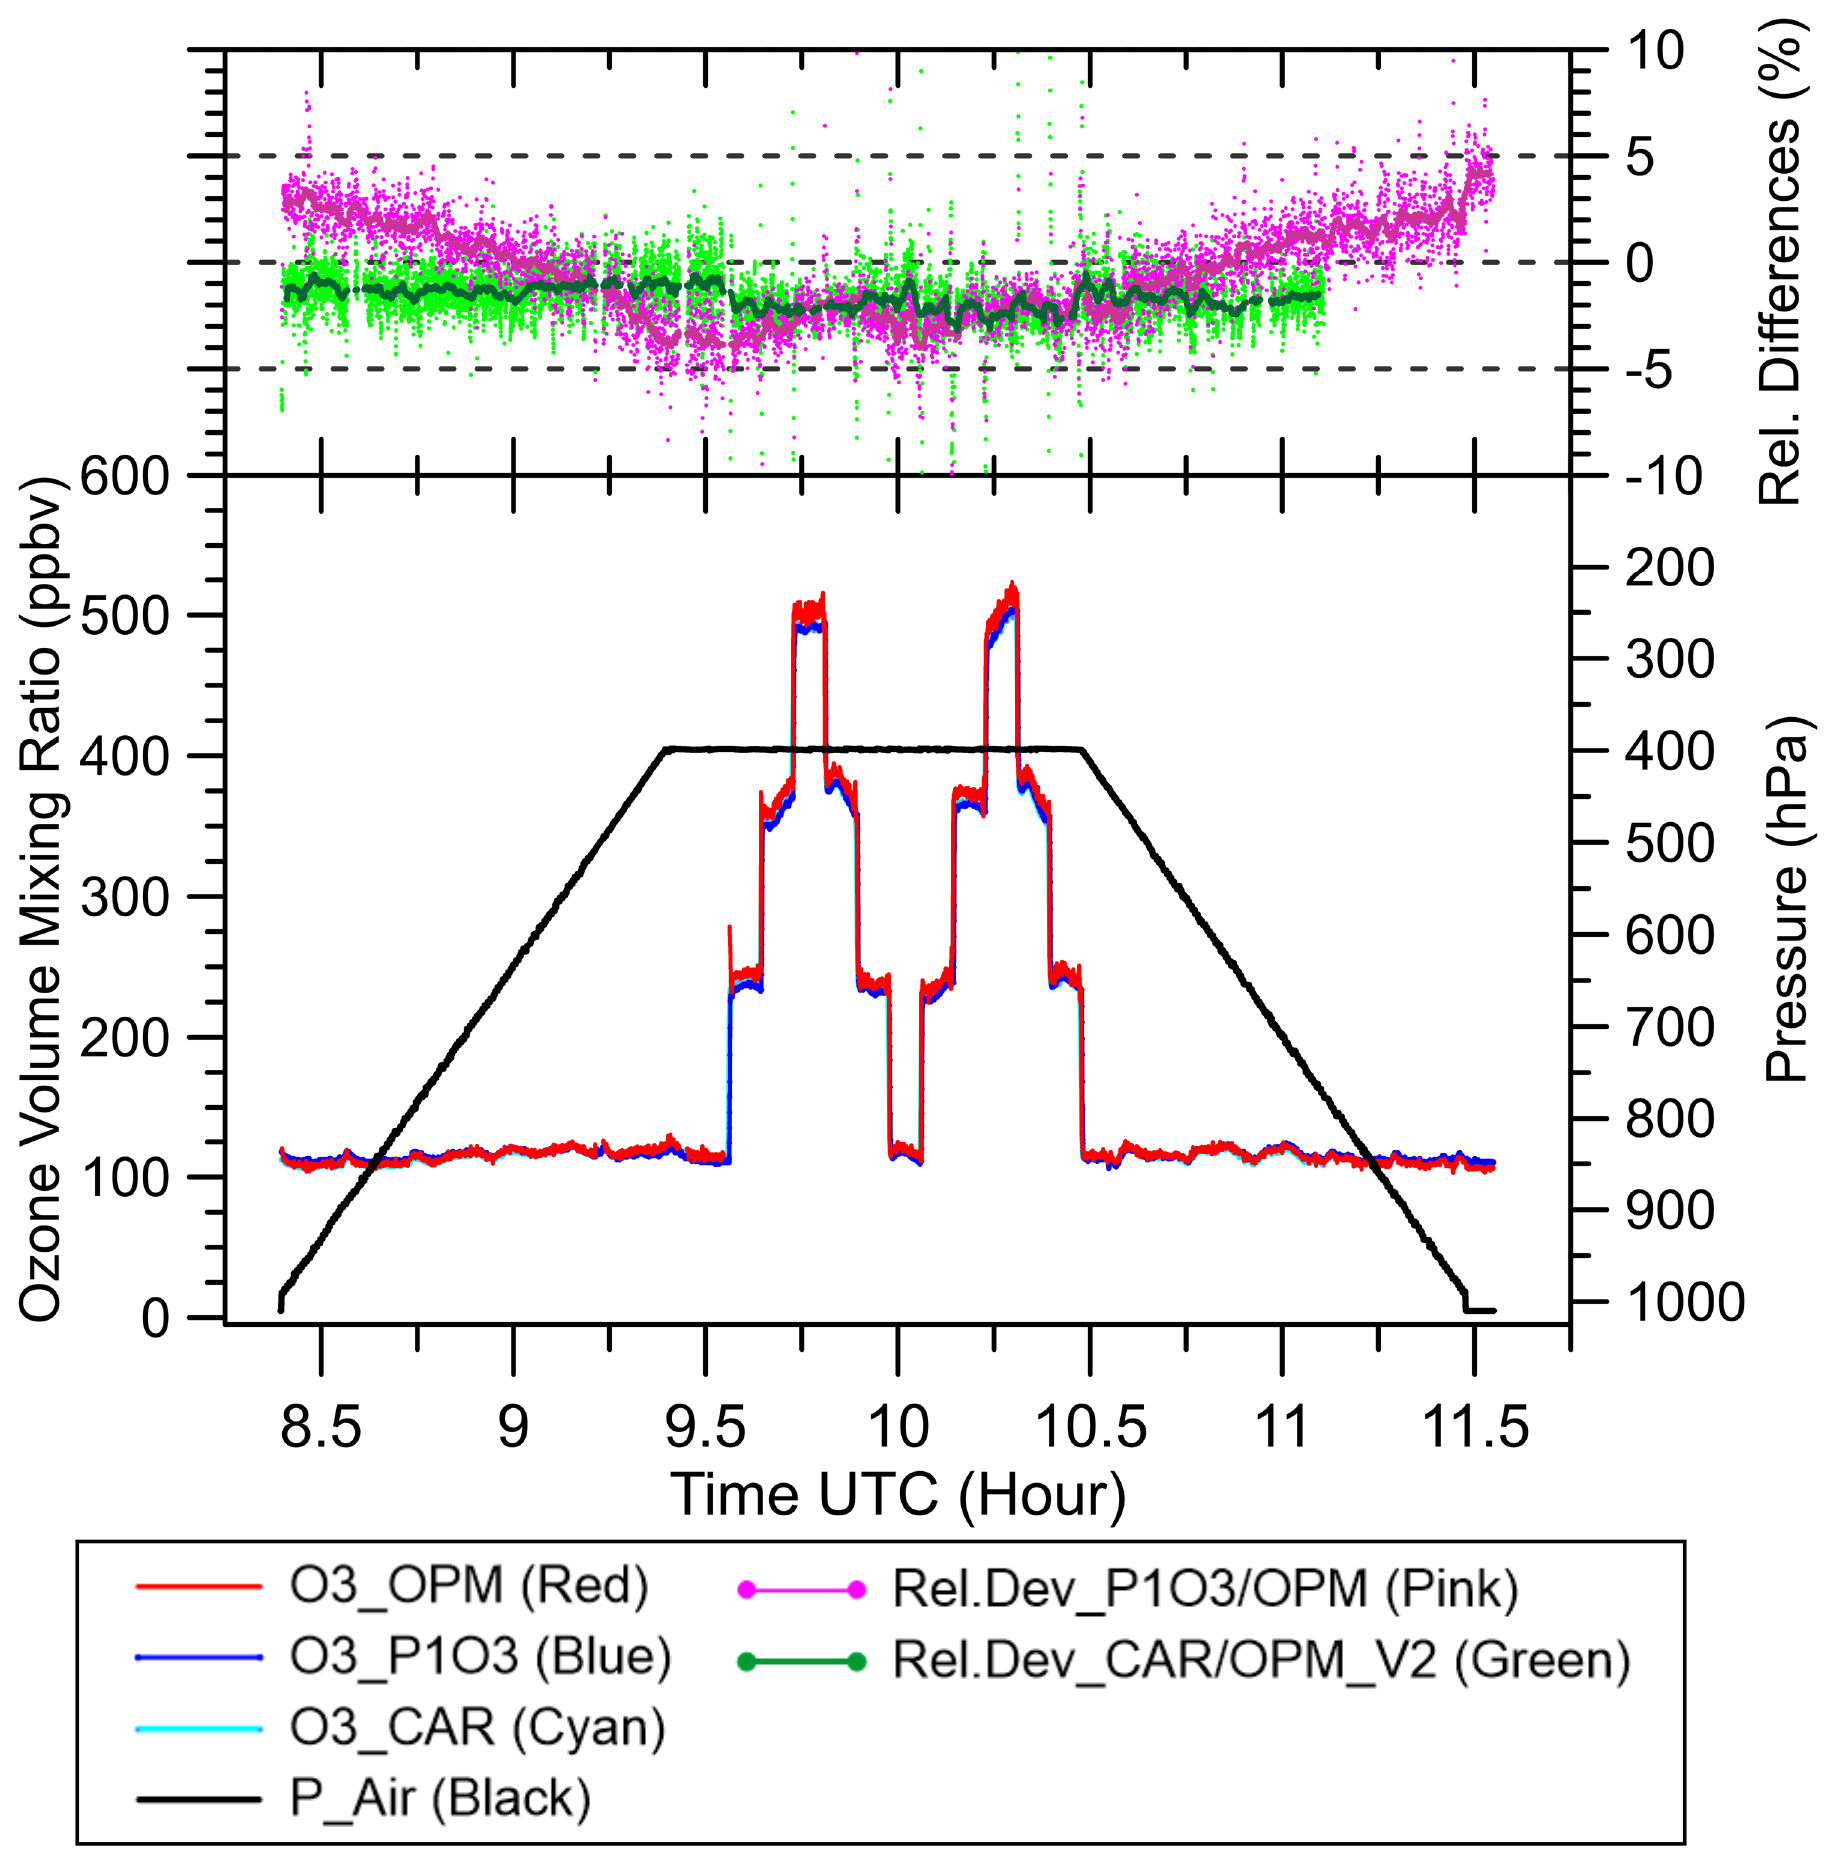
Experiment no. 3 (numbering, see second column in Table 2) simulates an aircraft doing an “ascent – cruise altitude – descent” profile of pressure and ozone volume mixing ratio (Figs. 2, 4, 5). The lowest pressure of 400 hPa is to simulate the maximum pressure difference the P1 pump box must achieve between cruise altitude and about 1000 hPa in the laboratory (see explanation in Sect. 2.3.2). In the first part of the simulation, during the ascent and the beginning part of the cruise phase, the ozone level was maintained at 400–500 ppbv to clean the inlet tubes of the OPM, P1-O3 (including P1-Pump Box) and CAR-O3 instruments. In the second part, the ozone was lowered to about 100 ppbv. The three missing data intervals of CAR-O3-instrument were caused by a malfunction of its temperature controller of the UV-LED light source such that the measured O3 values were rejected and not shown in the graph and excluded from further analysis.
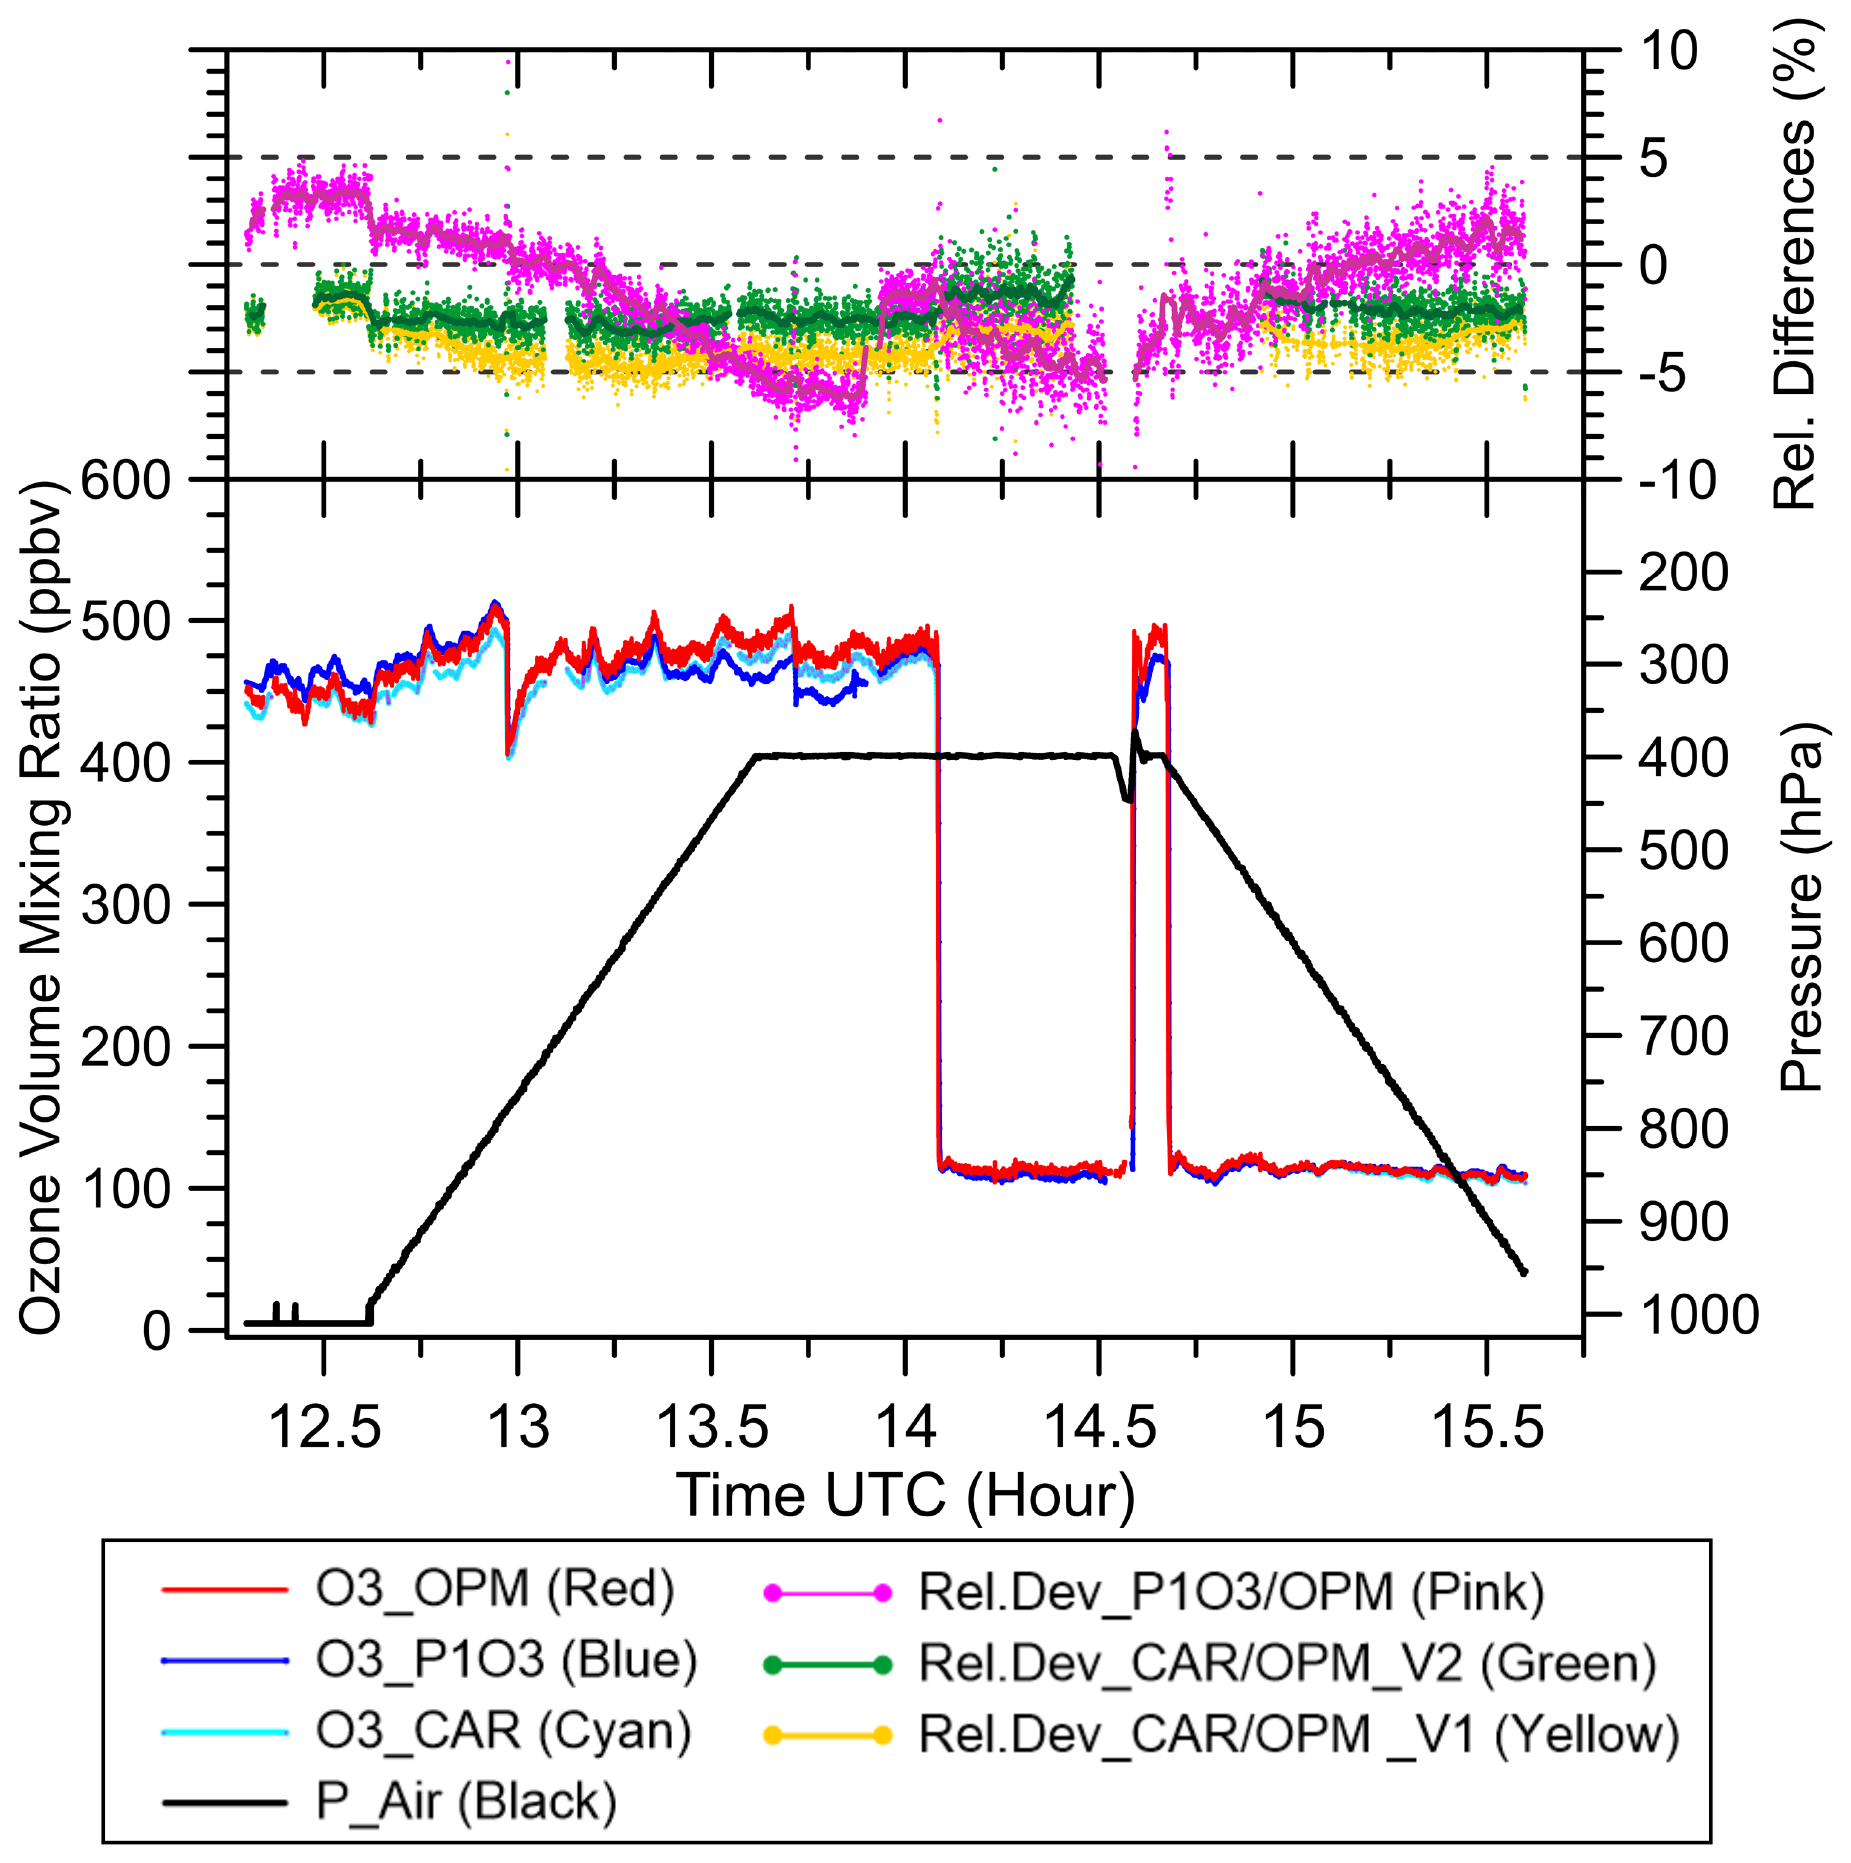
Figure 2Experiment no. 3: Time-series of pressure (black) and ozone volume mixing ratio to simulate an ascent-cruise-descent track of an IAGOS aircraft for P1-O3 (blue), CAR-O3 (cyan = light blue) and OPM (red). The relative differences compared to each other are P1-O3 to OPM (pink) and CAR-O3 (original: V1) to OPM (yellow) and CAR-O3 (pressure-sensor corrected: V2, see text) to OPM (green). Fat solid lines are 3 min running averages of the relative differences.
The relative differences in % of the (VMR) readings of P1-O3 and CAR-O3, respectively, shown in this study are consequently defined with respect to the readings of the OPM-O3 instrument acting as the reference as follows:
In general, the three instruments follow the simulated ozone profile well and agree among each other between −5 and +2 % (Fig. 2). P1-O3 compared to the OPM shows a pressure dependence, that is, from +3 % at 1000 hPa down to −5 % at cruise altitude conditions. The CAR-O3 instrument initially exhibited an increasing negative offset relative to the OPM of −1 % at 1000 hPa (at ∼ 12:30 UTC) to −4 % at 800 hPa and lower pressures (Fig. 2: yellow curve). This somewhat strange behaviour was subject to further investigations on the underlying cause. In a subsequent test (May 2024), KIT (Karslruher Institut für Technologie), responsible for the operation of the CAR-O3 instrument, found an issue with the electronic analog-digital converter of the data acquisition card of CAR-O3 that generated a systematic 2.2 % difference of the reading of the pressure, PCuv) inside the absorption cells below a pressure of ∼ 800 hPa (see Fig. 3a). This electronic artefact has been eliminated and the pressure readings before and after the repair of the AD-converter were compared against an accurate reference pressure, Pref, sensor (Omega HHP360, accuracy: 0.25 hPa). The observed pressure differences, as function of the reference pressure PRef. (Fig. 3a.) are used to correct all original CAR-O3 data (version V1) into the new pressure-sensor corrected CAR-O3 data (version V2). After the repair of the AD-converter, the corrected V2 data show a rather constant, pressure independent, deviation of about −2 % compared to the OPM (Fig. 3b). We only will present the pressure corrected CAR-O3 data. There exists just one single CAR-O3 instrument that is in flight operation. Meanwhile, all CARIBIC-Ozone data in the IAGOS database (https://iagos.aeris-data.fr) have been corrected accordingly. For the two similar CAR-O3 type instruments (FAIRO-1 and FAIRO-2) which are flown on the German research aircraft HALO (HALO (High Altitude and Long-Range Research Aircraft) the ADC-cards were configured correctly, such that no correction is needed.
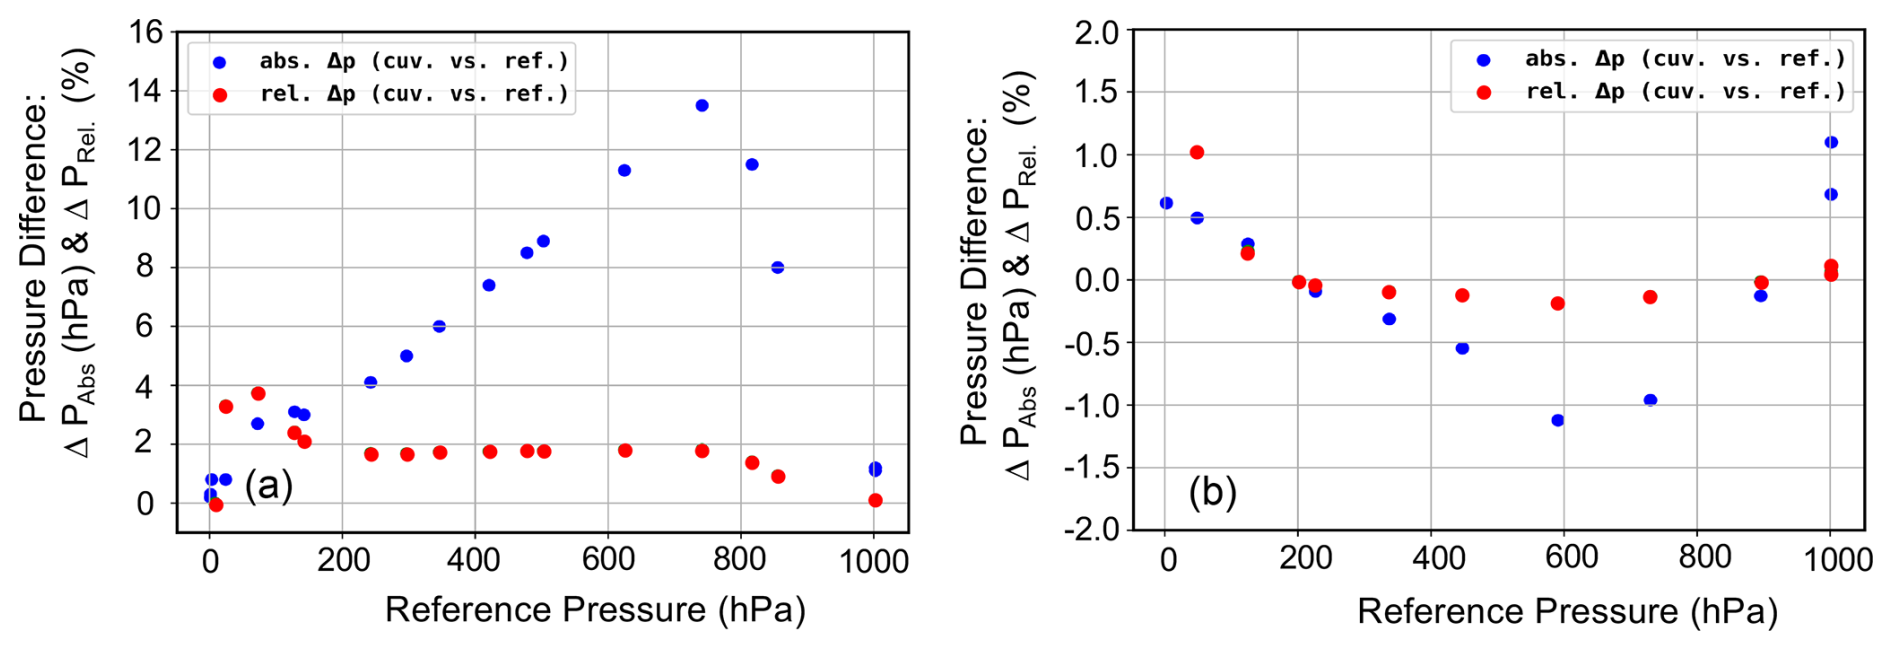
Figure 3Comparison of CAR-O3 air pressure sensor, PCuv, inside UV-absorption cell against accurate reference pressure, PRef. sensor (Omega, HHP360, uncertainty: 0.25 hPa) before (a) and after (b) solving the electronic artifact of the AD-converter (details see main text). Displayed are the pressure differences in hPa (blue dots) and their relative differences in % (red dots).
In Fig. 4 the identical data (experiment No. 3, see Fig. 2) have been split into the vertical O3-profiles during ascent (Fig. 4a) and descent (Fig. 4b). The behaviour of P1-O3 and CAR-O3 described above occurs identically during ascent and descent, and no indication for any hysteresis effects could be observed. This is also confirmed by the fast responses of both instruments on the sharp upward or downward steps of the simulated ozone levels.
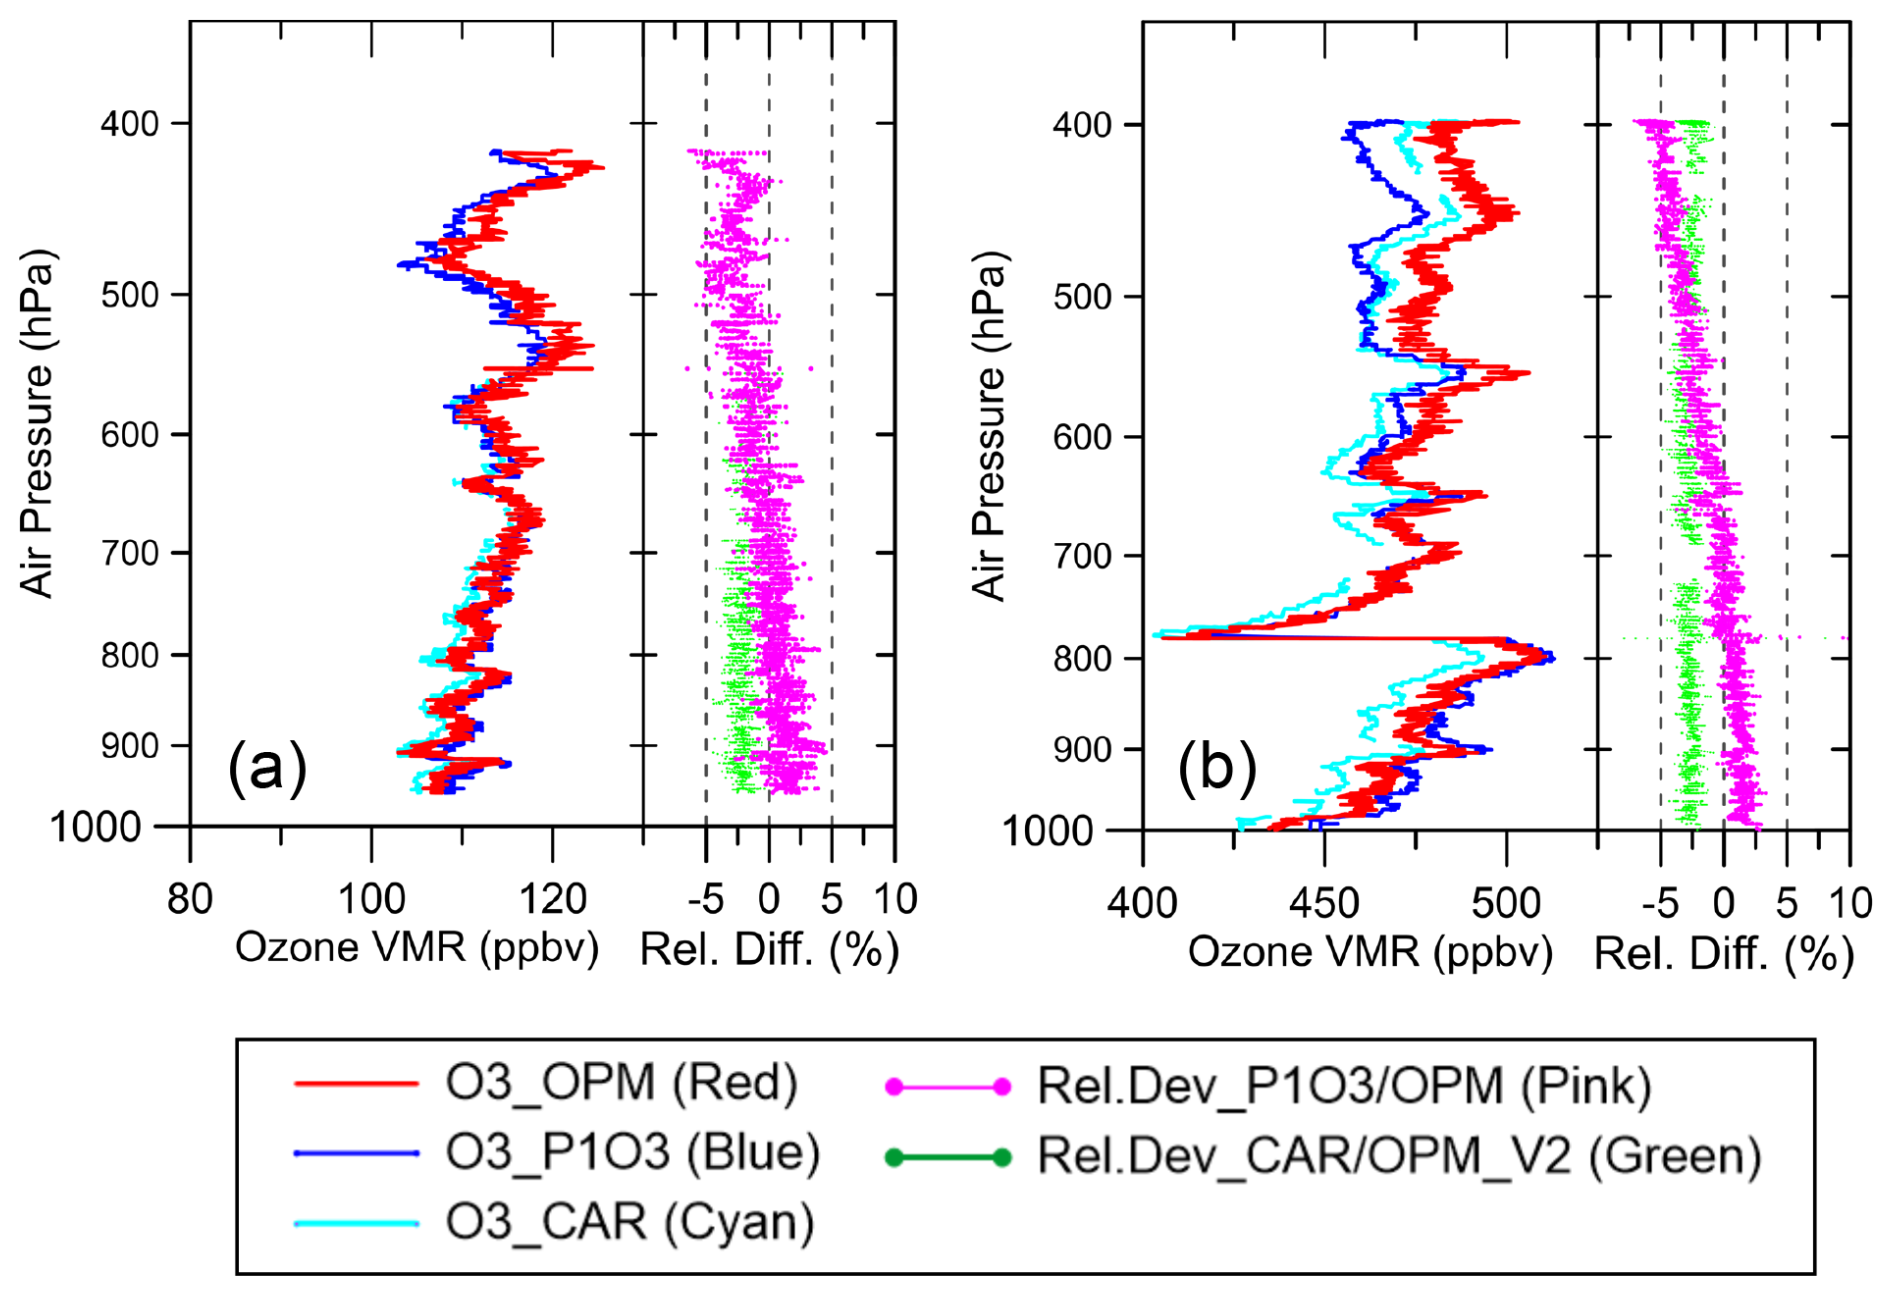
Figure 4Experiment No. 3: Same data (and colours) as in Fig. 2 but has been split into ascent (a) and descent (b). The measured ascent and descent profiles are displayed as ozone versus the simulated pressure (10Log scale).
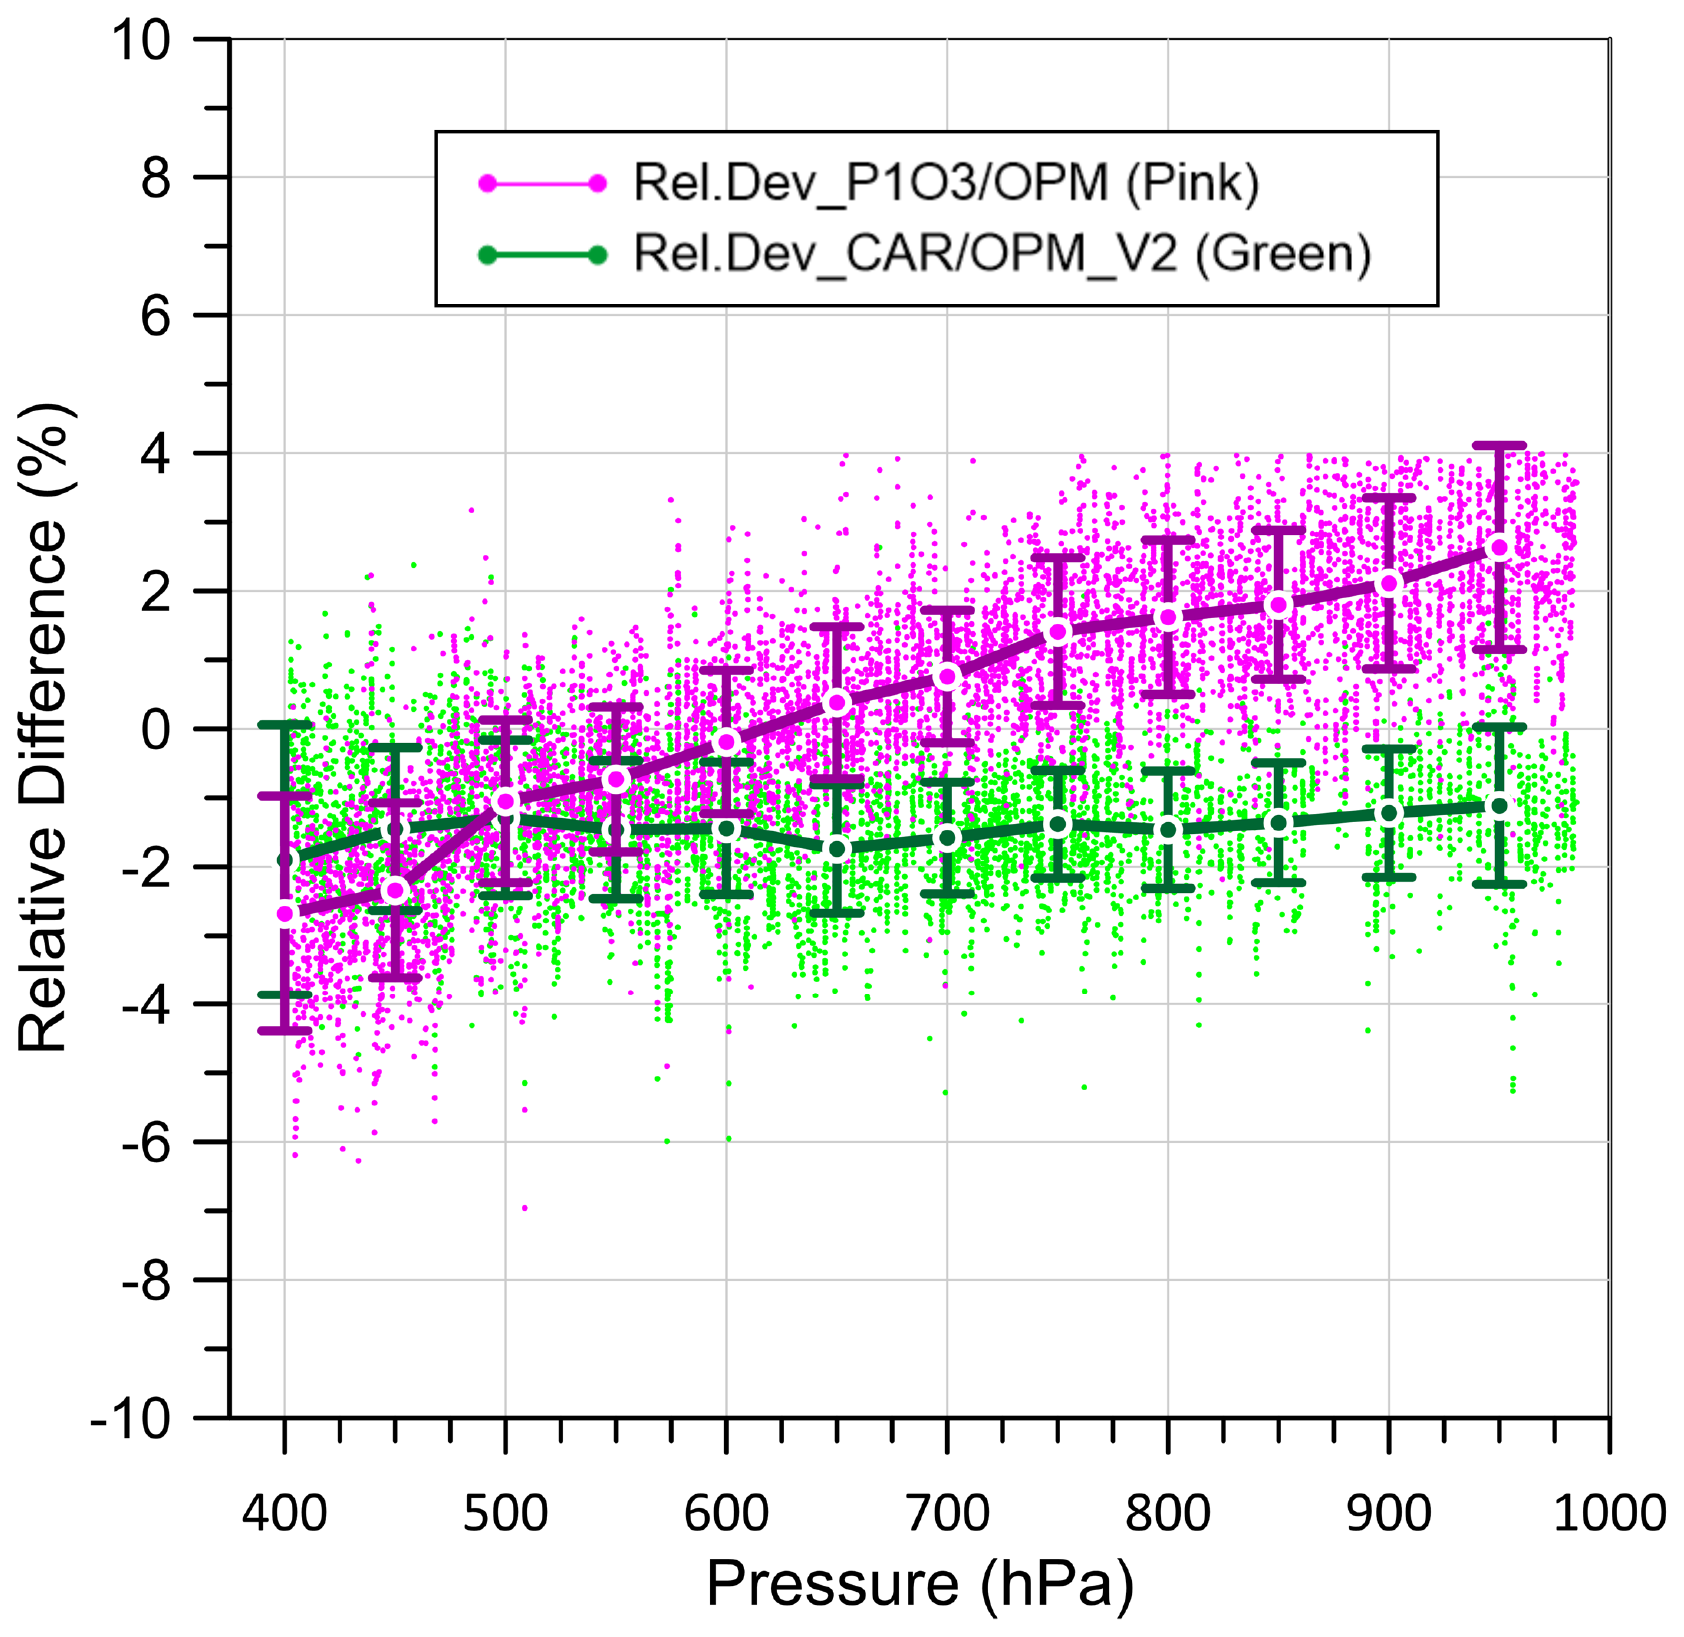
The results of this Exp. no. 3 are summarized in Fig. 5 that displays the relative differences of P1-O3 and CAR-O3 compared to the OPM as scatter plot and function of the air pressure inside the chamber. The thick curves are the corresponding averages over 50 hPa bins with their one standard deviation.
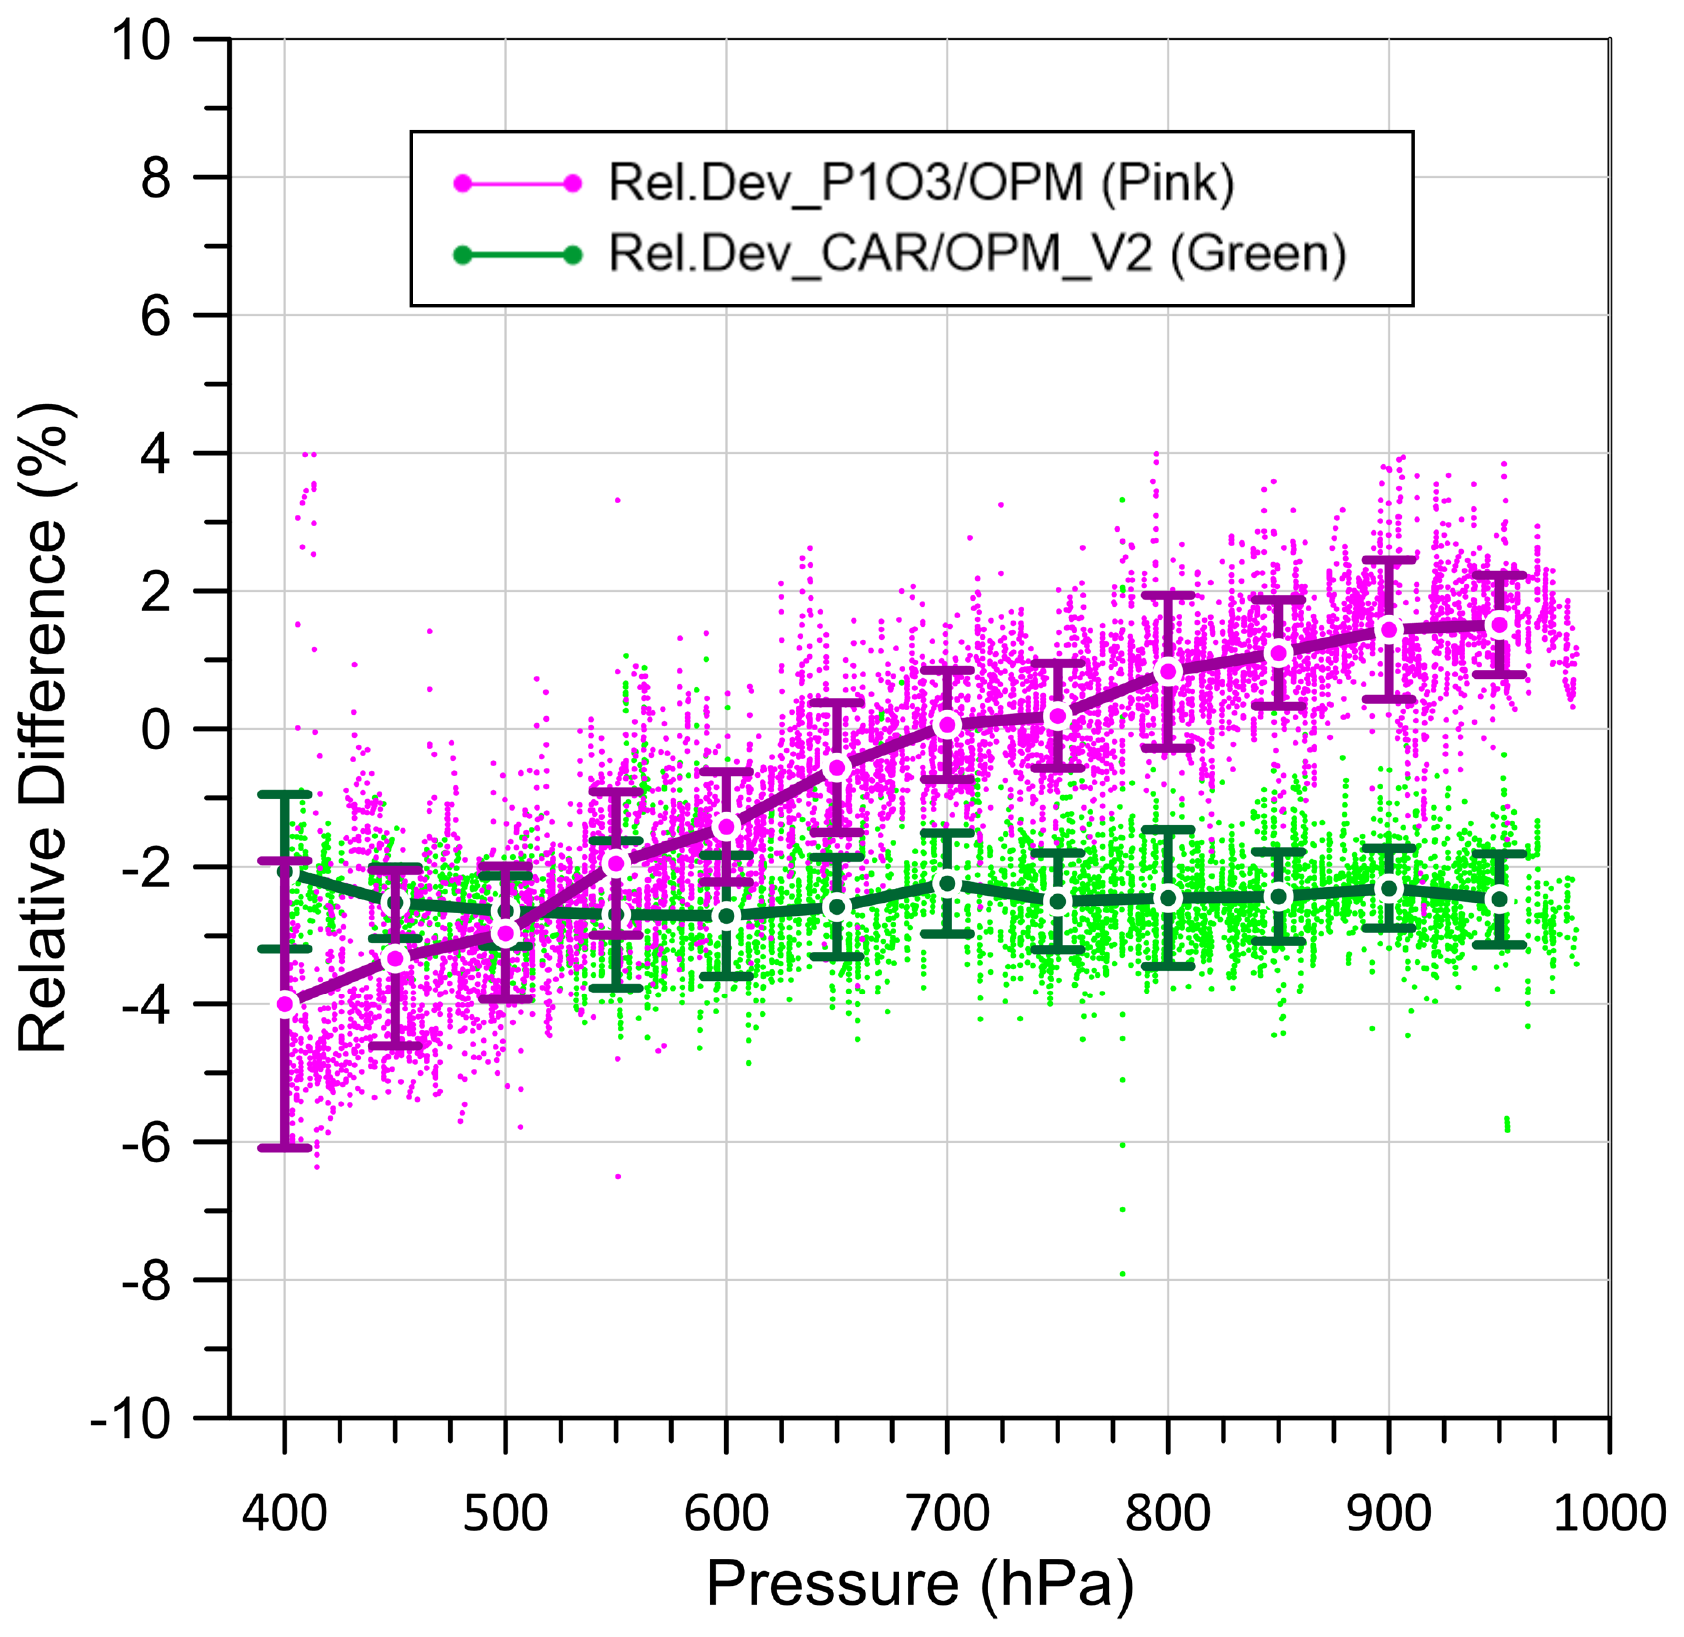
Figure 5Experiment No. 3: Same data (and colours) as in Fig. 2, but relative differences of P1-O3 and CAR-O3 compared to OPM as function of pressure. Thick solid lines are averages over 50 hPa pressure bins with their 1σ-standard deviation.
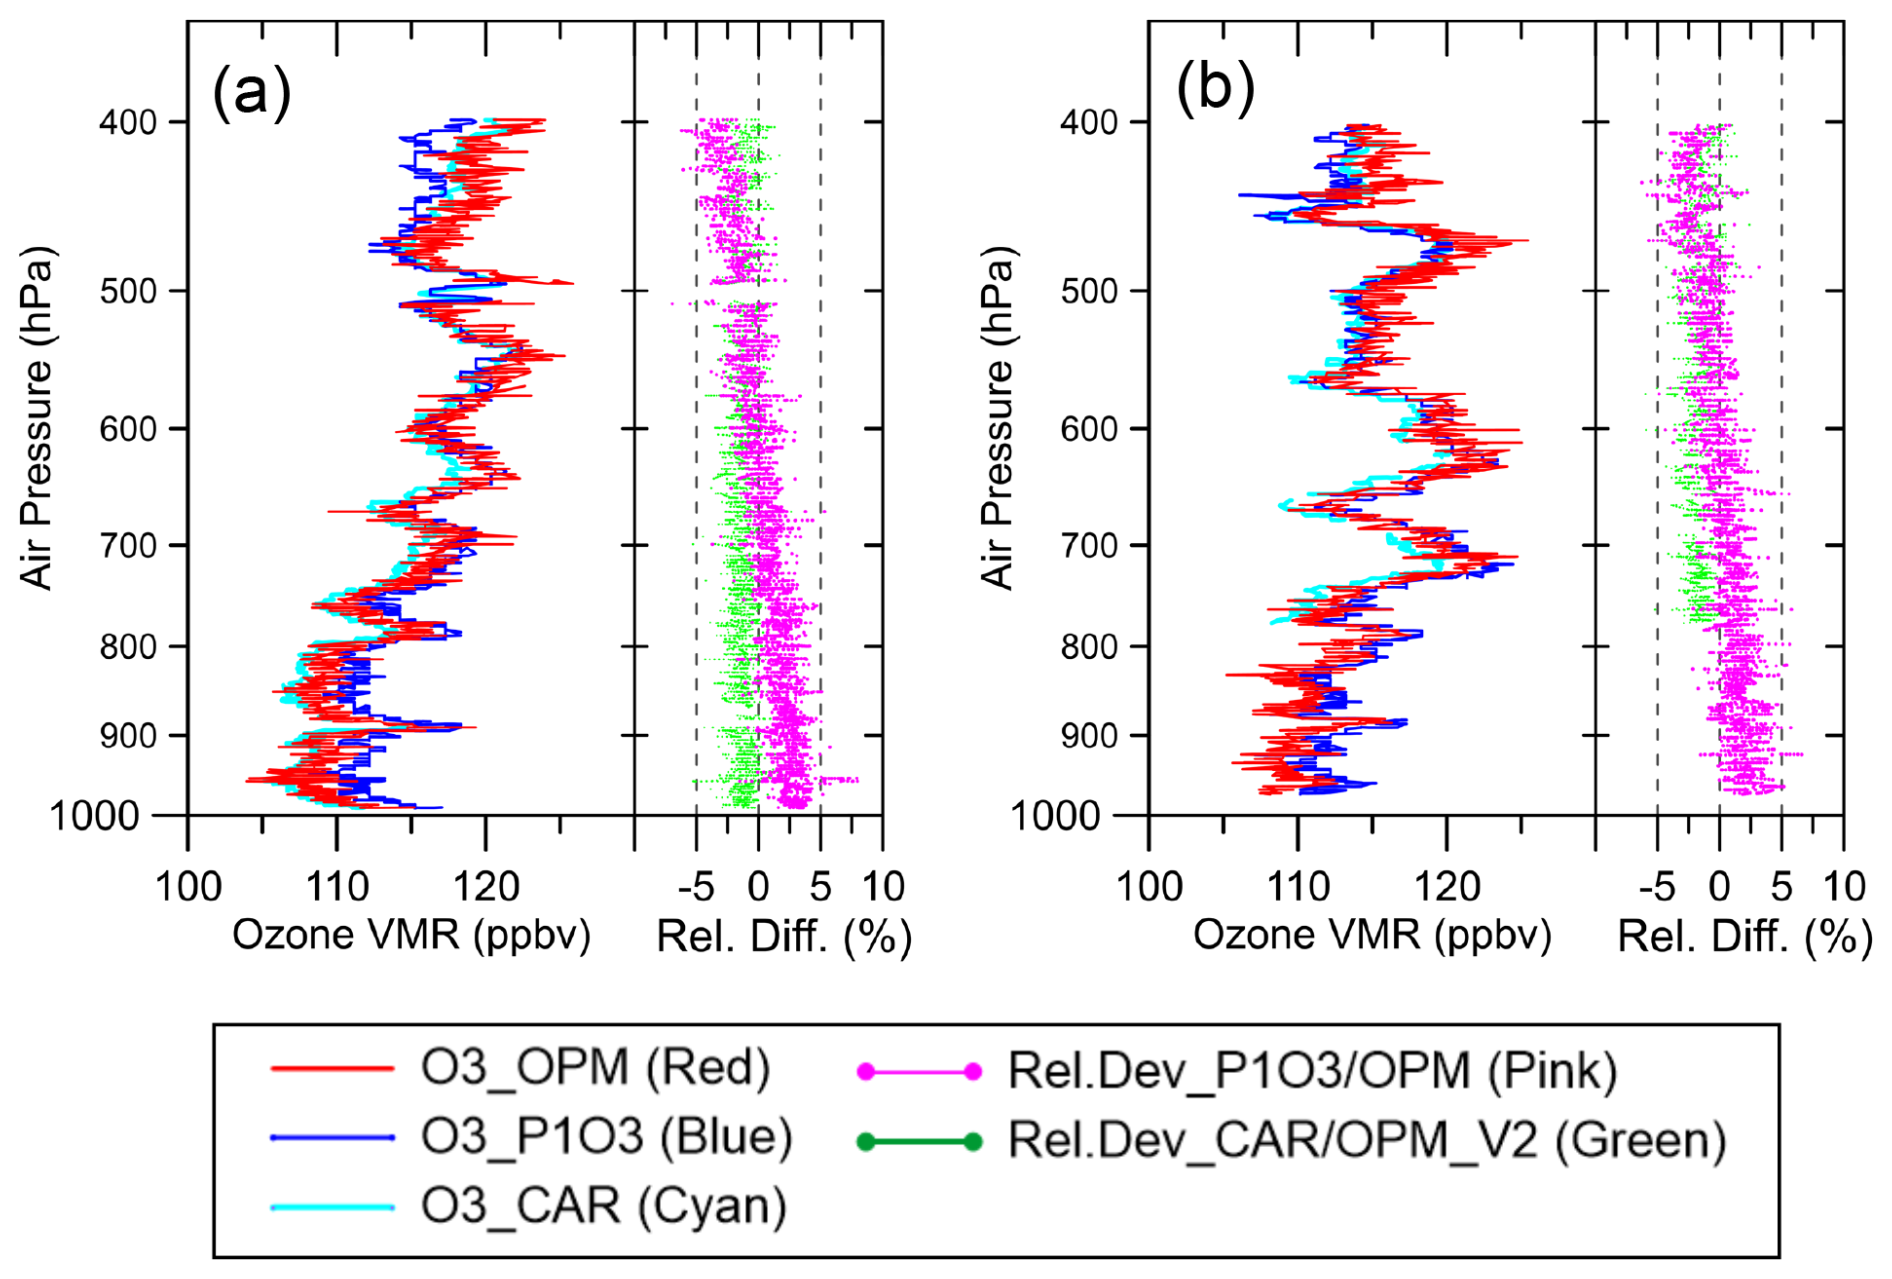
3.2.2 Experiment no. 4: Ascent – Cruise (O3 steps) – Descent
This simulation experiment is similar to Exp. No. 3, with the following differences: during ascent and descent the ozone volume mixing ratio was held at 110 ppbv, while at cruise altitude, the ozone was varied (stepped up and down) at different levels of 100, 250, 370 and 500 ppbv, see Figs. 6–8 equivalent to the Figs. 2, 4 and 5 respectively.
Also, in this simulation experiment the instruments follow the simulated ozone profile well and agree among each other to within ±3 %. From Figs. 7 and 8 it is depicted that the P1-O3 compared to the OPM show a significant decrease with decreasing pressure, similar as in the previous Exp. No. 3 from +3 % at 1000 hPa down to −3 % at 400 hPa (cruise altitude conditions). The CAR-O3 instrument relative to the OPM revealed a similar behaviour as in Exp. No. 3: −(1.5 %–2 %) deviation that is constant at pressures between 1000 and 400 hPa. Remarkable is that the span and slope of all data are identical to Exp. no. 3, but all data are shifted to 0.8 %–1.0 % higher values. Based on this observation we estimate the reproducibility of the experimental set-up within ±1 %. Further, no indications are found on any memory or hysteresis effects for both instruments.
3.2.3 Experiment No. 7: O3 Step Up/Down at Different Pressure Levels
In this simulation experiment at three different discrete pressure levels (950, 600 and 400 hPa) the ozone levels were varied (step up and down) at discrete values typically found at the corresponding pressure levels, (See Figs. 9 and 10).
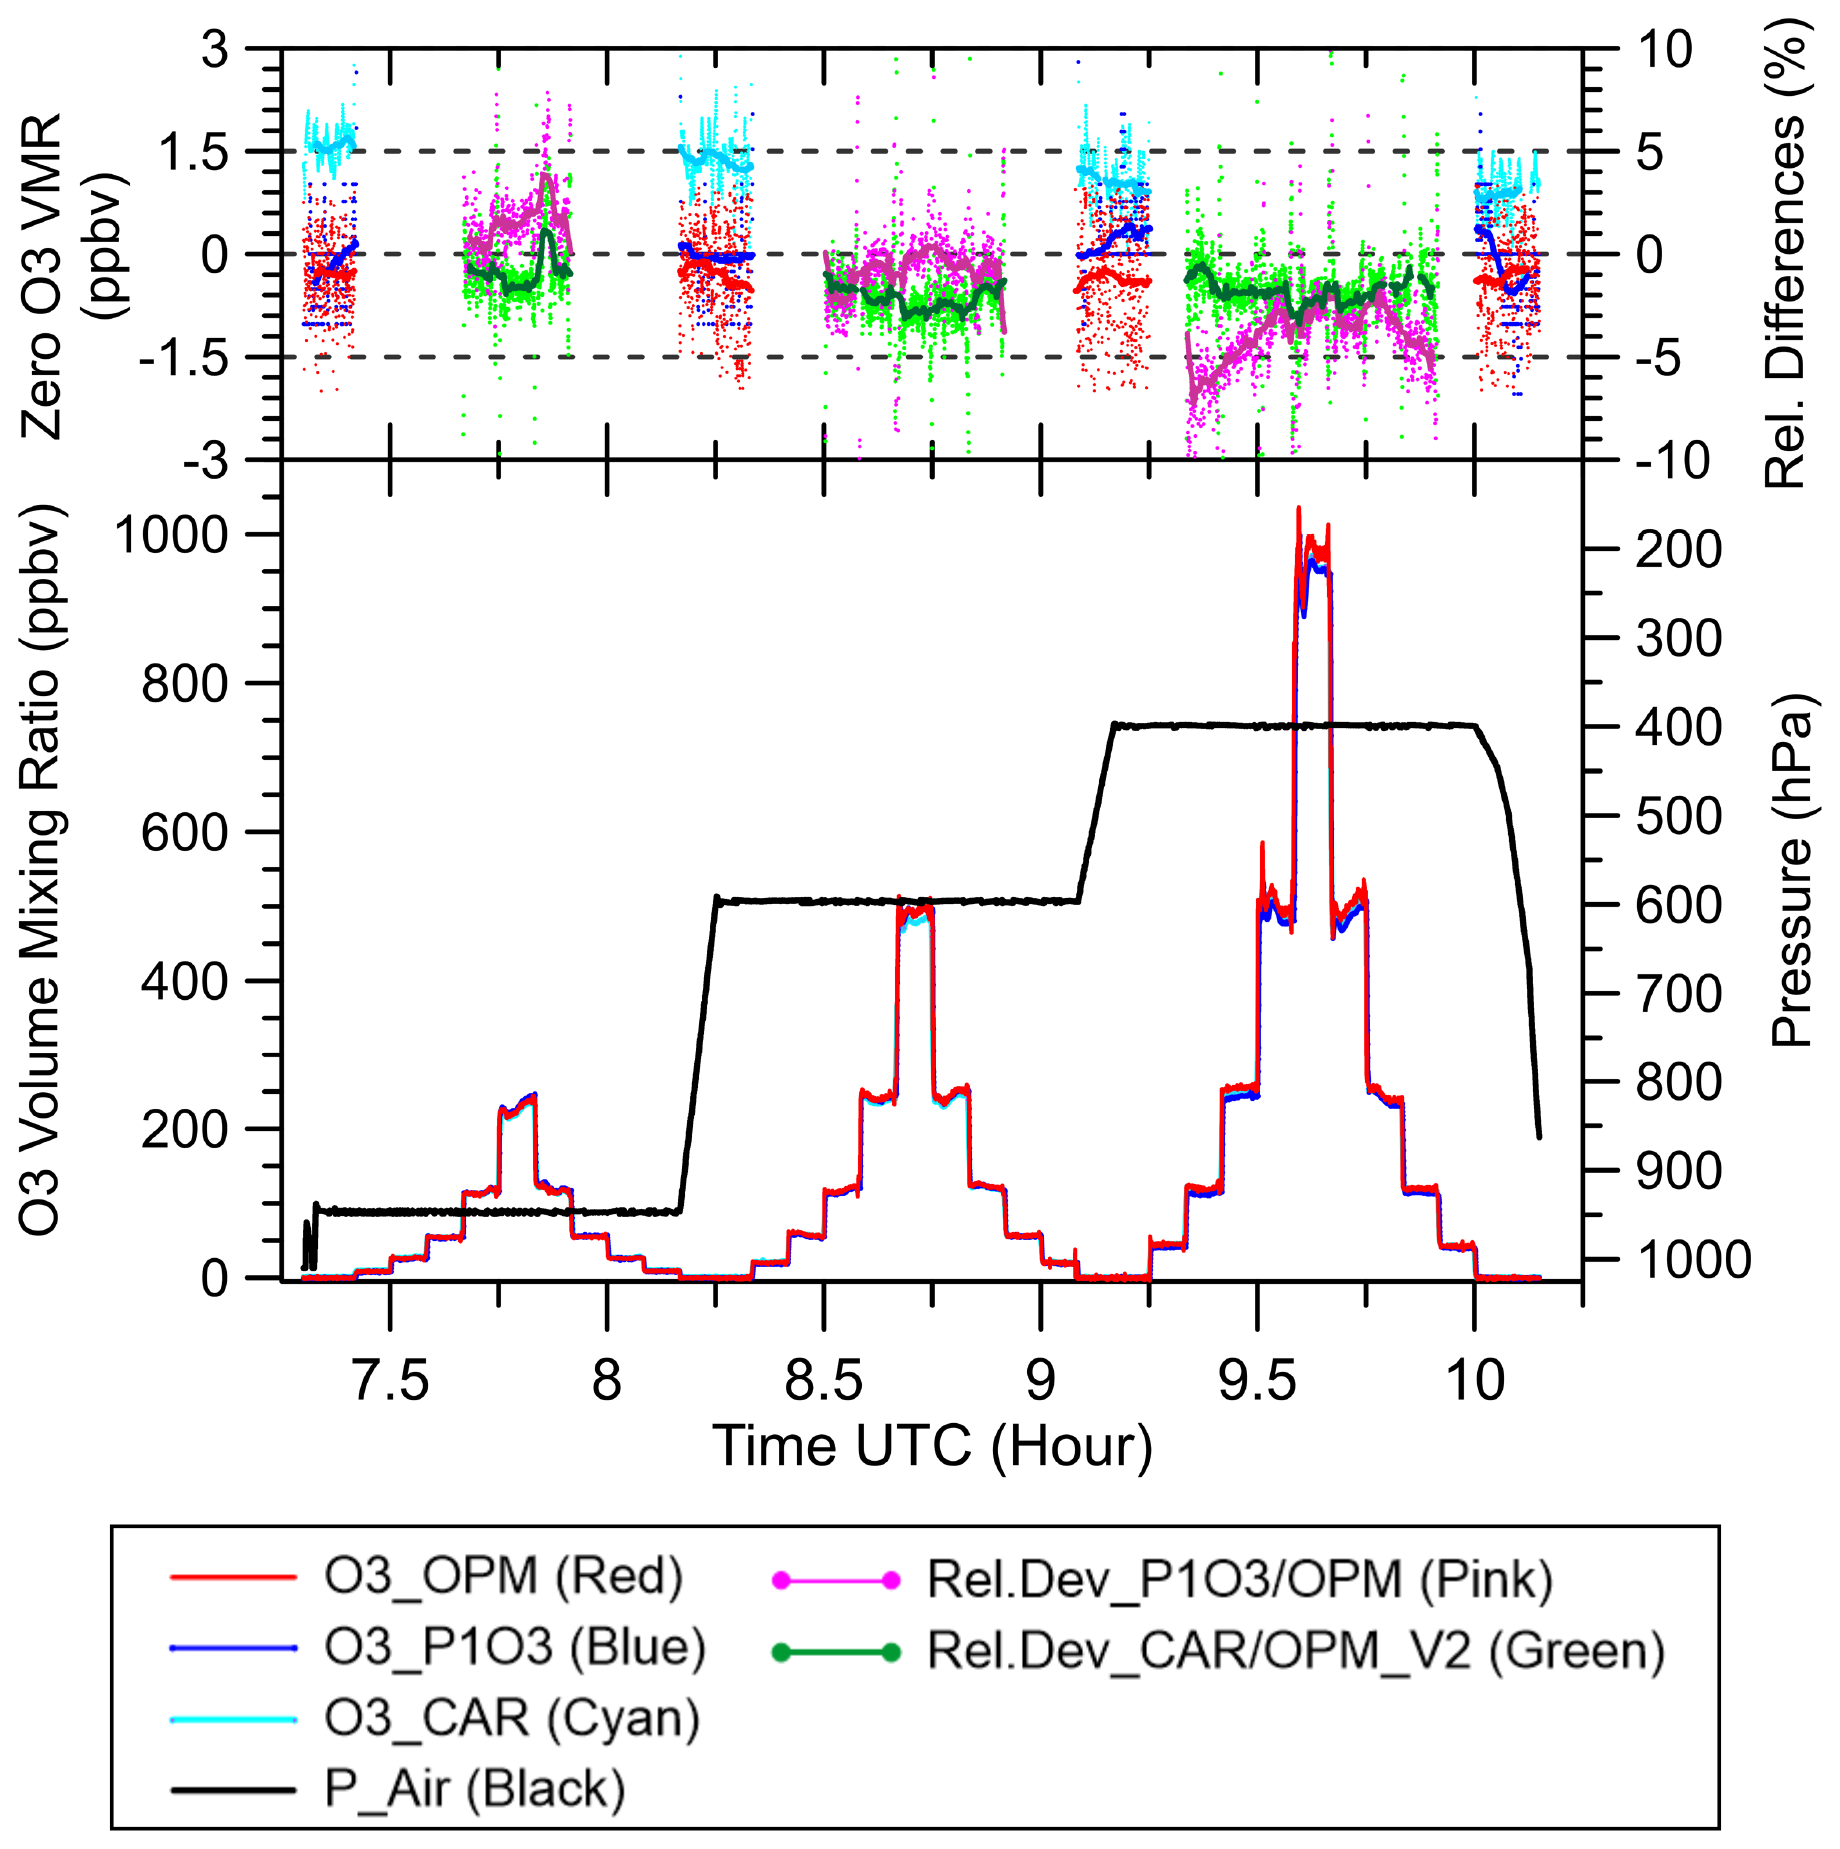
Figure 9Experiment no. 7: colour coding as listed in Fig. 4. In addition, in the upper panel (left vertical coordinate) are plotted the ozone offsets (red: OPM; blue: P1-O3; light blue = cyan: CAR-O3) measured during periods of zero ozone air, whereby fat solid lines are 3 min running averages of the offsets.
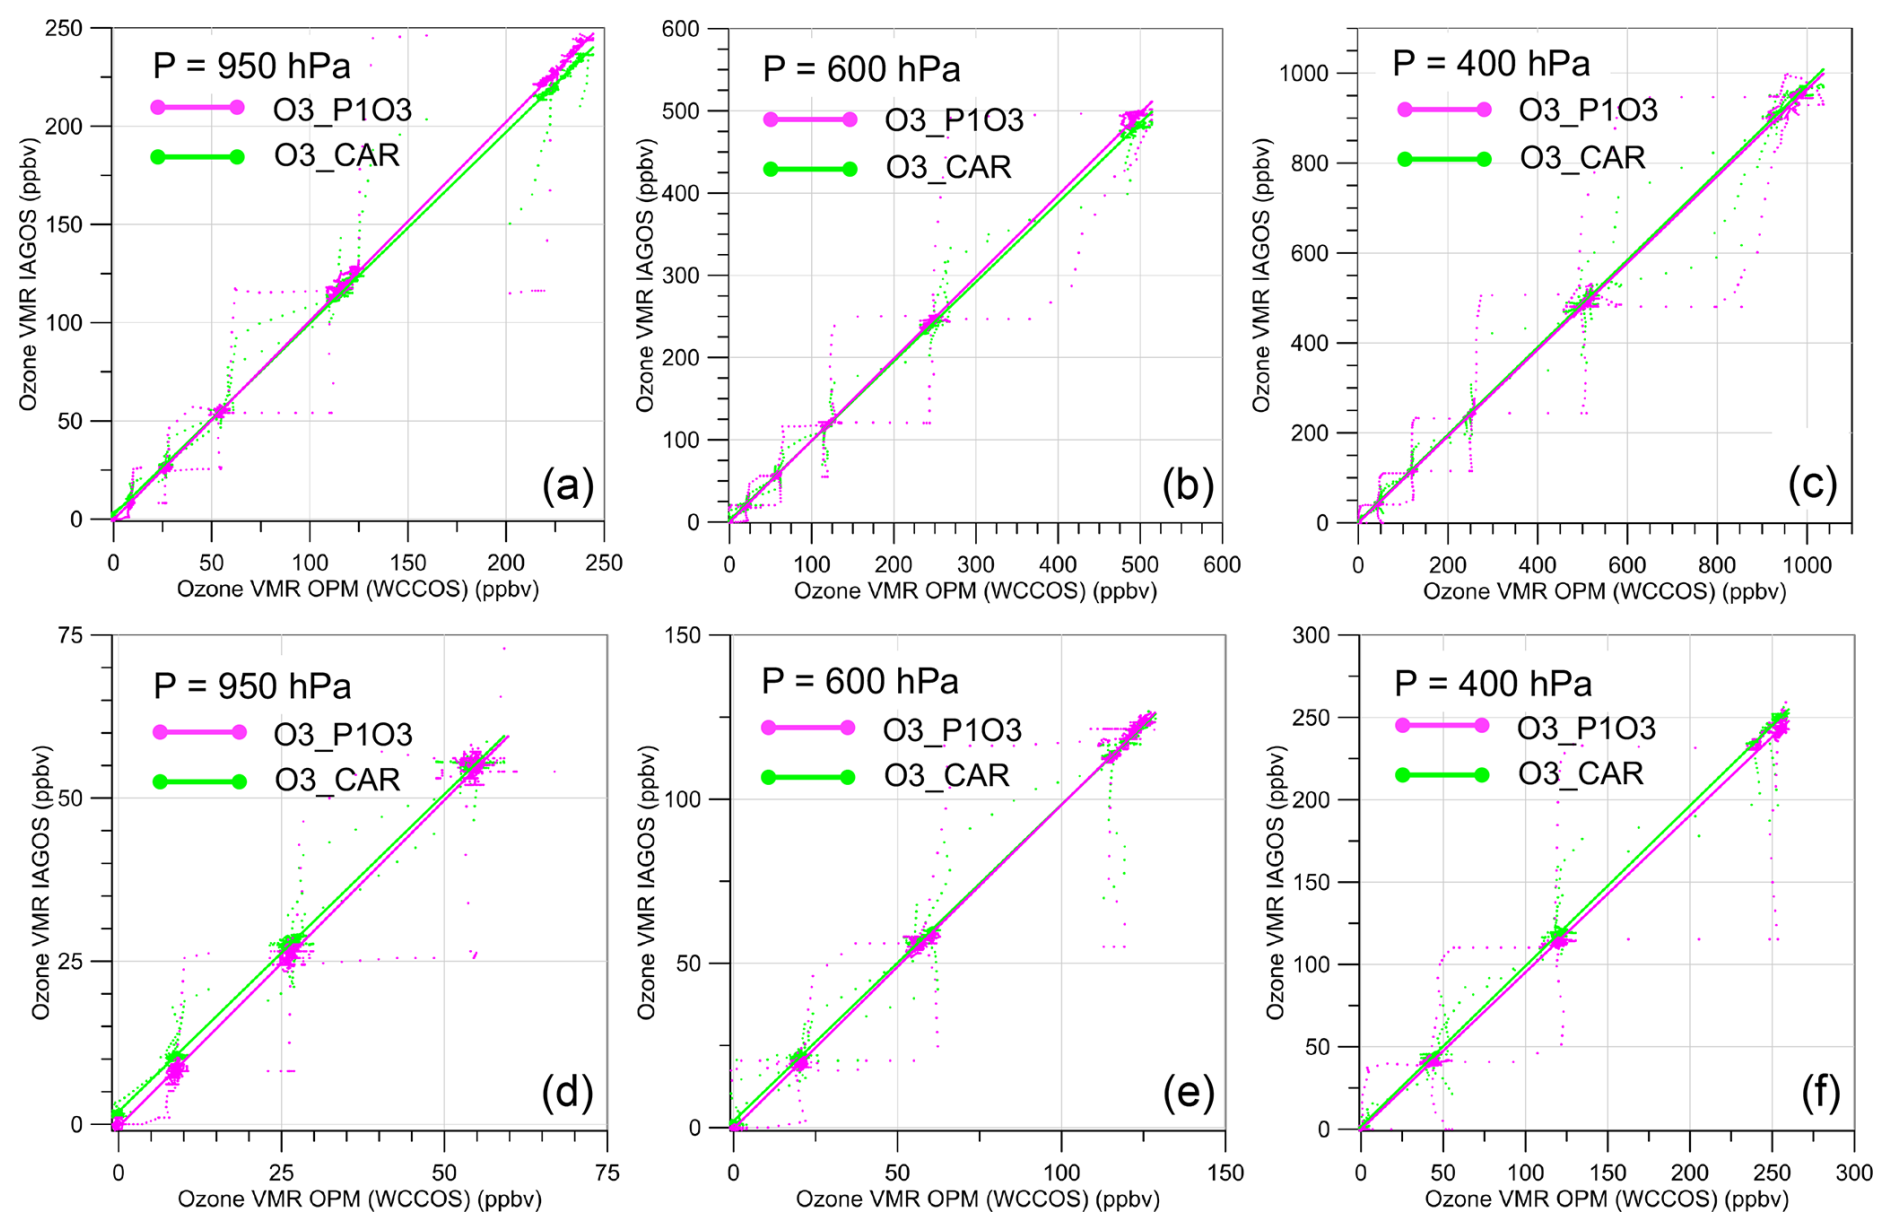
Figure 10Experiment no. 7: Ozone pressures measured by IAGOS instruments versus OPM at different ozone VMR levels (ppbv) for three discrete constant air pressure levels: 950, 600 and 400 hPa. Displayed are the scatter plots of P1-O3 versus OPM (pink) and CAR-O3 versus OPM (green) and the solid straight lines are their linear curve fits. Upper panels display the full ozone ranges (a–c) and the lower panels the lower ozone ranges (d–f) at the three different air pressure levels.
At low pressure around 400 hPa (Fig. 9), P1-O3 shows a small ozone dependent bias to the OPM from −5 % at ∼ 100 ppbv to −2 % at ∼ 1000 ppbv. The bias of CAR-O3 relative to OPM is again (as in Exp. no. 3 and no. 4) around −(1 %–2 %) and is constant over the entire pressure range of 400–1000 hPa with ozone volume mixing ratios up to 1000 ppbv. Although the three instruments track changes in ozone levels below 100 ppbv, only the relative differences for the higher ozone levels are shown in Fig. 9. This is because at lower ozone concentrations, even small differences between the instruments would result in large relative values. Therefore, to compare the behaviour of P1-O3 and CAR-O3 in more detail, Fig. 10 shows ozone VMR scatter plots of P1-O3 versus OPM and CAR-O3 versus OPM, respectively, for the three discrete pressure levels of 950, 600 and 400 hPa, once for the full ozone ranges upper panel) and once for the lower ozone ranges (lower panel). The lower ozone VMR levels are more representative of tropospheric conditions (Fig. 10d, e, f).
Table 3Offsets of OPM, P1-O3 and CAR-O3 determined from zero ozone air measurements (Fig. 8) and slope of linear curve fits of scatter plots of P1-O3 and CAR-O3 versus OPM scatter plots (Fig. 9), respectively, at three different air pressure levels: 950, 600 and 400 hPa for all data (Fig. 9), included the corresponding slopes for the upward and downward ozone step levels, respectively (Figs. S1 and S2, respectively).
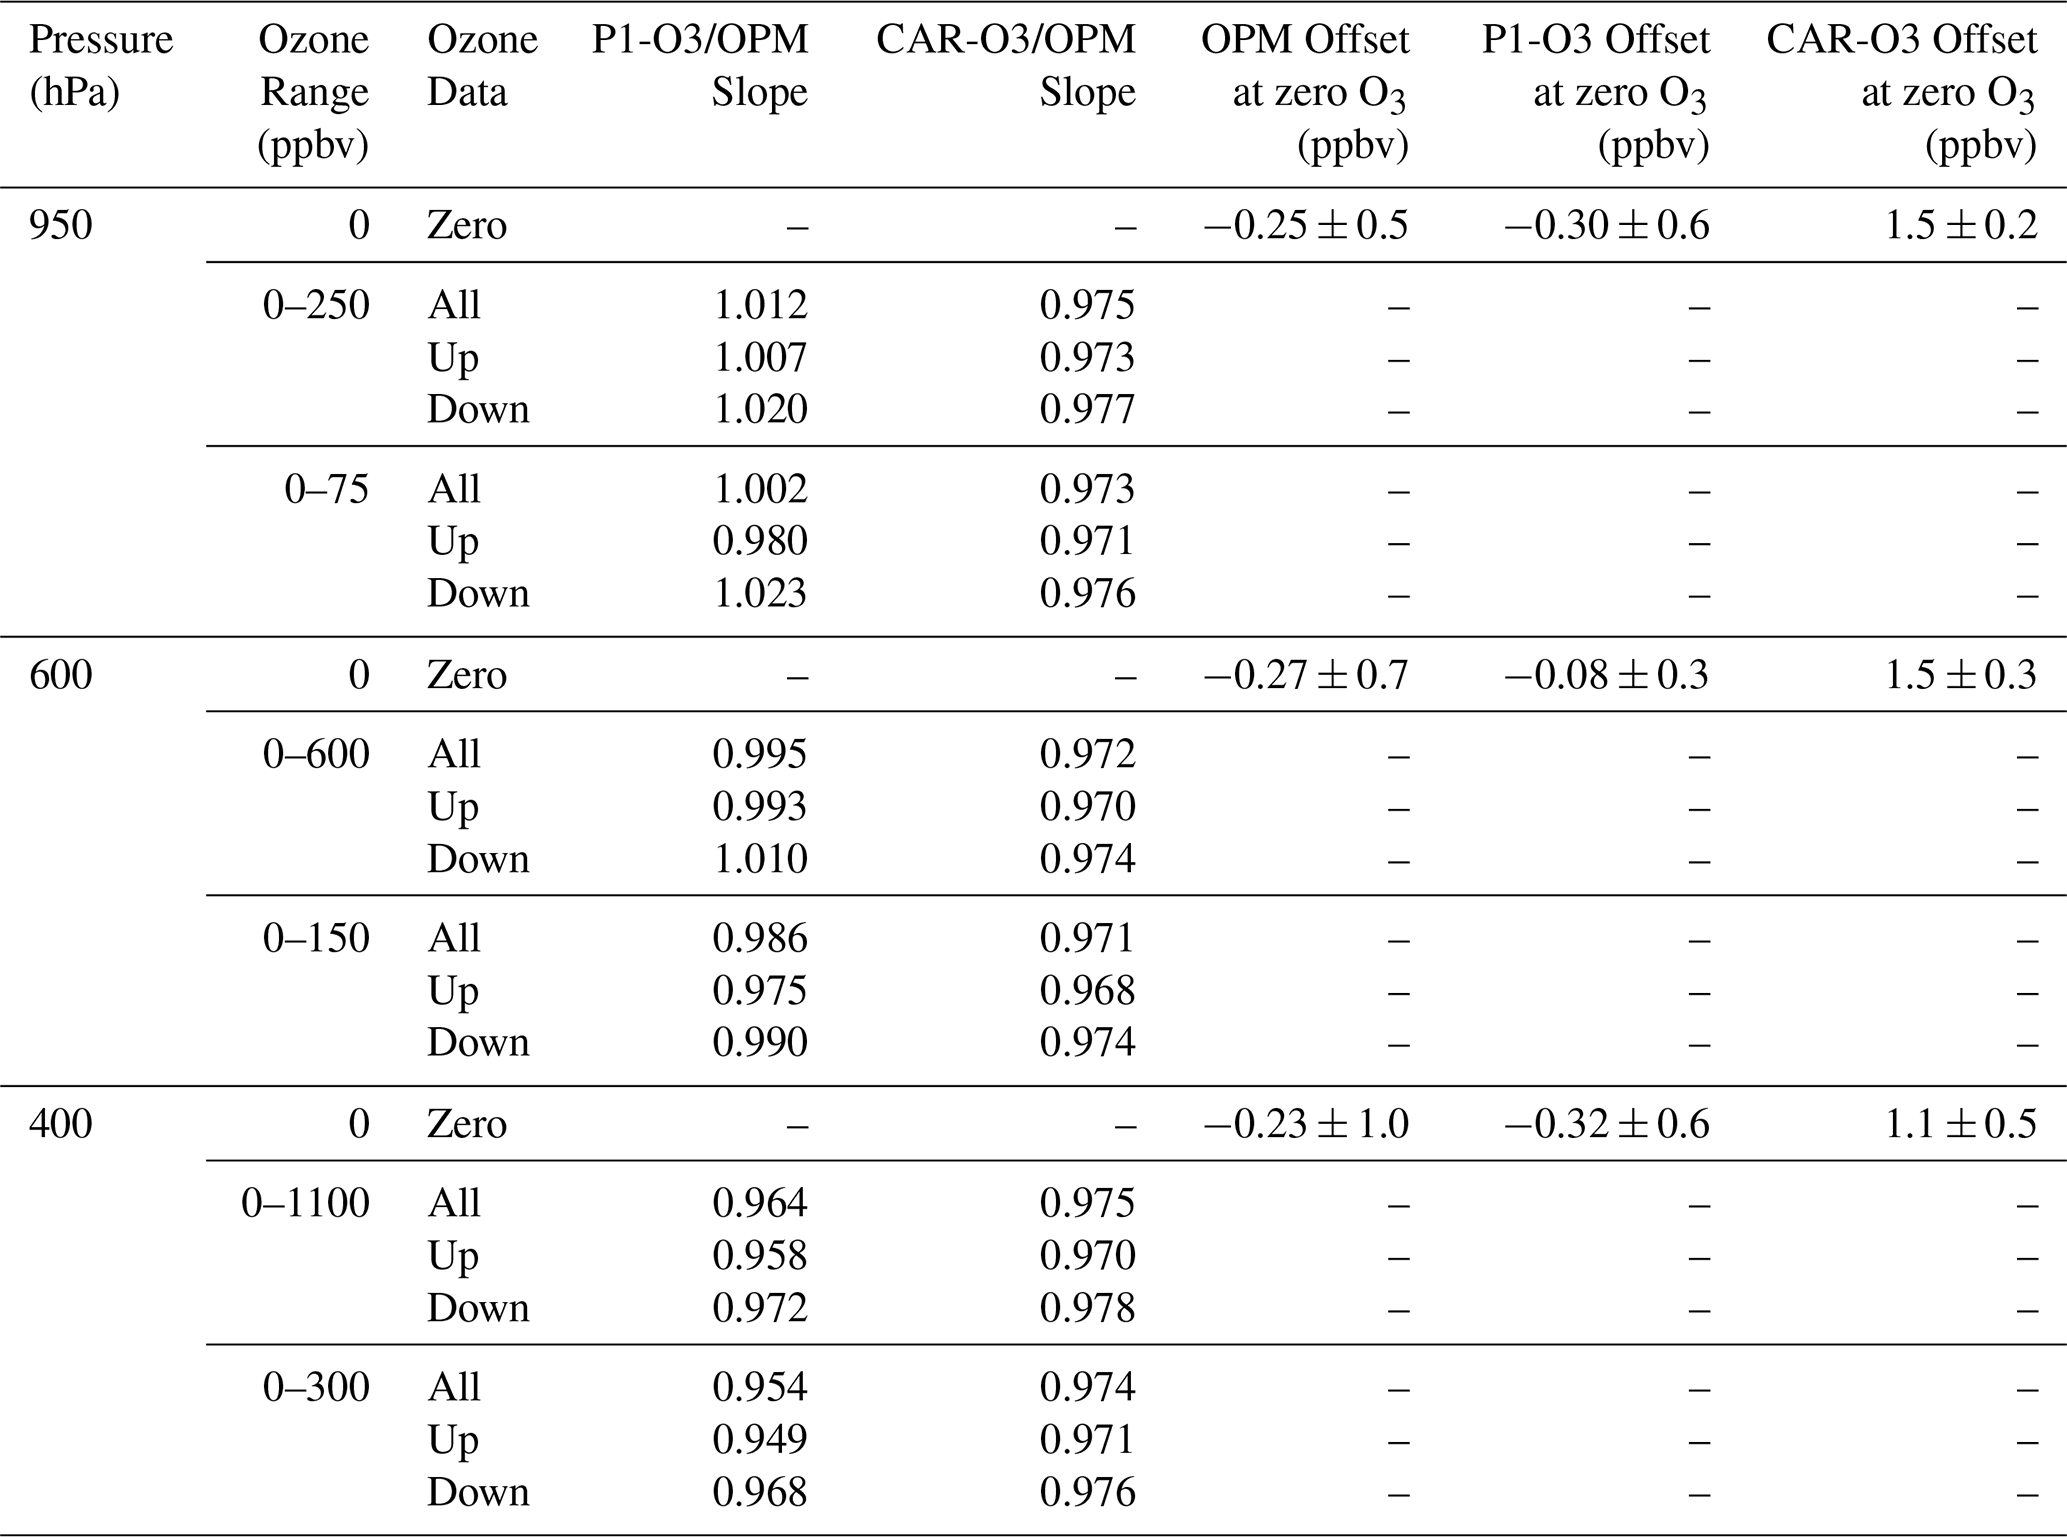
The results for each pressure level (950, 600 and 400 hPa) are summarized in Table 3, once for the entire ozone VMR range and once for the lower ozone VMR level. The offsets of the instruments have been determined in the periods when measuring zero ozone air by averaging over 5 min intervals (Fig. 9, upper panel, left vertical coordinate). At each pressure level the slope has been derived from a linear curve fit of the scatter plots of P1-O3 and CAR-O3 versus OPM (Fig. 10). To investigate any hysteresis effect, the slopes have been determined also for the upward step ozone levels and downward step levels, the corresponding figures are shown in the Supplement (Figs. S1 and S2 for P1-O3 and CAR-O3 against OPM, respectively). All results of slopes and offsets are summarized in Table 3.
From Table 3 it is seen that the behaviour between the three instruments observed at ozone levels larger than about 100 ppbv is consistent with the results obtained from the Exp. no. 3 and Exp. no. 4. At lower ozone values below 100 ppbv, however, the slopes for P1-O3/OPM differ slightly by −(1 %–2 %) compared to their corresponding slopes of P1-O3/OPM derived for higher ozone values, respectively. Breaking down the slopes into the upward and downward part of the ozone step levels, P1-O3/OPM reveals a small hysteresis effect of about 2 % which is most pronounced in the lower range of ozone levels. CAR-O3 shows no hysteresis, neither at the higher nor at the lower ozone levels (Table 3 and Figs. S1 and S2 in the Supplement). The observed differences are not really understood but are still within the experimental reproducibility of about ±1 % as mentioned in Sect. 3.2.2.
3.3 Comparison CAR-O3 Versus OPM at 250–1000 hPa Pressure
3.3.1 Experiment no. 5: Discrete Pressure Levels (1000–250 hPa)
To simulate the real cruise altitude conditions for CAR-O3 (see Sect. 2.3.2), a simulation experiment was repeated at three different pressure levels (1000, 500 and 250 hPa), whereby the ozone volume mixing ratios were kept at levels between 150 and 250 ppbv. The P1-O3 did not participate in this comparison experiment because the low-pressure level of 250 hPa is not within the specification of the P1-Pump Box to operate against 1000 hPa laboratory pressure instead of 850 hPa cabin air (i.e., the pressure under real flight conditions, see Sect. 2.3.2). In this simulation the total volume flow rate of the OPS, ΦOPS is reduced to 12 vol. L min−1. The results are shown in Fig. 11.
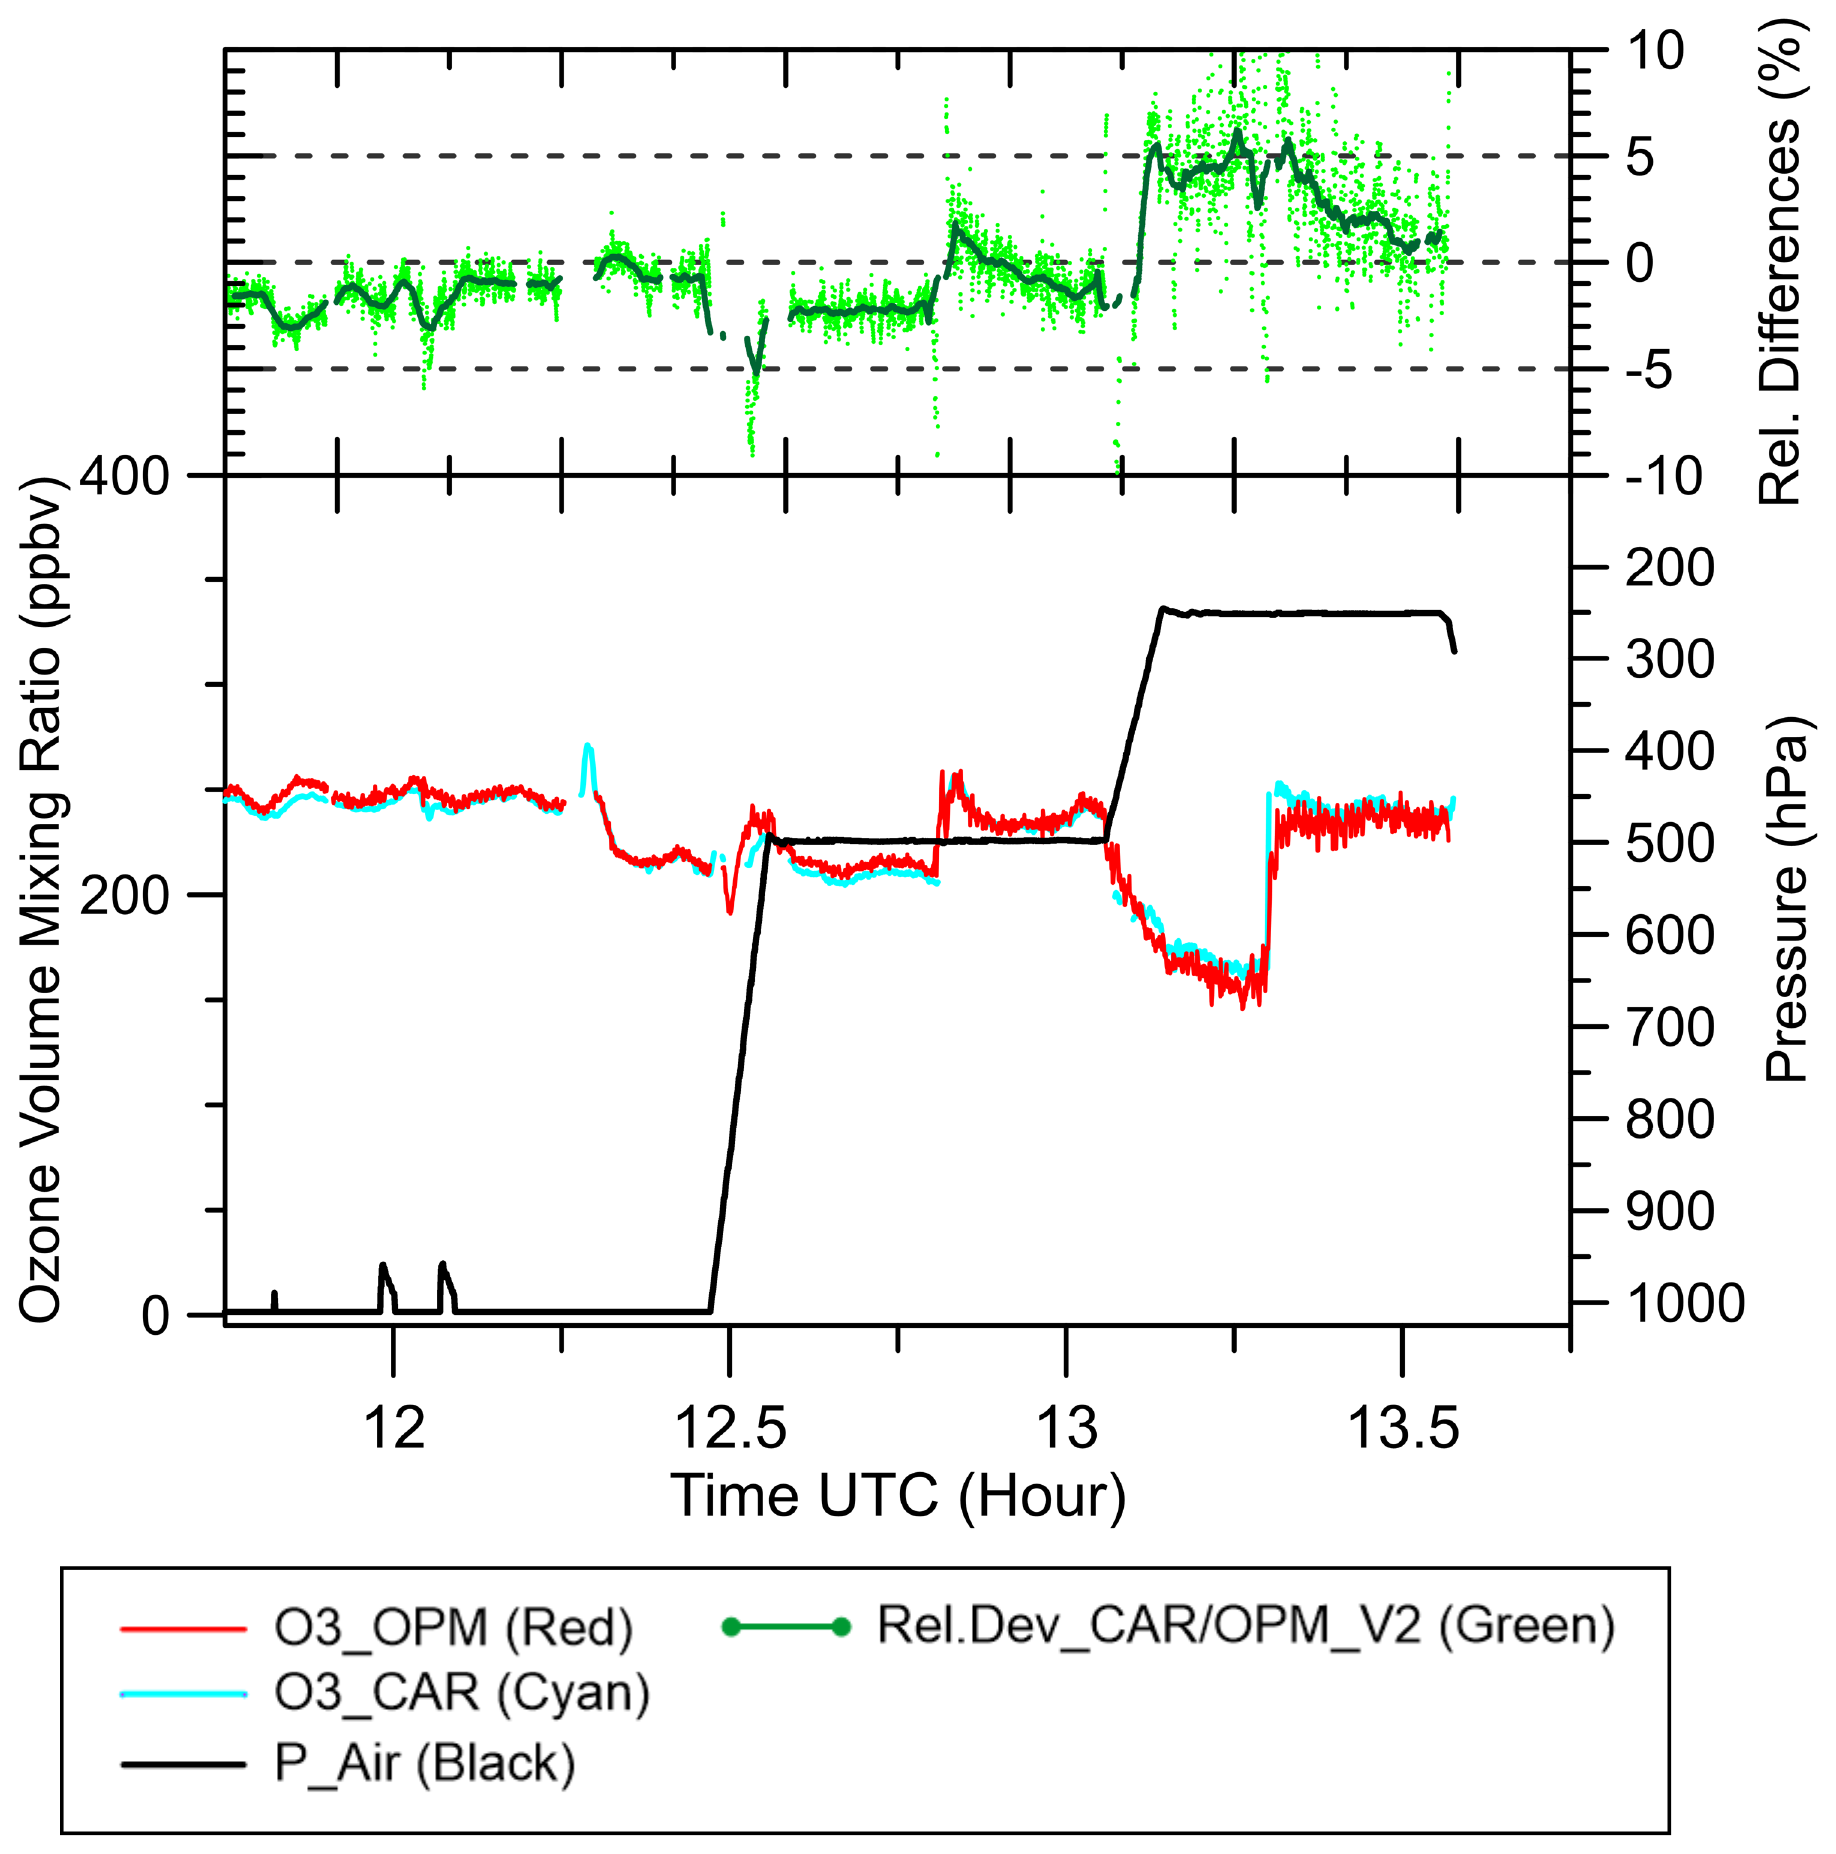
Figure 11Experiment no. 5: Time series of pressure (black) and ozone pressure (mPa) for CAR-O3 (cyan = light blue), OPM (red) and relative deviation of CAR-O3 to OPM (upper panel: green).
At 1000 and 500 hPa the results are very similar with the results of Exp. no. 3 and Exp. no. 4, while at 250 hPa initially CAR-O3 shows slight enhanced values of about +(4 %–5 %) compared to OPM, but after about 10 min, the difference declined to +(1 %–2 %). The cause of this behaviour has been investigated by evaluating the housekeeping data of both instruments (CAR-O3 and OPM) as well as the OPS and ESC; however, no indication of any malfunction of any of the components could be detected. The cause is still not understood; it is a subject for further detailed investigations.
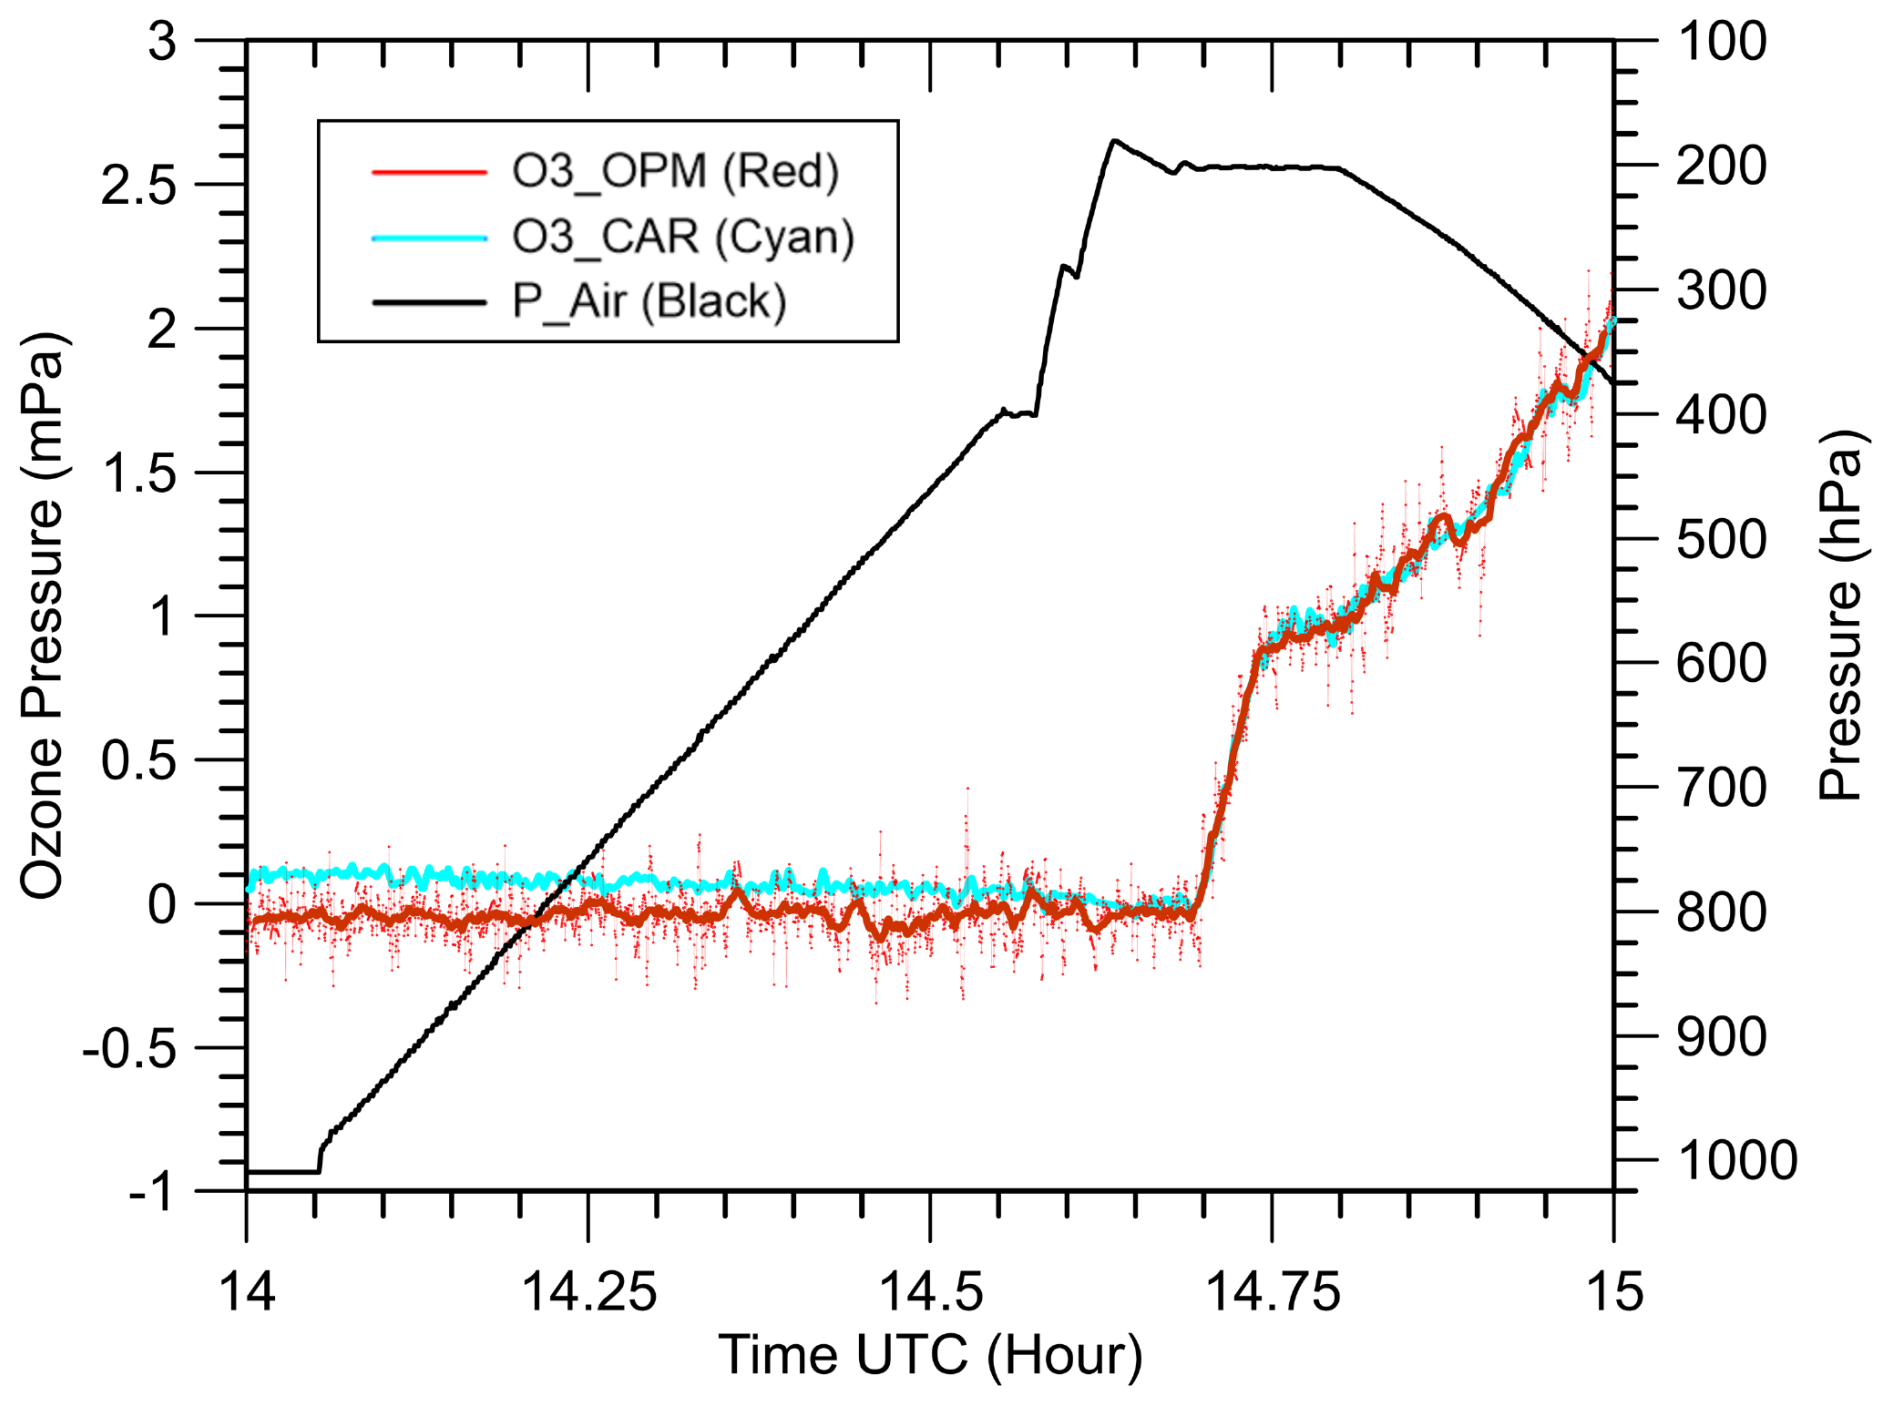
Figure 12Experiment no. 6: Time series of pressure (black) and ozone pressure (mPa) for CAR-O3 (cyan = light blue) and OPM (red), while ozone is kept initially at zero and after time = 14.70 (∼ 14:42 UTC) hour UTC ozone increased towards 2 mPa.
3.3.2 Experiment no. 6: Zero O3 Ascent (1000–180 hPa)
As shown in Fig. 12, in this experiment the ascent pressure (down to 200 hPa) was simulated while ozone was kept at zero to measure the zero signals of the CAR-O3 and OPM, while P1-O3 did not participate in the experiment. The OPM showed a small negative offset about −(0.02–0.05 mPa), but a rather noisy signal, unrealistic high and most likely due to the enhanced temperatures of the UV-light detector electronics exceeding the 50 °C threshold that occured during the experiment. The CAR-O3 showed a small positive offset of 0.1 mPa at 1000 hPa that vanishes towards lower pressures, which agrees with results of Exp. no. 7 (Table 3).
In general, the IAGOS-O3 instruments P1-O3 and CAR-O3 as well as the OPM showed consistent and good agreement among each other within a range better than about 5 %. CAR-O3 showed on average about −(1 %–2 %) deviation to the OPM, but no clear pressure dependence within the 1000 hPa down to 400 hPa range, while at 250 hPa CAR-O3 showed about 2 %–4 % more ozone than the OPM. P1-O3 showed a good performance with a moderate increasing pressure dependent O3 deviation to the OPM of about +2 % at 1000 hPa to −3 % at 400 hPa. The observed differences are small but systematic. The underlying causes should be better understood, also with respect to how far the observed results are consistent among the suite of instruments flown within IAGOS. Further, an experimental artefact of a few percent cannot be fully excluded, because we had to modify the WCCOS-JOSIE experimental setup to be able to adapt to the large sampling volume flow rate of about 24 vol. L min−1 of the P1-O3 (Sect. 2.3.1). However, no indications are found on any memory or hysteresis effects for both instruments. For IAGOS-O3 the long-term stability of the base line of the measured ozone records is extremely important to derive long term ozone changes of the order of one percent per decade.
Further, the intercomparison experiments here have shown that the reproducibility of the performance of the OPM as a standard, in combination with the experimental set up, within about ±1 %. A primary standard for O3-UV photometer measuring only exists at Earth surface conditions, a primary standard exists at the Bureau International des Poids et Mesures (BIPM), Paris, France, but not for the free atmosphere or at reduced pressure. Therefore, even all intercomparisons in the past like JOSIE (comparison of ozonesondes against OPM) as well as this study (IAGOS-O3 versus OPM) must be interpreted as being relative to each other. Hereby in this intercomparison the OPM acts as the reference instrument. However, it is an important gap in doing intercomparison studies like this that no ozone reference instrument running at reduced pressures exists at any National Metrological Institute in the world. For the global observation networks of measuring free atmospheric ozone concentrations, it is crucial to close this gap to harmonize long term ozone records from different platforms (e.g. aircraft or balloon sondes) to one reference standard.
This intercomparison is a first step with the goal to get the global ozone sonde data (GAW-NDACC-SHADOZ-GRUAN) and IAGOS-O3 (CORE & CARIBIC) data traceable to one common reference (OPM of WCCOS). While the aircraft and sonde measurements are often complementary, their records do not typically cover the same period. It is therefore essential to know and quantify potential biases and characteristics over time when merging their long-term records for process or trend studies. Tarasick et al. (2019) has evaluated earlier in-flight comparisons with ozonesonde measurements within a certain coincidence of space and time (Thouret et al., 1998; Staufer et al., 2013, 2014; Tanimoto et al., 2015) and found a consistent average relative positive bias of 5 %–10 % between the ozonesondes and IAGOS. In a most recent study (Wang et al., 2024) has confirmed and discussed this observed bias, but no conclusive explanation could be given. It is known that ozone sondes in the troposphere can overestimate ozone by up to 5 % (Smit et al., 2007, 2024; Thompson et al., 2019), while aircraft measurements may underestimate ozone due to wall losses when compressing the sampled air before measurement (Dias-Lalcaca et al., 1998; Brunner et al., 2001; Schnadt Poberaj et al., 2007). However, this intercomparison study has shown that a freshly serviced Pump Box compressing the sampled air to cabin air pressure conditions, before entering the P1-O3 monitor unit of P1-CORE-package, has only a small, in any, impact of less than 2 %–3 % compared to the total measurement error. Further investigations on the performance of the Pump Boxes are needed, particularly the ones which have been flown during long periods of IAGOS-CORE flight operation and thus may have been exposed to highly polluted air masses containing contaminants (e.g. aerosols) near airports during take-off or landing of the aircraft. A key question thereby is: Can these contaminants have an impact on the performance of P1-O3 or may the self-cleansing effect through high ozone concentrations, when flying in the stratosphere, be efficient enough that the impact is small or can be neglected?
A more regular validation of IAGOS-O3 on external consistency is therefore essential and could be achieved by regular comparisons of the IAGOS-O3 instruments together with ozonesondes against the OPM of the WCCOS in their environmental simulation chamber. This would be an important milestone in ozone research in the free troposphere and UTLS.
An important existing gap in doing intercomparison studies like this, however, is that no ozone reference instrument is running at reduced pressures at any National Metrological Institute in the world. For the global observation networks of measuring free atmospheric ozone, it is essential to close this gap in the future to enable the traceability of ozone measurements from different platforms to one reference standard, which is crucial to harmonize long-term ozone records and the detection of long term-changes in the free atmosphere.
However, a key gap in conducting such intercomparison studies is that no national metrology institute in the world is hosting and operating a reduced-pressure ozone reference instrument as the common primary standard. It is essential for global observation networks measuring free atmospheric ozone to close this gap in the future, enabling traceability of ozone measurements from different platforms to one reference standard. This is crucial for harmonizing long-term ozone records to detect long-term changes of ozone in the free atmosphere.
| ASOPOS | Assessment of Standard Operating Procedures for OzoneSondes |
| CARIBIC | Civil Aircraft for the Regular Investigation of the atmosphere Based on an Instrument Container |
| CCQM-GAWG | Consultative Committee for Amount of Substance: Metrology in Chemistry and Biology-Gas Analysis Working Group |
| CO | Carbon monoxide |
| DS | Design Study |
| ECC | Electrochemical Concentration Cell |
| ERI | European Research Infrastructure |
| ESC | Environmental Simulation Chamber |
| FTIR | Fourier Transform Infra-Red spectroscopy |
| FZJ | ForschungsZentrum Jülich |
| GAW | Global Atmosphere Watch |
| GCOS | Global Climate Observing System |
| GRUAN | GCOS Reference Upper Air Network |
| HALO | High Altitude and Long-Range Research Aircraft |
| IAGOS | In-service Aircraft for a Global Observing System |
| INSU | Institut National des Sciences de l'Univers |
| IPCC | Intergovernmental Panel on Climate Change |
| JOSIE | Jülich OzoneSonde Intercomparison Experiment |
| KIT | Karlsruher Institut für Technologie |
| LIDAR | Light Detection and Ranging |
| MOZAIC | Measurement of OZone and water vapor by Airbus In-service airCraft (now IAGOS) |
| NDACC | Network for the Detection of Atmospheric Composition Change |
| OPM | Ozone PhotoMeter instrument (used as UV-reference for ECC-ozonesondes at WCCOS) |
| OPS | Ozone Profile Simulator |
| SHADOZ | Southern Hemisphere ADditional OZonesondes |
| SPARC | Stratosphere-troposphere Processes And their Role in Climate |
| STP | Standard Temperature (= 273.15 K) and Pressure (= 1013.25 hPa) conditions |
| TEI | Thermo Environmental Instruments |
| TOAR | Tropospheric Ozone Assessment Report |
| UNEP | United Nations Environment Programme |
| UTC | Coordinated Universal Time |
| UV | Ultra-Violet |
| VMR | Volume Mixing Ratio |
| WCCOS | World Calibration Centre for OzoneSonde |
| WMO | World Meteorological Organization |
The software code can be provided on request by Herman G. J. Smit.
All the data used in this study is available at the IAGOS-data base at https://doi.org/10.25326/813 (last access: 26 September 2025).
The supplement related to this article is available online at https://doi.org/10.5194/amt-18-4985-2025-supplement.
The concept of this study was developed and worked out by HGJS, AZ and RB; data collection and processing TG, HGJS, FO, RB and JMC; data analysis by HGJS, FO and RB; preparation of the manuscript has been led by HGJS with the support of all co-authors. Data provision by HGJS (OPM and WCCOS data), AZ (IAGOS: CAR-O3) and RB (IAGOS: P1-O3).
At least one of the (co-)authors is a member of the editorial board of Atmospheric Measurement Techniques. The peer-review process was guided by an independent editor, and the authors also have no other competing interests to declare.
Publisher's note: Copernicus Publications remains neutral with regard to jurisdictional claims made in the text, published maps, institutional affiliations, or any other geographical representation in this paper. While Copernicus Publications makes every effort to include appropriate place names, the final responsibility lies with the authors. Also, please note that this paper has not received English language copy-editing.
This article is part of the special issue “Tropospheric Ozone Assessment Report Phase II (TOAR-II) Community Special Issue (ACP/AMT/BG/GMD inter-journal SI)”. It is a result of the Tropospheric Ozone Assessment Report, Phase II (TOAR-II, 2020–2024).
The WCCOS has been sponsored by the Forschungszentrum Jülich GmbH and WMO-GAW. IAGOS is supported by the European Commission, Airbus and the airlines (Deutsche Lufthansa, Air France, Austrian Airlines, Air Namibia, Cathay Pacific, Iberia, China Airlines, Hawaiian Airlines, and Air Canada so far) that have carried the MOZAIC or IAGOS equipment and performed the maintenance since 1994. IAGOS has been funded by the European Union projects IAGOS-DS and IAGOS-ERI. Additionally, IAGOS has been funded by INSU-CNRS (France), Météo-France, Université Paul Sabatier (Toulouse, France), Forschungszentrum Jülich GmbH and Karlsruher Institut für Technologie. The IAGOS database is supported in France by AERIS (https://www.aeris-data.fr, last access: 20 September 2025).
This research has been supported by the CNRS, Forschungszentrum Jülich (FZJ), and Karlsruher Institut für Technologie (KIT).
The article processing charges for this open-access publication were covered by the Forschungszentrum Jülich.
This paper was edited by Troy Thornberry and reviewed by two anonymous referees.
Ancellet, G. and Ravetta, F. : Compact airborne lidar for tropospheric ozone: description and field measurements, Appl. Opt. 37, 5509–5521, https://doi.org/10.1364/AO.37.005509, 1998.
Blot, R., Nedelec, P., Boulanger, D., Wolff, P., Sauvage, B., Cousin, J.-M., Athier, G., Zahn, A., Obersteiner, F., Scharffe, D., Petetin, H., Bennouna, Y., Clark, H., and Thouret, V.: Internal consistency of the IAGOS ozone and carbon monoxide measurements for the last 25 years, Atmos. Meas. Tech., 14, 3935–3951, https://doi.org/10.5194/amt-14-3935-2021, 2021.
Brenninkmeijer, C. A. M., Crutzen, P. J., Immelmann, T. Z., Kersting, D., Maiss, M., Nolle, M., Pitscheider, A., Pohlkamp, H., Scharffe, D., Specht, K., and Wiedensohler, A.: CARIBIC – Civil aircraft for global measurement of trace gases and aerosols in the tropopause region, J. Atmos. Ocean. Tech., 16, 1373–1383, 1999.
Brenninkmeijer, C. A. M., Crutzen, P., Boumard, F., Dauer, T., Dix, B., Ebinghaus, R., Filippi, D., Fischer, H., Franke, H., Frieβ, U., Heintzenberg, J., Helleis, F., Hermann, M., Kock, H. H., Koeppel, C., Lelieveld, J., Leuenberger, M., Martinsson, B. G., Miemczyk, S., Moret, H. P., Nguyen, H. N., Nyfeler, P., Oram, D., O'Sullivan, D., Penkett, S., Platt, U., Pupek, M., Ramonet, M., Randa, B., Reichelt, M., Rhee, T. S., Rohwer, J., Rosenfeld, K., Scharffe, D., Schlager, H., Schumann, U., Slemr, F., Sprung, D., Stock, P., Thaler, R., Valentino, F., van Velthoven, P., Waibel, A., Wandel, A., Waschitschek, K., Wiedensohler, A., Xueref-Remy, I., Zahn, A., Zech, U., and Ziereis, H.: Civil Aircraft for the regular investigation of the atmosphere based on an instrumented container: The new CARIBIC system, Atmos. Chem. Phys., 7, 4953–4976, https://doi.org/10.5194/acp-7-4953-2007, 2007.
Brunner, D., Staehelin, J., Jeker, D., Wernli, H., and Schumann, U.: Nitrogen oxides and ozone in the tropopause region of the Northern Hemisphere: Measurements from commercial aircraft in 1995/96 and 1997, J. Geophys. Res., 106, 27673–27699, 2001.
CCQM-GAWG, 2024/03: Guidelines how to implement the new absorption cross section for ozone concentration measurements, https://www.bipm.org/documents/d/guest/rapportbipm2024-03 (last access: 20 September 2025), 2024.
Cohen, Y., Petetin, H., Thouret, V., Marécal, V., Josse, B., Clark, H., Sauvage, B., Fontaine, A., Athier, G., Blot, R., Boulanger, D., Cousin, J.-M., and Nédélec, P.: Climatology and long-term evolution of ozone and carbon monoxide in the upper troposphere–lower stratosphere (UTLS) at northern midlatitudes, as seen by IAGOS from 1995 to 2013, Atmos. Chem. Phys., 18, 5415–5453, https://doi.org/10.5194/acp-18-5415-2018, 2018.
Cooper, O. R., Parrish, D. D., Ziemke, J., Balashov, N. V., Cupeiro, M., Galbally, I. E., Gilge, S., Horowitz, L., Jensen, N. R., Lamarque, J.-F., Naik, V., Oltmans, S. J., Schwab, J., Shindell, D. T., Thompson, A. M., Thouret, V., Wang, Y., and Zbinden, R. M.: Global distribution and trends of tropospheric ozone: An observation-based review, Elementa Sci. Anthropocene, 2, 000029, https://doi.org/10.12952/journal.elementa.000029, 2014
Dias-Lalcaca, P., Brunner, D., Imfeld, W., Moser, W., and Staehelin, J.: An Automated System for the Measurement of Nitrogen Oxides and Ozone Concentrations from a Passenger Aircraft: Instrumentation and First Results of the NOXAR Project, Env. Sci. Tech., 32, 3228–3236, 1998.
Gaudel, A., Cooper, O. R., Chang, K.-L., Bourgeois, I., Ziemke, J. R., Strode, S. A., Oman, L. D., Sellitto, P., Nédélec, P., Blot, R., Thouret, V., and Granier, C.: Aircraft observations since the 1990s reveal increases of tropospheric ozone at multiple locations across the Northern Hemisphere, Science Advances, 6, https://doi.org/10.1126/sciadv.aba8272, 2020.
Hearn, A. G.: Absorption of ozone in ultra-violet and visible regions of spectrum, Proc. Phys. Soc., 78, 932–940, 1961.
Hodges, J. T., Viallon, J., Brewer, P. J., Drouin, B. J., Gorshelev, V., Janssen, C., Lee, S., Possolo, A., Smith, M. A. H., Walden, J., and Wielgosz, R. I.: Recommendation of a consensus value of the ozone absorption cross section at 253.65 nm based on a literature review, Metrologia, 56, 03400, https://doi.org/10.1088/1681-7575/ab0bdd, 2019.
Hu, L., Jacob, D. J., Liu, X., Zhang, Y., Zhang., L., Kim, P. S., Sulprizio, M. P., and Yantosca, R. M.: Global budget of tropospheric ozone: Evaluating recent model advances with satellite (OMI), aircraft (IAGOS), and ozonesonde observations, Atm. Env., 167, 323–334, https://doi.org/10.1016/j.atmosenv.2017.08.036, 2017.
IPCC: The Physical Science Basis. Contribution of Working Group I to the Sixth Assessment Report of the Intergovernmental Panel on Climate Change, edited by: Masson-Delmotte, V., Zhai, P., Pirani, A., Connors, S.L., Péan, C., Berger, S., Caud, N., Chen, Y., Goldfarb, L., Gomis, M. I., Huang, M., Leitzell, K., Lonnoy, E., Matthews, J. B. R., Maycock, T. K., Waterfield, T., Yelekçi, O., Yu, R., and Zhou, B., Cambridge University Press, Cambridge, United Kingdom and New York, NY, USA, https://doi.org/10.1017/9781009157896, 2023.
Marenco, A., Thouret, V., Nédélec, P., Smit, H., Helten, M., Kley, D., Karcher, F., Simon, P., Law, K., Pyle, J., Poschmann, G., Von Wrede, R., Hume, C., and Cook, T.: Measurement of ozone and water vapor by Airbus in-service aircraft: The MOZAIC airborne program, An overview, J. Geophys. Res., 103, 25631–25642, 1998.
McDermid, I. S., Haner, D. A., Kleiman, M. M., Walsh, T. D., and White, M. L.: Differential absorption lidar systems for tropospheric and stratospheric ozone measurements, Opt. Engin., 30, 22–30, 1991.
Nédélec, P., Blot, R., Boulanger, D., Athier, G., Cousin, J.-M., Gautron, B., Petzold, A., Volz-Thomas, A., and Thouret, V., Instrumentation on commercial aircraft for monitoring the atmospheric composition on a global scale: the IAGOS system, technical overview of ozone and carbon monoxide measurements, MOZAIC-IAGOS special issue, Tellus B, 67, 27791, https://doi.org/10.3402/tellusb.v67.27791, 2015.
Obersteiner, F.: FAIROmeta (v0.1.8), Zenodo [data set], https://doi.org/10.5281/zenodo.11104076, 2024.
Petetin, H., Thouret, V., Athier, G., Blot, R., Boulanger, D., Cousin, J.-M., Gaudel, A., Nédélec, P., and Cooper, O.: Diurnal cycle of ozone throughout the troposphere over Frankfurt as measured by MOZAIC-IAGOS commercial aircraft, Elementa, 4, https://doi.org/10.12952/journal.elementa.000129, 2016.
Petzold, A., Thouret, V., Gerbig, C., Zahn, A., Brenninkmeijer, C. A. M., Gallagher, M., Hermann, M., Pontaud, M., Ziereis, H., Boulanger, D., Marshall, J., Nédélec, P., Smit, H. G. J., Frieß, U., Flaud, J.-M., Wahner, A., Cammas, J.-P., Volz-Thomas, A., and IAGOS Team: Global-Scale Atmosphere Monitoring by In-Service Aircraft – Current Achievements and Future Prospects of the European Research Infrastructure IAGOS, Tellus-B, 67, 28452, https://doi.org/10.3402/tellusb.v67.28452, 2015.
Petzold, A., Bundke, U., Hienola, A., Laj, P., Lund Myhre, C., Vermeulen, A., Adamaki, A., Kutsch, W., Thouret, V., Boulanger, D., Fiebig, M., Stocker, M., Zhao, Z., and Asmi, A.: Opinion: New directions in atmospheric research offered by research infrastructures combined with open and data-intensive science, Atmos. Chem. Phys., 24, 5369–5388, https://doi.org/10.5194/acp-24-5369-2024, 2024.
Proffitt, M. H. and McLaughlin, R. J.: Fast response dual-beam UV-absorption photometer suitable for use on stratospheric balloons, Rev. Sci. Instr., 54, 1719–1728, 1983.
Schnadt Poberaj, C., Staehelin, J., Brunner, D., Thouret, V., and Mohnen, V.: A UT/LS ozone climatology of the nineteen seventies deduced from the GASP aircraft measurement program, Atmos. Chem. Phys., 7, 5917–5936, https://doi.org/10.5194/acp-7-5917-2007, 2007.
Schneider, M., Blumenstock, T., Hase, F., Höpfner, M., Cuevas, E., Redondas, A., and Sancho, J. M.: Ozone profiles and total column amounts derived at Izana Tenerife Island, from FTIR solar absorption spectra, and its validation by an intercomparison to ECC-sonde and Brewer spectrometer measurements, J. Quant. Spectros. Radiat. Transfer, 245–274, https://doi.org/10.1016/j.jqsrt.2004.05.067, 2005.
Smit, H. G. J., Sträter, W., Helten, M., and Kley, D.: Environmental Simulation Facility to Calibrate Airborne Ozone and Humidity Sensors, Jül Berichte, No. 3796, Forschungszentrum Jülich, ISSN 0944-2952, 2000.
Smit, H. G. J., Sträter, W., Johnson, B. J., Oltmans, S. J., Davies, J., Tarasick, D. W., Högger, B., Stübi, R., Schmidlin, F. J., Northam, T., Thompson, A. M., Witte, J. C., Boyd, I., and Posny, F.: Assessment of the performance of ECC ozonesondes under quasi-flight conditions in the environmental simulation chamber: Insights from the Jülich Ozone Sonde Intercomparison Experiment (JOSIE), J. Geophys. Res., 112, D19306, https://doi.org/10.1029/2006JD007308, 2007.
Smit, H. G. J., Thompson, A. M., and the ASOPOS 2.0 Panel: Ozonesonde Measurement Principles and Best Operational Practices, WMO Global Atmosphere Watch Report Series, No. 268, World Meteorological Organization, Geneva, https://library.wmo.int/idurl/4/57720 (last access: 10 December 2023), 2021.
Smit, H. G. J., Poyraz, D., Van Malderen, R., Thompson, A. M., Tarasick, D. W., Stauffer, R. M., Johnson, B. J., and Kollonige, D. E.: New insights from the Jülich Ozone Sonde Intercomparison Experiment: calibration functions traceable to one ozone reference instrument, Atmos. Meas. Tech., 17, 73–112, https://doi.org/10.5194/amt-17-73-2024, 2024.
Staufer, J., Staehelin, J., Stübi, R., Peter, T., Tummon, F., and Thouret, V.: Trajectory matching of ozonesondes and MOZAIC measurements in the UTLS – Part 1: Method description and application at Payerne, Switzerland, Atmos. Meas. Tech., 6, 3393–3406, https://doi.org/10.5194/amt-6-3393-2013, 2013.
Staufer, J., Staehelin, J., Stübi, R., Peter, T., Tummon, F., and Thouret, V.: Trajectory matching of ozonesondes and MOZAIC measurements in the UTLS – Part 2: Application to the global ozonesonde network, Atmos. Meas. Tech., 7, 241–266, https://doi.org/10.5194/amt-7-241-2014, 2014.
Tarasick, D., Galbally, I. E., Cooper, O. R., Schultz, M. G., Ancellet, G., Leblanc, T., Wallington, T. J., Ziemke, J., Liu, X., Steinbacher, M., Staehelin, J., Vigouroux, C., Hannigan, J. W., García, O., Foret, G., Zanis, P., Weatherhead, E., Petropavlovskikh, I., Worden, H., Osman, M., Liu, J., Chang, K.-L., Gaudel, A., Lin, M., Granados-Muñoz, M., Thompson, A. M., Oltmans, S. J., Cuesta, J., Dufour, G., Thouret, V., Hassler, B., Trickl, T., and Neu, J. L.: Tropospheric Ozone Assessment Report: Tropospheric ozone from 1877 to 2016, observed levels, trends and uncertainties, Elementa: Science of the Anthropocene, 7, 39, https://doi.org/10.1525/elementa.376, 2019.
Tanimoto, H., Zbinden, R. M., Thouret, V., and Nédélec, P.: Consistency of tropospheric ozone observations made by different platforms and techniques in the global databases, Tellus B, 67, 27073, https://doi.org/10.3402/tellusb.v67.27073, 2015.
Thompson, A. M.: The oxidizing capacity of the earth's atmosphere: Probably past and future changes, Science, 256, 1157–1165, 1992.
Thompson, A. M., Smit, H. G. J., Witte, J. C., Stauffer, R. M., Johnson, B. J., Morris, G. A., von der Gathen, P., Van Malderen, R., Davies, J., Piters, A., Allaart, M., Posny, F., Kivi, R., Cullis, P., Nguyen T. H. Ahn, Corrales, E., Machinini, T., DaSilva, F. R., Paiman, G., Thiong'o, K., Zainal, A., Brothers, G. B., Wolff, K. R., Nakano, T., Stübi, R., Romanens, G., Coetzee, G. J. R., Diaz, J. A., Mitro, S., Mohamad, M., and Ogino, S.-Y.: Ozonesonde quality assurance: The JOSIE-SHADOZ (2017) experience, Bull. Amer. Met. Soc., 100, https://doi.org/10.1175/BAMS-D-17-0311.1, 2019.
Thouret, V., Marenco, A., Logan, J. A., Nédélec, P., and Grouhel, C.: Comparisons of ozone measurements from the MOZAIC airborne program and the ozone sounding network at eight locations, J. Geophys. Res., 103, 25695–25720, 1998.
Van Malderen, R., Thompson, A. M., Kollonige, D. E., Stauffer, R. M., Smit, H. G. J., Maillard Barras, E., Vigouroux, C., Petropavlovskikh, I., Leblanc, T., Thouret, V., Wolff, P., Effertz, P., Tarasick, D. W., Poyraz, D., Ancellet, G., De Backer, M.-R., Evan, S., Flood, V., Frey, M. M., Hannigan, J. W., Hernandez, J. L., Iarlori, M., Johnson, B. J., Jones, N., Kivi, R., Mahieu, E., McConville, G., Müller, K., Nagahama, T., Notholt, J., Piters, A., Prats, N., Querel, R., Smale, D., Steinbrecht, W., Strong, K., and Sussmann, R.: Global ground-based tropospheric ozone measurements: reference data and individual site trends (2000–2022) from the TOAR-II/HEGIFTOM project, Atmos. Chem. Phys., 25, 7187–7225, https://doi.org/10.5194/acp-25-7187-2025, 2025.
Vigouroux, C., De Mazière, M., Demoulin, P., Servais, C., Hase, F., Blumenstock, T., Kramer, I., Schneider, M., Mellqvist, J., Strandberg, A., Velazco, V., Notholt, J., Sussmann, R., Stremme, W., Rockmann, A., Gardiner, T., Coleman, M., and Woods, P.: Evaluation of tropospheric and stratospheric ozone trends over Western Europe from ground-based FTIR network observations, Atmos. Chem. Phys., 8, 6865–6886, https://doi.org/10.5194/acp-8-6865-2008, 2008.
Wagner, A., Bennouna, Y., Blechschmidt, A.-M., Brasseur, G., Chabrillat, S., Christophe, Y., Errera, Q., Eskes, H., Flemming, J., Hansen, K. M., Inness, A., Kapsomenakis, J., Langerock, B., Richter, A., Sudarchikova, N., Thouret, V., and Zerefos, C.: Comprehensive evaluation of the Copernicus Atmosphere Monitoring Service (CAMS) reanalysis against independent observations, Elementa, 9, https://doi.org/10.1525/elementa.2020.00171, 2021.
Wang, H., Lu, X., Jacob, D. J., Cooper, O. R., Chang, K.-L., Li, K., Gao, M., Liu, Y., Sheng, B., Wu, K., Wu, T., Zhang, J., Sauvage, B., Nédélec, P., Blot, R., and Fan, S.: Global tropospheric ozone trends, attributions, and radiative impacts in 1995–2017: an integrated analysis using aircraft (IAGOS) observations, ozonesonde, and multi-decadal chemical model simulations, Atmos. Chem. Phys., 22, 13753–13782, https://doi.org/10.5194/acp-22-13753-2022, 2022.
Wang, H., Tarasick, D. W., Liu, J., Smit, H. G. J., Van Malderen, R., Shen, L., Blot, R., and Zhao, T.: Consistency evaluation of tropospheric ozone from ozonesonde and IAGOS (In-service Aircraft for a Global Observing System) observations: vertical distribution, ozonesonde types, and station–airport distance, Atmos. Chem. Phys., 24, 11927–11942, https://doi.org/10.5194/acp-24-11927-2024, 2024.
Wilson, K. L. and Birks, J. W.: Mechanism and Elimination of a Water Vapor Interference in the Measurement of Ozone by UV Absorbance, Env. Sci. Tech., 40, 6361–6367, https://doi.org/10.1021/es052590c, 2006.
WMO/UNEP: Scientific Assessment of Ozone Depletion: 2022, Ozone Research and Monitoring, GAW Report No. 278, World Meteorological Organization, Geneva, ISBN 978-9914-733-97-6, https://library.wmo.int/idurl/4/58360 (last access: 10 December 2023), 2023.
Zahn, A.: Standard Operating Procedure (SOP) of the IAGOS-CARIBIC Ozone Instrument, IAGOS-Technical Document [report], Aeris, https://doi.org/10.25326/814#v1.0 (last access: 26 September 2025), 2016.
- Abstract
- Introduction
- Experimental Details
- Results
- Discussion, Conclusions and Recommendations
- Appendix A: List of Acronyms
- Code availability
- Data availability
- Author contributions
- Competing interests
- Disclaimer
- Special issue statement
- Acknowledgements
- Financial support
- Review statement
- References
- Supplement