the Creative Commons Attribution 4.0 License.
the Creative Commons Attribution 4.0 License.
 | 02 Dec 2025
Closing the gap: an algorithmic approach to reconciling in-situ and remotely sensed aerosol properties
Joseph S. Schlosser
Sanja Dmitrovic
Ryan Bennett
Brian Cairns
Gao Chen
Glenn S. Diskin
Richard A. Ferrare
Johnathan W. Hair
Michael A. Jones
Jeffrey S. Reid
Taylor J. Shingler
Michael A. Shook
Armin Sorooshian
Kenneth L. Thornhill
Luke D. Ziemba
Snorre Stamnes
Remote sensing retrievals of atmospheric particle (i.e., aerosol) properties, such as those from lidars and polarimeters, are increasingly used to study aerosol effects on critical cloud and marine boundary layer processes. To ensure the reliability of these retrievals, it is important to validate them using aerosol measurements from in-situ instruments (i.e., external closure). However, achieving rigorous external closure is challenging because in-situ instruments often (1) provide dry (relative humidity (RH) < 40 %) aerosol measurements, while remote sensors typically retrieve properties in ambient conditions and (2) only sample a limited aerosol size-range due to sampling inlet cutoffs. To address these challenges, we introduce the In-Situ Aerosol Retrieval Algorithm (ISARA), a methodological framework designed to enable closure between in-situ and remote sensing aerosol data by converting dry in-situ aerosol optical and microphysical properties into their humidified equivalents in ambient air. We apply ISARA to aerosol measurements collected during the NASA Aerosol Cloud meTeorology Interactions oVer the western ATlantic Experiment (ACTIVATE) field campaign to test its ability to generate aerosol properties that are physically consistent across in-situ and remote sensing platforms. To assess this performance, we conduct consistency analyses comparing ISARA-calculated intensive and extensive aerosol properties with corresponding measurements from (1) ACTIVATE's in-situ instruments (internal consistency), (2) Monte Carlo in-situ data simulations (synthetic consistency), (3) ACTIVATE's Second Generation High Spectral Resolution Lidar (HSRL-2) and Research Scanning Polarimeter (RSP) instruments (external consistency). This study demonstrates that: (1) appropriate a priori assumptions for aerosol can lead to consistency between many in-situ measurements and remote sensing retrievals in the ACTIVATE campaign, (2) ambient aerosol properties retrieved from dry in-situ and the RSP polarimetric data are compared showing reasonable agreement for the first time in literature, (3) measurements are externally consistent even in the presence of moderately absorbing (imaginary refractive index (IRI) > 0.015) and coarse nonspherical particles, and (4) ISARA is likely limited by (i) under-sampling of low background concentrations (N < 1 cm−3) for aerosol sizes greater than 5 µm in diameter as well as (ii) by an under-determined measurement system. These results suggest that additional in-situ measurements under ambient conditions, at a wider range of wavelengths, of the real refractive index, and of the coarse aerosol size distribution, can reduce the uncertainties of the in-situ ambient aerosol products. Although this study focuses on fine spherical aerosol mixtures with a coarse mode that is spherical or nonspherical (spheroidal), its success demonstrates that ISARA could have the potential to support systematic and physically consistent closure of aerosol data sets in various field campaigns and aerosol regimes.
- Article
(5304 KB) - Full-text XML
-
Supplement
(5150 KB) - BibTeX
- EndNote


Atmospheric particles (i.e., aerosols) play a central role in Earth's climate system by scattering and absorbing solar radiation (direct effect) and by serving as cloud condensation nuclei (CCN) that influence cloud formation and cloud radiative properties (indirect effect). Given their role in regulating Earth's radiation balance and cloud development, aerosols are the target of intensive observational efforts using instruments from ground-based, airborne, and satellite platforms. These observations are used to constrain global Earth system models that simulate aerosol radiative impacts and aerosol-cloud interactions. The instruments are designed to directly measure or indirectly retrieve the optical and microphysical properties of aerosol particles in the atmosphere. Because aerosol instruments have different designs and error characteristics, it is important to verify that aerosol measurements from one platform are consistent with those from another (i.e., external closure). External closure analysis can lead to improved physical consistency between different measurements and also advances aerosol science by enabling efforts to (1) validate the accuracy and uncertainty of satellite and airborne remote sensing aerosol products, (2) create improved a priori aerosol properties to better constrain satellite retrievals, (3) aid atmospheric modeling efforts by establishing new applications for remote sensing products such as deriving parameterizations of aerosol hygroscopicity, and (4) advance the methods used to derive ambient aerosol properties from in-situ measurements. This paper aims to address these needs in aerosol science by assessing the physical consistency between in-situ and remotely-sensed aerosol properties using data collected from two state-of-the-art remote sensing instruments: the Second Generation High Spectral Resolution Lidar (HSRL-2) and the Research Scanning Polarimeter (RSP). The HSRL-2 and RSP provide altitude-resolved and column retrievals, respectively, of aerosol optical and microphysical properties, among other products. Details on these instruments are provided in Sect. 3.2.
There have been numerous past efforts to assess consistency between aerosol data sets obtained from airborne in-situ and NASA's HSRL-2 and RSP instruments. For example, more recent works have attempted to demonstrate the consistency of airborne HSRL-2 extinction and backscatter coefficient measurements and HSRL-2-retrieved aerosol effective radius using collocated in-situ aerosol products (e.g., Müller et al., 2014; Sawamura et al., 2017; Tsekeri et al., 2017; Pistone et al., 2019). These studies consistently find that the extinction and backscatter coefficients derived from in-situ instruments are systematically low compared to those derived from HSRL-2. Additionally, evaluations of RSP retrievals of aerosol optical and microphysical properties have been performed using data from the AErosol RObotic NETwork (AERONET) (e.g., Wu et al., 2015; Fu et al., 2020). There have also been a limited number of case studies successfully making comparisons between RSP retrievals and airborne in-situ data from the Arctic Research of the Composition of the Troposphere from Aircraft and Satellites (ARCTAS; Knobelspiesse et al., 2011) and ObseRvations of Aerosols above CLouds and their intEractionS (ORACLES; Pistone et al., 2019) field campaigns. In particular, Pistone et al. (2019) found poor agreement between in-situ- and RSP-derived total (i.e., bulk) single scattering albedo (SSA). However, bulk, fine, and coarse aerosol microphysical properties from RSP have not been systematically evaluated against in-situ aerosol data as of the date of this study.
Despite the important findings from these studies, a framework for systematic and physically consistent closure of remote sensing aerosol data sets has not been yet achieved. Closure is challenging to perform due to the increasing volume and complexity of remote sensing data. Also, in-situ aerosol data sets can be affected by errors resulting from factors such as plumbing losses, calibration issues, and most importantly, the alteration of the aerosol's relative humidity (RH) while sampling through aircraft inlets. In order to avoid the complexities of RH variation, in-situ instruments will often dry the optical property and size distribution measurements of aerosols to the aerosol efflorescence regime, which has an RH range of 0 %–40 %). Note that 40 % RH is the minimum efflorescence point of the majority of atmospheric aerosol species (Li et al., 2014). This drying process is often achieved using a Nafion dryer or heating in the sampling line (Sorooshian et al., 2023).
Unlike the controlled environments of many in-situ instruments, remote sensors such as lidars and polarimeters retrieve aerosol properties without altering their RH (i.e., in ambient conditions). Although aircraft in-situ instruments can measure ambient RH and apply it to dry aerosol data sets, these RH measurements can have errors as high as 15 % (Diskin et al., 2002). Adding to this complexity, both parameterizations and measurements of hygroscopicity can also have a high uncertainty (Shingler et al., 2016; Petters and Kreidenweis, 2007). And, the variability in both RH and aerosol concentration can be substantial in and around clouds (Reid et al., 2025).
Aerosol hygroscopicity is commonly defined as the increase in aerosol diameter relative to the dry state due to atmospheric moisture, and is typically parameterized by the physical hygroscopicity parameter (κ; Petters and Kreidenweis, 2007). This physical hygroscopicity parameterization is indirectly related to changes in scattering coefficients, based on assumptions on aerosol shape. Alternatively, hygroscopicity can also be parameterized directly based on the increase in the aerosol scattering coefficient due to hygroscopic growth, referred to as the optical hygroscopicity parameter (γ; Sawamura et al., 2017). These parameterizations are discussed in more detail in Sect. 3.3.
In addition to the measurement limitations in measuring relative humidity and hygroscopicity, aerosols are lost between the external inlet of the aircraft and the inlets of the instruments (Baron and Willeke, 2001; Kulkarni et al., 2011). The other major difficulty of closure is that in-situ instruments placed behind inlets cannot efficiently sample coarse aerosols due to limitations in the inlet cutoff diameter (i.e., cutoff particle diameter (D) < 5 µm). Wing-mounted open-path probes are commonly used to estimate coarse aerosol properties, but are designed in such a way that coarse aerosol sizing is uncertain (e.g., Reid et al., 2003, 2006). The measurements of number concentration are less accurate for background concentrations (N < 1 cm−3), which is common for aerosol with diameters > 5 µm (Baumgardner et al., 2001). These sources of error can alter the measured or derived microphysical and optical characteristics of aerosol.
To strive toward physically consistent systematic closure of in-situ and remote sensing aerosol data sets within aircraft field campaigns, this study assesses the agreement between these two disparate measurement approaches, a process that is referred to as consistency or consistency analysis throughout this paper. To facilitate this comparison and eventually support broader closure efforts across field campaigns, we introduce the In-Situ Aerosol Retrieval Algorithm (ISARA), a retrieval algorithm that applies hygroscopic growth to dry in-situ aerosol and optical microphysical properties to derive ambient, humidified properties suitable for comparison with remote sensing retrievals. Specifically, the algorithm uses a Mie scattering library (e.g., Mishchenko et al., 2002; Bohren and Huffman, 2008) in conjunction with measured size distributions and optical coefficients to retrieve refractive indices and hygroscopicity from a “common” suite of in-situ instruments. This study builds on previous efforts such as Ziemba et al. (2013) and Sawamura et al. (2017) that developed similar algorithms for retrieving ambient aerosol properties from in-situ data. However, those studies focused on regions with limited coarse aerosol and, therefore, assumed negligible coarse contribution, and focused their analyses on ultrafine and fine aerosols.
Note that in this study, the fine regime is defined as an aerosol with an ambient diameter range of 0.09–1.00 µm and the coarse regime is defined as an aerosol with ambient diameters ≥ 1.0 µm. Common coarse species that can have diameters > 1.0 µm are sea salt, dust, and pollen (Hussein et al., 2005). As discussed above, the larger (D > 5 µm) sizes of these coarse species are difficult to measure in background concentrations. However, each species also poses a unique challenge from an optical perspective. Dry sea salt is nonspherical, non-absorbing, and very hygroscopic, translating to larger values of κ (Sorribas et al., 2015; Moosmüller and Sorensen, 2018; Ferrare et al., 2023). Similar to sea salt, dust can also be nonspherical. In contrast to sea salt, dust can be moderately absorbing and has a complex refractive index (CRI) that is dependent on wavelength (Voshchinnikov and Farafonov, 1993; Veselovskii et al., 2010; Wagner et al., 2012; Sorribas et al., 2015). This work uses wing-mounted open-path probes to estimate the contribution of the coarse aerosol on the calculated ambient optical and microphysical data (Ryder et al., 2015; Tsekeri et al., 2017; Ryder et al., 2018).
This work extends the methods established by Sawamura et al. (2017) by attempting to account for coarse aerosol in the bulk aerosol properties after retrieving the fine CRI and κ. Similar to the work of Tsekeri et al. (2017), we account for the contribution of coarse (ambient diameter > 1.0 µm) aerosols using wing probe measurements and a priori assumptions. While the current study focuses on the consistency analysis between in-situ- and remote sensing-derived aerosol properties of the more common spherical fine aerosols, significant effort is made to account for nonspherical coarse aerosols. It is hoped that the framework described in this study serves as an open source foundation that can be easily expanded and used to fully understand the information train between all manner of measurements and therefore enable systematic closure of field campaign aerosol data.
The ability of ISARA to perform consistency analyses is tested by applying the algorithm to synthesized data as well as data collected during the NASA Aerosol Cloud meTeorology Interactions oVer the western ATlantic Experiment (ACTIVATE) field campaign, a mission dedicated to characterizing aerosol-cloud-meteorology interactions by using two spatially-synchronized aircraft to provide systematic and simultaneous remote sensing and in-situ airborne measurements from 2020 to 2022 (Sorooshian et al., 2019). The spatial synchronization of these aircraft is ideal for performing a consistency analysis between in-situ, lidar, and polarimetric measurements since rigorous spatiotemporal collocation between these data sets can be achieved (Schlosser et al., 2024). The ACTIVATE data set also enables investigation of numerous atmospheric processes over the western North Atlantic Ocean, including aerosol-cloud interactions that represent the largest uncertainty in estimates of total anthropogenic radiative forcing (Field et al., 2014).
In addition to having a data set with ample amounts of collocated data, special effort was made to sample the North American anthropogenic outflow over the western North Atlantic Ocean (Sorooshian et al., 2019). The ultrafine and fine aerosol species of this anthropogenic outflow are predominantly composed of fresh or aged sulfate and organics (Dadashazar et al., 2022a), while the coarse aerosols are predominantly composed of sea salt. Although there are cases of various aerosol species that are sampled during ACTIVATE such as amines (Corral et al., 2022), dust (Ajayi et al., 2024), and smoke (Soloff et al., 2024), this study serves only to establish the utility of the ISARA and focuses on the less complex fine spherical aerosol species, while the coarse properties are prescribed based on a priori information. We purposely limit the scope of this study to these simpler aerosol species as part of a systematic approach to establish a baseline performance of ISARA before moving to more complex aerosol species. We also leave to future work the detailed analysis of the consistency between the ambient aerosol properties derived from in-situ ground site measurements and remote sensing measurements of coarse aerosol species. The ACTIVATE data set is discussed in more detail in Sect. 3.1.
With this overview, we introduce a three-fold consistency analysis framework to evaluate the performance and robustness of the ISARA algorithm. The central goal of consistency and closure efforts is to enable one-to-one comparisons between in-situ and remote sensing data sets. While ISARA is designed to account for differences in aerosol properties due to relative humidity, challenges remain in achieving true one-to-one comparison due to the difficulties in sampling and modeling coarse aerosols and statistical uncertainties in the retrievals themselves. It is important to note that ultimately, though perfect closure is likely impossible due to missing data on the fine aerosol refractive index and of the true size distribution of the coarse aerosol, we show that agreement between the derived aerosol properties can be achieved.
To assess whether ISARA produces aerosol properties that are accurate and quantitatively comparable across platforms, we perform three types of consistency analysis: (1) synthetic consistency, using Monte Carlo-generated data to test retrieval accuracy under controlled conditions; (2) internal consistency, comparing ISARA-derived aerosol properties with corresponding instrument measurements; and (3) external consistency, assessing agreement between ISARA-derived properties and remote sensing retrievals from HSRL-2 and RSP.
Section 2 provides a summary of a theoretical framework of aerosol properties. Section 3 includes: (1) ACTIVATE mission; (2) a description of relevant in-situ and remote sensing measurements; (3) ISARA methodology including retrieval descriptions for dry CRI and κ; (4) synthetic in-situ data generation; (5) HSRL-2 and RSP data processing including cloud filtering of remote sensing data and matching HSRL-2 data to the RSP resolution; and (6) collocation of in-situ data to the remote sensing data. Section 4 presents results of the synthetic, internal, and external measurement consistency analyses. The external measurement consistency analysis is conducted under ideal conditions defined as (1) good spatiotemporal collocation (defined as a spatiotemporal separation of < 6 min and < 15 km) between the platforms and (2) the absence of clouds within remote sensing retrievals and in-situ measurements. As part of the external consistency analysis, we present the results of two case studies as well as the results from a more general statistical analysis. Section 5 summarizes key points of this study and suggests potential avenues for future work.
While a comprehensive theoretical framework of aerosol properties is beyond the scope of this work, a brief summary is provided. Fundamentally, a aerosol's properties are defined by its size, shape, and composition. Atmospheric aerosols can vary in shape and morphology depending on their species and history, but they are typically categorized as spherical or nonspherical to first order. Aerosol size is described in terms of radius or diameter, however this becomes dependent on volume for nonspherical aerosols.
In cases of nonspherical aerosols, volume- or cross-section-equivalent diameters are sometimes used (Gasteiger and Wiegner, 2018). The cross-section-equivalent diameters are defined with respect to the orientation averaged cross-sectional area. For the purposes of this study, we define all of our nonspherical aerosol diameters in terms of cross-section-equivalent diameters (Dc) that are defined as follows:
where cg is the orientation averaged geometric cross-sectional area of the aerosol. Many ambient aerosol species are closely approximated by spherical aerosols with the notable exceptions of dust, fresh ash, dry sea salt, and pollen (Gasteiger et al., 2011; Bi et al., 2018; Cholleton et al., 2020). In is work we discuss spheroids in particular, which are stretched spheres. The eccentricity of a spheroid defines how far from a sphere the shape is stretched. an eccentricity of 1 indicates a sphere and the larger the eccentricity, the more stretched the spheroid is. Prolate spheroids are taller than they are wide, and oblate spheroids are wider than they are tall.
The composition of a aerosol defines the CRI, which is a complex number that depends on aerosol composition and is defined as follows:
where RRI and IRI are the real and imaginary components of CRI, respectively. The IRI indicates how much incoming light an aerosol absorbs and the RRI of an aerosol indicates how much of the incoming light is scattered. Size, shape, and CRI physically govern how an aerosol scatters and absorbs incoming light. Appendix A provides more detail on the mathematical description of the interaction between light and aerosol.
For aerosol that can be approximated as spheres, Mie theory provides a numerically exact approach to solving Eq. (A3) over a large aerosol size-range (Mie, 1908; Shingler et al., 2016). To model nonspherical aerosol shapes, a more sophisticated approach is required as each aerosol type has a different expected shape. One type of nonspherical shape approximation that is commonly used is a spheroid, which also has an exact solution (Sorribas et al., 2015; Unga et al., 2018). Some nonspherical shape approximations with stochastic solutions are cuboids and super-spheroids (Lin et al., 2018; Kahnert and Kanngießer, 2024). In addition, there are some limited stochastic solutions to more irregular shapes (Gasteiger et al., 2011). So far, we have defined the intensive properties of single particle; however, measurements of aerosol properties are done with respect to a ensemble of particles with various sizes and shapes.
Ensembles of aerosols can have extensive properties that are dependent on the quantity of aerosols that are present in addition to the averaging each aerosol's intensive properties. The extensive aerosol properties include number, volume, and surface area concentration as well as extinction, absorption, scattering, and backscatter coefficients. To integrate the intensive properties of in-situ size-distribution measurements of an ensemble of aerosols, we use Modeled Optical Properties of Ensembles of Aerosol Particles (MOPSMAP; Gasteiger and Wiegner, 2018) that is capable of resolving the intensive and extensive properties of a variety of shapes and sizes.
The spectral scattering and absorption efficiencies (Qscat and Qabs) can be integrated over the aerosol size distribution to compute the scattering and absorption coefficients (Cscat and Cabs, respectively):
where λ is the wavelength of the observation, dlog D is the logarithmic difference between the upper and lower diameter cutoffs of each bin, and n∘ is the logarithmic size-resolved aerosol number concentration. The integral bounds log 10Dmin and log 10Dmax correspond to the dlog D of the smallest and largest bins of the size distribution. The term n∘ is used per convention to represent the following:
where dN is the number of particles counted in a bin. Using these equations, we can “invert” the extensive measurements of absorption and scattering coefficients to determine the mean and spread of intensive properties of aerosol. This process is detailed in Sect. 3.3 along with mathematical definitions of the intensive and extensive ambient properties that are evaluated in this study.
In general, remote sensors are not as sensitive to aerosol number concentration as they are to aerosol surface area and volume concentrations. For remote sensing of fine and coarse aerosol, polarimeters and high-spectral-resolution lidar that operate in the visible to near-infrared part of the spectrum are sensitive to the aerosol effective radius, effective variance, real refractive index, and single-scattering albedo (Hansen and Travis, 1974; Burton et al., 2016; Stamnes et al., 2018). Given the sensitivity of remote sensors to both surface area and volume concentration, this work also discusses the lognormal size-resolved aerosol surface area and volume concentration (s∘ and v∘, respectively). Lognormal surface area concentration of aerosols in a given size-range is defined as follows:
Lognormal volume concentration of aerosols in a given size-range is defined as:
Another important aspect of aerosol properties is their interaction with water. As discussed above, ambient aerosol exist in the presence of water and it is necessary to understand how aerosol properties change as they uptake water. Water uptake by aerosol causes them to grow in size and alters their CRI. Depending on the aerosol species, the water can either solubilize the aerosol or the water can form a coating. For the purposes of this work we will not be considering aerosol coating and assume the aerosol and water are mixed.
First, we consider the impacts of water on aerosol size. Conceptually, hygroscopic growth results in the size distribution being shifted to the right by gf and the distribution will widen if the size distribution is graphed with diameter on the x-axis. For spherical (and spherically equivalent) aerosols, both the scattering coefficients and aerosol diameters are related to κ directly by the gf, which is defined as the ratio between the humidified (i.e., wet) and the dry diameters:
The gf is related to κ by RH via the following parameterization from Petters and Kreidenweis (2007):
where αw is the water activity. Water activity is a temperature-dependent function defined as follows:
where , Mw, R, T, and ρw are surface tension of solute (i.e., aerosol) to water, molecular weight of water, ideal gas constant, temperature, and density of water, respectively. The values of , ρw, and T are assumed to be 0.072 J m−2, 1000 kg m−3, and 298.15 K, respectively (Petters and Kreidenweis, 2007). For aerosols larger than 80 nm, this equation becomes (Zieger et al., 2013):
Finally, it is important to consider the impact that water has on dry CRI. To account for the mixing of water with aerosol CRI, the humidified CRI is assumed to be the volume-weighted average between dry CRI and the CRI of water . The volume-weighted mixing model is used because it was found to be the most robust of a variety of possible mixing models by (Nessler et al., 2005). With this model, CRI can be written as a function of gf (and consequently κ using Eq. 8) as follows:
Another hygroscopic parameterization relevant to this work is γ. The γ parameterization relates scattering coefficients at some specified RH (RHspecified) to dry measured scattering coefficients (Cscat,measured) through the following:
With the summary of aerosol properties complete, we now shift our focus to the ACTIVATE mission and the measurements of aerosol properties relevant to this work.
3.1 ACTIVATE Mission Description
An important feature of the ACTIVATE data set is the extensive collocated advanced passive and active remote sensing and in-situ data. The ACTIVATE aircraft executed flights that can be broadly categorized into two mission types: “process studies” and “statistical surveys”. This study focuses on statistical survey flights, where the lower-flying HU-25 Falcon aircraft collected in-situ data at various vertical levels (i.e., legs) in and above the marine boundary layer (MBL) for ∼ 3.3 h (Dadashazar et al., 2022b). During these statistical surveys, the Falcon would also make occasional vertical profiles (i.e., controlled ascents and descents) through the atmosphere. Simultaneously, the higher-flying King Air at approximately 9 km would conduct remote sensing and launch dropsondes while being spatially coordinated with the Falcon. These flights comprised 90 % of ACTIVATE missions and allowed for the efficient in-situ characterization of gas, cloud, aerosol, and meteorological quantities of the MBL across multiple flights and deployments (Dadashazar et al., 2022b; Sorooshian et al., 2023). As noted previously, the focus on spatial coordination of the two aircraft during the flights is beneficial for external consistency analysis, which is later described in Sect. 3.5.
The ACTIVATE mission featured 162 coordinated science flights across six ACTIVATE deployments that occurred from 14 February 2020 to 18 June 2022. During the first five and a half ACTIVATE deployments, the majority of these flights were carried out using NASA Langley Research Center (LaRC) in Virginia as a base of operations, and the final half of the sixth ACTIVATE deployment was based in Bermuda. The extent of the North Atlantic region that was sampled during ACTIVATE was within bounds of 58–78° W and 28–42° N. The ACTIVATE methodology, sample region, and data set are described in more detail in Sorooshian et al. (2023). The ACTIVATE mission follows previous studies that aim to study aerosol-cloud interactions in the dynamic western North Atlantic environment (e.g., Quinn et al., 2019; Sorooshian et al., 2020; Dadashazar et al., 2021b, a; Corral et al., 2021; Painemal et al., 2021).
3.2 Measurements
3.2.1 Remote Sensor Instrument Descriptions
The HSRL-2 is an active lidar remote sensor that provides altitude-resolved profiles of various aerosol and cloud properties for campaigns such as the Cloud, Aerosol and Monsoon Processes Philippines Experiment (CAMP2Ex; Reid et al., 2023), Deriving Information on Surface Conditions from COlumn and VERtically Resolved Observations Relevant to Air Quality (DISCOVER-AQ; Sawamura et al., 2017), and ACTIVATE (Sorooshian et al., 2023). Unlike standard elastic backscatter lidars such as Cloud-Aerosol Lidar with Orthogonal Polarization (CALIOP), the HSRL-2 has the ability to measure total and molecular backscatter separately from which aerosol backscatter and extinction can be derived (Hair et al., 2008). The HSRL-2 measurements can also be used to derive the ratio of aerosol extinction to backscatter coefficients, i.e., the lidar ratio (LR; see Eq. B9), as well as the linear depolarization ratio (LDR; see Eq. B10) (Burton et al., 2016, 2018).
The HSRL-2 has channels at 355 and 532 nm with an additional elastic backscatter channel at 1064 nm. The ambient extinction coefficient at 355 and 532 nm is derived from the measured LR. Because the HSRL-2 does not measure LR at 1064 nm, the 1064 nm extinction and LDR are retrieved products (Burton et al., 2016). In this study, the HSRL-2 measurement of total ambient extinction coefficient at 532 nm serves as the standard relative to the ISARA-derived ambient extinction coefficient as was done in Sawamura et al. (2017). The HSRL-2 field of view is 1 mrad, which corresponds to a 9 m footprint for an aircraft at 9 km altitude.
Complementing the HSRL-2 is the RSP, is a passive polarimetric remote sensor that uses highly accurate multispectral and hyperangular photopolarimetric measurements to characterize aerosol and cloud properties (Cairns et al., 1999, 2003). The aerosol products are based on an optimal estimate using the Research Scanning Polarimeter Microphysical Aerosol Properties from Polarimetery (RSP-MAPP) algorithm (Stamnes et al., 2018). Fine and coarse aerosol optical and microphysical properties are retrieved using seven channels that measure the total and polarized radiance across the visible-shortwave spectrum (wavelength range = 410–2260 nm) with over 100 viewing angles between ±55°. The RSP has a field of view of 14 mrad, which results in a 126 m along-track footprint for an aircraft at 9 km altitude. As a result, the RSP provides accurate column-averaged retrievals of aerosol optical and microphysical properties such as RRI, IRI, effective radius (reff; see Eq. B4), effective variance (veff; see Eq. B5), and SSA.
Table 1Summary of the King Air payload including relevant HSRL-2 and RSP ambient aerosol products with associated native resolutions and uncertainties.
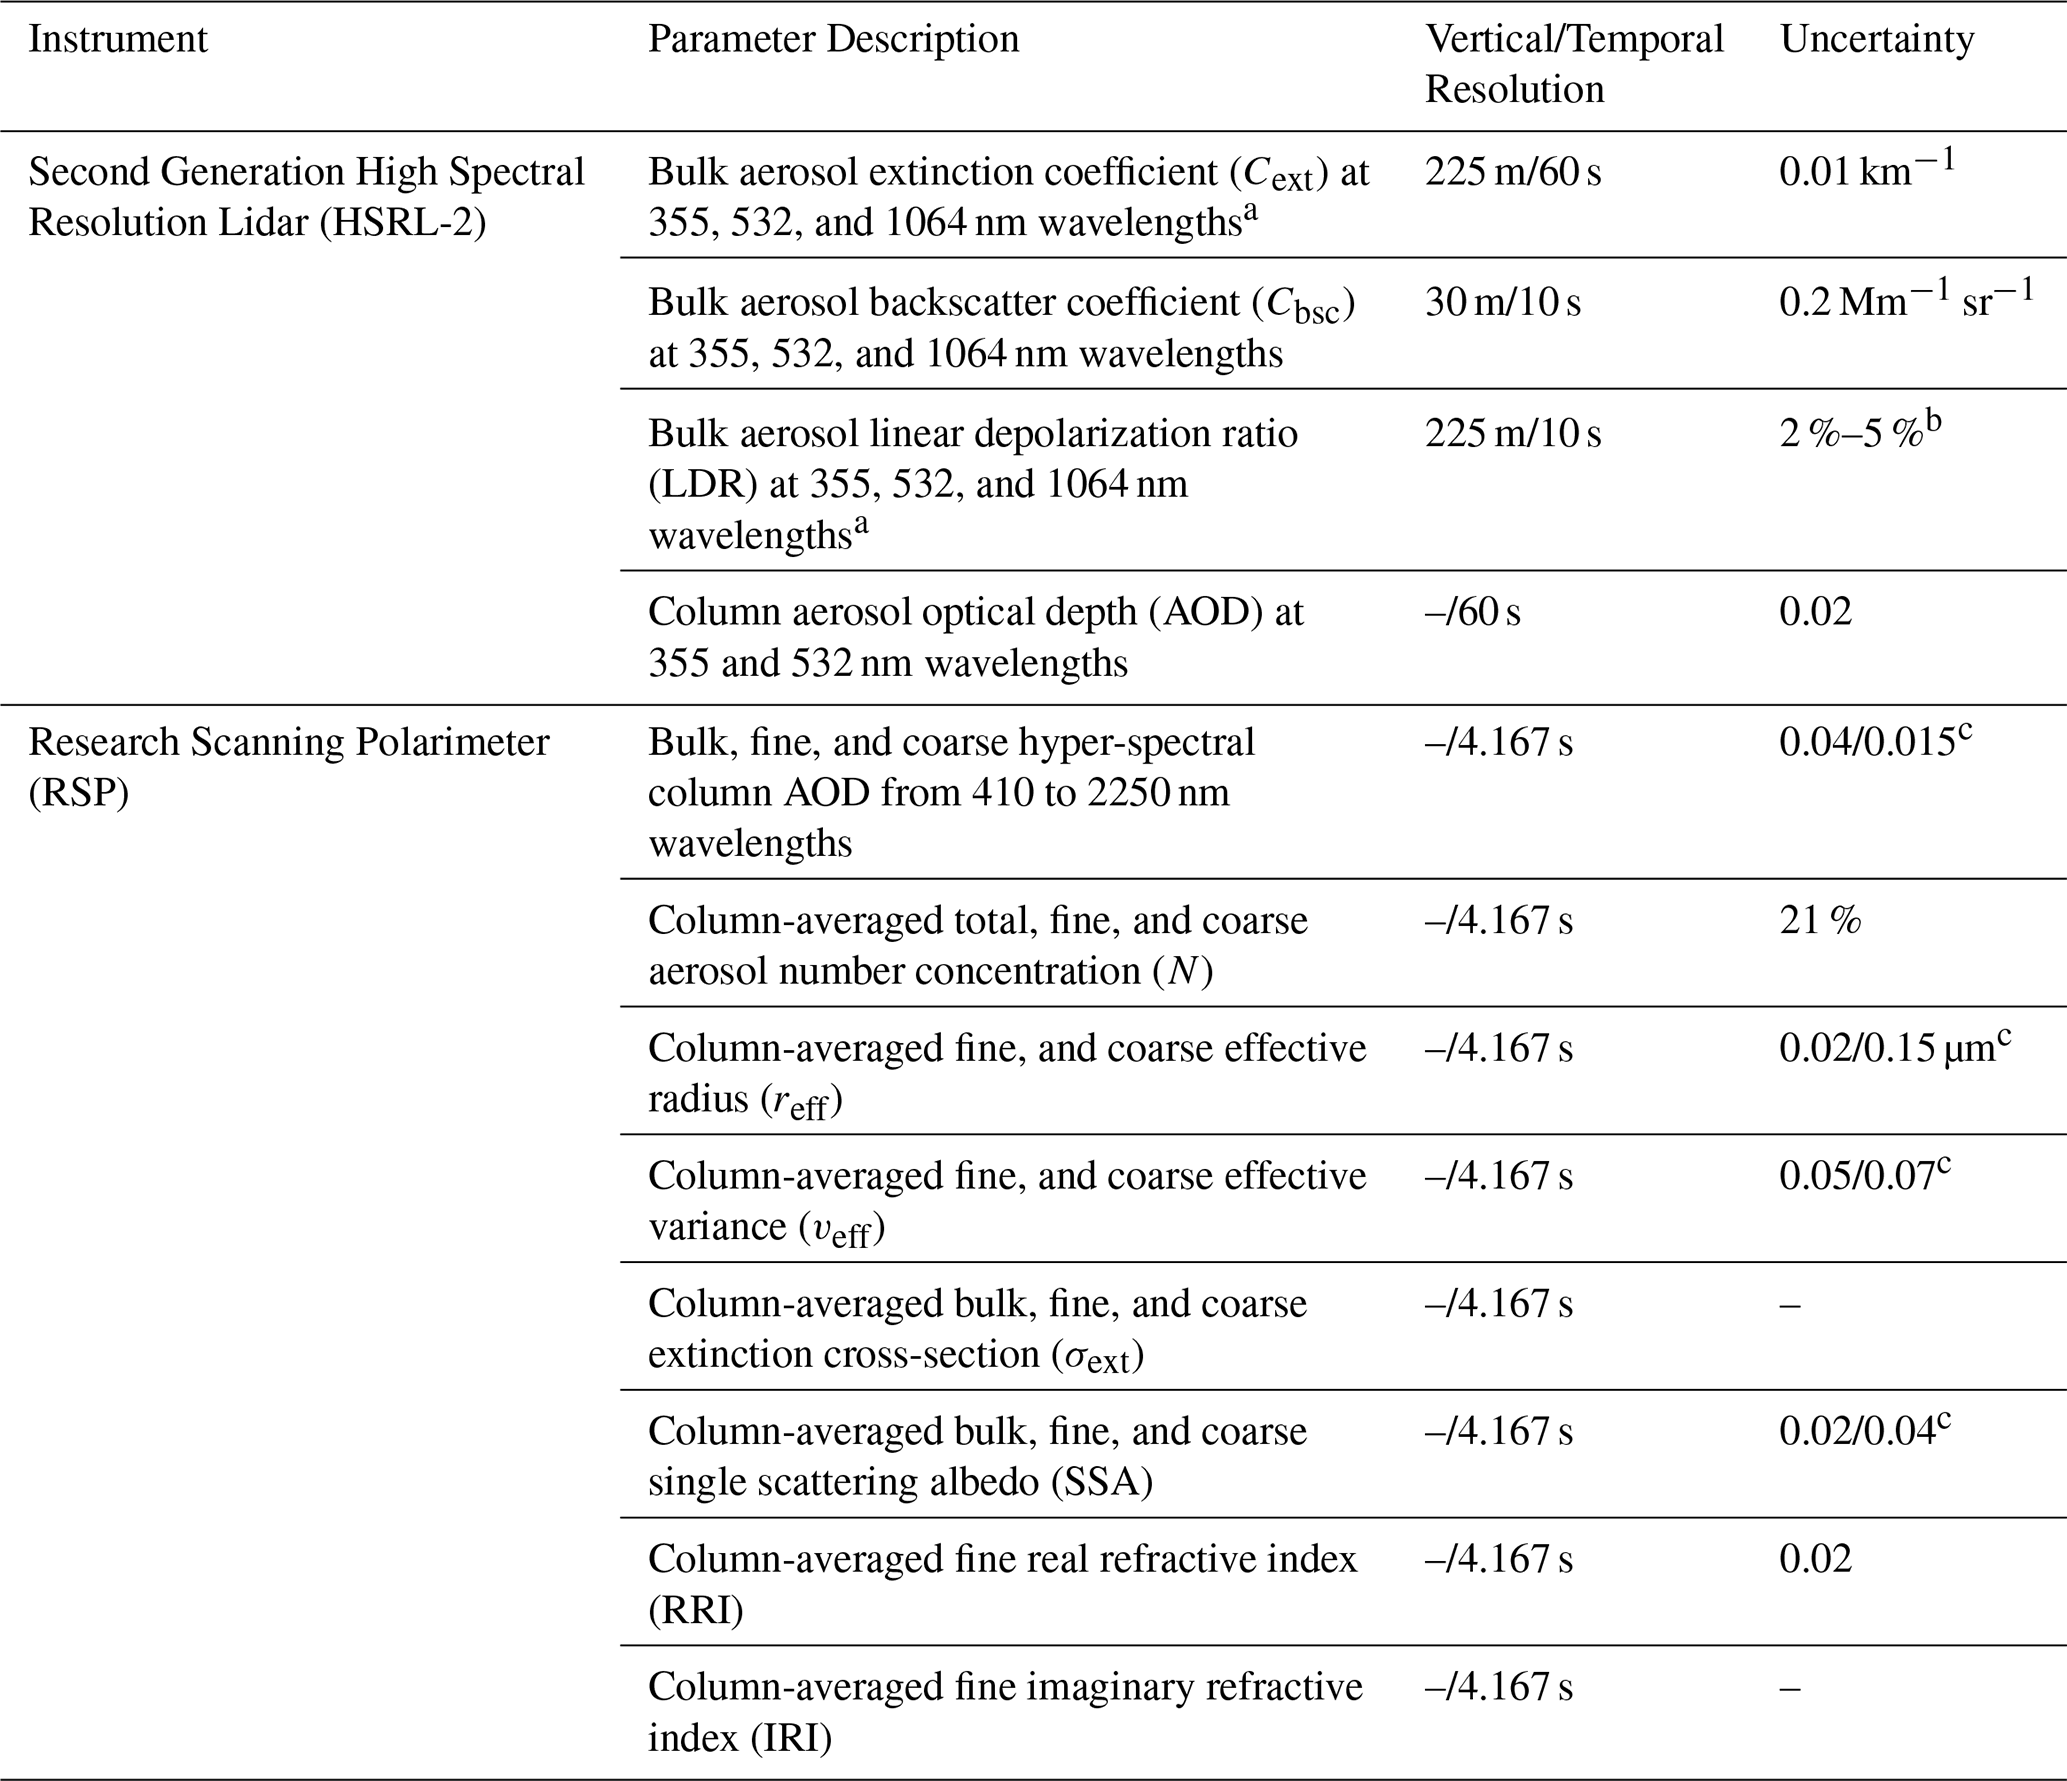
a The 1064 nm Cext and LDR are retrieved HSRL-2 products. b Uncertainty values are approximate and dependent on scattering levels. c Uncertainty values are for the fine/coarse, respectively.
The relevant King Air products are described in Table 1 along with their associated vertical resolutions, temporal resolutions, and uncertainties. Note that the native resolution of the extinction coefficients measured by the HSRL-2 is 225 m vertically and 60 s temporally. The provided HSRL-2 coefficients are smoothed from the subsampled resolution of 15 m × 1 s (vertical resolution × horizontal resolution) to the native resolution 225 m × 60 s by taking the arithmetic mean of all subsampled points within each native bin.
In addition to analyzing the consistency of the standard HSRL-2 and RSP aerosol products, this study analyzes the consistency of the novel altitude-resolved aerosol number concentration estimate (N; Schlosser et al., 2022). Complete details on the derivation of altitude-resolved N are discussed in Schlosser et al. (2022), but note that this quantity relies on the HSRL-2-derived aerosol extinction coefficient at 532 nm and the RSP-derived aerosol extinction cross section at 532 nm. This study also uses the advanced aerosol typing product provided by the HSRL-2 team (Burton et al., 2012, 2013). Specifically, we count the number of bins flagged as smoke in the HSRL-2 aerosol typing product within each 225 m × 60 s bin. This HSRL-2-derived smoke count is used to analyze for the presence of elevated smoke layers.
3.2.2 In-Situ Instrument Descriptions
In-situ measurements of dry n∘ are taken from the Scanning Mobility Particle Sizer (SMPS) (Model 3085 DMA, Model 3776 Condensation Particle Counter (CPC), and Model 3088 Neutralizer; TSI, Inc.) and a Laser Aerosol Spectrometer (LAS) (Model 3340; TSI, Inc.). The SMPS measures concentrations of aerosols with mobility D ranging in size from 2.97 to 94 nm at a 45 s temporal resolution (Moore et al., 2017). The LAS measures concentrations of aerosols with optical equivalent D ranging in sizes from 0.094 to 7.50 µm at a 1 s temporal resolution (Froyd et al., 2019). All SMPS data rely exclusively on passive drying from ram heating (i.e., air speeding up as it enters the aircraft inlet) and a generally warmer cabin temperature than ambient air. In addition to passive drying, the aerosols sampled by the LAS are actively dried with a 6 in. (152 mm) Monotube dryer (Perma-Pure, Model 700) for all flights except those conducted between 14 May and 30 June 2021, which were only dried passively. Note that all drying was done to an RH of ≤ 60 %. The n∘ measurements provided by the SMPS and LAS are provided at standard temperature and pressure (273.15 K and 1013 mbar). These data are provided with a standard temperature and pressure conversion factor that translates the standard number concentrations from standard temperature and pressure to ambient temperature and pressure conditions (See Sect. 3.3).
While the LAS has a measurement range up to 7.5 µm, the maximum cutoff D of the sample inlet prevents the measurement of aerosols with ambient D > 5 µm for ACTIVATE (McNaughton et al., 2007; Chen et al., 2011). The effective upper size cut is D = 5 µm for all 2020 data. For this data set, only aerosols with a maximum of dry optical D up to 3.49 µm were used. This is done because the next logarithmically-spaced bin starts at 3.49 µm and extends beyond the limit for efficient transmission into the isokinetic inlet. For 2021 and 2022 data sets, a cyclone was installed upstream of the nephelometers that results in a 1 µm aerodynamic cutoff for for scattering coefficient measurements only. The cyclone is not used for the absorption coefficient and size distribution measurements.
For the cyclone, it is important to note that the cyclone has a 50 % efficiency at 1 µm. Due to the difference between the aerodynamic and optical sizes and the imperfect nature of the cyclone, we select the LAS bin that has a geometric mean diameter (Dgm) of 2 µm as the last bin of size distribution. This bin samples aerosol with diameters ranging from 1.79 to 2.25 µm. While this bin extends to aerosol sizes as high as 2.25 µm this bin was chosen to limit the erroneous over-truncation of the size distribution. This decision is discussed in more detail in Sect. 3.3. The impact on the absorption coefficient from aerosol between 2.25 and 3.49 µm is negligible in the calculation of absorption coefficients (Moosmüller et al., 2009; Moosmüller and Sorensen, 2018). This assumption may result in an overestimation in the IRI in some cases, which is important to consider.
Another important detail to note is that the LAS aerosol sizing is calibrated using an assumed dry CRI and shape. The systematic error introduced by using an assumed dry CRI and shape is expected to be minimized by performing the LAS calibration with respect to spherical ammonium sulfate aerosols with dry CRI of 1.53+0i, which is among the most common aerosol species (Ebert et al., 2004; Sawamura et al., 2017). Furthermore, external mixtures of many aerosol species have an apparent RRI that falls between 1.5 and 1.58 (Li et al., 2023). If an external mixture of aerosols is dominated by a RRI outside of this range, it is likely that the assumptions of a spectrally flat CRI and sphericity are not longer valid. The SMPS sizing is calibrated using National Institute of Standards and Technology (NIST)-traceable polystyrene latex spheres, while size-dependent concentrations were calibrated in the laboratory using monodispersed aerosol and a reference CPC. These calibrations resulted in good stitching between the SMPS and LAS distributions, where stitching refers to the process of combining aerosol size distributions from different instruments into a continuous data set. They also led to consistent integrated number concentrations measured when compared to ancillary CPC measurements (see Fig. 7 of Sorooshian et al., 2023).
The in-situ optical measurements are taken by the nephelometer (Model 3563; TSI, Inc.) and the tricolor Particle Soot Absorption Photometer (PSAP) (Radiance Research; Sorooshian et al., 2023). The nephelometer measures cabin dried (RH ≤60 %) and humidified (RH ≈ 85 %) aerosol scattering coefficients ( and ) at wavelengths equal to 450, 550, and 700 nm at a 1 s temporal resolution (Ziemba et al., 2013). In addition to the scattering coefficients, the nephelometers also measure RH. The PSAP measures dry absorption coefficient () at 470, 532, and 660 nm at a 1 s temporal resolution (Mason et al., 2018). The PSAP sample stream is dried by heating the optical block to 35 °C. The scattering coefficients are corrected for truncation errors using Anderson and Ogren (1998) and the absorption coefficients are corrected for a transmittance and flow errors using Virkkula (2010). The parallel dry and humidified nephelometer deployment allows for scattering coefficients to be adjusted to any RH up to saturation (RH = 99 %) through the computation of γ (Sawamura et al., 2017). As discussed previously, this γ product relates scattering coefficients at some specified RH (RHspecified) to dry measured scattering coefficients through Eq. (12).
For this work, RHmeasured and Cscat,measured are measured by the cabin dried nephelometer. For the ISARA retrieval, the measured is adjusted to be scattering at RH = 0 % (i.e., Cscat,dry) using Eq. (12). For the purposes of this study, we will only use scattering and absorption data when all three channels of the nephelometer and PSAP have signals above 1 and 0 Mm−1, respectively. Note that measurement uncertainty can lead to the in-situ measurements having signals less than zero. This is most important for low signal measurements and can impact some or all channels.
Measurements of ambient liquid water content (LWC) and cloud drop number concentration (Nd) are used to classify in-situ data as cloud-free, ambiguous, or cloud. This classification becomes important because ISARA retrievals are performed for cloud-free cases. Ambient LWC and Nd are both derived from ambient aerosol size distribution measured by a Cloud and Aerosol Spectrometer (Droplet Measurement Technologies CAS; Baumgardner et al., 2001; Lance, 2012), a Fast Cloud Droplet Probe (SPEC FCDP; Kirschler et al., 2022), and a Cloud Droplet Probe (Droplet Measurement Technologies CDP; Sinclair et al., 2019). The CAS, CDP, and FCDP measure aerosols in ambient D size-ranges of 0.5–50, 2–50, and 3–50 µm, respectively. Measurements are considered cloud-free where LWC is less than 0.001 g m−3, respectively (Schlosser et al., 2022). Because the CAS, CDP, and FCDP provide redundant measurements of LWC, this work relies on the CDP primarily and only uses the FCDP for flights where the CDP was not used. The CAS is only used as a source of LWC information in the case the CDP and the FCDP are unavailable.
In addition to applying a maximum LWC threshold, a sampling inlet flag is used to confirm that the Falcon aircraft operated with the isokinetic inlet rather than the Counterflow Virtual Impactor (BMI Inc. CVI; Shingler et al., 2012), which is intended to collect cloud residuals. The sampling inlet flag also filters out ice clouds. Filtering out stray ice aerosol is not required as they will not survive the isokinetic sampling process.
Table 2Summary of the relevant Falcon measurements and payload with associated size-ranges, resolutions, and one standard deviation uncertainties.
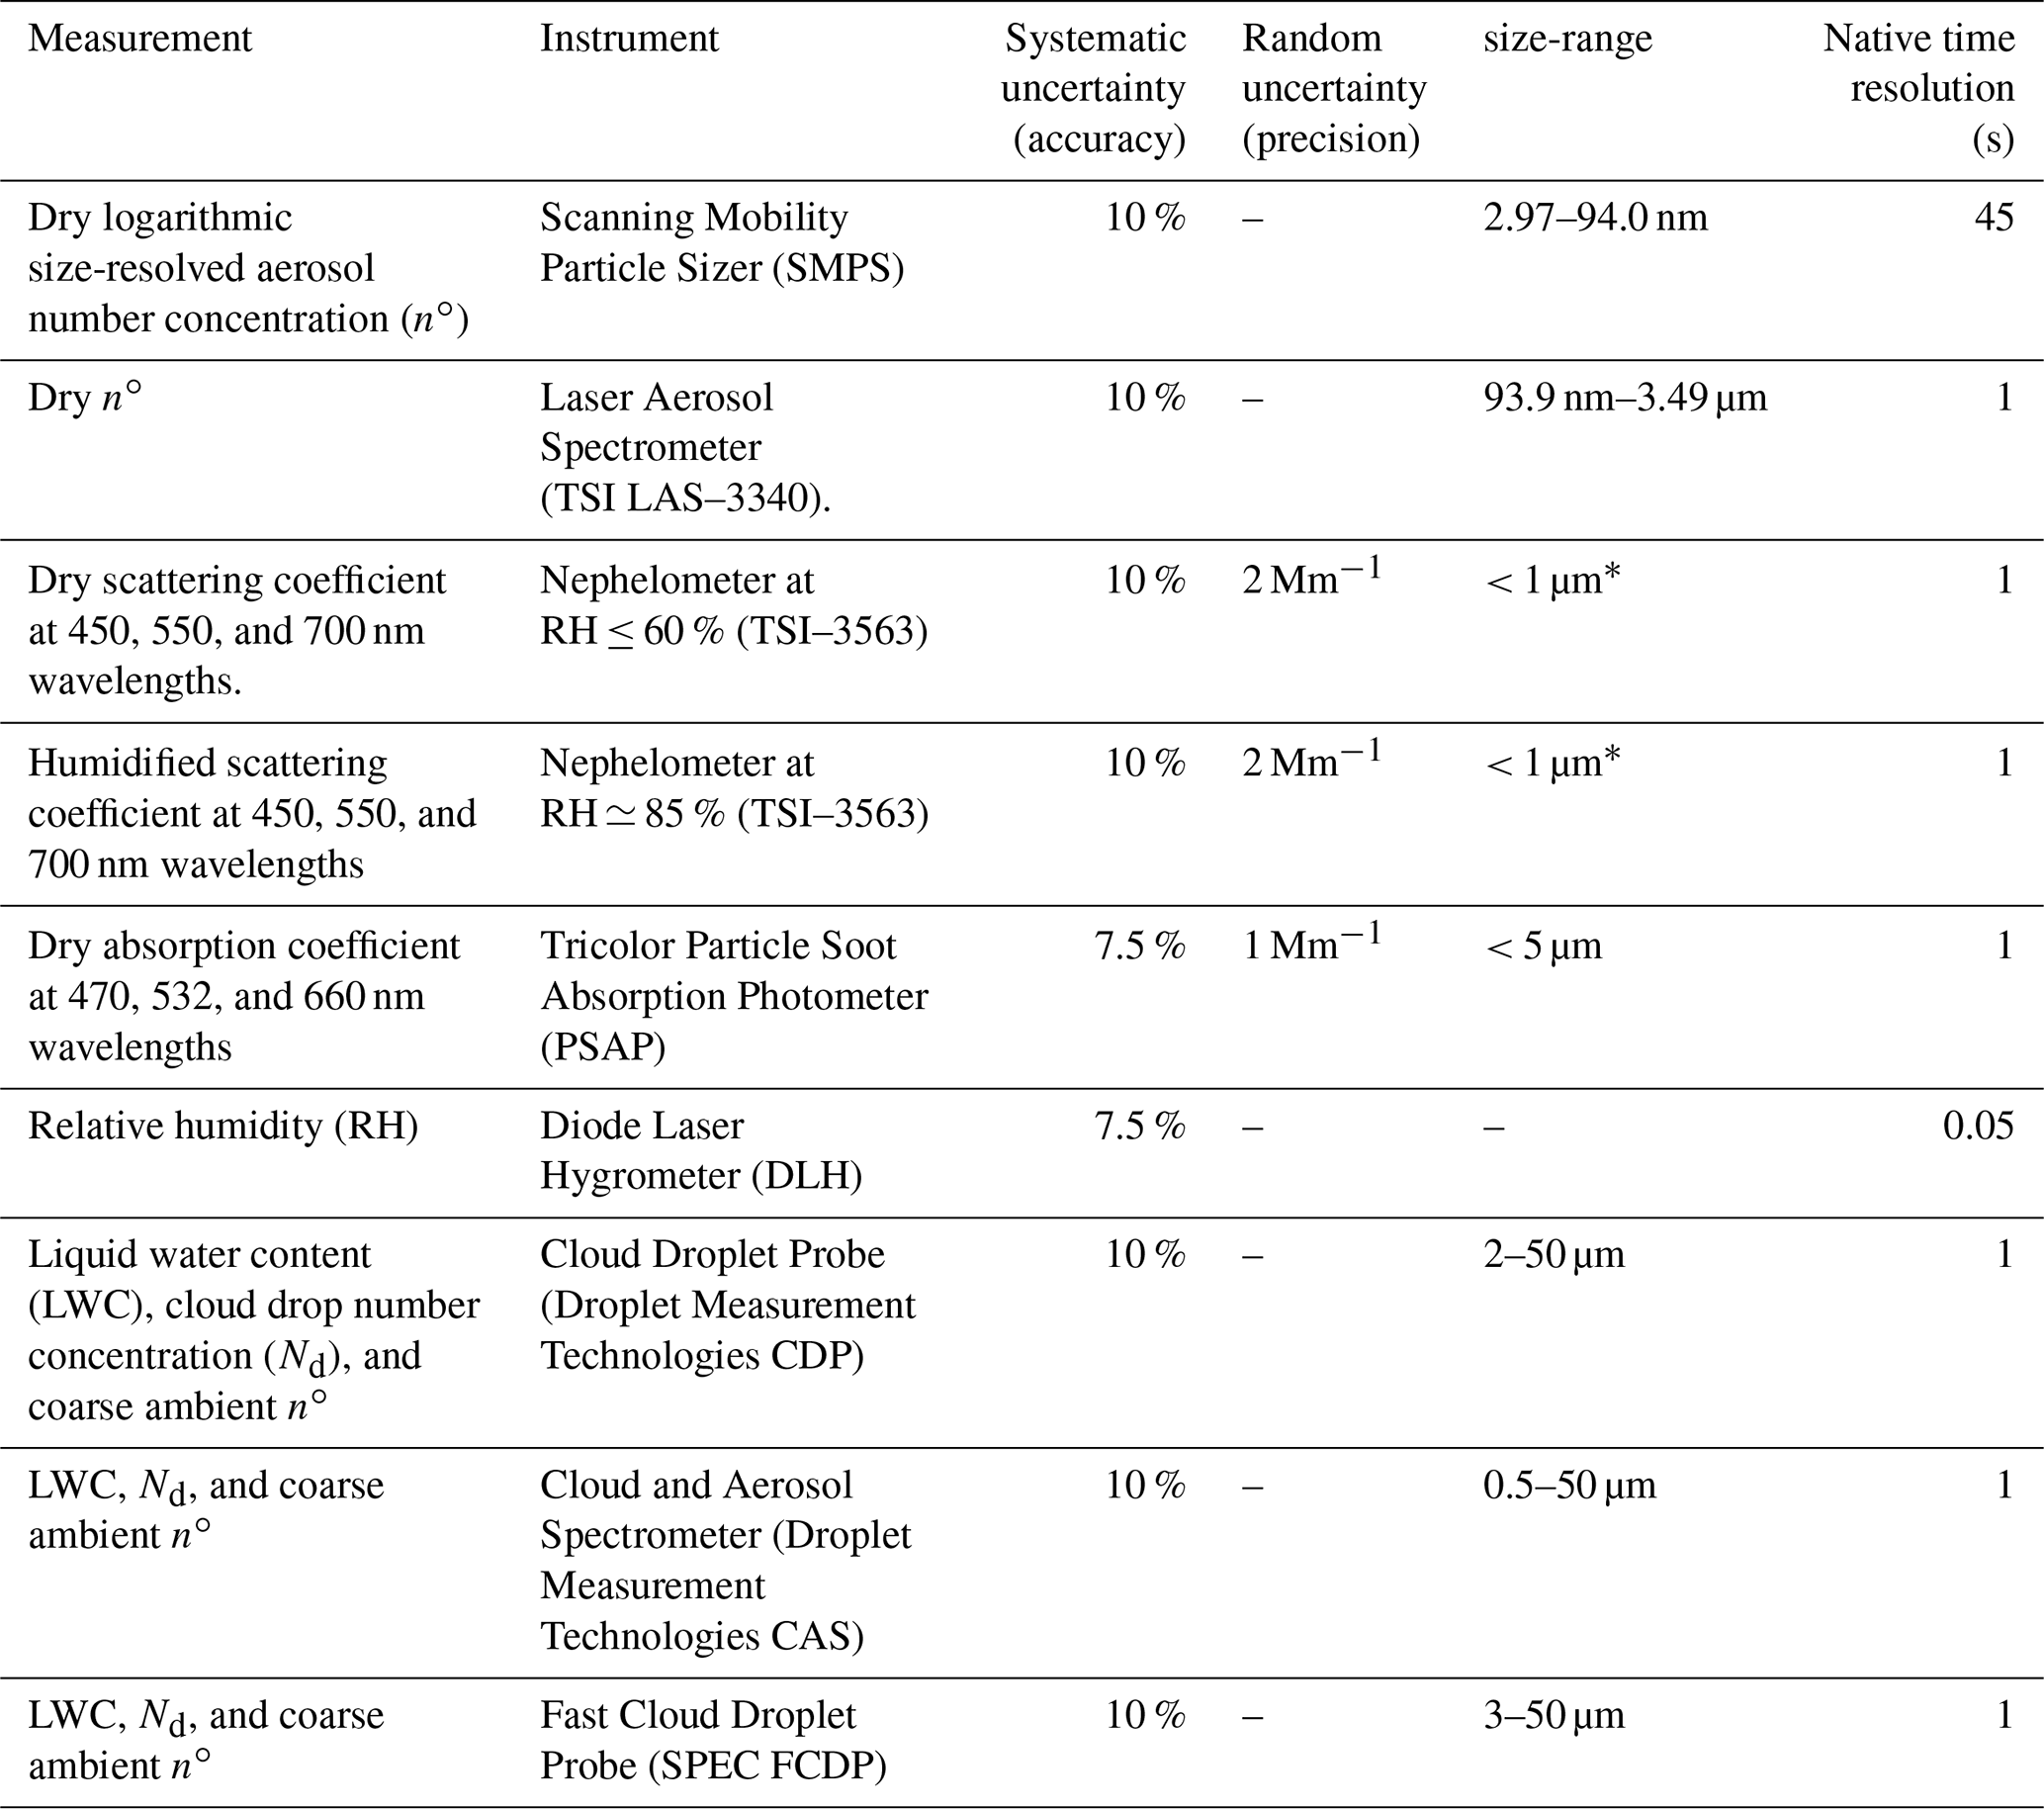
∗ For ACTIVATE 2020, this was < 5 µm. See Sect. 3.2 for details.
The ambient aerosol size distribution measured by the CAS, the CDP, and the FCDP also help account for coarse aerosol when calculating the final properties of the ambient aerosol (see Sect. 3.3). The CAS is used as the primary source of coarse ambient n∘ information. The CDP and FCDP are only used for coarse ambient n∘ information in the case the CAS data are not available. To round off the suite of in-situ instruments is the Diode Laser Hygrometer (DLH), which provides ambient RH data. Ambient RH is used for the final calculation of ambient aerosol properties as described in Sect. 3.3. Note that the DLH measures water vapor mixing ratio, which is used with ambient pressure and temperature data to derive ambient RH to a relative accuracy of 15 % of the measured RH (Diskin et al., 2002). The relevant Falcon measurements are described in Table 2 along with their associated size-ranges, temporal resolutions, and uncertainties.
3.3 In-Situ Aerosol Retrieval Algorithm (ISARA) Description
ISARA is a retrieval algorithm that uses dry and humidified (i.e., wet) aerosol measurements to retrieve the intensive properties while accounting for changes in optical properties due to hygroscopicity, allowing for the derivation of ambient aerosol properties. For these retrievals, we assume that the CRI does not change with wavelength (e.g., the CRI is spectrally flat), which is a good assumption for organic and sulfate aerosol species observed for much of ACTIVATE within the 450–700 nm range of wavelengths (Bain et al., 2019). Also, as discussed previously, we have limited our calculations for these retrievals to classical Mie theory due to the assumption of fine aerosol sphericity.
The preliminary step of this algorithm is to match all in-situ data to the lowest time resolution of the suite of instruments. In the case of ACTIVATE, the SMPS has the lowest time resolution of 45 s. The 45 s resolution results in a spatial resolution of 8 km, which assumes a ground speed of 180 m s−1. As such, the external consistency analysis is most useful from vertical profiles where the in-situ platform samples the column of air to an altitude of 150–250 m. Vertical profiles where the vertical extent is more than 1 km are most useful for comparing with the column-averaged aerosol properties derived from the RSP-measurements. Further details on the Falcon's vertical profile are discussed in Sect. 3.5.
The data merge is handled by the NASA Airborne Science Data for Atmospheric Composition online merge tool (see https://www-air.larc.nasa.gov/missions/etc/onlinemergedoc.pdf, last access: 25 November 2025). Data in their native resolution are averaged to 45 s using the NASA merging tool. After this step, the SMPS and LAS size distributions are combined (i.e., stitched) at a diameter of 94 nm, which is the upper bound of the size-range by the SMPS and the lower bound of the LAS size-range. After the size distribution measurements are combined, ISARA is used to determine the aerosol optical and microphysical properties relevant to this study. Figure 1 shows aerosol number, volume, and surface area concentration as a function of dry particle diameter (Ddry) from all of the ACTIVATE 2020–2022 data.
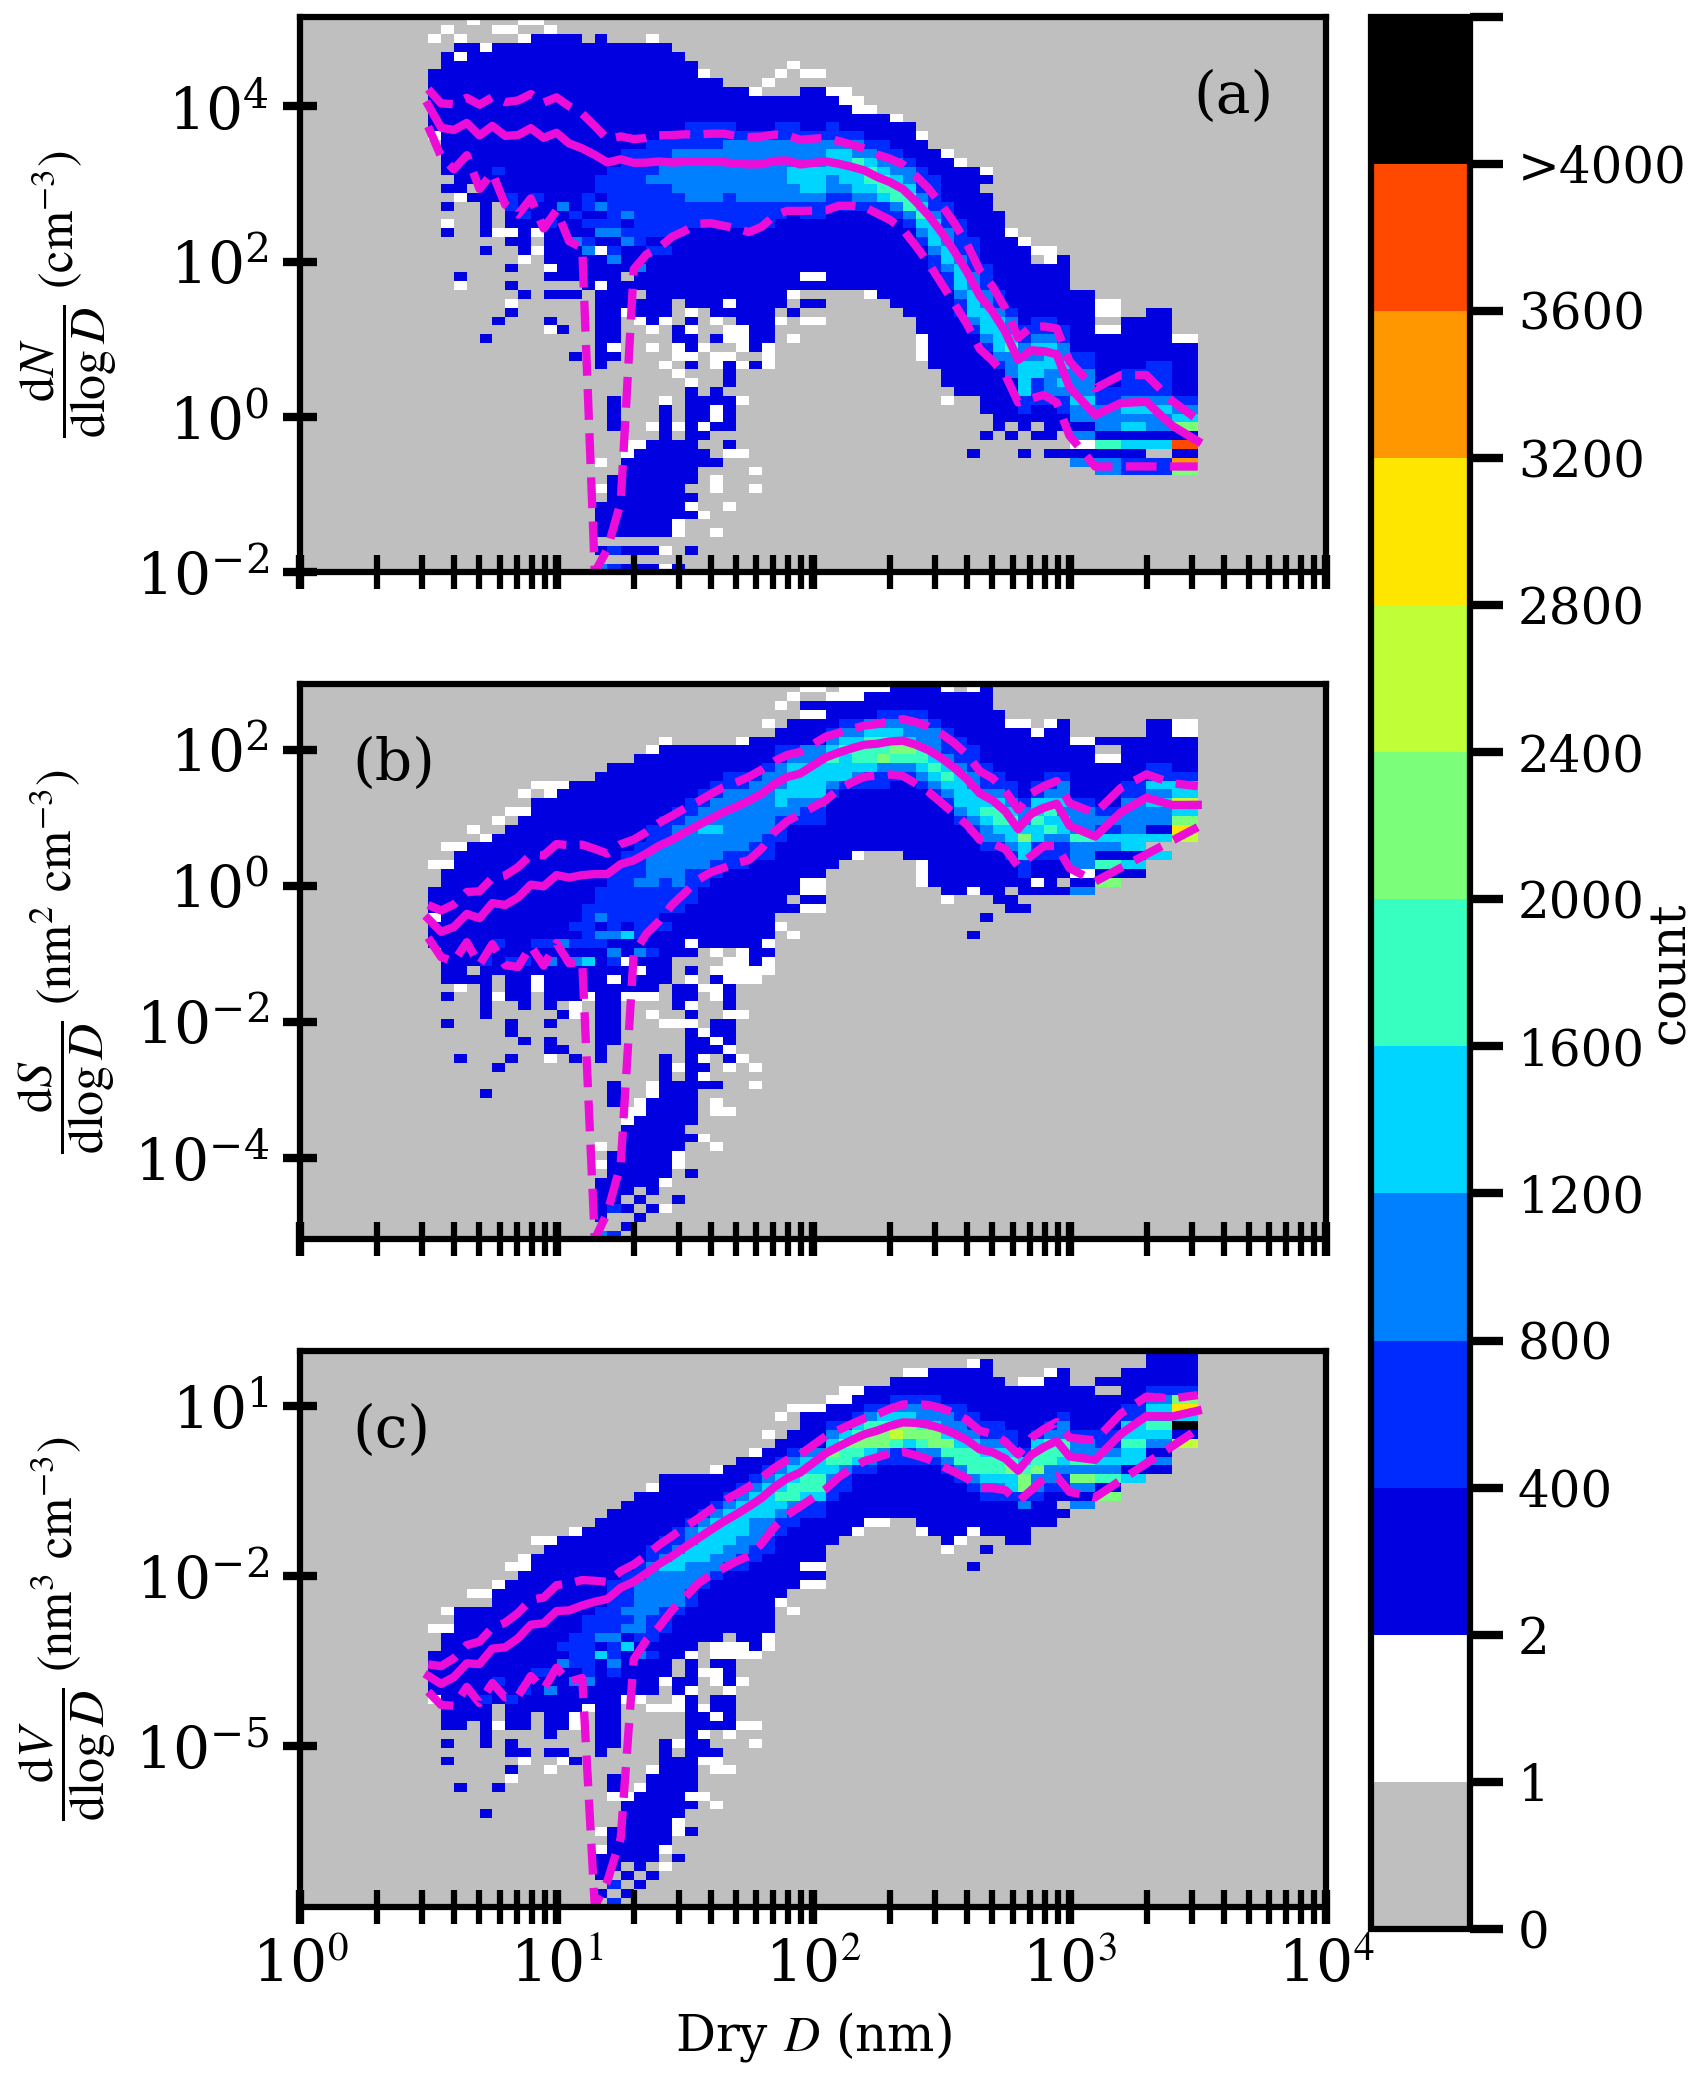
Figure 1Heat map plot of logarithmic size-resolved aerosol (a) number concentration, (b) surface area concentration, and (c) volume concentration versus dry particle diameter (D) measured from all ACTIVATE 2020–2022 data which is comprised of 34 015 size distribution measurements at 45 s resolution. The solid line represents the arithmetic mean of each bin, the bottom and top dashed lines represent the 10th and 90th percentiles of each bin, respectively, and the color bar indicates density of points in a given area of the plot.
The first main step of the ISARA retrieval is determining a bulk dry CRI since this is a critical parameter for Q and C as mentioned previously. This step focuses on retrieving CRI from measurements of dry scattering and absorption coefficients and size resolved number concentration in conjunction with Eq. (3). A set of scattering and absorption coefficients are calculated by iterating Eq. (3) through dry RRI and IRI. The IRI is iterated from 0.00 to 0.08 in increments of 0.001, which is a range suited for typical aerosol in the ACTIVATE region. The RRI is iterated at 1.51, 1.52 1.53, 1.54, and 1.55 to capture small deviations in RRI from the 1.53 assumed by the LAS calibration curve. Given that the scattering is dominated by aerosols in the LAS size-range, we expect to get a good agreement between the ISARA-derived scattering coefficient and that measured by the nephelometer. Note that this process uses the Dgm from each SMPS and LAS bin.
After the set of scattering and absorption coefficients are calculated, ISARA retrieves a final value of total dry CRI () by taking the average of all valid CRI values, which was shown to be effective for previous studies that this work expands upon (e.g., Sawamura et al., 2017). For a CRI to be valid for averaging, all three of the computed scattering coefficients must be within 20 % of the corresponding measured dry scattering coefficient and all three of the calculated absorption coefficients must be within 1 Mm−1 of the measured absorption coefficients . This method has been adapted from Sawamura et al. (2017) to include all three wavelengths. A summary of this retrieval step is provided in Fig. 2.

Figure 2Flow chart of the dry CRI retrieval procedure. Blue text represents measured values, black text represents calculated values, and red text represents ISARA retrievals. The term Ccalc indicates calculated Cscat,dry and Cabs,dry while Cmeas indicates and from the nephelometer and PSAP instruments, respectively.
A final check is performed to establish a successful CRI retrieval. Note that the successful retrieval rate (i.e., the success rate) of ISARA is defined as the number of points where the required fitting thresholds are met divided by the number of data points with measurements required to perform the retrieval:
Here we ensure results in scattering and absorption coefficients that meet the same thresholds of 20 % and 1 Mm−1, respectively. Now that dry CRI has been determined, it is then necessary to retrieve κ. Since the retrieval of κ relies on the same optics principles as the previous step, and relies primarily on optimizing Eq. (3). In the previous stage, we directly optimize Eq. (3) by changing dry CRI, but in this step we change the aerosol CRI indirectly based on the volumetric proportion of water present in solution.
With the relationships established is Sect. 2, a set of wet scattering coefficients (i.e., wet Cscat) at 550 nm are calculated by iterating through κ from 0.00 to 1.40 in increments of 0.001, also a range typical of ACTIVATE's measured aerosol. After calculating the set of forward-modeled wet Cscat, we use γ to derive the wet Cscat at RH = 80 % (i.e., ) and dry Cscat at RH = 0 % (i.e., ). The γ value is derived from the tandem nephelometers as detailed in Sect. 3.2. The and are obtained by applying Eq. (12) with the cabin dried measured scattering coefficient at 550 nm (i.e., ), with the measured cabin RH, and by setting the specified RH to be 80 % and 0 %, respectively. The and are then used to derive hygroscopic amplification factor (f(RH); Shingler et al., 2016) by rearranging Eq. (12) to be the following:
After the step is performed, the smallest κ values are taken for computed wet Cscat that are within 1 % of (ΔCscat,wet < 1 %). The smallest of these κ values is then taken to be the single effective κ () for the fine aerosol. In this step, a successful κ retrieval is where a κ was found with a corresponding ΔCscat,wet < 1 %. A summary of this retrieval process is illustrated below (Fig. 3).

Figure 3Flow chart of the physical hygroscopicity parameter (κ) retrieval procedure. Blue text represents measured values, black text represents synthetically generated values, and red text represents ISARA retrievals. Ccalc refers to the calculated scattering coefficient and Cwet refers to the wet scattering coefficient derived from Eq. (12) and the dry scattering coefficient.
Once IRI and κ are determined, the final humidified fine scattering coefficient and f(RH) are calculated for validation. Cumulative probability distributions of ISARA-derived IRI, κ, and f(RH) are shown for all ACTIVATE data (Fig. 4). It is observed that aerosol in the ACTIVATE region generally have low absorption (median IRI = 0.008) and low hygroscopicity (median κ = 0.11).
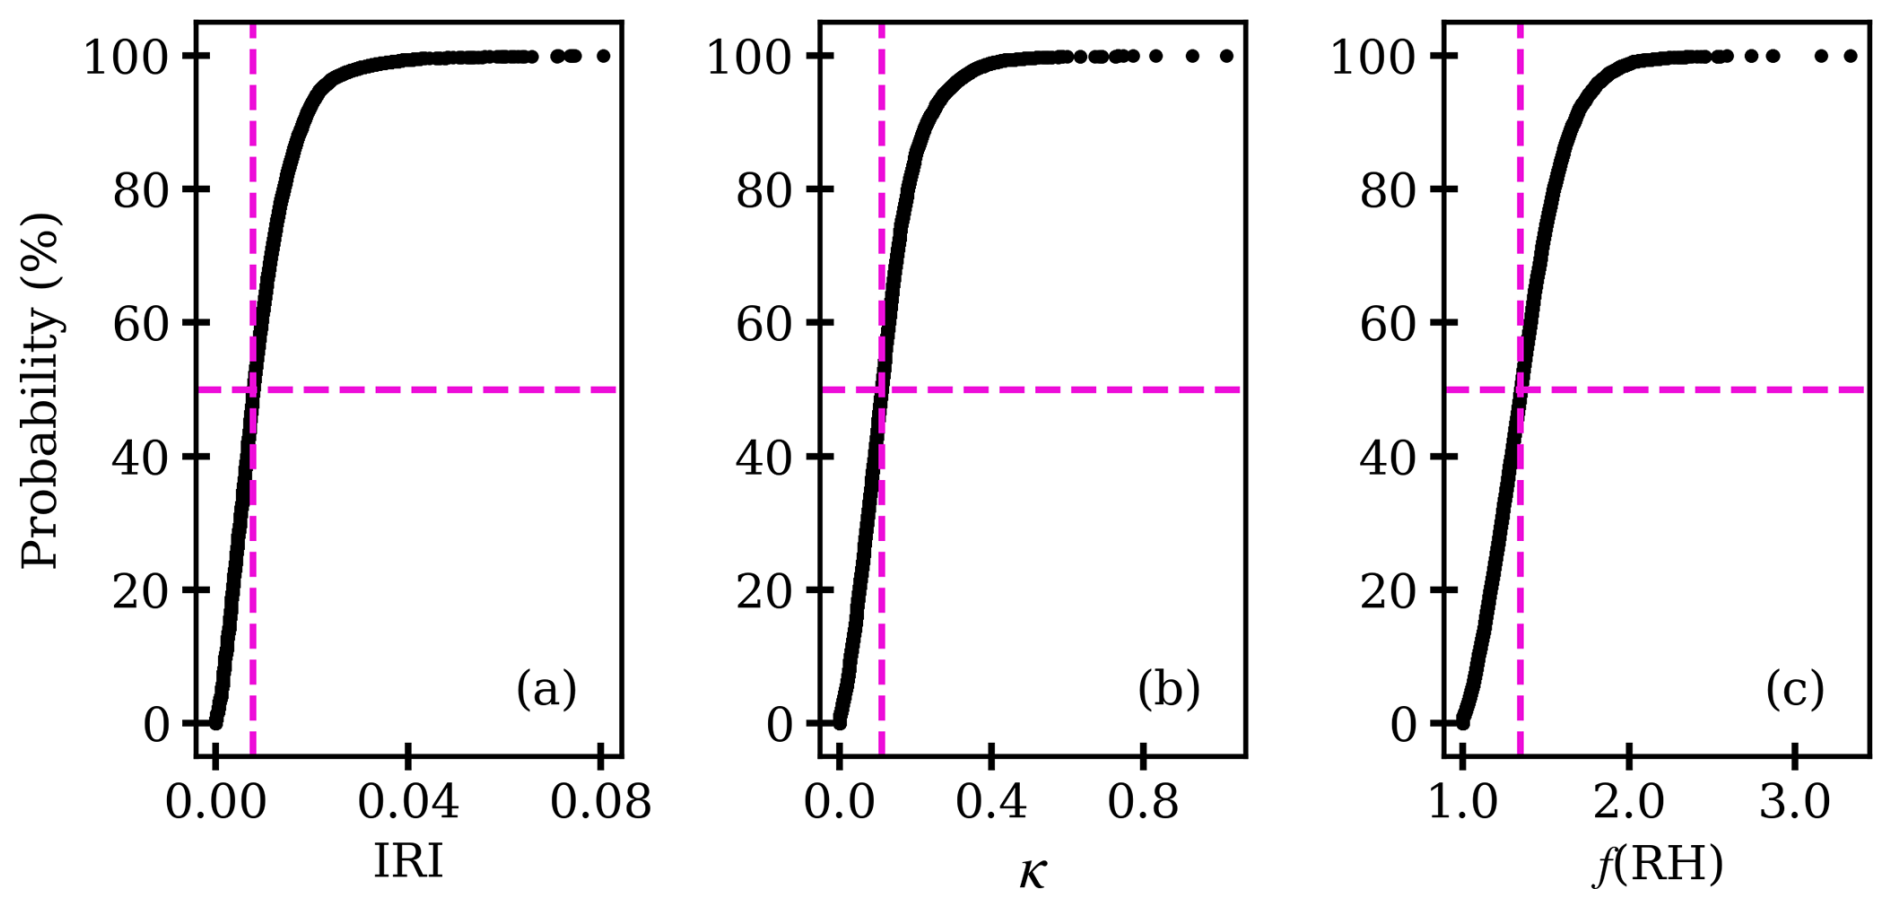
Figure 4Cumulative probability distribution plots for retrieved (a) IRI, (b) κ, and (c) 550 nm f(RH) at RH = 80 %, respectively derived from ACTIVATE 2020–2022 data. The intersection of the dashed magenta lines marks the medians of the data sets, which are 0.008, 0.11, and 1.34 for IRI, (b) κ, and (c) f(RH), respectively.
The commonly observed low absorption is expected given the frequency of sulfate and secondary organic aerosol as reported by Nakayama et al. (2015). That being said, the observed IRI is between 0.01 and 0.08 in 32 % of the data, which indicates the presence of moderately absorbing aerosol species such as aged smoke and dust. The observed low hygroscopicity in many of the retrievals also indicates organic aerosol species are present (Petters and Kreidenweis, 2007). Only 20 % of the data had κ > 0.2, which is the upper limit of the range of κ for organic aerosol species (Massoli et al., 2010).
The frequency of low κ observed suggests that more work could be done to improve the single effective κ assumption made during the retrieval process. The ACTIVATE instrument suite limits the sensitivity of the retrieved κ to favor aerosols with dry D > 90 nm. Future work could explore using a bimodal hygroscopicity retrieval, which has been proven to be successful in other work (e.g., van Diedenhoven et al., 2022). The ISARA framework and associated software package that are established in this work can be utilized to perform such an analysis.
The ISARA-derived IRI and κ are used in conjunction with the measured ambient RH, dry size distribution data, and standard temperature and conversion factor to calculate ambient scattering and absorption coefficients (Cscat,amb and Cabs,amb, respectively) for the total (e.g., bulk) size-distribution ( µm), as well as the ultrafine ( nm), the fine ( µm), the coarse ( µm), and the optically active ( µm) size-ranges. The first step of calculating the ambient aerosol properties is to convert the number concentrations from standard temperature and pressure to ambient temperature and pressure using the standard temperature conversion factor provided with the data.
After temperature and pressure adjustment, the hygroscopic properties are examined. The ambient scattering and absorption coefficients are calculated using Eq. (3). Along with the ambient scattering and absorption coefficients, several other ambient aerosol microphysical and optical properties examined in this study. The comprehensive definitions and mathematical representations of each of those properties are presented in Appendix B. The list of statistical metrics discussed in this study is as follows: (1) mean (; see Eq. C1), (2) standard deviation (s; see Eq. C2), (3) weighted mean (; see Eq. C3), (4) weighted standard deviation (sweight; see Eq. C4), (5) correlation coefficient (r; see Eq. C5), (6) probability of correlation (p), (7) bias (see Eq. C6), (8) mean bias (MB), (9) standard deviation of bias (SB), (10) relative bias (RB; see Eq. C7), (11) mean relative bias (MRB), (12) standard deviation of relative bias (SRB), and (13) normalized root-mean square deviation (NRMSD; see Eq. C8). To perform the external consistency analysis outlined in Sect. 3.5, the coarse contribution to the in-situ-derived total extinction, N, and SSA is derived from the CAS size distribution with a priori assumptions on the composition and shape.
For this step, we categorized our comparisons based on the collocated LDR derived from the HSRL-2. For the points where HSRL-2-derived 532 nm LDR < 0.08, we use a naive assumption that the coarse aerosols have dry microphysical and optical properties equivalent to humidified sea salt. The assumptions made for aerosol in these naive cases are as follows: (1) the refractive index of coarse aerosols are set to that of water , (2) the aerosols are fully hydrated, so no hygroscopic adjustment to the CRI is applied, and (3) the aerosols are spherical. For points where HSRL-2-derived 532 nm LDR > 0.08, we tried spheres in addition to various spheroid eccentricities and a range of CRI to apply to the coarse aerosol in an attempt to minimize differences between the HSRL-2- and ISARA-derived bulk optical properties. This step is discussed with more detail in Sect. 3.5.
In addition to the shape, CRI, and κ assumptions, we also assume the coarse size-range is truncated to diameters between 1 and 20 µm. As mentioned previously, if the CAS data are used as the primary source of the coarse aerosol size-distribution. With the path from ACTIVATE data to ambient aerosol product described, we next discuss our process for generating a synthetic data set and estimating the error of ISARA-derived dry CRI and κ.
3.4 Synthetic Consistency Analysis Methodology
In this section, we describe both the process for generating synthetic aerosol property measurements and the steps taken to perform a consistency analysis on the synthetically generated aerosol properties and ISARA retrievals derived from that synthetic data. This section details the synthetic data generation and retrieval process, which involves: (1) creating synthetic ground-truth intensive and extensive aerosol properties, (2) generating synthetic in-situ measurements from the ground truth properties with appropriately assumed measurement noise, and (3) using these synthetic measurements in ISARA to retrieve IRI and κ. The resulting optical and microphysical retrievals obtained from ISARA are detailed in Sect. 4.1.
The following discussion describes the process used to generate the synthetic ground-truth aerosol properties. The first step to generating the synthetic aerosol measurements is to generate the ground truth size distributions. For this step, it is important to generate realistic size distributions that might be observed when analyzing real-world data. To generate realistic size distribution measurements, we used optimal estimation to fit the stitched ACTIVATE size distributions to a number-weighted lognormal model with two modes (Vugrin et al., 2007). The bimodal lognormal size distribution model is expressed as follows:
where Dgm, sg, and Nm represent the geometric mean diameter, geometric standard deviation, and integrated number concentration for each mode (j). The Dgm is the diameter for which exactly half of the aerosol are smaller and half are larger. The sg is the ratio of the diameter below which 84.1 % of the aerosol lie to the Dgm.
The optimal values for Dgm, sg, and Nm for each mode are determined by minimizing the sum of the squared residuals between Eq. (15) and size distributions measured during ACTIVATE. This optimal estimation process is designed to provide the best fit to the original size distribution, but it can result in unrealistic fits for some conditions such as low total concentrations, complicated aerosol size distributions, or measurement noise.
To omit poorly fitted size distributions from the subsequent synthetic data analysis, any fits are removed where r < 0.99, where p > 10−4, and where integrated Cscat < 2 Mm−1. There are 473 good fits identified that comprise the final set of fitted size distributions. An example of the set of good size distribution fits is shown on Fig. 5. With the set of fitted size distributions to choose from, the synthetic ground truth size distributions are randomly chosen and generated for the aerosol diameter range of 0.003–3.49 µm for each of the SMPS and LAS size bins to correspond with ACTIVATE size distribution data. Next, we randomly assign a CRI and κ to each of the ground truth size distributions.
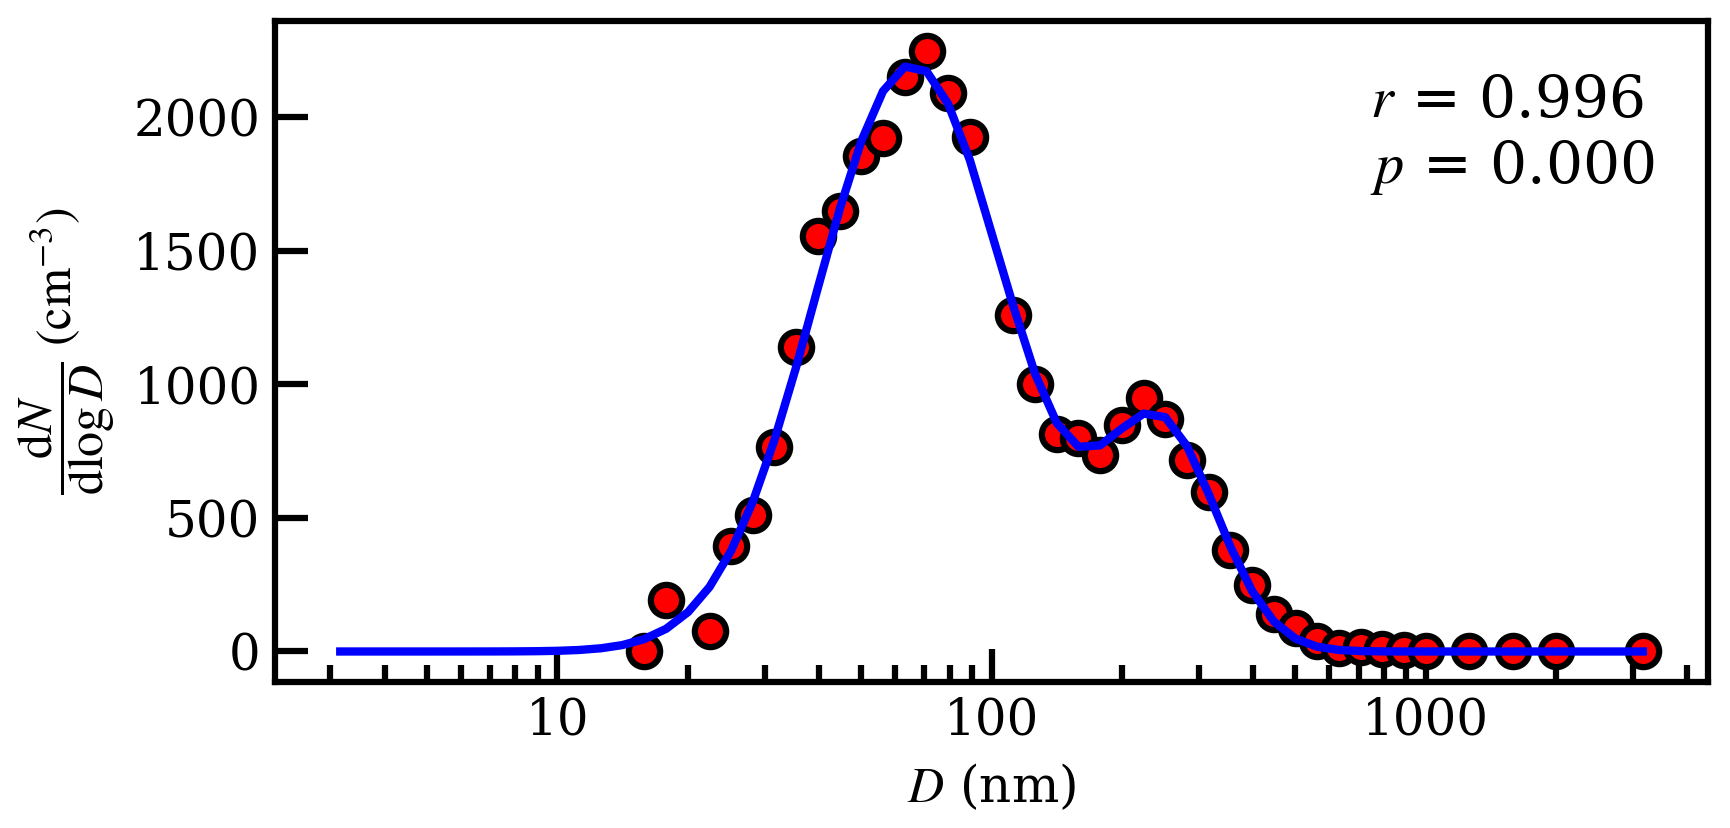
Figure 5One example out of the 473 size-distributions that serve as viable size-distributions for the synthetic data generation. The fitted n∘ (blue line) is compared to the measured n∘ (red dots).
For CRI, dry RRI is set 1.53 and IRI is randomly chosen from a range of 0.001–0.080. A κ is randomly chosen from the range of 0.00–1.40. Relative humidity for this analysis is held at 80 % and the corresponding gf range is 1.00–1.77. As a final step to generating ground truth aerosol properties, Eq. (3) is used in conjunction with the generated ground truth size distribution, CRI, and κ to calculate Cscat at wavelengths of 450, 550, and 700 nm, Cabs wavelengths of 470, 532, and 660 nm, and wet Cscat at the 550 nm wavelength. Next, we discuss how these ground truth aerosol properties are processed into synthetic measurements with appropriate measurement noise.
After generating the ground-truth intensive and extensive aerosol properties, synthetic dry in-situ measurements are created by applying appropriate measurement noise to the ground-truth properties. Measurement noise is bounded for each type of measurements using the random (precision) and systematic (accuracy) measurement uncertainties from Table 2. These uncertainties allow us to generate uniform measurement noise for the size distribution, the dry Cscat and Cabs, and the humidified Cscat noise properties. The measurement noise is applied to the ground-truth properties independently using the following equation:
where np is the SMPS resolution of 45 s and the Y is the synthesized value of the size resolved number concentration, dry spectral absorption and scattering coefficients, and humidified scattering coefficients. The randn operator generates a random number from a Gaussian probability distribution, which is centered around the expected value of 0 and has a standard deviation that is given by the term in parenthesis. The precision uncertainty is adjusted by dividing the uncertainties from Table 2 by the square root of the number of samples made in 45 s (i.e., np = 45) to represent the increase in measurement precision due to averaging. This adjustment in precision due to averaging is not applied to the synthetic SMPS data as its native resolution is 45 s (i.e., np = 1). With the steps to achieve synthetic measurement generation explained, we can now discuss how the synthetic measurements of aerosol properties were used to test ISARA and estimate the error of the CRI and κ retrievals.
Equation (16) allows for measurement noise to be added to each synthetically generated aerosol measurement. A total of 10 000 synthetic aerosol distributions are generated with CRI and κ. These parameters allow us to use the Mie scattering library to calculate synthetic values of Cscat and Cabs (results shown in Sect. 4.1); However, note that 77 of the synthetically generated measurements are removed due to the added noise that results in negative scattering, absorption, or n∘, which reduces the synthetic data set length to 9923. Once ISARA is used to retrieve CRI and κ from the synthetic data set, we can observe the forward modeling error inherent in the ISARA-derived CRI and κ under ideal conditions. These results are discussed in Sect. 4.1.
3.5 External Consistency Analysis Process
The process of data collocation is a complex four-dimensional problem that can always add uncertainty when comparing two measurements of aerosol in the environment. Achieving perfect collocation can be difficult due to spatial and temporal heterogeneity, which is made even more challenging with airborne data sets. In an effort to minimize the consistency error related to poor collocation, we use the platform collocation process that is explained in rigorous detail in Schlosser et al. (2024). We provide a short summary of the collocation process in this section. Additionally, this section provides a summary of the methods used to column-average the in-situ data for comparison with the RSP data, which is described with more detail in Schlosser et al. (2022).
The first step of the collocation process is to match the nearest HSRL-2 time stamp to each RSP scan. This is simply finding which of the 60 s HSRL-2 profiles is closest in time to a given RSP scan. Next, we identify viable cases for comparison that have a substantial presence of fine aerosol and low expected error by comparing HSRL-2 and RSP aerosol optical depth (AOD) at 532 nm (Table 1). Specifically, the HSRL-2 data are removed where the column AOD is < 0.08, which is the detection limit for the HSRL-2. Additionally, the RSP data are removed where fine AOD is < 0.1 and the normalized cost function of the RSP retrieval is > 0.15. Additionally we filter out data points with high expected error by removing data where the RSP- and HSRL-2-derived bulk AOD are in poor agreement. To limit the viable cases to ones where the RSP and HSRL-2 are in good agreement, the difference in HSRL-2-derived and RSP-derived total AOD must be < 50 % of HSRL-2-derived AOD or < 0.05, whichever is greater. With the remote sensing data collation process complete, we can collocate the remote sensing data to the Falcon's vertical profiles.
For this step, we use collocation data files described and produced in Schlosser et al. (2024) that provide a set of times and distances to facilitate the spatiotemporal collocation filtering. For this work, we limit the collocation periods to those where the Falcon performed a ascent or descent. These vertical profiles are identified using the leg identifier available as part of the ACTIVATE data set (Sorooshian et al., 2023). The points of interest are classified as part of a Falcon spiral, ascent, or descent vertical profile. During the ascent and descent profiles, the Falcon would limit its rate of altitude change to ∼ 150 m min−1 while performing a vertical profile while continuing to move in one direction. During the spiral profiles, the Falcon would spiral around a predetermined location while ascending or descending in addition to limiting its rate of altitude change to ∼ 150 m min−1. The SMPS scans typically cover 112–113 m in a 45 second scan.
Once the desired data from the vertical profiles are identified, we select the remote sensing profile that is the nearest (horizontally) to a Falcon profile and is within 6 min of the start or stop time of the Falcon's profile. Once a viable profile collocation is identified, ISARA products are averaged to the 225 m HSRL-2 bins for the HSRL-2 comparisons or weighted by extinction and averaged through the entire profile for RSP comparisons. For the case of the HSRL-2-ISARA comparisons, this averaging results in altitude-resolved properties for a given column of air. For the RSP-ISARA comparisons, this results in a column-average property. Note that for ISARA-AOD, the ambient extinction is vertically integrated with sample altitude and does not account for the altitude bins above or below the sample altitudes. This allows us to estimate the amount of the total aerosol column that was sampled by the Falcon and compare that to the standard column AOD products derived from the HSRL-2 and the RSP. As a final step of the external consistency analysis, we use information gained from the collocated HSRL-2-derived LDR and LR to make some final adjustments to the assumptions made regarding the coarse aerosol shape, CRI, and κ.
Specifically, we categorize the points with LDR < 0.08 as spherical and do not alter the naive assumption made for the coarse aerosol as described in Sect. 3.3. We categorize points where LDR > 0.08 and LR < 35 as oblate spheroids with an eccentricity of 1.1, CRI = , and κ = 1.2. Note that hygroscopic adjustment is only needed to dilute the CRI as the aerosol diameters measured by the optical probe are at ambient conditions. Additionally, we categorize points where LDR > 0.08 and LR > 35 as a distribution of spheroids, CRI = 1.52+0.0043i, and κ = 0.1. The distribution of spheroids found to be best is the one suggested by Dubovik et al. (2006). These two categories of assumptions were determined as possible appropriate properties based on our analysis of case studies (Sect. 4.3.1). Given the available optical libraries within MOPSMAP, we found these categories improved our external consistency statistics as was observed in Sect. 4.3.1 and 4.3.
To provide aerosol source information for the discussion in Sect. 4.3.1, this study uses 96 h isentropic back-trajectories from NOAA's Hybrid Single Particle Lagrangian Integrated Trajectory model (HYSPLIT; e.g., Stein et al., 2015). The input meteorological data were obtained from the North American Mesoscale Forecast System (NAM) with a horizontal resolution of 12 × 12 km2 (Rolph et al., 2017).
4.1 Synthetic Consistency Results
Here we present a consistency analysis of ISARA-derived in-situ IRI and κ with synthetically-generated data. Before delving into these comparisons, synthetically-generated size distribution data are shown to provide context on how synthetic IRI and κ differ from ISARA-derived ones (Fig. 6). The synthetic size distribution data are contained within the range of number, surface, and volume concentrations observed during ACTIVATE (Fig. 1), but the synthetic data see fewer aerosol above 1 µm, relative to the ACTIVATE data. Additionally, the synthetic data see higher concentrations in the 0.1–1 µm size-range. Despite these differences, the synthetic data set has a reasonable variety in size distributions that is comparable to the ACTIVATE data set.
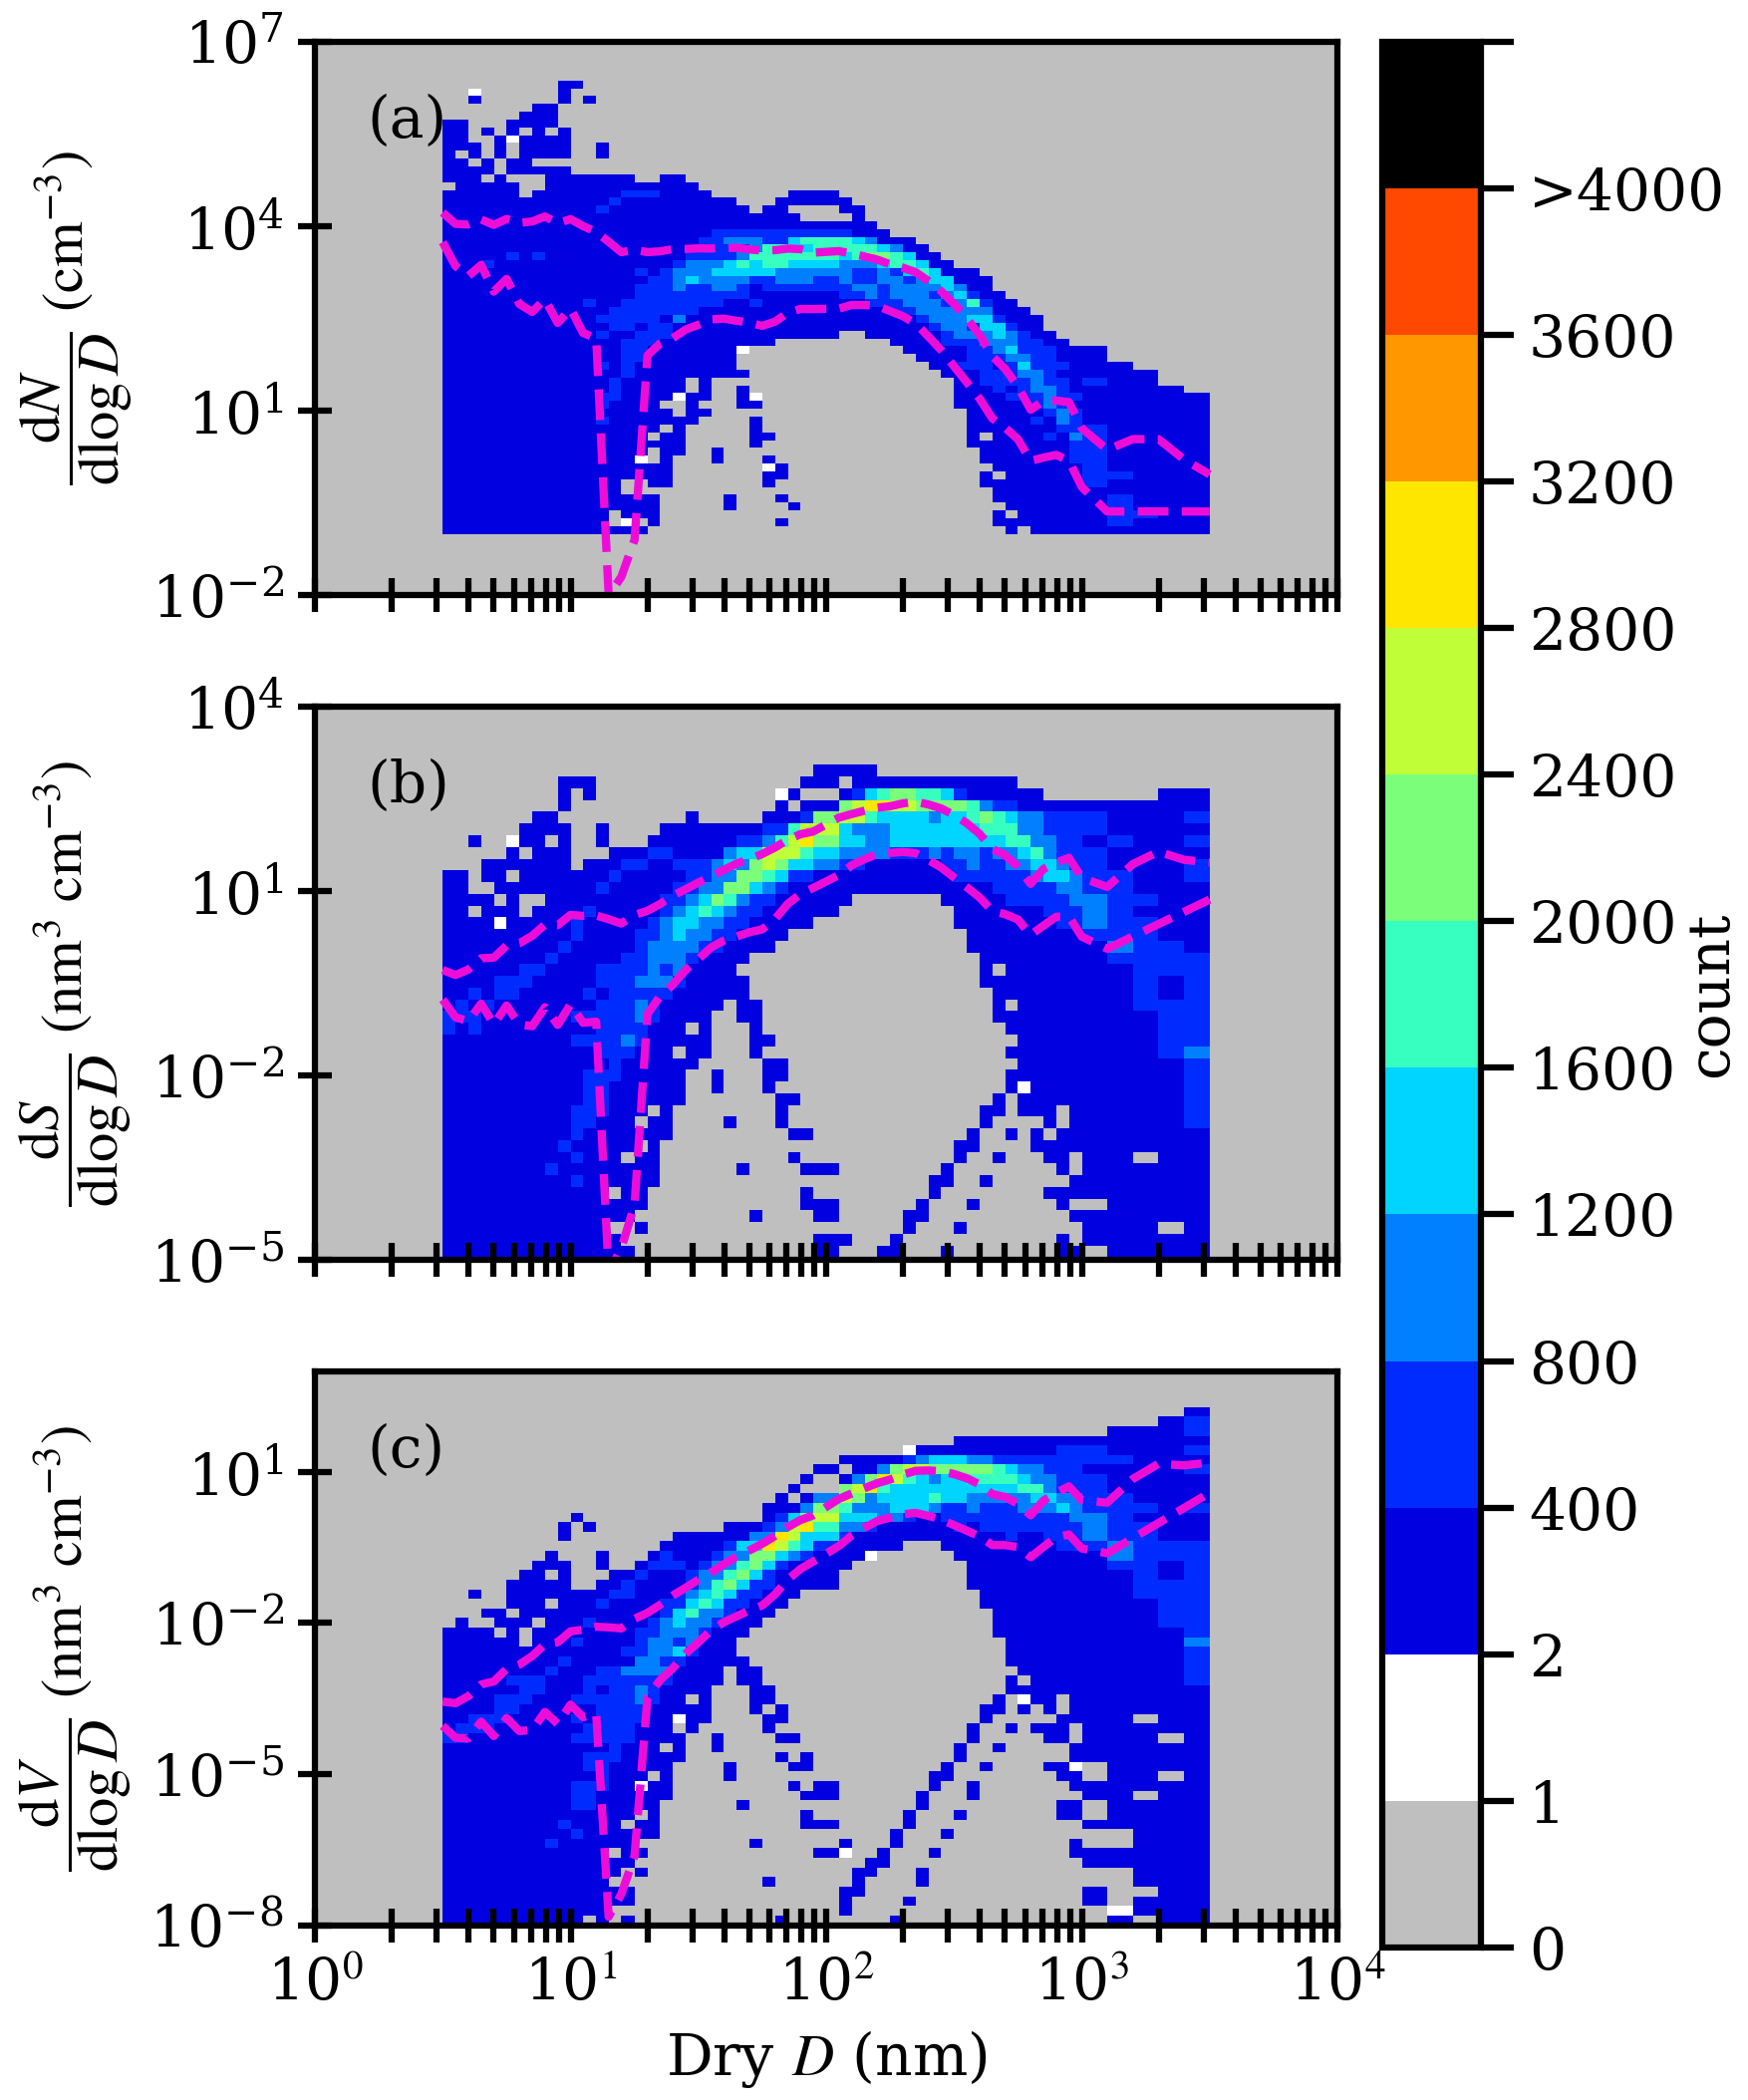
Figure 6Logarithmic size-resolved aerosol (a) n∘, (b) s∘, and (c) v∘ versus dry particle diameter (Ddry) from the 9923 synthetic data points. The bottom and top dashed lines represent the 10th and 90th percentiles of each bin, respectively, and the color bar indicates density of points in a given area of the plot.
As mentioned in Sect. 3.4, theoretical size distributions are used to generate synthetic IRI and κ values. These synthetic values are now compared to corresponding ISARA-derived data (Fig. 7). Note that all biases reported in this section are calculated with the ground truth synthetically generated data as the reference (See Eqs. C6 and C7 in Appendix C). Of the 9923 synthetically generated data points, 90.74 % have successful retrieval of both IRI and κ. Out of all possible retrievals, 2.60 % failed the κ but had a successful IRI retrieval. This κ retrieval success rate (see Eq. 13) is 97.40 %, which is close to the 95.84 % success rate observed in the ACTIVATE retrieval of κ. It is observed that both IRI and κ comparisons show strong correlation coefficients of 0.99. Additionally, the MRB near zero which is −3 % for IRI and 3 % for κ. The NRMSD for IRI and κ are 4 %. Finally, the observed SRB for IRI is 17 % and for κ is 20 %.
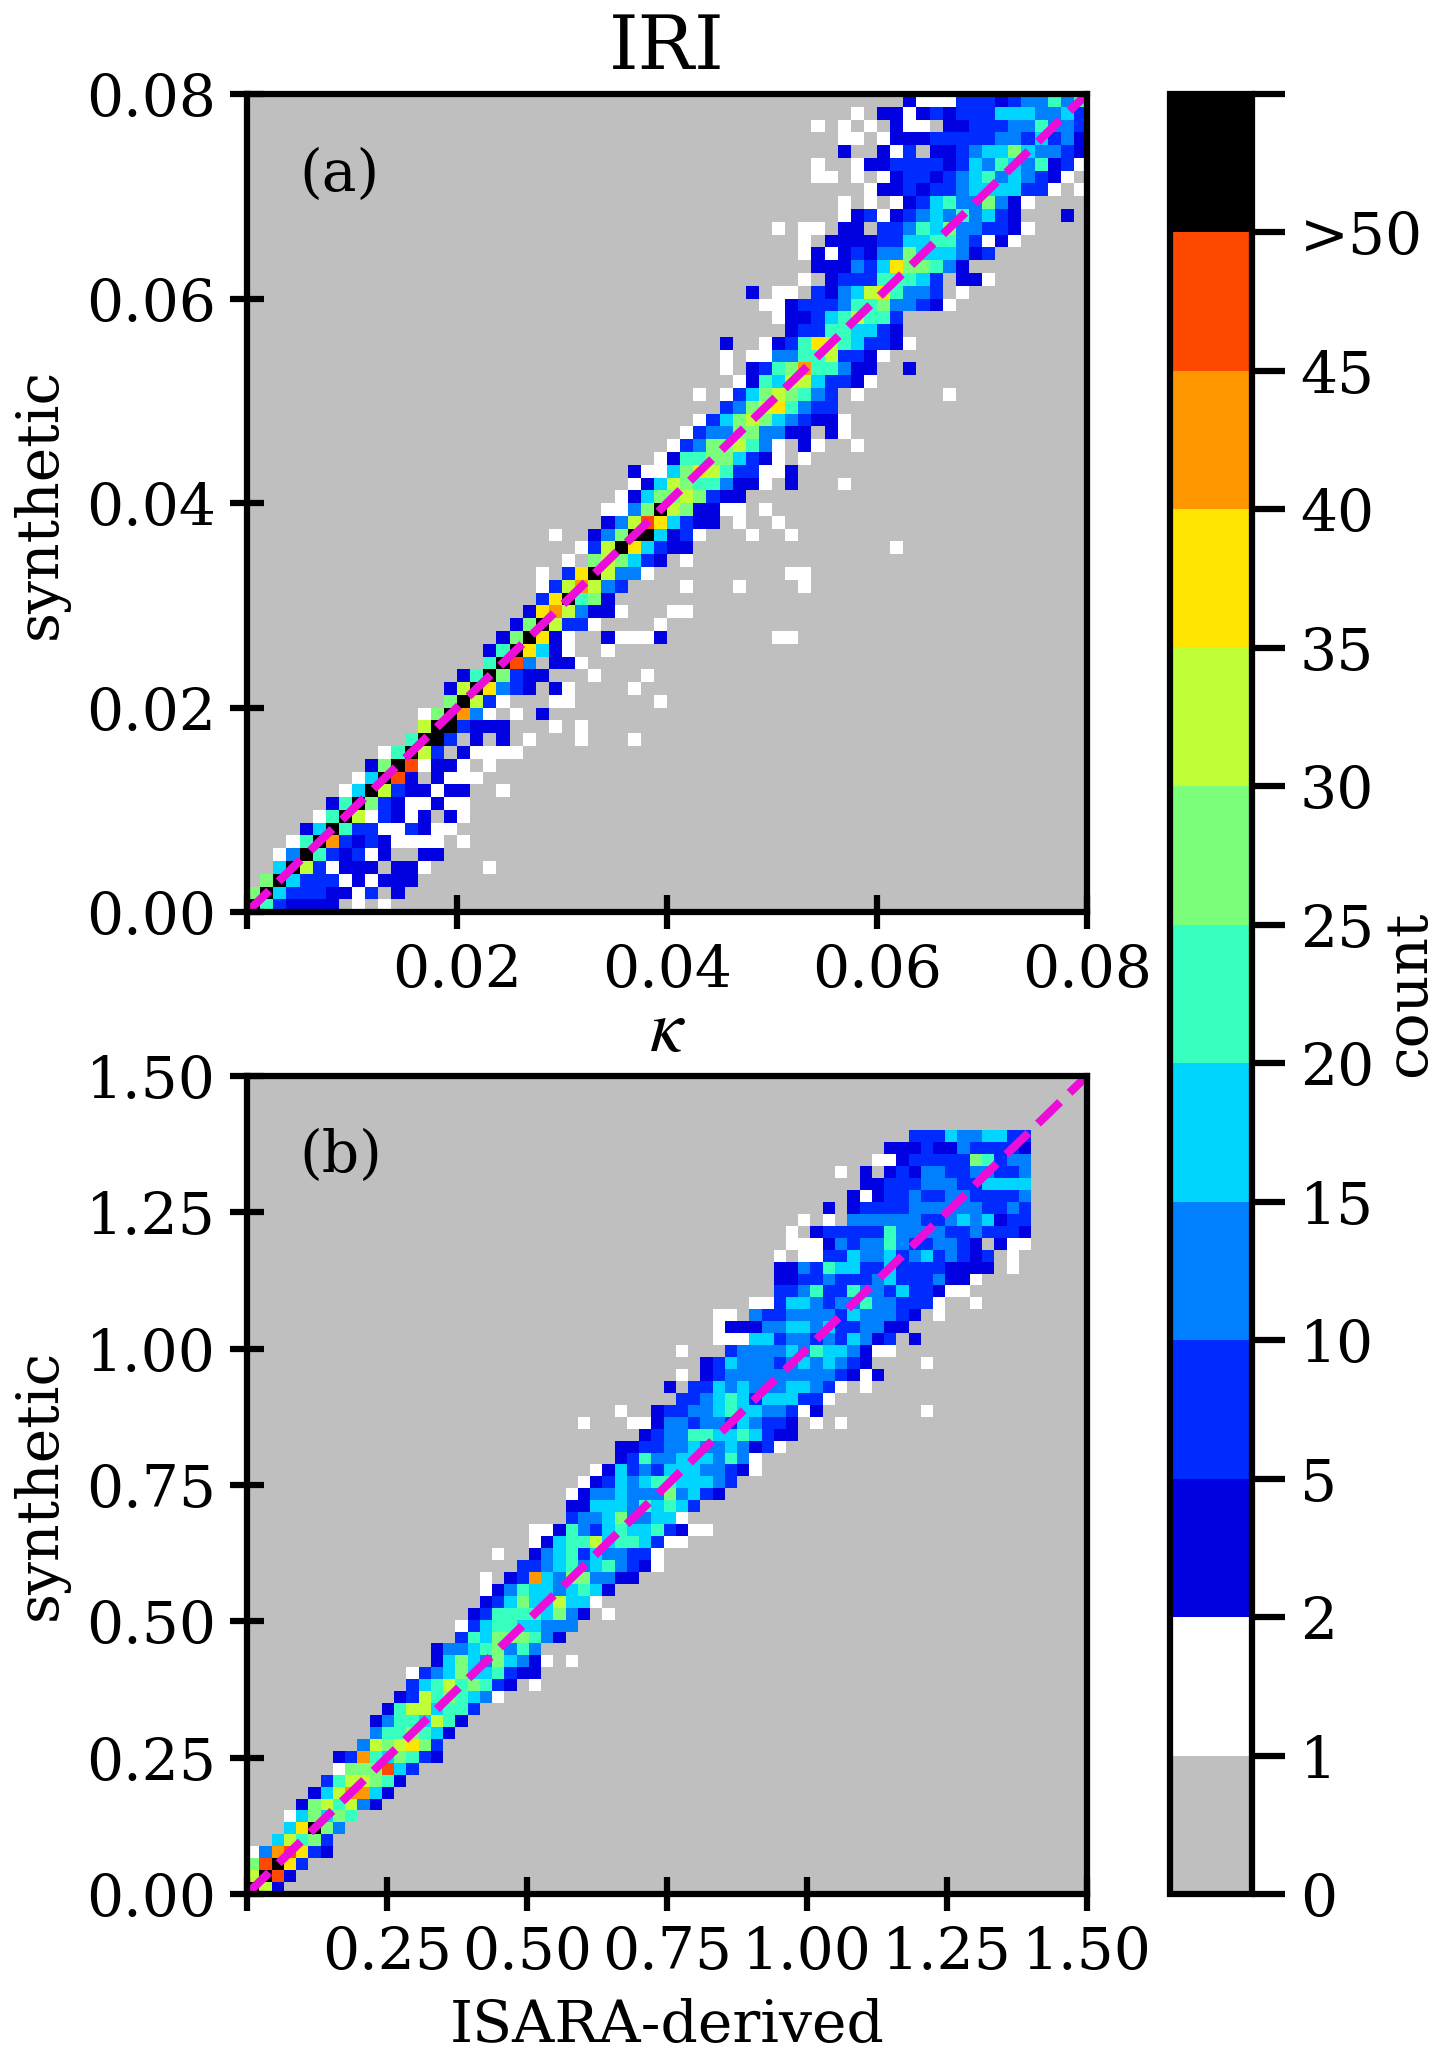
Figure 7Heat map scatterplot of ISARA-retrieved versus synthetic (a) IRI (count = 9244, r = 0.99, MRB = −3 %, SRB = 17 %, and NRMSD = 4 %) and (b) κ (count = 9004, r = 0.99, MRB = 3 %, SRB = 20 %, and NRMSD = 4 %). The dashed line represents the one-to-one line and the color bar indicates density of points in a given area of the plot.
Based on the observed SRB, it is expected that the ISARA-derived IRI and κ each agree within 20 % under ideal assumptions of spherical shapes, a spectrally flat CRI, and a well-constrained RRI. Given the strong correlations and low biases, it is found that error as a result of forward modeling for spherical aerosols with a constrained dry RRI (1.51 ≤ RRI ≤ 1.55) should not have a significant impact on the retrieval of a single effective IRI and κ from the size distribution, scattering coefficient, and absorption coefficient data measured during missions such as ACTIVATE.
To demonstrate the functionality of this analysis, the synthetic data generation and retrieval processes were repeated with zero measurement noise, which results in a rate of successful retrievals of 100 %. Synthetic consistency analysis can be extended further to include nonspherical aerosols, aerosols without a constrained RRI, and increasing the number of successful retrievals under higher noise and lower signal conditions (e.g., lower aerosol concentrations, weakly scattering or weakly absorbing aerosol).
4.2 Internal Consistency Results
As mentioned in the Introduction and Sect. 3, ISARA-calculated in-situ data are first compared with corresponding measurements from ACTIVATE's in-situ instruments to verify the robustness of the algorithm's retrieval method. Note that all biases reported in this section are calculated with the measured in-situ data as the reference (See Eqs. C6 and C7 in Appendix C). First, ISARA retrievals of dry scattering and absorption coefficients are verified against corresponding measurements from the nephelometer and PSAP described in Sect. 3.2 (Fig. 8). A total of 18 042 in-situ data points met the following criteria: (1) cloud-free conditions, (2) signal > 1 Mm−1 in all three dry scattering measurements, (3) signal > 0 Mm−1 in all three dry absorption measurements, and (4) at least three non-zero n∘ measurements from both the SMPS and LAS instruments. Of these 18 042 data points, there are 11 914 points that had the successful retrieval of CRI and 11 418 had the successful retrieval of both CRI and κ. The observed success rate for dry CRI alone is 66.03 %, which is lower than the success rate of 90.74 % observed for the synthetic consistency analysis (Sect. 4.1). Compared to the synthetic data set, the relatively lower retrieval success rate observed in the measured data set could be an indication that some of the measured data might be influenced by aerosols that violate the sphericity or the spectrally flat CRI assumptions. The lower retrieval success rate could also be as a result of higher measurement noise than prescribed in the generation of the simulated data.
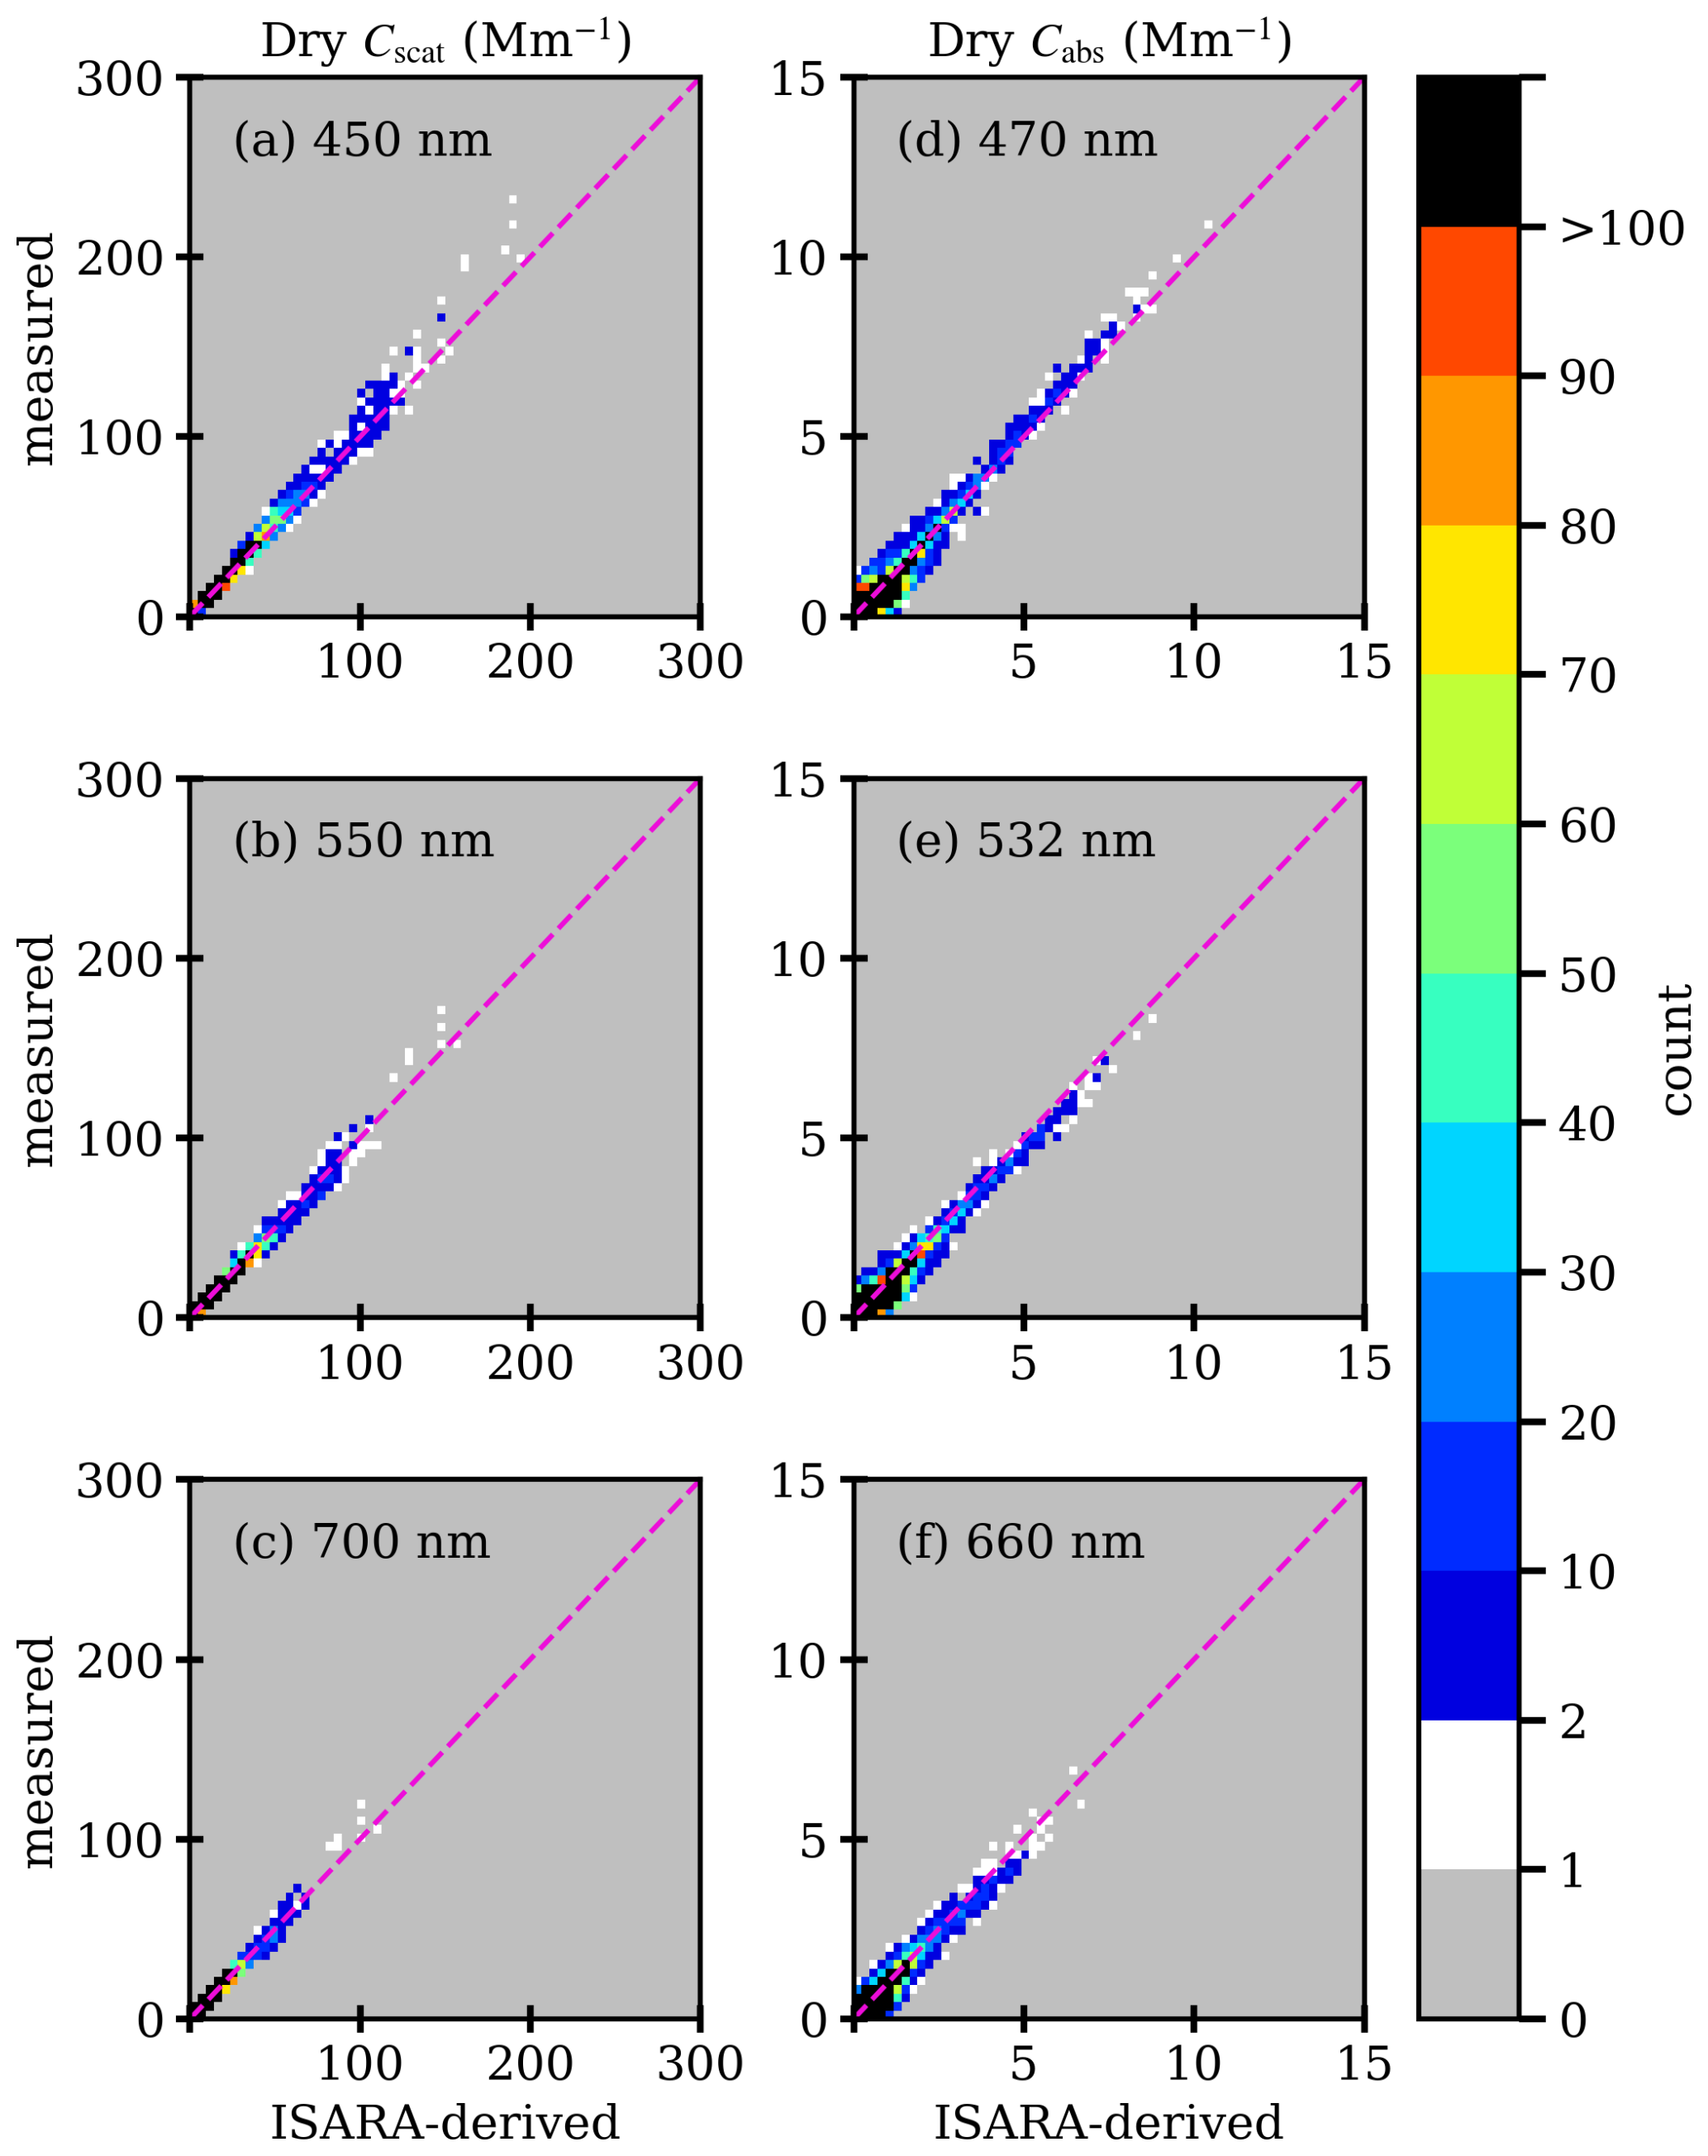
Figure 8Heat map scatterplots of measured versus ISARA-derived in-situ values of dry scattering coefficient at (a) 450 nm (r = 0.99, MRB = 4 %, SRB = 8 %, NRMSD = 1 %), (b) 550 nm (r = 0.99, MRB = −1 %, SRB = 9 %, NRMSD = 1 %), and (c) 700 nm (r = 0.99, MRB = 2 %, SRB = 11 %, NRMSD = 1 %). Also plotted are measured versus ISARA-derived in-situ values of dry absorption coefficient at (d) 470 nm (r = 0.96, MB = −0.06 Mm−1, SB = 0.29 Mm−1, NRMSD = 3 %), (e) 532 nm (r = 0.95, MB = −0.11 Mm−1, SB = 0.27 Mm−1, NRMSD = 3 %), and (f) 660 nm (r = 0.93, MB = −0.07 Mm−1, SB = 0.24 Mm−1, NRMSD = 4 %). There are 11914 ISARA retrievals that resulted from the ACTIVATE 2020–2022 data set. The dashed line represents the one-to-one line and the color bar indicates density of points in a given area of the plot.
As mentioned in Sect. 3.2.2, we performed a sensitivity analysis to motivate our choice of using the bin with Dgm = 2 µm as the upper limit to the aerosol size distributions measured during ACTIVATE 2021–2022. In this sensitivity analysis, we found that the next two highest bins with Dgm = 1.59 and 1.26 µm, respectively, resulted in a decrease in the ISARA success rate of 55 % and 37 %, respectively. There is also a decrease in the internal consistency as all measures of bias increase when a smaller diameter cutoff is used as the upper threshold of the aerosol size distribution.
It is observed that for all three wavelengths, the two sets of dry scattering coefficient measurements correlate nearly perfectly (i.e., r = 0.99) and agree within 2 % of each other in terms of NRMSD (see Fig. 8). Across all three channels, the ISARA-derived MRB is < 5 % compared the measured dry scattering coefficient. The best agreement in scattering coefficients is observed at the 532 nm wavelength with MRB = −1 %. Furthermore, the SRB ranges from 8 % to 11 %. Finally, the maximum observed relative bias in scattering coefficients is 22 % in all channels. These findings demonstrate the fidelity of the ISARA-derived coefficients for the majority of retrievals, but there are still some cases where the observed relative bias could be improved on.
Sources of this bias could be the assumption of a spectrally flat CRI and the assumption of a well constrained RRI of 1.53 ± 0.02. While the relative bias is important, to consider the bias scattering for all three channels have MB that range from −0.23 to 0.80 Mm−1 and SB that range from 1.61 to 2.27 Mm−1. The low mean and spread in bias suggests that the ISARA-derived dry coefficients are within the expected scattering measurement error (20 %) and are less reliable at relatively low scattering signal (i.e., signal < 5 Mm−1).
Dry absorption is also internally consistent as seen by strong r (0.96, 0.95, and 0.93) and NRMSD (3 %, 3 %, and 4 %) values. As with the scattering coefficient comparisons, the MB between the ISARA- and PSAP-derived dry absorption are small relative to the measurement uncertainty. The MB and SB range from −0.11 to −0.06 Mm−1 and from 0.24 to 0.29 Mm−1, respectively. Similar to the dry scattering coefficients this indicates that the ISARA-derived absorption coefficients are within expected measurement error (1 Mm−1) and less reliable when the absorption signal is < 1 Mm−1. Overall, internal consistency of the dry absorption coefficient is deemed successful, but it is important to keep these biases in the absorption and scattering coefficients in mind when calculating secondary optical properties that rely on it, such as Cext and SSA.
Now, ISARA retrievals of the wet Cscat and f(RH) are evaluated to test how well the κ retrieval performs before calculating final ambient aerosol properties (Fig. 9). Strong correlation coefficients (r = 1.00 and 0.85), strong agreement (NRMSD = 0.2 % and 6 %), low systematic bias (MRB = 1 % and 1 %), and low variability in bias (SRB = 0.13 % and 9 %) are seen between the two data sets. Due to the limitations of the aircraft instrument suite, the derived κ is not sensitive to ultrafine aerosols. Future iterations of ISARA for different instrument suites can involve implementing multiple κ parameters and having a non-soluble mode, which has been shown to be useful in other consistency studies (van Diedenhoven et al., 2022).
Figure 9Heat map scatterplot of measured versus ISARA-derived in-situ values for (a) wet scattering coefficient at 550 nm (r = 1.00, MRB = 1 %, SRB = 0.1 %, NRMSD = 0.2 %) and (b) 550 nm f(RH) at 80 % RH (r = 0.85, MRB = 2 %, SRB = 9 %, NRMSD = 5 %) from the 11 914 successful ISARA retrievals that resulted from the 2020–2022 ACTIVATE data. The dashed line represents the one-to-one line and the color bar indicates density of points in a given area of the plot.
Based on the conditions detailed in Appendix C, wet Cscat and f(RH) at 550 nm are deemed internally consistent with the ISARA-derived values. The internal checks demonstrate that in a “perfect model” world the system works. In the next section we can examine how consistent the ISARA-derived aerosol products are as compared to the under-determined environmental system that relies on coordinated sampling by separate platforms and various retrieved ISARA and HSRL-2-products.
4.3 External Consistency Results
4.3.1 Case Studies
After performing the procedures detailed in Sect. 3, ISARA-derived in-situ measurements of aerosol properties can be compared to the coincident HSRL-2 and RSP retrievals for 2020–2022 ACTIVATE data. There are a total of 49 vertical profiles that are absent of clouds and meet the required collocation thresholds. Of the 49 vertical profiles, 10 of them have at least 3 points of comparison between the in-situ and HSRL-2 data that make these 10 profiles potentially useful for comparison with column averaged properties. The ancillary information, RSP-, HSRL-2-, and ISARA-derived AOD, as well as the r and p resulting from the comparison of HSRL-2- and ISARA-derived Cext at 532 nm for these 10 cases are listed in Tables 3 and 4. Table 4 also shows the number concentration of aerosol with diameter greater than 5 µm (N>5 µm), which is notably in the measurement noise range for the CAS for many of the cases. Note that all biases reported in this section are calculated using the remote sensing data as the reference values (See Eqs. C6 and C7 in Appendix C). The thresholds used to define reasonable consistency are also discussed in Appendix C.
Table 3Ancillary information for each of the 10 case studies. The case number, latitude and longitude of the center point of the Falcon's vertical profile (i.e., location), the start and stop times of the Falcon's profile, the associated RSP sample time, the minimum and maximum altitudes sampled by the Falcon (i.e., in-situ) aircraft, the horizontal separation between the center point of the Falcon's profile and King Air (i.e., platform separation), the number of smoke counts above 2.5 km identified by the HSRL-2 typing product, and the HSRL-2-derived LDR. All dates and times are provided in coordinated universal time (UTC) and in the format “year-month-day” and “hour:minute:second”, respectively.
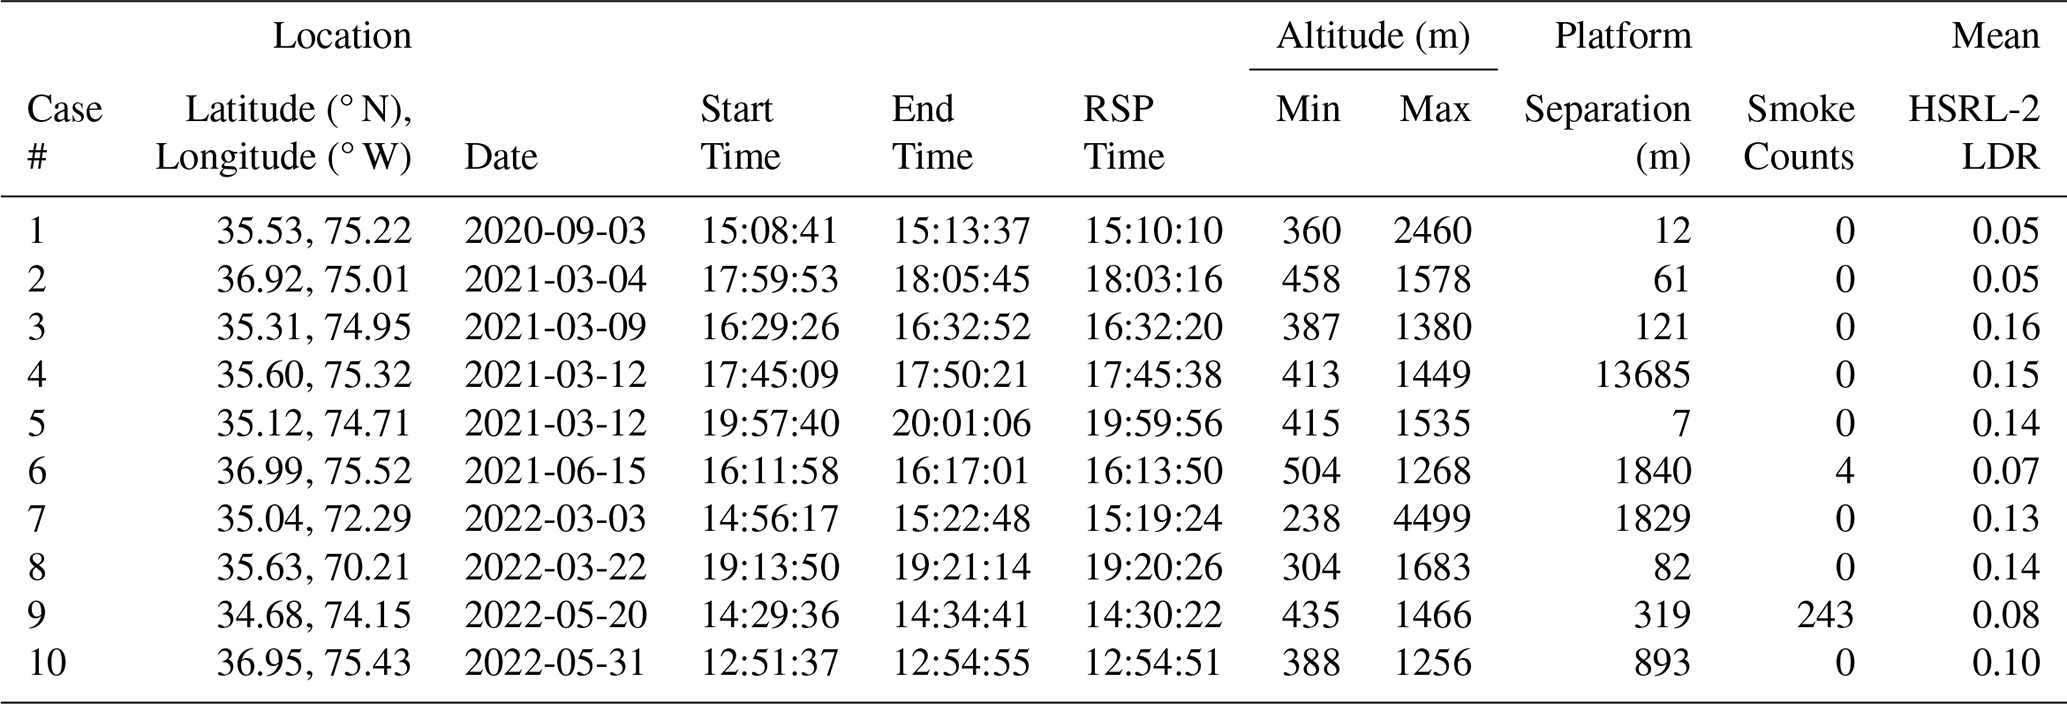
Table 4Aerosol optical depth at 532 nm derived from RSP, HSRL-2, and ISARA for each of the 10 case studies. Note that for ISARA-AOD, the ambient extinction is vertically integrated with sample altitude and does not account for the altitude bins above or below the sample altitudes. Also shown are the r and p resulting from the comparison of HSRL-2- and ISARA-derived Cext at 532 nm, the number of comparisons (i.e., count), the minimum and maximum , and the maximum observed N>5 µm.
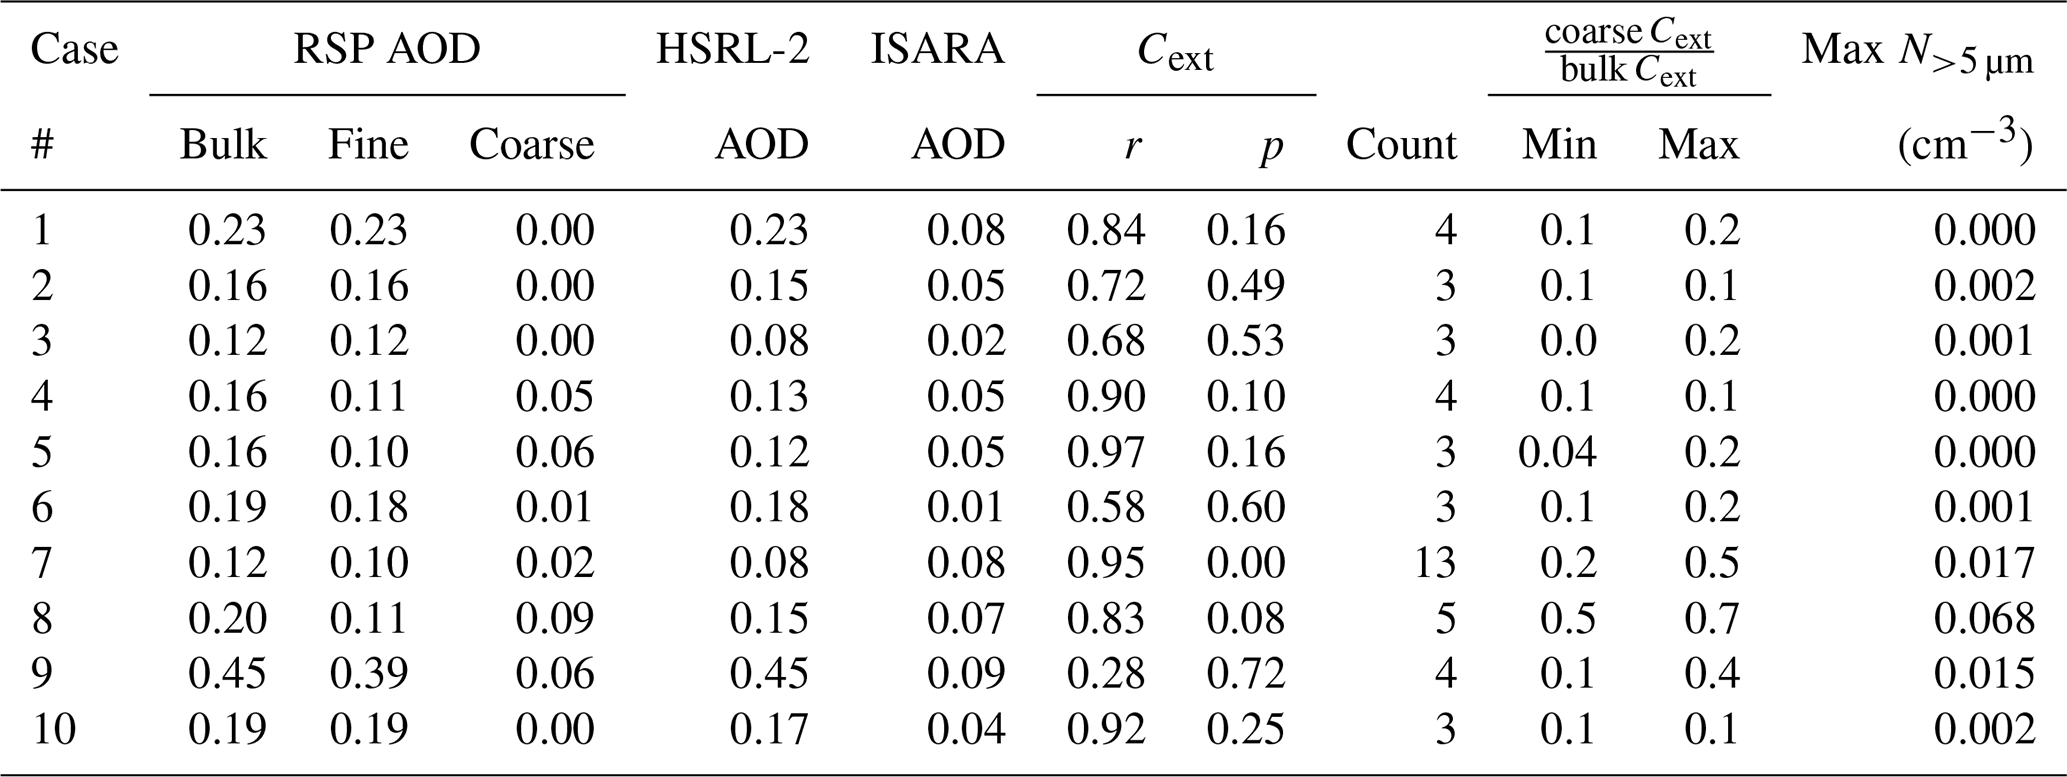
The ancillary information (Table 3) includes the case number, the location, start, and stop times of the Falcon's profiles. Additionally, the associated RSP sample time is provided to get a sense of the temporal separation between the King Air and Falcon's sample times. The minimum and maximum altitudes sampled by the Falcon aircraft are shown to provide a measure of the vertical extent of the Falcon's profile. Also provided are the number of smoke counts above 2.5 km as identified by the HSRL-2, which is an indicator of high altitude smoke layers. The smoke counts above 2.5 km are taken to be the sum of all the altitude bins above 2.5 km that are flagged as smoke from the HSRL-2 typing product (Burton et al., 2012). Finally, the HSRL-2-derived mean LDR provides us with a measure of the amount of nonspherical aerosols in each profile.
A vertical profile labeled Case 7 (Research Flight 131 on 3 March 2022) is chosen from Table 3 to examine how well ambient in-situ aerosol optical and microphysical measurements produced by ISARA compare with analogous RSP retrievals, which has not been shown in literature to date. On this day, a “unicorn” spiral was performed over the Atlantic ∼ 450 km east of the coast of North Carolina. This vertical profile is exceptional for four primary reasons: (1) this profile has the most number of viable comparisons between the HSRL-2- and ISARA-derived properties, (2) the 532 nm extinction derived from the HSRL-2 and ISARA have the highest correlation (r = 0.95) of any of the profiles, (3) this profile shows the best agreement between the ISARA-derived 532 nm AOD and the 532 nm AOD derived from both the RSP and the HSRL-2, and (4) this profile extends more than 4 km, which is the largest extent of any profile by 2 km over the next largest profile.
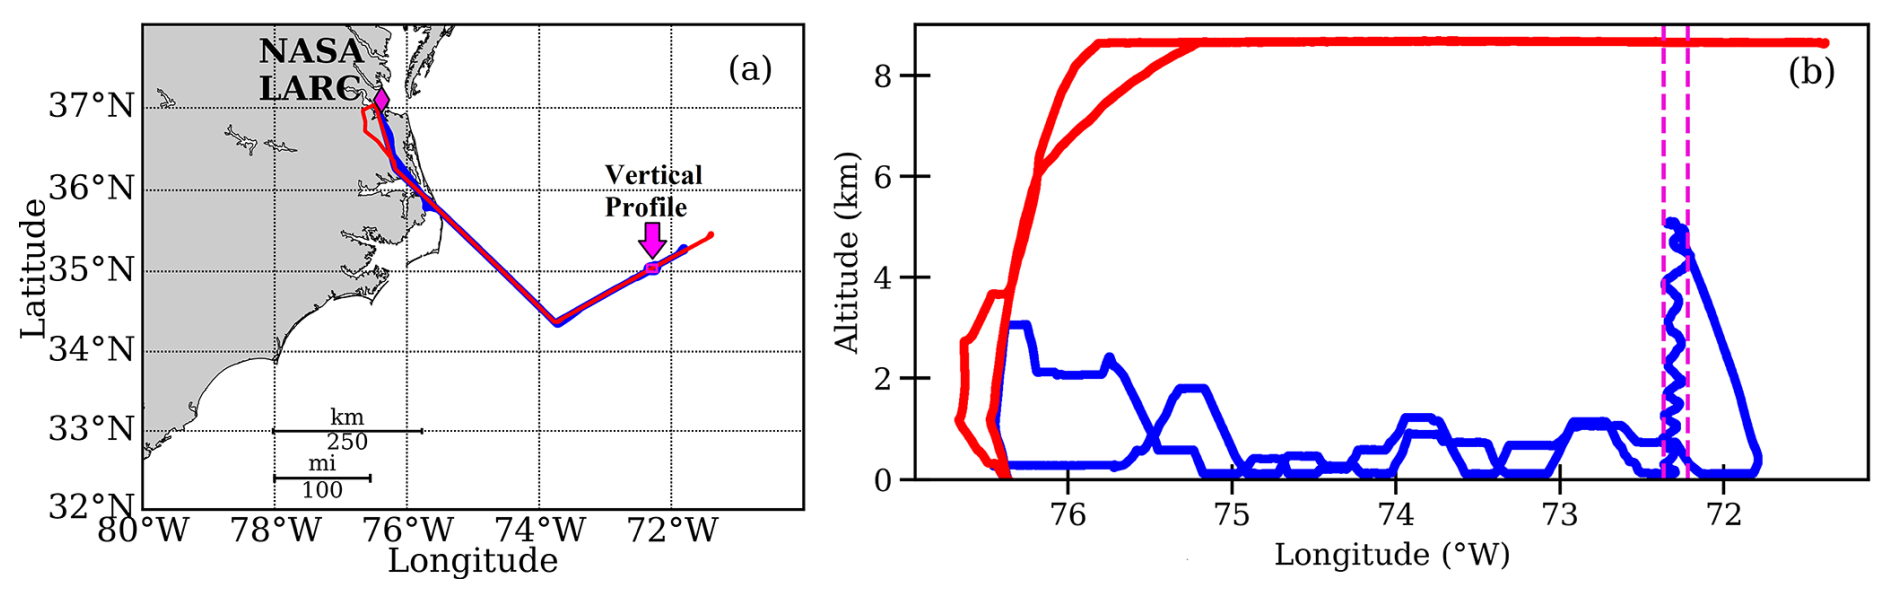
Figure 10(a) Top-down and (b) longitudinal views of the Falcon and King Air flight tracks from Research Flight 131. The blue and red lines represent the Falcon and King Air flight paths, respectively. The location of the “unicorn” spiral (Case 7) is bounded by the magenta box in panel (a) and by the vertical dashed lines in panel (b).
The Case 7 unicorn spiral involved the Falcon aircraft performing a spiral ascent from an altitude of 238 m to an altitude of 4.5 km to fully vertically sample a rich aerosol layer identified as having urban/pollution and dust species by the HSRL-2 aerosol typing algorithm (Burton et al., 2012). As illustrated by Fig. 10, the Falcon spiral began at 14:56 UTC and ended at 15:22 UTC, while the RSP sample time was at 15:19 UTC. For this clear-sky aerosol scenario over the ocean, the distance of the Falcon-in-situ spiral to the closest valid RSP-King Air overpass is 1.8 km. No cloud contamination is identifiable in the HSRL-2, RSP, or camera images.
The four-day HYSPLIT back trajectories are run at the altitudes of 0.5, 1.5, and 3.0 km above sea level, at 16:00 UTC on 3 March 2022, and at the location of the “unicorn” spiral (Fig. 11). These back trajectories use the meteorological data from the North American Mesoscale Forecast System (NAM) 12×12 km2 HYSPLIT meteorological data set. From these back trajectories, it is evident that the air mass that was sampled during this case was outflow from North America. This information indicates that the fine aerosols being sampled are likely anthropogenic and organic in origin that are often sulfate mixtures with secondary organic aerosol species. This type of air mass is typical of what would be expected for this marine environment based on climatological evidence (Braun et al., 2021).
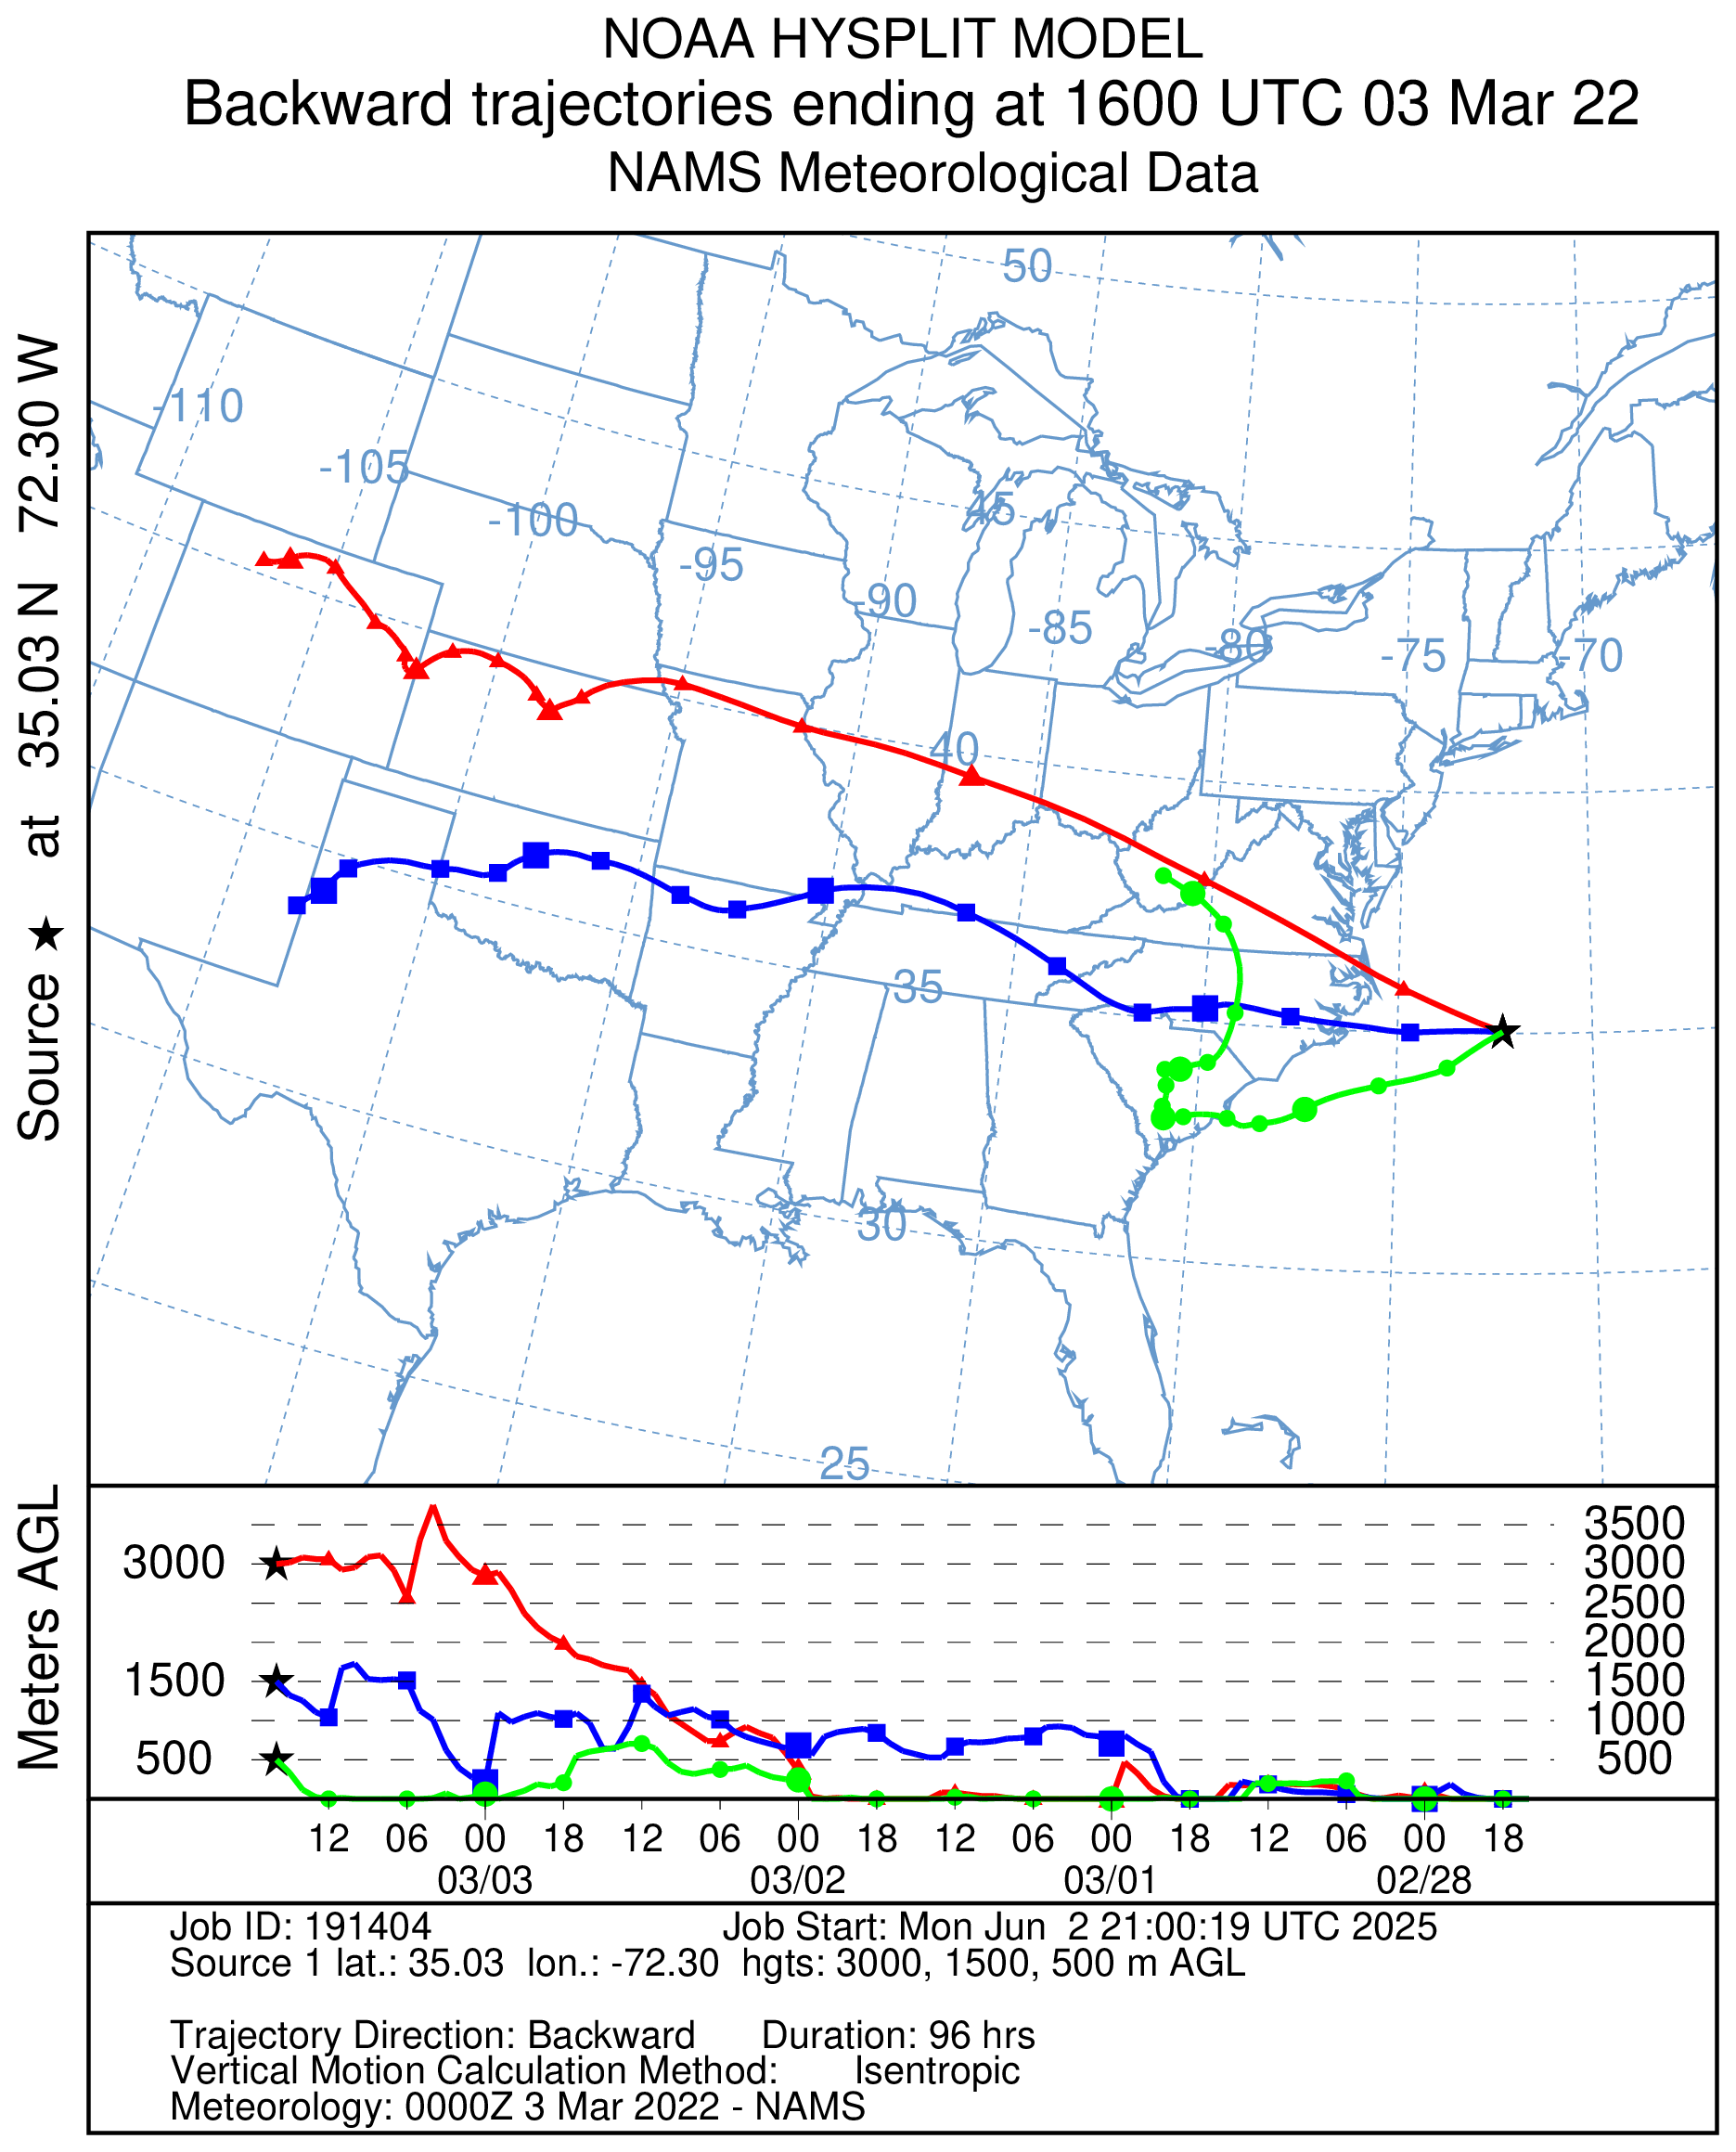
Figure 11Four-day HYSPLIT back trajectories end at the altitudes of 0.5, 1.5, and 3 km above sea level, at 16:00 UTC on 3 March 2022, and at the location of the center point of the “unicorn” spiral (Case 7) from Research Flight 131.
Table 5Consistency statistics resulting from the comparisons of the altitude-resolved aerosol properties of spectral Cext, Cbsc, and LR, as well as N. The consistency statistics shown correspond to the vertical profile from for Case 7 shown on Figs. 12 and 13a.
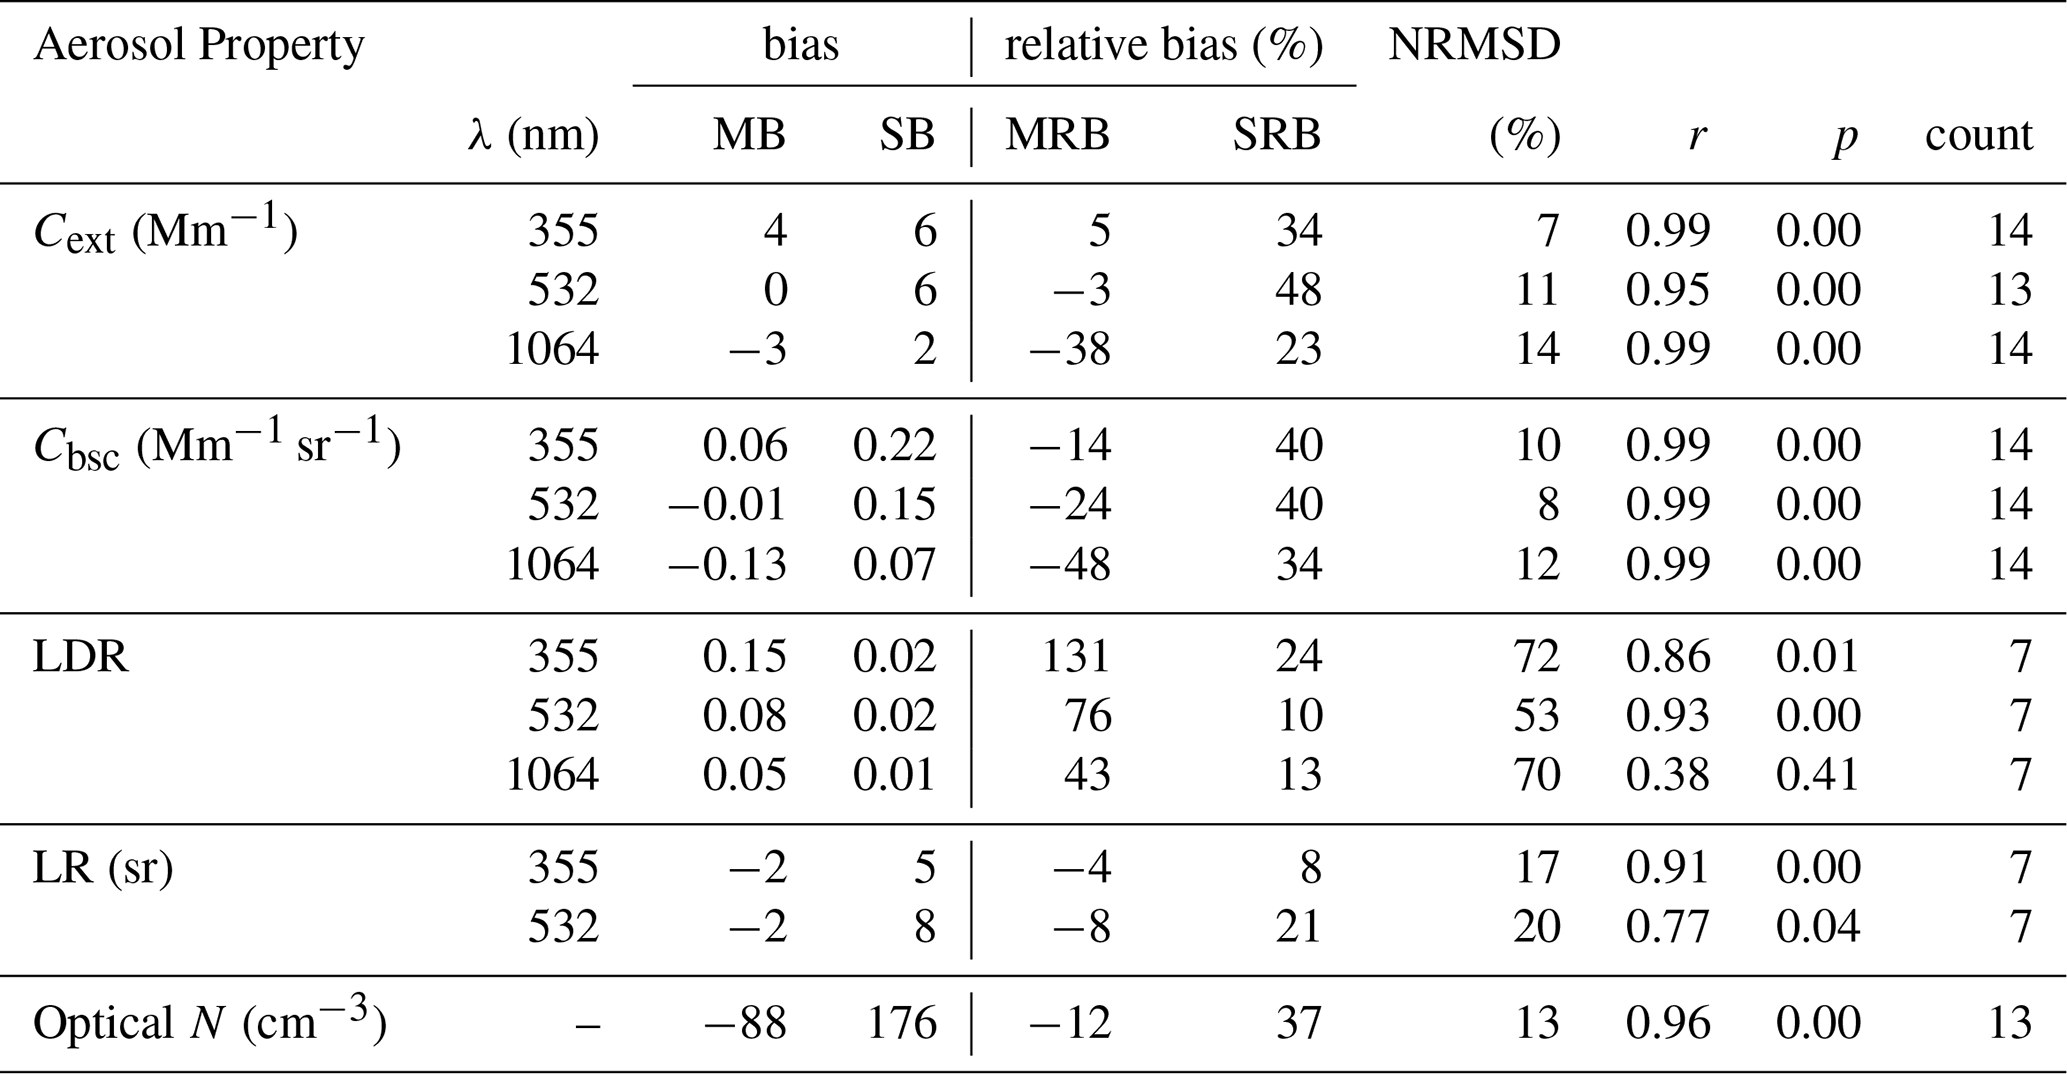
Figure 12 shows the profiles of altitude-resolved Cext, Cbsc, and LR in all three available wavelengths. Figure 12 also shows the ratio of coarse to bulk extinction at 532 nm. Figure 13 shows the HSRL-2+RSP and ISARA-derived N, HSRL-2- and ISARA-derived spectral LDR, and the measured ambient RH. The remaining panels show the vertical profiles of ISARA-derived κ, RRI, IRI, fine SSA, total SSA, fine and coarse reff, and fine and coarse veff. These panels also illustrate how the column-averaged properties derived from the RSP compare to the altitude-resolved data derived from the ISARA. The consistency statistics resulting from the comparisons of the altitude-resolved aerosol properties are illustrated by Table 5.
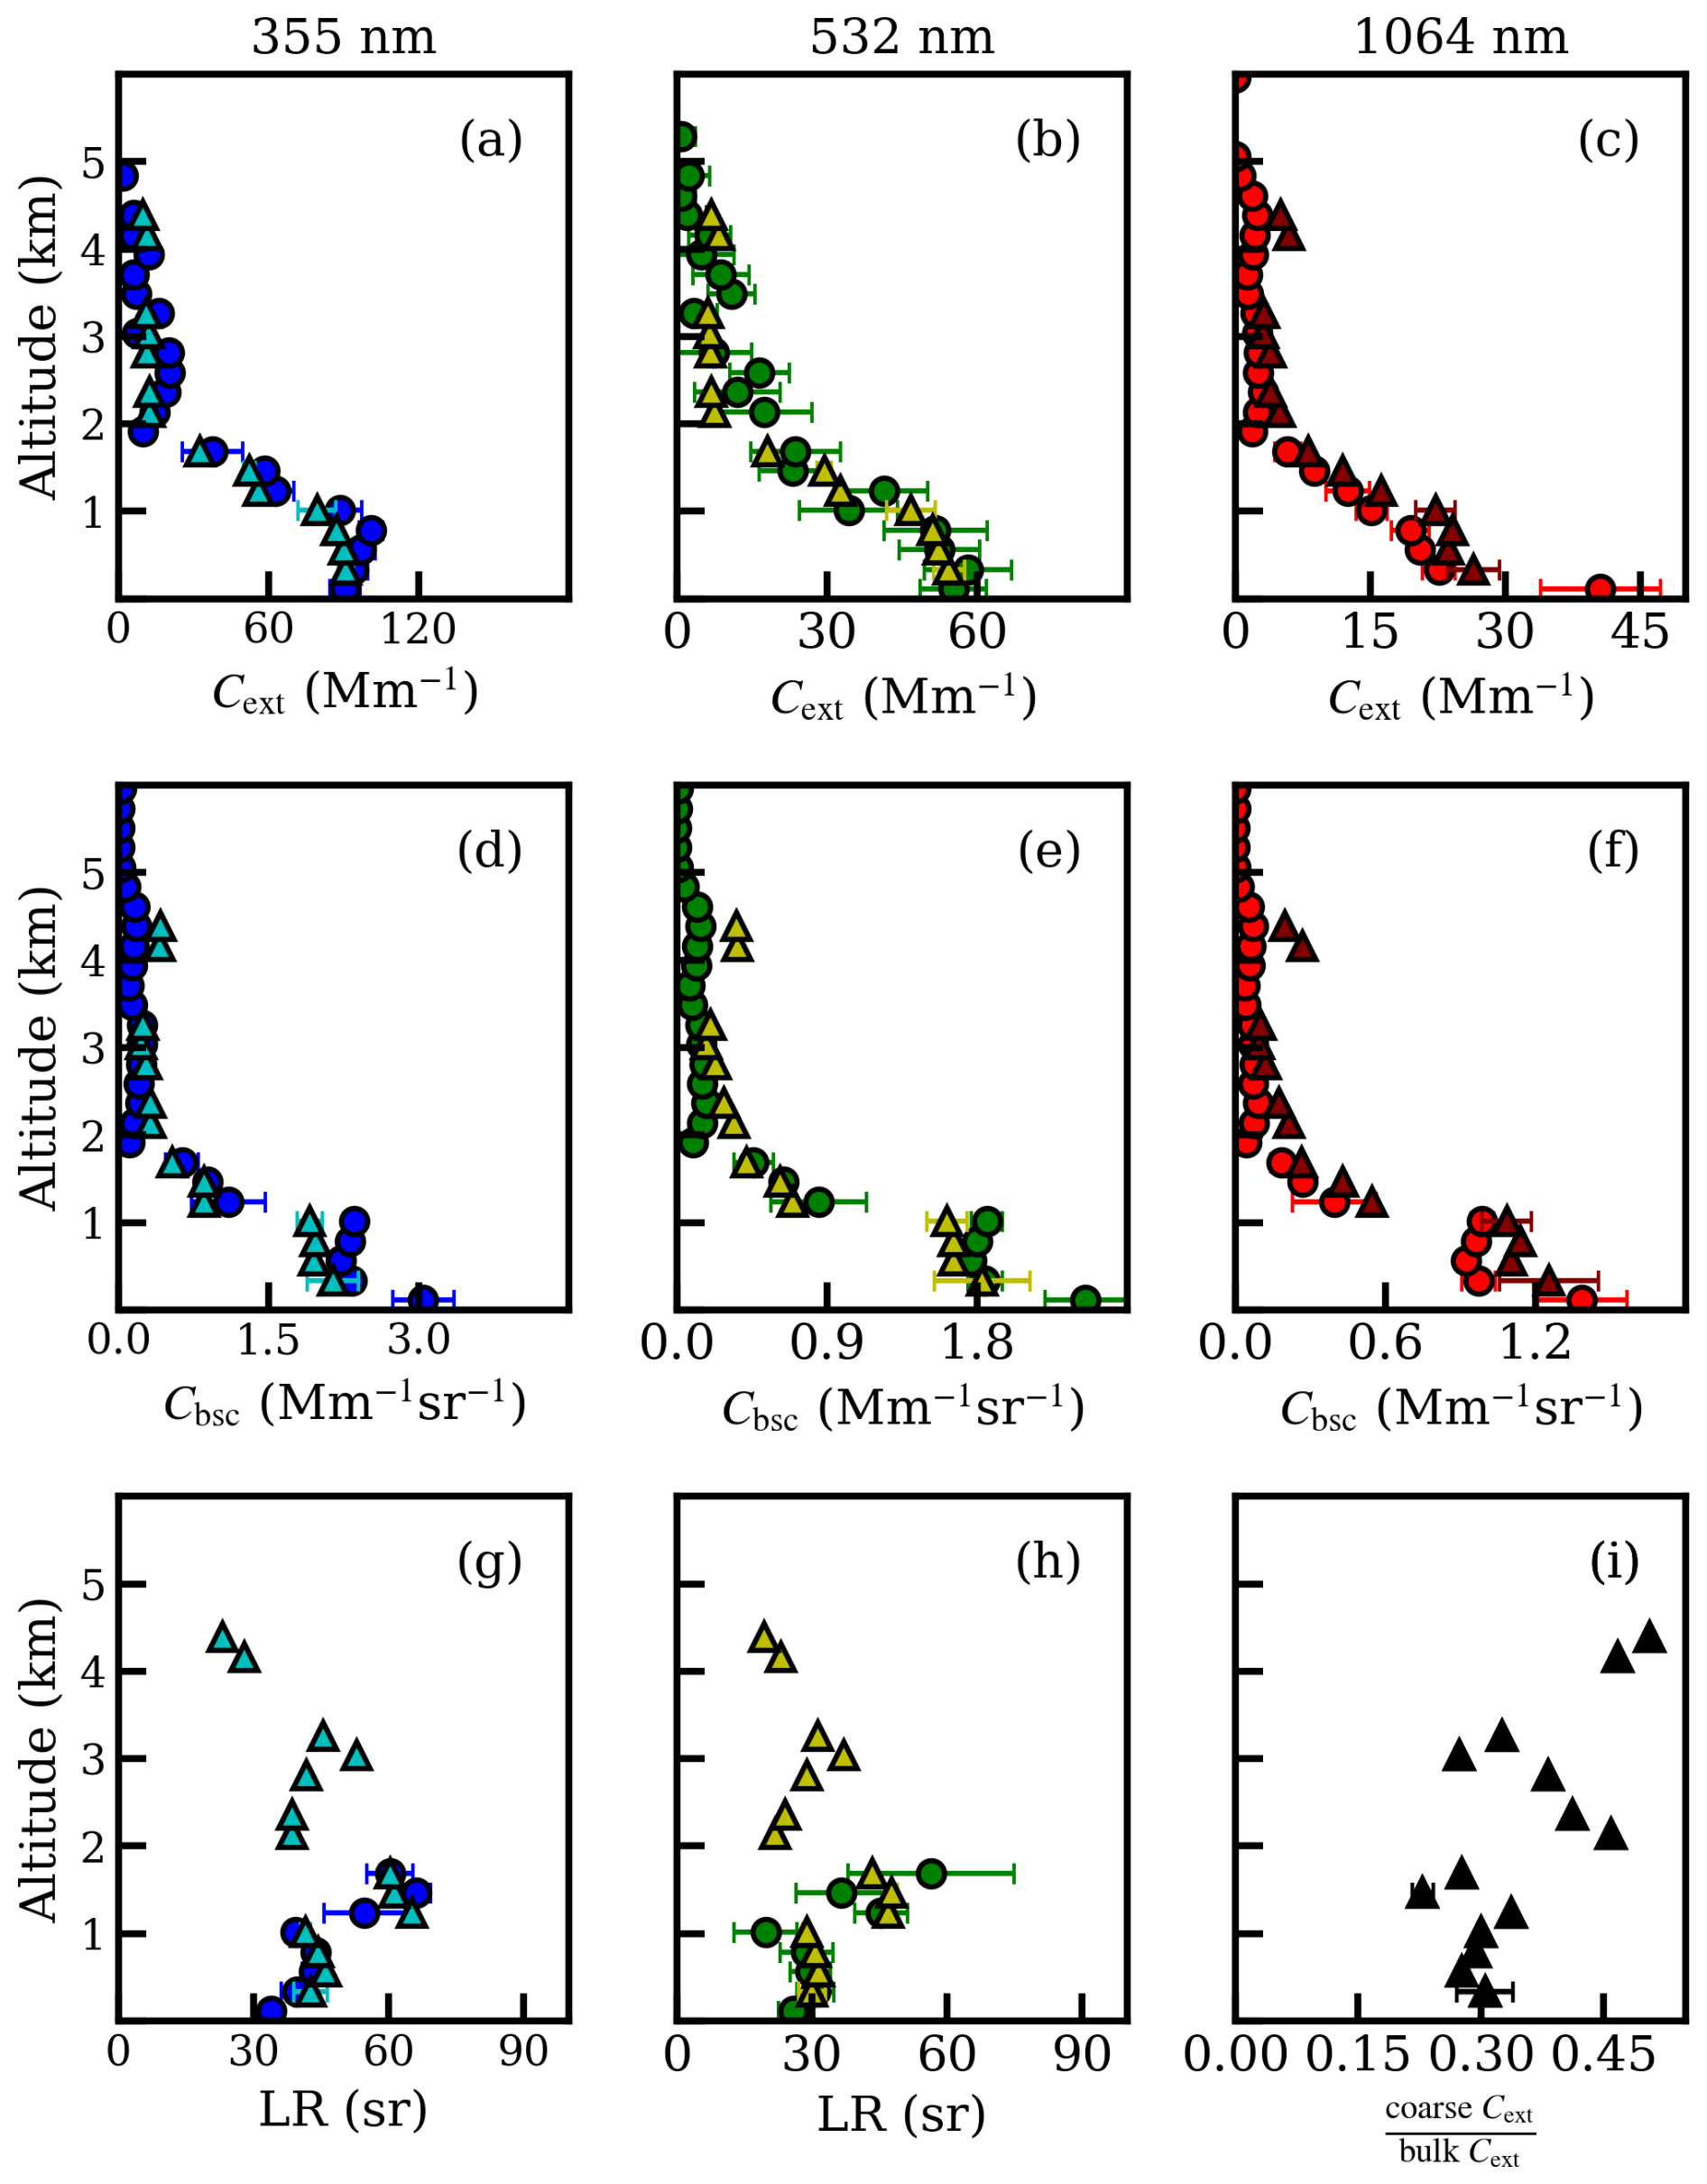
Figure 12Vertical profiles of HSRL-2-derived (circles) and ISARA-derived (triangles) ambient Cext at (a) 355 nm, (b) 532 nm, and (c) 1064 nm wavelengths, Cbsc at (d) 355 nm, (e) 532 nm, and (f) 1064 nm wavelengths, LR at (g) 355 nm and (h) 532 nm wavelengths, and (i) the at 532 nm from Case 7 that occurred during Research Flight 131 on 3 March 2022. The error bars shown indicate the standard deviation of a given aerosol property.
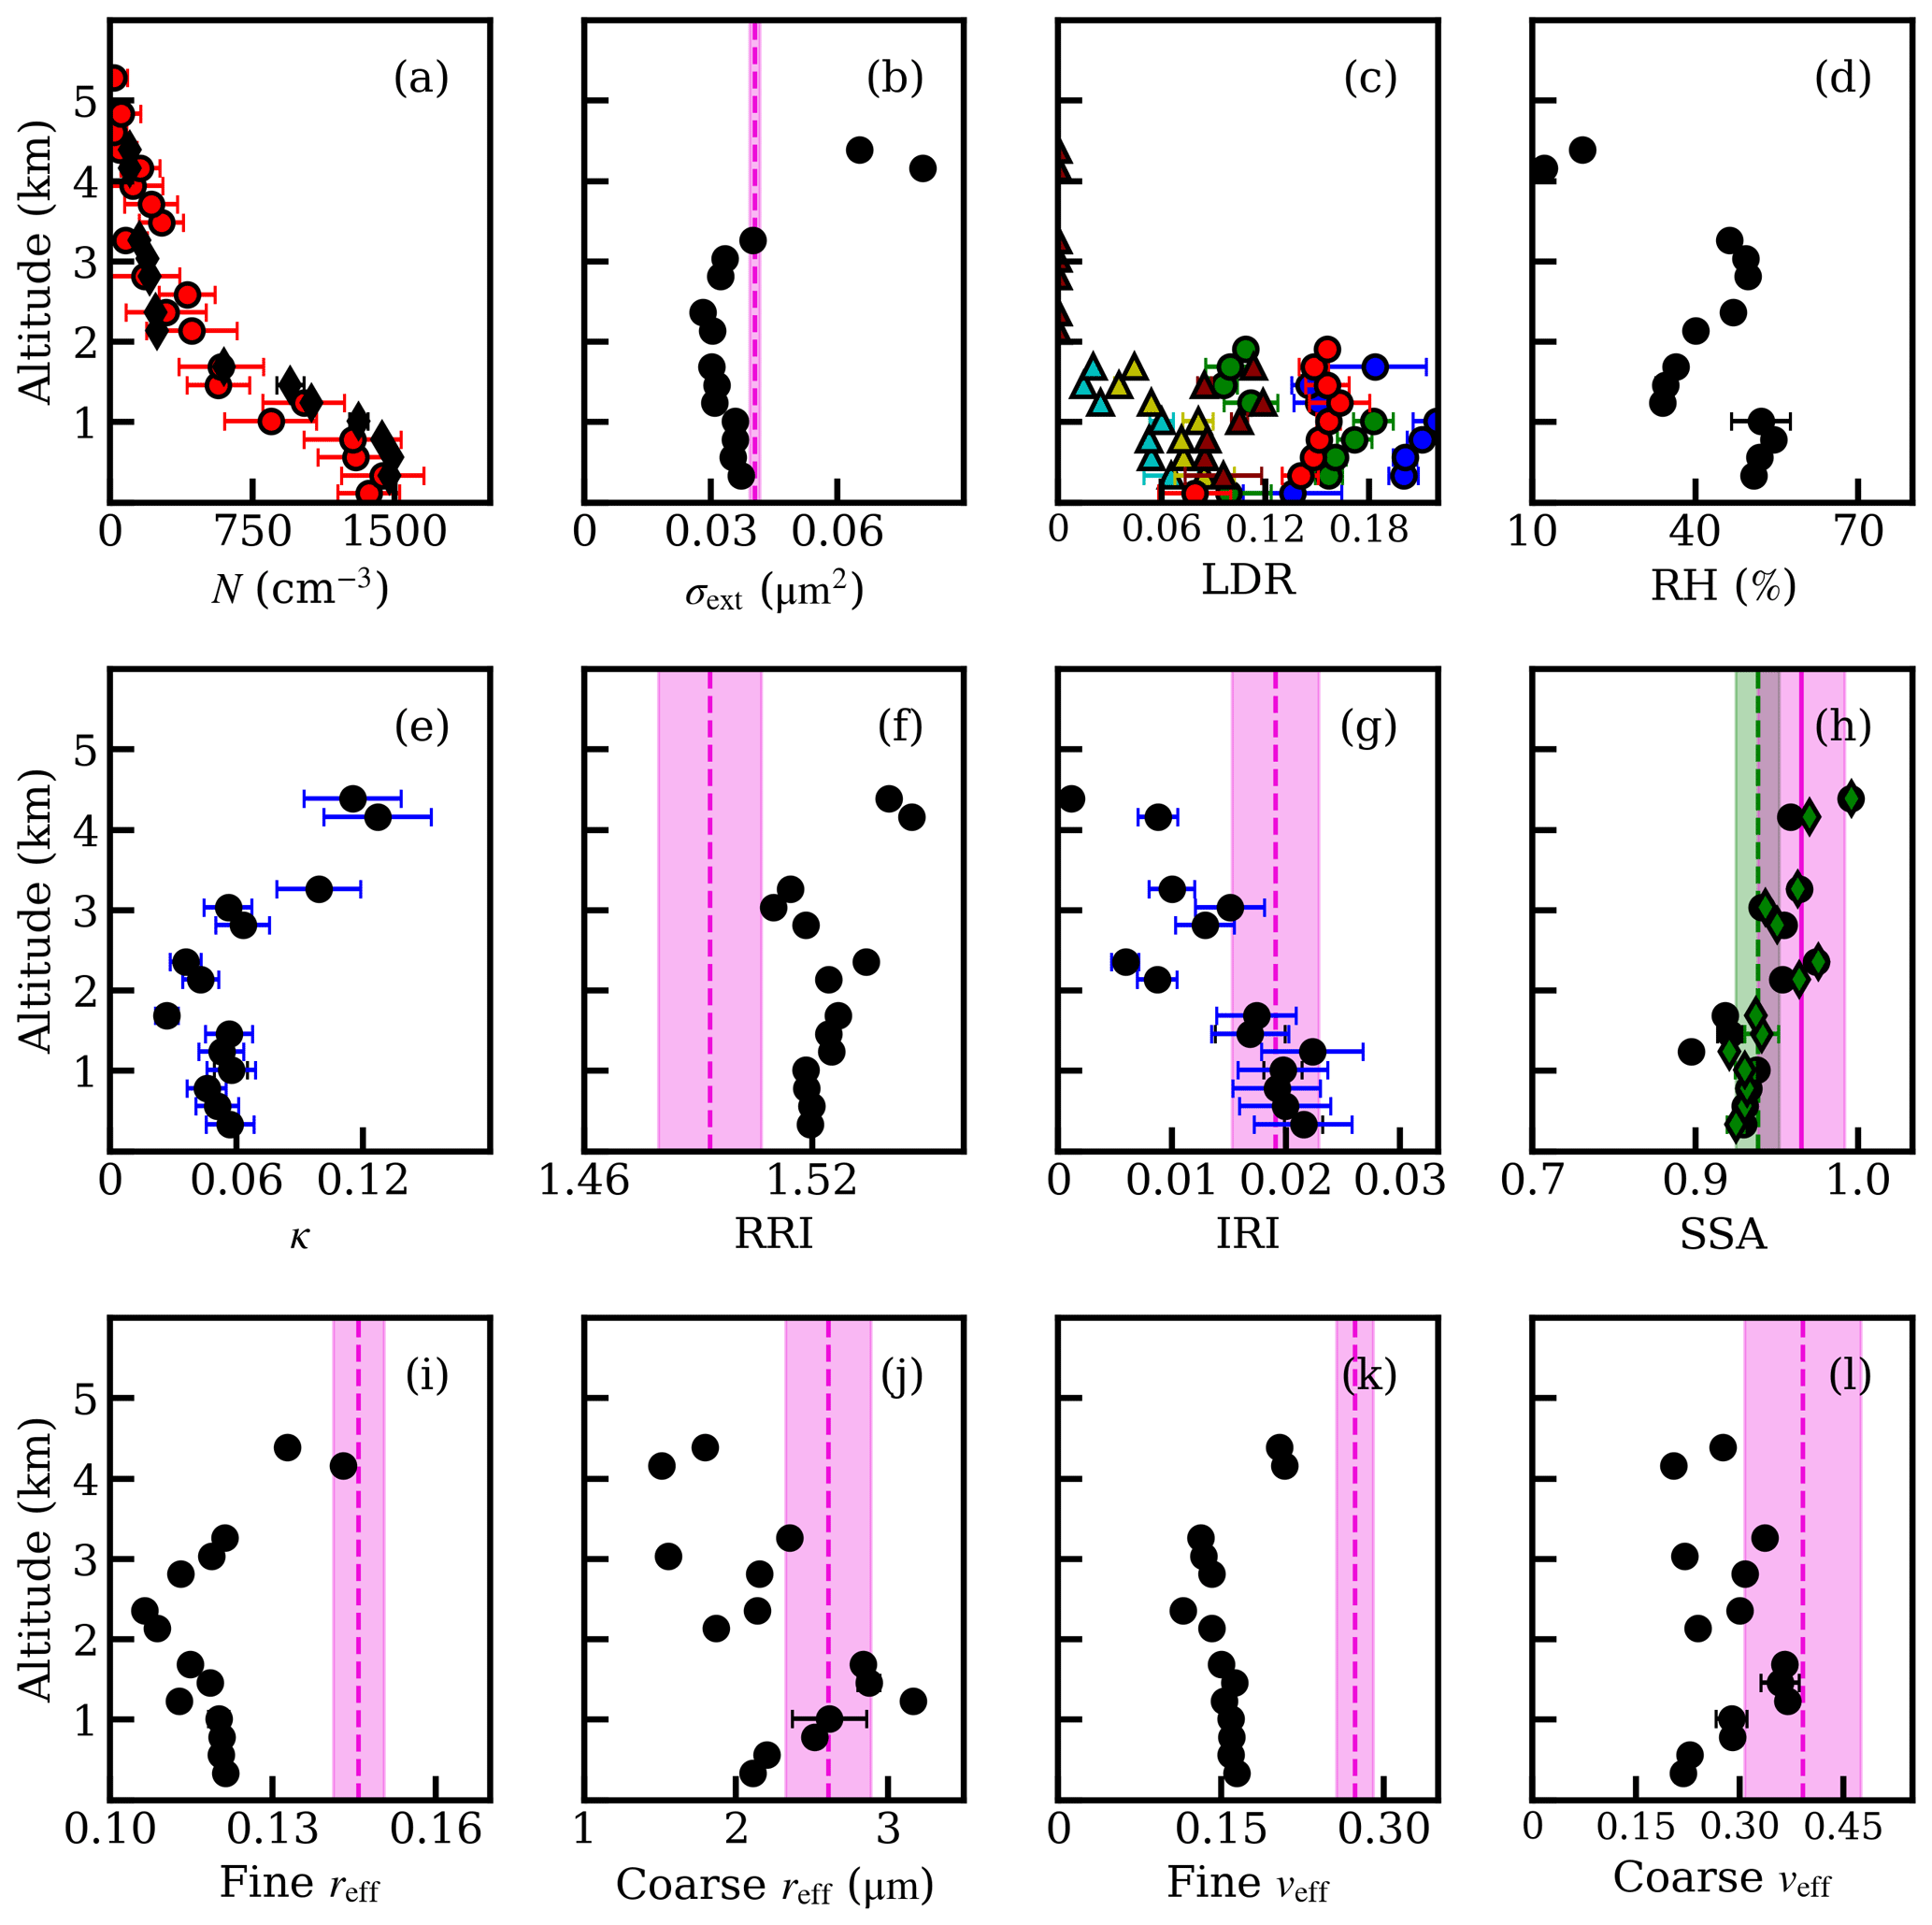
Figure 13Vertical profiles of (a) RSP+HSRL-2-derived (red points) and ISARA-derived (black diamonds) N, (b) ISARA-derived optical σext at 532 nm, (c) LDR derived from HSRL-2 (circles) and ISARA (triangles) at 355, 532, and 1064 nm (d) in-situ-measured ambient RH, along with ISARA-derived (e) κ, ambient (f) RRI, (g) IRI, (h) fine (green diamonds) and bulk (black points) SSA, (i) fine reff, (j) coarse reff, (k) fine veff, and (l) coarse veff from Case 7 that occurred during Research Flight 131 on 3 March 2022. The dashed magenta lines and shaded regions on panels (b) and (f)–(i) are the column-averaged properties and their associated uncertainties derived from the RSP. Panel (h) has an additional green dashed line and shaded region that represents the fine SSA derived from the RSP. The error bars shown indicate the standard deviation of a given aerosol property. Where available, the blue error bars indicate the uncertainty of an aerosol property as given from the synthetic consistency analysis. The ISARA-, HSRL-2- and RSP-derived bulk AOD are 0.08, 0.08 and 0.12, respectively.
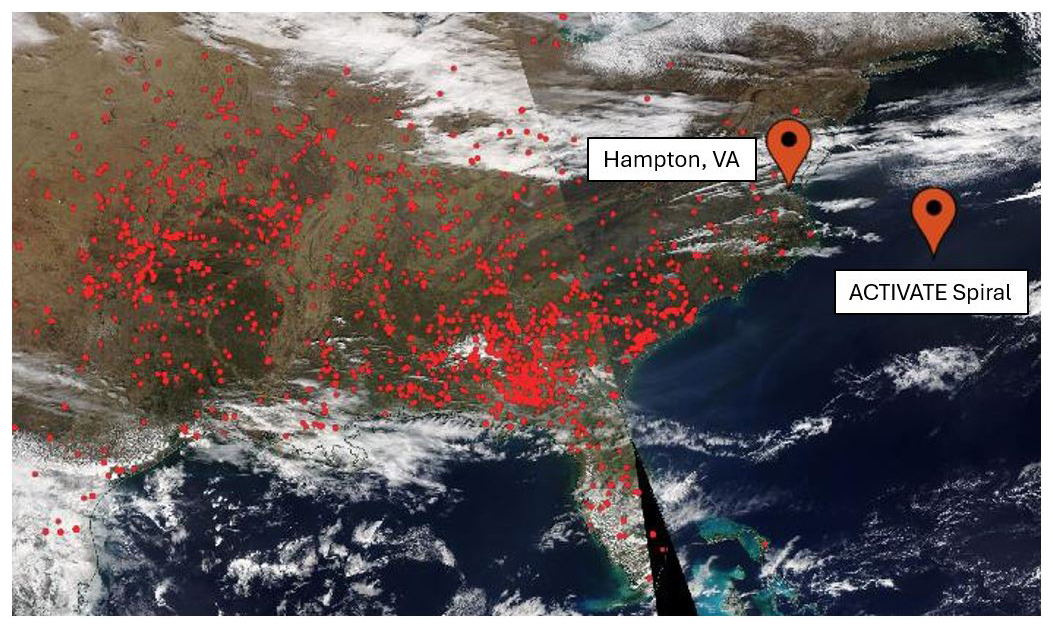
Figure 14NASA Worldview satellite image of fire presence (red points) during Research Flight 131 (3 March 2022) Case 7 flight with locations of LaRC and the Falcon flight spiral labeled. This image is used to identify sources of smoke on this day and comes from the VIIRS Fire and Thermal Anomalies product available from the NOAA-20 satellite (Schroeder et al., 2014).
Although some smoke aerosol could be present (Fig. 14), aerosol loading is low with an AOD of 0.08 (HSRL-2) and 0.12 (RSP), and the HSRL-2 is not detecting smoke counts in the vertical profile shown (Table 3). Note that the vertical extent of the Falcon's profile is 4.26 km. It appears there are absorbing aerosol in the mixing layer, based on ISARA-derived ambient IRI values near 0.02 (Fig. 13g) and lower SSA values near 0.91 (Fig. 13h). There is also an increasing fine reff and SSA seen above 2 km (Fig. 13h and i).
It is also seen that ISARA-derived RH range is 40 %–55 % that decreases to 10 % at 4 km (Fig. 13d), which is not unexpected for a marine environment far off-shore in the winter (Sorooshian et al., 2019). From the 1064 nm Cext and the 355, 532, and 1064 nm Cbsc, it is possible that the near surface aerosol are likely different in size or concentration from the next highest data point (0.3 km). There is no available comparison with the ISARA-derived properties as the Falcon did not sample that low in the atmosphere. This finding is particularity important to consider when examining the column-average properties derived from the RSP. This near-surface elevated backscatter coefficient is likely due to sea salt near the ocean surface. This is also an important finding because it indicates that lowering the minimum sample altitude within the marine environment could help resolve some of the discrepancies seen in the statistical consistency analysis when comparing the altitude-resolved comparisons. Additionally, it appears there may be the presence of an elevated aerosol layer with low concentrations at altitudes between 4 and 4.5 km.
The consistency statistics resulting from the altitude-resolved data of Case 7 establish the effectiveness of ISARA to produce aerosol properties that are consistent with the HSRL-2-derived properties for the predominant aerosol observed in the North American outflow. With the exception of LDR at 1064 nm, the aerosol properties are well correlated. Aside from the 1064 nm LDR, the lowest correlation observed is 532 nm LR (r = 0.77, p = 0.04). Additionally, the MB are centered on, or near, zero for all but LDR, which have MB ranging from 0.05 to 0.15 depending on the wavelength. The LR comparisons, where available, for this profile appear to be within the standard deviations of the HSRL-2-derived LR. All aerosol properties have NRMSD ≤ 20 % except for LDR, which ranges from 53 % to 72 %.
As indicated by the MB ranging from 0.5–0.15 and MRB ranging of 43 %–131 %, the ISARA-derived LDR significantly underestimates the LDR. Additionally, the 1064 nm LDR are not correlated even under these ideal circumstances. The ISARA-derived LDR increase with increasing wavelength, which is the opposite of what is observed in the HSRL-2-derived LDR. That there is a discrepancy for coarse mode aerosol properties is not unexpected given the in-situ under-sampling of coarse aerosol together with the simplified assumption that the non-spherical coarse mode aerosol is a homogeneous spheroidal shape. However, we find that the spheroidal shape leads to significantly improved comparisons against HSRL-2 when LDR ≥ 0.08 compared to treating the coarse mode as a hydrated sphere. These results suggest that to fully capture these features, more complex models of coated spheroid, roughened spheroid, superspheroid, superellipsoid, or irregular aerosol shapes may be needed (Kahnert and Kanngießer, 2024; Lin et al., 2018). Additionally, in-situ measurements of coarse and fine CRI and shape would help constrain LDR.
Overall, these results demonstrate reasonable consistency between the HSRL-2- and ISARA-derived Cext, Cbsc, LR, and optical N, but ISARA cannot replicate the LDR features observed in the HSRL-2 data using a homogeneous spheroidal shape to represent the coarse aerosol (Sect. 3.5). With these comparisons between the vertically resolved aerosol properties in mind, we analyze the column-averaged properties derived from the RSP and compare them to the ISARA-derived column-averaged properties.
Table 6Ambient optical and microphysical aerosol properties for case study 7 derived from the ISARA and the RSP. Ambient aerosol properties compared include the column-averaged properties of RRI, IRI, fine and coarse reff and veff, optical N and σext, as well as spectral (355, 532, and 1064 nm) SSA for both the fine and the total aerosol. The ISARA-derived extinction weighted average properties are shown with the weighted standard deviation and the RSP-derived properties are shown with the measurement uncertainty product where expected error from published sources was not available. The RSP retrieved fine and coarse AOD at 532 nm for this case is shown on Table 3.
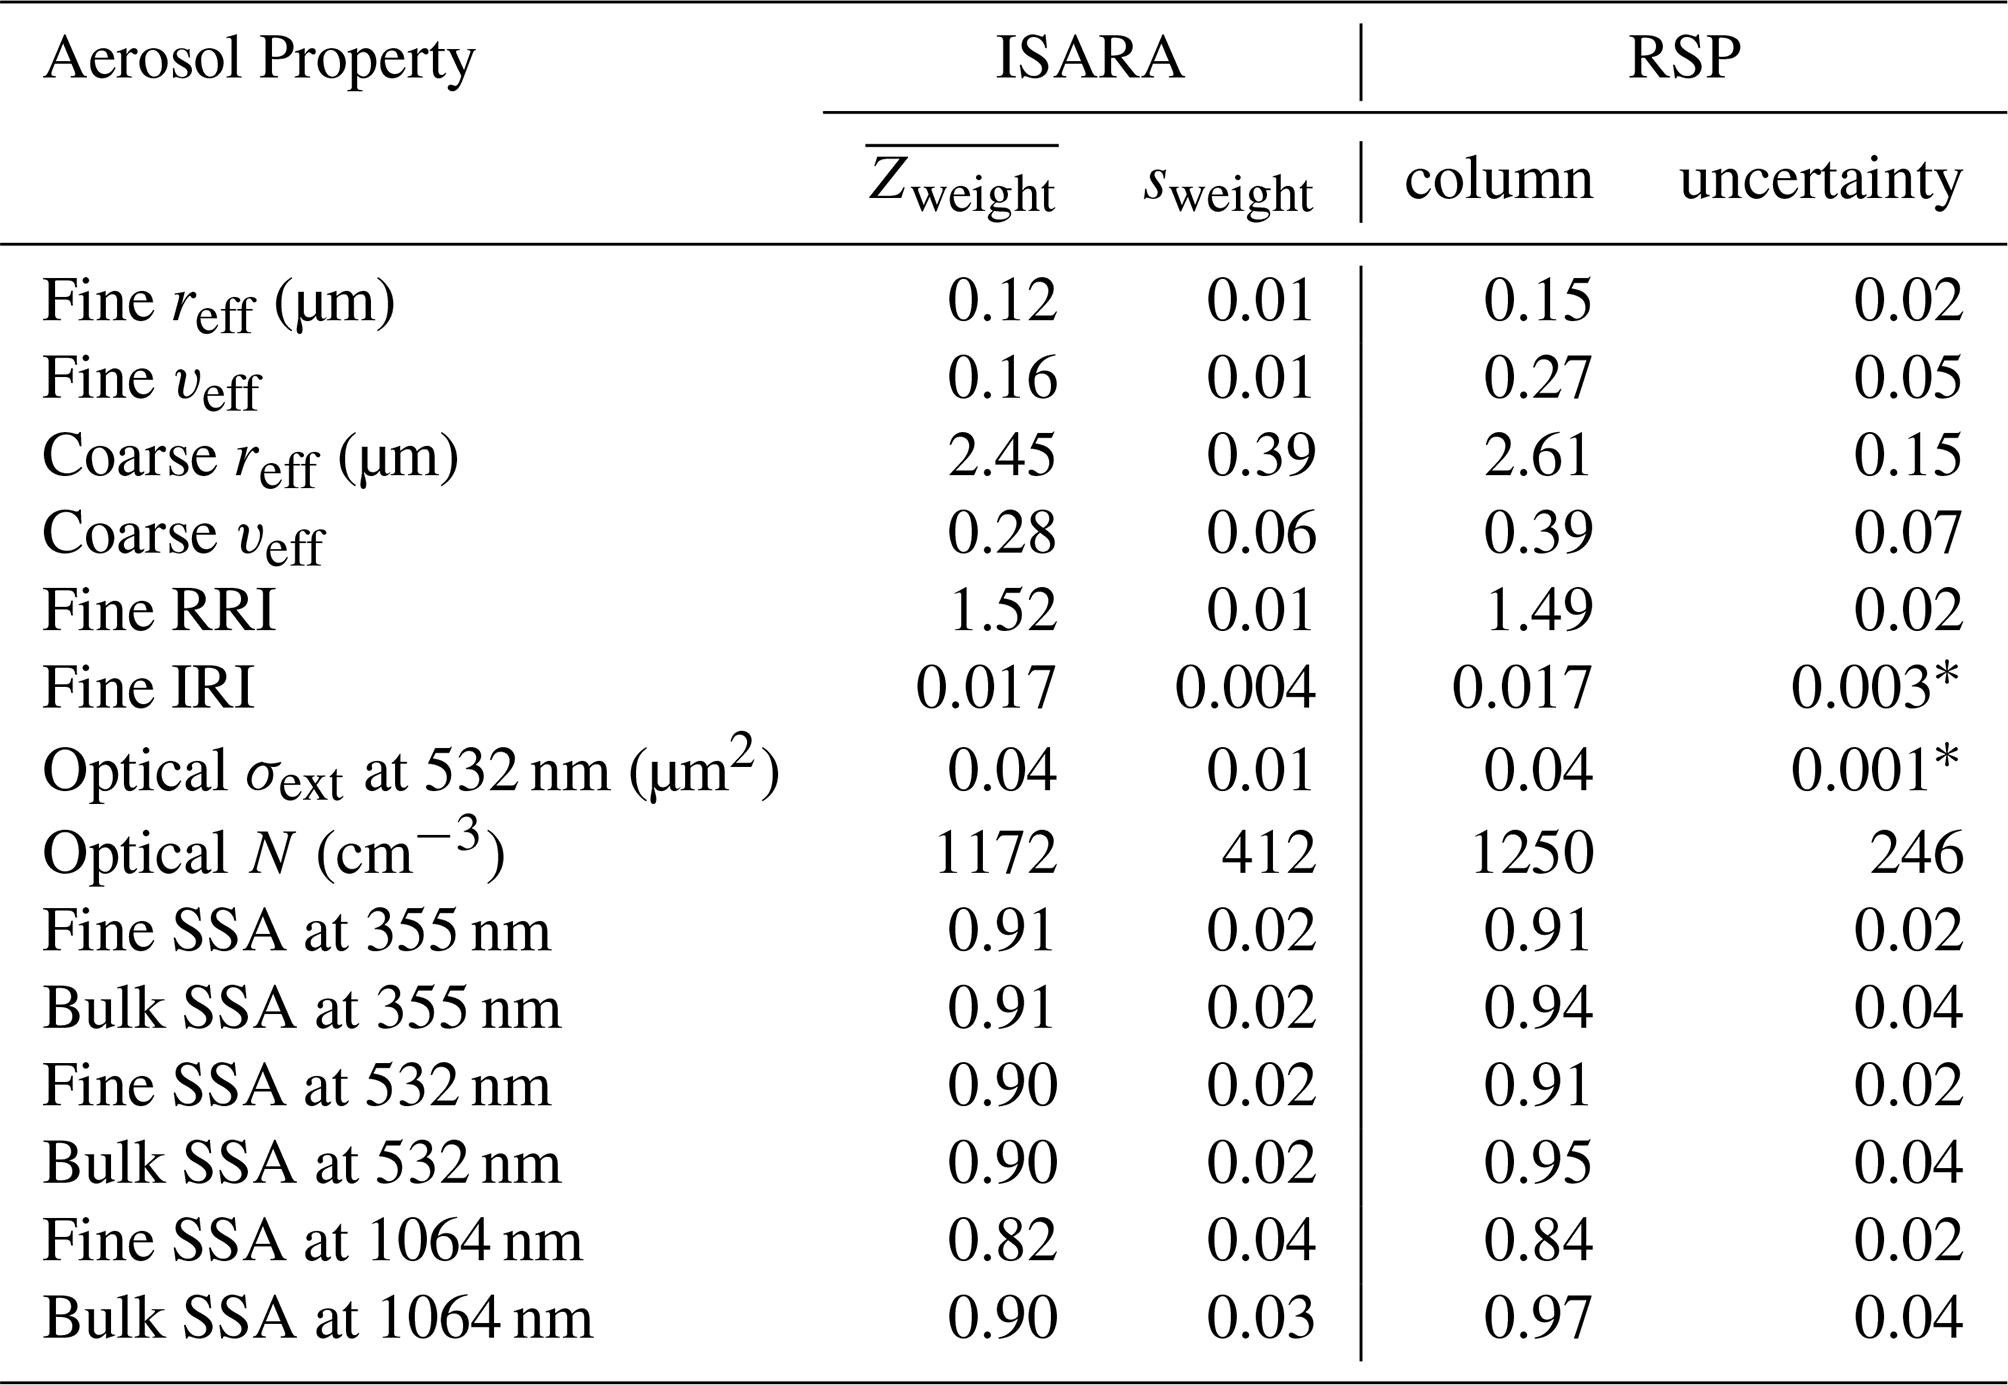
∗ Given from uncertainty data product available with the RSP data.
To compare to the RSP data, the vertical profile of ISARA results are then averaged using Cext for weights to provide column-averaged results (Table 6). The ISARA- and RSP-derived fine properties are within 2 sweight of their respective uncertainty estimations for this profile. Fine reff, IRI, and spectral SSA are all within 1 sweight of their respective uncertainty estimations. The fine aerosol properties with the worst observed agreement are ISARA-derived fine reff and veff, which deviate by 2 sweight. This disagreement can result from several possibilities. One possibility is that there are some fine aerosols that are not being sampled by the Falcon. While the profiles of Cext and Cbsc are in good agreement, there appears to be a small spike in 532 nm Cext between 4 and 5 km that was not sampled and there would be some fine aerosol missed below the lowest altitude sampled. Other possible sources leading to this discrepancy could be resulting from the small differences in CRI or in the ISARA-derived κ. Similar to the fine properties, the vertically-averaged optical σext and N have good agreement.
It is observed that 532 and 1064 nm total SSA derived from the RSP are elevated relative to the ISARA-derived counterparts. This discrepancy is possibly due to coarse sea salt that was not sampled by the Falcon, which is supported by the elevated near surface Cbsc. While 532 and 1064 nm total SSA are within the expected retrieval error, the RSP consistently observes higher total SSA at these wavelengths. This disagreement in total SSA is possibly due to the coarse sea salt aerosol being under-sampled by the in-situ instruments if the majority of the sea salt aerosol is at a low altitude that is not reachable safely by the aircraft. Additionally, this discrepancy could be in part due to the low counting efficiency of the CDP of aerosols larger than 5 µm in background conditions, as the maximum observed N>5 µm is 0.017 cm−3 in this case. Another challenge of this profile is that multiple layers of aerosol are present but the overall AOD is fairly low. Finally, there could be some collocation error as the collocated RSP scan is 1.8 km from the center point of the Falcon's spiral. Despite these sources of error, the majority of the ISARA- and RSP-derived properties are considered at least moderately consistent based on the metrics outlined in Appendix C. To contrast to the “unicorn” Case 7, we examine Case 9 that serves as a worst case for the consistency analysis.
Case 9 is a distinct contrast to Case 7 for several reasons. Case 9 is an in-line ascent profile that is carried out during Research Flight 158 on 20 May 2022, which is well after any cloud winter like conditions. The ascent is performed over the Atlantic that is ∼ 2° E and ∼ 0.3° S of Case 7 and extends from 0.44 to 1.46 km (see Table 3 and Fig. S1 in the Supplement). From a meteorological and transport standpoint, the aerosol seem to be outflow that has traveled a much shorter distance, relative to Case 7, but did pass over several potential sources of smoke aerosol (see Figs. S3 and S2). From Fig. S2, we can see possible evidence of some cloud and haze in the study region. From a consistency standpoint, we do not expect there to be good agreement between the RSP- and ISARA-derived aerosol properties for Case 9.
The expected disagreement stems from the following two findings: (1) the elevated smoke layer(s) identified by the 243 points flagged as smoke above an altitude of 2.5 km by the HSRL-2 typing product and (2) the large majority of the bulk AOD was not sampled by the Falcon. From the HSRL-2-derived Cext and LR, we can see possible evidence of aerosol layers between the altitudes ranges of 0–0.5, 1.5–2, 3–4, and 5–6 km. The latter of the two findings is evident from both the profile's limited vertical extent of 1.02 km and in Table 4, which shows that the ISARA-derived AOD is only 20 % of the RSP- and HSRL-2-derived AOD for this profile. Additionally, Case 9 has an even more morphologically dynamic aerosol. The HSRL-2-derived LDR range from ∼ 0 to > 0.2, which generally increases with altitude. With those known complications in mind, we can examine the consistency between the ISARA-derived aerosol properties and those derived from the HSRL-2 and RSP in a worst case scenario.
There also appear to be two noticeable nonspherical coarse aerosol layers within the column as evident from the spikes in LDR between 3 and 5 km (Fig. S4). These two layers contribute between 20 % and 50 % of the ambient aerosol extinction. Additionally, the HSRL-2-derived LDR are above the spherical threshold of 0.08 for the 2 km spanning these layers where LDR is reported. The lower layer of coarse aerosol has 532 nm LR ≈ 35 sr. The upper layer of coarse aerosol has 532 nm LR ≈ 45 sr, is less depolarizing, and appears to be more absorbing than the lower layer. These two layers are separated by a drop in RH at 1 km. Relative humidity decreases from ∼ 50 % to ∼ 35 % at 1 km. Our ability to classify aerosol species in these two layers is tenuous, so the definitive identification of the specific aerosol species is outside the scope of this work. However, we can generally state that the aerosol found in the lower layer has intensive properties that are most similar to those of sea salt aerosol, and the aerosol in the upper layer has intensive properties that are most similar to dust or pollen based on the 532 nm LR; however we cannot rule out a mixture of multiple coarse aerosol species mixed with urban outflow.
Despite the challenges associated case, Fig. S4 and Table S1 show reasonable consistency between a few of the ISARA- and HSRL-2-derived aerosol properties. Most notably 1064 nm Cext and Cbsc are well correlated with r = 0.98 and 0.94, respectively, and had a low NRMSD of 20 % and 30 %, respectively. Further, the 532 nm LR is moderately correlated without statistical significance (r = 0.84 and p = 0.16) with a low bias (MB = 3 sr) and narrow deviation in bias (SB = 7 sr).
Because there are no viable comparisons where HSRL-2-derived 532 nm LDR > 0.08, the ISARA-derived LDR are not consistent at all. The HSRL-2-RSP-derived N is also not correlated with a large MB > 500 cm−3, which is again expected as the assumptions made in that optical N product are violated in this case. Most notably, the presence of multiple distinct aerosol layers within the column violates the uniform distribution of fine σext assumption that is made in the derivation of the optical N product.
As has been foreshadowed, there is a general lack of consistency between the column-averaged aerosol properties derived from ISARA and the RSP (Table S2). The RSP-derived fine aerosol properties appear to be strongly scattering and absorbing with a , which is in stark contrast to the ISARA-derived CRI (), which suggests a weakly absorbing aerosol species. This difference is evident by comparing the fine SSA. The ISARA-derived SSA is near 1 (SSA ≈ 1) in all three wavelengths, but the RSP-derived SSA are ≤ 0.92.
In Case 9, the only column-averaged properties that can be considered consistent are the fine reff and coarse veff. Bulk SSA is also within the expected error of the RSP retrievals, but it still seems evident the ISARA-derived bulk SSA are higher, relative to the RSP. With these two cases to observe the best and worst case scenarios for external consistency analyses, the final section of the results will be focused on analyzing the consistency between the ISARA- and HSRL-2-derived properties available from all viable data identified during the collocation process.
4.3.2 Generalized Study
In this section we focus our analysis on the data from the 10 vertical profiles of altitude-resolved ambient Cext, Cbsc, LDR, LR and N that had more than 3 points of comparison. For this section we have applied the a priori assumption to the coarse aerosol as described in Sects. 3.5 and 4.3. Additionally, we compare the consistency results from this subset of 10 profiles to the entire set of 49 profiles. For the subset of 10 profiles, the Cext and Cbsc are available for 39–46 points of comparison, the LDR are available for 28–35 points of comparison, and the LR are available for 32–39 points of comparisons (Fig. 15 and Table 7). For the full set of profiles, the Cext and Cbsc are available for 39–46 points of comparison, the LDR are available for 28–35 points of comparison, and the LR are available for 32–39 points of comparisons (Fig. S5 and Table S3). First, we present the results of the HSRL-2 and in-situ Cext, Cbsc, and LR consistency analysis, which is followed by a discussion of the LDR and N consistency analysis.
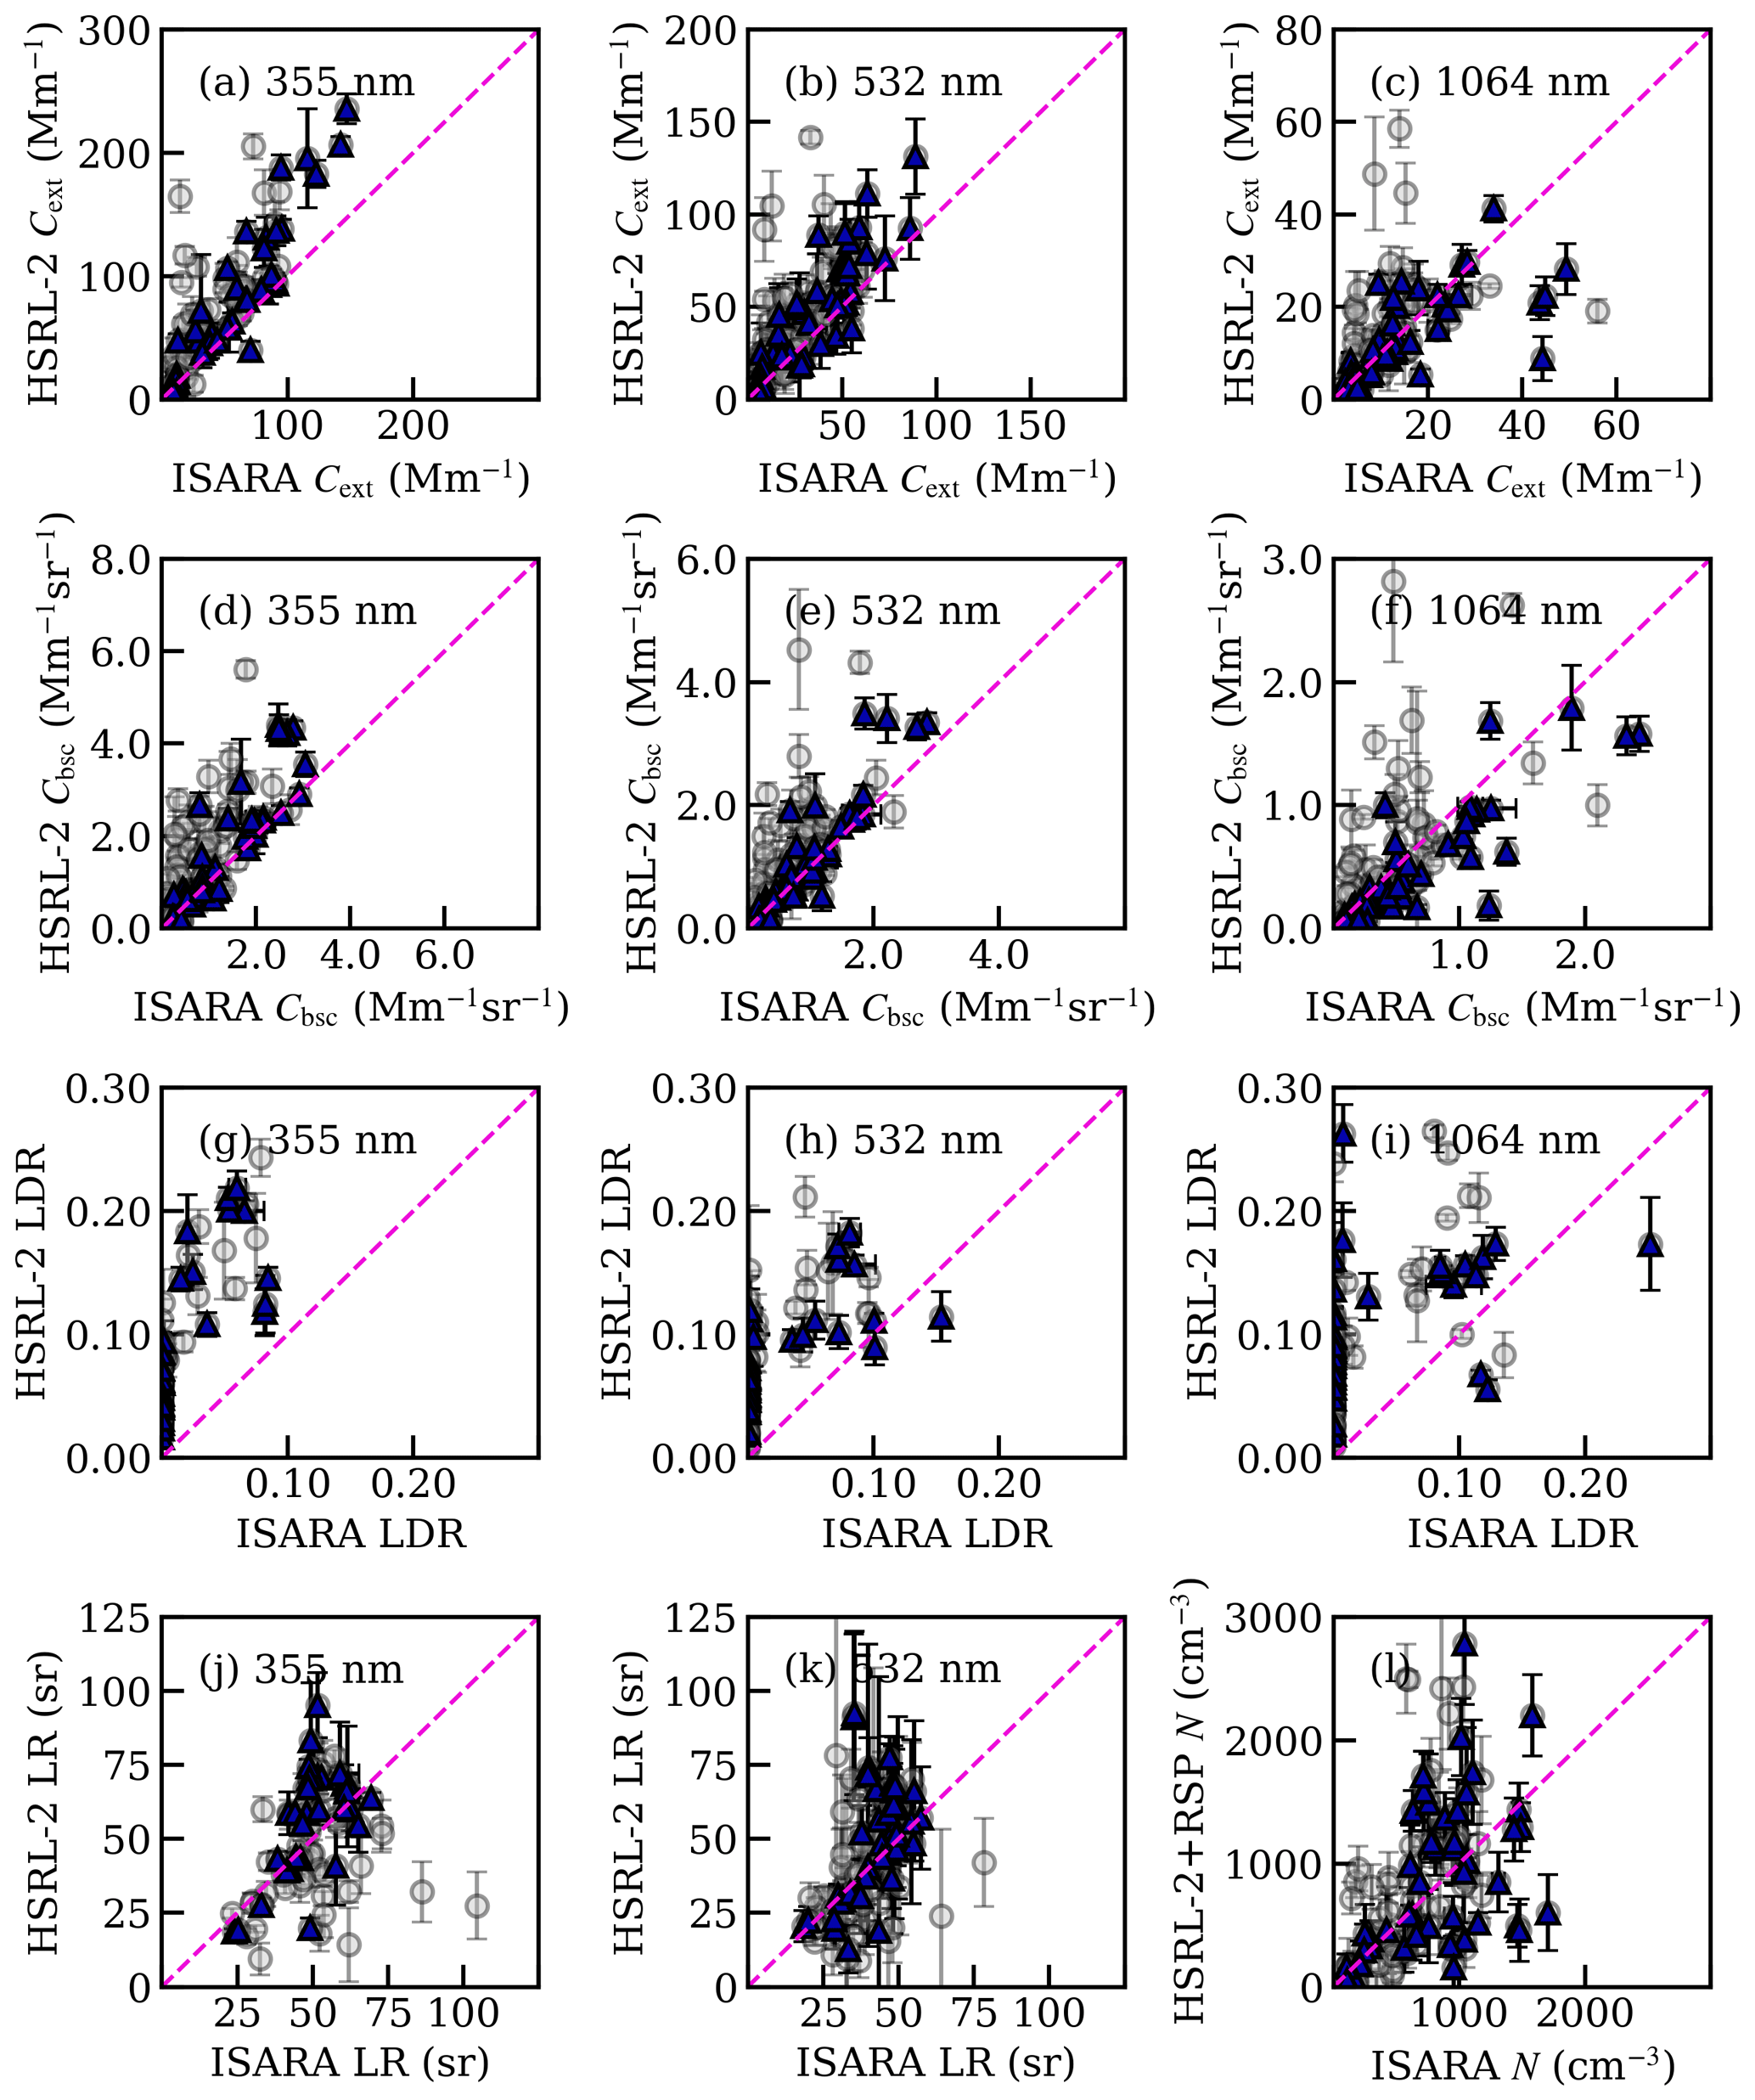
Figure 15Scatterplots of the following altitude-resolved aerosol properties: (a) 355 nm Cext, (b) 532 nm Cext, (c) 1064 nm Cext, (d) 355 nm Cbsc, (e) 532 nm Cbsc, (f) 1064 nm Cbsc, (g) 355 nm LDR, (h) 532 nm LDR, (i) 1064 nm LDR, (j) 355 nm LR, (k) 532 nm LR, (l) N, using 2020–2022 ACTIVATE data. The blue triangles are data from vertical profiles that contained 3 or more points, the gray circles are data from all vertical profiles, and the dashed line represents the one-to-one line. The error bars shown indicate the standard deviation of a given aerosol property. The consistency statistics for these data are shown in Table 7 for profiles with 3 or more data points and in Table S3 for data from all profiles.
Table 7Consistency statistics that result from the comparisons of altitude-resolved spectral Cext, Cbsc, and LR, as well as N. These consistency statistics correspond to the blue triangles from the scatterplots shown on Fig. 15.
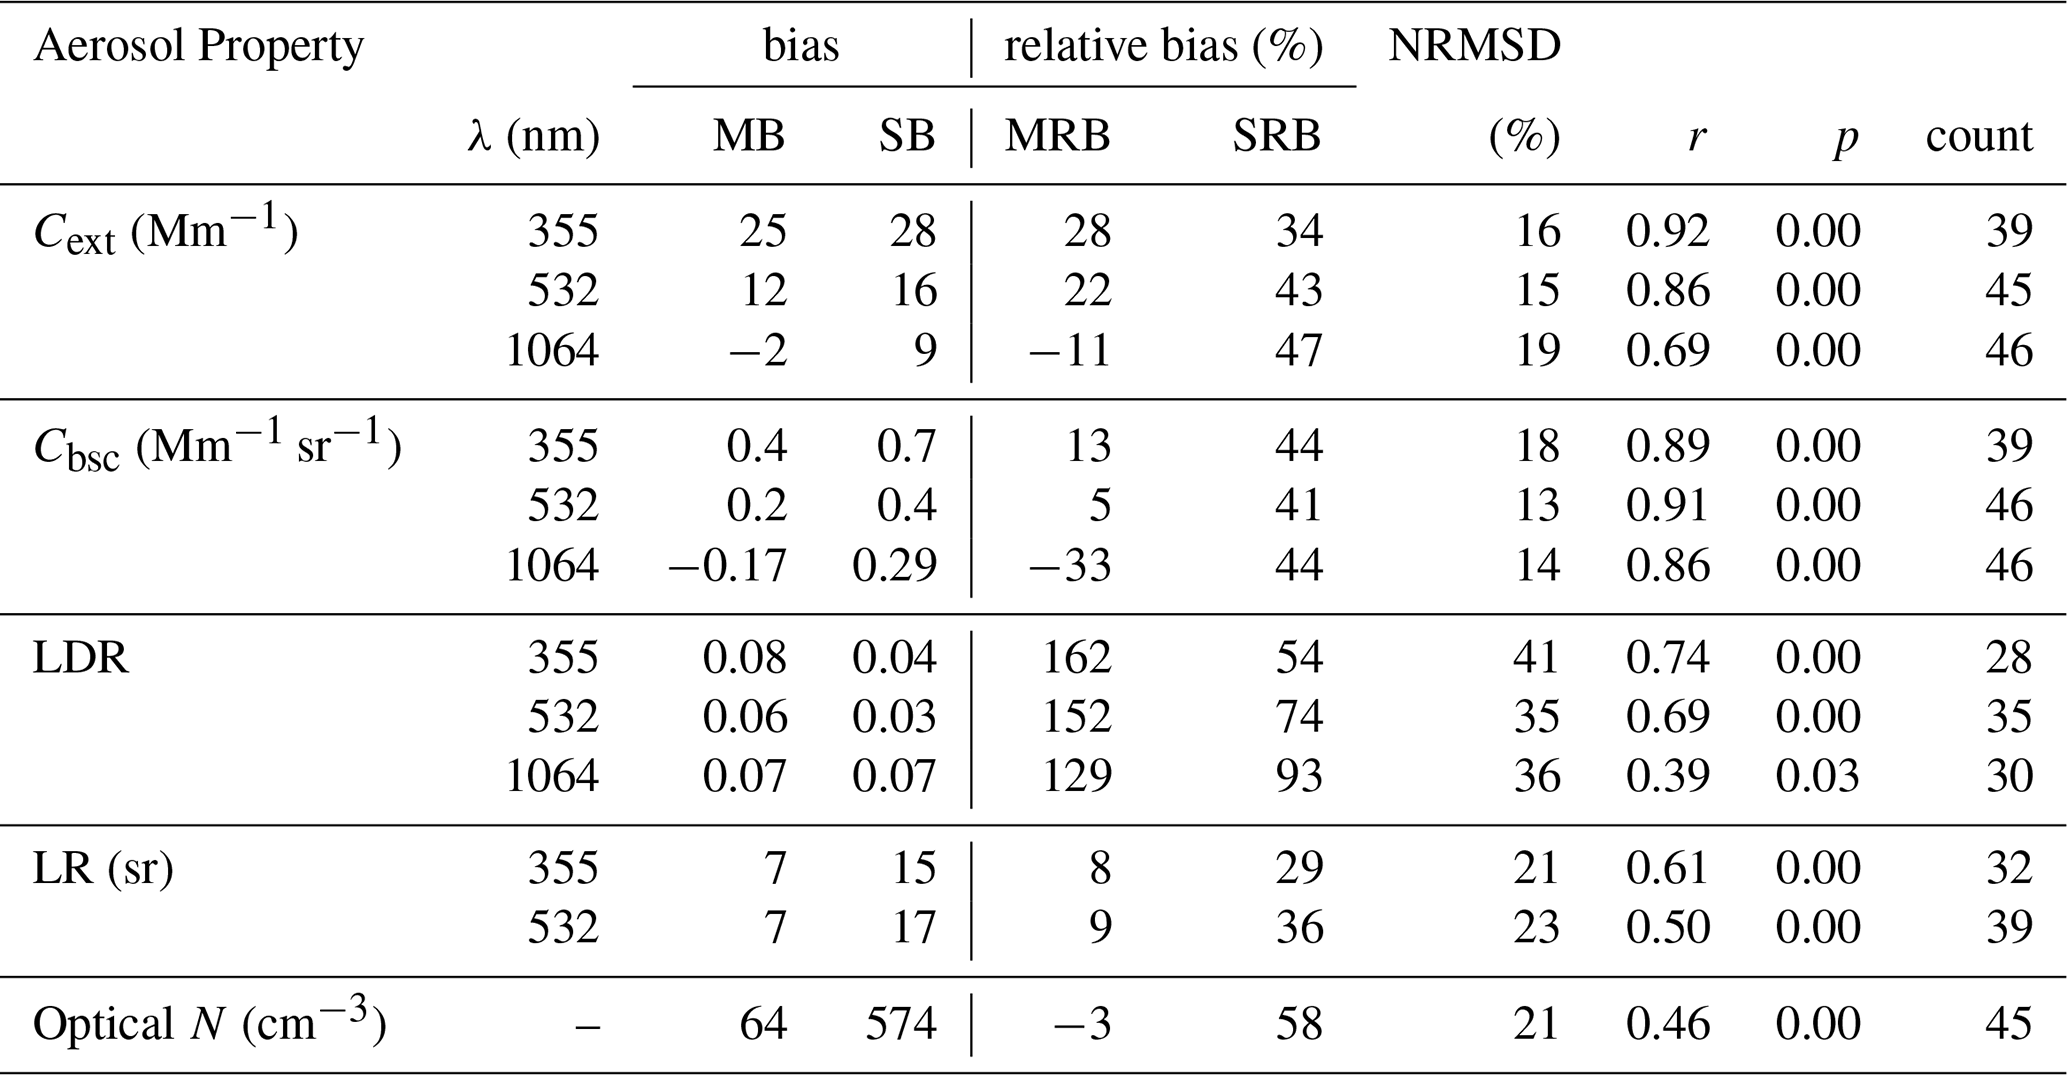
The HSRL-2- and ISARA-derived ambient Cext have moderate to good, statistically significant, correlation with a r of 0.92, 0.86, and 0.69 for the 355, 532, and 1064 nm wavelengths, respectively. The p for the ambient Cext data are also much less than 1 (i.e., p < 10−4) in all three wavelengths. The Cext also agree moderately well. The MB an MRB have a range of −2–25 Mm−1 and −11 %–28 %, respectively, which depends on wavelength. There is also a reasonable spread in bias as the SB observed in all three wavelengths that have a range of 9–28 Mm−1. Additionally, the NRMSD range is 15 %–19 %, with the lowest NRMSD observed in the 532 nm wavelength. These MRB indicate that the in-situ data is biased low from the HSRL-2, showing that the in-situ instruments retrieve lower values of Cext than the HSRL-2 throughout the ACTIVATE campaign. Similar low bias results are also seen in Sawamura et al. (2017), which are MRB = 31 % and 53 % for California and Texas, respectively. The SRB for those cases are 5 % and 11 %, respectively. Compared to that work, we demonstrate marked improvement in our observed Cext consistencies.
The consistency statistics between HSRL-2- and ISARA-derived ambient Cbsc also have moderate to good correlation with statistical significance with a r range of 0.86–0.91. The Cbsc MRB are 13 %, 5 %, and −33 % for the 355, 532, and 1064 nm wavelengths, respectively. The MB are 0.4, 0.2, and −0.17 Mm−1 sr−1 for the 355, 532, and 1064 nm wavelengths, respectively. Finally, the NRMSD range is 13 %–18 %, which is lowest in the 532 nm channel. From these statistics, we can observe that Cbsc is constrained within 1 Mm−1 sr−1 in all three wavelengths, but the fidelity does decrease for the 1064 nm channel. As mentioned before, the 1064 nm channel is a retrieved product and as such this decrease in fidelity is not necessarily reflective of reality.
The consistency statistics between HSRL-2- and ISARA-derived ambient LR and LDR are generally worse, relative to Cext and Cbsc, but the correlations are all statistically significant. The ISARA-derived LR have a MB of 7 sr and a MRB range of 8 %–9 % despite having r range of 0.50–0.61. The bias statistics indicate that this low correlation does not necessarily imply a lack of agreement. The standard deviations in LR often encompass the 1-to-1 line and many of the comparisons lie near the 1-to-1 line. The NRMSD resulting from the LR comparisons are 21 % and 23 % for the 355 and 532 nm wavelengths, respectively. The SRB in LR are similar to what is observed in the Cext and Cbsc comparisons ranging from 29 % to 36 %. While LR is not as well constrained as Cext and Cbsc, these comparisons show that ISARA-derived LR is within expected error ranges.
It is observed that there is a systematic underestimation between ISARA- and HSRL-2-derived 355 and 532 nm Cext and Cbsc; however, this is more important at lower signals (Cext < 50 Mm−1 and Cbsc < 1 Mm−1 sr−1). The biases in Cext and Cbsc have no clear altitude dependence. This discrepancy with the remote sensing retrievals is possibly due to (1) difficulties in data coincidence, (2) due to loss of aerosols from the diameter cutoff of the inlet and through the in-situ sampling pathways as discussed in the Introduction and undersampling of the coarse aerosol, (3) due morphologic and composition complexities, or (4) due to limitations of the hygroscopicity parameterizations. Although in-situ values are lower than the HSRL-2 ones, reasonable agreement is evident by the MB ranges. These results indicate that further work is needed to fully close HSRL-2- and in-situ-derived LR, but the method does result in ambient extinction and backscatter comparisons that meet the benchmarks set by previous works (e.g., Sawamura et al., 2017). By using ACTIVATE data for this analysis, the extinction and backscatter products do work as expected even in conditions where nonspherical coarse aerosol species are impacting the aerosol extinction. Future work can investigate improved methods for measuring coarse aerosol properties from in-situ aircraft. When analyzing the LR consistency, we see more evidence that there are more improvements needed to the morphological assumptions made as part of ISARA.
As discussed previously, the ISARA-derived LDR is derived exclusively from the three possible assumptions made for the coarse aerosol properties. Additionally, it is also important to keep in mind that the fine aerosol are always assumed to be spherical. The ISARA- and HSRL-2-derived LDR are correlated with statistical significance in all three wavelengths, but the r range is 0.39–0.74 that decreases with increasing wavelength. Additionally, the MRB, SRB, and NRMSD ranges are 129 %–162 %, 54 %–93 %, and 35 %–41 %, respectively, and are larger than the values observed when comparing Cext, Cbsc, LR, and N. The general poor correlation and wide range in bias further suggest that the shape assumptions made are too limited to fully capture the features observed in HSRL-2 data. Next, jointly-retrieved HSRL-2+RSP- and ISARA-derived N are compared.
The N comparisons result in a statistically significant r = 0.46, MRB = −3 %, SRB = 58 %, MB = 64 cm−3, SB = 574 cm−3, and NRMSD of 21 %. These results show relative biases that are often within 20 %. Other than this lower bias, agreement in terms of NRMSD is comparable to the Cext results. Similar to Cext and LR, the standard deviations in the HSRL-2+RSP-derived N often encompass the 1-to-1 line. Overall, the N comparisons are considered to be consistent. These values are comparable to results of Schlosser et al. (2022)'s evaluation of HSRL-2+RSP-derived N using N derived from ISARA. While the correlation for altitude-resolved N comparisons is weak compared to altitude-resolved NLAS (0.76 in Schlosser et al., 2022), the r values from a profile that had a statistically significant correlations for 532 nm extinction (p < 0.05) is 0.95 for Case 7 (see Table 3). Case 7 is also the only profile with more than 5 points for comparison and the conditions observed during this case study are such that it is investigated more in Sect. 4.3.1.
To further explore how the external consistency analyses are impacted by the number of points in a given profile, we have included the consistency statistics from all 49 profiles on Table S3 and show the points from the entire dataset as the transparent-gray points on Fig. 15. Despite having more than having twice the number of viable points of comparison for the unfiltered data set, we observe a decrease in the correlation coefficients for all compared aerosol properties. Additionally, the SRB are lower for all properties except for LDR, which are between 8 % and 13 % higher in all three wavelengths. This general decrease in consistency when including profiles with less than three points, suggest that good coordination and ideal sampling procedures are important to achieve full consistency. With this finding, we summarize our conclusions in the following section.
This study introduces ISARA, a retrieval framework developed to enable apples-to-apples comparison of ambient aerosol optical and microphysical properties in order to assess the physical consistency between field campaign remote sensing data sets and corresponding in-situ measurements, with the broader goal of advancing rigorous external closure across field campaign aerosol measurement platforms. Because remote sensing instruments retrieve aerosol properties under ambient conditions, direct one-to-one comparison requires that dry in-situ measurements be converted to their ambient equivalents. ISARA performs this conversion by retrieving CRI and κ from a standard suite of in-situ measurements. In addition to accounting for the hygroscopic growth of fine aerosol, we account for the contribution of nonspherical coarse aerosol to bulk aerosol properties to enable a more accurate comparison with ambient remote sensing retrievals, which supports the rigorous physical consistency evaluation of field campaign aerosol data, as demonstrated in prior studies (Tsekeri et al., 2017). The thresholds used to define reasonable physical consistency are discussed in Appendix C.
To evaluate the ability of ISARA to perform systematic physical consistency analysis, the algorithm is used on data from the ACTIVATE mission, which is chosen due to the campaign's large volume of statistically-rich aerosol measurements collected over three years of operations. Although the ACTIVATE region features a variety of aerosol and meteorological conditions, many of the ACTIVATE missions were carried out under cloud-free conditions without detectable influence from dust or smoke, making the data set well-suited for the consistency analysis performed in this study. Systematic physical consistency in this study is established using a three-fold effort: (1) synthetic consistency, where ambient in-situ data calculated from theoretical size distribution and composition data are compared to ISARA-derived in-situ values, (2) internal consistency, which compares ISARA-retrieved ambient in-situ measurements with corresponding data from ACTIVATE's in-situ instruments, and (3) external consistency, where ISARA-derived in-situ measurements are used to evaluate corresponding remote sensing retrievals from ACTIVATE's HSRL and RSP instruments.
This study demonstrates the moderately successful retrieval of ambient aerosol properties from in-situ data in all three consistency analyses. The synthetic consistency analysis process developed for this work is demonstrated to be valuable in understanding the inherent retrieval uncertainty of the measurements of the standard in-situ payload used by the ISARA algorithm. In the synthetic consistency analysis, we estimate that the retrieved values of CRI and κ for spherical aerosols with expected measurement noise are both found to have an uncertainty of ∼ 20 % (i.e., SRB ≈ 20 %). The incorporation of in-situ measurements at additional wavelengths as well as by instruments such as the Differential Aerosol Sizing and Hygroscopicity Spectrometer Probe (DASH-SP), PI-neph, and LI-neph, which can retrieve the real refractive index of the aerosol, are expected to improve the retrieval products and reduce the uncertainties of ISARA.
The internal consistency analysis provides a functionality and fidelity check for the ISARA-derived aerosol properties by comparing them to the original measured data. The internal consistency analysis presented in this work shows near-perfect correlations (r ≥ 0.96), strong agreement (NRMSD = 1 %), and generally low bias (absolute MRB < 10 %) between ISARA-calculated and measured in-situ data for the dry scattering coefficient, dry absorption coefficient, and wet scattering coefficient. The f(RH) have a good correlation (r = 0.85), and the MRB and NRMSD are 2 % and 5 %, respectively. With the general functionality of ISARA established, we present the external consistency results using a different instrument platform where data collocation becomes another important factor.
For the external consistency analysis, we examine comparisons between ambient aerosol properties derived from ISARA and those derived from the HSRL-2 (altitude-resolved properties) and RSP (column-averaged properties). For the first part of this analysis, we show the comparisons of two selected case studies. The first case served as a best case for external consistency with a large vertical extent and a limited number of aerosol layers above the Falcon's vertical profile. This case allowed us to better approximate the coarse aerosol properties. After defining two layers with coarse aerosols, we show reasonable consistency between all observed HSRL-2 aerosol observables including the extinction and scattering coefficients and the aerosol lidar ratio, with LDR being the only exception. We also show reasonable consistency with the novel vertically-resolved HSRL-2+RSP-derived optical N (Schlosser et al., 2022). We also show reasonable consistency with the bulk, fine, and coarse column-averaged aerosol properties derived from the RSP and ISARA. The polarimeter comparisons made in this work represent the first time these types of comparisons have been reported.
For this case study, external consistency between column-averaged RSP-derived fine reff, CRI, and SSA under ideal conditions is deemed successful. The RSP-derived ambient N and fine IRI, RRI, spectral SSA, reff, and N are all shown to be within expected error as compared to collocated in-situ data. These results demonstrate that external closure of RSP-derived aerosol properties is achievable, motivating future applications across a broader range of aerosol regimes and future field campaigns. However, it is important to note that the assumptions of perfectly ultrafine and fine spherical aerosols, of a single κ for all ultrafine and fine aerosols, and of a spectrally flat CRI can still introduce limitations in the current version of ISARA's retrievals since aerosols from species such as sea salt, smoke, and dust can be nonspherical, can have an inhomogeneous composition, and can have a wavelength-dependent CRI. The second case study served as a worst case for the external consistency. For this case a large portion of the aerosol are located above the Falcon's profile. Additionally, there appears to be at least 3 layers of distinct aerosol types.
For this highly challenging case, the majority of the ISARA-derived column-averaged properties are shown to be inconsistent with the RSP data. Despite the general disagreement between the column-averaged properties, there is reasonable consistency between the ISARA- and HSRL-2-derived Cext, Cbsc, and LR at 532 nm. After examining the consistency of the aerosol properties in these case studies, we conduct a generalized study using the coarse aerosol categories defined as part of the case study analysis.
After filtering for profiles with more than 3 viable points of comparisons, we show there is reasonable consistency when comparing the HSRL-2-derived extinction coefficient (Cext) to the corresponding ISARA-derived measurement, which are moderately correlated (r range of 0.69–0.92). The aerosol properties are well correlated at 355 and 532 nm, and the correlation appears to increase with decreasing wavelength. Additionally, the in-situ-derived extinction coefficient in the 355 and 532 nm channels appears to be low (MRB range from 22 % to 28 %) compared to the corresponding HSRL-2 measurement. This bias is possibly due to under-sampling of coarse aerosol species within the in-situ measurements or due to the limited morphological assumptions made as part of ISARA and as part of the coarse aerosol assumptions.
Relative to Cext, we demonstrate as good consistency between ISARA- and HSRL-2-derived Cbsc. The correlations observed in the Cbsc comparisons are all above 0.86 and the best agreement appears to be in the 532 nm channel with a r = 0.91. The NRMSD in this channel is also 13 % lower, relative to Cext at 532 nm. After demonstrating the independent consistency of Cbsc and Cext, we examined the consistency of LR and LDR which are inherently dependent on the morphological aerosol properties.
The LR at both 355 and 532 nm appear to have statistically significant correlations with r = 0.61 and 0.50 at 355 and 532 nm. While the correlations are fairly weak, the MRB, SRB, and NRMSD are similar in magnitude to the Cext and Cbsc comparisons. The LDR have slightly better correlations in the two channels that LR is reported that are 0.74 and 0.69 in the 355 and 532 nm channels, respectively. The LDR have the largest observed MRB, SRB, and NRMSD. The results from analysis of LDR and LR consistency demonstrate more work is needed to model the coarse aerosol composition and shape in a physically consistent manner. Finally, we look at the altitude-resolved joint HSRL-2-RSP N product, which has both the errors implicit in the HSRL-2 and RSP data but also the errors from the assumptions made in deriving that product.
When analyzing the altitude-resolved N product we observe a weaker statistical correlation in the data for profiles with multiple viable points in each profile relative to what was observed in Schlosser et al. (2022) for all profiles. But the MB and MRB are small, and under ideal conditions we show excellent agreement between the N derived from the HSRL-2-RSP and the N derived from ISARA. This finding indicates that significant deviations from the assumptions made in the derivation of the HSRL-2-RSP N can result in poor fidelity.
Although there are limitations and implicit errors in the ISARA retrievals, as discussed above, the results presented in this study demonstrate that these products are nonetheless valuable to evaluate the consistency of remote sensing measurements and to support progress toward systematic external closure. The retrieved values of CRI and κ are also important for aerosol and Earth system modeling applications, further extending the utility of this framework. In addition, the retrieval approach is both replicable and readily expandable. Although beyond the scope of this study, ISARA can be adapted for extended analyses that incorporate nonspherical fine aerosols, alternative coarse representations of shape and composition, and consider non-soluble components of the aerosol distribution. Taken together, these findings and capabilities suggest that the framework developed here can be applied beyond the ACTIVATE field campaign to advance efforts toward the comprehensive closure of aerosol optical and microphysical properties in future airborne field campaigns.
In this section we describe the mathematical model used to establish how aerosols interact with light based on their size, shape, and composition. Regardless of the shape, the amount of light scattered and absorbed by an aerosol of a given size is described by its scattering and absorption efficiency (Qscat and Qabs, respectively), which are directly dependent on the CRI. In addition to the total amount of light scattering and absorbing, it is also important to know what directions that an aerosol will scatter light and what impacts the aerosol has on the polarization of the incoming light. This information is contained in the angular scattering matrix (F) of an aerosol (Mishchenko and Travis, 1998; Gasteiger and Wiegner, 2018). The F describes the angle and relative intensity of scattered light and is defined as follows:
where θ is the angle of the scattered light. Within the angular scattering matrix, the first element is the phase function (a1) that describes the angular distribution of aerosol scattered light intensity. It is normalized over all directions so that it represents the probability of scattering into a given direction. In the context of this study, it defines the angular scattering characteristics relevant to the viewing geometries of the lidar, polarimeter, and in-situ instruments.
The remaining elements of F contain the information on how the aerosol twists incoming light as it is scattered, which changes the polarization of the incoming light. The angular scattering matrix combined with and Qscat provide all the information needed to determine how an aerosol of a given size scatters and twists the incoming light's Stokes vector (van de Hulst, 1981; Gasteiger and Wiegner, 2018). The Stokes vector parameterizes the polarization state of light and is defined as follows:
where S1(θ) is the angular light intensity and S2(θ), S3(θ), and S4(θ) correspond to the proportion of light in various polarization states. The S2(θ), S3(θ), and S4(θ) all contribute to the degree of linear polarization. Given the information contained in F and SI, the observed angular Stokes vector (SI,obs(θ)) of an aerosol can be expressed as follows:
where SI,inc(θ) is the Stokes vector of the incoming light and robs is the distance of the observer from the observed aerosol. In Eq. (A3), both the cg and the exact solution of the scattering matrix depend on aerosol shape.
In this section we define the equations for the additional ambient properties analyzed in the external consistency analysis. The ambient aerosol properties of interest are defined as follows (Note that the following equations are at ambient conditions):
where a1(180°) is the phase function at 180° scattering.
Note that calculation of ambient N is restricted to the optically active aerosol size-range (i.e., the portion of the distribution that significantly contributes to optical scattering and absorption; Schlosser et al., 2022). Subsequent to the limitation of ambient N, we calculate extinction cross-section (σext) using the following relationship:
where total Cext is the extinction coefficient for the total size-distribution and optical N is the number concentration for the optically-active aerosol size-range.
This section aims to define the statistical metrics used within this study. This also includes the specific metrics used to quantify how well ISARA-derived in-situ data close (i.e., agree) with internal, synthetic, and external consistency data sets. The mean () of a set of data is given by:
where Z(j) is an independent data point in the set Z and np is the total number of data points, respectively. The standard deviation (s) of a set of data is given by:
In some cases, we use the weighted mean for a set of data, which is defined as:
where weight(j) is the weight associated with a given data point. Following the definition of the weighted mean, we define the weighted standard deviation (sweight) of a set of data as:
The mean and standard deviation, or weighted mean and standard deviation where noted, are useful for quantifying the common trends and fluctuations for a given set of data. The correlation coefficient (r) is used to quantify the strength of correlation between two collocated data sets and is defined as follows:
where X and Y are the set of ISARA-derived and remote sensing aerosol measurements, respectively. Additionally, the p, which is the probability that the two parameters are not correlated (i.e., probability that the null-hypothesis is true), is used to quantify the statistical significance of the correlation (i.e., r). To quantify the difference between two measures of the same parameter, both bias and relative bias (RB) are used and defined as follows:
and
To quantify the systematic error of a set of comparable measures the normalized root-mean square deviation (NRMSD), the mean and standard deviation of bias (i.e., MB and SB, respectively), and the mean and standard deviation of RB (MRB and SRB, respectively) are discussed within the results. The NRMSD is defined as follows:
In this paper, statistical consistency of altitude-resolved data is determined to be successful for a given ambient aerosol property if NRMSD < 25 %, r > 0.8, and p < 0.05. Additionally, the consistency between column-averaged data are classified as “good”, “moderate”, and “poor”, based on either the column's extinction weighted standard deviation or the estimated of RSP error shown on Table 2. The ISARA- and RSP-derived properties are in good or moderate consistency if the are within 1sweight or within 3sweight, respectively. The column-averaged properties are in poor agreement if the are more than 3sweight from each other.
The ISARA codebase is written in open source Python. The ISARA codebase uses the Fortran-based Modeled Optical Properties of Ensembles of Aerosol Particles (MOPSMAP) to calculate aerosol properties from in-situ measurements (Gasteiger and Wiegner, 2018). A dedicated website for ISARA has been created, where instructions on how to download and use this code are found. The website is located at https://sdmitrovic.github.io/ISARA_code/ (last access: 25 November 2025).
Source ACTIVATE airborne data are available with the ISARA-derived ambient aerosol properties through https://doi.org/10.5067/SUBORBITAL/ACTIVATE/DATA001 (ACTIVATE science team, 2020).
The Supplement includes five figures and three tables to complement the main manuscript's external consistency analysis. The supplement related to this article is available online at https://doi.org/10.5194/amt-18-7187-2025-supplement.
SD and JS prepared manuscript with all co-authors involved in review and editing. JS, SD, and SS performed all consistency analyses detailed in this study. All other authors provided input for the manuscript and/or participated in data collection and processing.
The contact author has declared that none of the authors has any competing interests.
Publisher's note: Copernicus Publications remains neutral with regard to jurisdictional claims made in the text, published maps, institutional affiliations, or any other geographical representation in this paper. While Copernicus Publications makes every effort to include appropriate place names, the final responsibility lies with the authors. Views expressed in the text are those of the authors and do not necessarily reflect the views of the publisher.
Funding for this research was provided by the NASA ACTIVATE mission, a NASA Earth Venture Suborbital-3 (EVS-3) investigation funded by NASA's Earth Science Division and managed through the Earth System Science Pathfinder Program Office. A.S. and S.D. were supported by ONR grant N00014-22-1-2733 and by grant 80NSSC19K0442. J.S.S. was supported by the NASA Postdoctoral Program at NASA Langley Research Center, administered by Oak Ridge Associated Universities under contract with NASA. J.S.R. was supported by the Office of Naval Research Code 322. The authors gratefully acknowledge the NOAA Air Resources Laboratory (ARL) for the provision of the HYSPLIT transport and dispersion model and READY website (https://www.ready.noaa.gov, last access: 25 November 2025) used in this publication. We wish to thank the pilots and aircraft maintenance personnel of NASA Langley Research Services Directorate for their work in conducting the ACTIVATE flights.
This research has been supported by the Office of Naval Research (grant no. N00014-22-1-2733) and the ACTIVATE (grant no. 80NSSC19K0442).
This paper was edited by Charles Brock and reviewed by Han Huynh and three anonymous referees.
ACTIVATE science team: Aerosol cloud meteorology interactions over the western atlantic experiment data, NASA [data set], https://doi.org/10.5067/SUBORBITAL/ACTIVATE/DATA001, 2020. a
Ajayi, T., Choi, Y., Crosbie, E. C., DiGangi, J. P., Diskin, G. S., Fenn, M. A., Ferrare, R. A., Hair, J. W., Hilario, M. R. A., Hostetler, C. A., Kirschler, S., Moore, R. H., Shingler, T. J., Shook, M. A., Soloff, C., Thornhill, K. L., Voigt, C., Winstead, E. L., Ziemba, L. D., and Sorooshian, A.: Vertical variability of aerosol properties and trace gases over a remote marine region: a case study over Bermuda, Atmos. Chem. Phys., 24, 9197–9218, https://doi.org/10.5194/acp-24-9197-2024, 2024. a
Anderson, T. L. and Ogren, J. A.: Determining aerosol radiative properties using the TSI 3563 integrating nephelometer, Aerosol Science and Technology, 29, 57–69, https://doi.org/10.1080/02786829808965551, 1998. a
Bain, A., Rafferty, A., and Preston, T. C.: The wavelength-dependent complex refractive index of hygroscopic aerosol particles and other aqueous media: an effective oscillator model, Geophysical Research Letters, 46, 10636–10645, https://doi.org/10.1029/2019GL084568, 2019. a
Baron, P. and Willeke, K.: Aerosol Measurement: Principles, Techniques, and Applications, A Wiley-Interscience publication, Wiley, ISBN 9780471356363, https://books.google.com/books?id=nBpSAAAAMAAJ (last access: 25 Novemver 2025), 2001. a
Baumgardner, D., Jonsson, H., Dawson, W., O'Connor, D., and Newton, R.: The cloud, aerosol and precipitation spectrometer: a new instrument for cloud investigations, Atmospheric Research, 59-60, 251–264, https://doi.org/10.1016/S0169-8095(01)00119-3, 2001. a, b
Bi, L., Lin, W., Wang, Z., Tang, X., Zhang, X., and Yi, B.: Optical modeling of sea salt aerosols: the effects of nonsphericity and inhomogeneity, Journal of Geophysical Research: Atmospheres, 123, 543–558, https://doi.org/10.1002/2017JD027869, 2018. a
Bohren, C. and Huffman, D.: Absorption and Scattering of Light by Small Particles, Wiley Science Series, Wiley, ISBN 9783527618163, 2008. a
Braun, R. A., McComiskey, A., Tselioudis, G., Tropf, D., and Sorooshian, A.: Cloud, aerosol, and radiative properties over the western North Atlantic Ocean, Journal of Geophysical Research: Atmospheres, 126, e2020JD034113, https://doi.org/10.1029/2020JD034113, e2020JD034113 2020JD034113, 2021. a
Burton, S. P., Ferrare, R. A., Hostetler, C. A., Hair, J. W., Rogers, R. R., Obland, M. D., Butler, C. F., Cook, A. L., Harper, D. B., and Froyd, K. D.: Aerosol classification using airborne High Spectral Resolution Lidar measurements – methodology and examples, Atmos. Meas. Tech., 5, 73–98, https://doi.org/10.5194/amt-5-73-2012, 2012. a, b, c
Burton, S. P., Ferrare, R. A., Vaughan, M. A., Omar, A. H., Rogers, R. R., Hostetler, C. A., and Hair, J. W.: Aerosol classification from airborne HSRL and comparisons with the CALIPSO vertical feature mask, Atmos. Meas. Tech., 6, 1397–1412, https://doi.org/10.5194/amt-6-1397-2013, 2013. a
Burton, S. P., Chemyakin, E., Liu, X., Knobelspiesse, K., Stamnes, S., Sawamura, P., Moore, R. H., Hostetler, C. A., and Ferrare, R. A.: Information content and sensitivity of the 3β + 2α lidar measurement system for aerosol microphysical retrievals, Atmos. Meas. Tech., 9, 5555–5574, https://doi.org/10.5194/amt-9-5555-2016, 2016. a, b, c
Burton, S. P., Hostetler, C. A., Cook, A. L., Hair, J. W., Seaman, S. T., Scola, S., Harper, D. B., Smith, J. A., Fenn, M. A., Ferrare, R. A., Saide, P. E., Chemyakin, E. V., and Müller, D.: Calibration of a high spectral resolution lidar using a Michelson interferometer, with data examples from ORACLES, Appl. Opt., 57, 6061–6075, https://doi.org/10.1364/AO.57.006061, 2018. a
Cairns, B., Russell, E. E., and Travis, L. D.: Research Scanning Polarimeter: calibration and ground-based measurements, in: Polarization: Measurement, Analysis, and Remote Sensing II, edited by: Goldstein, D. H. and Chenault, D. B., International Society for Optics and Photonics, SPIE, vol. 3754, 186–196, https://doi.org/10.1117/12.366329, 1999. a
Cairns, B., Russell, E. E., LaVeigne, J. D., and Tennant, P. M. W.: Research scanning polarimeter and airborne usage for remote sensing of aerosols, in: Polarization Science and Remote Sensing, edited by: Shaw, J. A. and Tyo, J. S., International Society for Optics and Photonics, SPIE, vol. 5158, 33–44, https://doi.org/10.1117/12.518320, 2003. a
Chen, G., Ziemba, L. D., Chu, D. A., Thornhill, K. L., Schuster, G. L., Winstead, E. L., Diskin, G. S., Ferrare, R. A., Burton, S. P., Ismail, S., Kooi, S. A., Omar, A. H., Slusher, D. L., Kleb, M. M., Reid, J. S., Twohy, C. H., Zhang, H., and Anderson, B. E.: Observations of Saharan dust microphysical and optical properties from the Eastern Atlantic during NAMMA airborne field campaign, Atmos. Chem. Phys., 11, 723–740, https://doi.org/10.5194/acp-11-723-2011, 2011. a
Cholleton, D., Bialic, E., Dumas, A., Kaluzny, P., Rairoux, P., and Miffre, A.: Laboratory evaluation of the (VIS, IR) scattering matrix of complex-shaped ragweed pollen particles, Journal of Quantitative Spectroscopy and Radiative Transfer, 254, 107223, https://doi.org/10.1016/j.jqsrt.2020.107223, 2020. a
Corral, A. F., Braun, R. A., Cairns, B., Gorooh, V. A., Liu, H., Ma, L., Mardi, A. H., Painemal, D., Stamnes, S., van Diedenhoven, B., Wang, H., Yang, Y., Zhang, B., and Sorooshian, A.: An overview of atmospheric features over the western North Atlantic Ocean and North American east coast – Part 1: Analysis of Aerosols, Gases, and Wet Deposition Chemistry, Journal of Geophysical Research: Atmospheres, 126, e2020JD032592, https://doi.org/10.1029/2020JD032592, 2021. a
Corral, A. F., Choi, Y., Collister, B. L., Crosbie, E., Dadashazar, H., DiGangi, J. P., Diskin, G. S., Fenn, M., Kirschler, S., Moore, R. H., Nowak, J. B., Shook, M. A., Stahl, C. T., Shingler, T., Thornhill, K. L., Voigt, C., Ziemba, L. D., and Sorooshian, A.: Dimethylamine in cloud water: a case study over the northwest Atlantic Ocean, Environ. Sci.: Atmos., 2, 1534–1550, https://doi.org/10.1039/D2EA00117A, 2022. a
Dadashazar, H., Alipanah, M., Hilario, M. R. A., Crosbie, E., Kirschler, S., Liu, H., Moore, R. H., Peters, A. J., Scarino, A. J., Shook, M., Thornhill, K. L., Voigt, C., Wang, H., Winstead, E., Zhang, B., Ziemba, L., and Sorooshian, A.: Aerosol responses to precipitation along North American air trajectories arriving at Bermuda, Atmos. Chem. Phys., 21, 16121–16141, https://doi.org/10.5194/acp-21-16121-2021, 2021a. a
Dadashazar, H., Painemal, D., Alipanah, M., Brunke, M., Chellappan, S., Corral, A. F., Crosbie, E., Kirschler, S., Liu, H., Moore, R. H., Robinson, C., Scarino, A. J., Shook, M., Sinclair, K., Thornhill, K. L., Voigt, C., Wang, H., Winstead, E., Zeng, X., Ziemba, L., Zuidema, P., and Sorooshian, A.: Cloud drop number concentrations over the western North Atlantic Ocean: seasonal cycle, aerosol interrelationships, and other influential factors, Atmos. Chem. Phys., 21, 10499–10526, https://doi.org/10.5194/acp-21-10499-2021, 2021b. a
Dadashazar, H., Corral, A. F., Crosbie, E., Dmitrovic, S., Kirschler, S., McCauley, K., Moore, R., Robinson, C., Schlosser, J. S., Shook, M., Thornhill, K. L., Voigt, C., Winstead, E., Ziemba, L., and Sorooshian, A.: Organic enrichment in droplet residual particles relative to out of cloud over the northwestern Atlantic: analysis of airborne ACTIVATE data, Atmos. Chem. Phys., 22, 13897–13913, https://doi.org/10.5194/acp-22-13897-2022, 2022a. a
Dadashazar, H., Crosbie, E., Choi, Y., Corral, A. F., DiGangi, J. P., Diskin, G. S., Dmitrovic, S., Kirschler, S., McCauley, K., Moore, R. H., Nowak, J. B., Robinson, C. E., Schlosser, J., Shook, M., Thornhill, K. L., Voigt, C., Winstead, E. L., Ziemba, L. D., and Sorooshian, A.: Analysis of MONARC and ACTIVATE Airborne Aerosol Data for Aerosol-Cloud Interaction Investigations: Efficacy of Stairstepping Flight Legs for Airborne In Situ Sampling, Atmosphere, 13, https://doi.org/10.3390/atmos13081242, 2022b. a, b
Diskin, G. S., Podolske, J. R., Sachse, G. W., and Slate, T. A.: Open-path airborne tunable diode laser hygrometer, in: Diode Lasers and Applications in Atmospheric Sensing, edited by Fried, A., International Society for Optics and Photonics, SPIE, vol. 4817, 196–204, https://doi.org/10.1117/12.453736, 2002. a, b
Dubovik, O., Sinyuk, A., Lapyonok, T., Holben, B. N., Mishchenko, M., Yang, P., Eck, T. F., Volten, H., Muñoz, O., Veihelmann, B., van der Zande, W. J., Leon, J.-F., Sorokin, M., and Slutsker, I.: Application of spheroid models to account for aerosol particle nonsphericity in remote sensing of desert dust, Journal of Geophysical Research: Atmospheres, 111, https://doi.org/10.1029/2005JD006619, 2006. a
Ebert, M., Weinbruch, S., Hoffmann, P., and Ortner, H. M.: The chemical composition and complex refractive index of rural and urban influenced aerosols determined by individual particle analysis, Atmospheric Environment, 38, 6531–6545, https://doi.org/10.1016/j.atmosenv.2004.08.048, 2004. a
Ferrare, R., Hair, J., Hostetler, C., Shingler, T., Burton, S. P., Fenn, M., Clayton, M., Scarino, A. J., Harper, D., Seaman, S., Cook, A., Crosbie, E., Winstead, E., Ziemba, L., Thornhill, L., Robinson, C., Moore, R., Vaughan, M., Sorooshian, A., Schlosser, J. S., Liu, H., Zhang, B., Diskin, G., DiGangi, J., Nowak, J., Choi, Y., Zuidema, P., and Chellappan, S.: Airborne HSRL-2 measurements of elevated aerosol depolarization associated with non-spherical sea salt, Frontiers in Remote Sensing, 4, https://doi.org/10.3389/frsen.2023.1143944, 2023. a
Field, C., Barros, V., Dokken, D., Mach, K., Mastrandrea, M., Bilir, T., Chatterjee, M., Ebi, K., Estrada, Y., Genova, R., Girma, B., Kissel, E., Levy, A., MacCracken, S., Mastrandrea, P., and White, L.: IPCC: Summary for policymakers, in: Climate Change 2014: Impacts, Adaptation, and Vulnerability, vol. 1, Cambridge University Press, https://doi.org/10.1017/CBO9781107415379.003, 2014. a
Froyd, K. D., Murphy, D. M., Brock, C. A., Campuzano-Jost, P., Dibb, J. E., Jimenez, J.-L., Kupc, A., Middlebrook, A. M., Schill, G. P., Thornhill, K. L., Williamson, C. J., Wilson, J. C., and Ziemba, L. D.: A new method to quantify mineral dust and other aerosol species from aircraft platforms using single-particle mass spectrometry, Atmos. Meas. Tech., 12, 6209–6239, https://doi.org/10.5194/amt-12-6209-2019, 2019. a
Fu, G., Hasekamp, O., Rietjens, J., Smit, M., Di Noia, A., Cairns, B., Wasilewski, A., Diner, D., Seidel, F., Xu, F., Knobelspiesse, K., Gao, M., da Silva, A., Burton, S., Hostetler, C., Hair, J., and Ferrare, R.: Aerosol retrievals from different polarimeters during the ACEPOL campaign using a common retrieval algorithm, Atmos. Meas. Tech., 13, 553–573, https://doi.org/10.5194/amt-13-553-2020, 2020. a
Gasteiger, J. and Wiegner, M.: MOPSMAP v1.0: a versatile tool for the modeling of aerosol optical properties, Geosci. Model Dev., 11, 2739–2762, https://doi.org/10.5194/gmd-11-2739-2018, 2018. a, b, c, d, e
Gasteiger, J., Wiegner, M., Groß, S., Freudenthaler, V., Toledano, C., Tesche, M., and Kandler, K.: Modelling lidar-relevant optical properties of complex mineral dust aerosols, Tellus B: Chemical and Physical Meteorology, https://doi.org/10.1111/j.1600-0889.2011.00559.x, 2011. a, b
Hair, J., Hostetler, C., Cook, A., Harper, D., Ferrare, R., Mack, T., Welch, W., Izquierdo, L., and Hovis, F.: Airborne high spectral resolution lidar for profiling aerosol optical properties, Applied Optics, 47, 6734–6752, https://doi.org/10.1364/AO.47.006734, 2008. a
Hansen, J. E. and Travis, L. D.: Light scattering in planetary atmospheres, Space Science Reviews, 16, 527–610, https://doi.org/10.1007/BF00168069, 1974. a
Hussein, T., Maso, M. D., Petäjä, T., Koponen, I. K., Paatero, P., Aalto, P. P., Hämeri, K. J., and Kulmala, M.: Evaluation of an automatic algorithm for fitting the particle number size distributions, Boreal Environment Research, 10, 337–355, 2005. a
Kahnert, M. and Kanngießer, F.: Optical characterization of marine aerosols using a morphologically realistic model With varying water content: implications for lidar spplications and passive polarimetric remote sensing, Geophysical Research Letters, 51, e2023GL107541, https://doi.org/10.1029/2023GL107541, 2024. a, b
Kirschler, S., Voigt, C., Anderson, B., Campos Braga, R., Chen, G., Corral, A. F., Crosbie, E., Dadashazar, H., Ferrare, R. A., Hahn, V., Hendricks, J., Kaufmann, S., Moore, R., Pöhlker, M. L., Robinson, C., Scarino, A. J., Schollmayer, D., Shook, M. A., Thornhill, K. L., Winstead, E., Ziemba, L. D., and Sorooshian, A.: Seasonal updraft speeds change cloud droplet number concentrations in low-level clouds over the western North Atlantic, Atmos. Chem. Phys., 22, 8299–8319, https://doi.org/10.5194/acp-22-8299-2022, 2022. a
Knobelspiesse, K., Cairns, B., Ottaviani, M., Ferrare, R., Hair, J., Hostetler, C., Obland, M., Rogers, R., Redemann, J., Shinozuka, Y., Clarke, A., Freitag, S., Howell, S., Kapustin, V., and McNaughton, C.: Combined retrievals of boreal forest fire aerosol properties with a polarimeter and lidar, Atmos. Chem. Phys., 11, 7045–7067, https://doi.org/10.5194/acp-11-7045-2011, 2011. a
Kulkarni, P., Baron, P., and Willeke, K.: Aerosol Measurement: Principles, Techniques, and Applications, Engineering professional collection, Wiley, ISBN 9780470387412, https://books.google.com/books?id=2VtsSKLsMY8C (last access: 25 Novemer 2025), 2011. a
Lance, S.: Coincidence errors in a Cloud Droplet Probe (CDP) and a Cloud and Aerosol Spectrometer (CAS), and the improved performance of a modified CDP, Journal of Atmospheric and Oceanic Technology, 29, 1532–1541, https://doi.org/10.1175/JTECH-D-11-00208.1, 2012. a
Li, X., Gupta, D., Eom, H.-J., Kim, H., and Ro, C.-U.: Deliquescence and efflorescence behavior of individual NaCl and KCl mixture aerosol particles, Atmospheric Environment, 82, 36–43, https://doi.org/10.1016/j.atmosenv.2013.10.011, 2014. a
Li, Y., Bai, B., Dykema, J., Shin, N., Lambe, A. T., Chen, Q., Kuwata, M., Ng, N. L., Keutsch, F. N., and Liu, P.: Predicting real refractive index of organic aerosols from elemental composition, Geophysical Research Letters, 50, e2023GL103446, https://doi.org/10.1029/2023GL103446, 2023. a
Lin, W., Bi, L., and Dubovik, O.: Assessing superspheroids in modeling the scattering matrices of dust aerosols, Journal of Geophysical Research: Atmospheres, 123, 13917–13943, https://doi.org/10.1029/2018JD029464, 2018. a, b
Mason, B., Wagner, N. L., Adler, G., Andrews, E., Brock, C. A., Gordon, T. D., Lack, D. A., Perring, A. E., Richardson, M. S., Schwarz, J. P., Shook, M. A., Thornhill, K. L., Ziemba, L. D., and Murphy, D. M.: An intercomparison of aerosol absorption measurements conducted during the SEAC4RS campaign, Aerosol Science and Technology, 52, 1012–1027, https://doi.org/10.1080/02786826.2018.1500012, 2018. a
Massoli, P., Lambe, A. T., Ahern, A. T., Williams, L. R., Ehn, M., Mikkilä, J., Canagaratna, M. R., Brune, W. H., Onasch, T. B., Jayne, J. T., Petäjä, T., Kulmala, M., Laaksonen, A., Kolb, C. E., Davidovits, P., and Worsnop, D. R.: Relationship between aerosol oxidation level and hygroscopic properties of laboratory generated secondary organic aerosol (SOA) particles, Geophysical Research Letters, 37, https://doi.org/10.1029/2010GL045258, 2010. a
McNaughton, C. S., Clarke, A. D., Howell, S. G., Pinkerton, M., Anderson, B., Thornhill, L., Hudgins, C., Winstead, E., Dibb, J. E., Scheuer, E., and Maring, H.: Results from the DC-8 Inlet Characterization Experiment (DICE): airborne versus surface sampling of mineral dust and sea salt aerosols, Aerosol Science and Technology, 41, 136–159, https://doi.org/10.1080/02786820601118406, 2007. a
Mie, G.: Beiträge zur optik trüber medien, speziell kolloidaler metallösungen, Annalen der Physik, 330, 377–445, https://doi.org/10.1002/andp.19083300302, 1908. a
Mishchenko, M., Travis, L., and Lacis, A.: Scattering, Absorption, and Emission of Light by Small Particles, Cambridge University Press, ISBN 9780521782524, https://books.google.com/books?id=i6r1YFyK_g8C (last access: 25 Novemer 2025), 2002. a
Mishchenko, M. I. and Travis, L. D.: Capabilities and limitations of a current FORTRAN implementation of the T-matrix method for randomly oriented, rotationally symmetric scatterers, Journal of Quantitative Spectroscopy and Radiative Transfer, 60, 309–324, https://doi.org/10.1016/S0022-4073(98)00008-9, 1998. a
Moore, R. H., Thornhill, K. L., Weinzierl, B., Sauer, D., D'Ascoli, E., Kim, J., Lichtenstern, M., Scheibe, M., Beaton, B., Beyersdorf, A. J., Barrick, J., Bulzan, D., Corr, C. A., Crosbie, E., Jurkat, T., Martin, R., Riddick, D., Shook, M., Slover, G., Voigt, C., White, R., Winstead, E., Yasky, R., Ziemba, L. D., Brown, A., Schlager, H., and Anderson, B. E.: Biofuel blending reduces particle emissions from aircraft engines at cruise conditions, Nature, 543, 411–415, https://doi.org/10.1038/nature21420, 2017. a
Moosmüller, H. and Sorensen, C.: Small and large particle limits of single scattering albedo for homogeneous, spherical particles, Journal of Quantitative Spectroscopy and Radiative Transfer, 204, 250–255, https://doi.org/10.1016/j.jqsrt.2017.09.029, 2018. a, b
Moosmüller, H., Chakrabarty, R., and Arnott, W.: Aerosol light absorption and its measurement: a review, Journal of Quantitative Spectroscopy and Radiative Transfer, 110, 844–878, https://doi.org/10.1016/j.jqsrt.2009.02.035, 2009. a
Müller, D., Hostetler, C. A., Ferrare, R. A., Burton, S. P., Chemyakin, E., Kolgotin, A., Hair, J. W., Cook, A. L., Harper, D. B., Rogers, R. R., Hare, R. W., Cleckner, C. S., Obland, M. D., Tomlinson, J., Berg, L. K., and Schmid, B.: Airborne Multiwavelength High Spectral Resolution Lidar (HSRL-2) observations during TCAP 2012: vertical profiles of optical and microphysical properties of a smoke/urban haze plume over the northeastern coast of the US, Atmos. Meas. Tech., 7, 3487–3496, https://doi.org/10.5194/amt-7-3487-2014, 2014. a
Nakayama, T., Sato, K., Tsuge, M., Imamura, T., and Matsumi, Y.: Complex refractive index of secondary organic aerosol generated from isoprene/NOx photooxidation in the presence and absence of SO2, Journal of Geophysical Research: Atmospheres, 120, 7777–7787, https://doi.org/10.1002/2015JD023522, 2015. a
Nessler, R., Weingartner, E., and Baltensperger, U.: Effect of humidity on aerosol light absorption and its implications for extinction and the single scattering albedo illustrated for a site in the lower free troposphere, Journal of Aerosol Science, 36, 958–972, https://doi.org/10.1016/j.jaerosci.2004.11.012, 2005. a
Painemal, D., Corral, A. F., Sorooshian, A., Brunke, M. A., Chellappan, S., Afzali Gorooh, V., Ham, S.-H., O'Neill, L., Smith Jr., W. L., Tselioudis, G., Wang, H., Zeng, X., and Zuidema, P.: An overview of atmospheric features over the Western North Atlantic Ocean and North American east coast – Part 2: Circulation, Boundary Layer, and Clouds, Journal of Geophysical Research: Atmospheres, 126, e2020JD033423, https://doi.org/10.1029/2020JD033423, 2021. a
Petters, M. D. and Kreidenweis, S. M.: A single parameter representation of hygroscopic growth and cloud condensation nucleus activity, Atmos. Chem. Phys., 7, 1961–1971, https://doi.org/10.5194/acp-7-1961-2007, 2007. a, b, c, d, e
Pistone, K., Redemann, J., Doherty, S., Zuidema, P., Burton, S., Cairns, B., Cochrane, S., Ferrare, R., Flynn, C., Freitag, S., Howell, S. G., Kacenelenbogen, M., LeBlanc, S., Liu, X., Schmidt, K. S., Sedlacek III, A. J., Segal-Rozenhaimer, M., Shinozuka, Y., Stamnes, S., van Diedenhoven, B., Van Harten, G., and Xu, F.: Intercomparison of biomass burning aerosol optical properties from in situ and remote-sensing instruments in ORACLES-2016, Atmos. Chem. Phys., 19, 9181–9208, https://doi.org/10.5194/acp-19-9181-2019, 2019. a, b, c
Quinn, P., Bates, T., Coffman, D., Upchurch, L., Johnson, J., Moore, R., Ziemba, L., Bell, T., Saltzman, E., Graff, J., and Behrenfeld, M.: Seasonal variations in western North Atlantic remote marine aerosol properties, Journal of Geophysical Research: Atmospheres, 124, 14240–14261, https://doi.org/10.1029/2019JD031740, 2019. a
Reid, J. S., Jonsson, H. H., Maring, H. B., Smirnov, A., Savoie, D. L., Cliff, S. S., Reid, E. A., Livingston, J. M., Meier, M. M., Dubovik, O., and Tsay, S.-C.: Comparison of size and morphological measurements of coarse mode dust particles from Africa, Journal of Geophysical Research: Atmospheres, 108, https://doi.org/10.1029/2002JD002485, 2003. a
Reid, J. S., Brooks, B., Crahan, K. K., Hegg, D. A., Eck, T. F., O'Neill, N., de Leeuw, G., Reid, E. A., and Anderson, K. D.: Reconciliation of coarse mode sea-salt aerosol particle size measurements and parameterizations at a subtropical ocean receptor site, Journal of Geophysical Research: Atmospheres, 111, https://doi.org/10.1029/2005JD006200, 2006. a
Reid, J. S., Maring, H. B., Narisma, G. T., van den Heever, S., Girolamo, L. D., Ferrare, R., Lawson, P., Mace, G. G., Simpas, J. B., Tanelli, S., Ziemba, L., van Diedenhoven, B., Bruintjes, R., Bucholtz, A., Cairns, B., Cambaliza, M. O., Chen, G., Diskin, G. S., Flynn, J. H., Hostetler, C. A., Holz, R. E., Lang, T. J., Schmidt, K. S., Smith, G., Sorooshian, A., Thompson, E. J., Thornhill, K. L., Trepte, C., Wang, J., Woods, S., Yoon, S., Alexandrov, M., Alvarez, S., Amiot, C. G., Bennett, J. R., Brooks, M., Burton, S. P., Cayanan, E., Chen, H., Collow, A., Crosbie, E., DaSilva, A., DiGangi, J. P., Flagg, D. D., Freeman, S. W., Fu, D., Fukada, E., Hilario, M. R. A., Hong, Y., Hristova-Veleva, S. M., Kuehn, R., Kowch, R. S., Leung, G. R., Loveridge, J., Meyer, K., Miller, R. M., Montes, M. J., Moum, J. N., Nenes, A., Nesbitt, S. W., Norgren, M., Nowottnick, E. P., Rauber, R. M., Reid, E. A., Rutledge, S., Schlosser, J. S., Sekiyama, T. T., Shook, M. A., Sokolowsky, G. A., Stamnes, S. A., Tanaka, T. Y., Wasilewski, A., Xian, P., Xiao, Q., Xu, Z., and Zavaleta, J.: The coupling between tropical meteorology, aerosol lifecycle, convection, and radiation during the Cloud Aerosol and Monsoon Processes Philippines Experiment (CAMP2Ex), Bulletin of the American Meteorological Society, 104, E1179–E1205, https://doi.org/10.1175/BAMS-D-21-0285.1, 2023. a
Reid, J. S., Holz, R. E., Hostetler, C. A., Ferrare, R. A., Rubin, J. I., Thompson, E. J., van den Heever, S. C., Amiot, C. G., Burton, S. P., DiGangi, J. P., Diskin, G. S., Cossuth, J. H., Eleuterio, D. P., Eloranta, E. W., Kuehn, R., Marais, W. J., Maring, H. B., Sorooshian, A., Thornhill, K. L., Trepte, C. R., Wang, J., Xian, P., and Ziemba, L. D.: PISTON and CAMP2Ex observations of the fundamental modes of aerosol vertical variability in the Northwest Tropical Pacific and Maritime Continent's Monsoon, EGUsphere [preprint], https://doi.org/10.5194/egusphere-2025-2605, 2025. a
Rolph, G., Stein, A., and Stunder, B.: Real-time Environmental Applications and Display sYstem: READY, Environmental Modelling & Software, 95, 210–228, https://doi.org/10.1016/j.envsoft.2017.06.025, 2017. a
Ryder, C. L., McQuaid, J. B., Flamant, C., Rosenberg, P. D., Washington, R., Brindley, H. E., Highwood, E. J., Marsham, J. H., Parker, D. J., Todd, M. C., Banks, J. R., Brooke, J. K., Engelstaedter, S., Estelles, V., Formenti, P., Garcia-Carreras, L., Kocha, C., Marenco, F., Sodemann, H., Allen, C. J. T., Bourdon, A., Bart, M., Cavazos-Guerra, C., Chevaillier, S., Crosier, J., Darbyshire, E., Dean, A. R., Dorsey, J. R., Kent, J., O'Sullivan, D., Schepanski, K., Szpek, K., Trembath, J., and Woolley, A.: Advances in understanding mineral dust and boundary layer processes over the Sahara from Fennec aircraft observations, Atmos. Chem. Phys., 15, 8479–8520, https://doi.org/10.5194/acp-15-8479-2015, 2015. a
Ryder, C. L., Marenco, F., Brooke, J. K., Estelles, V., Cotton, R., Formenti, P., McQuaid, J. B., Price, H. C., Liu, D., Ausset, P., Rosenberg, P. D., Taylor, J. W., Choularton, T., Bower, K., Coe, H., Gallagher, M., Crosier, J., Lloyd, G., Highwood, E. J., and Murray, B. J.: Coarse-mode mineral dust size distributions, composition and optical properties from AER-D aircraft measurements over the tropical eastern Atlantic, Atmos. Chem. Phys., 18, 17225–17257, https://doi.org/10.5194/acp-18-17225-2018, 2018. a
Sawamura, P., Moore, R. H., Burton, S. P., Chemyakin, E., Müller, D., Kolgotin, A., Ferrare, R. A., Hostetler, C. A., Ziemba, L. D., Beyersdorf, A. J., and Anderson, B. E.: HSRL-2 aerosol optical measurements and microphysical retrievals vs. airborne in situ measurements during DISCOVER-AQ 2013: an intercomparison study, Atmos. Chem. Phys., 17, 7229–7243, https://doi.org/10.5194/acp-17-7229-2017, 2017. a, b, c, d, e, f, g, h, i, j, k, l
Schlosser, J. S., Stamnes, S., Burton, S. P., Cairns, B., Crosbie, E., Van Diedenhoven, B., Diskin, G., Dmitrovic, S., Ferrare, R., Hair, J. W., Hostetler, C. A., Hu, Y., Liu, X., Moore, R. H., Shingler, T., Shook, M. A., Thornhill, K. L., Winstead, E., Ziemba, L., and Sorooshian, A.: Polarimeter + Lidar-Derived Aerosol Particle Number Concentration, Frontiers in Remote Sensing, 3, https://doi.org/10.3389/frsen.2022.885332, 2022. a, b, c, d, e, f, g, h, i
Schlosser, J. S., Bennett, R., Cairns, B., Chen, G., Collister, B. L., Hair, J. W., Jones, M., Shook, M. A., Sorooshian, A., Thornhill, K. L., Ziemba, L. D., and Stamnes, S.: Maximizing the Volume of Collocated Data from Two Coordinated Suborbital Platforms, Journal of Atmospheric and Oceanic Technology, 41, 189–201, https://doi.org/10.1175/JTECH-D-23-0001.1, 2024. a, b, c
Schroeder, W., Oliva, P., Giglio, L., and Csiszar, I. A.: The new VIIRS 375m active fire detection data product: algorithm description and initial assessment, Remote Sensing of Environment, 143, 85–96, https://doi.org/10.1016/j.rse.2013.12.008, 2014. a
Shingler, T., Dey, S., Sorooshian, A., Brechtel, F. J., Wang, Z., Metcalf, A., Coggon, M., Mülmenstädt, J., Russell, L. M., Jonsson, H. H., and Seinfeld, J. H.: Characterisation and airborne deployment of a new counterflow virtual impactor inlet, Atmos. Meas. Tech., 5, 1259–1269, https://doi.org/10.5194/amt-5-1259-2012, 2012. a
Shingler, T., Sorooshian, A., Ortega, A., Crosbie, E., Wonaschütz, A., Perring, A. E., Beyersdorf, A., Ziemba, L., Jimenez, J. L., Campuzano-Jost, P., Mikoviny, T., Wisthaler, A., and Russell, L. M.: Ambient observations of hygroscopic growth factor and f(RH) below 1: Case studies from surface and airborne measurements, Journal of Geophysical Research: Atmospheres, 121, 13661–13677, https://doi.org/10.1002/2016JD025471, 2016. a, b, c
Sinclair, K., van Diedenhoven, B., Cairns, B., Alexandrov, M., Moore, R., Crosbie, E., and Ziemba, L.: Polarimetric retrievals of cloud droplet number concentrations, Remote Sensing of Environment, 228, 227–240, https://doi.org/10.1016/j.rse.2019.04.008, 2019. a
Soloff, C., Ajayi, T., Choi, Y., Crosbie, E. C., DiGangi, J. P., Diskin, G. S., Fenn, M. A., Ferrare, R. A., Gallo, F., Hair, J. W., Hilario, M. R. A., Kirschler, S., Moore, R. H., Shingler, T. J., Shook, M. A., Thornhill, K. L., Voigt, C., Winstead, E. L., Ziemba, L. D., and Sorooshian, A.: Bridging gas and aerosol properties between the northeastern US and Bermuda: analysis of eight transit flights, Atmos. Chem. Phys., 24, 10385–10408, https://doi.org/10.5194/acp-24-10385-2024, 2024. a
Sorooshian, A., Anderson, B., Bauer, S. E., Braun, R. A., Cairns, B., Crosbie, E., Dadashazar, H., Diskin, G., Ferrare, R., Flagan, R. C., Hair, J., Hostetler, C., Jonsson, H. H., Kleb, M. M., Liu, H., MacDonald, A. B., McComiskey, A., Moore, R., Painemal, D., Russell, L. M., Seinfeld, J. H., Shook, M., Smith, W. L., Thornhill, K., Tselioudis, G., Wang, H., Zeng, X., Zhang, B., Ziemba, L., and Zuidema, P.: Aerosol–cloud–meteorology interaction airborne field investigations: using lessons learned from the U.S. West Coast in the Design of ACTIVATE off the U.S. East Coast, Bulletin of the American Meteorological Society, 100, 1511–1528, https://doi.org/10.1175/BAMS-D-18-0100.1, 2019. a, b, c
Sorooshian, A., Corral, A. F., Braun, R. A., Cairns, B., Crosbie, E., Ferrare, R., Hair, J., Kleb, M. M., Hossein Mardi, A., Maring, H., McComiskey, A., Moore, R., Painemal, D., Scarino, A. J., Schlosser, J., Shingler, T., Shook, M., Wang, H., Zeng, X., Ziemba, L., and Zuidema, P.: Atmospheric research over the western North Atlantic Ocean region and North American east coast: a review of past work and challenges ahead, Journal of Geophysical Research: Atmospheres, 125, e2019JD031626, https://doi.org/10.1029/2019JD031626, 2020. a
Sorooshian, A., Alexandrov, M. D., Bell, A. D., Bennett, R., Betito, G., Burton, S. P., Buzanowicz, M. E., Cairns, B., Chemyakin, E. V., Chen, G., Choi, Y., Collister, B. L., Cook, A. L., Corral, A. F., Crosbie, E. C., van Diedenhoven, B., DiGangi, J. P., Diskin, G. S., Dmitrovic, S., Edwards, E.-L., Fenn, M. A., Ferrare, R. A., van Gilst, D., Hair, J. W., Harper, D. B., Hilario, M. R. A., Hostetler, C. A., Jester, N., Jones, M., Kirschler, S., Kleb, M. M., Kusterer, J. M., Leavor, S., Lee, J. W., Liu, H., McCauley, K., Moore, R. H., Nied, J., Notari, A., Nowak, J. B., Painemal, D., Phillips, K. E., Robinson, C. E., Scarino, A. J., Schlosser, J. S., Seaman, S. T., Seethala, C., Shingler, T. J., Shook, M. A., Sinclair, K. A., Smith Jr., W. L., Spangenberg, D. A., Stamnes, S. A., Thornhill, K. L., Voigt, C., Vömel, H., Wasilewski, A. P., Wang, H., Winstead, E. L., Zeider, K., Zeng, X., Zhang, B., Ziemba, L. D., and Zuidema, P.: Spatially coordinated airborne data and complementary products for aerosol, gas, cloud, and meteorological studies: the NASA ACTIVATE dataset , Earth Syst. Sci. Data, 15, 3419–3472, https://doi.org/10.5194/essd-15-3419-2023, 2023. a, b, c, d, e, f, g
Sorribas, M., Olmo, F. J., Quirantes, A., Lyamani, H., Gil-Ojeda, M., Alados-Arboledas, L., and Horvath, H.: Role of spheroidal particles in closure studies for aerosol microphysical–optical properties, Quarterly Journal of the Royal Meteorological Society, 141, 2700–2707, https://doi.org/10.1002/qj.2557, 2015. a, b, c
Stamnes, S., Hostetler, C., Ferrare, R., Burton, S., Liu, X., Hair, J., Hu, Y., Wasilewski, A., Martin, W., B., van Diedenhoven, Chowdhary, J., Cetinić, I., Berg, L. K., Stamnes, K., and Cairns, B.: Simultaneous polarimeter retrievals of microphysical aerosol and ocean color parameters from the “MAPP” algorithm with comparison to high-spectral-resolution lidar aerosol and ocean products, Applied Optics, 57, 2394–2413, https://doi.org/10.1364/AO.57.002394, 2018. a, b
Stein, A. F., Draxler, R. R., Rolph, G. D., Stunder, B. J. B., Cohen, M. D., and Ngan, F.: NOAA's HYSPLIT atmospheric transport and dispersion modeling system, Bulletin of the American Meteorological Society, 96, 2059–2077, https://doi.org/10.1175/BAMS-D-14-00110.1, 2015. a
Tsekeri, A., Amiridis, V., Marenco, F., Nenes, A., Marinou, E., Solomos, S., Rosenberg, P., Trembath, J., Nott, G. J., Allan, J., Le Breton, M., Bacak, A., Coe, H., Percival, C., and Mihalopoulos, N.: Profiling aerosol optical, microphysical and hygroscopic properties in ambient conditions by combining in situ and remote sensing, Atmos. Meas. Tech., 10, 83–107, https://doi.org/10.5194/amt-10-83-2017, 2017. a, b, c, d
Unga, F., Choël, M., Derimian, Y., Deboudt, K., Dubovik, O., and Goloub, P.: Microscopic observations of core-shell particle structure and implications for atmospheric aerosol remote sensing, Journal of Geophysical Research: Atmospheres, 123, 13944–13962, https://doi.org/10.1029/2018JD028602, 2018. a
van de Hulst, H. C.: Light scattering by small particles, Dover Publications, New York, ISBN 9780486139753, 1981. a
van Diedenhoven, B., Hasekamp, O. P., Cairns, B., Schuster, G. L., Stamnes, S., Shook, M., and Ziemba, L.: Remote sensing of aerosol water fraction, dry size distribution and soluble fraction using multi-angle, multi-spectral polarimetry, Atmos. Meas. Tech., 15, 7411–7434, https://doi.org/10.5194/amt-15-7411-2022, 2022. a, b
Veselovskii, I., Dubovik, O., Kolgotin, A., Lapyonok, T., Di Girolamo, P., Summa, D., Whiteman, D. N., Mishchenko, M., and Tanré, D.: Application of randomly oriented spheroids for retrieval of dust particle parameters from multiwavelength lidar measurements, Journal of Geophysical Research: Atmospheres, 115, https://doi.org/10.1029/2010JD014139, 2010. a
Virkkula, A.: Correction of the calibration of the 3-wavelength Particle Soot Absorption Photometer (3λ PSAP), Aerosol Science and Technology, 44, 706–712, https://doi.org/10.1080/02786826.2010.482110, 2010. a
Voshchinnikov, N. V. and Farafonov, V. G.: Optical properties of spheroidal particles, Astrophysics and Space Science, 204, 19–86, https://doi.org/10.1007/BF00658095, 1993. a
Vugrin, K. W., Swiler, L. P., Roberts, R. M., Stucky-Mack, N. J., and Sullivan, S. P.: Confidence region estimation techniques for nonlinear regression in groundwater flow: Three case studies, Water Resources Research, 43, https://doi.org/10.1029/2005WR004804, 2007. a
Wagner, R., Ajtai, T., Kandler, K., Lieke, K., Linke, C., Müller, T., Schnaiter, M., and Vragel, M.: Complex refractive indices of Saharan dust samples at visible and near UV wavelengths: a laboratory study, Atmos. Chem. Phys., 12, 2491–2512, https://doi.org/10.5194/acp-12-2491-2012, 2012. a
Wu, L., Hasekamp, O., van Diedenhoven, B., and Cairns, B.: Aerosol retrieval from multiangle, multispectral photopolarimetric measurements: importance of spectral range and angular resolution, Atmos. Meas. Tech., 8, 2625–2638, https://doi.org/10.5194/amt-8-2625-2015, 2015. a
Zieger, P., Fierz-Schmidhauser, R., Weingartner, E., and Baltensperger, U.: Effects of relative humidity on aerosol light scattering: results from different European sites, Atmos. Chem. Phys., 13, 10609–10631, https://doi.org/10.5194/acp-13-10609-2013, 2013. a
Ziemba, L. D., Lee Thornhill, K., Ferrare, R., Barrick, J., Beyersdorf, A. J., Chen, G., Crumeyrolle, S. N., Hair, J., Hostetler, C., Hudgins, C., Obland, M., Rogers, R., Scarino, A. J., Winstead, E. L., and Anderson, B. E.: Airborne observations of aerosol extinction by in situ and remote-sensing techniques: Evaluation of particle hygroscopicity, Geophysical Research Letters, 40, 417–422, https://doi.org/10.1029/2012GL054428, 2013. a, b
- Abstract
- Introduction
- Background on Aerosol Properties
- Methods
- Results and Discussion
- Conclusions
- Appendix A: Modeling the interaction of light with particles
- Appendix B: Equations describing ambient aerosol properties
- Appendix C: Statistical Analysis Metrics
- Code availability
- Data availability
- Author contributions
- Competing interests
- Disclaimer
- Acknowledgements
- Financial support
- Review statement
- References
- Supplement