the Creative Commons Attribution 4.0 License.
the Creative Commons Attribution 4.0 License.
 | 08 Dec 2025
Information-theoretic analysis of commercial microwave link and environmental variables in rainfall estimation
Martin Fencl
Vojtěch Bareš
Commercial microwave links (CMLs) are opportunistic rainfall sensors that provide indirect rainfall estimates from attenuation data. This is achieved by separating raindrop path attenuation from observed total loss and converting it to rainfall intensity using the k−R formula. Various methods have been proposed for CML rainfall retrieval using either attenuation data alone or additional environmental variables. However, most studies evaluate CML rainfall estimates deterministically and do not reveal how individual processing steps and variables affect rainfall estimation uncertainty. This study proposes to evaluate CML processing using an information-theoretic framework and demonstrates this probabilistic concept on two particular problems. The first analysis reveals the reduction of uncertainty in CML rainfall estimates by measuring the information content of individual variables and their combinations. Both quantitative and qualitative predictors are used, including sensor variables such as CML signal attenuation, and environmental variables such as temperature, or synoptic types. The rainfall intensity derived from the k−R formula and combined with synoptic type forms an informative combination of sensor and environmental variables for reducing uncertainty regarding reference rainfall intensity. The second analysis demonstrates the application of information theory for classifying wet and dry periods using signal attenuation data and other environmental variables. In a limited single-link evaluation, a non-parametric model indicated better performance than the reference approaches suggesting the potential of information theory in CML processing. The proposed framework enables the identification of informative sensor and environmental variables, the evaluation of the effects of different processing steps on the estimated rainfall intensity, or the development of a wet-dry classification model calibrated in a probabilistic manner ultimately facilitating the improvement of CML rainfall estimates.
- Article
(2218 KB) - Full-text XML
- BibTeX
- EndNote


Opportunistic rainfall observations can leverage existing precipitation monitoring networks. One of the most prominent sources of opportunistic rainfall data are commercial microwave links (CMLs), point-to-point radio connections operating as a backhaul of telecommunication networks and providing indirect rainfall observations through a dense monitoring network situated a few metres above ground (Uijlenhoet et al., 2018). In addition to the opportunistic nature of the observation, the data are accessible via standard communication protocols in near-real time (Chwala et al., 2016). Over the past decade, CMLs have been successfully employed in hydrology and hydrometeorology, particularly for rainfall monitoring (Messer et al., 2006; Rios Gaona et al., 2017; Graf et al., 2020), water vapour estimation (David et al., 2009), drop size distribution (DSD) estimation (van Leth et al., 2020), weather radar adjustment (Graf et al., 2024), nowcasting (Imhoff et al., 2020), and hydrological modelling in natural and urbanised catchments (Cazzaniga et al., 2022; Pastorek et al., 2023). The field of hydrometeorology can exploit dense near-ground CML networks providing reliable quantitative precipitation estimates (QPE). However, there are several challenges related to rainfall retrieval using CMLs.
As with weather radar, CML rainfall retrieval must address significant uncertainties and bias when estimating rain-induced specific attenuation and, consequently, rainfall intensity using a power law. The transformation of observed total loss (TL) on individual CMLs to rainfall intensity R requires several processing steps. The first step eliminates background attenuation levels, the so-called baseline separation or identification of dry weather attenuation (Ostrometzky and Messer, 2018; Polz et al., 2020; Schleiss and Berne, 2010). The second step involves removing residual attenuation originating from the wetting of radio antenna radomes in the form of additional, multiplicative, or time-dependent biases (Leijnse et al., 2008; Overeem et al., 2011; Pastorek et al., 2022; Schleiss et al., 2013). Lastly, CML path-specific attenuation k is transformed to rainfall intensity using a power law and its empirical parameters depending on CML frequency, microwave polarization, and precipitation DSD, frequently adopted from ITU recommendations (ITU-R, 2005).
CML rainfall retrieval is susceptible to multiple factors of varying origin, all of whose roles must be accounted for and considered, including radio hardware, antenna shielding, CML installation, CML length, microwave propagation near ground (vegetation, surfaces wetness), as well as atmospheric conditions such as rainfall DSD, the terminal velocity of drops, wind speed, humidity, temperature and sunlight. A review of different sources of errors in CML rainfall retrieval can be found in Leijnse et al. (2010), Chwala and Kunstmann (2019) or Špačková et al. (2023).
Furthermore, compared to the quantitative precipitation estimation (QPE) provided by the weather radar product, the CML rainfall composite is derived from the observations of hundreds or thousands of individual sensors with spatially variable densities, sensor characteristics, sensor sensitivities to rainfall, errors and uncertainties.
In summary, despite significant progress in the retrieval of CML QPE over the past decade, the interpretation of CML precipitation data using deterministic models is difficult. The precise processing of observed total loss to rainfall intensity requires an accurate description of conditions along the CML path as total loss is composed of free space loss, atmospheric absorption, and losses and gains at the antennas (ITU-R, 2009). CML empirical relations, e.g., the k−R relation with its empirical parameters or models for the wetting of antenna radomes, are designed to reduce bias by utilising variables that can be obtained from opportunistic sensors. However, systematic errors may be explained by environmental variables. Standard approaches do not reveal different data inputs with respect to the uncertainty of the estimation. Furthermore, the interpretation of CML rainfall data is also questioned by uncertainty and the bias of reference rainfall products, e.g., commonly used gauge-adjusted weather radar which is prone to significant uncertainties (Schleiss et al., 2020).
In this context, we apply an information-theoretic framework (Shannon, 1948) which enables the evaluation of the strength of the relations between data using derived discrete probability distributions instead of standard optimization processes in formulated deterministic or empirical models. The approach is objective, minimises model parameters and directly measures the information value of data (and strength of their relations), together with the estimation of uncertainty. Furthermore, the framework allows the favourable integration of both quantitative and qualitative data. The discretization employed in the application of the information theory framework allows wider binning for more intense rainfalls, thus partly mitigating the increasing uncertainty of observations of high rainfall intensities.
This paper presents two analyses. The first examines the information value and uncertainty contribution of individual CML processing steps, CML characteristics and environmental variables to the resulting QPEs. The second experiment is focused on wet-dry classification. It demonstrates the potential of the non-parametric model on a single link built in the framework of information theory in comparison to established wet-dry classification and baseline separation approaches.
For the first analysis, 117 sublink CMLs from the region of Prague in the Czech Republic are utilised. Firstly, the contribution of the rainfall-attenuation relation, the wet antenna attenuation (WAA) and the dependence of rainfall retrieval on CML characteristics are evaluated by measuring the strength of their relations towards reference rainfall. Secondly, the information value and relevance of environmental variables, namely temperature, seasonality and synoptic type, for CML rainfall retrieval, are explored. Thirdly, the effect of data sample size, with respect to different predictive models and the number of predictors, is investigated. In this study, the gauge-adjusted weather radar product is used as the reference.
The second analysis assesses the information value of sensor data and environmental variables towards wet-dry classification on a single CML across three non-winter seasons. The investigation of different combinations of variables is followed by the application of the model and its comparison with established CML wet-dry classification and baseline separation approaches.
This study proposes data-driven models for CML rainfall estimation and wet-dry classification using the information theory approach which emphasises the key variables driving the two objectives integral to CML data processing.
The paper is structured as follows: Sect. 2 elaborates on an overview of information theory methodology and introduces the terminology of the information and uncertainty in the context of information theory, in addition to the measures applied in this approach. The section then assimilates questions to be answered by the information theory approach.
Section 3 summarises the methodology steps in the context of this study. The two tasks, rainfall estimation and wet-dry classification, are elaborated upon separately.
Section 4 presents the available target and predictor data including its preprocessing.
Section 5 presents the results. Firstly, the results of the rainfall estimation analysis which highlight the significance of the variables of rainfall estimation and an evaluation of the models built from the sample showing the data demand. Secondly, the results show the variables influencing wet-dry classification. The information-theory model application is then compared to established wet-dry classification approaches.
The discussion follows with conclusions being drawn in the last section.
This section outlines the fundamental principles of the information theory approach, including the most relevant measures and their application within the context of this paper.
The idea of entropy as a measure of uncertainty comes from a mathematical theory of communication (Shannon, 1948). For a method overview we refer the reader to these textbooks (Cover and Thomas, 2006; Singh, 2013) and papers (Timme and Lapish, 2018; Neuper and Ehret, 2019). Owing to its generality, the approach found its application in e.g., biology (Uda, 2020), design monitoring networks (Foroozand and Weijs, 2021), neuroscience (Timme and Lapish, 2018), the social sciences (Šlerka and Šisler, 2018) or bioinformatics (Steuer et al., 2002). In the field of hydrology, relevant studies include the analysis of the linkage between the hydrological system and topography (Loritz et al., 2018), precipitation variability (Mishra et al., 2009), precipitation estimation (Neuper and Ehret, 2019), model performance evaluation (Liu et al., 2016), or rainfall-runoff event identification (Thiesen et al., 2019).
Information theory benefits from its multivariate analysis setup, in which interactions between variables (in principle, a large number) are examined. It describes uncertainty and dependency between variables and their reciprocal influence (Cover and Thomas, 2006). It both highlights and distinguishes between variables that determine the system. Even nonlinear interactions of the system variables are successfully detected (e.g., Fig. 5 in Timme and Lapish, 2018). It poses minimum assumptions about the system structure and data interactions. No a priori parameters nor their optimization are required, the data are incorporated directly into the information theory framework. Favourably, data can be of any type (continuous and/or discrete) and can be pre-processed.
The information theory approach does have weaknesses, such as not being able to provide a description of the system mechanism, and how the system works. It does, however, highlight the strength of association between variables. The theory only sets the boundaries of possible models, in the sense of constraining relations between physical quantities (Timme and Lapish, 2018) as it assumes that the system produces outcomes within a certain range. Compared to sensitivity analysis, information theory does not analyse a system under a given set of assumptions and empirical relations, but rather the statistical dependence of variables (Cover and Thomas, 2006). Sensitivity analysis identifies areas for improvement and the impact of changes on the outcome (Saltelli et al., 2008). Information theory identifies dependent variables without any assumptions about the system. Unlike Bayesian analysis, which updates probabilities based on the latest available record, information theory is not a tool for decision-making; rather it explores the relations between variables to provide an overall picture (Gong et al., 2013). Uncertainty in terms of precision and accuracy can only be analysed for the results of a model that gives the same quantities and units as the reference. Since information theory measures do not provide probabilities of system outcomes, it is unsuitable for decision-making purposes.
Even though the continuous form of information theory framework is possible (Cover and Thomas, 2006), it works more instinctually with discrete data which implies that the data needs to be discretized into bins depending on the user's choice. As multivariate data distribution is possible, it can lead to a distribution with an inadequate population (Darscheid et al., 2018) when dataset size is insufficient. Nonstationary data may complicate the interpretation of results, thus system stationarity is often assumed (Timme and Lapish, 2018). Moreover, the temporal order of data is lost with the transformation to probability distribution.
The model is, in the context of this study, a multivariate probability distribution of target, the variable we want to predict, and predictors which are variables that potentially reduce uncertainty concerning the target or carry information about the target. Thus, the model consists of a target and predictor variable(s). The model dimension is the number of predictors plus one (which is the target).
The key quantity in the context of information theory is information (I(x), Eq. 1) which is a negative logarithm of probability p of outcome x:
With a base 2 logarithm, information has units of bits and is additive which is an intuitive characteristic. The data in the time series have an information value that is based on occurrence probability p in the dataset. Thus, information value is derived for a specific dataset.
Data carry information, which reduces uncertainty, and having a large enough dataset allows the true probability distribution of a variable to be known. Different sources of uncertainty can be formulated and quantified: uncertainty due to data variability, uncertainty that can be limited by the knowledge of other variables, and uncertainty by the limited knowledge of data distribution. The measures to comprehend these sources of uncertainty are provided in the following paragraphs.
Entropy (H(X), Eq. 2) is a non-negative measure of information content, or measure of uncertainty, and it is unit invariant:
where X is a discrete variable. Intuitively, the higher the entropy, the higher the uncertainty. Moreover, entropy cannot be negative as this would lead to counter-intuitive negative uncertainty. It measures the spread of the distribution but, in contrast to variance, it is not as influenced by data at large distances from the mean. On the contrary, it is mainly influenced by higher probability outcomes. Consequently, the distribution of qualitative variables can be incorporated in the models. Compared to variance it has boundaries. The minimum entropy is 0 bit, i.e., the probability of the outcome is 1. The maximum entropy is associated with uniform probability distribution.
Conditional entropy (H(X|Y), Eq. 3) measures the ability of information that we have, in advance, to reduce uncertainty:
where X and Y are the target and the predictor variables, respectively. Prior knowledge of other variables will never increase the level of uncertainty compared to the state without the other variable. In the worst-case scenario, prior knowledge of other variables is not helpful, and uncertainty remains the same. It describes functional behaviour and does not anticipate performance, such as root mean square error (RMSE).
The model uses the predictor(s) to condition the target and evaluates the information gain when an observation of another variable is used to predict the target. The more informative the predictor, the lower the uncertainty. Thus, different predictors can be evaluated for the significance of their information relating to the target.
In conclusion, the entropy of target variable distribution scales the uncertainty level so that our models, conditioned by predictors, always perform better. Conditional entropy is always equal or smaller than the entropy of the target (Cover and Thomas, 2006). In this study, the scale is set by the entropy of the distribution of reference rainfall intensity and, for the other analysis, the entropy of the target distribution of reference wet-dry timesteps.
The Kullback-Leibler distance (D, Eq. 4, Kullback and Leibler, 1951) is a model-based component of uncertainty:
It is the statistical distance between true p and approximate q distribution (Cover and Thomas, 2006) and serves as a measure of representativeness of the sample to the target.
Cross entropy (Hpq, Eq. 5) combines the uncertainty of data (conditional uncertainty) and of the model (the Kullback-Leibler distance):
Thus, it allows the evaluation of the magnitude and origin of the uncertainty: If the true probability distribution of the system differs from the model, cross entropy increases as it equals the sum of the Kullback-Leibler distance and entropy.
It may happen that some bins in the distribution become empty, thus representing zero probability and leading to an infinite Kullback-Leibler distance. To prevent this, Darscheid et al. (2018) suggested replacing zero probability by small, nonzero values.
The application utilises opportunistic rainfall observations from commercial microwave links and incorporates ordinarily collected environmental observations to assess their potential in CML rainfall estimation models.
The two analyses, each focusing on distinct targets, are conducted using selected predictors. The first analysis aims at estimating reference rainfall intensity as observed by independently adjusted weather radar. The second analysis focuses on the classification of wet-dry timesteps in the CML signal attenuation time series.
The target variable in the first analysis is the adjusted weather radar rainfall intensity, while in the second analysis it is a classification of wet-dry timesteps. These targets are tested by various predictor variables, including quantitative variables (e.g., specific attenuation) and qualitative variables (e.g., synoptic type), which are listed in Tables 1 and 2.
The relationships among these variables are derived directly from the data tuples, i.e., joint observations of the target and predictor variables at each timestep. To construct a multivariate probability distribution describing a statistical dependence between the predictor(s) and target X, the variables are discretized into bins (as shown in the fourth columns in Tables 1 and 2). Each joint probability is then estimated empirically as the relative frequency of co-occurrence of the predictor-target tuples in the dataset.
Next, the entropy, which measures the overall uncertainty of a target variable, is calculated using Eq. (2). In this equation, p(x) is determined from the discretized distribution of the target variable. To maximize this uncertainty, the empirical distribution of the target is transformed into a uniform distribution with the bin ranges to match those of the target.
Then, the conditional entropy, which measures the remaining uncertainty in the target variable after considering the predictor variable(s), is calculated using Eq. (3). Conditional entropy H(X|Y) is the entropy of the distribution of X, weighted by the probabilities of each condition where Y=y is known.
The diagram of the model construction and evaluation is in Appendix A.
3.1 Binning of data variables
The binning process involves discretizing data variables into a finite number of intervals (bins) which enables the construction of empirical probability distributions required for the calculations of the information theory metrics. Binning is subjective, based on user requirements and should reflect data size, distribution, and precision (Thiesen et al., 2019).
The bin widths were selected to balance several considerations. Wherever possible, uniform bin widths were used to maintain consistency and comparability. However, for variables with highly skewed distributions, non-uniform binning was applied to ensure that both common and extreme values were adequately represented and captured the variability in the data.
The minimum bin width for rainfall intensity was set to 0.5 mm h−1, as the bin width should be greater than or equal to the measurement resolution. The coarsest resolution of rainfall intensity is provided by the tipping bucket rain gauges (0.1 mm h−1). To preserve the skewness and variability inherent rainfall and attenuation data, bin widths were made wider for more intense rainfall where observations are rarer. Binning for the specific attenuation data is set by the reverse transformation of rainfall intensity binning edges to specific attenuation binning edges by the International Telecommunication Union (ITU) coefficients for 30 GHz CML.
For some variables, e.g., total loss (TL) gradient, the wider bin size is applied only for data close to the data range limits to preserve the data long tail and limit the number of empty bins.
Binning for CML frequency data follows the ITU Recommendation for frequency bands (ITU-R, 2001). To avoid empty bins, the absent frequency bands and missing intervals between the ranges of frequency bands are merged with lower frequency bands.
The qualitative data of synoptic type, CML polarization and wet-dry timesteps are labelled by integer and binned.
Further discussion can be found in Sect. 5.3.3 Binning.
3.2 Rainfall intensity estimation
The targets for the first analysis are reference rainfall intensities retrieved from the intersect of the CML path with the gauge-adjusted weather radar pixels. It is assumed that the reference observation reflects the truth, however, rainfall is an environmental process variable (both in space and time), complex, large in scale and inaccessible, meaning the uncertainty of the target observation to the truth is hardly estimated. As in other studies comparing CML and adjusted radar observations (Overeem et al., 2013; Graf et al., 2020), we accept the reference as truth and a target to aim for.
The predictors, listed in Table 1, are variables that potentially reduce uncertainty about the target. Data are aggregated into 15 min resolutions. Data with longer sampling (seasonality, synoptic type, temperature) are considered as constant for the unsampled timesteps.
To prevent skewness, caused by a large number of dry timesteps, the dataset is subset by selecting only those instances where the adjusted radar rainfall intensity at the corresponding CML path exceeds 0.5 mm h−1. The results reflect this consideration because the choice of threshold can influence precipitation occurrence statistics, as light precipitation below the detection thresholds is common.
Table 1Data used in the rainfall estimation analysis. Binning is identified by the edges of the bins.
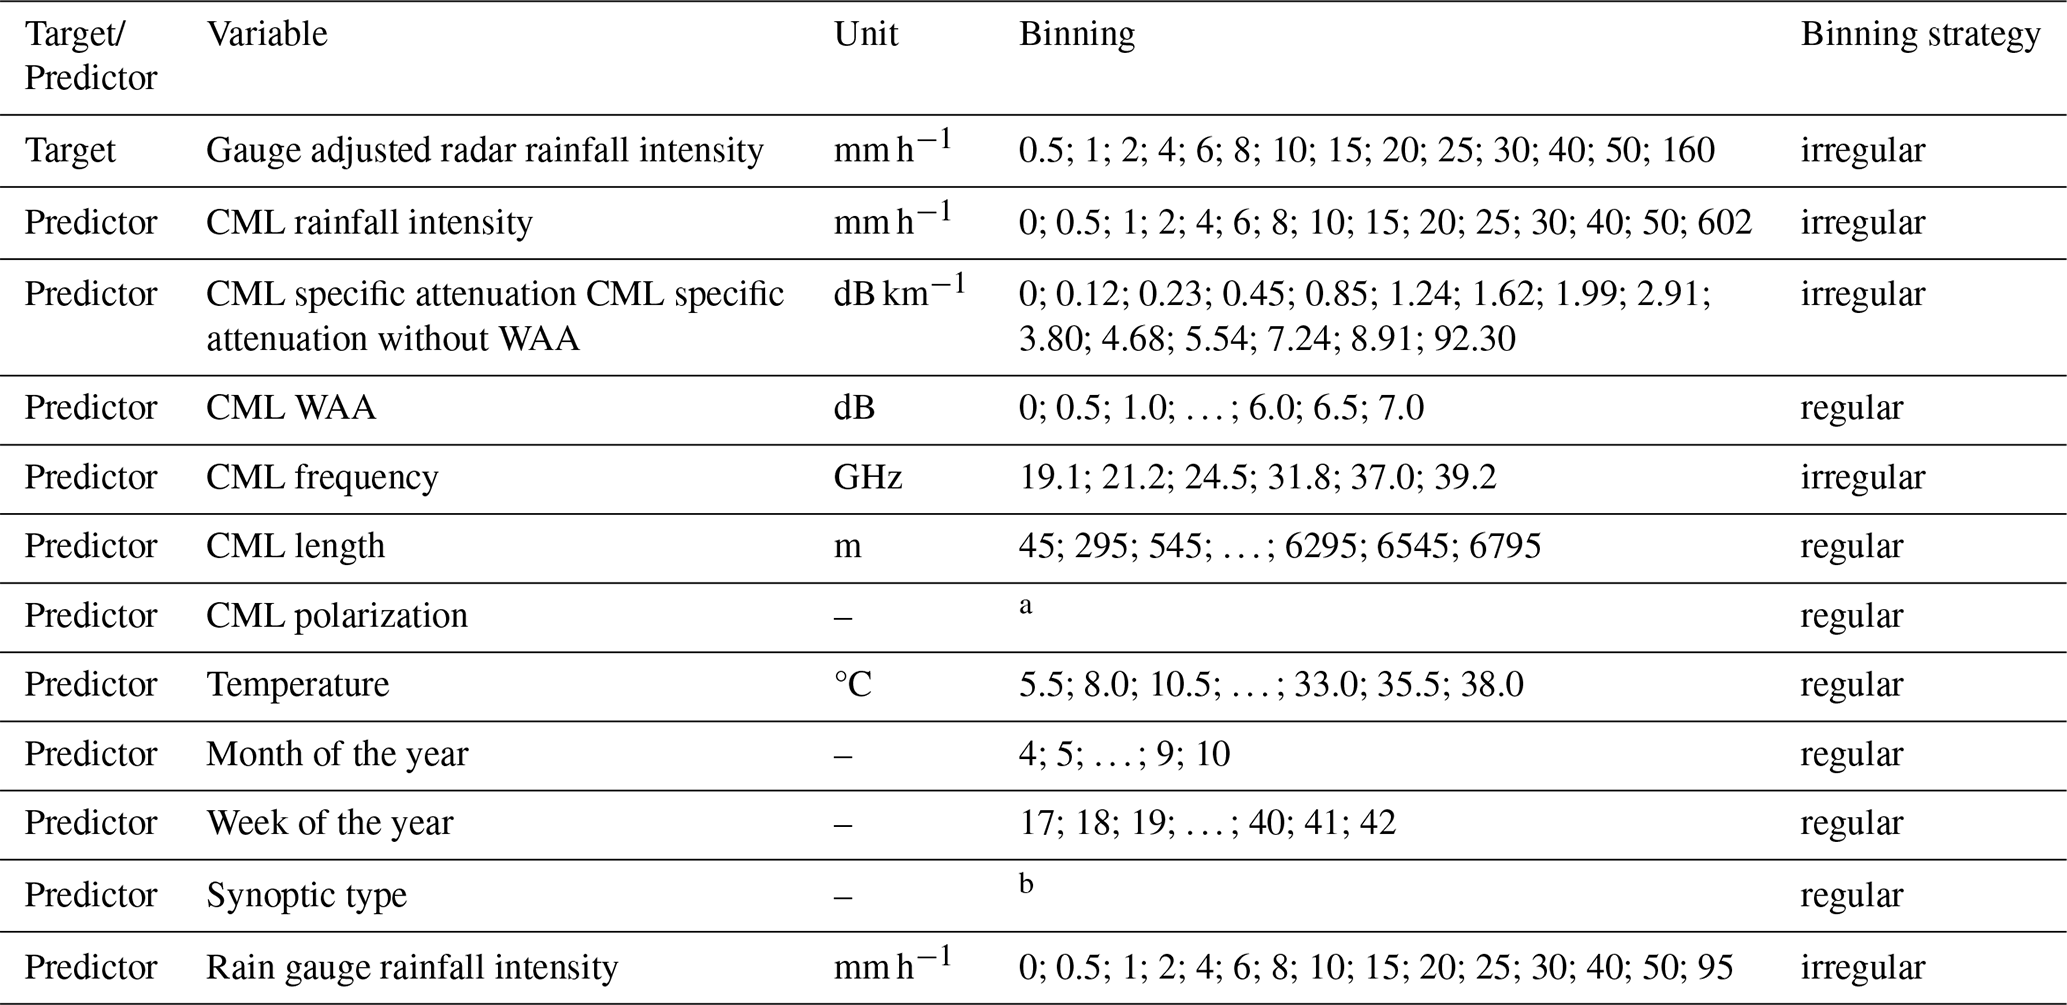
For qualitative predictors: a horizontal or vertical; b 15 synoptic types.
The information theory measures (entropy Eq. 2 and conditional entropy Eq. 3) are calculated for single- and multi-predictor models. The predictors and their combinations are ranked based on their ability to predict the target.
The robustness of the models is evaluated by quantifying cross entropy Eq. (5) where approximate distribution q is constructed from a sample dataset, and true data distribution p from the full dataset. When the sample accurately represents the full dataset, the cross entropy becomes equal to conditional entropy. The cross entropy is calculated for sample sizes (500, 750, 1000, 1500, 2000, 5000, 10 000, 30 000, and the full dataset 52 738). A randomly drawn subset for each sample size is repeated 500 times.
3.3 Wet-dry classification
The targets for the second analysis are reference timesteps identified as wet or dry in CML TL data. The predictors are variables that potentially reduce our uncertainty about the target and are listed in Table 2.
CML data are aggregated into a 1 min resolution. Data with longer sampling (seasonality, synoptic type, temperature) are considered as constant for the unsampled timesteps.
Entropy Eq. (2) and conditional entropy Eq. (3) are calculated for single- and multi-predictor models. The predictors and their combinations are ranked based on their ability to predict the target. The most informative predictor combination is used for the application of the wet-dry classification model.
Table 2Data used in the wet-dry classification analysis. Binning is identified by the edges of the bins.
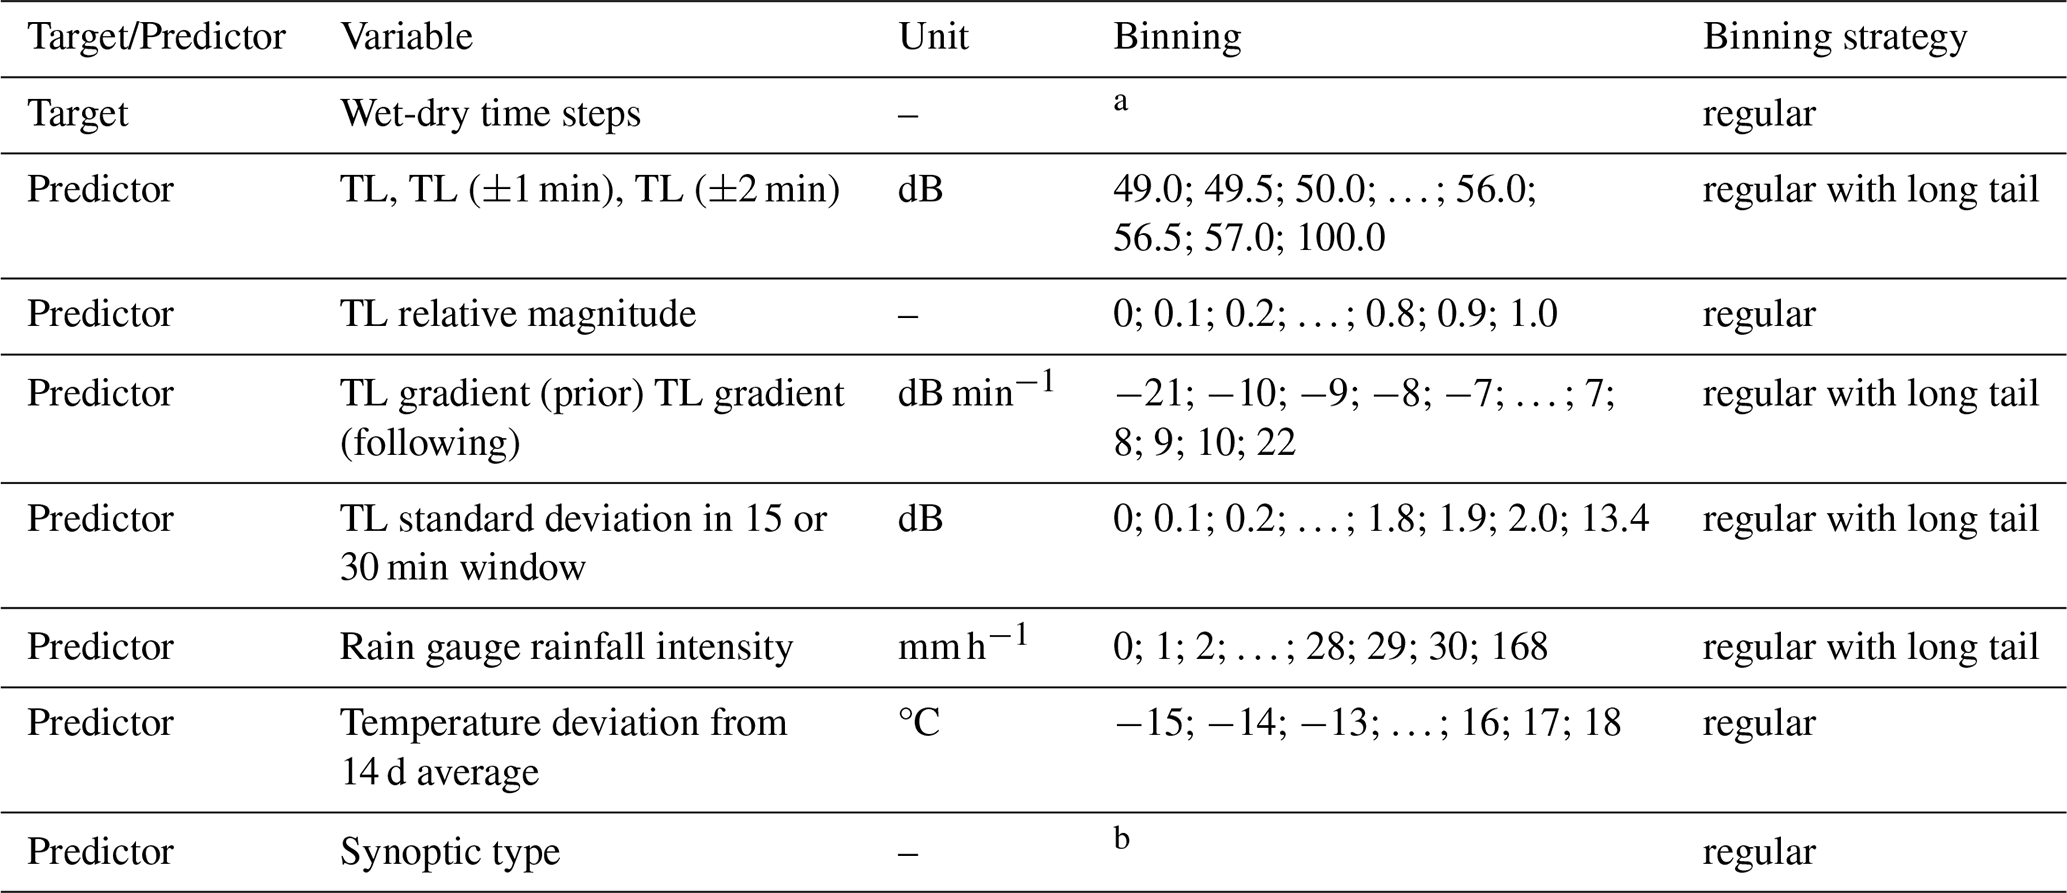
For qualitative predictors: a dry or wet; b 28 synoptic types.
3.3.1 Application and evaluation of wet-dry classification model
The binary nature of the target in the wet-dry classification analysis allows the conversion of the model into binary wet-dry flagged timesteps in the original data time series. The objective is to convert a multivariate probability distribution into binary output as in Thiesen et al. (2019). The dataset is split into a training subset for calibrating the detection threshold and a testing subset used for validation. Different training sample sizes are drawn as a subset of 10 000, 50 000 and 90 000 timesteps. The detection threshold is determined iteratively as follows:
-
Each combination of predictors has a probability for wet and dry timesteps. If a time step has a wet probability greater than the detection threshold, it is labelled as wet.
-
The match rate with the target is checked using receiver operating characteristics (ROC) that reflect the ratio of true positives and the ratio of false positives.
-
The optimal threshold is found by minimising the distance to the ideal scenario:
where RTP is a ratio of true positives and RFP is a ratio of false positives defined as:
Validation of the optimal threshold is performed on the test data by the ROC. The ROC is a statistical tool for the evaluation and visual representation of binary classifier performance. It is defined by mapping RFP on the horizontal axis and RTP on the vertical axis, thus the top-left corner of the plot represents a perfect model.
The optimal threshold is then applied to the testing subset of the data. The results of the proposed information theory model are then compared to alternative wet-dry classification approaches that are widely used in CML data processing. The results are also evaluated by the Matthews correlation coefficient (MCC), which is a measure for binary classification that handles class imbalance and has a high value only when the classifier works well on both wet and dry periods. The MCC ranges from −1 (worse) to 1 (best). It is defined as:
where TP are true positives, TN are true negatives, FP are false positives and FN are false negatives.
3.3.2 Alternative wet-dry classification approach
Common wet-dry classification approaches are used in this study in comparison with the information theory approach. The most prominent and established approaches are the following:
- a.
Baseline separation approach
It first estimates the baseline on a data-driven basis as a 1 % quantile of total loss baseline, a 7 d baseline of 15 min averages, a constant median baseline, or as a 7 d moving quantile window baseline (Overeem et al., 2016; Fencl et al., 2017, 2020).
- b.
Wet-dry classification by Schleiss and Berne (2010)
This is a commonly used wet-dry classification benchmark in CML research and frequently applied in other studies (e.g., Weiss et al., 2024; Graf et al., 2020; Djibo et al., 2023). It sets a threshold for a rolling 15 min window standard deviation of total loss. Its detection ability is limited by the window and level of fluctuation within the window.
The study presents available CML data from the non-winter seasons between 2014 and 2016 in the Prague area (35 km × 35 km). In addition to CML data, gauge-adjusted radar data, rain gauge data and other easily accessible environmental data are used. The data resolution for rainfall estimation analysis is 15 min. As the raw 5 min weather radar sampling suffers from significant bias, even when adjusted by municipal rain gauges, the data were aggregated to 15 min, thus balancing a sufficient size of the dataset with bias reduction (see Sect. 5.3.2 Accuracy of reference rainfall in Discussion). The data resolution for wet-dry classification analysis is 1 min thus preserving the resolution of the CML data. Lists of all variables for the rainfall estimation analysis and the wet-dry classification analysis can be found in Tables 1 and 2, respectively.
4.1 Target data
Target data (the first lines in Tables 1 and 2) in this study are:
-
For the rainfall intensity analysis: rainfall intensities from gauge-adjusted weather radar averaged along a CML path.
-
For the wet-dry classification analysis: a flagged time series of total loss classifying for one CML wet and dry time steps.
4.1.1 Adjusted radar data – rainfall intensity analysis
Raw radar images are composites of two dual-polarized weather radars from the CZRAD network operated by the Czech Hydrometeorological institute. Reflectivity from 2 km above sea level (CAPPI 2 km) is in a resolution of 1 km × 1 km and 5 min. From the raw rainfall images an area of 35 km × 35 km over Prague is selected.
The raw data are aggregated into a 15 min resolution and the multiplicative bias correction is applied by the wradlib package (Heistermann et al., 2013) using 23 municipal rain gauge stations. Further information about rain gauges used for the adjustment is found in Sect. 4.2.3 Rain gauge data.
4.1.2 Detection of wet and dry timesteps – wet-dry classification analysis
The analysis is performed on a selected CML (25.56 GHz, 2480 m long) from the Prague CML network, specifically a link from group 1a in Špačková et al. (2023). The target wet-dry classifier is constructed in two steps. First, rainfall intensities from a tipping bucket rain gauge located approximately 3 km from the CML path (Fig. 1) are used to identify wet and dry periods at a coarser scale, where errors due to rain-gauge quantization, distance to the CML and limited catch area are less pronounced. Second, this coarse wet-dry classifier is refined to a 1 min resolution by visually inspecting total loss to determine the precise onset and end of rainfall events, taking advantage of the typically strong correlation between attenuation and rain rate (e.g., Graf et al., 2020). Fine manual identification also helps to capture WAA patterns for accurately distinguishing periods of wet antenna from actual rainfall effects. In total, 97 % of the timesteps are classified as dry and 3 % of the timesteps as wet.
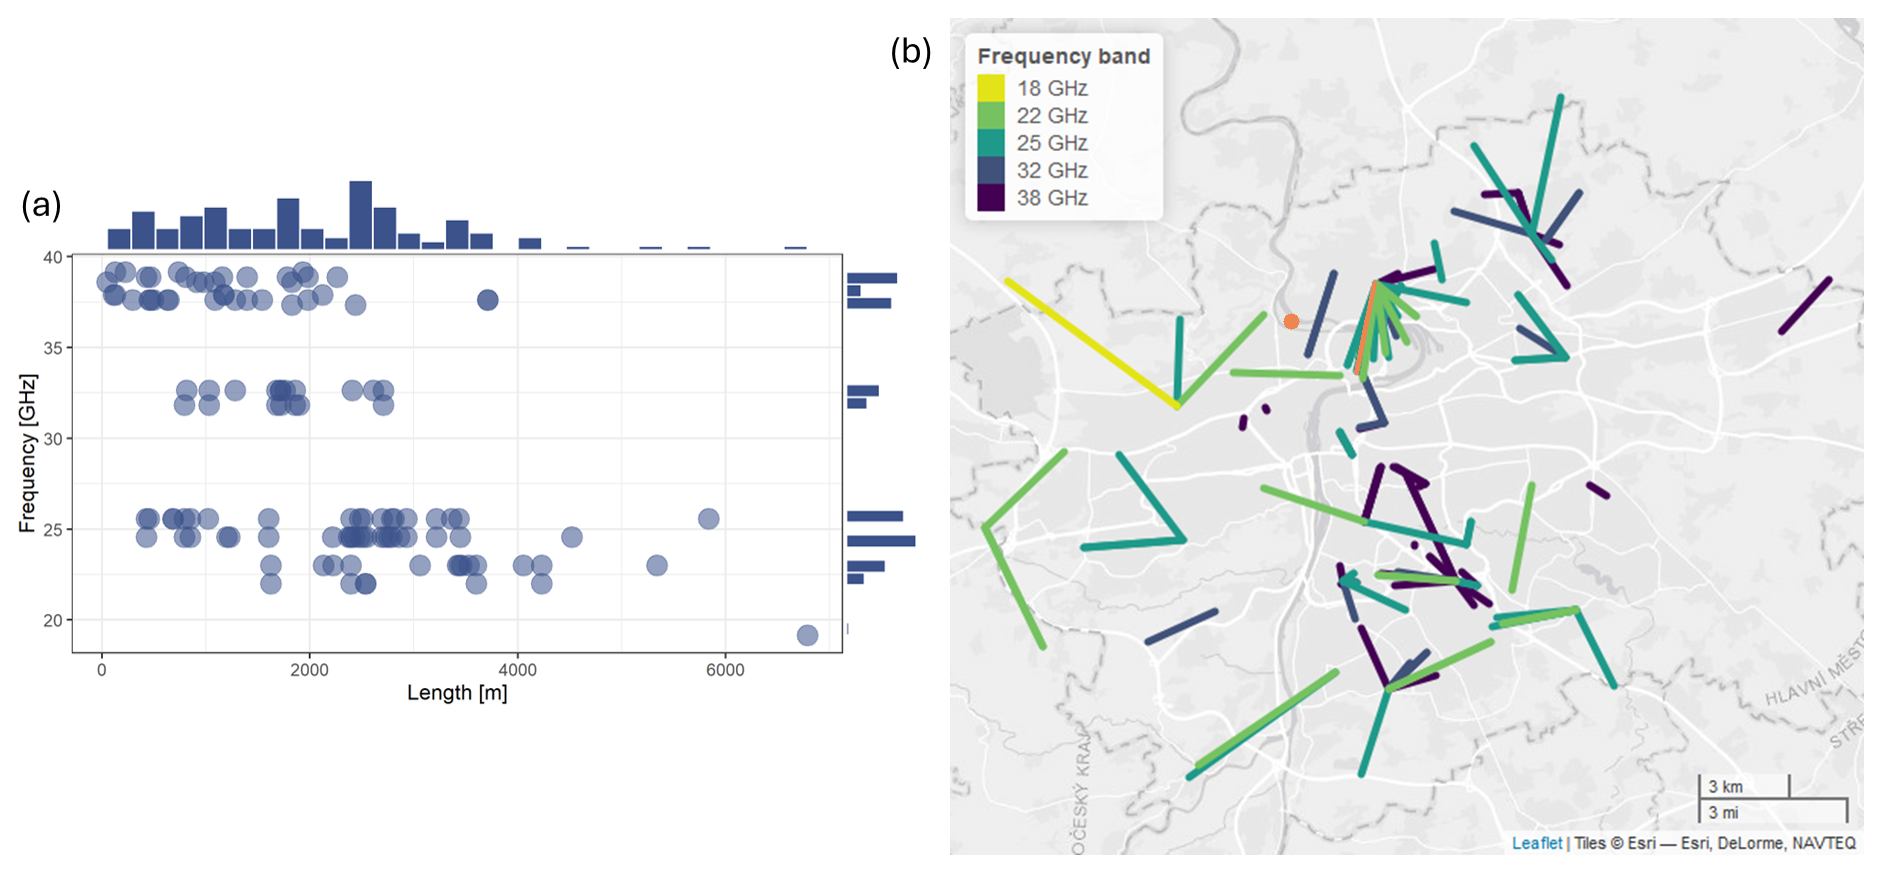
Figure 1(a) Scatterplot of CML length and frequency. (b) Map of the distribution of CMLs over the Prague area. The orange link is used for the wet-dry classification analysis. The orange point indicates the location of the rain gauge. © OpenStreetMap contributors 2024. Distributed under a Creative Commons BY-SA licence.
4.2 Predictor data
Predictor data (other than the first lines in Tables 1 and 2) consist of various sources, either derived from CML data, collected from other sensors, or are synthetic as seasonality or of a synoptic type.
4.2.1 CML data
The CML data comes from the telecommunication network of T-Mobile Czech Republic a.s., which used Ericsson MINILINK devices. The majority of CMLs consist of two sublinks separated by approximately 1 GHz. Each of the two sublinks within one CML in this study is considered as an independent sensor and will, hereafter, be called a CML.
The data of the transmitted and received power levels are collected by custom-made data acquisition software and sampled every 10 s.
CMLs with a stationary baseline level are the only ones considered. Stability is checked by visual inspection and only those CMLs with no visual artifacts, e.g., sudden changes in total loss caused by hardware malfunction, are accepted. This results in 117 CMLs available for the analysis. The frequency of the CMLs is between 19.16 and 39.16 GHz. Length of the CMLs range from 48 to 6791 m (Fig. 1). Quantization of transmitted power is 1 dB and received power is dB.
Each CML operates at a different power level across the network. To ensure comparability, the transmitted and received power levels are subtracted and aggregated to a 1 min resolution. For the transformation of attenuation to rainfall intensity, the baseline (representing a 10 d moving average) needs to be subtracted to eliminate dry weather attenuation. Then the WAA can be considered by using the approach of Pastorek et al. (2022) that explicitly derives WAA from rainfall intensity estimated from observed attenuation. Specific attenuation, the total loss divided by link length, can be transformed to rainfall intensity using the k−R relation (Olsen et al., 1978) with empirical parameters (ITU-R, 2005).
4.2.2 Further data derived from CML observation
To evaluate the amount of information preserved, the raw and processed data are used as predictors.
The total loss and its values from 1 and 2 min prior to and after the timestep of interest i , a standard deviation of the signal within a 30 min and 15 min centred moving window are tested. The gradient expressed, with respect to the timestep before or after the timestep of interest and the relative magnitude of total loss within a 209 min window are considered (the window with the largest information value is estimated by the approach presented in Thiesen et al., 2019).
4.2.3 Rain gauge data
In Prague's permanent municipal rain gauge network (maintained and operated by Pražské vodovody a kanalizace, a.s.), there are 23 tipping bucket rain gauges. The sampling area is 500 cm2 and the resolution is 0.1 mm (MR3, METEOSERVIS v.o.s.). To relate the CML and rain gauge time series, the distance between the centre point of the CML and all rain gauge stations is determined, and the data from the closest rain gauge are used as a predictor. The calibrated tip records are transformed to a rainfall intensity time series with a 15 min resolution for the rainfall estimation analysis or 1 min for the wet-dry classification analysis.
4.2.4 Other available datasets
Other easily available environmental data are utilised in the analyses. The first set of data includes temperature-related quantities: the current temperature and its deviation from a 14 d moving average that can indicate a temperature drop associated with rainfall events. Temperature data are collected from five municipal stations in Prague with the closest station to the CML being used in the data tuples.
Additionally, seasonality is represented by both month and week of the year.
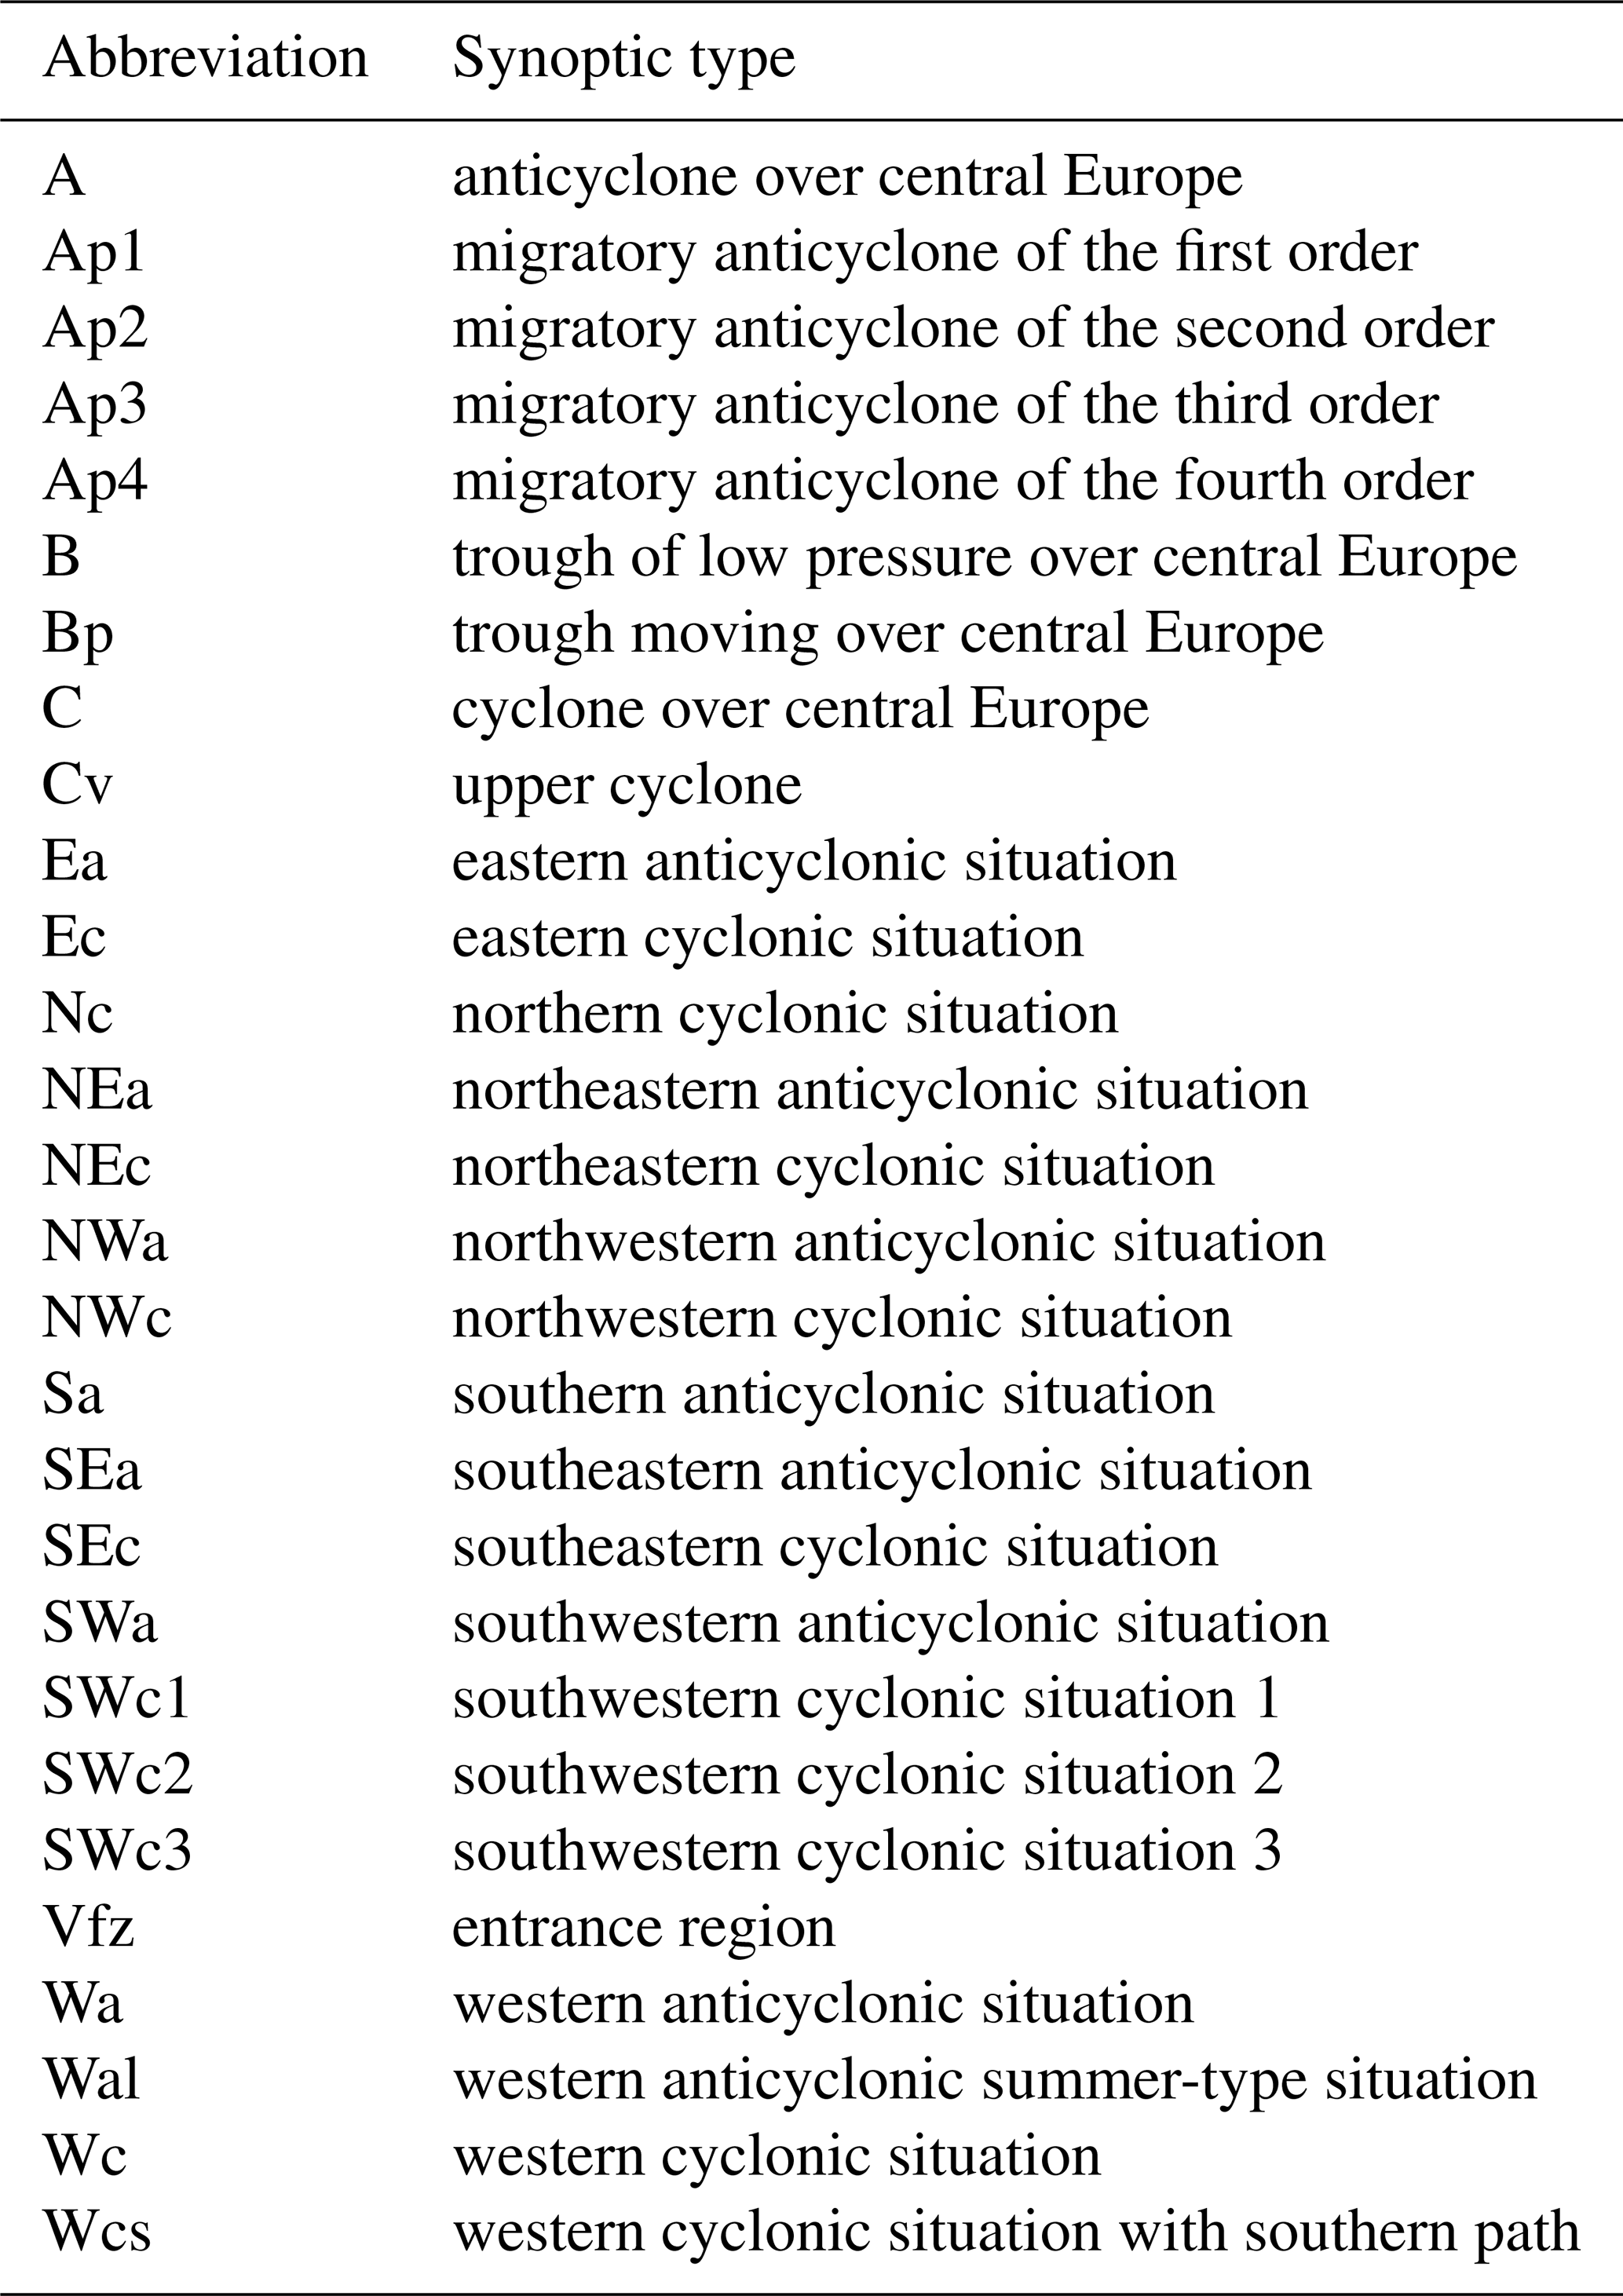
Lastly, the daily data of synoptic type is determined based on the expertise of the Czech Hydrometeorological Institute (CHMI, 2024). The synoptic types are listed in Appendix B.
In the following section, we investigate the opportunistic rainfall observations from the CMLs and environmental observations for rainfall estimation models. First, we analyse the predictors towards the reference rainfall intensity observed by independently adjusted weather radar. Second, we analyse the predictors for the classification of wet-dry timesteps in the CML signal attenuation time series. Finally, we show a comparison of the wet-dry classification approach to the established models used in CML data processing.
5.1 Rainfall estimation
The value of predictors for rainfall intensity estimation is quantified by conditional entropy. The evaluation of selected variables and their combinations is presented in Fig. 2.
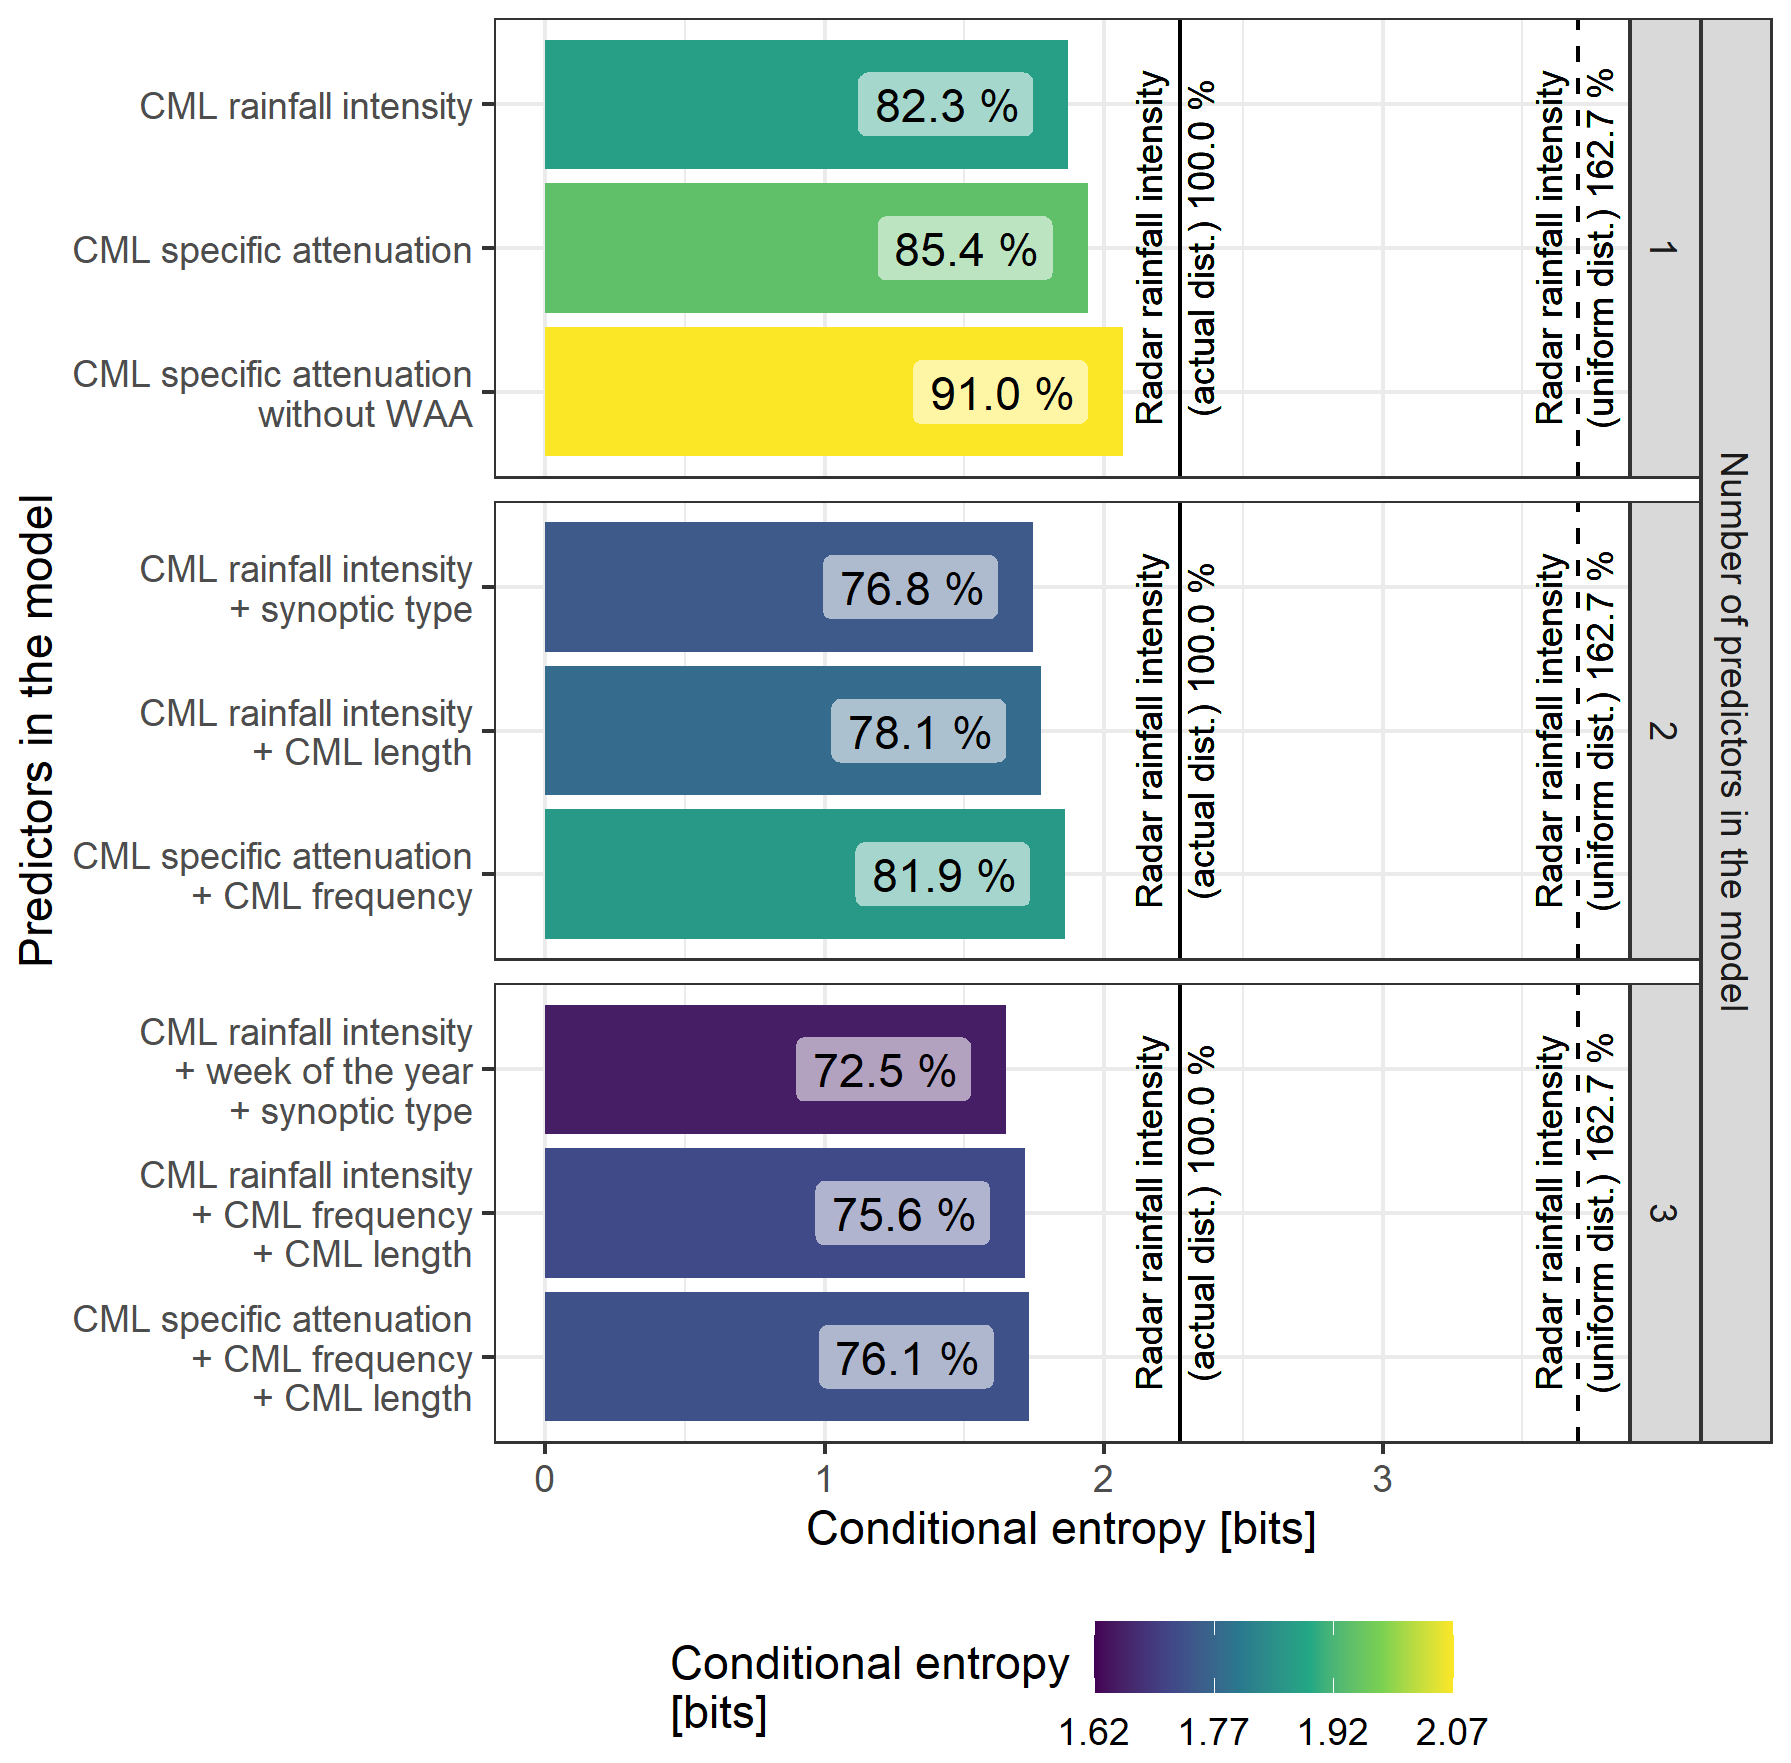
Figure 2Conditional entropy of models built from a full dataset using one to three predictors. Relative entropy is indicated in percentage with respect to the entropy of the target. The entropy of the target is indicated by the solid line. The entropy of the uniform distribution is the dashed line.
The solid vertical line in Fig. 2 puts the other results in perspective, with respect to the entropy of the reference distribution that is caused by the variability of the rainfall intensity of the reference. The uncertainty of the target is thus expressed as the entropy of the reference distribution. The upper boundary of uncertainty (the dashed line in Fig. 2) is expressed as the entropy of the uniform probability distribution with the bin range as its target.
Incorporating predictors reduces uncertainty in the target variable (see the bars in Fig. 2, note that only selected results, which show relevant predictor combinations and address at least one predictor related to the CMLs, are shown), which allows a comparative evaluation of the influence of the predictors via conditional entropy.
Specific attenuation as a predictor gains less information when estimating the target compared to CML rainfall intensity alone. The 3 % difference represents the effect of the data transformation from specific attenuation to rainfall intensity using parameters that reflect the frequency and polarization of CMLs. The combination of specific attenuation and CML frequency (double-predictor model) approximates CML rainfall intensity well (single-predictor model), confirming that frequency-related effects in the data are present. Specific attenuation without WAA leads to a 6 % increase in uncertainty which indicates that the largest space for method development lies in the WAA estimation.
The 4 % decrease in relative conditional entropy for the combination of CML rainfall intensity and CML length, compared to stand-alone CML rainfall intensity, suggests that the effects of CML length should be further incorporated into rainfall retrieval models.
The combination of CML frequency and length, along with CML rainfall intensity, yields results that are 1.5 % better than the combination of CML frequency, length and CML specific attenuation.
The environmental predictors, seasonality and synoptic type, are valuable for further uncertainty reduction. Uncertainty decreases by 10 % when combined with CML rainfall intensity and by 5 % when combined with the synoptic type only. Synoptic weather types and seasons are linked to the occurrence of stratiform and convective rainfall events. Stratiform rainfalls typically arise in large-scale, low-pressure atmospheric conditions, while convective precipitation is associated with strong vertical motions in unstable atmospheric conditions. The synoptic conditions influence the microphysical processes in clouds, which, in turn, affect the DSD of raindrops characteristic of each rainfall type. The variability in DSD linked to synoptic types significantly impacts the accuracy and precision of CML rainfall estimates as the k−R relation differs with rainfall type and DSD (Schleiss et al., 2023). Hence, incorporating synoptic type classification enhances the rainfall estimates derived from CMLs by the adaptive k−R relation. The potential to improve and leverage CML data processing methods with those easily obtainable variables is within reach.
The robustness of the models is evaluated by the quantification of cross entropy for different sample sizes. Figure 3 shows how cross entropy decreases with increasing sample size. The more predictors, the greater the sample size needs to converge to the cross entropy of a full dataset. The model saturates at certain data samples (lines in Fig. 3 become close to horizontal). This is defined by a 5 % criterion for the ratio of the model-based component of uncertainty and the data-based component of uncertainty (Thiesen et al., 2019).
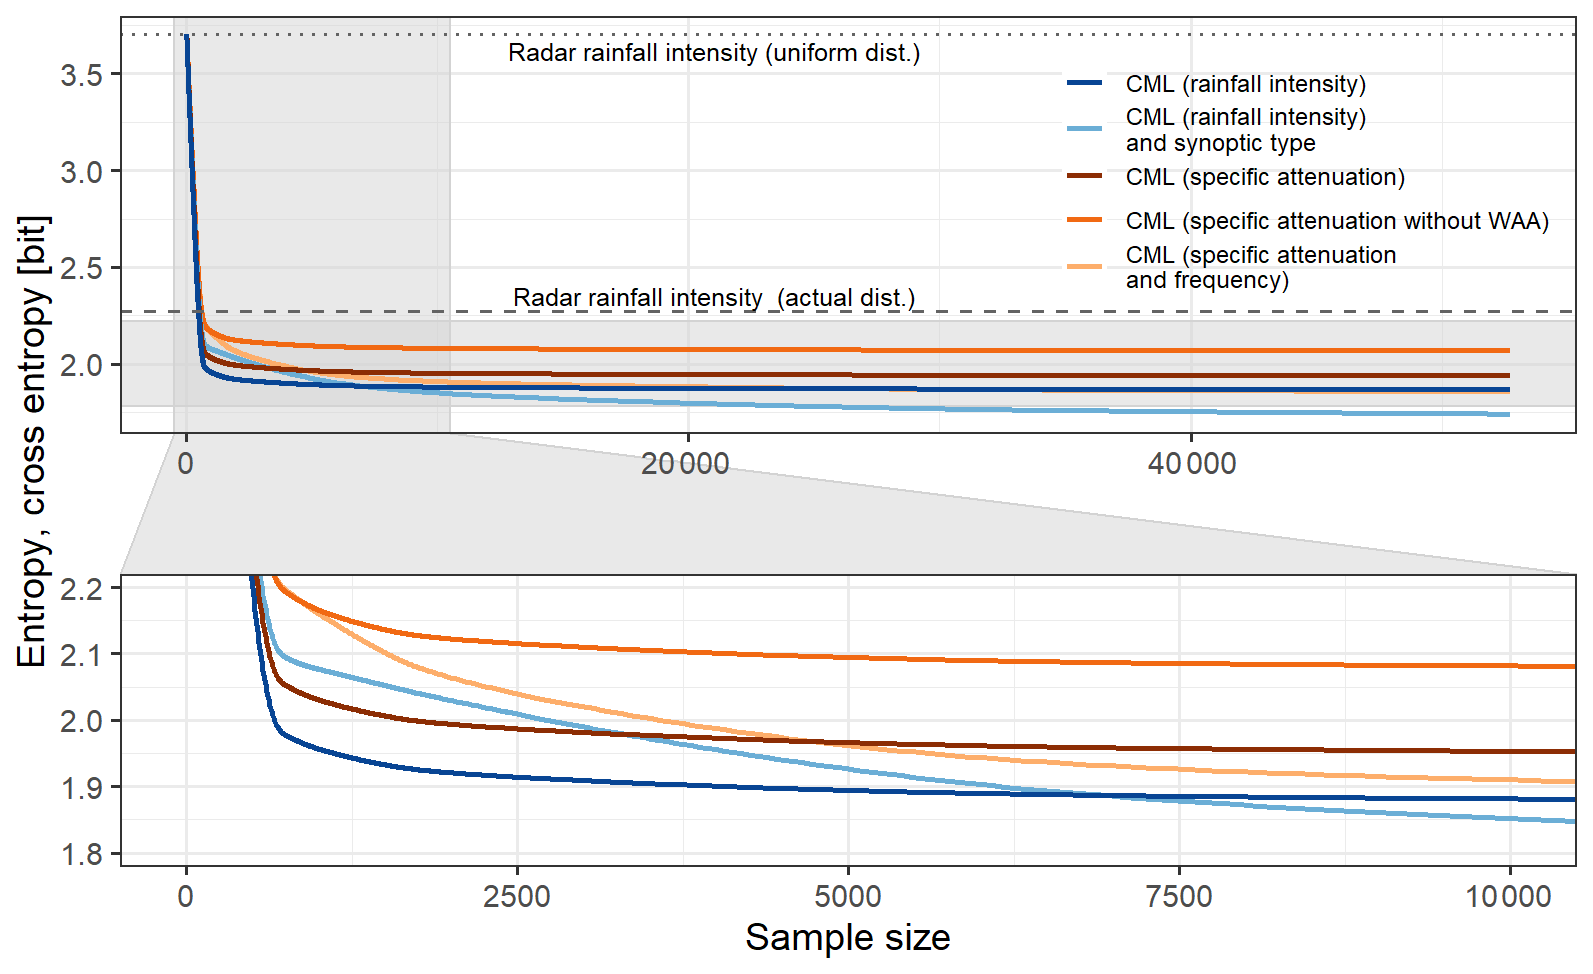
Figure 3Effect of the sample size on the model expressed by cross entropy. Entropy of the target is indicated by a dashed line. Entropy of the uniform distribution is a dotted line. Cross entropies of the models are as a function of sample size.
The small sample size model contains an extremely low amount of information and, thus, reaches the uncertainty of a uniform target distribution (dotted horizontal line in Fig. 3). With increasing sample size, the models quickly reach the internal uncertainty of the target (dashed line in Fig. 3) that is caused by the variability of rainfall intensity of the reference. By further increasing the sample size model, the curves almost become horizontal lines, meeting the 5 % criterion. A larger dataset is not actually needed to sufficiently describe the relations between the variables in the model.
Both models, one constructed from specific attenuation with CML frequency as predictors and the other from CML rainfall intensity as a predictor, exhibit similar performance for the full dataset (also measured as conditional entropy in Fig. 2) but differ in their saturation related to the sample size (cross entropy in Fig. 3). The model of specific attenuation with CML frequency as predictors saturates at a sample size of 4816 and the model of CML rainfall intensity saturates at a sample size of 904.
The incorporation of the WAA in the preprocessing of specific attenuation affects the overall level of cross entropy, but both saturate at the same sample size (a sample size of 894 for specific attenuation and 903 for specific attenuation without WAA).
The CML rainfall intensity and synoptic type model achieves better uncertainty reduction for the full dataset with improved results starting to occur at around one-fifth the size of the dataset as saturation is reached at a sample size of 10 952.
5.2 Wet-dry classification
This study introduces an approach for wet-dry classification in signal attenuation observation based on the evaluation of information measures (conditional entropy) in the information theory approach.
As in the preceding section, the predictors are evaluated with the objective of estimating their effectiveness for wet-dry classification.
Figure 4 shows the conditional entropy of the models with one, two, and three predictors. The entropy of the target (solid line in Fig. 4) provides a scale for the results of conditional entropy.
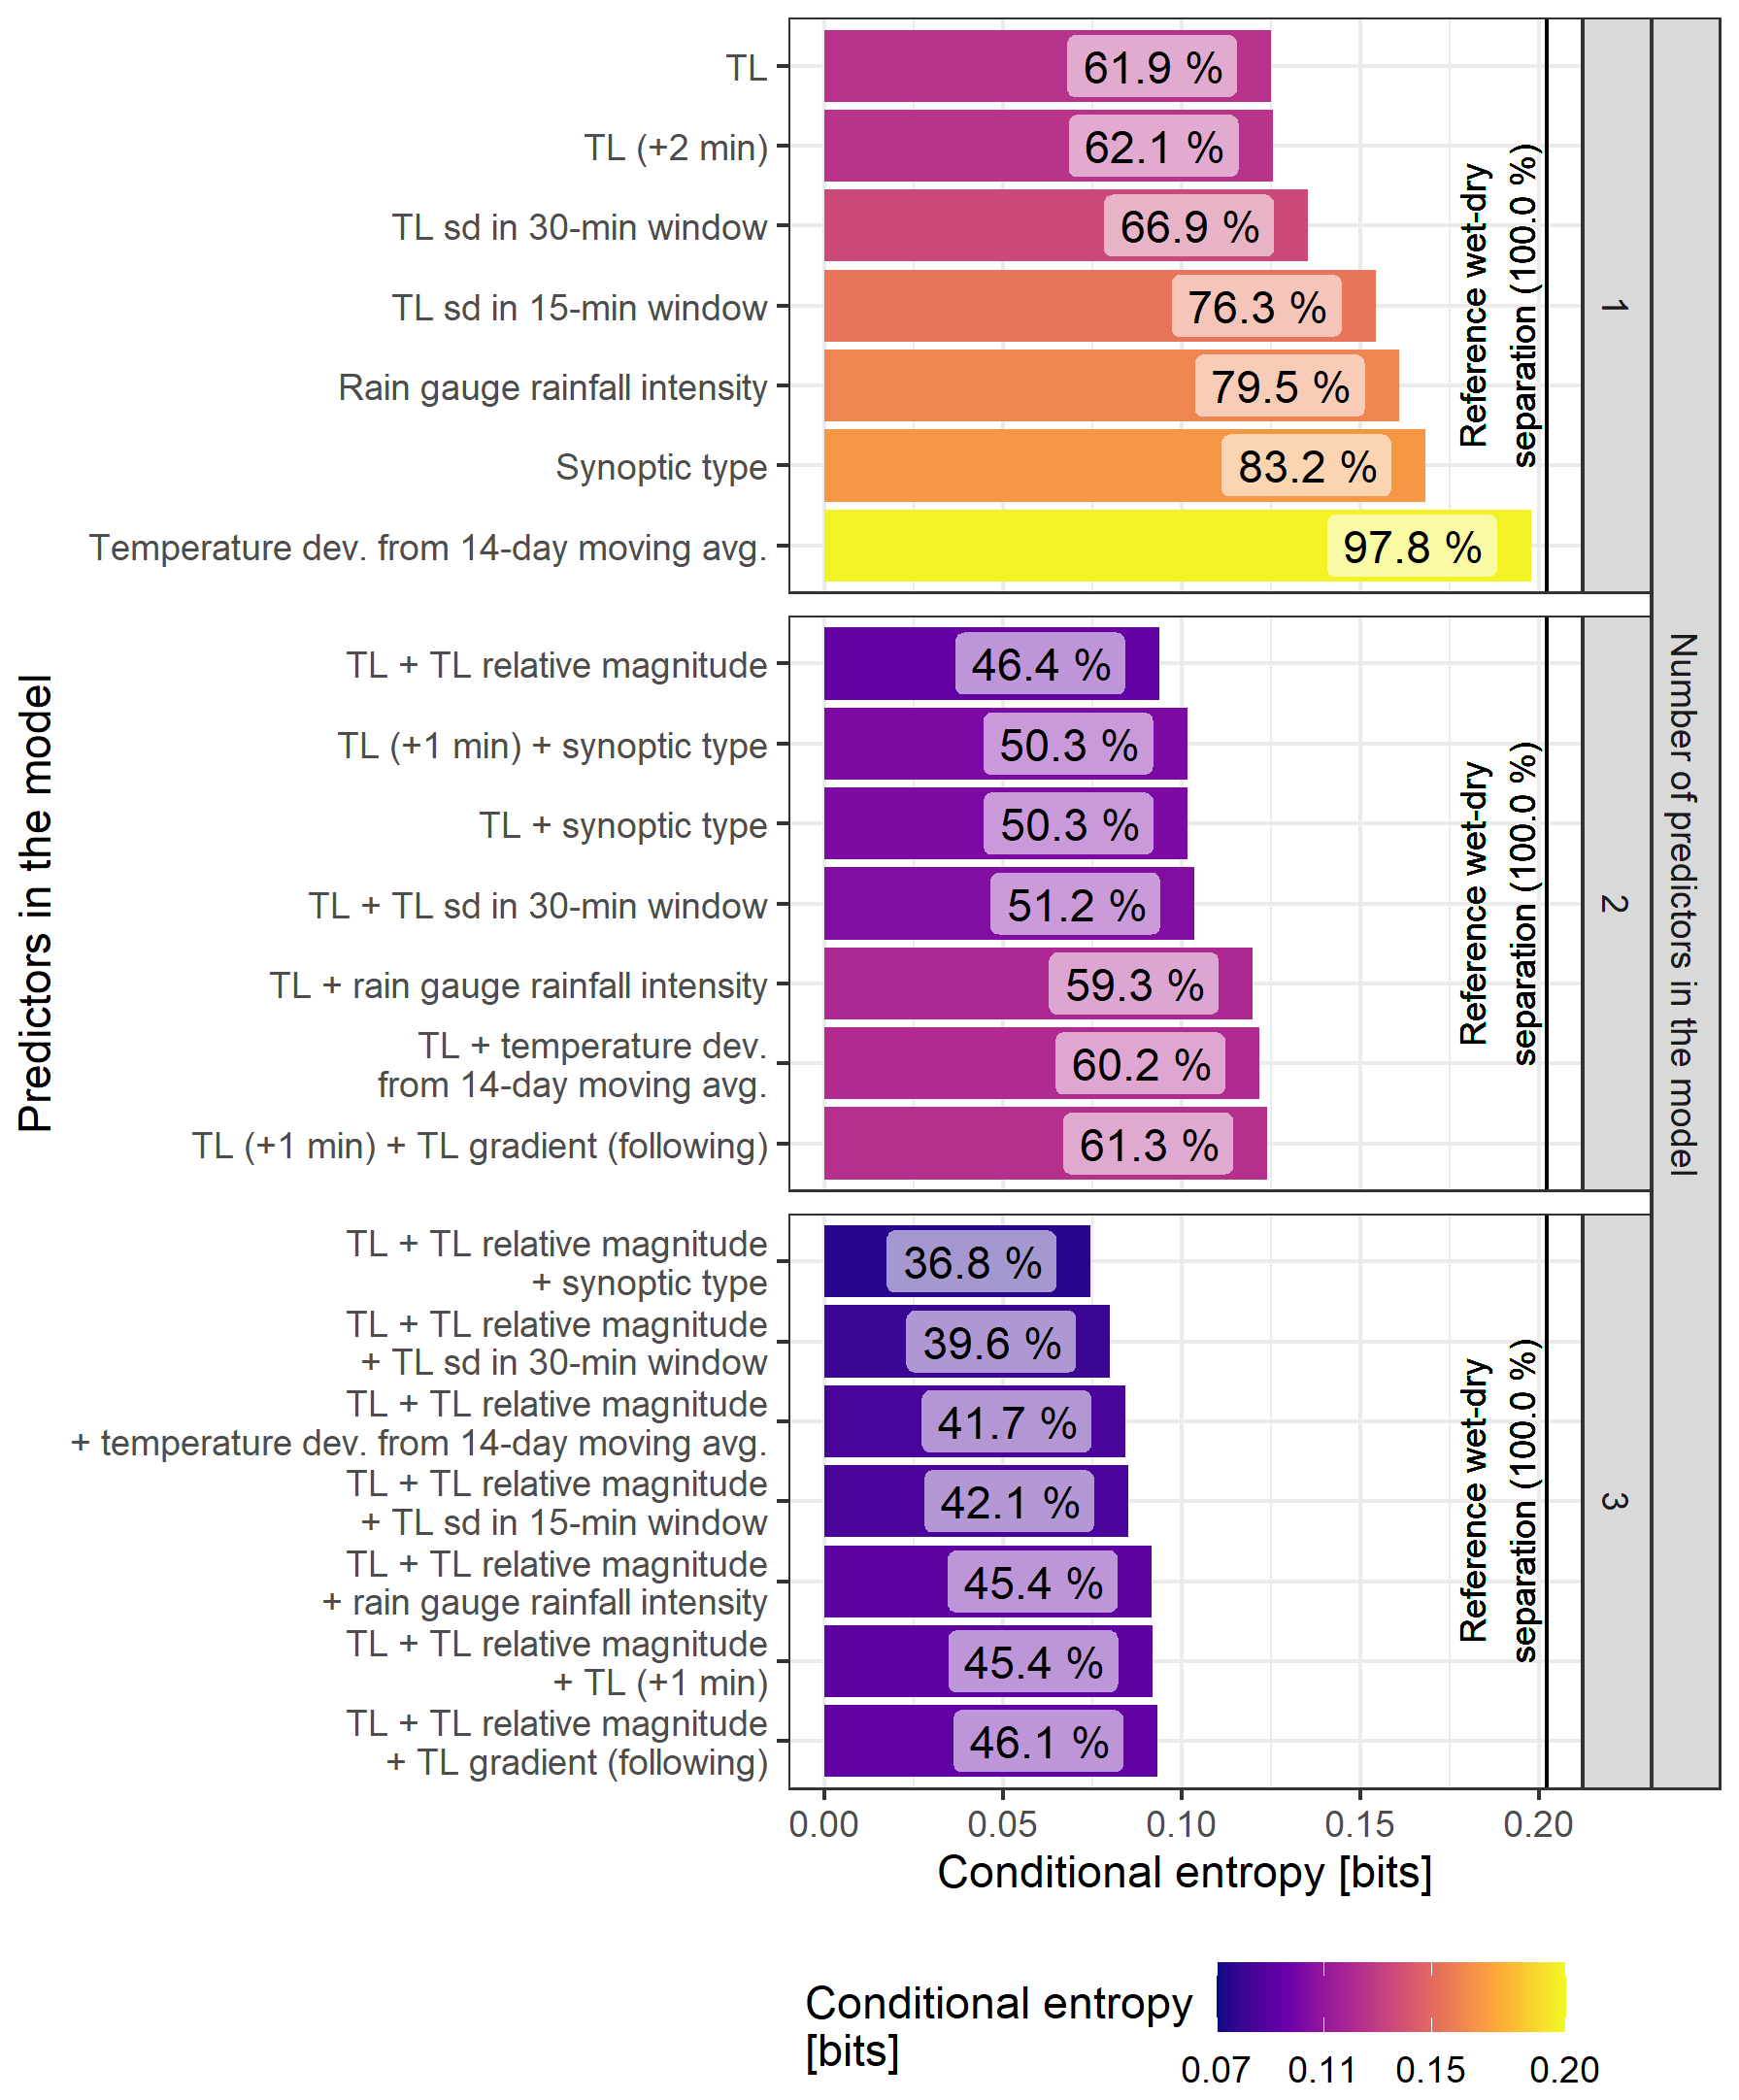
Figure 4Conditional entropy of models built using one to three predictors. The relative entropy is indicated in percent with respect to the entropy of the target. The entropy of the target is indicated by a solid line.
Most informative predictors come from sensor data as TL observations (from the timestep of the event and from the surrounding timesteps ±2 min) perform best with an approximately 38 % reduction of uncertainty. There is a significant difference (9.4 %) in the uncertainty reduction for the standard deviation (sd) of a 30 min moving window and a 15 min moving window. The environmental predictor, a rain gauge approximately 3 km from the CML, reduces uncertainty by only 20.5 %. Information about synoptic type reduces uncertainty by 16.8 %. Finally, temperature deviation from the 14 d moving average is not as informative with almost no uncertainty being reduced. The temperature drop when a rainfall event arrives is unlikely to be strong enough or occurs only in a limited period in the peak of summer. Even less information is found in the local gradient of TL and in TL relative magnitude (not shown in Fig. 4).
The TL, in combination with the relative magnitude of TL, is the most informative of the two-predictor models as it decreases uncertainty to 46.4 %. Both the TL and TL (+1 min) with synoptic type reaches almost 50 %. Combining the TL with the TL sd in the 30 min window decreases uncertainty by more than 10 % compared to the TL model only (and by almost 16 % compared to the model using only the TL sd in a 30 min window). The rain gauge data from the relatively distant rain gauge does not significantly improve the results of the TL model. Similarly, the temperature data and the TL gradient are not significantly informative.
The three predictor models are all based on a combination of the TL and the relative magnitude of the TL. The most informative combination includes the synoptic type which reaches 36.8 % of relative conditional entropy. The combination with TL sd in a 30 min window (39.6 %) is about three percent worse in comparison. Temperature deviation ranks third best with 41.7 %. At this point rainfall intensity from the rain gauge does not enhance the results (a 1 % reduction compared to the two-predictor model). Other variables retrieved from the TL time series (TL (+1 min) and TL gradient) do not cause any significant improvement.
The best performing models with one (TL), two (TL and TL relative magnitude) and three (TL and TL relative magnitude and synoptic type) predictors are applied to the time series and the results are compared below with other wet-dry classification approaches.
The model probability distribution is first converted to binary form as described in Sect. 3.3.1. The ROC is calculated and plotted in Fig. 5. The best performance, distance to the perfect model (false positive =0 and true positive =1), is 0.13 for the three-predictor model with the largest sample size used for training. Generally, a small ratio of false positive events and a high ratio of true positive events have been found.
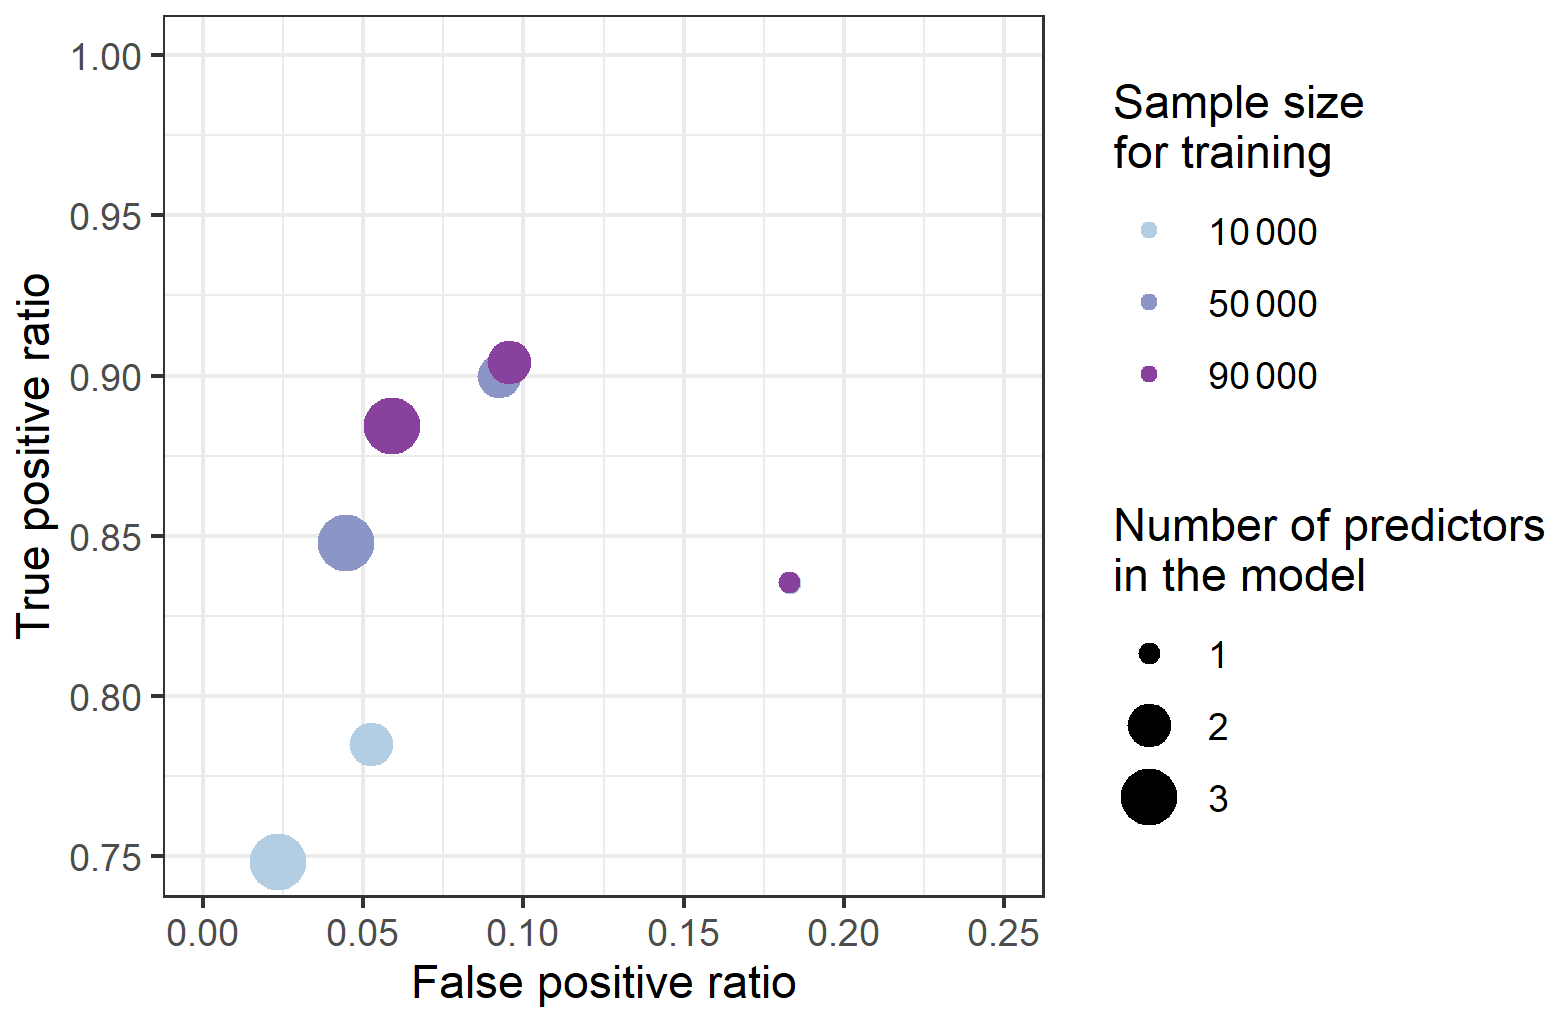
Figure 5Receiver operating characteristics of the best one-, two- and three-predictor models trained with different sizes of the dataset. The scales of the axes are adjusted to zoom on the top-left area of the ROC plot.
Figure 5 shows that the more predictors there are, the better the results. Also, the more data available for training, the better the results. The trend shows that the more data used, the greater the improvements in the true positive ratio compared to the false positive ratio, especially for the three-predictor model. For the one-predictor model, the results for the distance to the ideal model are quite similar (around 0.246). The one-predictor model does not require much data to learn the relations, however, their results cannot be improved by increasing the amount of data. On the other hand, the three-predictor model fails when an insufficient amount of data is available and is outperformed by the two-predictor models.
The results are then compared to other wet-dry classification approaches (Fig. 6). The baseline separation approaches for wet-dry identification recognise true wet timesteps very well (with RTP higher than 94 %). However, they suffer from a high ratio of falsely identified wet timesteps (mostly 48 %–50 %). Any random increase of the fluctuation of a signal is identified as a rainfall event. The poor performance and low predictive quality are also indicated by an MCC up to 0.16.
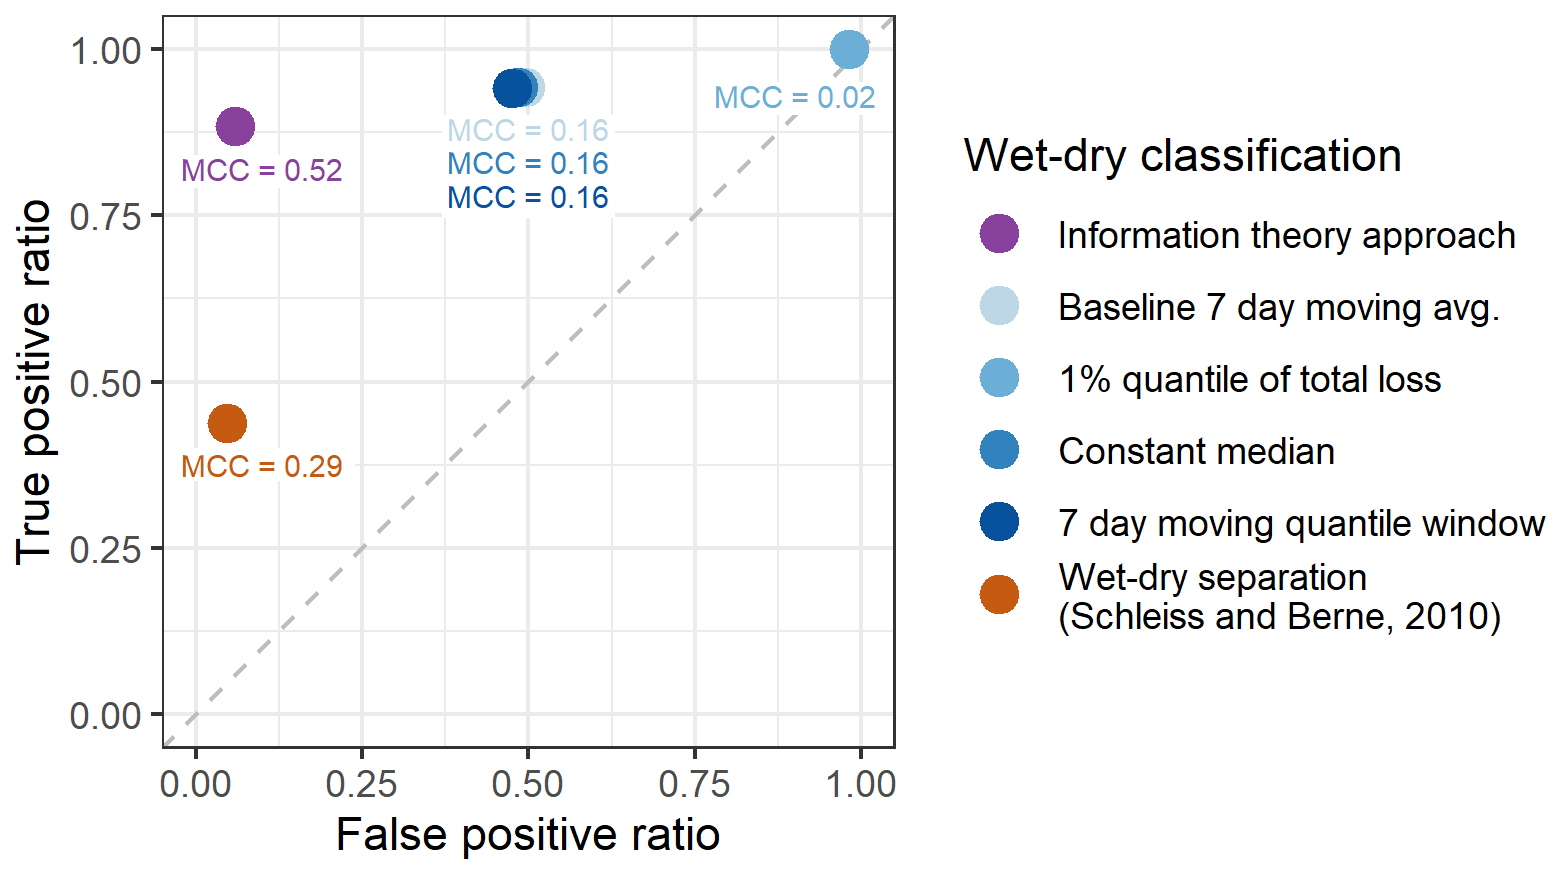
Figure 6Receiver operating characteristics of the alternative wet-dry classification approaches and the Matthews correlation coefficient.
On the other hand, the approach of Schleiss and Berne (2010) tends to have a low RFP (5 %) while RTP is only 44 %. Longer windows for standard deviation calculations improve results. Their approach is less sensitive to smaller rainfall events, however, it works well when identifying stronger events. This can be explained by the origin of their approach, which was developed using weather radar data as a reference with a spatial resolution 1 km × 1 km and a temporal resolution of 5 min. The approach is thus influenced by (and reproduces) the bias and inaccuracies related to weather radar observation techniques (see Sect. 5.3.2 Accuracy of reference rainfall in Discussion). In contrast, the information theory approach has a similar RFP (6 %), but reaches a higher RTP (89 %). Based on the MCC values for the compared approaches, the information theory approach (MCC =0.52) and the benchmark approach of Schleiss and Berne (2010) (MCC =0.29) show moderate classification performance. This indicates a fair balance between correct positive and negative predictions.
5.3 Discussion
5.3.1 Interpretation of the method results
By adopting the information theory approach, we exploit a long dataset of opportunistic observations and relax assumptions about system relations. These assumptions, traditionally formulated in data processing as empirical relations, can be reframed using information theory which focuses solely on the data-derived relations. Information theory provides a means of identifying unknown relations within a given dataset. Furthermore, it is capable of evaluating both quantitative and qualitative data in contrast to correlation or RMSE. The method, however, requires the specification of the range within which the variables occur as it is unable to extrapolate beyond the known (or estimated) range. As the position and order of the data within the time series are lost, the information theory approach considers each timestep as independent. This can be partially compensated by using the variable shifted in time, e.g., total loss used as the predictor in the second analysis in this study.
The approach does not allow the interpretation of isolated data outside the context of the dataset. Although conditional entropy does not provide a measure of certainty about the target variable, it does estimate the relative reduction of uncertainty that comes with knowledge of other variables. The shared units of bits ensure the comparison of results across all variables. The evaluation of dependence between the predictors is beyond the scope of this analysis.
We are aware of climate-specific constraints. The target reference rainfall distribution has been applied in central-European climatic conditions. Walraven et al. (2022) show that the relation of attenuation and rainfall needs to be adjusted for other climatic regions. This study, however, affords the opportunity to evaluate variables and characteristics that may affect the CML rainfall estimation process.
The incorporation of CML length showed an additional reduction of 4 % of uncertainty. This indicates that CML length plays a more significant role than current methods allow for. Berne and Uijlenhoet (2007) demonstrated that CML length has no influence on power-law exponents. Therefore, CML length effects arise elsewhere (e.g., WAA, which is more pronounced for shorter CMLs). It is worth noting that the work of Berne and Uijlenhoet (2007) is based on stochastic simulator data, whereas our study uses adjusted radar reference.
5.3.2 Accuracy of reference rainfall
The accuracy of the rainfall estimates is significantly affected by the observation technique employed. In the context of CML rainfall retrieval, a common practice is to compare the results with reference weather radar gauge-adjusted rainfall intensities while utilising path-averages derived from intersected pixels. The benefits of weather radar observation, namely high spatial availability and relatively good spatial resolution, are weighted against the indirect nature of high-altitude and volume-based observation. Furthermore, the influence of wind and the 5 min sampling intervals present additional challenges in the comparison of these data to the close-to-ground CML observations which are sampled in timesteps of a few seconds. In particular, there is a lack of discussion in the CML studies regarding the extent to which they reproduce the errors and bias of the weather radar. Even though the application of rain-gauge adjustment increases accuracy and reduces the bias of the radar observations compared to the raw measurements, inaccuracies and biases to the truth remain. The longer the time aggregation, the greater the tendency to smooth out short-term fluctuations in rainfall intensity, thereby reducing discrepancies (Schleiss et al., 2020). In our study, the 15 min aggregates are used to maintain the size of the dataset while reducing errors. An additional study on the cross-validation of radar adjustment showed that RMSE decreased from 3.5 to 2 mm h−1 and the correlation increased from 0.6 to 0.8 for a 15 min aggregation compared to a 5 min aggregation. However, for rainfall intensities higher than 10 mm h−1, adjusted radar underestimated rain rates by 40 % at a 15 min resolution. Obtaining an accurate measurement of such a highly space-time variable process as rainfall remains challenging.
5.3.3 Binning
For models including rainfall intensity, we propose a minimal bin width of 0.5 mm h−1 which was then increasingly extended as uncertainty increased with higher intensities. The wider bins, for more intense rainfalls, preserve the information relating to the distribution. If the bins are too narrow, the high rainfall intensities will be fragmented leading to loss of information (Pendergrass and Hartmann, 2014). More specifically, for high rainfall intensities, which are relatively rare, the higher number of dimensions of the model can significantly defragment the occupancy of the bins. The binning was selected to capture the variability of rainfall data and skewness of its distribution while maintaining a reasonable sample size within the bins. The selection of bin size and the characteristics of entropy, in contrast to e.g., variance, is more influenced by outcomes with higher probability, instead of outliers, which results in assigning a larger model impact for moderate and lower rainfall intensities.
5.3.4 Data set variables
This study incorporated readily available variables capable of exerting an influence on CML rainfall retrieval or wet-dry classification, such as temperature, seasonality and synoptic type. Despite the demonstrated benefit of environmental predictors, it is important to acknowledge that the rainfall retrieval models based exclusively on CML data are not dependent on data with longer latency such as the synoptic type. The presented approach concurs with pioneering studies in the field of CML aiming to challenge the dominant approach of data processing by introducing environmental variables. Van het Schip et al. (2017) employed satellite products (precipitation and cloud properties) for the classification of wet and dry conditions in the Netherlands. However, cloud properties were available only during daylight hours. Pastorek et al. (2019) employed runoff observations with the objective of enhancing the estimation of WAA in a specific context of a small, separate stormwater drainage system.
Analyses were performed within the framework of information theory, an approach that has vast applicability in the field of geosciences in the context of complex environmental systems which aim to synthesise data and models. Information theory quantifies information and uncertainty within any structure of data content rather than relying on descriptive relations. Information theory enables the effective handling of extensive datasets and the evaluation of data relations through generalised models with minimal prior (and possibly not optimal) assumptions.
For the first time, information theory has been used on time series from opportunistic rainfall sensors, particularly CMLs. These are sensors requiring extensive data processing to achieve minimal bias likely caused by environmental variables which have not yet been incorporated in data processing algorithms. The information theory measures suggest that CML data processing models can be improved by incorporating environmental variables, from which synoptic types performed well, as the combination of CML rainfall intensity and synoptic type decreased uncertainty by 5 % compared to CML rainfall intensity only. Further, adding the seasonality decreases uncertainty by an additional 5 %. Incorporation of such environmental variables is thus encouraged.
Accordingly, the sensor variables from CMLs are evaluated for their usefulness and significance to determine the target variable, which is rainfall intensity in the first analysis and wet-dry classification in the second analysis. The results confirm the importance of separating wet antenna attenuation which reduced uncertainty by 6 % and reveal that CML length should be further incorporated into the rainfall retrieval models.
The second analysis demonstrates a different type of information-theory application, focusing on wet-dry classification. It is based on a single link and, while not intended as a comprehensive analysis, it provides an illustrative example of the potential of the non-parametric model based on information theory compared with established wet-dry classification and baseline separation approaches. Further studies involving multiple CMLs are necessary to confirm the general applicability of the classification approach to confirm the general applicability of the classification approach across different devices and environmental settings, as well as to enable a more robust comparison with other dry-wet classification methods. The presented results encourage the use of the synoptic type as a useful predictor for both rainfall estimation and wet-dry classification. The model application outperforms the well-established wet-dry classification approach in true positives while maintaining a low level of false positives. The comparative study confirmed the predictive potential of the evaluated variables.
Interpreting results from an information theory approach requires recognising the limitations of the measures covered in the discussion. The presented results provide evidence that the concepts of information theory are valuable tools for discovering relationships between variables and for evaluating their relevance in the context of opportunistic sensors.
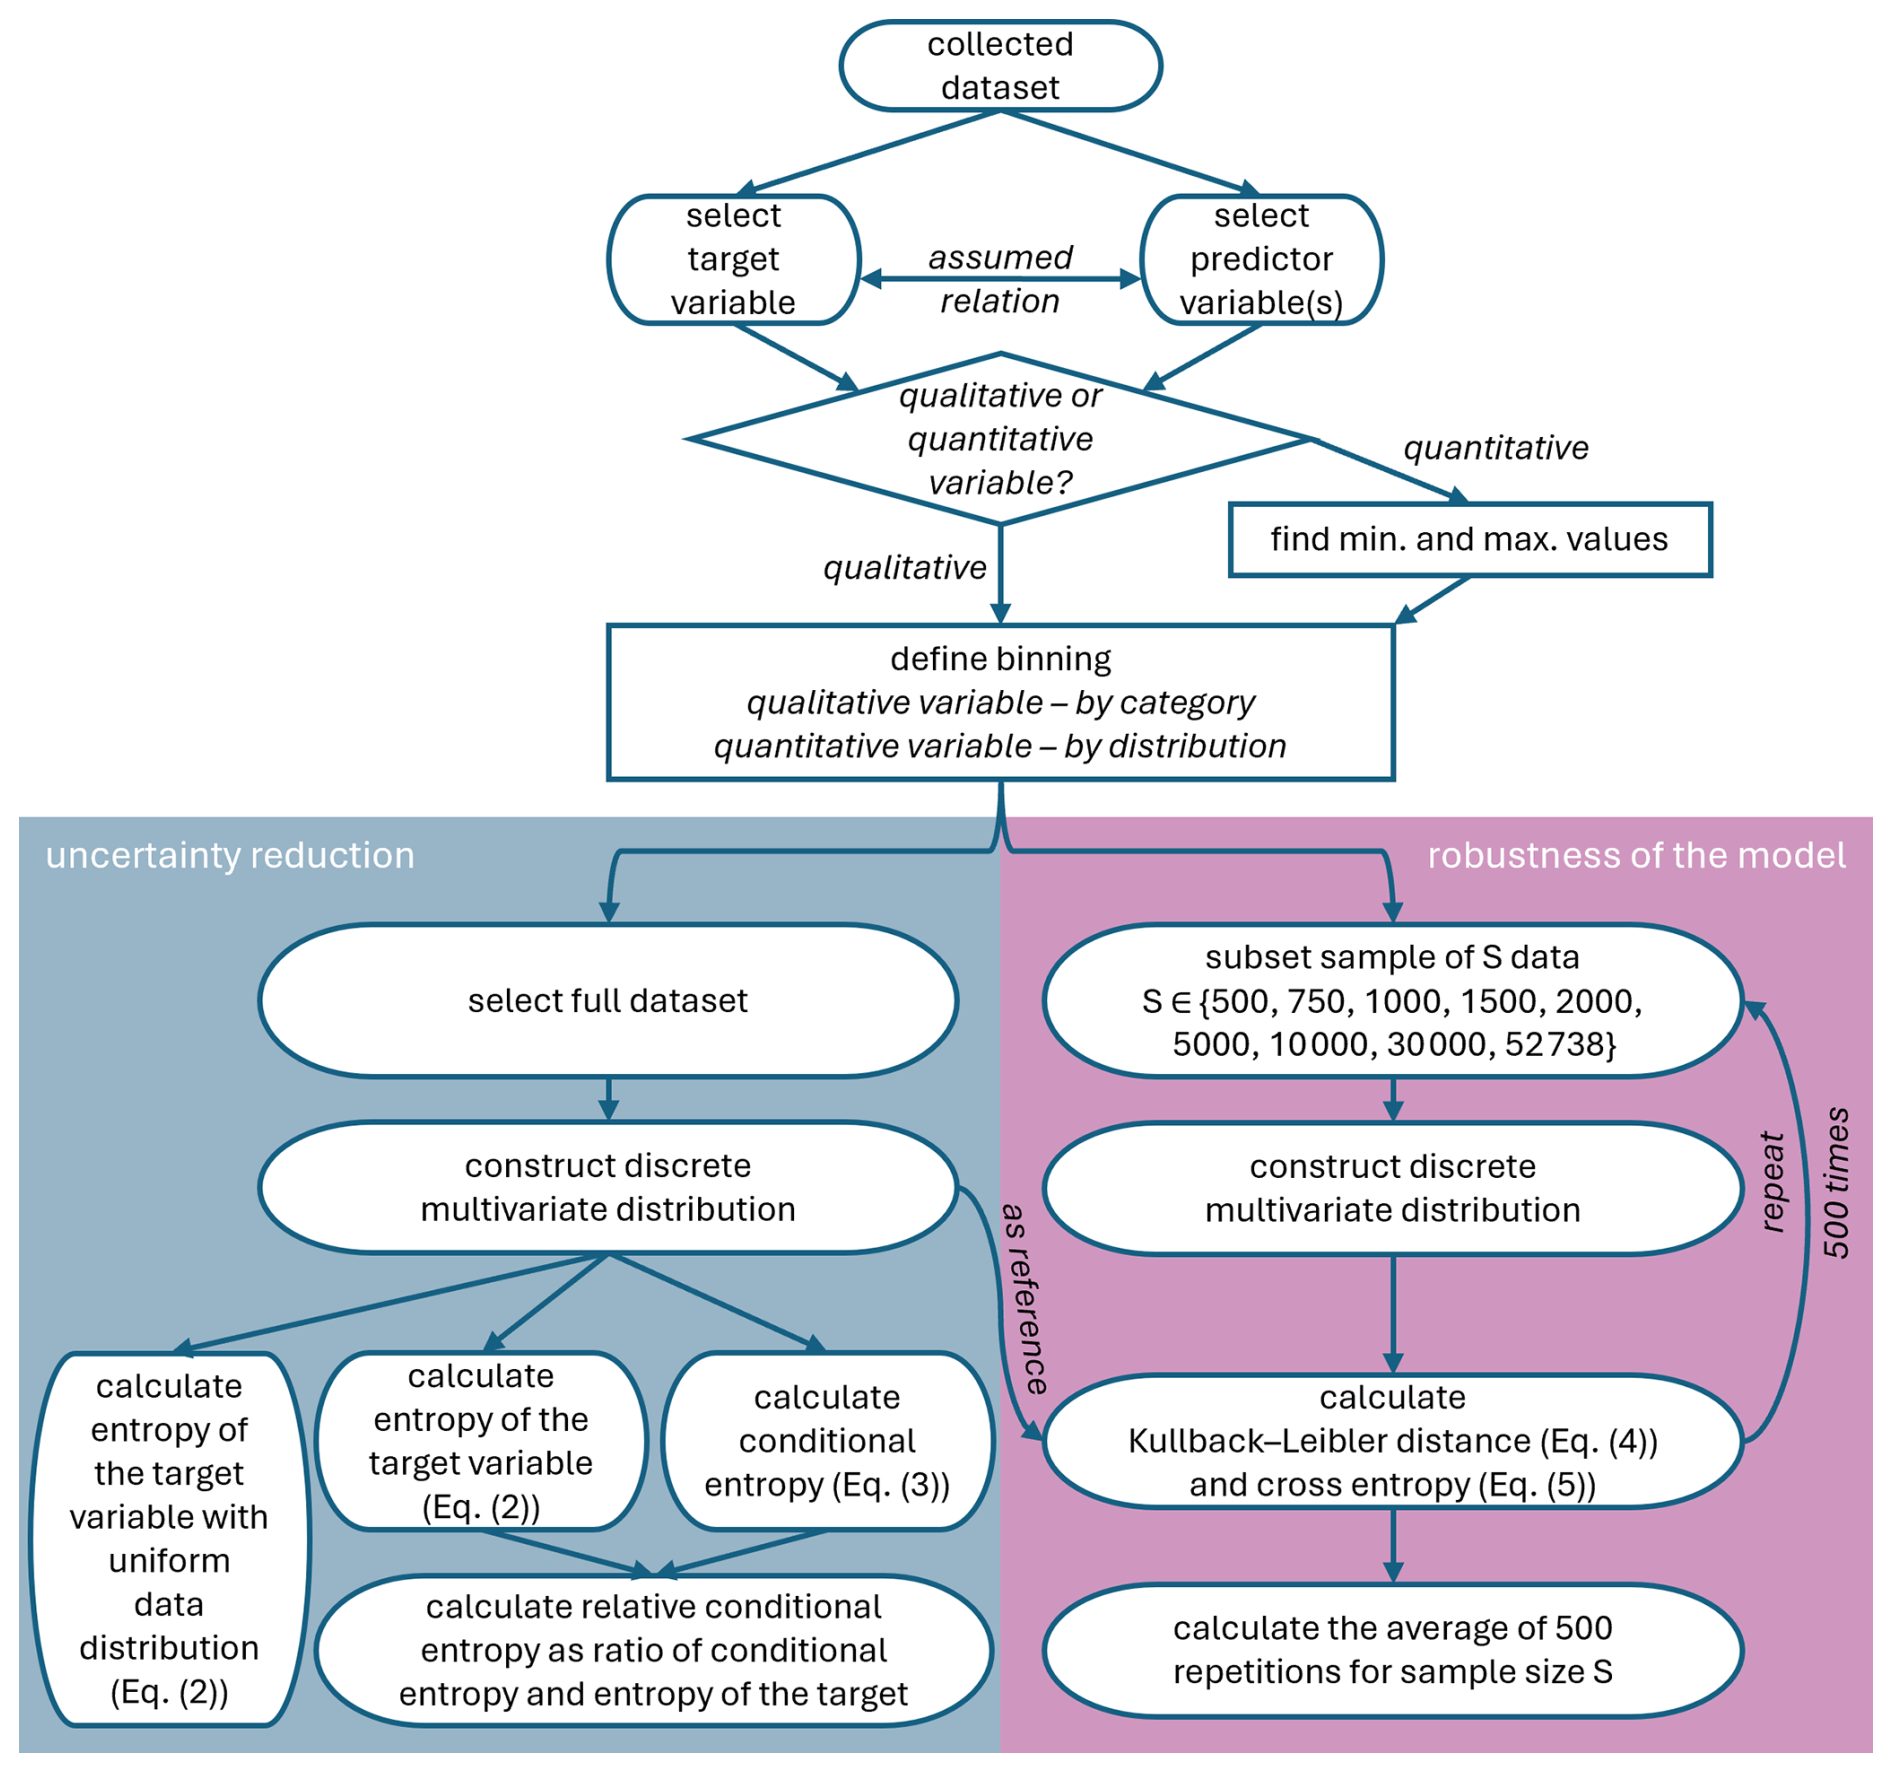
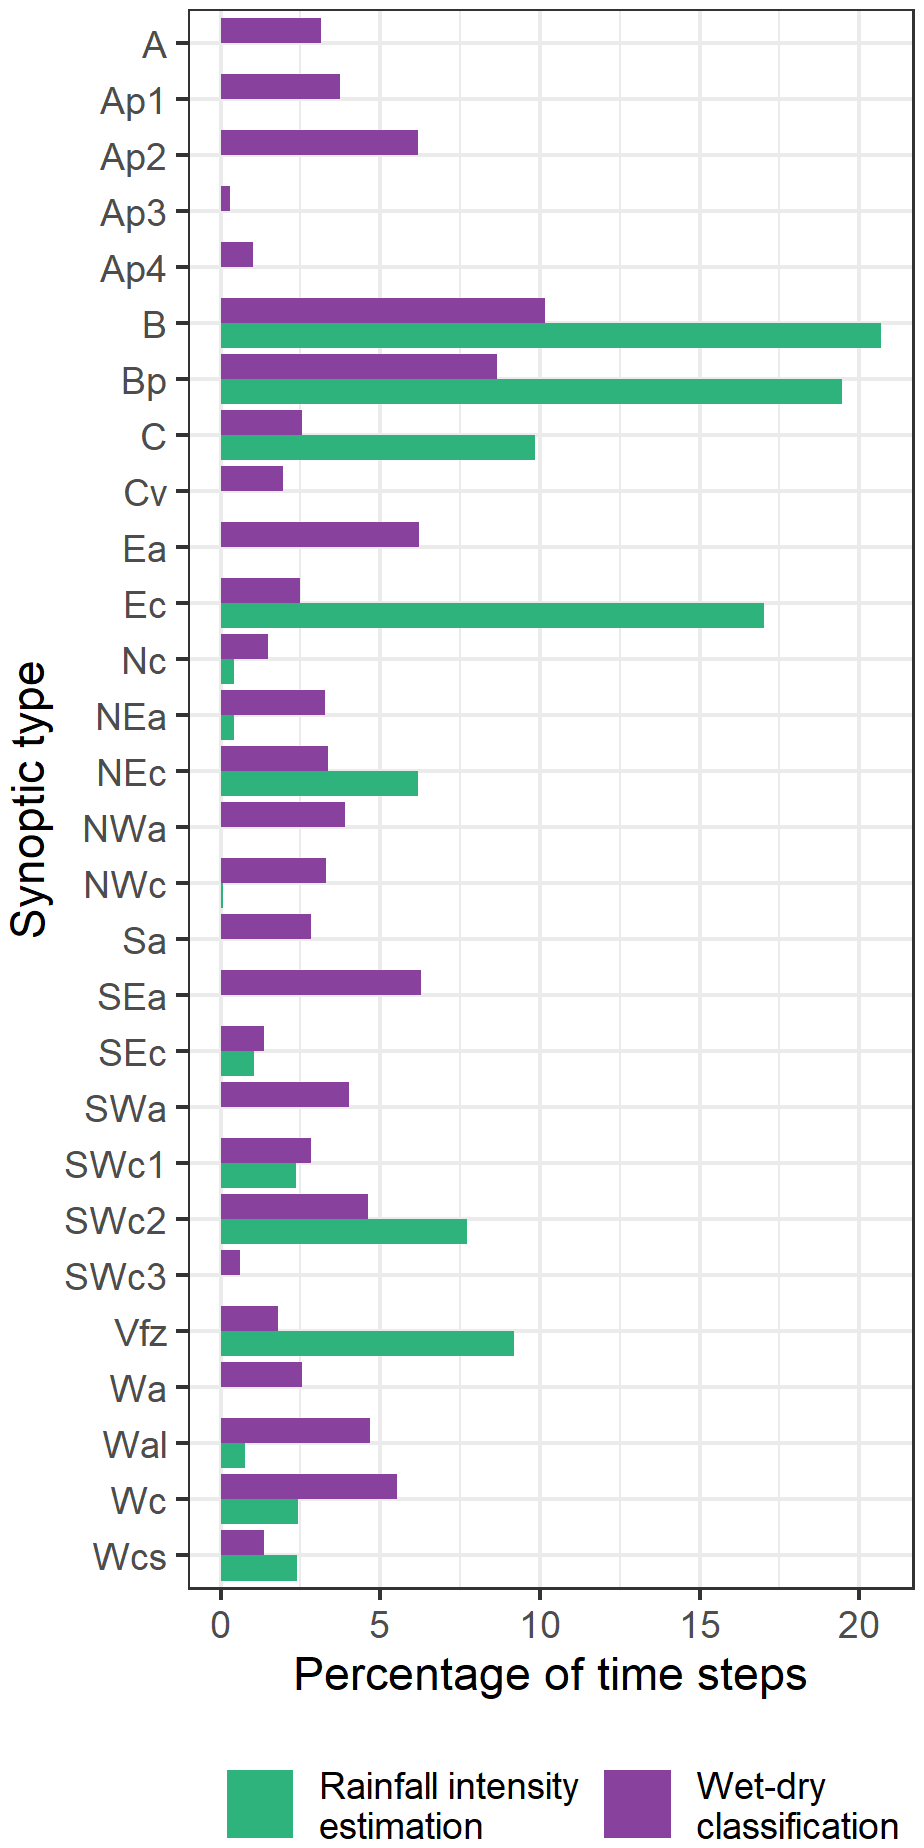
Figure B1Distribution of the synoptic types in the wet-dry classification analysis and rainfall intensity estimation analysis.
Synoptic type data can be downloaded from https://www.chmi.cz/historicka-data/pocasi/typizace-povetrnostnich-situaci (last access: 13 February 2024). Other data are available from the corresponding author upon request.
AŠ conducted the analysis and drafted the manuscript. MF and VB offered critical revisions, recommended additional analyses, and suggested modifications. All authors participated in addressing the comments of the reviewers.
The contact author has declared that none of the authors has any competing interests.
Publisher’s note: Copernicus Publications remains neutral with regard to jurisdictional claims made in the text, published maps, institutional affiliations, or any other geographical representation in this paper. While Copernicus Publications makes every effort to include appropriate place names, the final responsibility lies with the authors. Views expressed in the text are those of the authors and do not necessarily reflect the views of the publisher.
The authors greatly acknowledge financial support from the Czech Science Foundation (GACR) projects MERGOSAT 24-13677L. We thank all the persons who helped with the data acquisition. We would like to thank T-Mobile Czech Republic a.s. for providing us with the CML data. Special thanks are extended to Pražská vodohospodářská společnost a.s. for providing rainfall data from their rain gauge network and Pražské vodovody a kanalizace, a.s. for rain gauges maintenance.
This research has been supported by the Grantová Agentura České Republiky (grant no. MERGOSAT 24-13677L).
This paper was edited by Gianfranco Vulpiani and reviewed by two anonymous referees.
Berne, A. and Uijlenhoet, R.: Path-averaged rainfall estimation using microwave links: Uncertainty due to spatial rainfall variability, Geophys. Res. Lett., 34, L07403,https://doi.org/10.1029/2007GL029409, 2007. a, b
Cazzaniga, G., De Michele, C., D'Amico, M., Deidda, C., Ghezzi, A., and Nebuloni, R.: Hydrological response of a peri-urban catchment exploiting conventional and unconventional rainfall observations: the case study of Lambro Catchment, Hydrol. Earth Syst. Sci., 26, 2093–2111, https://doi.org/10.5194/hess-26-2093-2022, 2022. a
CHMI: Typizace povětrnostních situací pro území České republiky: https://www.chmi.cz/historicka-data/pocasi/typizace-povetrnostnich-situaci, last access: 13 February 2024. a
Chwala, C. and Kunstmann, H.: Commercial microwave link networks for rainfall observation: Assessment of the current status and future challenges, WIREs Water, 6, e1337, https://doi.org/10.1002/wat2.1337, 2019. a
Chwala, C., Keis, F., and Kunstmann, H.: Real-time data acquisition of commercial microwave link networks for hydrometeorological applications, Atmos. Meas. Tech., 9, 991–999, https://doi.org/10.5194/amt-9-991-2016, 2016. a
Cover, T. M. and Thomas, J. A.: Elements of Information Theory, 2nd ed., John Wiley & Sons, New Jersey, USA, 784 pp., ISBN: 978-0-471-24195-9, 2006. a, b, c, d, e, f
Darscheid, P., Guthke, A., and Ehret, U.: A maximum entropy method to estimate discrete distributions from samples ensuring nonzero probabilities, Entropy, 20, 601, https://doi.org/10.5445/IR/1000085954, 2018. a, b
David, N., Alpert, P., and Messer, H.: Technical Note: Novel method for water vapour monitoring using wireless communication networks measurements, Atmos. Chem. Phys., 9, 2413–2418, https://doi.org/10.5194/acp-9-2413-2009, 2009. a
Djibo, M., Chwala, C., Graf, M., Polz, J., Kunstmann, H., and Zougmoré, F.: High-Resolution Rainfall Maps from Commercial Microwave Links for a Data-Scarce Region in West Africa, J. Hydrometeor., 24, 1847–1861, https://doi.org/10.1175/JHM-D-23-0015.1, 2023. a
Fencl, M., Dohnal, M., Rieckermann, J., and Bareš, V.: Gauge-adjusted rainfall estimates from commercial microwave links, Hydrol. Earth Syst. Sci., 21, 617–634, https://doi.org/10.5194/hess-21-617-2017, 2017. a
Fencl, M., Dohnal, M., Valtr, P., Grabner, M., and Bareš, V.: Atmospheric observations with E-band microwave links – challenges and opportunities, Atmos. Meas. Tech., 13, 6559–6578, https://doi.org/10.5194/amt-13-6559-2020, 2020. a
Foroozand, H. and Weijs, S. V.: Objective functions for information-theoretical monitoring network design: what is “optimal”?, Hydrol. Earth Syst. Sci., 25, 831–850, https://doi.org/10.5194/hess-25-831-2021, 2021. a
Gong, W., Gupta, H. V., Yang, D., Sricharan, K., and Hero III, A. O.: Estimating epistemic and aleatory uncertainties during hydrologic modeling: An information theoretic approach, Water Resour. Res., 49, 2253–2273, https://doi.org/10.1002/wrcr.20161, 2013. a
Graf, M., Chwala, C., Polz, J., and Kunstmann, H.: Rainfall estimation from a German-wide commercial microwave link network: optimized processing and validation for 1 year of data, Hydrol. Earth Syst. Sci., 24, 2931–2950, https://doi.org/10.5194/hess-24-2931-2020, 2020. a, b, c, d
Graf, M., Chwala, C., Wenzel, M., Vogel, C., Kunstmann, H., and Winterrath, T.: The new real-time radar-gauge-CML adjustment system pyRADMAN at DWD, EGU General Assembly 2024, Vienna, Austria, 14–19 Apr 2024, EGU24-12890, https://doi.org/10.5194/egusphere-egu24-12890, 2024. a
Heistermann, M., Jacobi, S., and Pfaff, T.: Technical Note: An open source library for processing weather radar data (wradlib), Hydrol. Earth Syst. Sci., 17, 863–871, https://doi.org/10.5194/hess-17-863-2013, 2013. a
Imhoff, R. O., Overeem, A., Brauer, C. C., Leijnse, H., Weerts, A. H., and Uijlenhoet, R.: Rainfall nowcasting using commercial microwave links, Geophys. Res. Lett., 47, e2020GL089365, https://doi.org/10.1029/2020GL089365, 2020. a
ITU-R: Radio-frequency channel arrangements for fixed service systems (Recommendation F.746-5), ITU-R, Geneva, Switzerland, https://www.itu.int/rec/R-REC-F.746-5-200105-S/en (last access: 10 October 2024), 2001. a
ITU-R: Specific attenuation model for rain for use in prediction methods (Recommendation P.838-3), ITU-R, Geneva, Switzerland, https://www.itu.int/rec/R-REC-P.838-3-200503-I/en (last access: 12 May 2022), 2005. a, b
ITU-R: Handbook – Radiowave propagation information for designing terrestrial point-to-point links, ITU, Geneva, Switzerland, http://handle.itu.int/11.1002/pub/80301443-en, 2009. a
Kullback, S. and Leibler, R. A.: On information and sufficiency, Ann. Math. Stat., 22, 79–86, 1951. a
Leijnse, H., Uijlenhoet, R., and Stricker, J.: Microwave link rainfall estimation: Effects of link length and frequency, temporal sampling, power resolution, and wet antenna attenuation, Advances in Water Resources, 31, 1481–1493, https://doi.org/10.1016/j.advwatres.2008.03.004, 2008. a
Leijnse, H., Uijlenhoet, R., and Berne, A.: Errors and Uncertainties in Microwave Link Rainfall Estimation Explored Using Drop Size Measurements and High-Resolution Radar Data, Journal of Hydrometeorology, 11, 1330–1344, https://doi.org/10.1175/2010JHM1243.1, 2010. a
Liu, D., Wang, D., Wang, Y., Wu, J., Singh, V. P., Zeng, X., Wang, L., Chen, Y., Chen, X., Zhang, L., and Gu, S.: Entropy of hydrological systems under small samples: uncertainty and variability, J. Hydrol., 532, 163–176, https://doi.org/10.1016/j.jhydrol.2015.11.019, 2016. a
Loritz, R., Gupta, H., Jackisch, C., Westhoff, M., Kleidon, A., Ehret, U., and Zehe, E.: On the dynamic nature of hydrological similarity, Hydrol. Earth Syst. Sci., 22, 3663–3684, https://doi.org/10.5194/hess-22-3663-2018, 2018. a
Messer H., Zinevich A., and Alpert P.: Environmental monitoring by wireless communication networks, Science, 312, 713–713, https://doi.org/10.1126/science.1120034, 2006. a
Mishra, A. K., Özger, M., and Singh, V. P.: An entropy-based investigation into the variability of precipitation, J. Hydrol., 370, 139–154, https://doi.org/10.1016/j.jhydrol.2009.03.006, 2009. a
Neuper, M. and Ehret, U.: Quantitative precipitation estimation with weather radar using a data- and information-based approach, Hydrol. Earth Syst. Sci., 23, 3711–3733, https://doi.org/10.5194/hess-23-3711-2019, 2019. a, b
Olsen, R., Rogers, D., and Hodge, D.: The aRb relation in the calculation of rain attenuation, IEEE T. Anten. Propag., 26, 318–329, https://doi.org/10.1109/TAP.1978.1141845, 1978. a
Ostrometzky, J. and Messer, H.: Dynamic determination of the baseline level in microwave links for rain monitoring from minimum attenuation values, IEEE J. Sel. Top. Appl., 11, 24–33, https://doi.org/10.1109/JSTARS.2017.2752902, 2018. a
Overeem, A., Leijnse, H., and Uijlenhoet, R.: Measuring urban rainfall using microwave links from commercial cellular communication networks, Water Resources Research, 47, https://doi.org/10.1029/2010WR010350, 2011. a
Overeem, A., Leijnse, H., and Uijlenhoet, R.: Country-wide rainfall maps from cellular communication networks, Proc. Natl. Acad. Sci., 110, 2741–2745, https://doi.org/10.1073/pnas.1217961110, 2013. a
Overeem, A., Leijnse, H., and Uijlenhoet, R.: Retrieval algorithm for rainfall mapping from microwave links in a cellular communication network, Atmos. Meas. Tech., 9, 2425–2444, https://doi.org/10.5194/amt-9-2425-2016, 2016. a
Pastorek, J., Fencl, M., and Bareš, V.: Calibrating microwave link rainfall retrieval model using runoff observations, EGU General Assembly 2019, 7-12 April 2019, Geophysical Research Abstracts, 21, EGU2019-10072, https://meetingorganizer.copernicus.org/EGU2019/EGU2019-10072.pdf (last access: 1 December 2024), 2019. a
Pastorek, J., Fencl, M., Rieckermann, J., and Bareš, V.: Precipitation estimates from commercial microwave links: Practical approaches to wet-antenna correction, IEEE Transactions on Geoscience and Remote Sensing, 60, 1–9, https://doi.org/10.1109/TGRS.2021.3110004, 2022. a, b
Pastorek, J., Fencl, M., and Bareš, V.: Uncertainties in discharge predictions based on microwave link rainfall estimates in a small urban catchment, J. Hydrol., 617, 129051, https://doi.org/10.1016/j.jhydrol.2022.129051, 2023. a
Pendergrass, A. G. and Hartmann, D. L.: Two modes of change of the distribution of rain, J. Climate, 27, 8357–8371, https://doi.org/10.1175/JCLI-D-14-00182.1, 2014. a
Polz, J., Chwala, C., Graf, M., and Kunstmann, H.: Rain event detection in commercial microwave link attenuation data using convolutional neural networks, Atmos. Meas. Tech., 13, 3835–3853, https://doi.org/10.5194/amt-13-3835-2020, 2020. a
Rios Gaona, M. F., Overeem, A., Brasjen, A. M., Meirink, J. F., Leijnse, H., and Uijlenhoet, R.: Evaluation of rainfall products derived from satellites and microwave links for the Netherlands, IEEE T. Geosci. Remote, 55, 12, 6849–6859, https://doi.org/10.1109/TGRS.2017.2735439, 2017. a
Saltelli, A., Ratto, M., Andres, T., Campolongo, F., Cariboni, J., Gatelli, D., Saisana, M., and Tarantola, S.: Global Sensitivity Analysis: The Primer, John Wiley and Sons, Hoboken, New Jersey, 292 pp., https://doi.org/10.1002/9780470725184, 2008. a
Schleiss, M. and Berne A.: Identification of Dry and Rainy Periods Using Telecommunication Microwave Links, IEEE Geoscience and Remote Sensing Letters, 7, 611–615, https://doi.org/10.1109/LGRS.2010.2043052, 2010. a, b, c, d
Schleiss, M., Rieckermann, J., and Berne, A.: Quantification and modeling of wet-antenna attenuation for commercial microwave links, in IEEE Geoscience and Remote Sensing Letters, 10, 5, 1195–1199, https://doi.org/10.1109/LGRS.2012.2236074, 2013. a
Schleiss, M., Olsson, J., Berg, P., Niemi, T., Kokkonen, T., Thorndahl, S., Nielsen, R., Ellerbæk Nielsen, J., Bozhinova, D., and Pulkkinen, S.: The accuracy of weather radar in heavy rain: a comparative study for Denmark, the Netherlands, Finland and Sweden, Hydrol. Earth Syst. Sci., 24, 3157–3188, https://doi.org/10.5194/hess-24-3157-2020, 2020. a, b
Schleiss, M., Raupach, T. H., and Berne, A.: The raindrop size distribution – the unknown that holds everything together, in Advances in Weather Radar, Volume 2: Precipitation Science, Scattering and Processing Algorithms, edited by: Bringi, V. N., Mishra, K. V., and Thurai, M., Institution of Engineering and Technology, 247–292, https://doi.org/10.1049/sbra557g_ch6, 2023. a
Shannon, C. E.: A mathematical theory of communication, Bell Syst. Tech. J., 27, 379–423, 1948. a, b
Singh, V. P.: Entropy theory and its application in environmental and water engineering, John Wiley & Sons, Chichester, West Sussex, UK, ISBN 978-1-119-97656-1, 2013. a
Šlerka, J. and Šisler, V.: Who is shaping your agenda? Social network analysis of anti-Islam and anti-immigration movement audiences on Czech facebook, in: Expressions of radicalization, edited by: Steiner, K. and Önnerfors, A., Palgrave Macmillan, Cham, Germany, 61–85, https://doi.org/10.1007/978-3-319-65566-6_3, 2018. a
Špačková, A., Fencl, M., and Bareš, V.: Evaluation of error components in rainfall retrieval from collocated commercial microwave links, Atmos. Meas. Tech., 16, 3865–3879, https://doi.org/10.5194/amt-16-3865-2023, 2023. a, b
Steuer, R., Kurths, J., Daub, C. O., Weise, J., and Selbig, J.: The mutual information: Detecting and evaluating dependencies between variables, Bioinformatics, 18, 2, S231–S240, https://doi.org/10.1093/bioinformatics/18.suppl_2.S231, 2002. a
Thiesen, S., Darscheid, P., and Ehret, U.: Identifying rainfall-runoff events in discharge time series: a data-driven method based on information theory, Hydrol. Earth Syst. Sci., 23, 1015–1034, https://doi.org/10.5194/hess-23-1015-2019, 2019. a, b, c, d, e
Timme, N. M. and Lapish, C.: A tutorial for information theory in neuroscience, eNeuro, 5, 3, https://doi.org/10.1523/ENEURO.0052-18.2018, 2018. a, b, c, d, e
Uda, S.: Application of information theory in systems biology, Biophysical Reviews, 12, 377–384, https://doi.org/10.1007/s12551-020-00665-w, 2020. a
Uijlenhoet, R., Overeem, A., and Leijnse, H.: Opportunistic remote sensing of rainfall using microwave links from cellular communication networks, Wires Water, 5, e1289, https://doi.org/10.1002/wat2.1289, 2018. a
van het Schip, T. I., Overeem, A., Leijnse, H., Uijlenhoet, R., Meirink, J. F., and van Delden, A. J.: Rainfall measurement using cell phone links: classification of wet and dry periods using geostationary satellites, Hydrol. Sci. J., 62, 1343–1353, https://doi.org/10.1080/02626667.2017.1329588, 2017. a
van Leth, T. C., Leijnse, H., Overeem, A., and Uijlenhoet, R.: Estimating raindrop size distributions using microwave link measurements: potential and limitations, Atmos. Meas. Tech., 13, 1797–1815, https://doi.org/10.5194/amt-13-1797-2020, 2020. a
Walraven, B., Overeem, A., Leijnse, H., Coenders, M., Hut, R., van der Valk, L., and Uijlenhoet, R.: Considering local network characteristics and environmental conditions improves rainfall estimates from commercial microwave links in Sri Lanka, EGU General Assembly 2022, Vienna, Austria, 23–27 May 2022, EGU22-9544, https://doi.org/10.5194/egusphere-egu22-9544, 2022. a
Weiss, T., Routtenberg, T., Ostrometzky, J., and Messer, H.: Intensity estimation after detection for accumulated rainfall estimation, Front. Sig. Proc., 4, 1291878, https://doi.org/10.3389/frsip.2024.1291878, 2024. a