the Creative Commons Attribution 4.0 License.
the Creative Commons Attribution 4.0 License.
 | 13 Feb 2025
Performance evaluation of Atmotube PRO sensors for air quality measurements in an urban location
Aishah I. Shittu
Kirsty J. Pringle
Stephen R. Arnold
Richard J. Pope
Ailish M. Graham
Carly Reddington
Richard Rigby
James B. McQuaid
This study presents a performance evaluation of eight Atmotube PRO sensors using US Environmental Protection Agency (US EPA) guidelines. The Atmotube PRO sensors were collocated side by side with a reference-grade Fidas monitor in an outdoor setting for a 14-week period in the city centre of Leeds, UK. We assessed the linearity and bias for PM1, PM2.5, and PM10. The result of the PM2.5 assessment showed the Atmotube PRO sensors had particularly good precision with a coefficient of variation (CoV) of 28 %, 18 %, and 15 % for PM2.5 data averaged every minute, hour, and day, respectively. The inter-sensor variability assessment showed two sensors with low bias and one sensor with a higher bias in comparison with the sensor average. Simple univariate analysis was sufficient to obtain good fitting quality to a Fidas reference-grade monitor (R2>0.7) at hourly averages, although poorer performance was observed using a higher time resolution of 15 min averaged PM2.5 data (R2 of 0.48–0.53). The average error bias, root mean square error (RMSE), and normalized root mean square error (NRMSE) were 3.38 µg m−3 and 0.03 %, respectively. While there were negligible influences of temperature on Atmotube PRO-measured PM2.5 values, substantial positive biases (compared to a reference instrument) occurred at relative humidity (RH) values > 80 %. The Atmotube PRO sensors correlated well with the PurpleAir sensor (R2 of 0.88, RMSE of 2.9 µg m−3). In general, the Atmotube PRO sensors performed well and passed the base-testing metrics as stipulated by recommended guidelines for low-cost PM2.5 sensors. Calibration using the multiple linear regression model was enough to improve the performance of the PM2.5 data of the Atmotube PRO sensors.
- Article
(3044 KB) - Full-text XML
- BibTeX
- EndNote


Particulate matter (PM) with an aerodynamic diameter of less than 2.5 µm (PM2.5) has been associated with several harmful effects on human health (Maynard et al., 2023; WHO, 2021; Williams et al., 2014). The acute effects of PM include an increase in hospital admissions and early development of asthma in children (Khreis et al., 2019; Mansourian et al., 2011). Long-term effects of outdoor PM2.5 are associated with fatal cardiovascular and respiratory diseases and lung cancer with records of increased mortality rates in cities with a higher concentration of airborne PM (WHO, 2021). Another challenge is the exposure disparities amongst socioeconomic groups (Keswani et al., 2022). Understanding the health effects on a given population requires evaluation of their exposure to PM2.5, which in turn relies on an understanding of the atmospheric concentration of PM2.5. This is challenging as PM2.5 concentrations can vary temporally and spatially on small scales (Liu et al., 2009). Low-cost air quality sensors represent recent technologies which are less expensive than typical air quality monitors and allow for the measurement of specific air pollutants such as PM and other gaseous pollutants. These low-cost sensors are portable, allowing for ongoing measurements of exposure to individuals as they move around their environments; they also offer an appealing way of obtaining additional atmospheric measurements to better characterize the distribution of PM2.5 in a wide range of locations.
Several low-cost sensors (USD 200–2500) have become commercially available (Williams et al., 2014). These sensors are portable, small in size, and lightweight and provide high-resolution data in near real time (Morawska et al., 2018; Rai et al., 2017). The advent of these low-cost sensors has the potential to change the paradigm of air pollution monitoring as it allows for the possibility of more frequent measurements, which could improve our knowledge, especially in areas where monitoring is sparse and lacks expensive equipment operated by the government or research agencies (Chatzidiakou et al., 2019; Morawska et al., 2018). In addition, these sensors can be used easily without much training, enabling widespread access to air quality data and making it possible for individuals and communities to monitor air quality both indoors and outdoors by themselves. Recent research has demonstrated that low-cost sensors may be used to identify and apportion various pollution sources in urban environments (Bousiotis et al., 2023; Hagan et al., 2019; Pope et al., 2022; Westervelt et al., 2024; Yang et al., 2022). Assessing the performance of low-cost sensors and their behaviour relative to reference instruments is crucial, given the growing popularity and use of these sensors for citizen science projects, community engagement initiatives, personal exposure monitoring (Borghi et al., 2017), and building community sensor networks to supplement official reference-grade monitoring networks.
Previous studies have found that some low-cost sensors exhibit significant variation in performance, influenced by several factors such as environmental conditions and the choice of the reference instrument used (Kang et al., 2022; Karaoghlanian et al., 2022). Environmental factors such as humidity and temperature have been reported to impact their accuracy (Hagan and Kroll, 2020; Pawar and Sinha, 2020). The results of these evaluations can help determine the suitability of low-cost sensors for measuring pollution in different settings and applications and guide the development of better sensor technologies in the future. Numerous studies have found that some low-cost sensors performed well at measuring ultrafine particles, while others were less accurate and had higher measurement variability as reported by Alfano et al. (2020) and Kang et al. (2022). Overall, these studies highlight that careful evaluation of low-cost sensors for particulate pollution measurement is required.
Studies have examined the performance of different brands of low-cost sensors in comparison with a reference-grade monitor (Bulot et al., 2019; Feenstra et al., 2019; Jovašević-Stojanović et al., 2015; Sousan et al., 2017), and several calibration methods using linear regression, multiple linear regression, Gaussian process regression, ridge regression, and random forests have been used to improve the raw PM2.5 data (Badura et al., 2019; Barkjohn et al., 2021, 2022; Karaoghlanian et al., 2022; Malings et al., 2019, 2020; Raheja et al., 2023). These calibration methods allow for the sensors to be better suited for implementation as a supplement for reference monitors in smaller communities or cities. However, the use of different methodologies developed by various research groups may impact the accuracy and reliability of the data obtained from low-cost sensors (Alfano et al., 2020). Performance evaluation of low-cost sensors for particulate pollution measurements thus far has focused on assessing the accuracy and reliability of low-cost sensors used for measuring particulate matter pollution in field studies, and only a few papers have investigated in detail inter-sensor variability of identical sensor types. Inconsistencies among devices from the same manufacturer might emerge, leading to varying readings under similar conditions. Sensor performance can be highly variable between different devices, and end users need to be provided with information on inter-sensor precision, accuracy, long-term drift, and calibration transferability to decide on the right measurement tool for their specific application (Diez et al., 2024).
There are two ways of evaluating the performance of low-cost PM sensors: collocation with a reference instrument and laboratory-based evaluation. The US EPA (Environmental Protection Agency) refers to these as base testing and enhanced testing, respectively (Duvall et al., 2021). This paper focuses on the well-detailed metrics for base-testing methods for the performance assessment of Atmotube PRO sensors data. The AQ-SPEC (Air Quality Sensor Performance Evaluation Center) programme is a testing centre for low-cost air monitoring sensors for establishing performance standards by which low-cost sensors are evaluated both in the field under ambient conditions and using laboratory testing under controlled environmental conditions for sensors measuring criteria pollutants (Feenstra et al., 2019; Polidori et al., 2017). Three Atmotube PRO units were previously used in a field evaluation by the well-known South Coast Air Quality Management District (AQMD), which set up the AQ-SPEC using the GRIMM and Met One BAM reference instruments (R2>0.7) (AQMD, 2020). The report focused on limited evaluation statistics. Since the AQ-SPEC report in 2020, a few other studies have made use of these Atmotube PRO sensors for occupational and household PM2.5 exposure monitoring and community citizen science (Masri et al., 2022, 2023; Voultsidis et al., 2023; Wang et al., 2020); thus there is a need for a detailed performance assessment of these sensors to ensure confidence in the data being collected.
In summary, low-cost sensors have the potential to provide widespread useful air quality information for researchers and community members. The aim of the study is to assess the inter-sensor variability and accuracy of Atmotube PRO sensors to provide insight into the reliability and robustness of these sensors' PM2.5 measurements. By demonstrating a good framework for testing the precision, accuracy, and reliability of sensors within a sensor network, the results will provide users a clear understanding of the limitations as well as confidence in the in situ PM2.5 levels measurements obtained for Atmotube PRO sensors. In addition, we investigated the performance of the sensors at higher time resolution (15 min) to test the feasibility of their application in capturing short-term events that may be missed at lower resolution.
2.1 Sampling site and data collection
We conducted a sensor collocation exercise aimed at evaluating the performance of Atmotube PRO sensors compared to a reference monitor placed alongside them. The collocation exercise took place in an ambient environment at Leeds Corn Exchange, in the city centre of Leeds (next to a bus stop), where eight Atmotube PRO sensors and one PurpleAir sensor were collocated side by side with a fine-dust analysis system (Fidas 200S) reference-grade air quality monitor in an urban location in the Leeds city centre (53° N, 1° W) at a height of about 3.5 m. The duration of the collocation exercise was done during autumn from 26 September 2023 to 1 January 2024. The city centre is representative of an ideal urban centre, which included frequent stops from public buses (vehicular emissions).
Atmotube PRO is a small and lightweight sensor (0.104 kg), classified as a low-cost device (USD 250), and is commercially available. Atmotube PRO devices have Sensirion SPS30 sensors which use the laser scattering principle to radiate and detect suspended particles in an air chamber. A micro fan draws in air through an inlet, and the air passes through the laser beam where the scattered light reflected by the particles is captured by a photodiode. A signal is transmitted to the micro control unit based on Mie theory, where a proprietary algorithm processes the data and supplies outputs for the concentration of the particulate (µg m−3). Atmotube PRO sensors report the estimated mass concentration of particles with an aerodynamic diameter of < 1 µm (PM1), < 2.5 µm (PM2.5), and < 10 µm (PM10). In addition to the Sensirion sensors for PM measurements, the Atmotube device also contains Bosch BME280 sensors for measuring temperature and relative humidity values. The sensors also log data every second and store them in memory every minute (Atmotube, 2023). One of the limitations of the Atmotube PRO device is the data retrieval memory with a limited history size of 10 d, after which data not downloaded would be overwritten. The Atmotube PRO came assembled and needs to be charged frequently. The sensor requires a charging time of about 2.5 h. The battery requires daily charging when set to always-on mode; thus we left the sensor plugged in throughout the entire duration of the study alongside the PurpleAir and reference monitor.
The PurpleAir sensors contain two Plantower PMS5003 sensors, which record 2 min averaged data. The PurpleAir sensor uses a principle similar to the Atmotube PRO sensors described above, based on scattering of laser light. The Plantower sensors also estimate the mass of particles with aerodynamic diameters of < 1, < 2.5, and < 10 µm which are reported as cf_1 and cf_atm and both have channels A and B in the PurpleAir dataset. The cf_atm data are displayed on the PurpleAir map (Barkjohn et al., 2022), and this sensor input is the dataset used in this study. The PurpleAir sensor has been deployed at the collocation site since June 2022.
The reference monitor used for the study was a Fidas 200S consisting of a sampling head that also enables representative sampling in strong wind. The control unit is integrated in an IP65 weather-protected housing which can be set up as a standalone outdoor instrument. It uses optical light scattering according to Mie theory using bright and durable white LED light as a light source. It measures PM1, PM2.5, PM4, PM10, total suspended particles (TSPs), temperature, and relative humidity. The measuring range in mass is 0–10 000 µg m−3, and the particle size range is 0.18–18 µm. The monitor records 15 min averages. The Fidas 200S sensors are certified and developed for compliance monitoring of PM in accordance with EU and UK legislation. The uncertainty between Fidas devices is 0.44 µg m−3 (FIDAS, 2024).
The performance of the low-cost sensors will be assessed using US EPA guidelines (Duvall et al., 2021) for base- and enhanced-testing metrics. For sensor accuracy, the coefficient of determination (R2), root mean square error (RMSE), mean normalized bias (MNB), normalized root mean square error (NRMSE), slope, and intercept will be determined. The R2 value is a metric that provides information about the proportion of the variance in the dependent variable (Atmotube PRO sensor) that can be explained by the independent variable (reference monitor). The RMSE helps to explain the error associated with sensor PM2.5 concentration in comparison with the reference concentration. For sensor precision, the standard deviation (SD) and coefficient of variation (CoV) will be determined. It is recommended that low-cost sensors used for performance evaluation tests should have 75 % data completeness during the collocation study period (Duvall et al., 2021; Zimmerman, 2022). Other performance metrics include the detection range, detection limit, and response time.
This paper focuses on the reproducibility of the eight Atmotube PRO sensor units (identical model). The CoV was calculated using 1 min, 15 min, and 1 h averages. Low CoV values indicate high reproducibility in the measurements across the Atmotube PRO sensors units. The US EPA recommends a CoV of < 30 % between sensors of identical models.
2.2 Atmotube PRO quality assurance
The Atmotube PRO also stores historical data in onboard flash memory when not connected to a smartphone. The historical data can be transferred to a smartphone during data synchronization each time the sensor is connected to a smartphone. The Atmotube PRO sensors are designed for mobile monitoring and to protect the sensors from rain at the collocation site; a makeshift cover was used to enclose all the sensors used in the study as shown in Fig. A1.
The 1 min PM1, PM2.5, PM10, relative humidity, and temperature data were retrieved from eight Atmotube PRO sensors. Data completeness as shown in Eq. (1) for Atmotube PRO sensors is the percentage ratio of minute-wise data available for each sensor and the total number of minutes expected for the study period (Polidori et al., 2017). This ranged from 73 %–84 % for PM1, PM2.5, and PM10. A preliminary analysis investigated the performance of PM1, PM2.5, and PM10 size distributions using Atmotube PRO sensors and reference Fidas monitor data. To understand reproducibility between Atmotube PRO sensor units, 1 min, 15 min, and 1 h averaged PM2.5 outputs were used for calculating a coefficient of correlation (r) between Atmotube PRO sensors.
where Nvalid data is the number of valid sensor data points during the test period and Nstudy period is the total number of data points for the study period.
During the collocation period, there were some data gaps, mostly due to a failure to download data within the 10 d data-buffering period of the internal sensor storage. The Atmotube PRO device erases old records to create room for new ones after storing a maximum of 14 400 data points or 10 d. The sensors were connected to external power continually throughout the study period. The data download tool allows for fetching data from the sensor unit for a period of up to 7 d via a simple user interface (Atmotube, 2023), and this is a limitation for long-term data collection due to limited space. This indicates that the sensor data need to be frequently downloaded to avoid data loss.
The performance of Atmotube PRO sensors for PM1, PM2.5, and PM10 in comparison with the reference Fidas monitor is shown in Fig. 1. The average of all eight sensors was computed at hourly time resolution. PM1 had a very low error bias of 1.7 µg m−3 and a strong R2 of 0.94. PM2.5 had a larger error bias of 3.2 µg m−3 and a decrease in the R2 value to 0.86 in comparison to PM1. The poorest performance was recorded for PM10 with a larger error bias of 6.2 µg m−3 and a further decline in R2 of 0.49. Similar results were recorded in the study by Molina Rueda et al. (2023) using Plantower, Sensirion, and Piera low-cost sensors. The rest of the paper will focus on a particle size of < 2.5 µm (PM2.5) as PM2.5 is the key standard by the World Health Organization (WHO) and other regulatory agencies for health-related research.
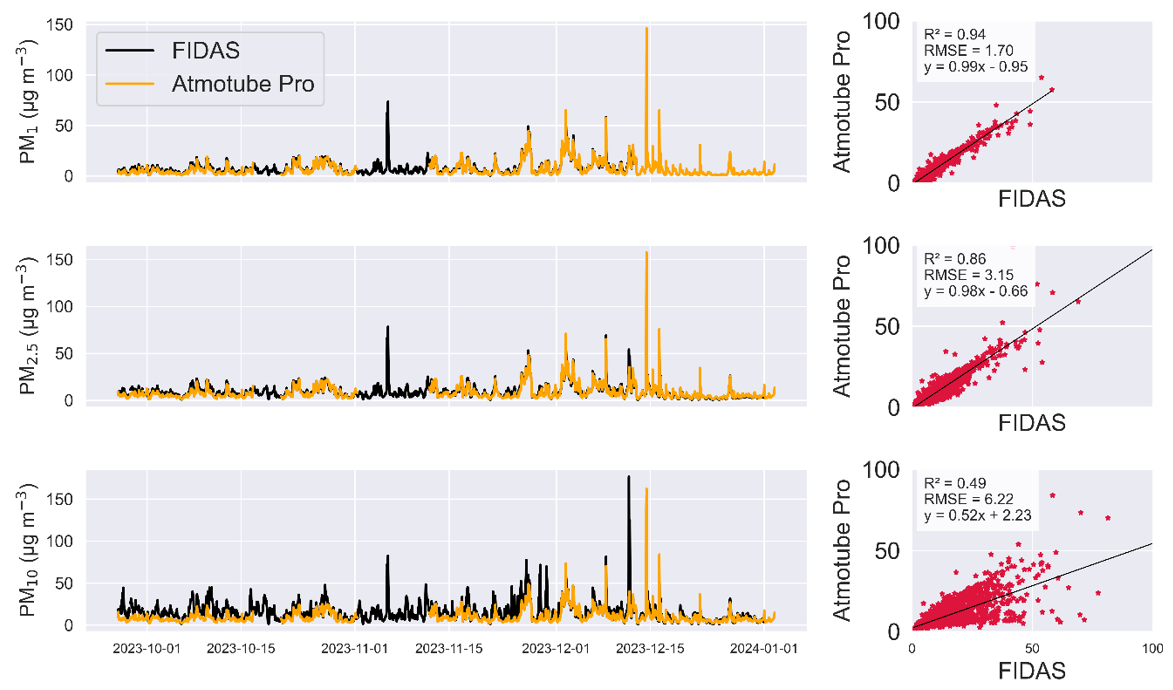
Figure 1Comparison of Atmotube PRO and Fidas reference monitor data for PM1, PM2.5, and PM10 (hourly averaged data).
We have approximately 3 months of observational data with PM2.5 in a range of 1–120 µg m−3 (using hourly averaged data) as shown in Fig. 2a. During this period, there are spikes in the order of ∼ 50 µg m−3 and above which are probably due to episodic events such as buses driving past, tobacco smoke, and the annual Guy Fawkes Night. The sensors exhibit comparable temporal variability between the sensors; however, in absolute terms, sensor 6 (S6) has higher concentrations in some cases. We correlated minute-wise data of each sensor against the others, and the coefficient of correlation generally ranged from 0.8 to nearly 1.0. Sensor 5 (S5) had slightly lower values of about 0.8–0.9, while S6 clearly was the poorest or the outlier because the r value was between 0.5–0.6. This suggests some anomalous data were recorded as shown in Fig. 2, highlighting a fault in S6.
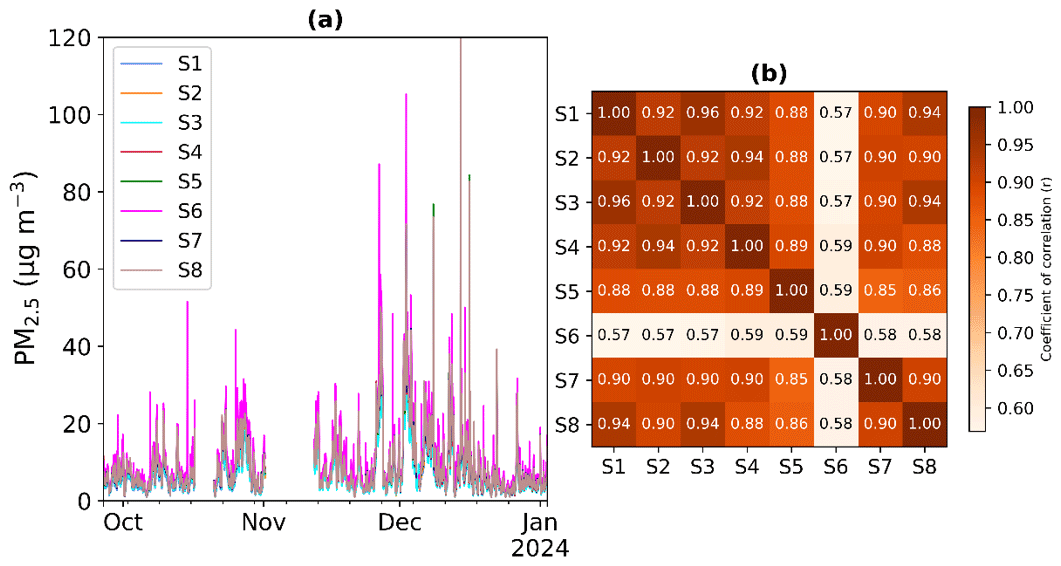
Figure 2PM2.5 data from eight Atmotube PRO sensors showing the (a) time series of each sensor (hourly average) and (b) coefficient of correlation (r) (minute-wise data).
Most air quality networks implement regular quality assurance and quality control measures, although outliers can still happen because of sensor malfunctions or differences in the monitoring configuration such as inlet orientation. There are possibilities of using some of these low-cost sensors where there are no reference monitors present, but it is imperative to check if a network of low-cost sensors has malfunctioning sensors. Outliers pose challenges for statistical analysis. S6 was the sensor with the most erroneous PM2.5 data, which showed anomalous data spikes (low and high) relative to the other sensors. One of the important benefits of the performance evaluation assessment for multiple sensors is identifying less robust individual sensors in a sample of sensors.
3.1 Inter-sensor variability
Using methods stated in the US EPA guidelines for low-cost performance metrics, results showed that the SD metrics in this study just exceeded the US EPA recommended limit of < 5 µg m−3, while the CoV was below the recommended limit of < 30 % as shown in Table 1. For this section, the CoV for determining inter-sensor variability is calculated as described by Duvall et al. (2021) and Zimmerman (2022). This indicates reasonable variability in sensors of identical models, and the high SD values can be attributed to short high-concentration events such as Christmas market barbecues smoking next to the sensors. Although the CoV values are within the recommended limits, the values are higher than values seen in the report made by the South Coast AQMD (AQMD, 2020), where the relative inter-sensor variability (CoV) was 6.7 % and the standard deviation was also reported to be 0.57 µg m−3 for PM2.5 values using 5 min averages of three Atmotube PRO sensors. There is a difference in the environment, duration of the study, and PM2.5 concentrations. For the AQ-SPEC, the collocation was for done for a 2-week period and the 5 min averages had a maximum of 50 µg m−3. This suggests the Atmotube PRO inter-sensor variability is less at lower PM2.5 concentrations. Previous studies have reported a CoV of < 10 % for Plantower sensors (Badura et al., 2019; Zimmerman, 2022), while other models of low-cost sensors have also reported a higher CoV of > 25 % for Dylos (Carvlin et al., 2017); Plantower and Syhitech (indoor collocation) had a CoV > 30 % (Zamora et al., 2020).
Table 1Coefficient of variation (CoV) and standard deviation (SD) for eight Atmotube PRO sensors.
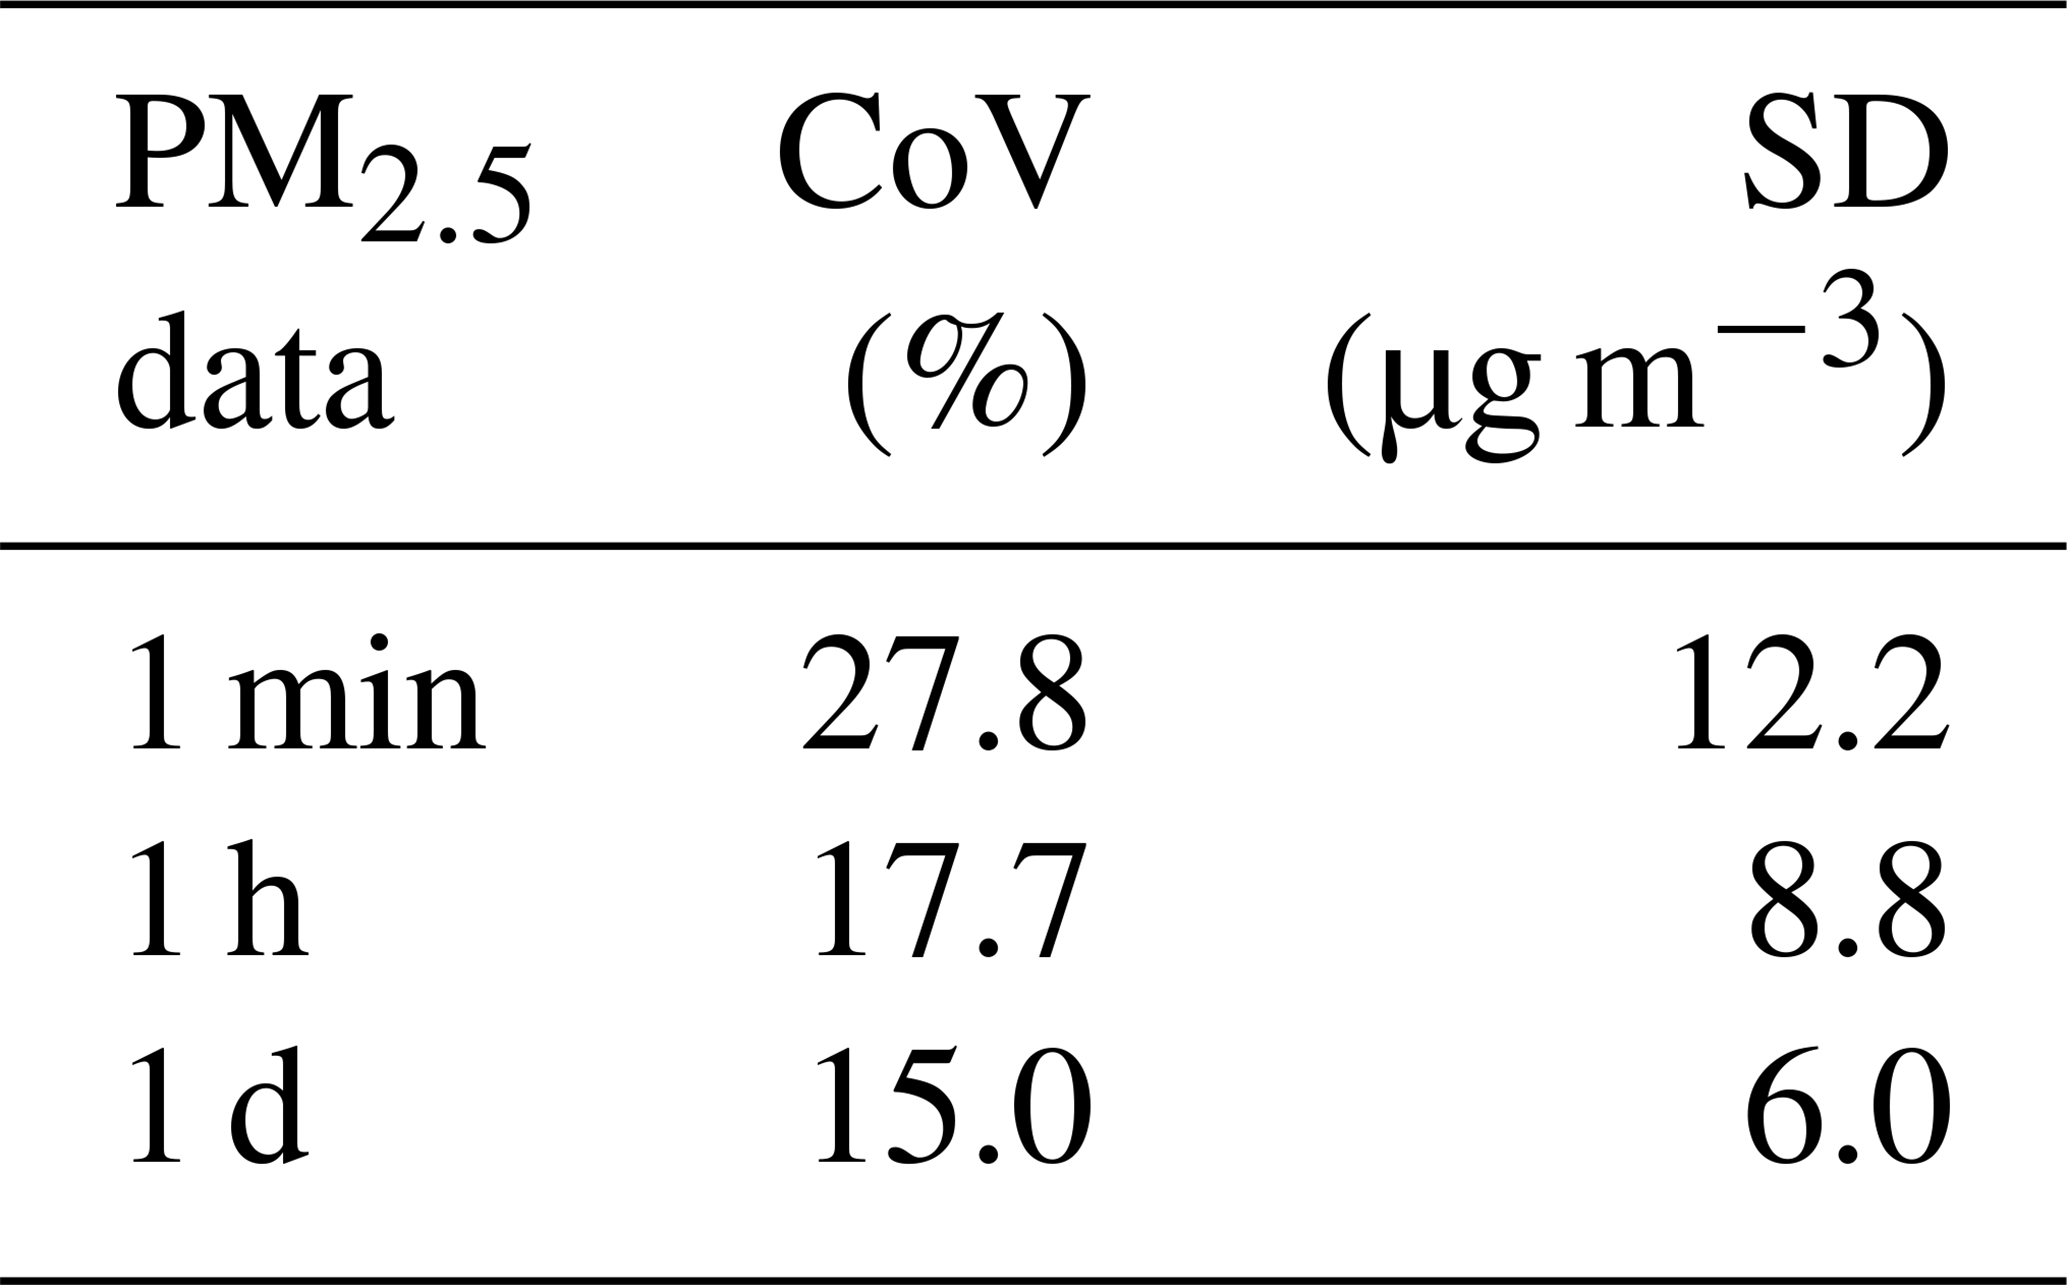
The CoV reduced further when S6 (Atmotube PRO) was removed from the analysis (CoV of 20 %, 11 %, and 10 % for data averaged every minute, hour, and day, respectively). This compares well with the range of CoV values from field evaluation results of different low-cost sensors of 0.9 % to 31.0 % with an average of 12.8 % for 24 h averages as described by Duvall et al. (2021) using resources from AQ-SPEC sensor evaluations, US EPA sensor evaluations, and peer-reviewed literature. Atmotube PRO sensors sit well within this range for both lower- and higher-resolution PM2.5 data of ∼ 28 %, 18 %, and 15 % for data averaged every minute, hour, and day, respectively. Our results indicate one anomalous sensor can drive increased inter-sensor variability in the measurements for the Atmotube PRO sensors. More research is required to identify the minimum number of sensors needed for a performance evaluation assessment. There were inconsistencies observed among Atmotube PRO sensors leading to varying readings under the same conditions, thus contributing to a high CoV. There is also the possibility of environmental factors such as relative humidity and temperature measurements, which may have influenced the PM2.5 values of these sensors differently.
To further investigate the reproducibility of the sensors, an hourly time step of the PM2.5 average (Avgh) of all eight sensors was derived over the study period. For each sensor, the ratio between the sensor value (per hour time step) and the multi-sensor mean was calculated as in Eq. (2). The temporal distribution of these ratios for each sensor was illustrated using box-and-whisker diagrams as in Fig. 3 to provide an indication of the sensor–sensor precision.
where xhi is Atmotube PRO PM2.5 hourly data (µg m−3) for sensor i, where i=1–8, and μh is the mean PM2.5 (µg m−3) concentration hourly average (for all eight sensors).

Figure 3Sensor–sensor precision comparing the ratio of sensor hourly PM2.5 values to the average of eight Atmotube PRO sensors as a reference. The whiskers represent the 5th and the 95th percentiles. Dashed red line indicates a sensor / average ratio of 1, where < 1 represents low bias and vice versa.
Although there is no standard regarding what the sensor precision should be, this investigation makes it clear that S6 can be deemed to have a large deviation from the average. S6 had a median ratio of ∼ 1.25 and a range of the 25th–75th percentiles of 1.2–1.3. S1 and S3 have a small deviation from the average PM2.5 values (that is, a median of ∼ 0.8 and a range of the 25th–75th percentiles of 0.7–0.95). Note that the hourly time averages were used for Fig. 3. For an inter-sensor quality assurance check where a reference-grade instrument is far away or totally lacking, comparing against the mean PM2.5 value for all the sensors may prove useful in identifying faulty sensors within a network of sensors as shown in Eq. (2). Where the sensor PM2.5 median ratio value tends to 1.0, it indicates the sensor measurements are consistent with the majority of the other sensors in the network (Fig. 3). Other sensors (S2, S4, S5, S7, and S8) may be used as a “supplementary reference” to identify potentially anomalous sensors. In summary, 62.5 % of the sensors used for the study exhibited greater precision in their measurements.
3.2 Comparison with a reference-grade monitor
Sensor performance was investigated further by comparing the PM2.5 Atmotube PRO sensor data to measurements from the local-authority reference monitor data at the Leeds city centre air quality monitoring site. Atmotube 15 min averaged data were used for this comparison as the reference monitor logs PM2.5 data at this temporal resolution.
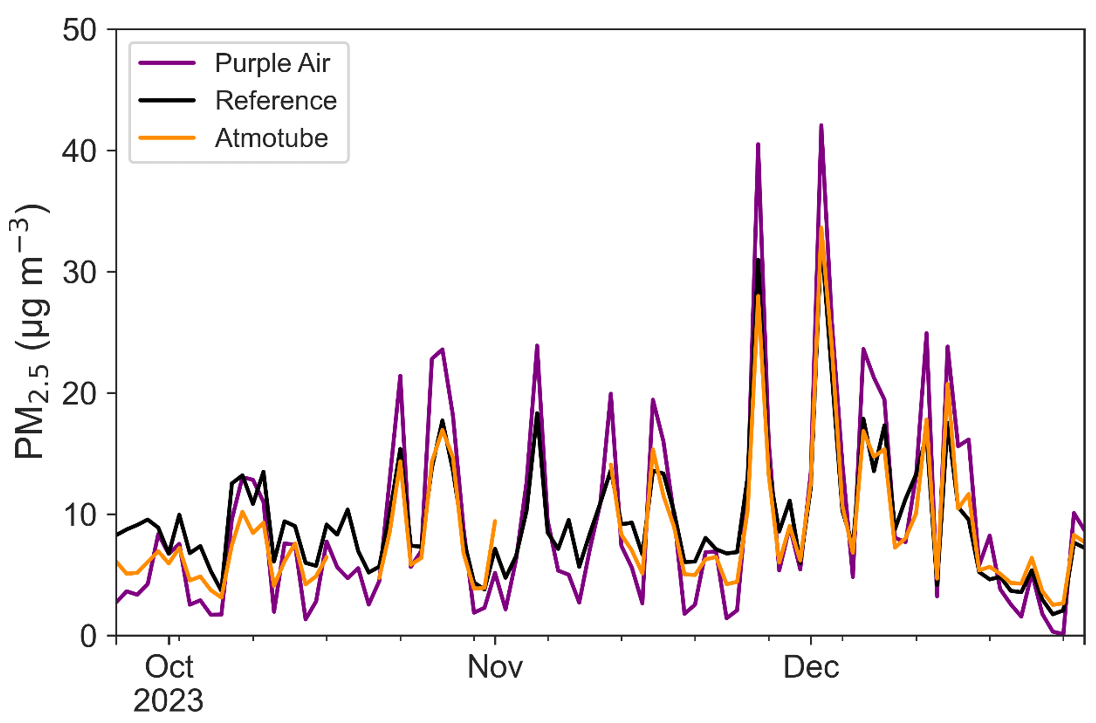
Figure 4Time series of PM2.5 concentration reported by PurpleAir, the average of the Atmotube PRO sensors, and the reference monitor. The data have been averaged to daily data.
The time series in Fig. 4. shows the Atmotube PRO sensors; the PurpleAir sensor captured the reference monitor PM2.5 temporal variability, and the low-cost sensor PM2.5 values are of the same order of magnitude. However, during some high-concentration episodes, the PurpleAir sensors typically overestimated PM2.5 values in comparison with the reference. We calculated the R2, RMSE, NRMSE, MNB, slope, and intercept of the relationship between the Atmotube PRO sensor data and the reference monitor. The results for 15 min and hourly averages are summarized in Table 2. For the coarser time resolution, Atmotube PRO sensors had an R2 of > 0.7 and RMSE of < 7 µg m−3 in comparison to the 15 min averages with an R2 of 0.48–0.53 and RMSE of > 7 µg m−3. Using hourly PM2.5 averages, the Atmotube PRO and PurpleAir sensors performed well with evaluation metrics within the US EPA guideline values, with RMSE values of 3.4 and 4.8 µg m−3, respectively. Results show that the hourly averaged data of the Atmotube PRO sensors performed better than the higher-time-resolution data. In comparison with the AQ-SPEC evaluation, Atmotube PRO sensors had an R2 of ∼0.79 and 0.89 using BAM and GRIMM reference monitors, respectively (AQMD, 2020). The R2 values can be further improved by calibration methods as reported in the literature with different calibration and correction methods (Badura et al., 2019; Giordano et al., 2021; Hong et al., 2021; Pawar and Sinha, 2020) to improve the PM2.5 data quality of different low-cost sensor models.
Table 2Accuracy metrics using Atmotube PRO and PurpleAir sensors in comparison with 15 min and hourly averaged reference data. R2: correlation of determination, RMSE: root mean square error, NRMSE: normalized root mean square error, a: slope, b: intercept, S1–S8: Atmotube PRO sensors, mean: Atmotube PRO sensor average, PA: PurpleAir sensor.
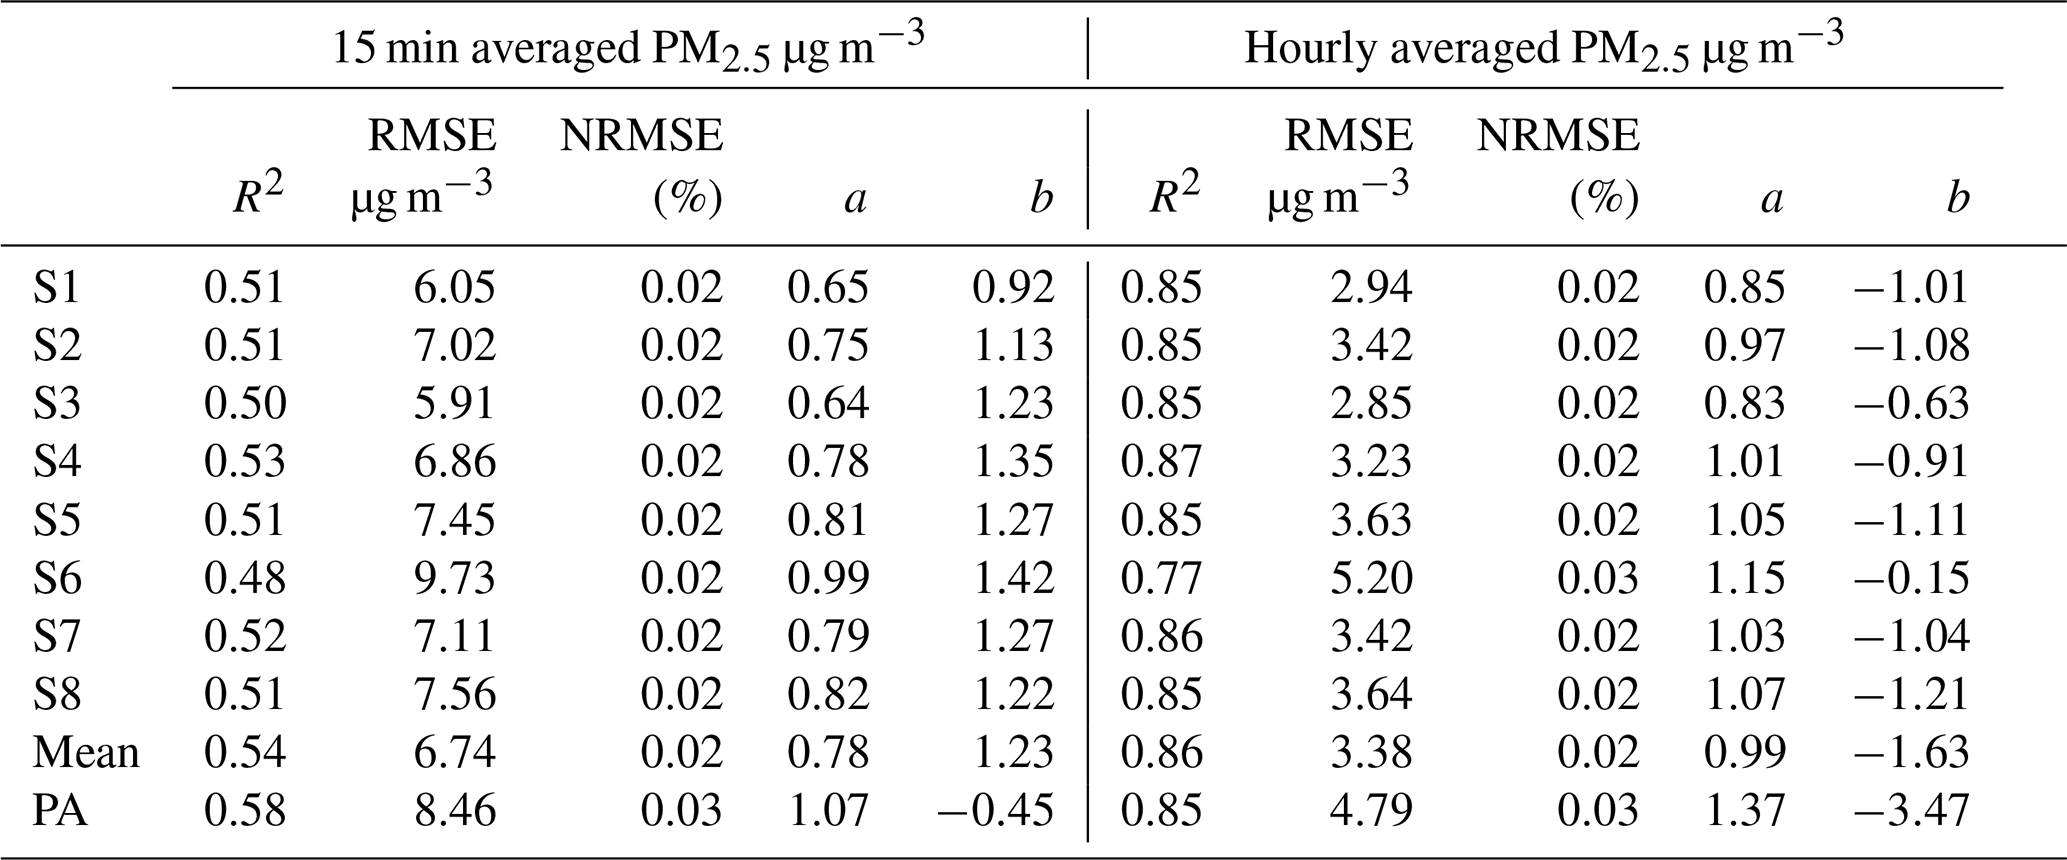
A measure of correlation is necessary when assessing the performance of low-cost sensors, but that alone is not sufficient as the error bias should also be reported (Giordano et al., 2021). The AQ-SPEC, however, did not mention the error bias of the Atmotube PRO sensors in its report. The RMSE describes the difference between sensors PM2.5 measurements and the true value (reference instruments). The NRMSE accounts for testing in conditions where high PM2.5 concentrations were recorded and the RMSE is normalized using the average of the reference PM2.5 measurements over the testing period (Duvall et al., 2021; Zimmerman, 2022). The RMSE and NRMSE values as shown in Table 2 were within the recommended US EPA guidelines of an RMSE of < 7 µg m−3 and < 30 %, respectively, using hourly averaged PM2.5 data. The MNB is a model evaluation metric which helps to quantify the accuracy of the measurements over the collocation period (Giordano et al., 2021). The MNB values for the 15 min average Atmotube PRO and the PurpleAir sensors were −0.17 and −2.7, respectively. For 1 h averages, the MNB values for the average Atmotube PRO and the PurpleAir sensors were 0.01 and −0.29, respectively.
The US EPA guidelines also recommend a target slope and intercept range of 1.0±0.35 and −5 to +5, respectively. The slope and intercept of the Atmotube PRO sensors had an average of 0.99 and −1.63, respectively, while the values for the PurpleAir sensor were 1.37 and −3.47, respectively. The overall performance of the eight Atmotube PRO sensors is summarized in Table 3. The Atmotube PRO sensors met the US EPA base-testing criteria (precision, bias, linearity, and error) at coarser-resolution averages (1 h). However, the linearity and the error did not meet these criteria at higher-resolution averages (15 min). Also, at a PM2.5 concentration below 100 µg m−3 for higher-resolution averages, the criteria were met for these metrics, indicating the Atmotube sensors perform better at lower concentrations.
Table 3Overview performance summary of reproducibility and accuracy among identical Atmotube PRO sensors using US EPA guidelines.

Separating high-concentration events
The performance of the eight Atmotube PRO sensors showed the R2 using 15 min averaged PM2.5 data were correlated well at a PM2.5 concentration below 100 µg m−3. R2 values were >0.7 for all eight Atmotube PRO sensors and the PurpleAir sensor as shown in Fig. 5. Although correlation was low using the full dataset (R2 range of 0.42 to 0.56) for 15 min averaged data as seen in Table 2, this is indicative of poorer performance at higher concentrations above 100 µg m−3. At a higher averaging time the R2 improved significantly, and this is in line with a report by Hong et al. (2021) using Sensirion, Plantower, and Honeywell sensors.
Comparing the error bias in the regression analysis of the 15 min averaged data of the full PM2.5 dataset (1–300 µg m−3) and PM2.5 dataset below 100 µg m−3 only, the RMSE range was 7.6–9.5 µg m−3 and 3.56–4.83 µg m−3, respectively. This shows a general lower bias in error at lower concentrations between the Atmotube PRO sensors and the reference. The same applies to the PA sensor, as there was also a reduction in RMSE values from 8.8 to 6.2 µg m−3. The plot in Fig. 5. was coloured by individual RH data logged by each sensor. Section 3.4 highlights the influence of RH and temperature on the sensor data.
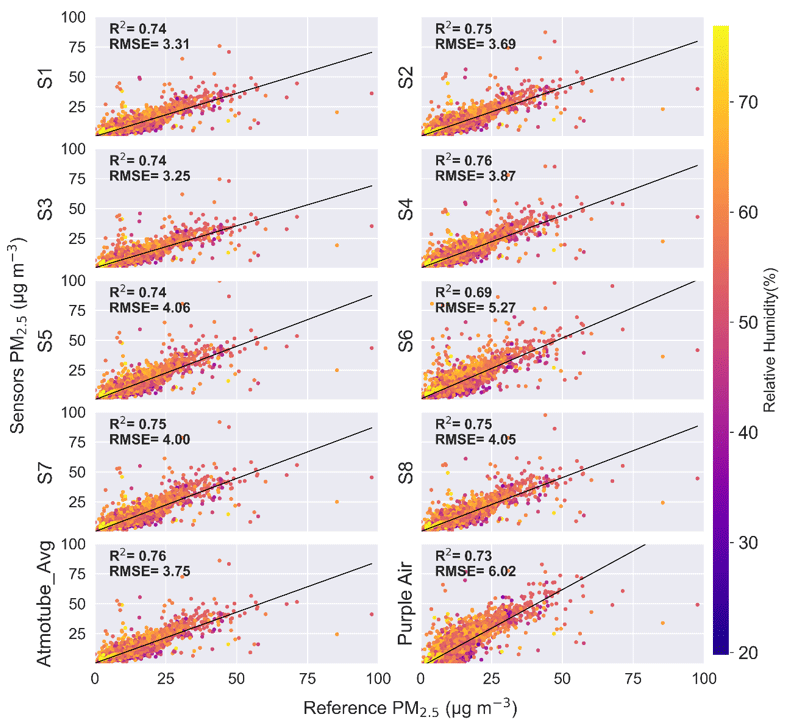
Figure 5Summary of comparison metrics of each Atmotube PRO sensor, the Atmotube PRO average, the PurpleAir sensor, and the reference (15 min averaged data) showing a PM2.5 concentration below 100 µg m−3.
3.3 Influence of temperature and relative humidity
The ratio of the average of all eight Atmotube PRO sensors and the reference PM2.5 data for hourly averages was calculated. Scatter plots of the PM2.5 ratio (defined as average Atmotube PRO sensor PM2.5 / reference PM2.5) as calculated in Eq. (3) were plotted as a function of RH and temperature reported by a nearby weather station as shown in Fig. 6. Data were collected from a local weather station rather than from the Atmotube PRO sensor themselves, since Zimmerman (2022) reported that RH and temperature sensors in the low-cost devices can be influenced by sensor heating when connected to power. The nearest meteorological station was set up on the rooftop of the School of Earth and Environment building at the University of Leeds (53°49 N, 1°34 W) about 0.96 km away from where the collocation experiment of the Atmotube PRO sensors, PurpleAir sensor, and reference monitors took place (53°47 N, 1°33 W).
where μh is the mean PM2.5 (µg m−3) concentration hourly average for hour h (for all eight sensors) and Rh is the reference PM2.5 (µg m−3) concentration hourly average for hour h.
For RH, there is a clear relationship with the PM2.5 sensor / reference ratio, which increases sharply at RH > 80 %, while at low RH the ratio was below 1.0, indicating the sensors were underestimating the PM2.5 value relative to the reference monitor. There was no clear influence observed for the PM2.5 ratio relative to the temperature; however, there was a general low bias at all temperatures apart from the mid-temperature range of 5–15 °C. This agrees with results as reported by Zimmerman (2022) using PurpleAir sensors where a clear influence at 80 % RH was also observed, with no influence from temperature. Implementing a statistical correction using RH values for these sensors could improve the accuracy of the measured PM2.5 values. We recommend a further exploration of correction methods using RH in future research investigations.
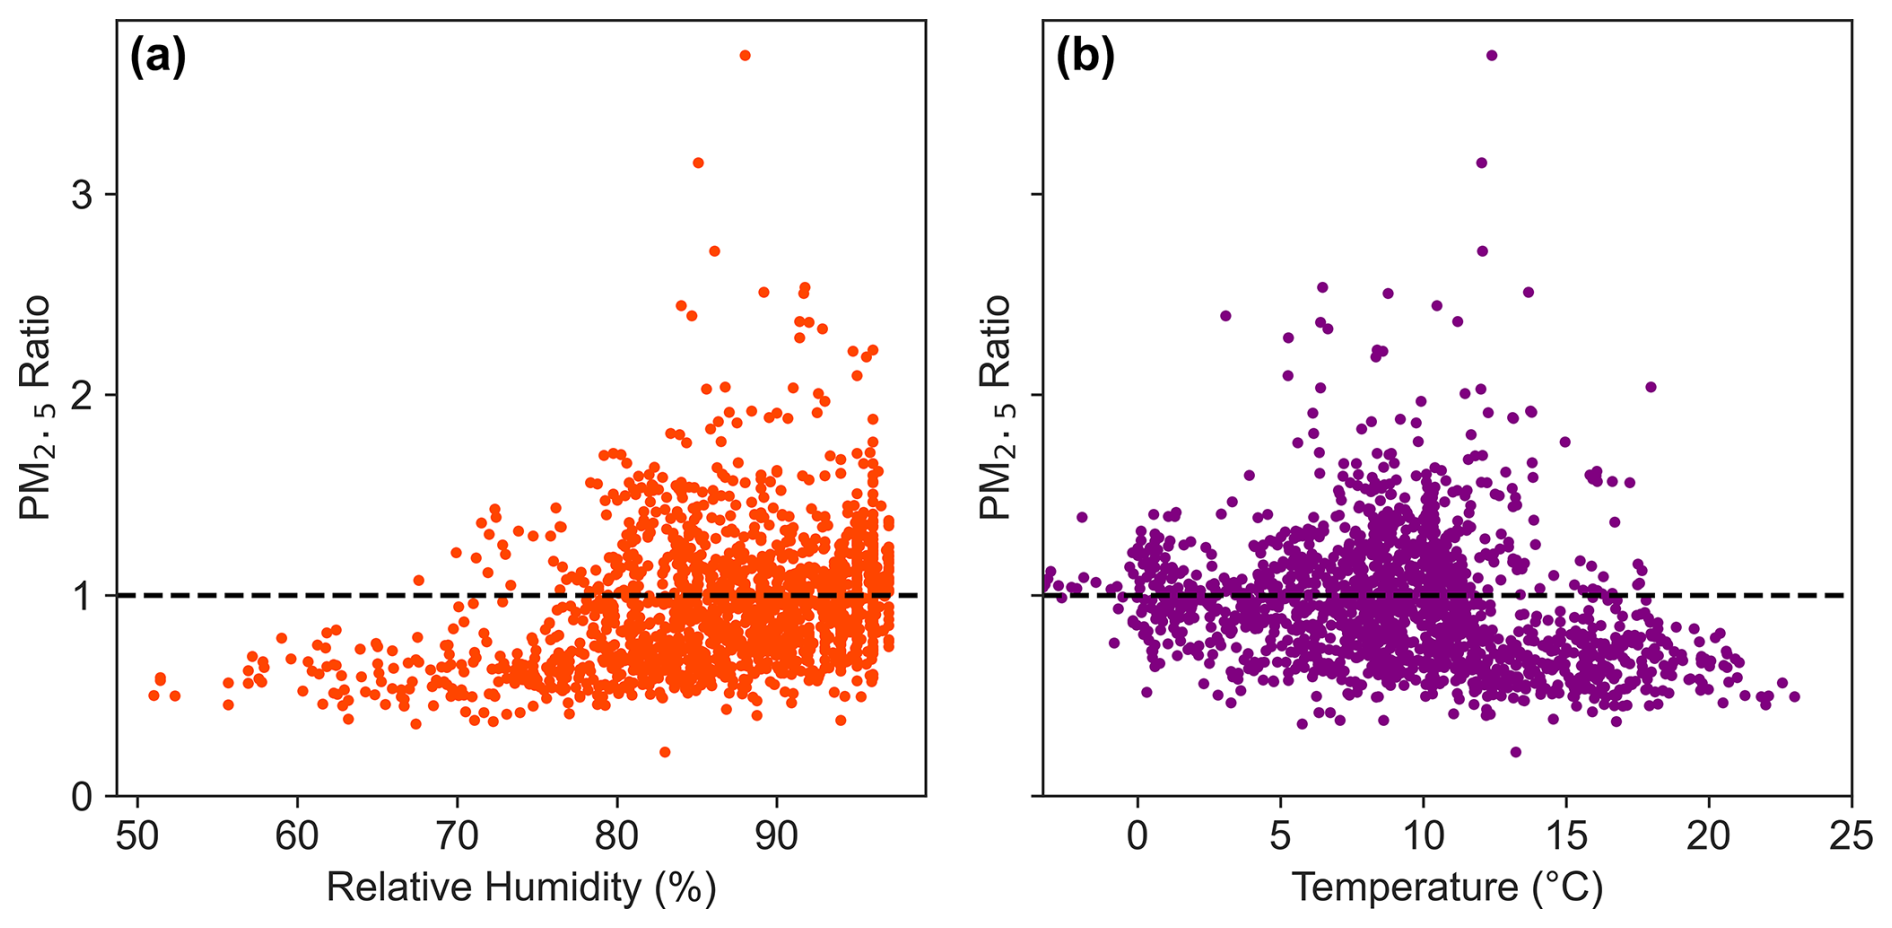
Figure 6Relationships between (a) relative humidity (RH) and (b) temperature (T) and the average Atmotube PRO sensor / reference PM2.5 ratio.
3.4 Correction factor development
Many studies have used multiple linear regression (MLR) calibration models that include temperature, RH, and dew point to improve the PM2.5 data recorded by low-cost sensors (Badura et al., 2019; Barkjohn et al., 2021; Karaoghlanian et al., 2022; Malings et al., 2019; Raheja et al., 2023). In this section we explored the use of MLR using RH and temperature values to improve Atmotube PRO PM2.5 data. We tested using 15 min and 1 h time resolutions for the calibration model and assessed the model performance using R2 and RMSE. Given the results of investigating performance of PM2.5 concentrations of < 100 µg m−3 for the 15 min average data, we recorded improved performance, shown in Fig. 5 in comparison with Table 4, where the full dataset of PM2.5 concentrations for the 15 min average data was used.
Table 4Correction equation forms, R2, and the RMSE.
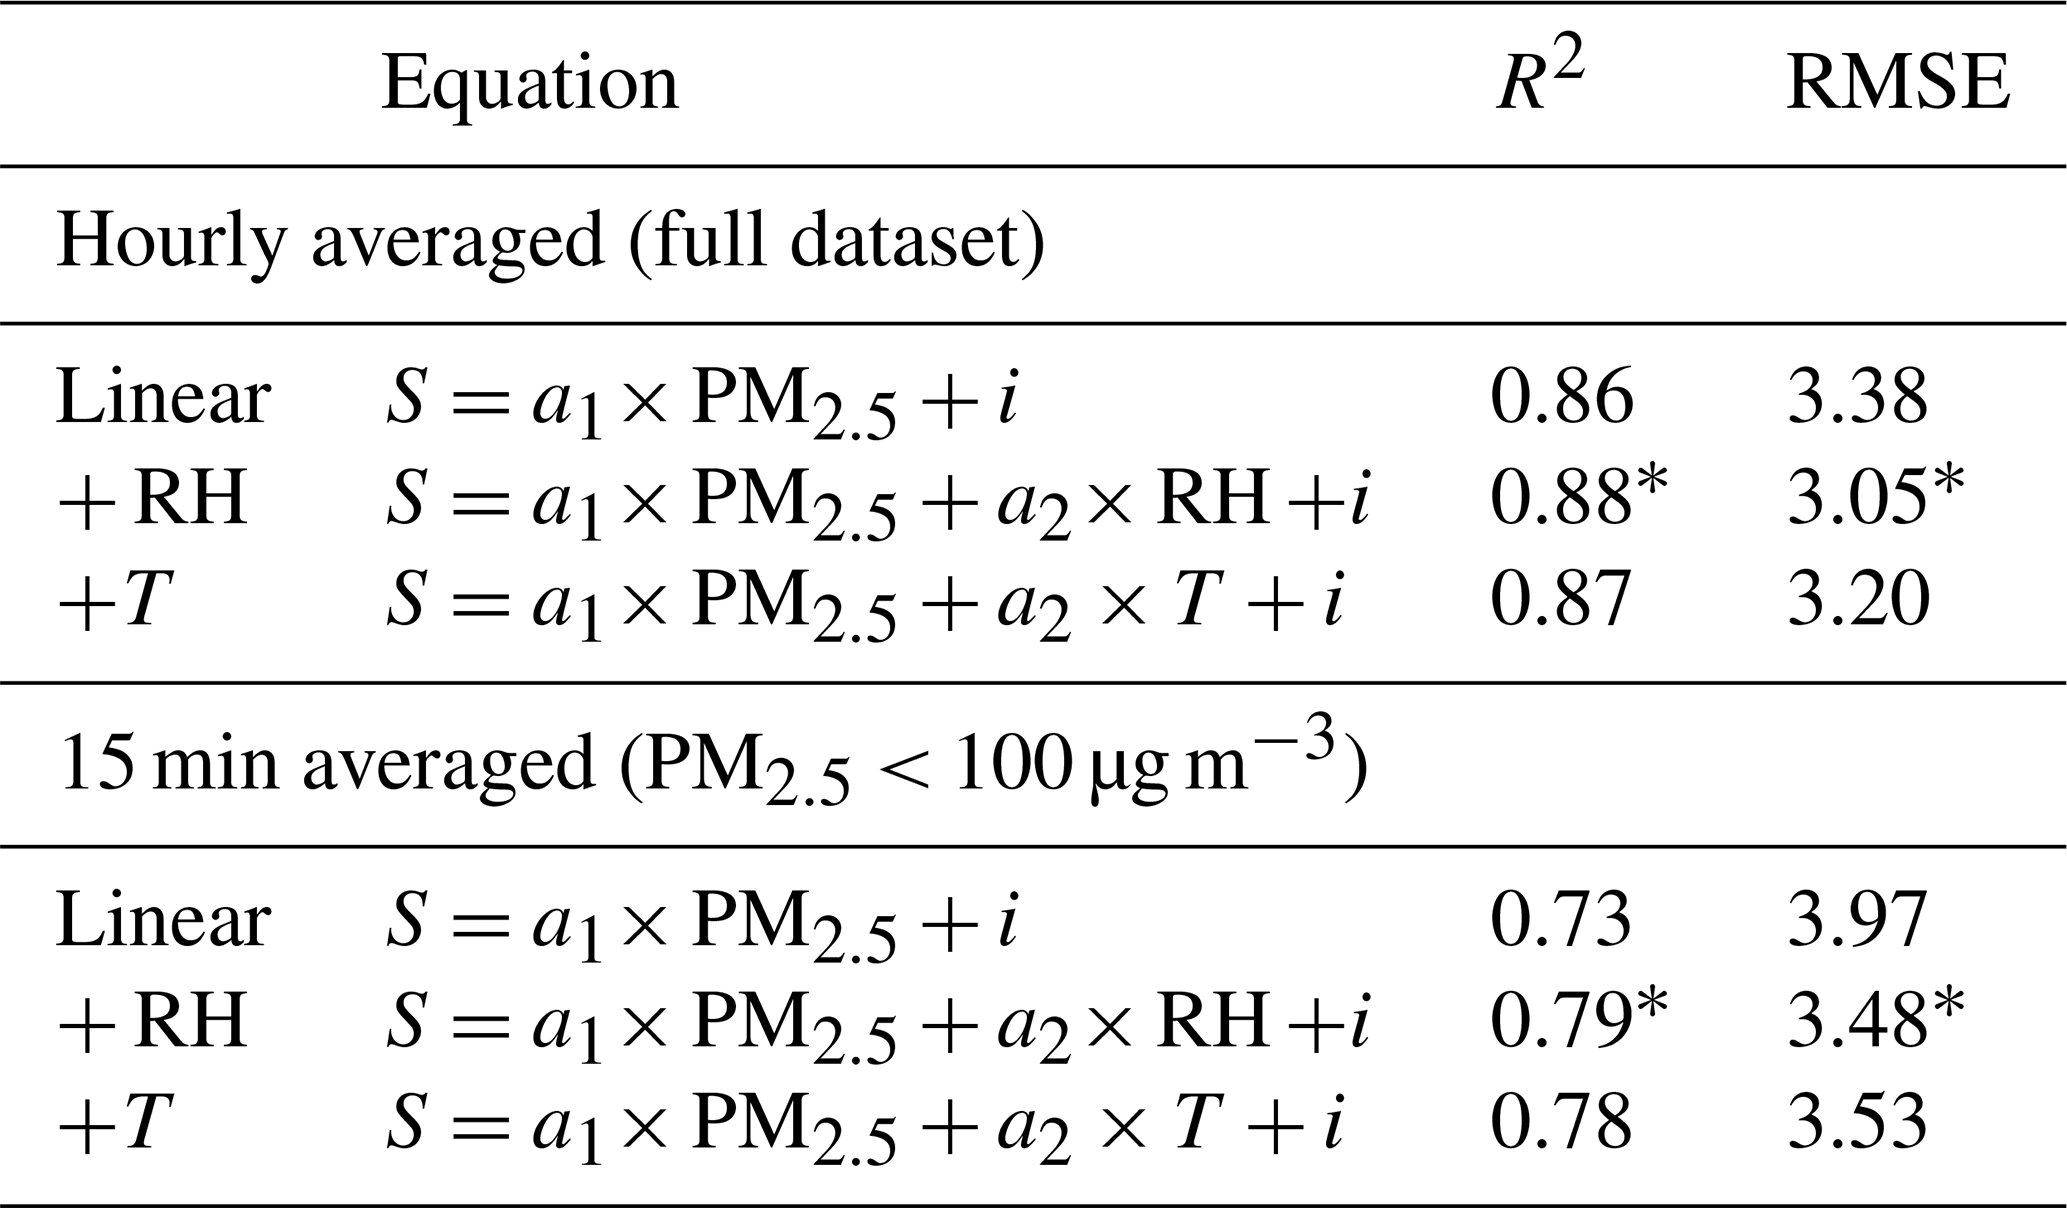
Best-performing calibration equation is indicated as (∗). a: slope, i: intercept.
The addition of RH and temperature values to the model improved the R2 value and decreased the RMSE value. However, the addition of T values only resulted in a smaller improvement in R2 and RMSE relative to using RH values. Similar improvement was also gained for higher-resolution data at concentrations of < 100 µg m−3. We note that this result cannot be generalized, since the calibration is done at a single location in an urban background during the winter months. It is possible that warmer seasons or different influences on aerosol composition would require different calibration factors.
We have conducted comprehensive inter-sensor and reference data comparisons for a set of eight Atmotube PRO sensors in order to characterize their precision and bias at different levels of PM2.5 exposure. The research also explored the potential of identifying underperforming sensors within a network of low-cost sensors, particularly in situations where no reference-grade monitors are available. The study revealed the PM2.5 values from the Atmotube PRO sensors had reasonably good precision (CoV of 18 %), indicating low inter-sensor variability of the sensors. The sensor measurements also replicated measurements from a reference monitor well, with accuracy metrics for R2 of 0.77–0.87, slope of 0.99 to 1.15, intercept of −1.2 to −0.15, and error biases below the recommended limits for low-cost sensors; values for RMSE of 2.85 to 5.2 µg m−3 and NRMSE of 0.02 % to 0.03 % were based on the routinely used US EPA guidelines. The sensors also showed a strong correlation with the PurpleAir sensor, with an average R2 value of 0.88 and an error bias (RMSE) of 2.9 µg m−3. The performance of Atmotube PRO sensors was also observed to have deteriorated at higher PM2.5 concentrations and improved at a coarser temporal resolution. Out of the eight Atmotube PRO sensors used for the assessment, one sensor showed poorer performance with an r value range of 0.57–0.59, while the other sensors reported values were above 0.9. The overall performance of the eight Atmotube PRO sensors used for the collocation study is summarized in Table 3. This study observed a precision uncertainty (SD) of 8.8 µg m−3 and an accuracy (RMSE) error of 3.7 ± 0.8 µg m−3 for hourly Atmotube PRO PM2.5 data, and the chance of having a less reliable sensor in a group of sensors is ∼ 10 % (12.5 % as the case in this study). Overall, this information is useful for local monitoring or citizen science use. Calibrations using a multiple linear regression model improved the performance of Atmotube PRO sensors. R2 improved from 0.86 to 0.88, and RMSE decreased from 3.38 to 3.05 µg m−3 when accounting for RH values. Future work may look at using multiple models in a longer-term collocation study and in multiple collocation sites to achieve more robust calibration. It is worthwhile to note that Atmotube PRO sensors (used for both static and non-static PM2.5 measurements) are not “plug and play” as they require close monitoring and frequent downloading of the data to achieve good data recovery.
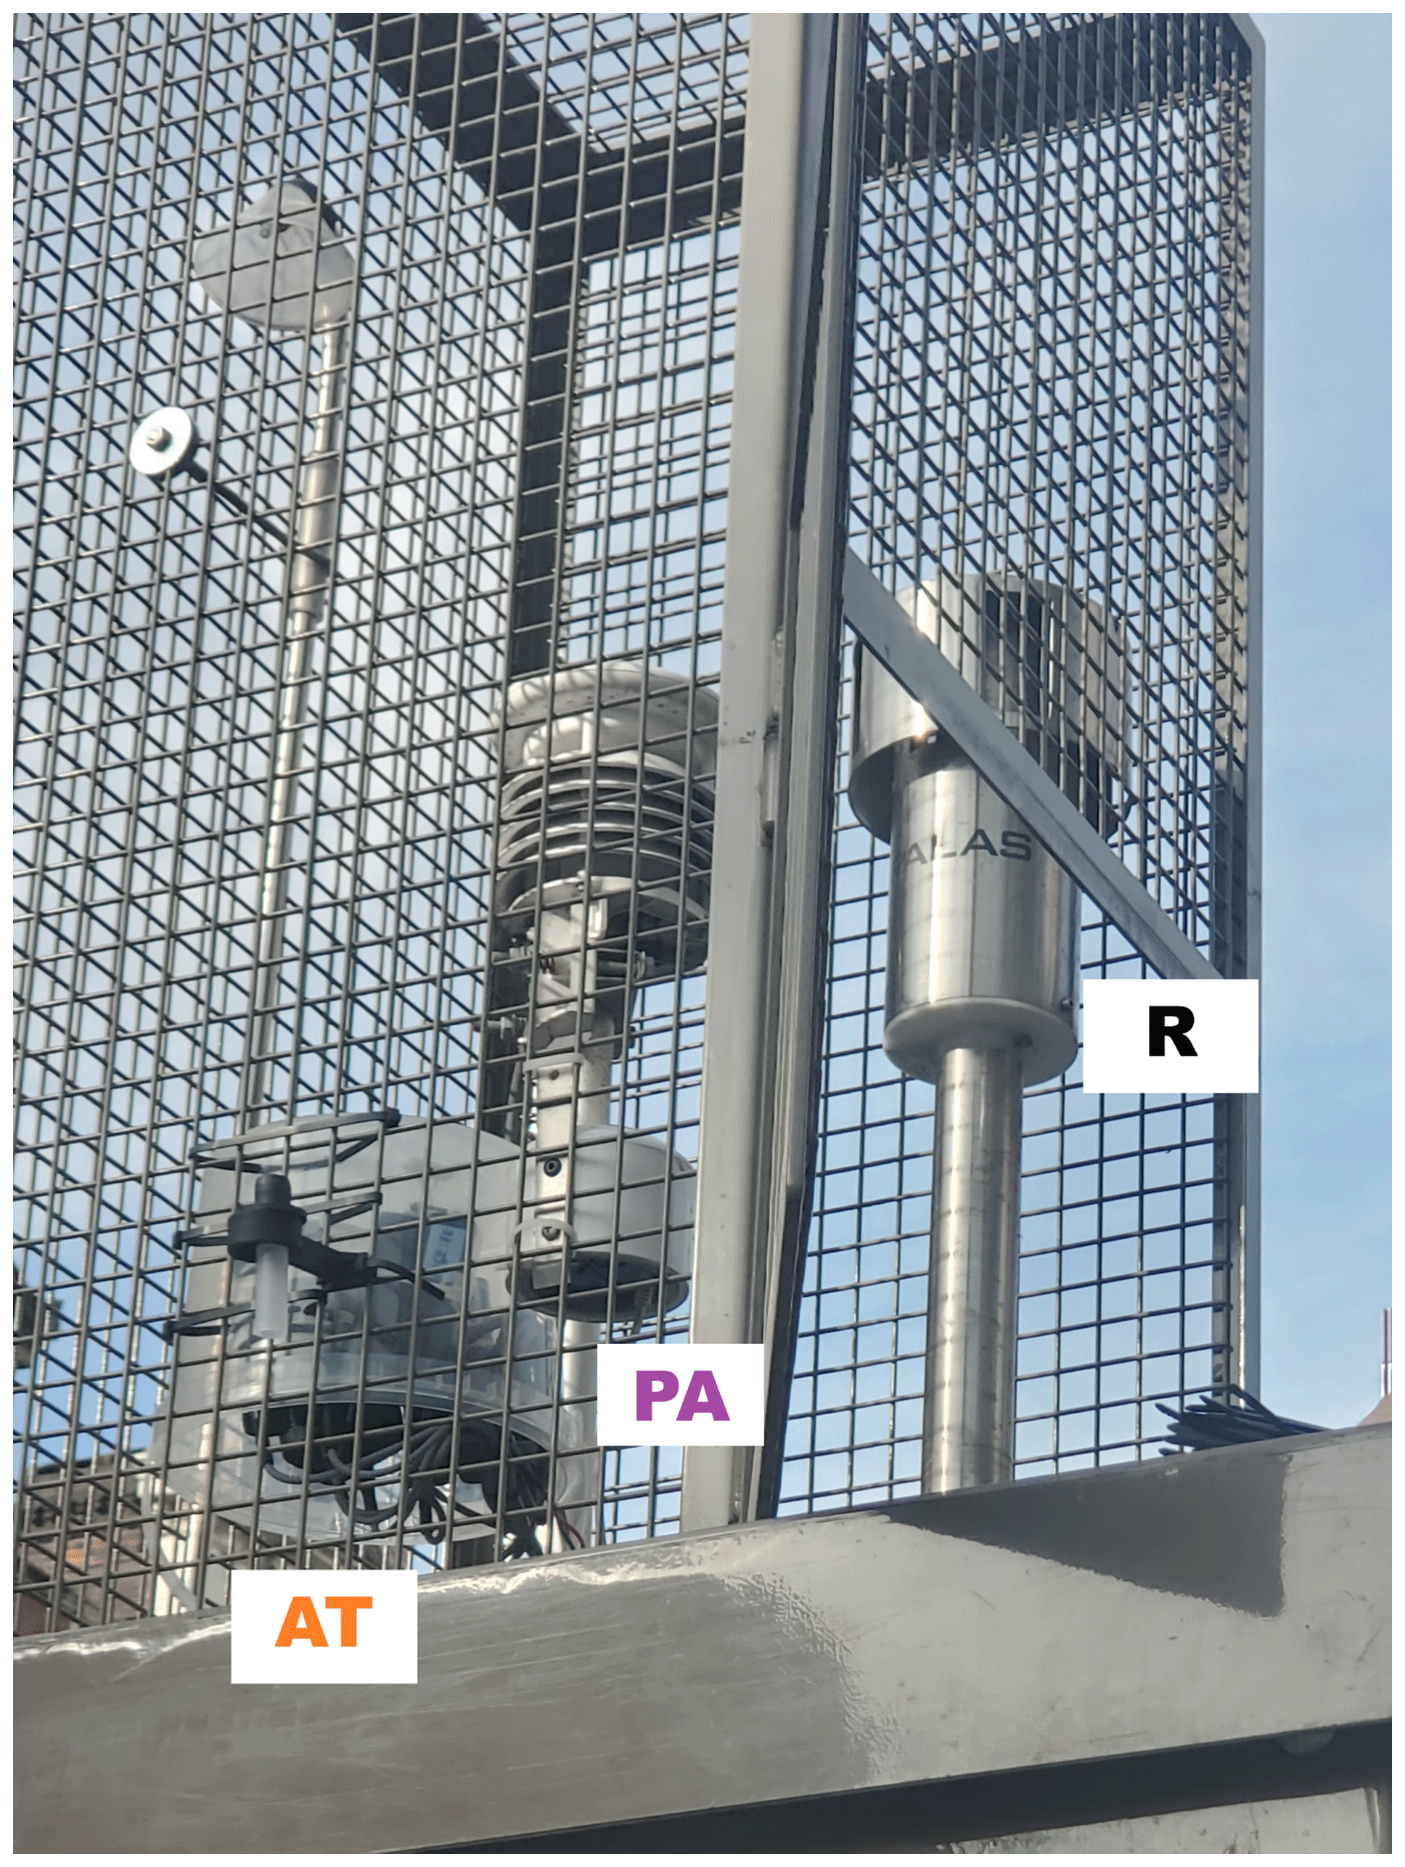
Figure A1Collocation site. AT: Atmotube PRO sensors in a makeshift rain cover, PA: PurpleAir sensor, R: reference Fidas monitor inlet.
The data downloaded from the Atmotube PRO sensors, data from the Fidas sensor (reference), and PurpleAir sensor data collected from Leeds City Council used for the analysis have been uploaded to Zenodo and can be accessed via https://doi.org/10.5281/zenodo.11059054 (Shittu et al., 2024).
AIS undertook the research study and prepared the manuscript with contributions from all co-authors.
The contact author has declared that none of the authors has any competing interests.
Publisher’s note: Copernicus Publications remains neutral with regard to jurisdictional claims made in the text, published maps, institutional affiliations, or any other geographical representation in this paper. While Copernicus Publications makes every effort to include appropriate place names, the final responsibility lies with the authors.
This work is funded by the Tertiary Education Trust Fund (TETFund) of Nigeria through a postgraduate research scholarship for Aishah I. Shittu (award reference number TETF/ES/POLY/ILARO/TSAS/2020). We thank Richard Crowther (Leeds City Council) for providing access to the data used for reference comparison and granting permission for the collocation of sensors at their air quality monitoring site. We express our gratitude to the Born in Bradford (BiB Breathes) project for providing the Atmotube PRO sensors used for this research. Ben Silver provided valuable advice throughout the project.
This research has been supported by the Natural Environment Research Council (grant no. NE/T010401/1), the National Centre for Earth Observation (NCEO) (grant no. NE/R016518/1), and the National Institute for Health and Care Research (grant no. NIHR128833) and TETFund (award reference number TETF/ES/POLY/ILARO/TSAS/2020).
This paper was edited by Albert Presto and reviewed by two anonymous referees.
Alfano, B., Barretta, L., Del Giudice, A., De Vito, S., Di Francia, G., Esposito, E., Formisano, F., Massera, E., Miglietta, M. L., and Polichetti, T.: A Review of Low-Cost Particulate Matter Sensors from the Developers' Perspectives, Sensors, 20, 6819, https://doi.org/10.3390/s20236819, 2020.
AQMD: Field Evaluation Atmotube Pro, Air Quality Sensor performance Evaluation Centre, https://www.aqmd.gov/aq-spec (last access: 30 January 2025), 2020.
Atmotube: Atmotube Technical Specifications, https://atmotube.com/atmotube-support/atmotube-technical-specification (last access: 24 July 2023), 2023.
Badura, M., Batog, P., Drzeniecka-Osiadacz, A., and Modzel, P.: Regression methods in the calibration of low-cost sensors for ambient particulate matter measurements, SN (Springer) Appl. Sci., 1, 622, https://doi.org/10.1007/s42452-019-0630-1, 2019.
Barkjohn, K. K., Gantt, B., and Clements, A. L.: Development and application of a United States-wide correction for PM2.5 data collected with the PurpleAir sensor, Atmos. Meas. Tech., 14, 4617–4637, https://doi.org/10.5194/amt-14-4617-2021, 2021.
Barkjohn, K. K., Holder, A. L., Frederick, S. G., and Clements, A. L.: Correction and Accuracy of PurpleAir PM2.5 Measurements for Extreme Wildfire Smoke, Sensors, 22, 9669, https://doi.org/10.3390/s22249669, 2022.
Borghi, F., Spinazzè, A., Rovelli, S., Campagnolo, D., Del Buono, L., Cattaneo, A., and Cavallo, D.: Miniaturized Monitors for Assessment of Exposure to Air Pollutants: A Review, IJERPH, 14, 909, https://doi.org/10.3390/ijerph14080909, 2017.
Bousiotis, D., Allison, G., Beddows, D. C. S., Harrison, R. M., and Pope, F. D.: Towards comprehensive air quality management using low-cost sensors for pollution source apportionment, Clim. Atmos. Sci., 6, 122, https://doi.org/10.1038/s41612-023-00424-0, 2023.
Bulot, F. M. J., Johnston, S. J., Basford, P. J., Easton, N. H. C., Apetroaie-Cristea, M., Foster, G. L., Morris, A. K. R., Cox, S. J., and Loxham, M.: Long-term field comparison of multiple low-cost particulate matter sensors in an outdoor urban environment, Sci. Rep., 9, 7497, https://doi.org/10.1038/s41598-019-43716-3, 2019.
Carvlin, G. N., Lugo, H., Olmedo, L., Bejarano, E., Wilkie, A., Meltzer, D., Wong, M., King, G., Northcross, A., Jerrett, M., English, P. B., Hammond, D., and Seto, E.: Development and field validation of a community-engaged particulate matter air quality monitoring network in Imperial, California, USA, J. Air Waste Manage. Assoc., 67, 1342–1352, https://doi.org/10.1080/10962247.2017.1369471, 2017.
Chatzidiakou, L., Krause, A., Popoola, O. A. M., Di Antonio, A., Kellaway, M., Han, Y., Squires, F. A., Wang, T., Zhang, H., Wang, Q., Fan, Y., Chen, S., Hu, M., Quint, J. K., Barratt, B., Kelly, F. J., Zhu, T., and Jones, R. L.: Characterising low-cost sensors in highly portable platforms to quantify personal exposure in diverse environments, Atmos. Meas. Tech., 12, 4643–4657, https://doi.org/10.5194/amt-12-4643-2019, 2019.
Diez, S., Lacy, S., Coe, H., Urquiza, J., Priestman, M., Flynn, M., Marsden, N., Martin, N. A., Gillott, S., Bannan, T., and Edwards, P. M.: Long-term evaluation of commercial air quality sensors: an overview from the QUANT (Quantification of Utility of Atmospheric Network Technologies) study, Atmos. Meas. Tech., 17, 3809–3827, https://doi.org/10.5194/amt-17-3809-2024, 2024.
Duvall, Clements, A., Hagler, G., Kamal, A., Kilaru, V., Goodman, L., and Frederick, S.: Performance testing Protocols, Metrics, and Target Values for Fine Particulate Matter Air Sensors, US Environmental Protection Agency, Office of Research and Development, 79, https://cfpub.epa.gov/si/si_public_record_Report.cfm?dirEntryId=350785&Lab=CEMM (last access: 11 February 2025), 2021.
Feenstra, B., Papapostolou, V., Hasheminassab, S., Zhang, H., Boghossian, B. D., Cocker, D., and Polidori, A.: Performance evaluation of twelve low-cost PM2.5 sensors at an ambient air monitoring site, Atmos. Environ., 216, 116946, https://doi.org/10.1016/j.atmosenv.2019.116946, 2019.
FIDAS: Fidas 200, Fidas System, https://www.palas.de/en/product/fidas200 (last access: 6 February 2024), 2024.
Giordano, M. R., Malings, C., Pandis, S. N., Presto, A. A., McNeill, V. F., Westervelt, D. M., Beekmann, M., and Subramanian, R.: From low-cost sensors to high-quality data: A summary of challenges and best practices for effectively calibrating low-cost particulate matter mass sensors, J. Aerosol Sci., 158, 105833, https://doi.org/10.1016/j.jaerosci.2021.105833, 2021.
Hagan, D. H. and Kroll, J. H.: Assessing the accuracy of low-cost optical particle sensors using a physics-based approach, Atmos. Meas. Tech., 13, 6343–6355, https://doi.org/10.5194/amt-13-6343-2020, 2020.
Hagan, D. H., Gani, S., Bhandari, S., Patel, K., Habib, G., Apte, J. S., Hildebrandt Ruiz, L., and Kroll, J. H.: Inferring Aerosol Sources from Low-Cost Air Quality Sensor Measurements: A Case Study in Delhi, India, Environ. Sci. Technol. Lett., 6, 467–472, https://doi.org/10.1021/acs.estlett.9b00393, 2019.
Hong, G.-H., Le, T.-C., Tu, J.-W., Wang, C., Chang, S.-C., Yu, J.-Y., Lin, G.-Y., Aggarwal, S. G., and Tsai, C.-J.: Long-term evaluation and calibration of three types of low-cost PM2.5 sensors at different air quality monitoring stations, J. Aerosol Sci., 157, 105829, https://doi.org/10.1016/j.jaerosci.2021.105829, 2021.
Jovašević-Stojanović, M., Bartonova, A., Topalović, D., Lazović, I., Pokrić, B., and Ristovski, Z.: On the use of small and cheaper sensors and devices for indicative citizen-based monitoring of respirable particulate matter, Environ. Pollut., 206, 696–704, https://doi.org/10.1016/j.envpol.2015.08.035, 2015.
Kang, Y., Aye, L., Ngo, T. D., and Zhou, J.: Performance evaluation of low-cost air quality sensors: A review, Sci. Total Environ., 818, 151769, https://doi.org/10.1016/j.scitotenv.2021.151769, 2022.
Karaoghlanian, N., Noureddine, B., Saliba, N., Shihadeh, A., and Lakkis, I.: Low cost air quality sensors “PurpleAir” calibration and inter-calibration dataset in the context of Beirut, Lebanon, Data Brief, 41, 108008, https://doi.org/10.1016/j.dib.2022.108008, 2022.
Keswani, A., Akselrod, H., and Anenberg, S. C.: Health and Clinical Impacts of Air Pollution and Linkages with Climate Change, NEJM Evidence, 1, 7, https://doi.org/10.1056/EVIDra2200068, 2022.
Khreis, H., Cirach, M., Mueller, N., De Hoogh, K., Hoek, G., Nieuwenhuijsen, M. J., and Rojas-Rueda, D.: Outdoor air pollution and the burden of childhood asthma across Europe, Eur. Respir. J., 54, 1802194, https://doi.org/10.1183/13993003.02194-2018, 2019.
Liu, Y., Paciorek, C. J., and Koutrakis, P.: Estimating Regional Spatial and Temporal Variability of PM 2.5 Concentrations Using Satellite Data, Meteorology, and Land Use Information, Environ. Health Perspect, 117, 886–892, https://doi.org/10.1289/ehp.0800123, 2009.
Malings, C., Tanzer, R., Hauryliuk, A., Kumar, S. P. N., Zimmerman, N., Kara, L. B., Presto, A. A., and R. Subramanian: Development of a general calibration model and long-term performance evaluation of low-cost sensors for air pollutant gas monitoring, Atmos. Meas. Tech., 12, 903–920, https://doi.org/10.5194/amt-12-903-2019, 2019.
Malings, C., Tanzer, R., Hauryliuk, A., Saha, P. K., Robinson, A. L., Presto, A. A., and Subramanian, R.: Fine particle mass monitoring with low-cost sensors: Corrections and long-term performance evaluation, Aerosol Sci. Technol., 54, 160–174, https://doi.org/10.1080/02786826.2019.1623863, 2020.
Mansourian, M., Javanmard, S., Poursafa, P., and Kelishadi, R.: Air pollution and hospitalization for respiratory diseases among children in Isfahan, Iran, Ghana Med. J., 44, https://doi.org/10.4314/gmj.v44i4.68906, 2011.
Masri, S., Rea, J., and Wu, J.: Use of Low-Cost Sensors to Characterize Occupational Exposure to PM2.5 Concentrations Inside an Industrial Facility in Santa Ana, CA: Results from a Worker- and Community-Led Pilot Study, Atmosphere, 13, 722, https://doi.org/10.3390/atmos13050722, 2022.
Masri, S., Flores, L., Rea, J., and Wu, J.: Race and Street-Level Firework Legalization as Primary Determinants of July 4th Air Pollution across Southern California, Atmosphere, 14, 401, https://doi.org/10.3390/atmos14020401, 2023.
Maynard, R., Carare, R., Grigg, J., Fox, N., Love, S., Mudway, I., Shaddick, G., Delgado-Saborit, J. M., Guercio, V., Earl, N., Mitsakou, C., Doutsi, A., Exley, K., Robertson, S., Douglas, P., and Gowers, A.: 53 Cognitive Decline, Dementia and Air Pollution: A Report by the Committee on the Medical Effects of Air Pollutants, Ann. Work Exp. Health, 67, i80–i81, https://doi.org/10.1093/annweh/wxac087.196, 2023.
Molina Rueda, E., Carter, E., L'Orange, C., and Volkens, J.: Size-Resolved Fiels Performance of Low-Cost sensors for Particulate Matter Air Pollution, Environ. Sci. Technol. Lett., 10, 247–253, https://doi.org/10.1021/acs.estlett.3c00030, 2023.
Morawska, L., Thai, P. K., Liu, X., Asumadu-Sakyi, A., Ayoko, G., Bartonova, A., Bedini, A., Chai, F., Christensen, B., Dunbabin, M., Gao, J., Hagler, G. S. W., Jayaratne, R., Kumar, P., Lau, A. K. H., Louie, P. K. K., Mazaheri, M., Ning, Z., Motta, N., Mullins, B., Rahman, M. M., Ristovski, Z., Shafiei, M., Tjondronegoro, D., Westerdahl, D., and Williams, R.: Applications of low-cost sensing technologies for air quality monitoring and exposure assessment: How far have they gone?, Environ. Int., 116, 286–299, https://doi.org/10.1016/j.envint.2018.04.018, 2018.
Pawar, H. and Sinha, B.: Humidity, density, and inlet aspiration efficiency correction improve accuracy of a low-cost sensor during field calibration at a suburban site in the North-Western Indo-Gangetic plain (NW-IGP), Aerosol Sci. Technol., 54, 685–703, https://doi.org/10.1080/02786826.2020.1719971, 2020.
Polidori, A., Papapostolou, V., Feenstra, B., and Zhang, H.: Air Quality Sensor Performance Evaluation Center – Field Evaluation of Low-Cost Air Quality Sensors, 11 pp., 2017.
Pope, F., Bousiotis, D., Beddows, D., and Allison, G.: Low cost source apportionment of urban air pollution, EGU General Assembly 2022, Vienna, Austria, 23–27 May 2022, EGU22-4361, https://doi.org/10.5194/egusphere-egu22-4361, 2022.
Raheja, G., Nimo, J., Appoh, E. K.-E., Essien, B., Sunu, M., Nyante, J., Amegah, M., Quansah, R., Arku, R. E., Penn, S. L., Giordano, M. R., Zheng, Z., Jack, D., Chillrud, S., Amegah, K., Subramanian, R., Pinder, R., Appah-Sampong, E., Tetteh, E. N., Borketey, M. A., Hughes, A. F., and Westervelt, D. M.: Low-Cost Sensor Performance Intercomparison, Correction Factor Development, and 2+ Years of Ambient PM2.5 Monitoring in Accra, Ghana, Environ. Sci. Technol., 57, 10708–10720, https://doi.org/10.1021/acs.est.2c09264, 2023.
Rai, A. C., Kumar, P., Pilla, F., Skouloudis, A. N., Di Sabatino, S., Ratti, C., Yasar, A., and Rickerby, D.: End-user perspective of low-cost sensors for outdoor air pollution monitoring, Sci. Total Environ., 607–608, 691–705, https://doi.org/10.1016/j.scitotenv.2017.06.266, 2017.
Shittu, A., Pringle, K., Arnold, S., Pope, R., Graham, A., Reddington, C., Rigby, R., and McQuaid, J.: Sensor data with reference, Zenodo [data set], https://doi.org/10.5281/zenodo.11059054, 2024.
Sousan, S., Koehler, K., Hallett, L., and Peters, T. M.: Evaluation of consumer monitors to measure particulate matter, J. Aerosol Sci., 107, 123–133, https://doi.org/10.1016/j.jaerosci.2017.02.013, 2017.
Voultsidis, D., Gialelis, J., Protopsaltis, G., Bali, N., and Mountzouris, C.: Utilizing Unobtrusive Portable Electronic Devices for Real-Time Assessment of Indoor PM2.5 and tVOC Exposure and Its Correlation with Heart Rate Variability, Proc. Comput. Sci., 224, 550–557, https://doi.org/10.1016/j.procs.2023.09.080, 2023.
Wang, X., Zhou, H., Arnott, W. P., Meyer, M. E., Taylor, S., Firouzkouhi, H., Moosmüller, H., Chow, J. C., and Watson, J. G.: Evaluation of gas and particle sensors for detecting spacecraft-relevant fire emissions, Fire Safety J., 113, 102977, https://doi.org/10.1016/j.firesaf.2020.102977, 2020.
Westervelt, D. M., Isevulambire, P. K., Yombo Phaka, R., Yang, L. H., Raheja, G., Milly, G., Selenge, J.-L. B., Mulumba, J. P. M., Bousiotis, D., Djibi, B. L., McNeill, V. F., Ng, N. L., Pope, F., Mbela, G. K., and Konde, J. N.: Low-Cost Investigation into Sources of PM2.5 in Kinshasa, Democratic Republic of the Congo, ACS EST Air, 1, 43–51, https://doi.org/10.1021/acsestair.3c00024, 2024.
WHO: WHO global air quality guidelines: particulate matter (PM2.5 and PM10), ozone, nitrogen dioxide, sulfur dioxide and carbon monoxide, WHO European Centre for Environment and Health, Bonn, Germany, https://www.who.int/publications/i/item/9789240034228/ (last access: 30 January 2025), 290 pp., 2021.
Williams, R., Kilaru, V., Snyder, E., Kaufman, A., Dye, T., Rutter, A., Russell, A., and Hafner, H.: Air Sensor Guidebook, US Environmental Protection Agency, EPA/600/R-A4/159, 65 pp., 2014.
Yang, L. H., Hagan, D. H., Rivera-Rios, J. C., Kelp, M. M., Cross, E. S., Peng, Y., Kaiser, J., Williams, L. R., Croteau, P. L., Jayne, J. T., and Ng, N. L.: Investigating the Sources of Urban Air Pollution Using Low-Cost Air Quality Sensors at an Urban Atlanta Site, Environ. Sci. Technol., 56, 7063–7073, https://doi.org/10.1021/acs.est.1c07005, 2022.
Zamora, M. L., Rice, J., and Koehler, K.: One year evaluation of three low-cost PM2.5 monitors, Atmos. Environ., 235, 117615, https://doi.org/10.1016/j.atmosenv.2020.117615, 2020.
Zimmerman, N.: Tutorial: Guidelines for implementing low-cost sensor networks for aerosol monitoring, J. Aerosol Sci., 159, 105872, https://doi.org/10.1016/j.jaerosci.2021.105872, 2022.