the Creative Commons Attribution 4.0 License.
the Creative Commons Attribution 4.0 License.
 | 25 Feb 2025
A global perspective on CO2 satellite observations in high AOD conditions
Anu-Maija Sundström
Elli Suhonen
Antti Lipponen
Antti Arola
Christopher O'Dell
Robert R. Nelson
Hannakaisa Lindqvist
Satellite-based observations of carbon dioxide (CO2) are sensitive to all processes that affect the propagation of radiation in the atmosphere, including scattering and absorption by atmospheric aerosols. Therefore, accurate retrievals of column-averaged CO2 (XCO2) benefit from detailed information on the aerosol conditions. This is particularly relevant for future missions focusing on observing anthropogenic CO2 emissions, such as the Copernicus Anthropogenic CO2 Monitoring mission (CO2M). To fully prepare for CO2M observations, it is informative to investigate existing observations in addition to other approaches. Our focus here is on observations from the NASA Orbiting Carbon Observatory-2 (OCO-2) mission. In the operational full-physics XCO2 retrieval used to generate OCO-2 level 2 products, the aerosol properties are known to have high uncertainty, but their main objective is to facilitate CO2 retrievals. We evaluate the OCO-2 product from the point of view of aerosols by comparing the OCO-2-retrieved aerosol properties to collocated Moderate Resolution Imaging Spectroradiometer (MODIS) Aqua Dark Target aerosol products. We find that there is a systematic difference between the aerosol optical depth (AOD, τ) values retrieved by the two instruments such that . A similar difference is found when comparing OCO-2 with the Aerosol Robotic Network (AERONET). This results in 16.5 % of cases being misclassified as low AOD (good quality) by the OCO-2 quality filtering. We also find a dependence of the XCO2 on the AOD difference, indicating an aerosol-induced effect in the XCO2 retrieval. Furthermore, comparing with the Total Carbon Column Observing Network (TCCON), we find a small AOD-dependent bias in XCO2. In addition, we find a weak but statistically significant correlation between MODIS AOD and XCO2, which can be partly explained by natural covariance and co-emission of aerosols and CO2. Due to the co-emission, using an AOD threshold in the quality filtering leads to a sampling bias, where high XCO2 values are more often removed. To mitigate the effect of this on the anthropogenic CO2 emission monitoring, we investigate the effect of the AOD threshold on the fraction of acceptable XCO2 data. We find that relaxing the MODIS AOD threshold from 0.2 to 0.5, which is the goal for the CO2M, increases the fraction of acceptable data by 14 percentage points globally and by 31 percentage points for urban areas.
- Article
(17554 KB) - Full-text XML
- BibTeX
- EndNote


Anthropogenic emissions of carbon dioxide (CO2) will be monitored operationally in this decade using atmospheric measurements to support the Global Stocktake and provide independent information for tracking national emission reductions outlined in the Paris Agreement (Janssens-Maenhout et al., 2020). While ground-based greenhouse gas measurements are mainly available in developed countries – with limited coverage and representativeness – satellite-based XCO2 information will be irreplaceable in areas where ground-based measurements are not made. An essential monitoring component will be the Copernicus Anthropogenic CO2 Monitoring Mission (CO2M; Meijer et al., 2023). The key purpose of the observations is to provide means for an independent verification of nationally reported emissions, and therefore the focus and the challenge of CO2M will be to make accurate and precise observations of anthropogenically polluted environments.
The existing satellite XCO2 products from JAXA's Greenhouse Gases Observing Satellite (GOSAT; Yokota et al., 2009), NASA's Orbiting Carbon Observatory-2 (OCO-2; Crisp et al., 2004), and the Chinese TanSat (Yang et al., 2018) are focused on global CO2 observations and have been developed to inform flux inversion models for quantifying the large-scale sources and sinks of CO2 (e.g., Houweling et al., 2015; Crowell et al., 2019). In assimilating satellite data to inverse model systems, the reliability of data has been preferred at the cost of not achieving full global coverage; thus, the observations of potentially deteriorated quality are filtered in the post-processing. One of the known factors affecting XCO2 retrieval accuracy and precision is atmospheric aerosol: scattering and absorption by aerosols affect the light path of radiation and complicate the interpretation of the signal (Butz et al., 2009; Guerlet et al., 2013; Connor et al., 2016; Lamminpää et al., 2019; Rusli et al., 2021). Therefore, retrievals made in aerosol-loaded conditions are mostly filtered out (e.g., O'Dell et al., 2018). In the advent of CO2M and other missions targeting anthropogenic signals, the focus of flux estimation is shifting from using satellite data from pristine, aerosol-free scenes to the need to also observe aerosol-contaminated, polluted atmospheres. The goal is to enable reliable quantification of local and regional anthropogenic CO2 emissions, but this poses new challenges for satellite retrievals.
In the NASA Atmospheric CO2 Observations from Space (ACOS) retrieval algorithm for OCO-2 observations, the aerosol properties are retrieved as part of the full-physics retrieval and are known to have high uncertainties, in particular for high aerosol loads (O'Dell et al., 2018). The potential to improve the co-retrieval of aerosols and XCO2 has been emphasized in recent studies (Lamminpää et al., 2019; Sanghavi et al., 2020). A systematic, statistical study on the long data record of OCO-2 observations in quantified aerosol conditions can increase understanding of the potential aerosol effects on CO2 retrievals and support preparations for the CO2M observations. Reliable information on atmospheric aerosols can be obtained from ground-based instruments and from satellite-based instruments (and algorithms) specialized to detect aerosols, such as the Moderate Resolution Imaging Spectroradiometer (MODIS; Levy and Hsu, 2015). In the latter case, the favorable orbital configuration of OCO-2 and Aqua satellites as part of the A-train constellation ensures optimal coverage for collocated observations. This enables an expansion of the evaluation beyond the traditional approaches that are centered around ground-based validation sites (e.g., the Total Carbon Column Observing Network, TCCON; Wunch et al., 2011) from which only a small fraction represent an urban environment.
In this paper, we evaluate the OCO-2 level 2 product from the point of view of aerosols by comparing the OCO-2-estimated aerosol properties to the MODIS/Aqua Dark Target aerosol product. We study how well the current ACOS quality filtering works in different aerosol conditions, focusing in particular on heavy aerosol conditions and urban environments. The focus of this paper is on the statistical analysis of a global multiyear dataset. For complementarity, we also use all available TCCON data as a subset of the study and to estimate aerosol and CO2 co-emission.
2.1 OCO-2
NASA's Orbiting Carbon Observatory-2 (OCO-2) is an atmospheric carbon dioxide (CO2) observing mission with a diffraction-grating spectrometer on board a polar-orbiting satellite. OCO-2 makes passive observations of backscattered solar radiation in the near-infrared and shortwave infrared wavelengths. It has a ground pixel size of approximately 1 km × 2 km and covers a swath width of 10 km, with a 16 d revisit time.
We use OCO-2 daily Lite files (V10r) (OCO-2 Science Team et al., 2020), produced by the OCO-2 project at the Jet Propulsion Laboratory, California Institute of Technology, and obtained from the OCO-2 data archive maintained at the NASA Goddard Earth Science Data and Information Services Center (O'Dell et al., 2018; Wunch et al., 2017; Taylor et al., 2023). The aerosol parameters of the ACOS algorithm include five scatterers, which are two cloud types (water and ice), two tropospheric aerosol types, and a stratospheric aerosol type (sulfate). The two most representative types of tropospheric aerosols out of five possible types (dust, sea salt, sulfate aerosol, organic carbon, and black carbon) are drawn from collocated 3-hourly aerosol fields from the Goddard Earth Observing System Model, Version 5, Forward Processing for Instrument Teams (GEOS-5 FP-IT; see Crisp et al., 2021). From the large number of data products provided by the ACOS Level 2 full-physics (L2FP) retrieval algorithm, we use mainly the estimates of the CO2 column-averaged dry-air mole fraction (XCO2), the total aerosol optical depth (AOD) values, and the XCO2 quality flag.
2.2 MODIS
We use the level 2 (L2) Moderate Resolution Imaging Spectroradiometer (MODIS) Collection 6.1 atmospheric aerosol product from the Aqua platform (MYD04_L2) as reference aerosol data (Levy and Hsu, 2015). The MODIS Dark Target (DT) algorithm (Levy et al., 2013) is available over ocean and dark (e.g., vegetated) land surfaces, while MODIS Deep Blue (DB) (Hsu et al., 2004) covers land areas including bright surfaces. As we are mainly interested in the effect of aerosols on XCO2 over urban areas, we concentrate on MODIS retrievals over land surfaces and use mainly the 10 km MODIS DT product over land; results for DB are shown in Appendix A. While the global aerosol optical depth (AOD) patterns are somewhat different between DT and DB, we find that the global statistics and conclusions regarding the connection to XCO2 retrievals are largely the same. Collocation with the higher-spatial-resolution MODIS 3 km aerosol product (MYD04_3K; Remer et al., 2013) was tested for 1 year (2018). The results did not differ significantly from the corresponding subset when using the 10 km DT product (not shown). Due to the considerably larger computational burden of the 3 km data, the full dataset was processed only with the 10 km product. Previous studies have shown that the 3 and 10 km products perform very similarly on the global scale (Gupta et al., 2018; He et al., 2017). For more detailed case studies the use of the MODIS 3 km product could be beneficial, but that is beyond the scope of this exercise.
Both Aqua and OCO-2 are in the A-train satellite constellation following similar orbital tracks, allowing fair collocation between the instruments. MODIS data used in this study were obtained from the NASA Level 1 and Atmosphere Archive and Distribution System Distributed Active Archive Center (LAADS DAAC) (LAADS-DAAC, 2024). A total of 5 years of data from 2015 to 2019 were processed. Due to the large size of the original MODIS L2 aerosol data, the data were pre-processed before collocating with OCO-2 data to create daily files which contain a reduced number of original data fields and cloud-screened pixels only. The MODIS quality flag was applied to remove the poor-quality pixels (MODIS quality flag 0). We also tested using more stringent quality filtering, keeping only the best-quality MODIS data (quality flag 3). Although this reduced the number of matches with OCO-2 by nearly 30 % and reduced the global average AOD by 0.02, it did not affect the conclusions of our work. Note that the MODIS quality flag is systematically applied throughout the results in this paper, while the use of the OCO-2 quality flag varies. In the rest of the paper, when the use of quality flag or quality filtering is discussed, this refers to the OCO-2 quality flag.
2.3 TCCON
For ground-based reference XCO2 measurements, we employ the Total Carbon Column Observing Network (TCCON), which consists of high-resolution Fourier transform spectrometers that make observations of direct sunlight in the near-infrared wavelengths. TCCON provides precise and accurate retrievals of the total column CO2 abundance (Wunch et al., 2011). In this study, we use data from 26 TCCON stations to quantify the AOD dependence of XCO2 (Table A4).
2.4 AERONET
The Aerosol Robotic Network (AERONET) is used as ground-based reference data for AOD. AERONET is a network of over 600 stations (currently) using standardized methodology and equipment to measure aerosol optical, microphysical, and radiative properties (Holben et al., 1998). The AERONET sun photometer measurements are routinely used as reference measurements for satellite aerosol retrievals due to their high accuracy (absolute error in AOD of the order of 0.01–0.02; Eck et al., 1999; Sinyuk et al., 2020). In this work we use AERONET Version 3 level 2.0 data at 500, 675, and 870 nm to evaluate the OCO-2 total AOD (Giles et al., 2019). We consider AERONET data collocated with OCO-2 glint and nadir observations for September 2014–February 2023.
3.1 Collocation of MODIS and OCO-2 data
The OCO-2 and MODIS data are collocated using the OCO-2 daily (Lite) files and reduced daily MODIS files. The collocation is done by selecting the nearest MODIS pixel for each OCO-2 pixel within a 0.2° × 0.2° area and within 1 h of the OCO-2 overpass (to remove possible overlapping orbits of the same day at high latitudes). To further reduce the data size, the collocated dataset includes only OCO-2 data points for which a MODIS match is found. This reduces the number of data points to about 14 % of the original OCO-2 data points for the 5 years considered (2015–2019). Table A1 shows the number of original OCO-2 data points and the number of collocated data points with a MODIS match for each year (2015–2019). Using the MODIS DT-land retrieval removes oceans and bright surfaces such as deserts and snow-covered areas, and the MODIS cloud mask and quality filtering may further reduce the number of data points. This reduces the coverage of the collocated dataset with respect to the original OCO-2 data, especially at high latitudes. We note that although both data products are cloud-screened, possible mutual cloud-contaminated pixels can cause erroneous high AOD values, which may affect the obtained correlation coefficients. Figure A1 shows the fraction of OCO-2 pixels with a MODIS match for 1° × 1° grid cells and the fraction of good-quality pixels (OCO-2 quality flag) for the collocated data. The collocated dataset in NetCDF format is available as open data (Virtanen, 2024).
3.2 Collocation with TCCON
OCO-2 v10 XCO2 observations were collocated with TCCON using the following criteria. Spatially, all satellite observations within 1° in latitude and 1.5° in longitude from a given TCCON site were collected, and, for each observation, a corresponding TCCON XCO2 value was assigned as the mean of TCCON XCO2 retrievals within ±60 min from each OCO-2 observation. The effect of different prior profiles in OCO-2 v10 and TCCON retrieval algorithm version GGG2020 (Laughner et al., 2024) was taken into account by adjusting the OCO-2 XCO2 value, following Mendonca et al. (2021). In practice, this adjustment was very small, given the similarity of the prior profiles. The different vertical sensitivity of the TCCON and OCO-2 retrievals was taken into account by adjusting the retrieved, collocated TCCON XCO2 values (Mendonca et al., 2021).
3.3 Collocation with AERONET
Each nadir or glint-mode OCO-2 observation close to an AERONET site is matched with the ground-based observations using the following criteria. Spatial collocation uses a distance threshold of 0.1° around all available AERONET sites and temporal collocation averages AERONET observations within ± 30 min of the satellite overpass. The OCO-2 observations within the 0.1° radius are included in the comparison individually (no spatial averaging). We note that the comparison statistics are typically affected by the spatial and temporal collocation parameters (see, e.g., Virtanen et al., 2018). Different sampling radii and time windows were tested with a subset of data, with minor effects on the results. With the abundance of AERONET sites, we could afford a smaller sampling area than that used for TCCON data. A simple average of AOD values at 675 and 870 nm is used to evaluate the effect of wavelength difference (see Fig. 3). While this simple approach may not be the most accurate, it is sufficiently accurate for our purposes. A more accurate method for the wavelength scaling using the Ångström exponent from AERONET was tested for a subset of data, and we did not find significant differences in the results.
3.4 Aggregation of collocated data
Analyzing collocated data of this size (∼ 10 million points for a year) requires some aggregation before plotting. Two approaches have been applied: (1) data fields are aggregated to an AOD vs. AOD grid; i.e., data points falling in certain MODIS AOD bin and a certain OCO-2 AOD bin are averaged (e.g., Fig. 7). For MODIS, we use AOD at 550 nm and for OCO-2 the total AOD data field. The number of data points in each AOD matrix grid cell is also recorded (e.g., Fig. 4). (2) In the second approach the data are aggregated to a regular lat–long grid (e.g., Fig. 1). Optionally, the OCO-2 quality flag (QF) can be applied in the aggregation, removing low-quality pixels. Aggregation is done using all available collocated data over 5 years (2015–2019).
3.5 Linear trend correction for XCO2
For the multiyear dataset we use a simple detrending of OCO-2 XCO2 values to compensate for the steady increase in CO2 levels in order to focus more on the details of XCO2 variability and possible retrieval biases. A reference date is set at 1 January 2015, and a linear increase of 2.4 ppm yr−1 is assumed and corrected for in the data (10-year global average; NOAA Global Monitoring Laboratory, 2024). We call this process linear trend correction, and when applied to the XCO2 data in this work, we denote this by the abbreviation LTC. While this approach allows meaningful aggregation of XCO2 data over several years, it does not take into account the (spatially varying) seasonal variation of XCO2.
3.6 XCO2 anomaly
The OCO-2 XCO2 anomaly is calculated for each good-quality OCO-2 pixel in the collocated dataset as the difference from a local, temporally varying median value. This median is calculated from the good-quality pixels in the same OCO-2 orbit within 500 km from the pixel considered. The idea is that the yearly increase in CO2 and the seasonal variation are large-spatial-scale effects which are captured by the 500 km portion of an orbit. When the median value is subtracted, the remaining “anomaly” part is assumed to contain information on local sources and sinks, while the trend and seasonal effects are removed. This is an alternative way to de-trend the data, instead of applying the simple LTC. Unlike LTC, the anomaly method also effectively de-seasonalizes the data. It also allows studying the covariance of AOD values and local XCO2 anomalies caused by possible CO2 sources and sinks. While most of the results shown in this work have been processed with the linear trend correction, the corresponding XCO2 anomaly results are also shown where appropriate to support the analysis.
In this section, we explore the relationships and implications of 5 years of global collocated MODIS and OCO-2 data, with a particular focus on how AOD differences impact XCO2 retrievals. We will first consider the differences between collocated MODIS and OCO-2 AOD data to establish the variability in aerosol estimates across different regions (Sect. 4.1). This provides the foundation for understanding how regional variations in AOD influence XCO2 retrievals, particularly in polluted areas.
Building on this, we examine the extent to which high-AOD cases, identified using MODIS, remain in the quality-filtered OCO-2 dataset (Sect. 4.2). This is particularly relevant for urban regions where aerosol and CO2 emissions are correlated, making accurate detection and handling of high-AOD cases essential for reliable monitoring of anthropogenic CO2 emissions. In Sect. 4.3, we explore the statistical relationship between AOD and XCO2 using TCCON data as a reference and considering both real atmospheric co-emission effects and aerosol-induced retrieval biases. In this context, in order to remove the effect of increasing XCO2 values over the 5 years, we apply the simple linear trend correction (LTC) described in the Methods section. As an alternative de-trending option for XCO2 we use anomaly data (see Sect. 3), which is useful in also removing the seasonal effect, ideally preserving local-scale spatial variability.
Finally, Sect. 4.4 examines how using different AOD thresholds for quality filtering impact data coverage, with a focus on the correlation between AOD and CO2 emissions. Since high-AOD cases often correspond to high-CO2-emission regions, limiting retrievals to low AOD introduces a sampling bias by disproportionately removing these high-emission cases. Relaxing the AOD threshold increases coverage, particularly in urban areas, complementing the previous analyses by ensuring a more representative dataset for monitoring anthropogenic CO2 emissions.
4.1 Spatial AOD comparison
Figure 1a shows MODIS DT AOD at 550 nm aggregated to a 1° × 1° lat–long grid for 2015–2019 for quality-filtered collocated data (the MODIS quality flag is always applied; here we use also the OCO-2 quality flag) over land. High-AOD areas due to anthropogenic aerosol emissions are seen in particular in parts of Asia, and elevated aerosol loads due to dust are seen over various desert areas around the globe. MODIS Dark Target observations are not available over bright surfaces such as large deserts and snow-covered areas, which explains the gaps seen on the map. Figure 1b shows the AOD difference between OCO-2 and MODIS. Note that the OCO-2 AOD is retrieved at 755 nm, while the MODIS AOD is obtained at 550 nm; the effect of the wavelength difference will be discussed below. The largest differences in AOD appear to be concentrated largely in the high-AOD areas in parts of Asia, where OCO-2 AOD is lower than MODIS AOD. Also, for several areas with low MODIS AOD, OCO-2 shows higher values (positive AOD difference), e.g., in parts of Brazil and Australia. These positive difference values are related to the MODIS DT algorithm permitting small negative AOD values (Sayer et al., 2014). In short, the negative values mean that the AOD is low, but the exact value is not certain. While the negative values are unphysical, they are kept in the data in order to avoid a positive bias in the data. The AOD difference is also positive for the Sahel region where the MODIS DT values in the collocated dataset are low. The Sahel area is known to have occasional high AOD caused by desert dust. Some of these cases are removed by the OCO-2 quality filtering. The MODIS DT algorithm has lower AOD values compared to the MODIS Deep Blue algorithm in this region. The AOD map and AOD difference map for MODIS DB are shown in Fig. A2. We see that MODIS DB shows higher AOD than OCO-2 more often than MODIS DT. A limited collocation test made with the MODIS 3 km aerosol product for the year 2018 shows slightly enhanced coverage but otherwise very similar AOD patterns as the 10 km DT product.
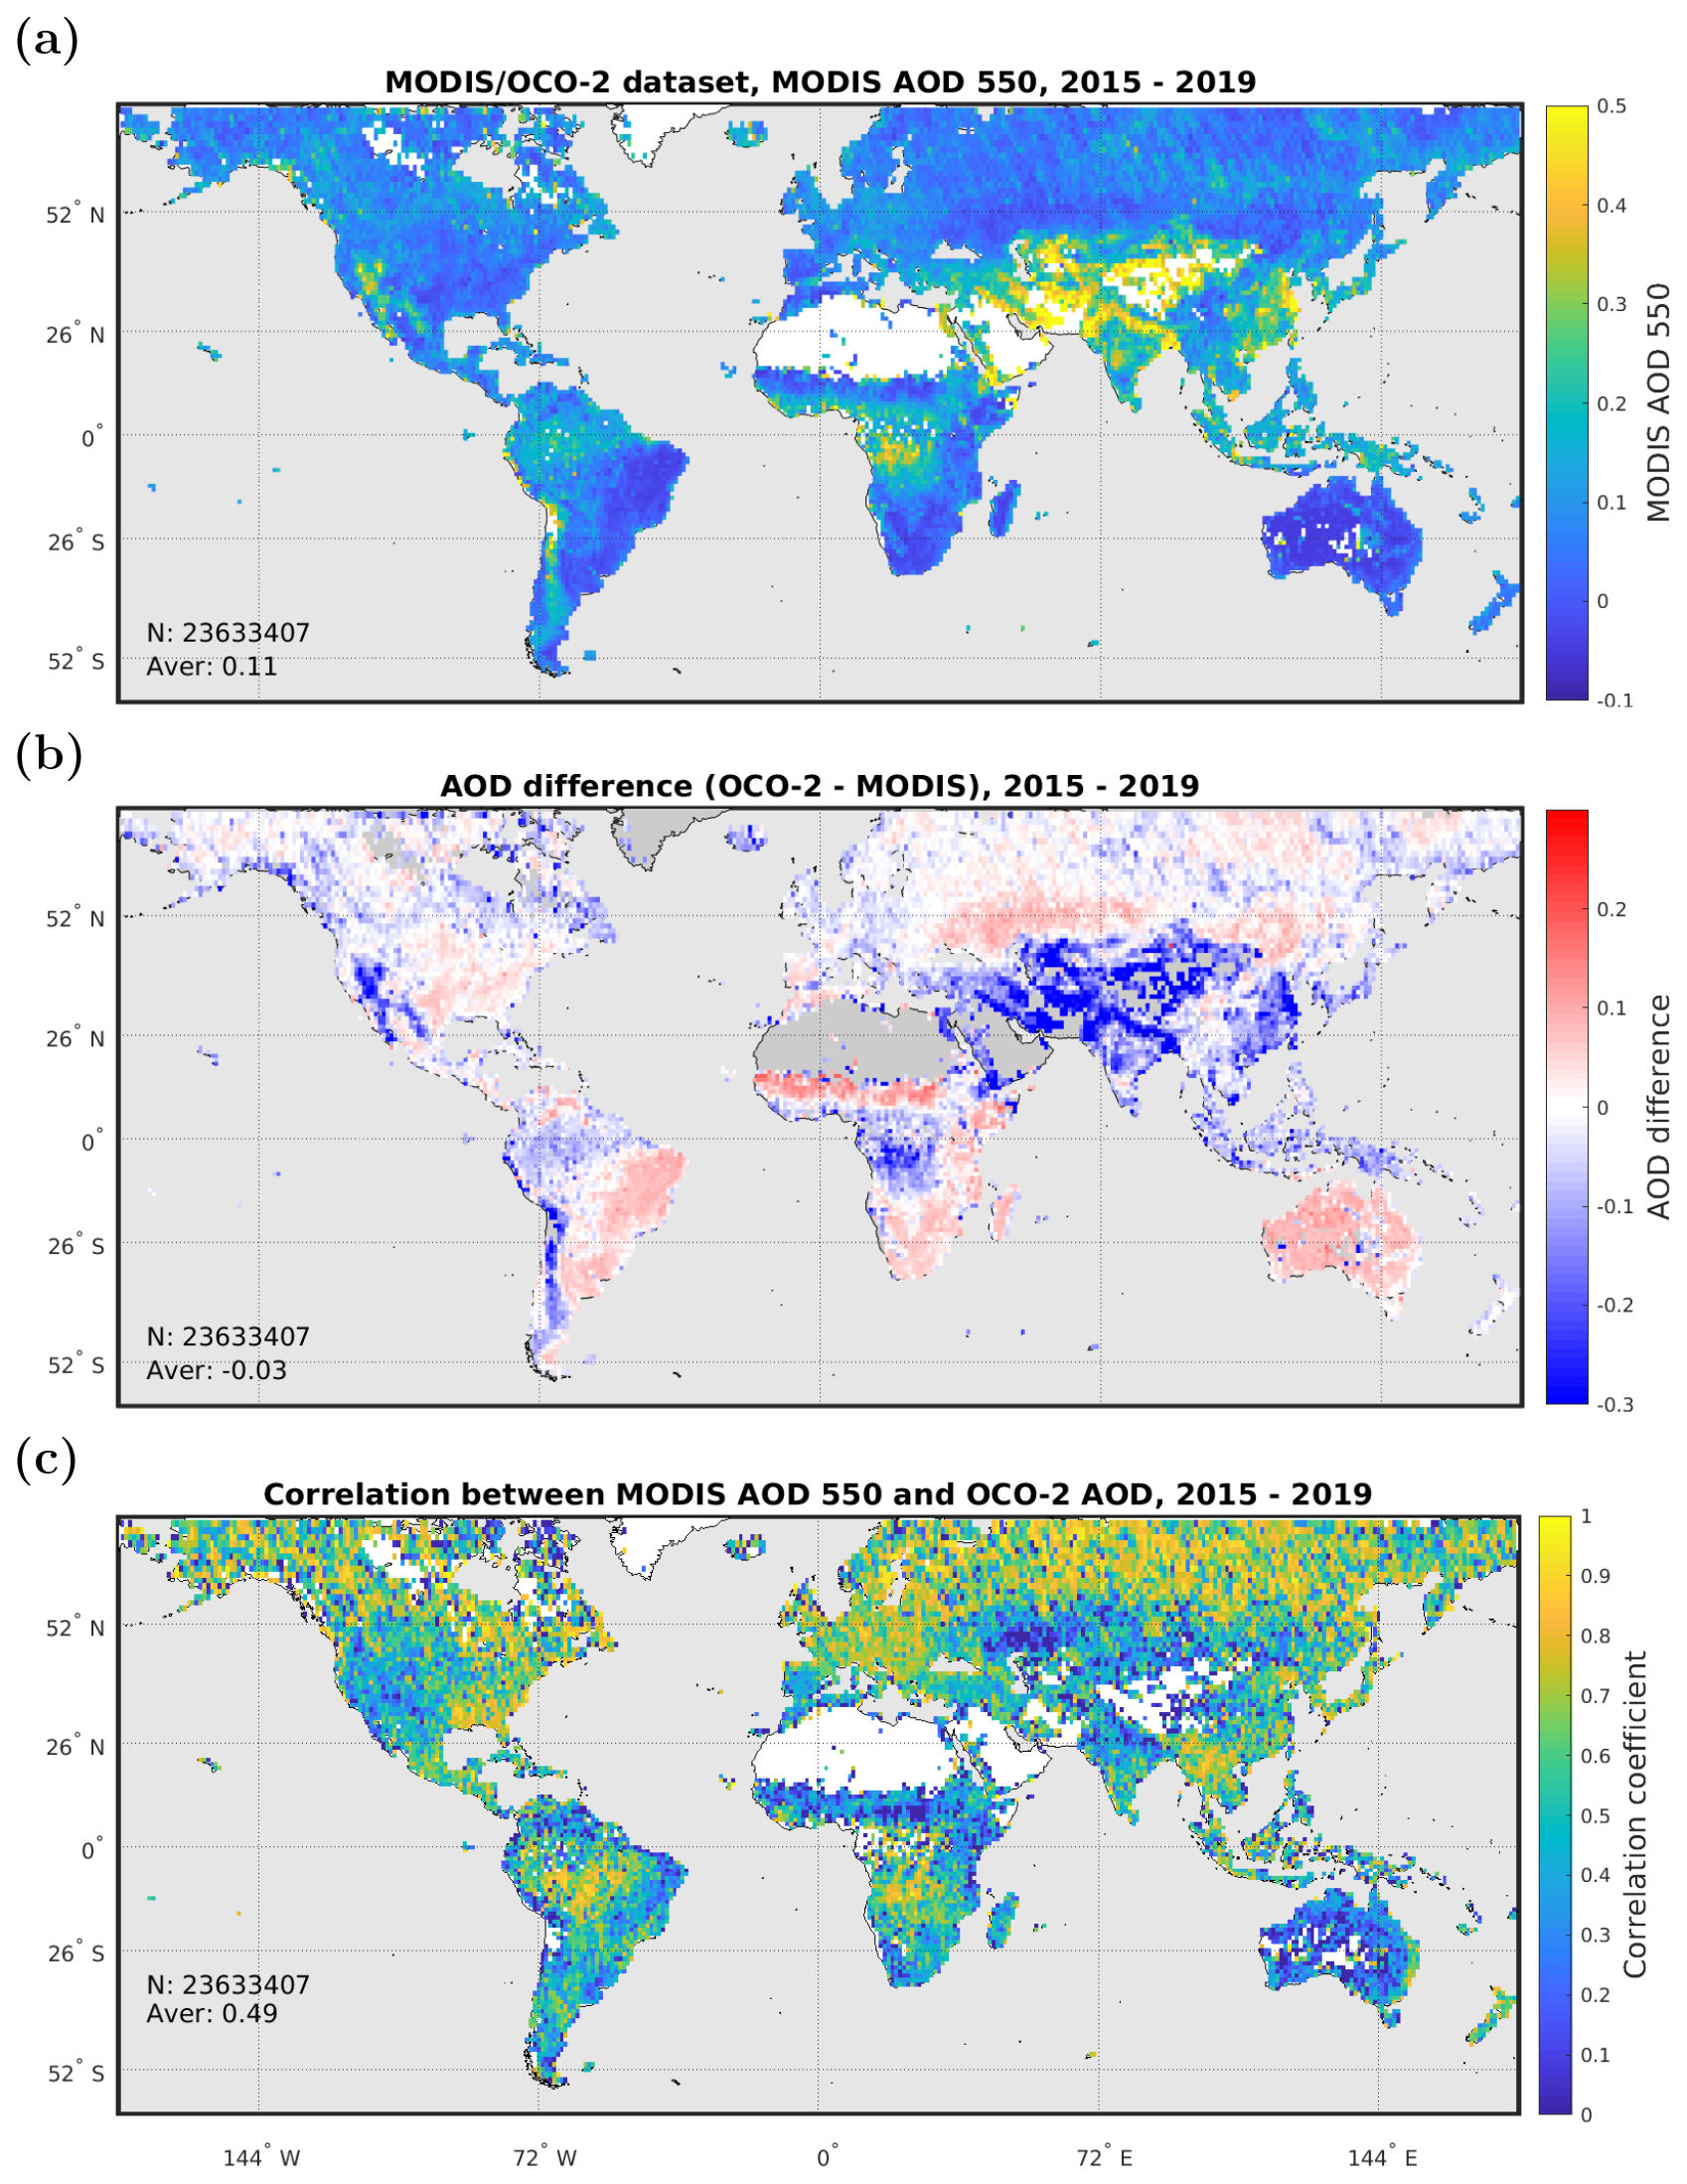
Figure 1Collocated OCO-2 v10 and MODIS/Aqua DT-land dataset 5-year 1° × 1° aggregate maps for quality-filtered data. (a) MODIS AOD at 550 nm. (b) AOD difference (OCO-2 − MODIS). (c) Correlation between MODIS and OCO-2 AOD values for 1° × 1° grid cells.
Figure 1c shows the Pearson correlation coefficient R between MODIS AOD at 550 nm and OCO-2 total AOD for 1° × 1° grid cells for 5 years. The data are rather noisy, but regions with particularly low correlation are seen, including Australia, the Sahel, the western USA, and the arid regions of central Asia. These areas are characterized by bright surfaces, indicating that the surface reflectance treatment in the algorithms might explain some of the differences in AOD. We note that MODIS DB shows roughly similar patterns (Fig. A2c), including low correlation over bright surface areas. Good correlation is observed in Europe, at northern high latitudes, and over tropical rainforests. Figure 2a shows a global time series comparison for MODIS and OCO-2 AODs. The correlation coefficient calculated from monthly temporal bins (R=0.53) is similar to the average spatial correlation in Fig. 1c (R=0.49). We note that possible mutual cloud contamination of collocated data points could lead to erroneous high AOD values for both instruments, possibly leading to higher correlation values than without cloud contamination. However, data from each satellite are cloud-screened with their respective cloud masks, and the vast majority of data are in the low-AOD region, reducing the probability of large bias.
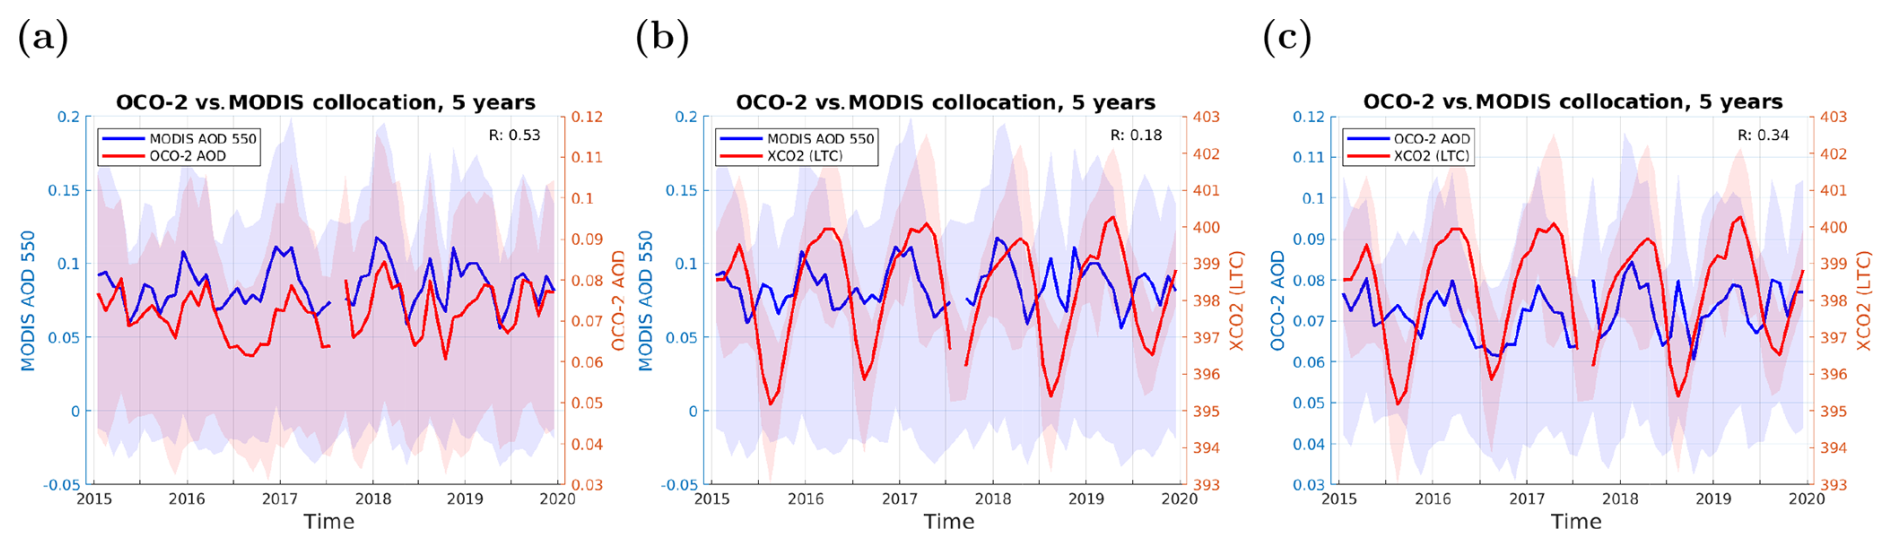
Figure 2Temporal bin plots (3-week mean values) for the global, quality-filtered collocated OCO-2–MODIS dataset. Shaded areas show the interquartile range. Correlation coefficients R are calculated from the temporal bin values. Comparison of (a) MODIS and OCO-2 AOD, (b) MODIS AOD and OCO-2 XCO2, and (c) OCO-2 AOD and XCO2. The positive correlation suggests that there is temporal covariance between AOD and XCO2.
Here we point out that the MODIS AOD is evaluated at 550 nm wavelength, while the OCO-2 total AOD value corresponds to 755 nm, and the two are hence not directly comparable. We do not expect to see a one-to-one correspondence between the two. The sensitivity of AOD to the wavelength depends on the aerosol size distribution and other properties. In general, for typical ambient aerosols, it is expected that the AOD is smaller at 755 nm, as suggested by the data. One way to scale the AOD obtained at one wavelength to another wavelength is to use the Ångström exponent. While MODIS-based estimates of the Ångström exponent exist, they are not reliable over land (Levy et al., 2010). To obtain a rough idea of how the wavelength difference might affect the AOD comparison on a global scale, we have used the Ångström exponent from collocated MERRA-2 monthly climatology (, ) to scale the OCO-2 AOD values to 550 nm, which can be considered a reference wavelength used in many satellite aerosol products. The result suggests that the low bias in OCO-2 AOD compared to MODIS is only slightly reduced by the scaling (Fig. A3). A bivariate linear fit for OCO-2 AOD (at 755 nm) as a function of MODIS AOD (at 550 nm) gives a slope of 0.3, while a fit using OCO-2 AOD scaled to 550 nm gives a slope of 0.4 (without the OCO-2 quality filtering).
The use of MERRA-2 data potentially induces high uncertainty to the spectral conversion. We use this method merely to get a rough estimate of the effect of the wavelength difference on the AOD difference. This is done only in a statistical sense for the global dataset, understanding that the high uncertainties involved with the scaling do not allow for a more detailed comparison. The main conclusion drawn from this is that while the slope of OCO-2 AOD against MODIS AOD is 0.3 before spectral scaling, it is 0.5 after the scaling; i.e., the wavelength difference explains some, but not all, of the difference. The spectral conversion was repeated with a smaller subset of data using the Ångström exponent from AERONET, and the results largely agreed with the global dataset.
Comparison of OCO-2 AOD with AERONET shows similar results (Fig. 3). A linear fit of OCO-2 AOD against AERONET AOD at 500 nm gives a slope of 0.3, while a fit against AERONET AOD scaled to 770 nm gives a slope of 0.53. The slope is further increased when a more recent version of the OCO-2 algorithm is used. The similarity of these results supports the assumption that MODIS AOD can be used as reference data in evaluating the OCO-2 performance. The MODIS aerosol products have been extensively validated, with a typical correlation coefficient of R∼0.9 against AERONET (Levy et al., 2013; Sayer et al., 2014; Wei et al., 2019). We do not repeat the MODIS AOD product validation against AERONET in this work, but we have compared the MODIS part of the collocated OCO-2–MODIS dataset to AERONET with similar sampling as used for OCO-2. This differs from the typical validation in that the sampling is not optimal for MODIS but limited to the pixels collocated with OCO-2. As expected, this sampling leads to slightly reduced validation metrics against AERONET (R∼0.8, small bias), but the metrics are still better than for OCO-2. Hence, we are confident that although the MODIS AOD product certainly has higher uncertainty than AERONET, it helps to extend the evaluation of OCO-2 AOD to the global scale.
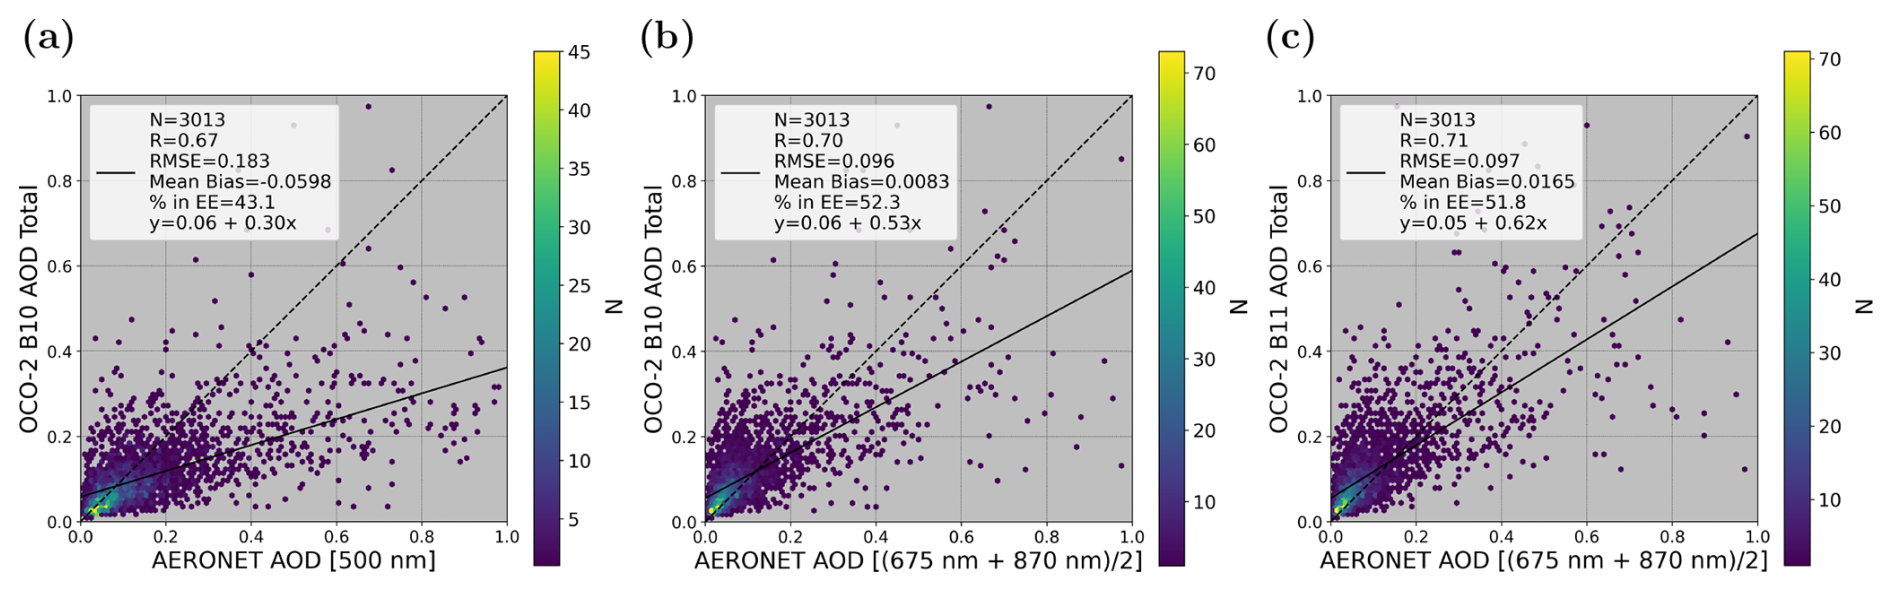
Figure 3Comparison between OCO-2 and AERONET for all collocated data through February 2023. (a) AERONET AOD at 500 nm. (b) AERONET AOD scaled to 770 nm by simple average. (c) OCO-2 version B11.
The OCO-2 quality filtering applied to the collocated dataset heavily affects the AOD comparison shown in Fig. 1. Because the cases where OCO-2 retrieves large AODs are removed by the quality filtering, the aggregated MODIS DT AOD values are much lower than they would be for unfiltered MODIS data. The quality filtering also causes a sampling bias between MODIS and OCO-2 AOD data, since not all cases with high MODIS AOD are removed. Statistics for AOD in different subsets are shown in Tables A1 to A2. The correlation is better for unfiltered data (Table A2).
Finally, we note that the OCO-2 retrieval algorithm ACOS is not an aerosol retrieval algorithm and the total AOD value included in the product is only one of more than 50 components in the full-physics retrieval. Incorrect AOD values in the ACOS retrieval may be compensated for by other retrieval parameters, and a difference between MODIS and OCO-2 AOD values does not necessarily indicate erroneous XCO2 retrieval. Our focus here is not to evaluate the AOD component of ACOS retrieval as such but to study the statistical relationships using MODIS AOD as independent reference data. We also note that the collocation between the MODIS 10 km AOD product and the OCO-2 observations at higher spatial resolution (approximately 1 ×2 km2) affects the comparison. The collocation approach applied here, using the closest MODIS pixel for each OCO-2 data point, is the simplest possible. The simple approach was chosen to enable processing the large dataset efficiently, and more sophisticated collocation for detailed case studies is considered elsewhere. However, we made a limited test with the MODIS 3 km aerosol product for the year 2018 to study the effect of aerosol data resolution. This increased the number of matches with OCO-2 by 38 % with little effect on the results: the average XCO2 value of the collocated dataset increased by 0.02 ppm and the average MODIS AOD increased by 0.01 for the unfiltered dataset.
The expected error envelope for MODIS DT AOD is for reference (AERONET) AOD τA (Levy et al., 2010, 2013), indicating a high relative uncertainty at low AOD values. However, the absolute value of AOD (or the absolute difference between MODIS and OCO-2) at very low levels is not crucial for the accuracy of the XCO2 retrieval, since the effect of aerosols is expected to be small for low AODs. In addition, the cases where OCO-2 severely overestimated AOD are not seen in the quality-filtered dataset, as the cases with OCO-2 AOD over 0.2 are removed by the standard quality filtering (O'Dell et al., 2018). Hence, from the point of view of the aerosol effect on the XCO2 retrievals, the most important areas are those with an AOD difference below −0.2 (blue areas in Fig. 1b), where OCO-2 AOD is significantly lower than MODIS AOD. In the following we will separate the data into different AOD difference subsets to study this in more detail.
To conclude, in this section we consider the differences between the collocated MODIS DT AOD product and the OCO-2 total AOD component. We find that the AOD difference depends on region. OCO-2 tends to overestimate the aerosol load in regions with low MODIS AOD. More important for the XCO2 retrievals, OCO-2 tends to severely underestimate AOD in the high-MODIS-AOD regions (including areas with high anthropogenic emissions), which may have an effect on the XCO2 retrievals in these regions.
4.2 Effect of AOD discrepancy in OCO-2 quality filtering
In this section we will compare the OCO-2 total AOD component to MODIS AOD statistically for the full collocated dataset using, for example, density scatter plots. Specifically, we address the question of how well the OCO-2 quality filtering works from the point of view of aerosols. The OCO-2 quality filter uses an AOD threshold of 0.2, among several other tests, to remove heavy aerosol conditions. We use collocated MODIS AOD data to assess the performance of the OCO-2 AOD filter.
Figure 4 shows joint histograms of 5 years of collocated OCO-2 and MODIS AOD data (over 40 million collocated data points). In panel (a) we show all data, without OCO-2 quality filtering. In panel (b) we have applied filtering using the OCO-2 quality flag (O'Dell et al., 2018), which identifies potentially bad-quality retrievals affected by, e.g., clouds or high aerosol loads, and removes the results with OCO-2 AOD higher than 0.2. The dashed red line shows bin-averaged OCO-2 AOD data for MODIS AOD bins (50 bins with width 0.02; see also Fig. A3a for a box plot). We see that OCO-2 AOD is systematically low with respect to MODIS AOD (mean MODIS AOD is 0.15, mean OCO-2 AOD is 0.12), except for the lowest MODIS AOD values where OCO-2 has higher AOD. The overestimation at the low AOD end may be related to the water and ice aerosol components included in the OCO-2 total AOD. These two AOD components are included in the ACOS retrieval to account for possible residual cloud contamination, while the MODIS aerosol retrieval does not have corresponding elements. Preliminary study shows elevated water and ice AOD values at low MODIS AOD values, but a more detailed study, beyond the scope of this work, would be required to confirm this. The dashed green line shows a bivariate linear fit, which closely follows the binned mean values with a slope of 0.33 for the unfiltered data. Naturally, the quality filtering affects the binned averages at the high-MODIS-AOD end, where a larger fraction of the data with high OCO-2 AOD is removed. This causes deviation of the binned averages from the linear behavior and is reflected in the lower slope (0.18) for the linear fit.
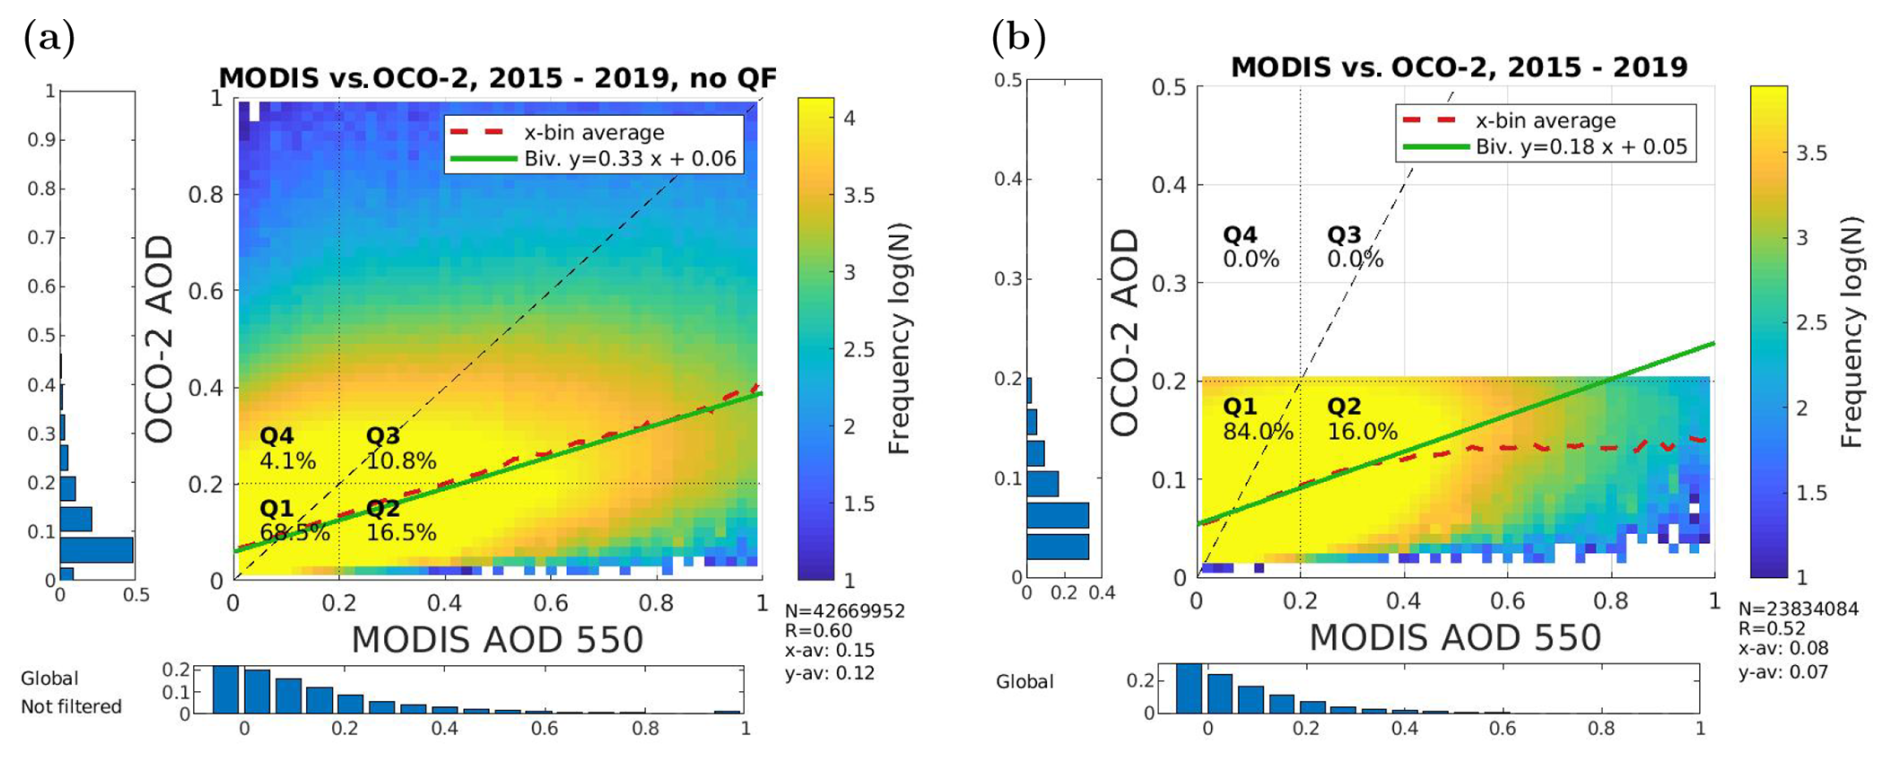
Figure 4Number of collocated data points (logarithmic color scale) for each “AOD grid cell” (50×50 cells of AOD width 0.02). (a) All data and (b) good-quality data only. The dashed red line shows average OCO-2 AOD for each MODIS AOD bin. The green line shows a bivariate linear fit. The dotted black lines divide the data into four “AOD quarters” (Q1–Q4; see text). The text insets show the fraction of data in each quarter. The dashed black line shows the 1:1 line. The normalized AOD histograms respectively show the distribution of data for OCO-2 (left-hand histograms) and MODIS (bottom histograms). The lower right text inset shows the number of data points, correlation coefficient (R), and average AOD values for MODIS (x-av) and OCO-2 (y-av), respectively.
The Pearson correlation coefficient for the unfiltered data is 0.60, which is reduced to 0.52 for the data filtered with the OCO-2 quality filter. The large spread of the data reflects the fact that the ACOS algorithm is not optimized for AOD retrieval, as discussed above. Considering this, the obtained correlation with MODIS AOD can be considered acceptable. Note that in the collocated dataset the MODIS data are often the limiting factor (Table A1), already removing data over bright surfaces and in proximity to clouds. Applying the OCO-2 quality filter further reduces the collocated data to 56 % of the original collocated data points. We note that only 15 % of the original data are removed by the total AOD threshold of 0.2, while 29 % are removed by other quality tests. The lower correlation coefficient of the quality-filtered dataset reflects the imbalance between OCO-2 and MODIS in the AOD distribution of data points removed by the OCO-2 quality filter.
The dotted black lines in Fig. 4 at the AOD threshold of 0.2 divide the AOD matrix into four quarters, Q1–Q4. The threshold 0.2 corresponds to the current limit for good-quality retrievals in OCO-2 over land. We note that since the wavelength-corrected linear relation between the two instruments is roughly AODMODIS∼2.5 AODOCO−2, a more appropriate AOD threshold for MODIS could be 0.5. For simplicity we use the same limit of 0.2 for both instruments, but in Sect. 4.4 we study the effect of filtering the data with an AOD threshold of 0.5 applied to MODIS data. The first quarter (Q1) with AOD from both instruments below 0.2 contains most of the data (68.5 %). The second quarter (Q2) contains data with and τMODIS>0.2 (16.5 %). These data points are assumed to have low AOD in the OCO-2 retrievals, but according to MODIS there can be quite heavy aerosol loads, which might affect the XCO2 retrievals. Q3 contains data points with AOD above 0.2 for both instruments (10.8 %). These data points are removed when the OCO-2 quality filtering is applied, which is appropriate considering that heavy aerosol conditions should be avoided in XCO2 retrievals. The last quarter (Q4) includes data points for which and τMODIS≤0.2 (4.1 %). These data are removed by quality filtering, but based on low MODIS AOD values Q4 could contain good-quality retrievals.
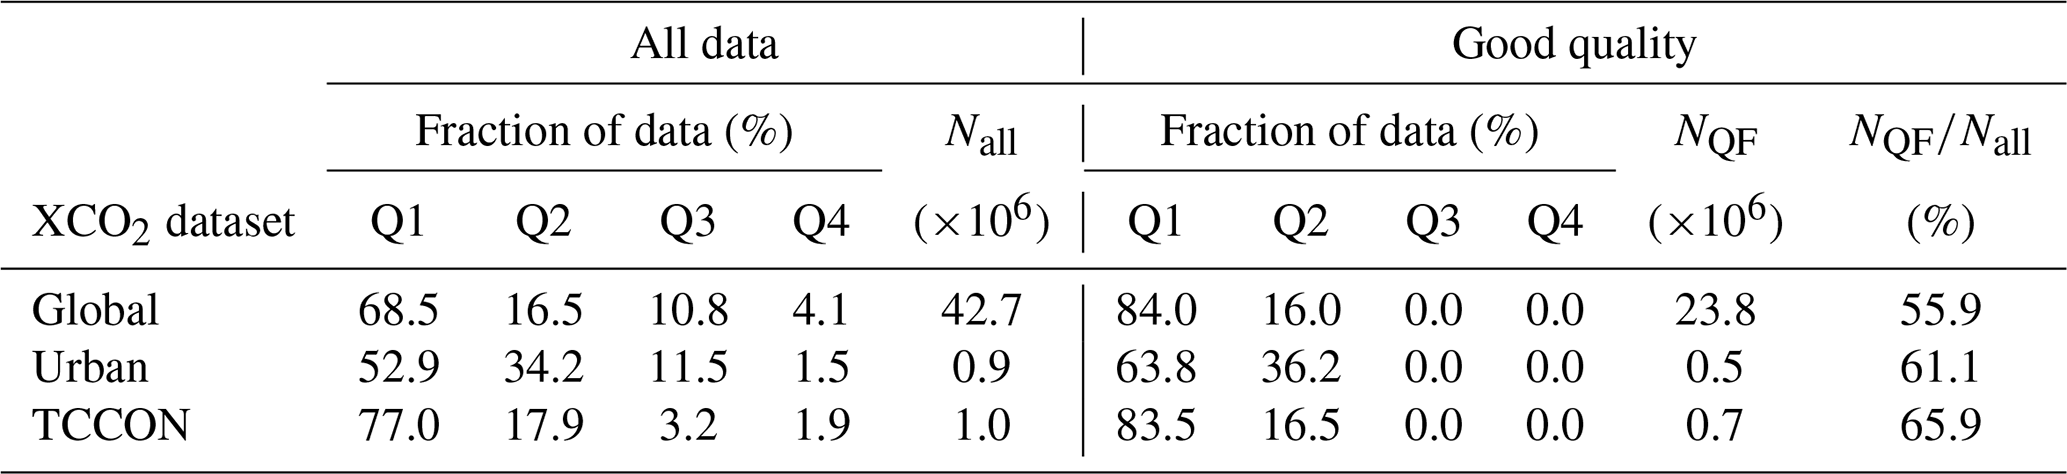
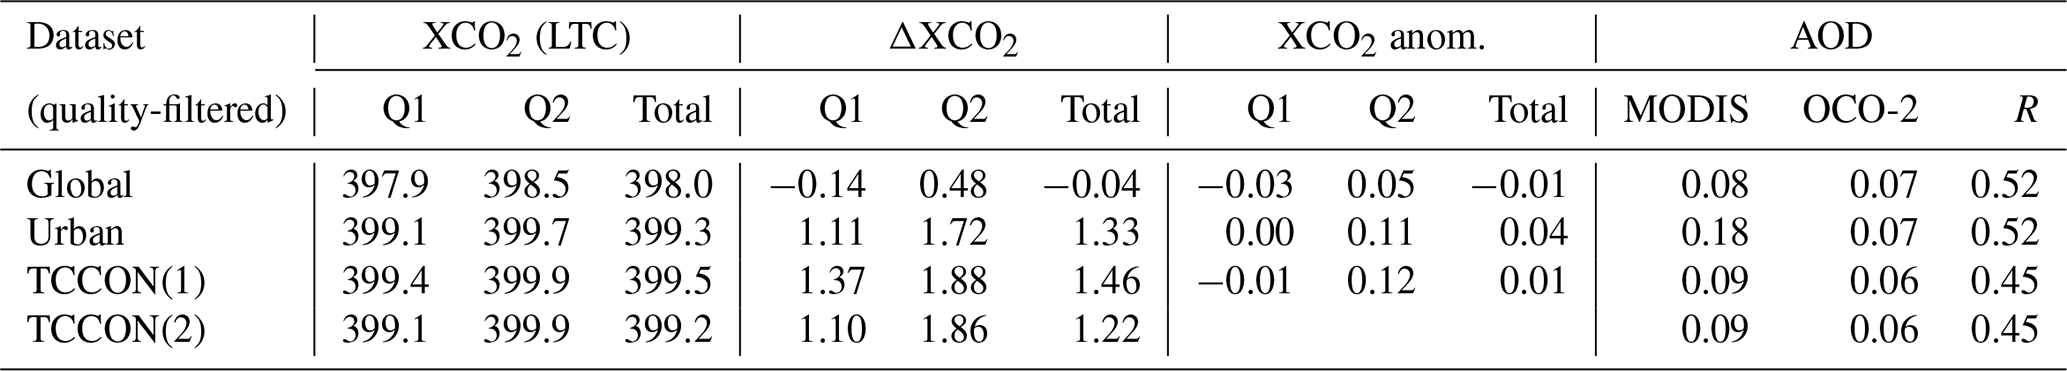
Table 1 shows the fraction of data in different quarters of the AOD matrix and the total number of data points in the collocated MODIS–OCO-2 dataset and two subsets. The numbers are respectively shown for quality-filtered (good-quality) and for the unfiltered (all data) cases. The global dataset includes all available OCO-2 data from 2015–2019 which have a matching MODIS aerosol retrieval (14 % of all OCO-2 data points, over 40 million data points in total; see Table A1). The urban dataset is limited to areas of dense human habitation using the urban area mask from https://www.naturalearthdata.com/ (last access: 22 April 2024) (Ver. 4.1.0) (NaturalEarth, 2024; Schneider et al., 2009), illustrated in Fig. A5; these results are discussed in more detail in Sect. 4.3. The OCO-2–TCCON dataset contains collocated MODIS–OCO-2–TCCON data for the 26 TCCON sites listed in Table A4. The fraction of data in Q2 is considerably higher for the urban subset, reflecting the higher AOD differences between the two instruments over urban areas. We see that the quality filtering using the OCO-2 quality flag also removes some of data from Q1 and Q2. The ∼ 24 million good-quality data points for the global dataset compose about 56 % of the total collocated data, which is about 66 % of data originally in the two lower quarters Q1 and Q2.
Table 1Fraction of data in different AOD quarters for different subsets of the collocated MODIS–OCO-2 datasets. The “global” set includes all collocated data, the “urban” subset is limited to urban areas (see text), and the “TCCON” subset is further collocated with TCCON stations.
As already noted, the MODIS DT aerosol product contains a considerable fraction (∼ 20 %) of negative AOD values. While these are obviously unphysical, they are kept in the analyses in order to not disturb the AOD distribution (Sayer et al., 2014). These data are not shown in Fig. 4, but in the statistics we include the negative MODIS AOD data points in Q1 and Q4, depending on the corresponding OCO-2 AOD value.
Figure 5 shows maps of the fraction of data in the two AOD matrix quarters (Q1 and Q2) for the good-quality data per 1° × 1° grid cell. The map for the Q1 fraction reveals that for the vast majority of land regions, average AOD is less than 0.2 for both instruments; however, large areas in Southeast Asia and central Africa have a low fraction of data in the low-AOD quarter and correspondingly a higher fraction of data in Q2. Therefore, these areas are more sensitive to effects caused by high aerosol loads in the XCO2 retrieval. Figure A5 shows the fraction of data in Q1 for the urban subset.
To conclude this section, we have found that the quality-filtered OCO-2 data contain a large fraction of data with high MODIS AOD, potentially affecting the XCO2 retrieval quality. These data are more frequent in densely populated areas with high aerosol and CO2 emissions. Hence, for monitoring anthropogenic CO2 emissions with satellites, it is crucial that the high-AOD cases are carefully detected and treated in the satellite retrievals.
4.3 Connection between XCO2 and AOD
In this section we consider the possible aerosol effects in the OCO-2 XCO2 retrieval. Figure 6a shows aggregated OCO-2 XCO2 values over the globe for the collocated dataset. Visual comparison with the AOD map in Fig. 1 shows some spatial correlation between high AOD and high XCO2 values. This spatial correlation between high XCO2 and high AOD values may affect the XCO2 statistics in two ways: first, a larger fraction of data is removed by the OCO-2 quality filtering over the high-XCO2-load areas. Second, considering Fig. 5 for the quality-filtered data shows that areas with a large fraction of data in Q2 typically have high XCO2 values. These heavy aerosol conditions suggested by MODIS data, which remain in the quality-filtered OCO-2 dataset, may affect the XCO2 retrieval quality. Figure 6b shows the correlation between MODIS AOD and OCO-2 XCO2 for 1° × 1° grid cells. We see particularly high correlation values for the Sahel region, parts of Southeast Asia, and the western USA.
The sampling of the data (e.g., seasonal variation) affects the observed spatial features. The spatiotemporal sampling of the collocated dataset is not even but is affected by, e.g., solar zenith angle, cloudiness, and snow cover. In particular, the Northern Hemisphere high-latitude areas have a relatively strong seasonal cycle of XCO2 (Lindqvist et al., 2015), which is not fully captured in this aggregated dataset, as the winter months are scarcely sampled. Figure 2b and c show global time series of collocated OCO-2–MODIS data, revealing a moderate (R=0.18) temporal correlation between MODIS AOD and OCO-2 XCO2. We also emphasize that the OCO-2 swath is very narrow and repeats over the same areas, leaving relatively large gaps without data. The crude map presentation with a 1° × 1° lat–long grid in Fig. 6 artificially fills the gaps and smooths the data, while the patchy structure of the data is still seen in the northern high-latitude areas. Therefore, these maps serve only as a rough reference indicating spatial variance in retrieved XCO2 values, and one should not draw far-reaching conclusions from it. More detailed analyses are made based on the statistics from the spatiotemporally collocated subsets of the full dataset in the following.
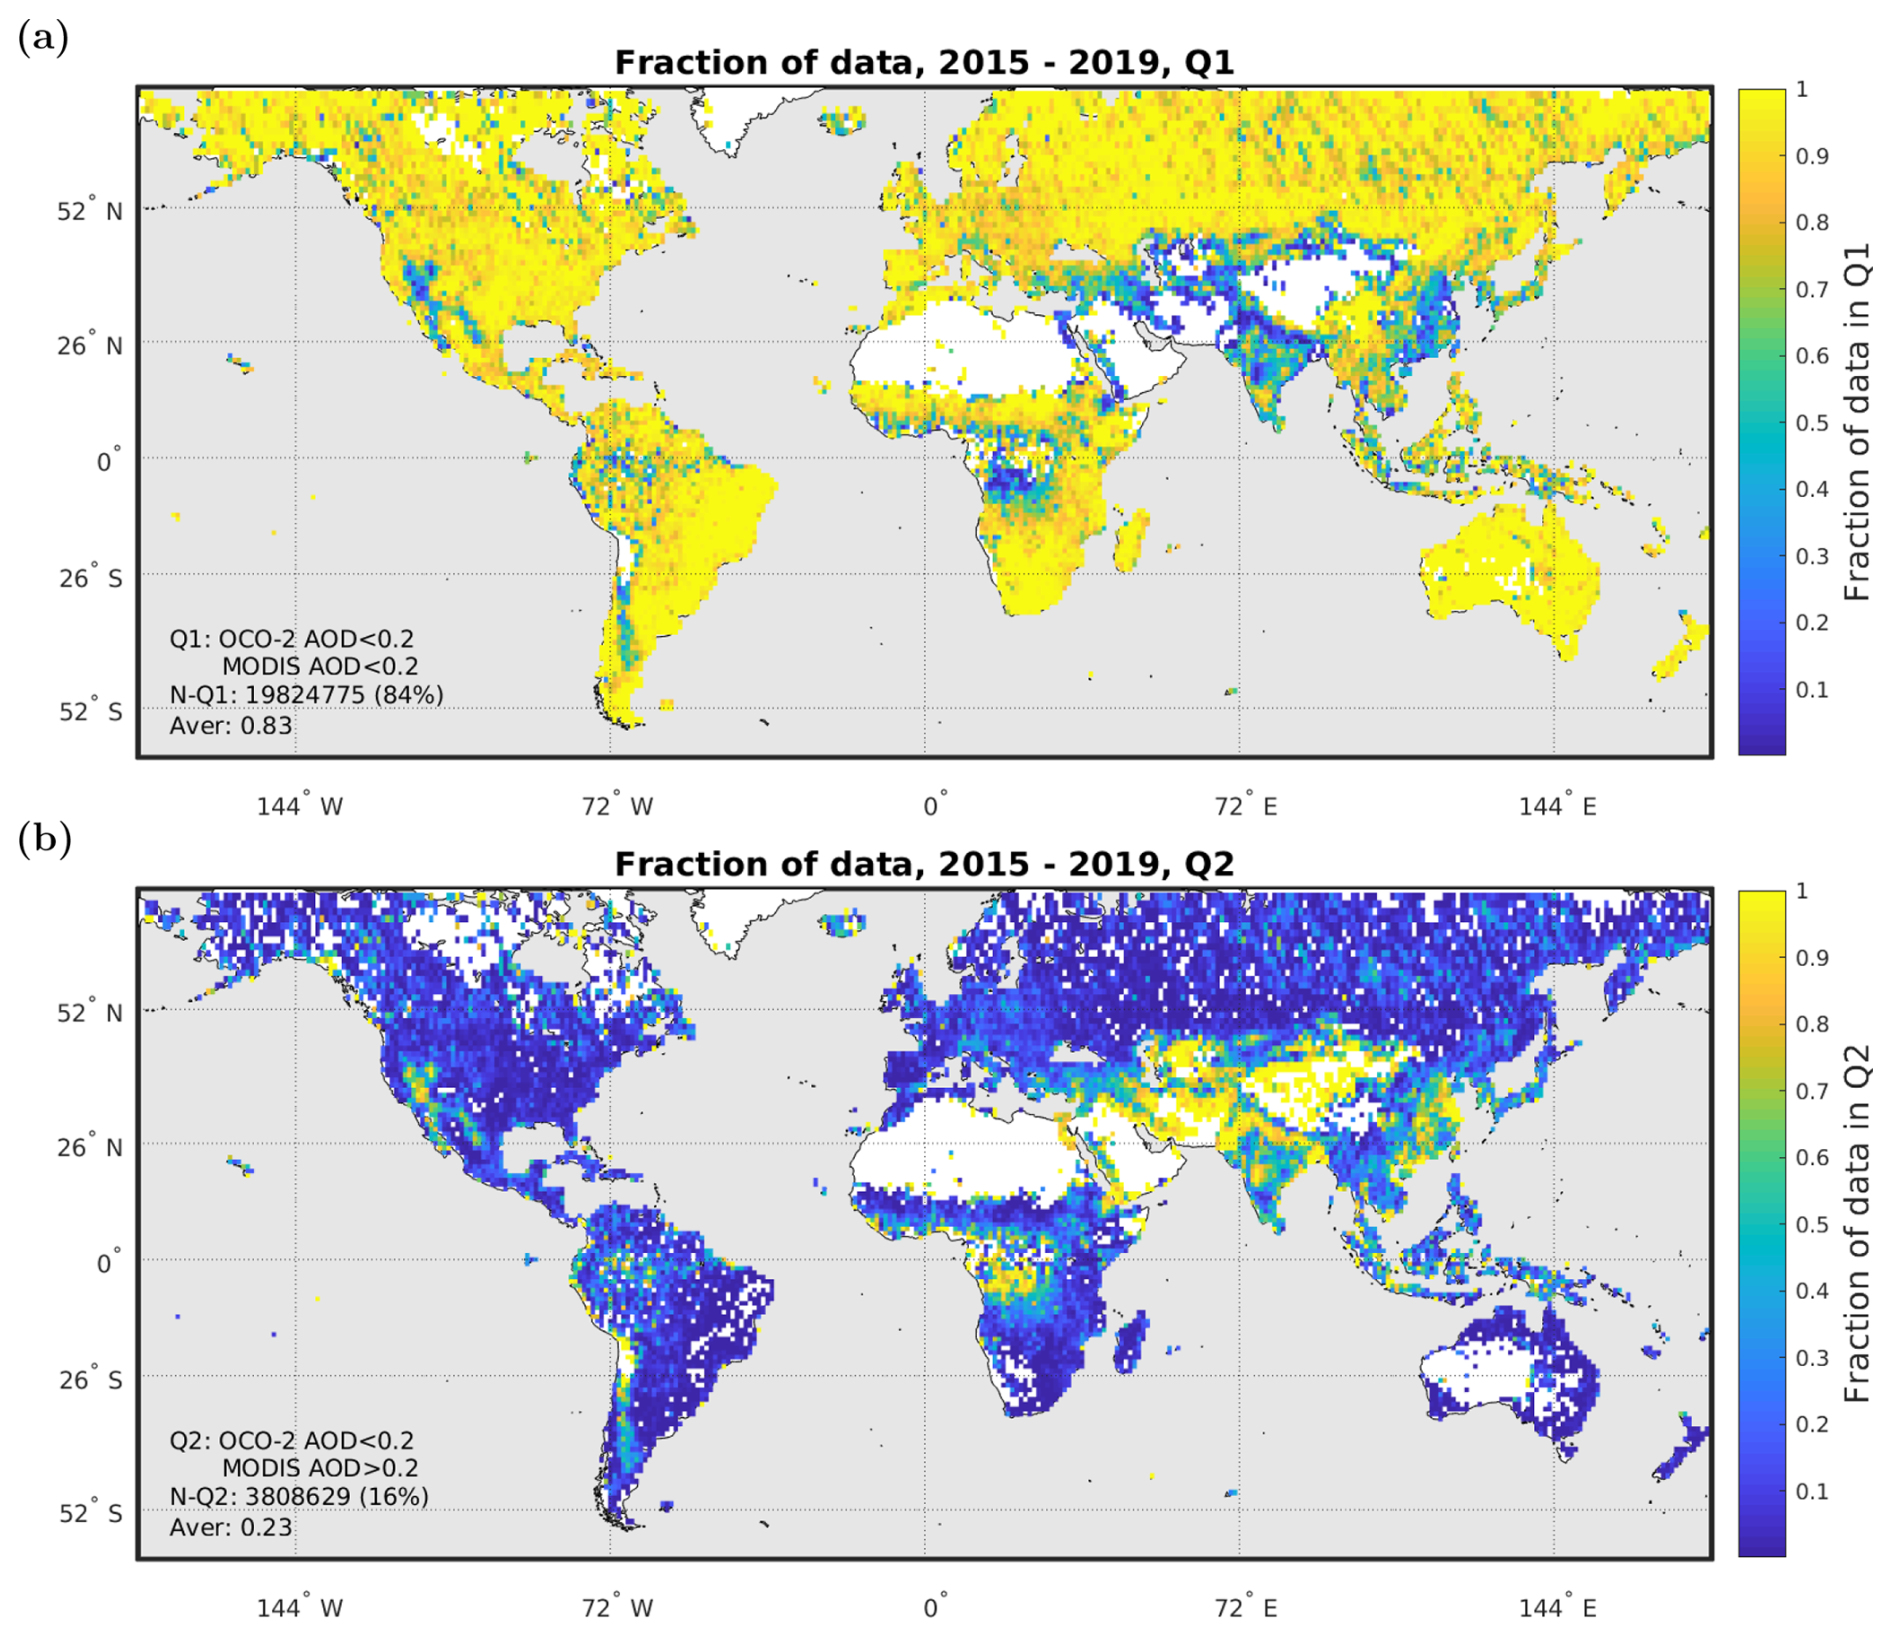
Figure 5Fraction of data in Q1 (both AODs <0.2) and Q2 (OCO-2 AOD below 0.2, MODIS AOD above 0.2) for 5 years of data.
Figure 7 shows the retrieved XCO2 values aggregated to the AOD matrix (see Fig. 4 for the number of data points). When aggregating 5 years of data we first apply a simple linear trend correction in an attempt to remove the effect of increasing CO2 values, as described in the Methods section. Figure 7a clearly shows, when considering all data points (no quality filtering), that the retrieved XCO2 values are correlated with the relative AOD values. In AOD Q4, where OCO-2 AOD is biased high compared to MODIS, we get lower XCO2 values (1.3 ppm lower than the total average). In Q2, where OCO-2 AOD is biased low compared to MODIS, we get higher XCO2 values (0.4 ppm higher than the total average). When quality filtering is applied (Fig. 7b) the total average is increased by 0.2 ppm, and the Q2 average is 0.5 ppm above the total average. Table 2 shows average XCO2 values for Q1 and Q2 for the quality-filtered data. Table A2 summarizes the average XCO2 values in different AOD quarters for the unfiltered data.
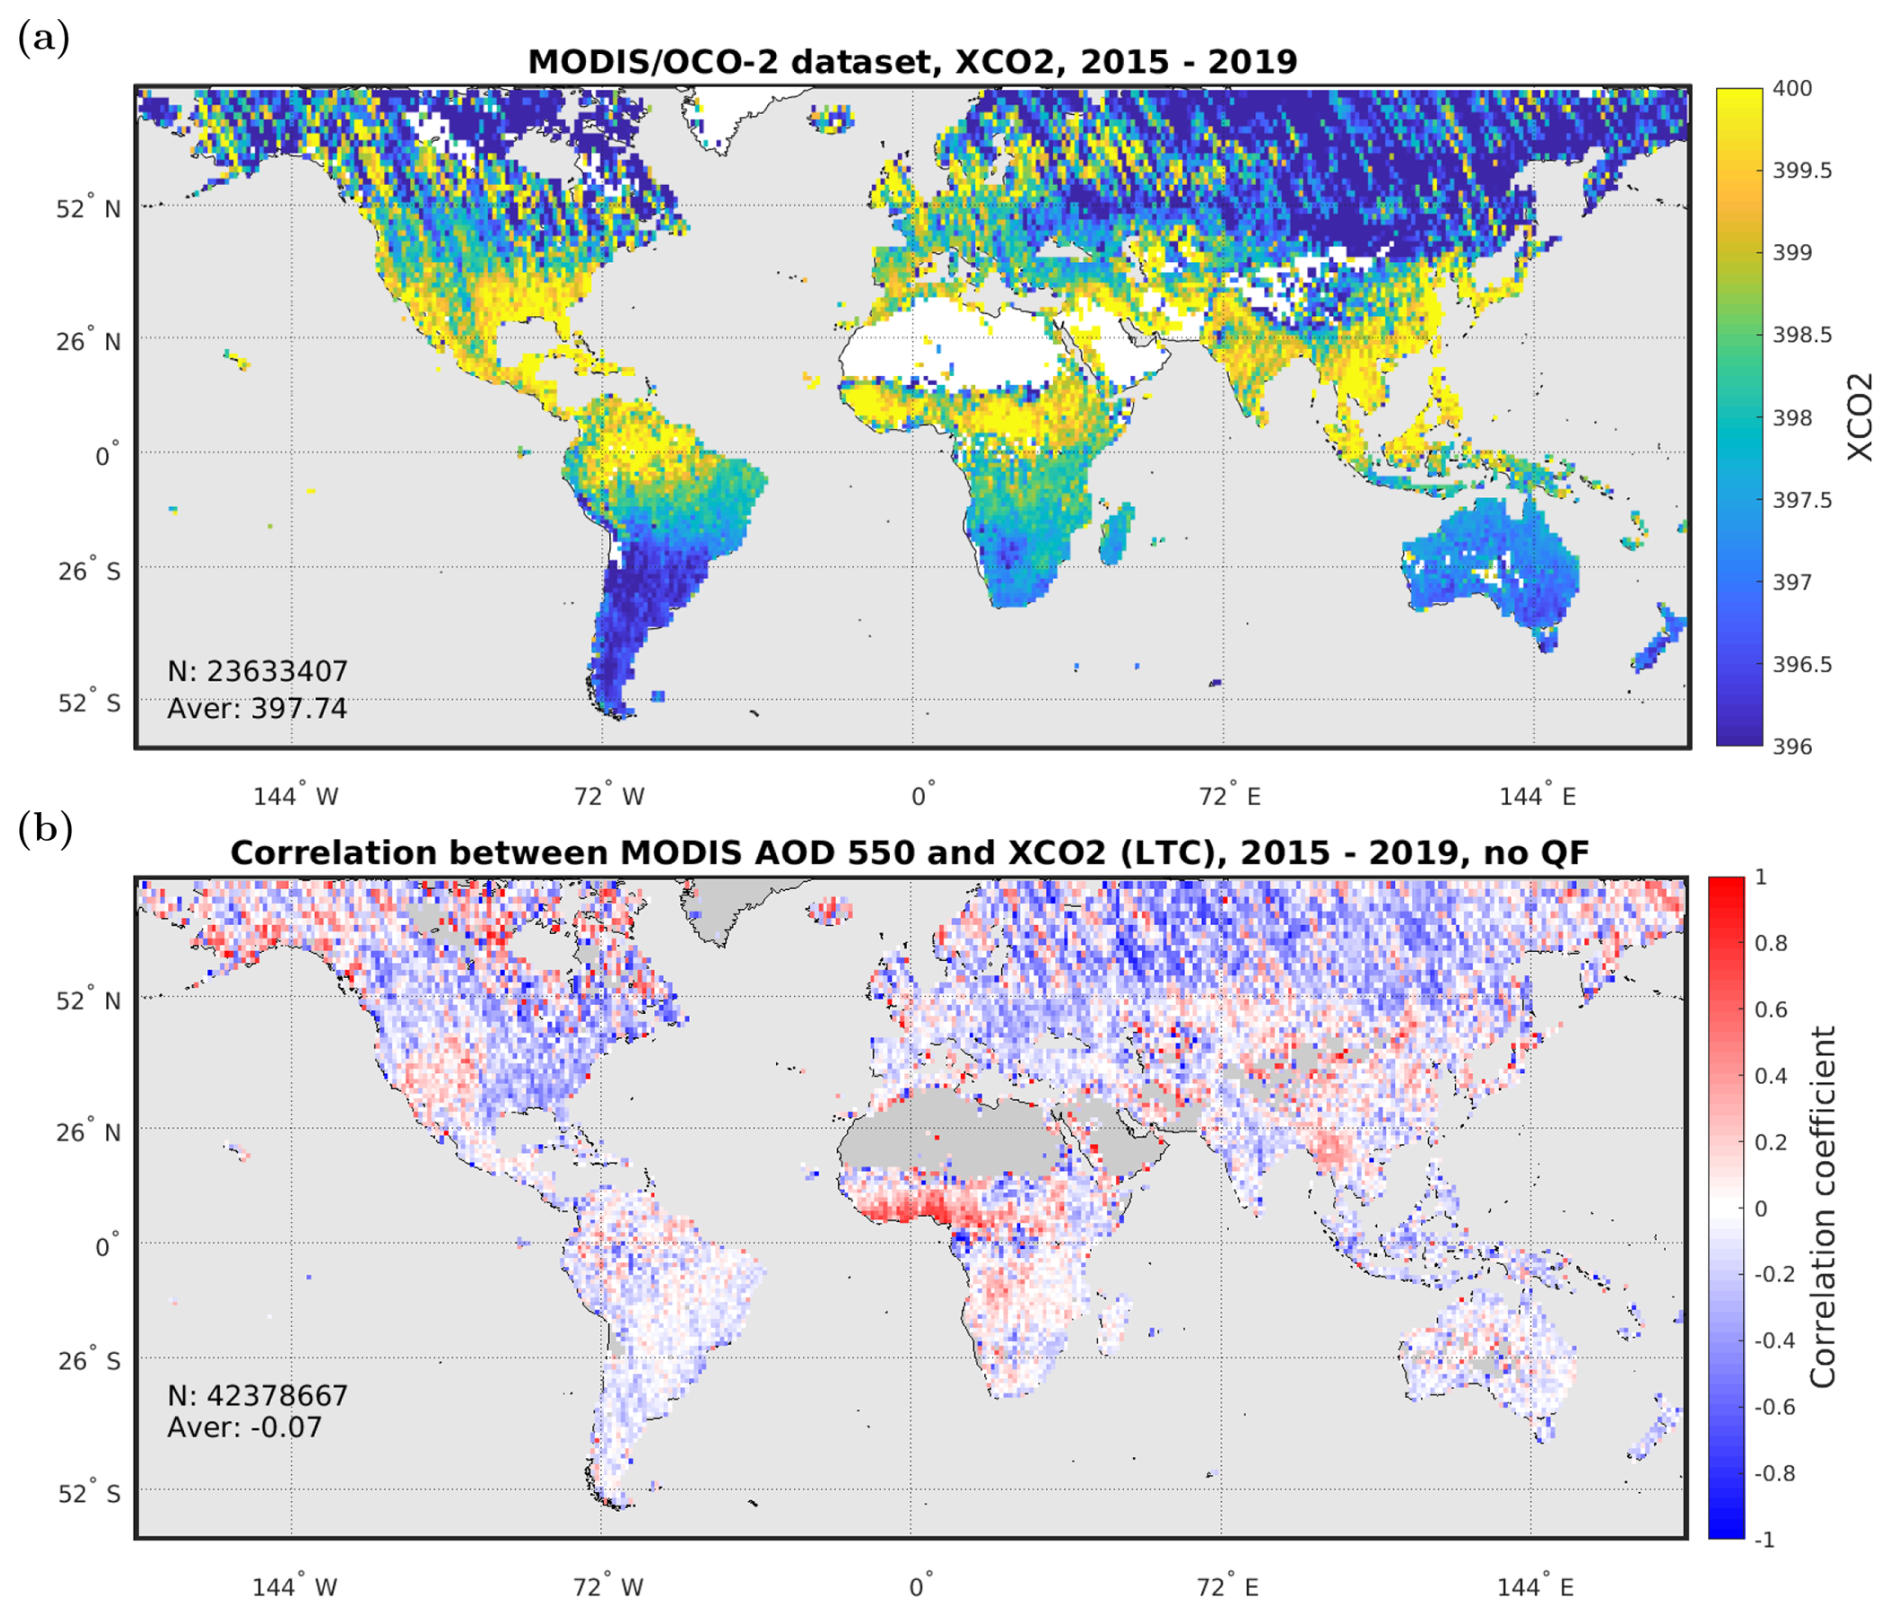
Figure 6Linear-trend-corrected OCO-2 XCO2 data from the collocated OCO-2 and MODIS dataset for 5 years (2015–2019). (a) Quality-filtered XCO2 (LTC) data aggregated to 1° × 1° grid cells. (b) Correlation between MODIS AOD and OCO-2 XCO2 for 1° × 1° grid cells (quality filter not applied).
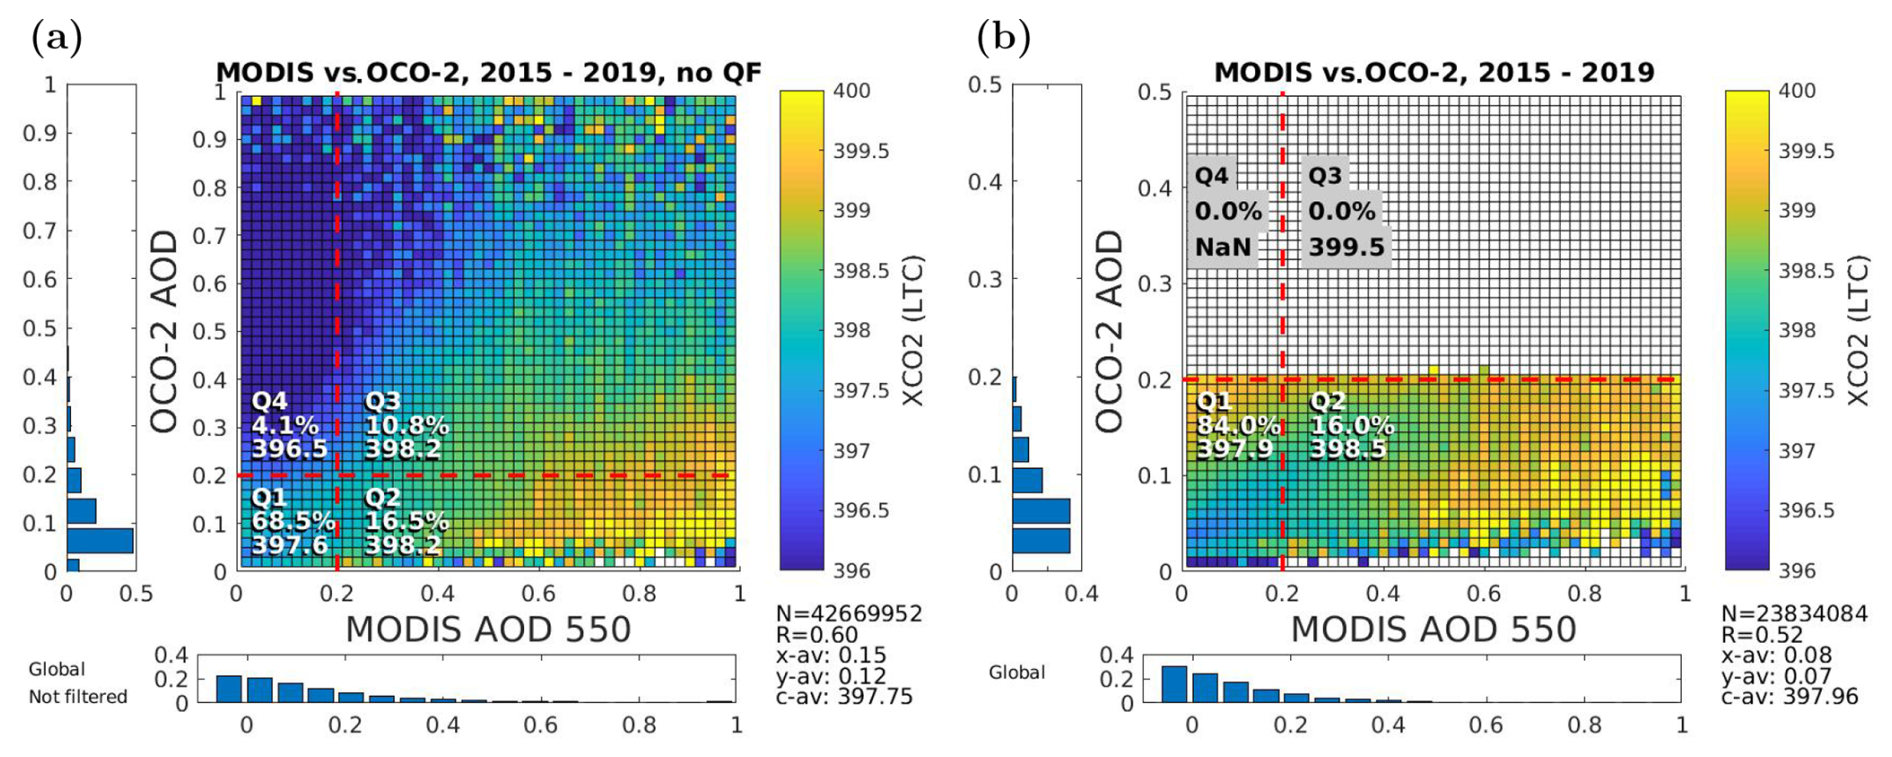
Figure 7OCO-2 XCO2 retrievals for 5 years aggregated to the AOD matrix. Linear trend correction (LTC) has been applied to the XCO2 values. (a) All data and (b) only good-quality data. The text insets on the scatter plot show the fraction of data in each AOD quarter and the mean XCO2 value. The lower right-hand text inset shows the number of data points (N), correlation coefficient (R), average AOD values for MODIS (x-av) and OCO-2 (y-av), and average XCO2 (c-av). The normalized histograms show the distribution of AOD data along each axis.
Table 2XCO2 statistics for different good-quality datasets for the two AOD quarters (Q1 and Q2; see text). ΔXCO2 is calculated with respect to the reference value 398.1 ppm (the total global average value). Three datasets are used: global, urban, and one collocated with TCCON. For the collocated TCCON data two XCO2 values are given from OCO-2 (labeled TCCON(1)) and from TCCON (labeled TCCON(2)). The XCO2 anomaly is calculated with respect to the OCO-2 median value within 500 km. MODIS AOD is calculated at 550 nm and OCO-2 total AOD at 755 nm; R is the correlation coefficient.
As a first guess, the striking connection between XCO2 and the relative AOD values between the two instruments in Fig. 7a could potentially be explained by the light path length used in the ACOS full-physics retrieval. The top-of-atmosphere radiance measured by OCO-2 contains information on the total amount of CO2 along the light path, and inversion of this information to XCO2 values requires knowledge of the light path length, which is affected by aerosols. If the aerosol load is overestimated in the retrieval (Q4), the light path is also overestimated, and the measured CO2 absorption is divided into a distance that is too long, leading to underestimation of XCO2. Similarly, if AOD is underestimated (Q2), the light path is also underestimated, causing overestimation of XCO2. While the potentially bad-quality XCO2 retrievals in Q3 and Q4 are removed by the quality filtering, the possible aerosol effects in Q2 remain in the quality-filtered OCO-2 data. However, for Q2 the interpretation turns out to be more complicated when the reference XCO2 data from TCCON are considered, as discussed below.
The correlation between XCO2 and AOD can be a sign of a retrieval bias caused by aerosols, or it can be caused by real correlation between aerosols and CO2 emissions. It is entirely plausible that there is a natural correlation between AOD and XCO2, stemming partially from anthropogenic (or, in case of fires or volcanoes, natural) co-emission of CO2 and aerosols. However, the striking feature in Fig. 7 is the dependence of XCO2 on the relative AOD values between the two instruments. This dependence of XCO2 on the AOD difference implies that possible biases in the aerosol treatment have an effect on the XCO2 retrievals. In the following we will study these two possible causes of the observed correlation between XCO2 and MODIS AOD in more detail. On one hand, to investigate the natural correlation, we will focus more on urban areas, where anthropogenic emissions are presumably more pronounced. On the other hand, we will consider the reference XCO2 from 26 TCCON sites collocated with both OCO-2 and MODIS.
We have created an urban subset of the collocated data using a MODIS-based urban area mask (NaturalEarth, 2024). Figure A5 shows the urban areas (and fraction of data in Q1 for these areas). The data are reduced to slightly below 1 million data points (2 % of all data), with a mean XCO2 value 1.3 ppm higher than for the global data for the quality-filtered case. Similarly to the global case, lower XCO2 values in Q4 and higher values in Q2 are seen for the unfiltered data (Table A2). For the urban areas there is a much higher fraction of high-MODIS-AOD data (Q2+Q3) than globally: 36.2 % (45.7 %) compared to 16.0 % (27.3 %) for filtered (unfiltered) data (Table 1). Average MODIS AOD for urban areas is 0.18 (0.24), while for the global dataset it is 0.08 (0.15). Interestingly, for OCO-2 the corresponding values are 0.07 (0.11) and 0.07 (0.12), respectively, and the high-OCO-2-AOD fraction (Q3 + Q4) is about the same for urban and global datasets (Table 2 and Table A2). It should be noted that earlier versions of the MODIS DT aerosol retrieval had some issues over urban areas (Gupta et al., 2016), and more detailed studies on the reliability of the reference AOD values in urban areas might be useful.
Finally, there is a column for the XCO2 anomaly in Table 2. The OCO-2 XCO2 anomaly is calculated for each good-quality OCO-2 pixel in the collocated dataset as the difference from the median XCO2 value calculated within 500 km for the corresponding OCO-2 orbit. This is an alternative way to de-seasonalize and de-trend the data, instead of applying the simple LTC. The idea is to study covariance of AOD values and local XCO2 anomalies caused by possible CO2 sources and sinks. We see that the average XCO2 anomaly is negative (−0.03 ppm) in Q1 for the global dataset, indicating that average XCO2 is lower in low-AOD areas. Also, the anomaly is higher in Q2, further supporting the idea that the local XCO2 positive anomaly (source) is connected to higher AOD. For the urban areas the positive anomaly in Q2 is enhanced (0.11 ppm).
In order to further investigate to what extent the observed relation between AOD and XCO2 is related to possible retrieval issues on the one hand and to the natural covariance of AOD and XCO2 on the other hand, we have collocated the 5-year OCO-2–MODIS dataset with the ground-based data from 26 TCCON sites (see Table A4). From Table 2 we see that the TCCON XCO2 is 0.8 ppm higher in Q2 than in Q1, suggesting that there is a real positive correlation between AOD and XCO2. For the OCO-2 XCO2 values in the collocated TCCON dataset the difference between Q1 and Q2 is 0.5 ppm for the quality-filtered data. The XCO2 values are systematically higher in Q2 than in Q1 for all subsets, suggesting a positive correlation between MODIS AOD and OCO-2 XCO2. In particular, the difference between Q2 and Q1 is highest for the TCCON XCO2 data, which suggests that there is actually a stronger correlation between MODIS AOD and XCO2 than suggested by the OCO-2 data.
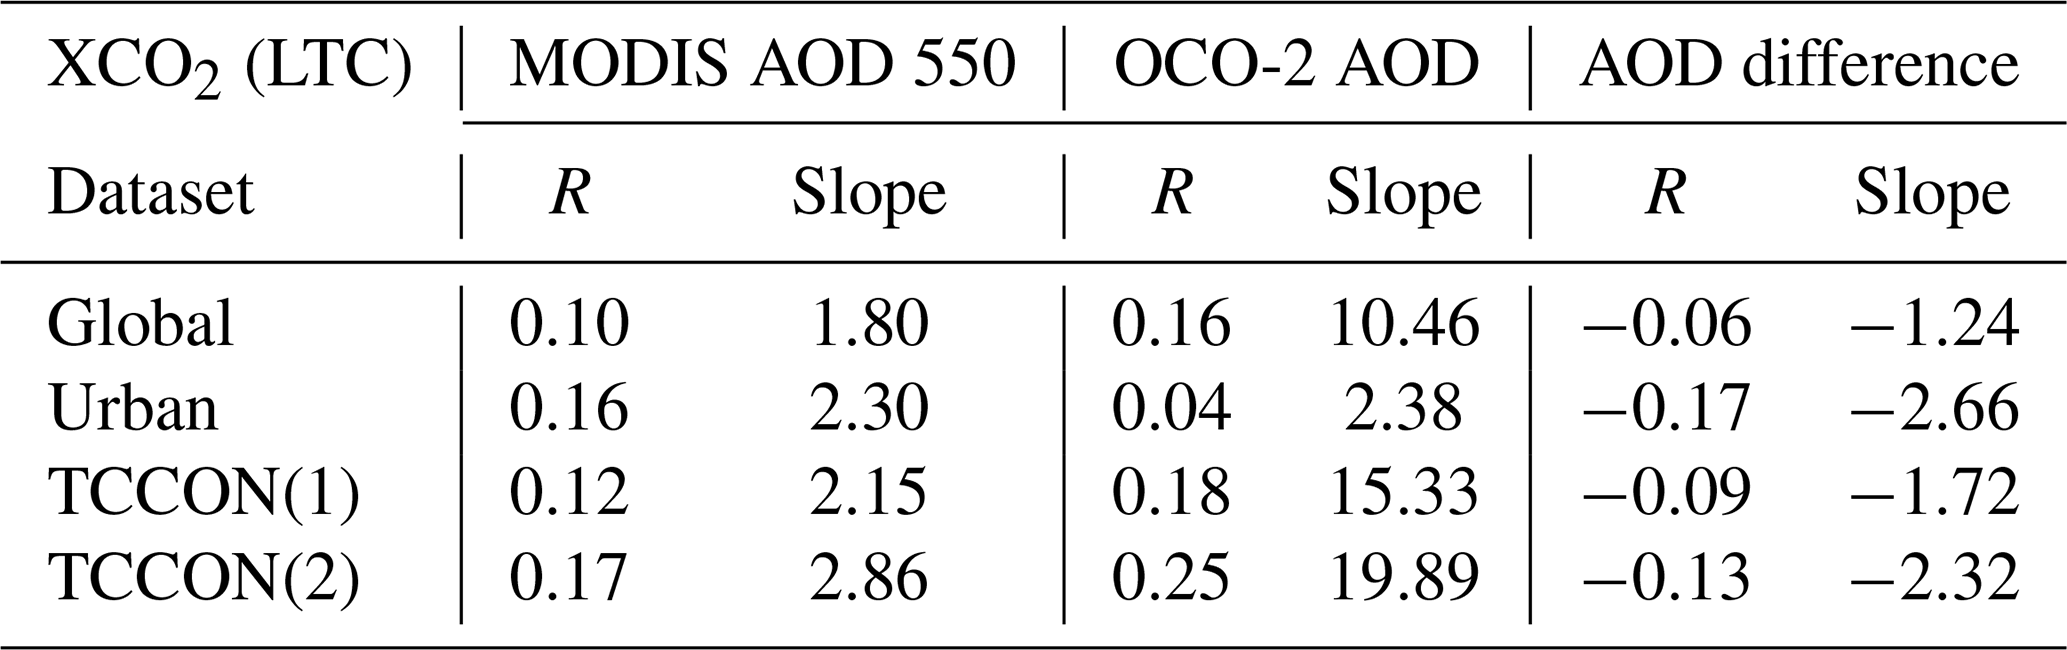
Figure 8 shows joint histograms of XCO2 and MODIS AOD with bivariate linear fits. In addition to the global dataset, the urban and TCCON subsets are shown. There is a small but statistically significant correlation between XCO2 and AOD, and this correlation is strongest when using the TCCON XCO2 data. The linear fit also shows a higher positive slope for TCCON. This suggests that there is a real correlation between AOD and XCO2, and this correlation is partly masked by aerosol effects in the OCO-2 retrievals. Figure 9 shows combined bin-averaged plots and linear fits for the different subsets, also as a function of OCO-2 AOD and AOD difference. The linear fit slopes and correlation coefficients are summarized in Table A3. For OCO-2 AOD the slopes are also positive (and steeper). Disentangling the effects of the AOD difference between MODIS and OCO-2 and the dependence of XCO2 and AOD makes interpretation of Fig. 9c complicated, but it is shown for completeness.
We have extended this analysis to smaller spatial and temporal subsets of data, studying seven geographic areas: Southeast Asia, northern Asia, North America, South America, Europe, and Australia (Fig. A7). SE Asia and Africa show a positive correlation between XCO2 and AOD, while Europe and, in particular, northern Asia have a negative correlation (not shown). Using temporal subsets, we find a positive correlation between XCO2 and AOD for each year in 2015–2019, with little interannual variability. A positive correlation is also found for all seasons. Some seasonal variability is observed, with the highest slope of XCO2 vs. AOD in MAM.
Figure 10 shows plots similar to Fig. 8, also using OCO-2 AOD and the AOD difference on the x axis and the XCO2 difference between OCO-2 and TCCON on the y axis, and reveals negative correlation coefficients and a negative slope for the linear fits. Figure 10a shows a weak but statistically significant correlation between MODIS AOD and the OCO-2 XCO2 bias with respect to TCCON. OCO-2 slightly overestimates XCO2 for low AOD values and underestimates at high AOD values. As with Fig. 9c, the interpolation of Fig. 10c is complicated, since there are two aerosol-related dependencies affecting the data. First, the AOD difference between OCO-2 and MODIS depends on the MODIS AOD in a nontrivial way as shown in Fig. 4, with an OCO-2 low bias at one end and high bias at the other. Second, the XCO2 bias also depends on MODIS AOD.
A post-process correction based on systematic comparisons with the TCCON data is routinely applied to OCO-2 XCO2 data (O'Dell et al., 2018). Even when using the bias-corrected data, our comparison with TCCON reveals a residual bias which depends on the MODIS AOD. These observations further support the suggested correlation between AOD and XCO2, which is partly masked by aerosol effects in the satellite retrievals. Table 3 summarizes the observed correlation coefficients and linear fit slopes for XCO2 as a function of AOD for the different datasets.
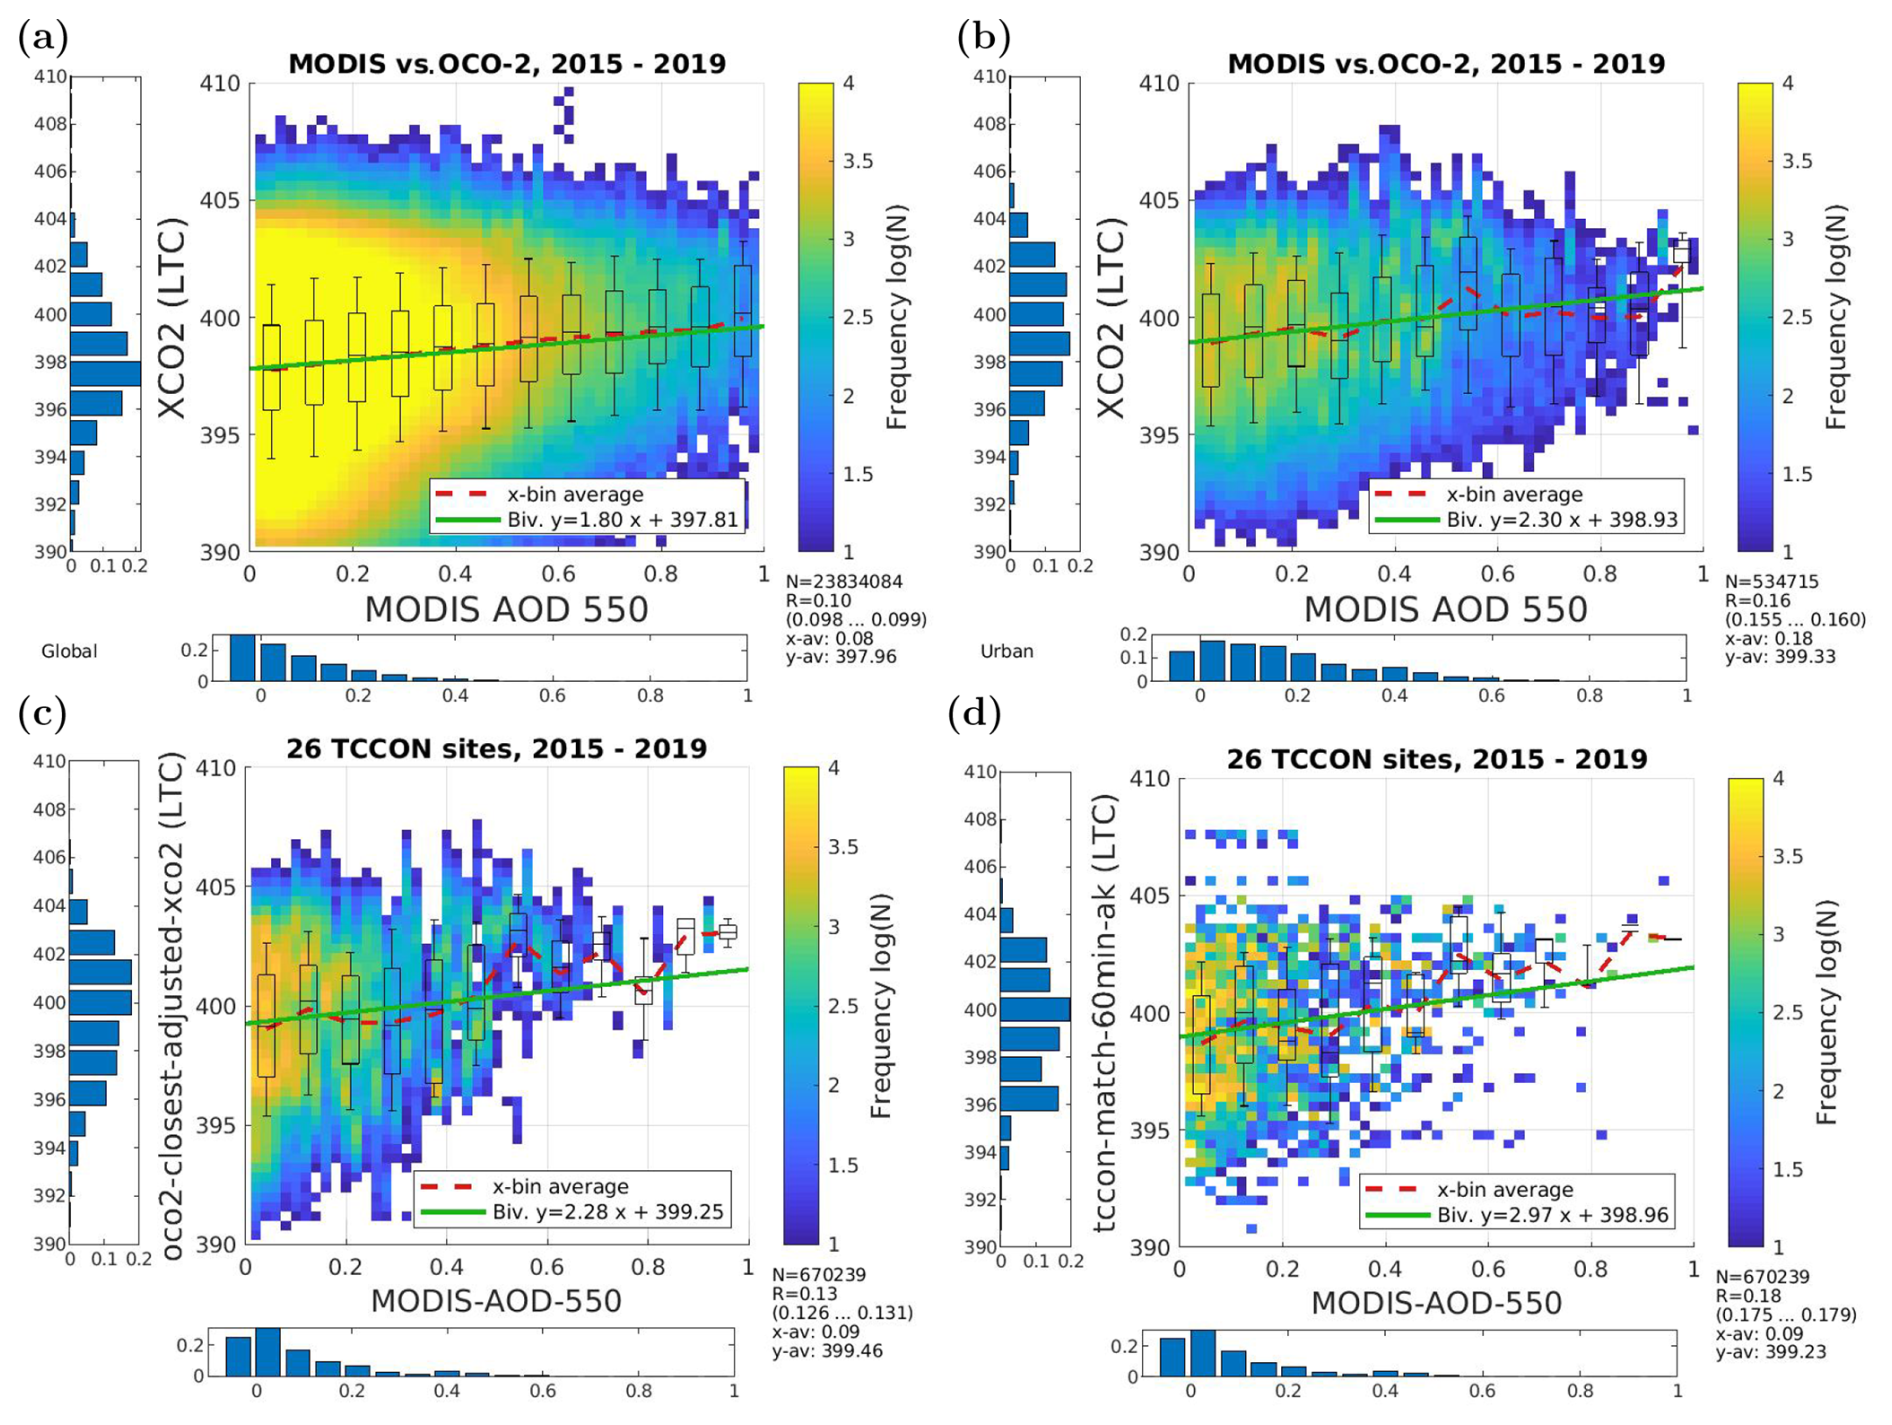
Figure 8Dependence of XCO2 (LTC) on MODIS AOD for different subsets (quality-filtered data). The dashed red line shows binned mean XCO2 values for MODIS AOD bins. The green line shows a corresponding bivariate linear fit. The box plot shows the interquartile range for an AOD bin, while the whiskers show 9th and 91st percentiles. The text inset in the lower right corner shows similar information as in Fig. 4, with the addition of a 95 % confidence range for the correlation coefficient R in parentheses. (a) Global collocated dataset. (b) Urban data subset. (c) Collocated MODIS–OCO-2–TCCON dataset, showing OCO-2 XCO2 values (with TCCON priori adjustment). (d) Collocated MODIS–OCO-2–TCCON dataset, showing TCCON XCO2 values (60 min average centered at the OCO-2 overpass time).
Table 3Correlation and bivariate linear regression slopes for XCO2 vs. AOD for different subsets and for AOD from different instruments (p values for all cases). For the collocated TCCON dataset, XCO2 values from OCO-2 (TCCON(1)) and TCCON (TCCON(2)) are used.
Disentangling the effects of AOD and XCO2 differences in the comparison is not straightforward. One should also note that the TCCON sampling may affect the results. For example, not all of the included TCCON sites have data for the whole 5-year period. In particular, some sites with higher AOD and XCO2 values are included only towards the end of the time period. We also see that the TCCON sites are not representative for the globe in the sense that the average value of OCO-2 XCO2 for the TCCON subset is 1.5 ppm higher than the global average for data collected with MODIS (Table 2). Most of the TCCON sites are located in the Northern Hemisphere, with large gaps between the sites. A more detailed analysis considering individual TCCON sites would be required to confirm the observed dependencies, and this is the subject of a separate study.
To conclude this section, we find that there is a linear relationship between OCO-2 XCO2 and MODIS AOD (Fig. 8a). We also find a linear relation between the OCO-2 XCO2 bias and MODIS AOD (Fig. 10a). In addition, we find a relation between the AOD difference between OCO-2 and MODIS and the OCO-2 XCO2 values, as shown in Fig. 7a. Aerosols are related to OCO-2 XCO2 retrievals in two ways: there is a real correlation between XCO2 and AOD due to co-emission of aerosols and CO2. There is also an aerosol-related bias in the OCO-2 retrievals, which acts in the opposite direction as the co-emission but with a smaller magnitude, thus partly masking the co-emission effect. However, we are unable to directly relate the AOD difference observed between OCO-2 and MODIS to the XCO2 difference observed between OCO-2 and TCCON for the quality-filtered data. This is due to the nontrivial AOD difference observed between OCO-2 and MODIS, further complicating the entanglement caused by the two competing aerosol effects.
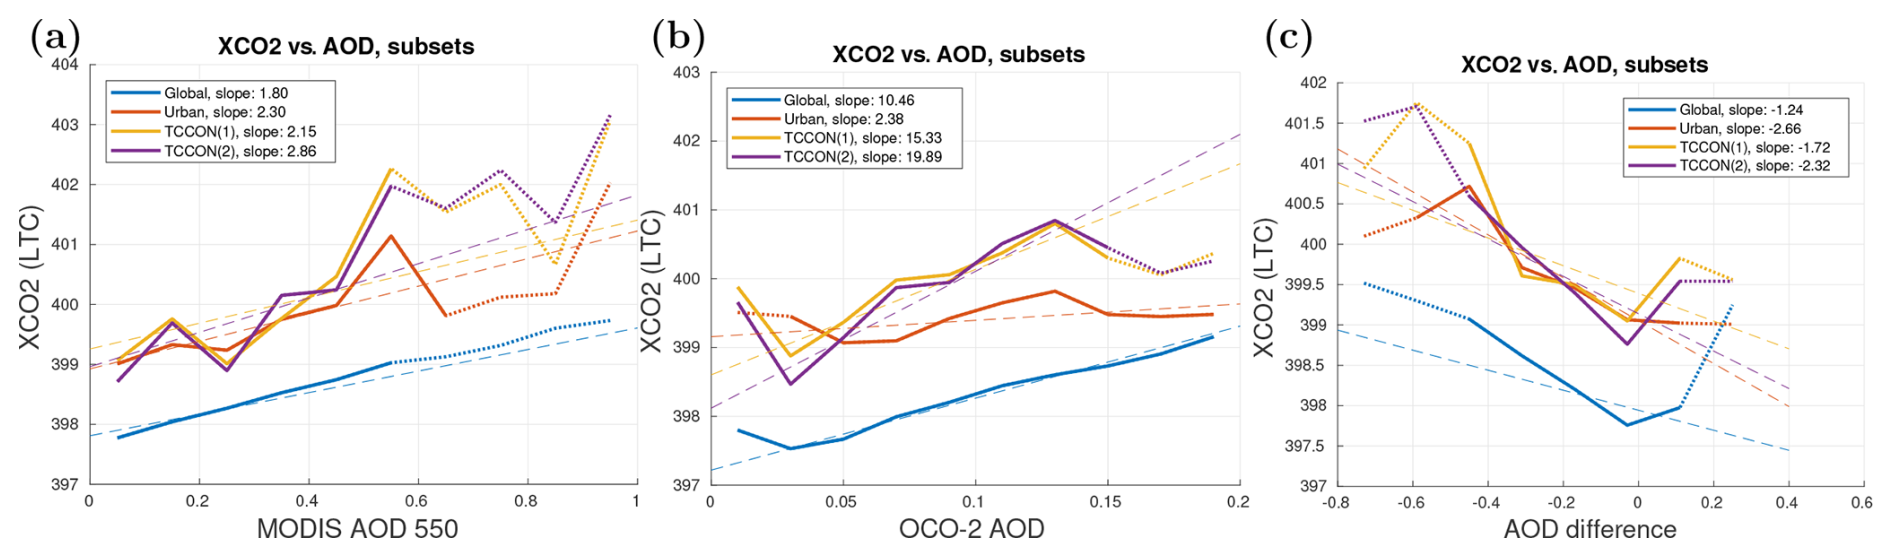
Figure 9Dependence of bin-averaged XCO2 (linear-trend-corrected, quality-filtered) on AOD for three subsets of OCO-2 data and TCCON (solid lines). (a) XCO2 vs. MODIS AOD. (b) XCO2 vs. OCO-2 total AOD. (c) XCO2 vs. AOD difference (OCO-2 − MODIS). The dashed lines are simple linear regression lines. The dotted parts of the bin average lines correspond to AOD bins with less than 1 % of all data.
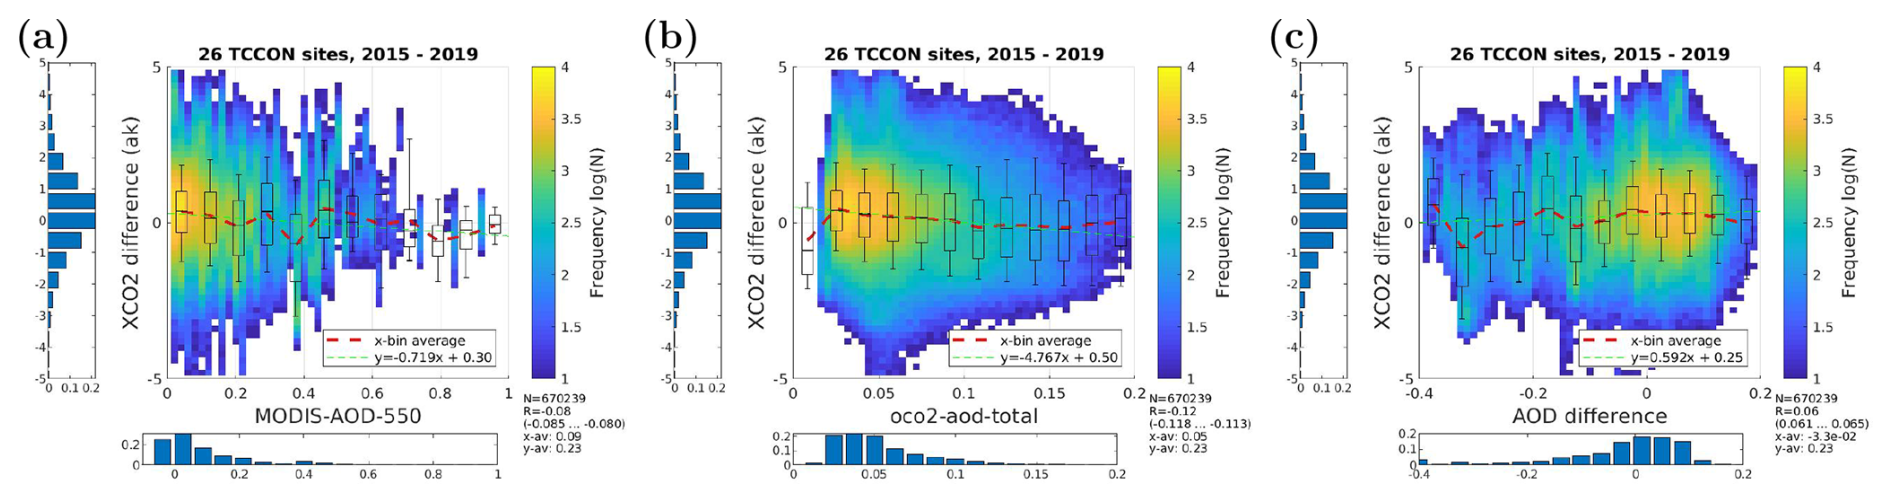
Figure 10XCO2 vs. AOD for the collocated quality-filtered TCCON–OCO-2–MODIS dataset (2015–2019). The XCO2 value from TCCON (ttccon-match-60min) is aggregated for a 1 h time window centered at the OCO-2 overpass time. The XCO2 difference is OCO-2 minus TCCON, and the AOD difference is OCO-2 minus MODIS.
4.4 Alternative AOD thresholds in anticipation of the CO2M
Satellite XCO2 retrievals are known to have higher uncertainty in high aerosol conditions (Connor et al., 2016; O'Dell et al., 2018). Setting an AOD threshold for good-quality retrievals is always a trade-off between coverage and quality of the data. While for OCO-2 a strict AOD threshold is used to ensure good-quality retrievals, for the coming CO2M good coverage over polluted regions is also crucial for monitoring CO2 emissions. In the latter case it is also important to avoid possible sampling bias caused by excluding high-AOD areas from analysis, considering the co-emission of anthropogenic aerosols and CO2. The CO2M mission will include a dedicated aerosol instrument, the Multi-Angle Polarimeter (MAP), and is expected to be better equipped to deal with high aerosol conditions. In the upcoming CO2M mission the required AOD threshold for good-quality retrievals is designed to be 0.5 (ESA, 2024). In this section we estimate how the selected AOD threshold affects the coverage of satellite XCO2 retrievals, in particular in urban areas with high co-emission of aerosols and CO2.
Here we use the collocated, quality-filtered OCO-2–MODIS dataset as a proxy for CO2M data. This dataset includes high-MODIS-AOD pixels, although the OCO-2 quality filter including an AOD threshold of 0.2 has been applied. We assume that the OCO-2 quality filtering ensures that the XCO2 data are of good quality, even for higher-MODIS-AOD cases, as CO2M data are expected to have AOD up to 0.5. This assumption is supported by a comparison of quality-filtered OCO-2 XCO2 data against TCCON, where additional collocated MODIS AOD thresholds had a minimal effect on the retrieval quality (not shown). We further assume that the MODIS AOD in the collocated dataset is representative of “true” AOD and can be used to study the AOD threshold, even though the OCO-2 quality filtering has removed many of the original pixels. With this collocated dataset, we can test the effect of relaxing the MODIS AOD threshold from 0.2 to 0.5. We emphasize that this does not mean that we extend the OCO-2 coverage (or propose relaxing the OCO-2 AOD threshold); the MODIS AOD threshold used here is an additional constraint on the quality-filtered OCO-2 data.
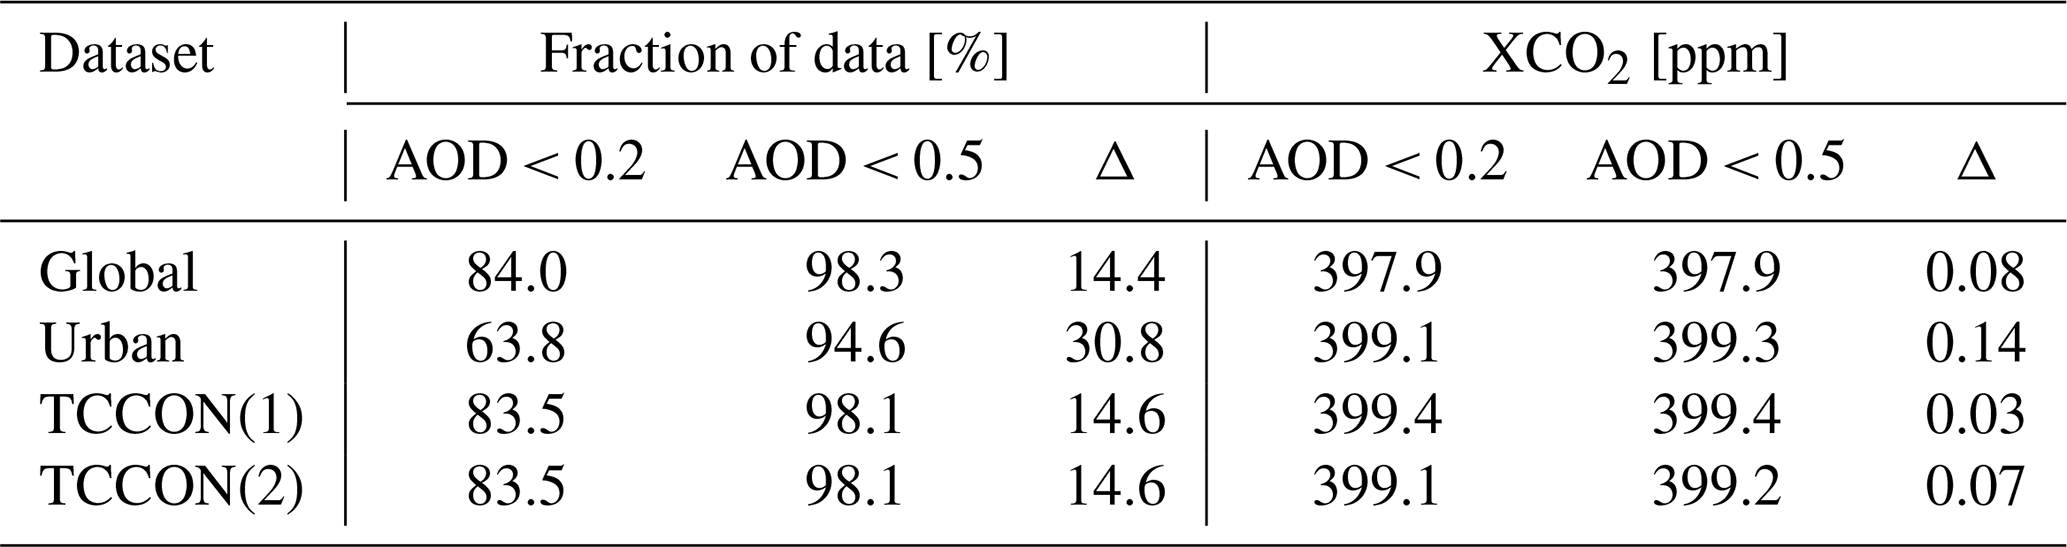
Table 4 shows the fraction of collocated quality-filtered data for two different MODIS AOD bins using either 0.2 or 0.5 as the threshold for maximum AOD (at 550 nm). For the global dataset relaxing the MODIS AOD threshold from 0.2 to 0.5 increases the fraction of acceptable data by 14.4 percentage points, while the average XCO2 is increased by 0.08 ppm. For the urban areas the increase in coverage is as high as 30.8 percentage points, while the increase in XCO2 is 0.14 ppm. This finding supports the idea that being able to perform reliable XCO2 retrievals at higher aerosol loads is crucial for capturing anthropogenic CO2 emissions.
Figure 11 shows the fraction of data in the two considered MODIS AOD bins zoomed in to Southeast Asia, which stands out as a high-AOD area. Here the two MODIS AOD bins partly overlap: M1 is −0.2–0.2 and M2 is −0.2–0.5. M1 contains 59 % of the data, while M2 contains 94 % of the data in this area. We see that large areas have a low fraction of data in M1, while for M2 only a few heavy-AOD areas have a low fraction of data within the bin. The high values over India and eastern China indicate that in these areas relaxing the MODIS AOD threshold from 0.2 to 0.5 increases the fraction of acceptable data considerably.
In conclusion, here we have used the quality-filtered OCO-2 data as a proxy for the coming CO2M data, which can be further filtered by using AOD thresholds from collocated MODIS data. We find that if CO2M can handle AODs up to 0.5, this will significantly increase the coverage, in particular in urban areas, compared to a case where AOD only up to 0.2 could be allowed. We also find that due to the correlation found between AOD and XCO2, including data with higher AOD increases the mean XCO2 values, especially for the urban pixels.
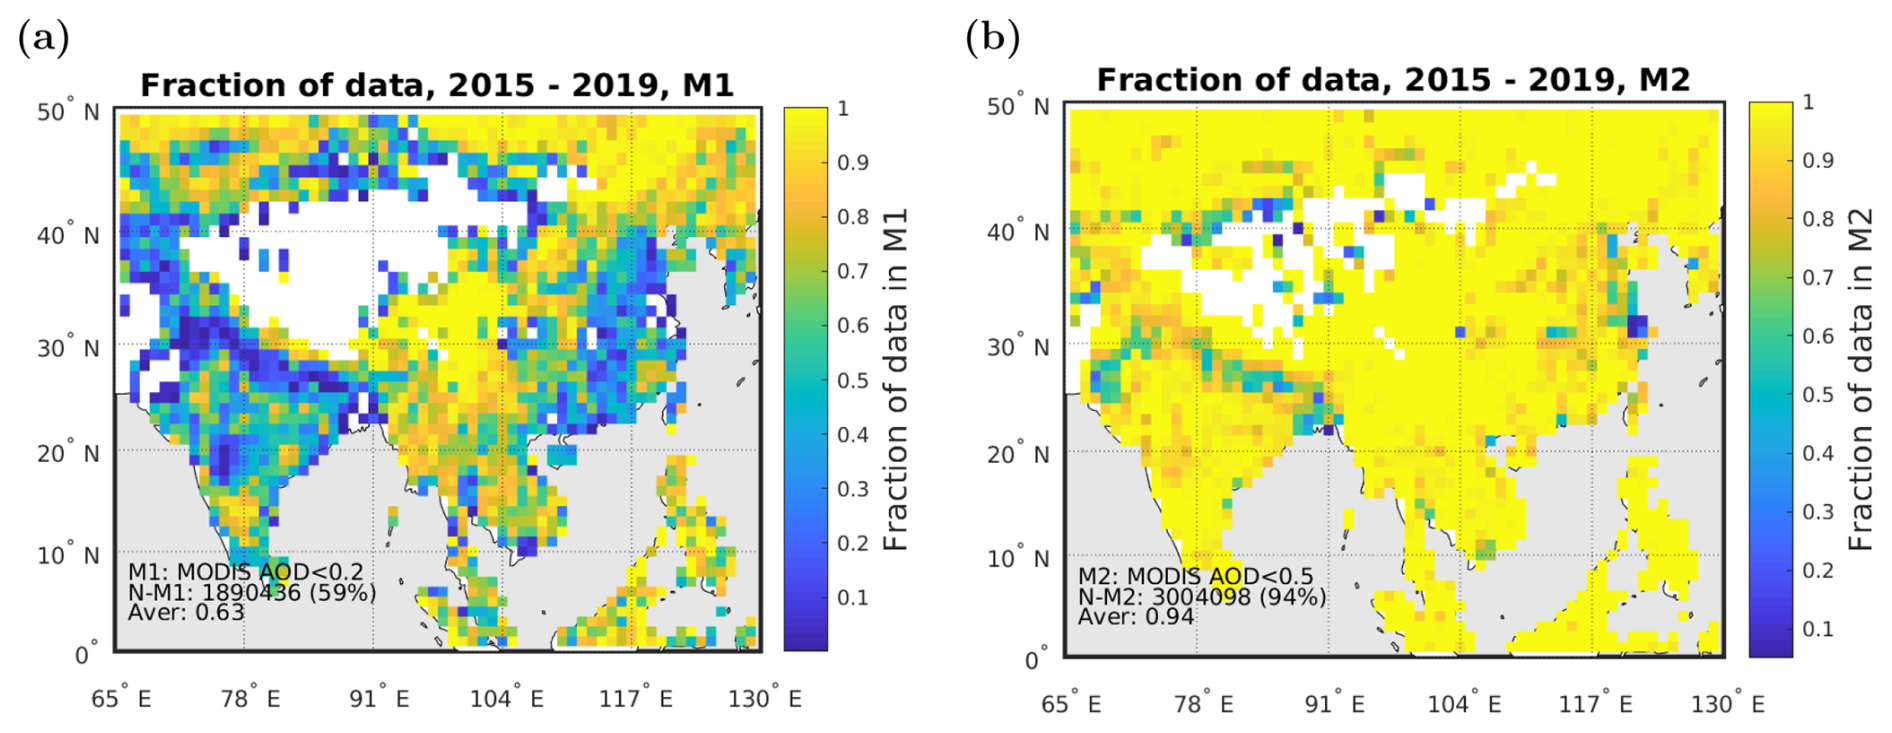
Figure 11Difference in using a MODIS AOD threshold 0.2 or 0.5 in Asia. Panels (a) and (b) show the fraction of data in M1 or M2, respectively, for each 1° × 1° grid cell.
Table 4Difference between using 0.2 or 0.5 as the MODIS AOD threshold (quality-filtered data).
In this work, we have compiled and analyzed a 5-year dataset of collocated aerosol and XCO2 satellite observations from MODIS/Aqua and OCO-2, focusing on the relationships between aerosols, XCO2 retrieval quality, and data coverage in polluted areas. The primary aim was to understand how aerosols influence XCO2 retrievals and how quality filtering decisions impact data availability and quality, particularly in urban regions with high emissions. We have shown that the total AOD value in ACOS full-physics retrieval differs considerably from the MODIS Dark Target AOD over land for a large fraction of the data. The observed difference depends on location and conditions, but on average OCO-2 tends to overestimate at low aerosol loads and underestimate at higher AODs. This discrepancy highlights potential limitations in OCO-2 aerosol modeling that could influence XCO2 retrievals. We found that the AOD difference is connected to the retrieved XCO2 in the unfiltered dataset: XCO2 values are lower when OCO-2 overestimates AOD and higher when AOD is underestimated.
We have found evidence of covariance of AOD and XCO2, partly reflecting co-emission of anthropogenic CO2 and aerosols from anthropogenic sources. A comparison with TCCON revealed a weak but statistically significant dependence of the XCO2 bias on the AOD such that at high AOD OCO-2 tends to underestimate XCO2. This aerosol bias acts in the opposite direction as the observed covariance between AOD and XCO2, partly masking the correlation.
The observed correlation between AOD and XCO2 means that removing data under high AOD conditions not only excludes regions with elevated aerosol loads but also disproportionately removes observations of high XCO2. The current OCO-2 quality filtering, which excludes data with AOD > 0.2, effectively mitigates retrieval errors associated with aerosol effects but at the cost of reduced coverage in polluted regions. These regions, such as urban areas with elevated CO2 emissions, are critical for understanding anthropogenic contributions. Relaxing the AOD threshold to 0.5 increased the number of accepted data points globally by 14.4 percentage points, with a substantial improvement of 30.8 percentage points over urban areas. This adjustment would enable more comprehensive sampling of high-emission areas, especially in regions like Asia, where constant elevated aerosol loads often lead to significant data loss.
The correlation between AOD and XCO2, combined with the observed XCO2 bias at high AOD, underscores the challenge of separating real atmospheric covariance from retrieval artifacts. While our study does not directly link OCO-2 AOD underestimation to the observed XCO2 bias, these results highlight the critical need to refine aerosol handling in future XCO2 retrieval algorithms, particularly in polluted regions. The focus in this paper has been on the global multiyear statistics of AOD and XCO2 in the collocated satellite dataset. The comparison with ground-based TCCON data has been done only statistically, combining all sites, to give a first reference point for independent data. Future work should focus on detailed site-specific studies, including comparisons with ground-based TCCON data, to disentangle retrieval biases from real atmospheric correlations.
Relaxing AOD thresholds could mitigate the significant sampling bias observed in high-emission regions but requires careful calibration to balance data quality and coverage. The upcoming CO2M mission, with its dedicated aerosol instrument and higher AOD threshold, represents a key opportunity to address these challenges and to ensure that observations provide robust support for the Global Stocktake and other climate initiatives.
Table A1Number of data points and average AOD and XCO2 values for the 5 years of collocated OCO-2 and MODIS DT-land data considered in this work. The second column (“OCO2”) shows the number of original OCO-2 data points (in millions) for each year. The next column (“MOD”) shows the fraction of OCO-2 data which have a matching MODIS AOD observation. The fourth column (“QF”) shows the fraction of collocated data after the OCO-2 quality filter has been applied (with respect to all collocated data). Also shown are the yearly average OCO-2 XCO2 value and AOD value for each instrument, as well as the correlation coefficient (R) between the collocated AOD data for the unfiltered and filtered data, respectively.
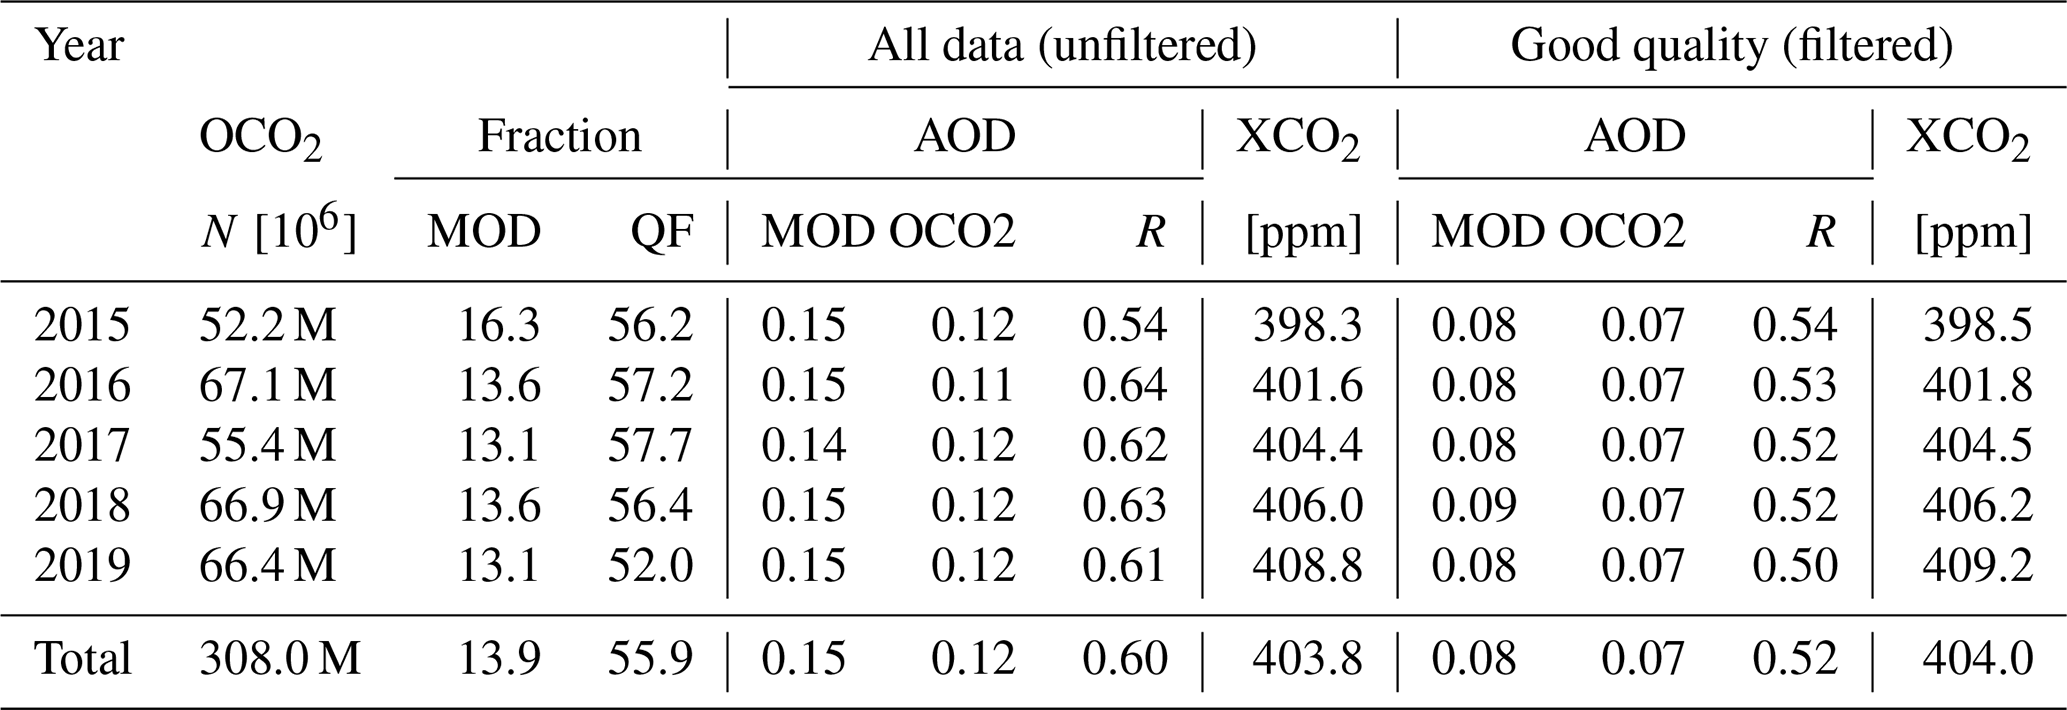
Table A2XCO2 statistics in different datasets without OCO-2 quality filtering. For TCCON collocation XCO2 is obtained from OCO-2 (TCCON(1)) and TCCON (TCCON(2)). Anomaly data are not available for the unfiltered case; instead, ΔXCO2 is calculated with respect to the reference value of 398.1 ppm (the total global average value for good-quality data). Linear trend correction (LTC) has been applied. The p values are for all cases.
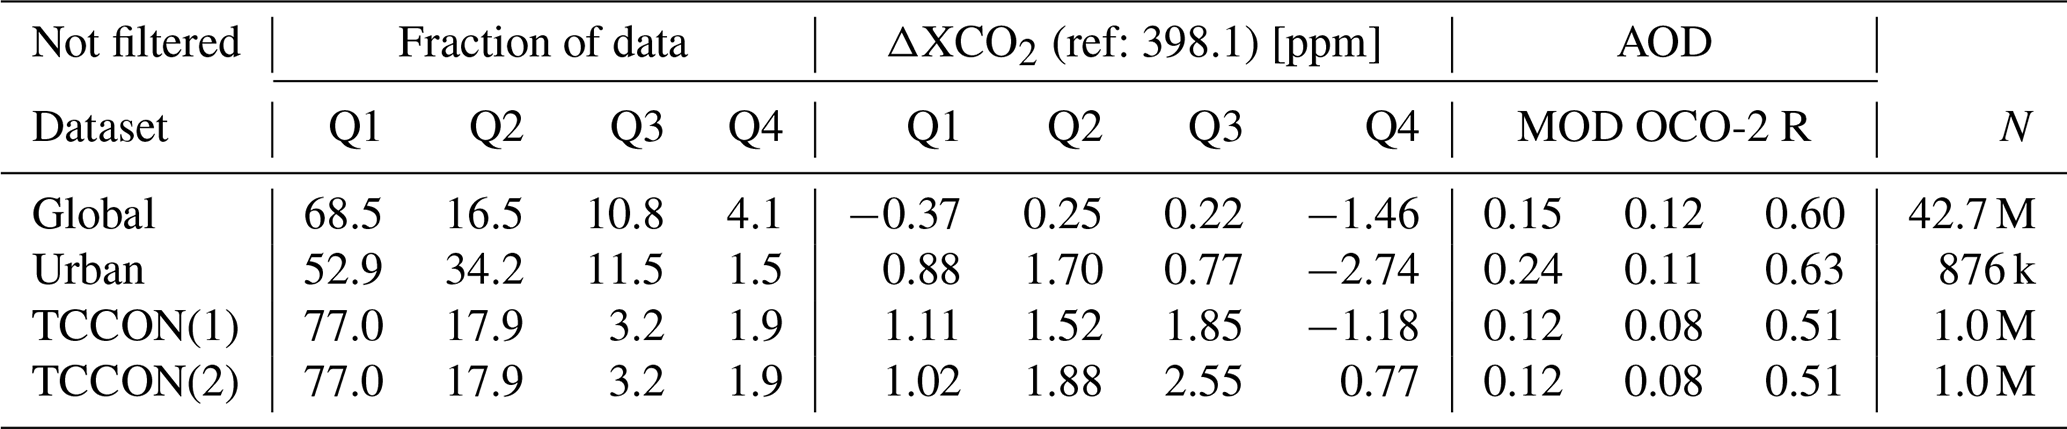
Table A3Statistics for correlation between AOD and XCO2 as well as bivariate linear regression slopes for different subsets of the quality-filtered collocated MODIS–OCO-2 5-year (2015–2019) dataset. The first three slopes (columns 3, 5, and 7) are for XCO2 as a function of AOD (or AOD difference), while the last column gives the fitted slope for OCO-2 AOD as a function of MODIS AOD. The p values are smaller than 10−6 for all cases.
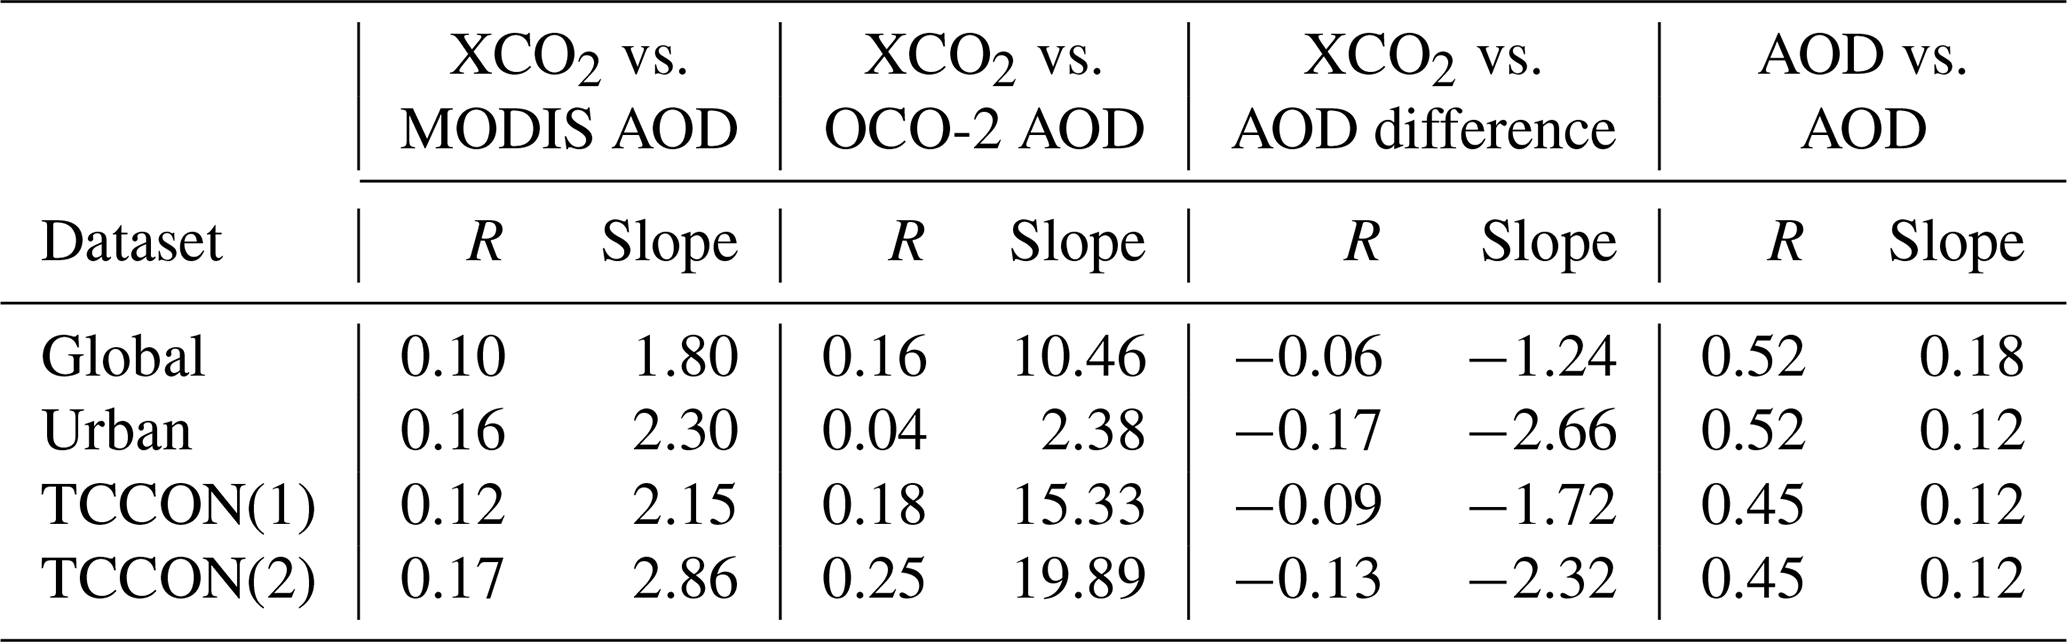
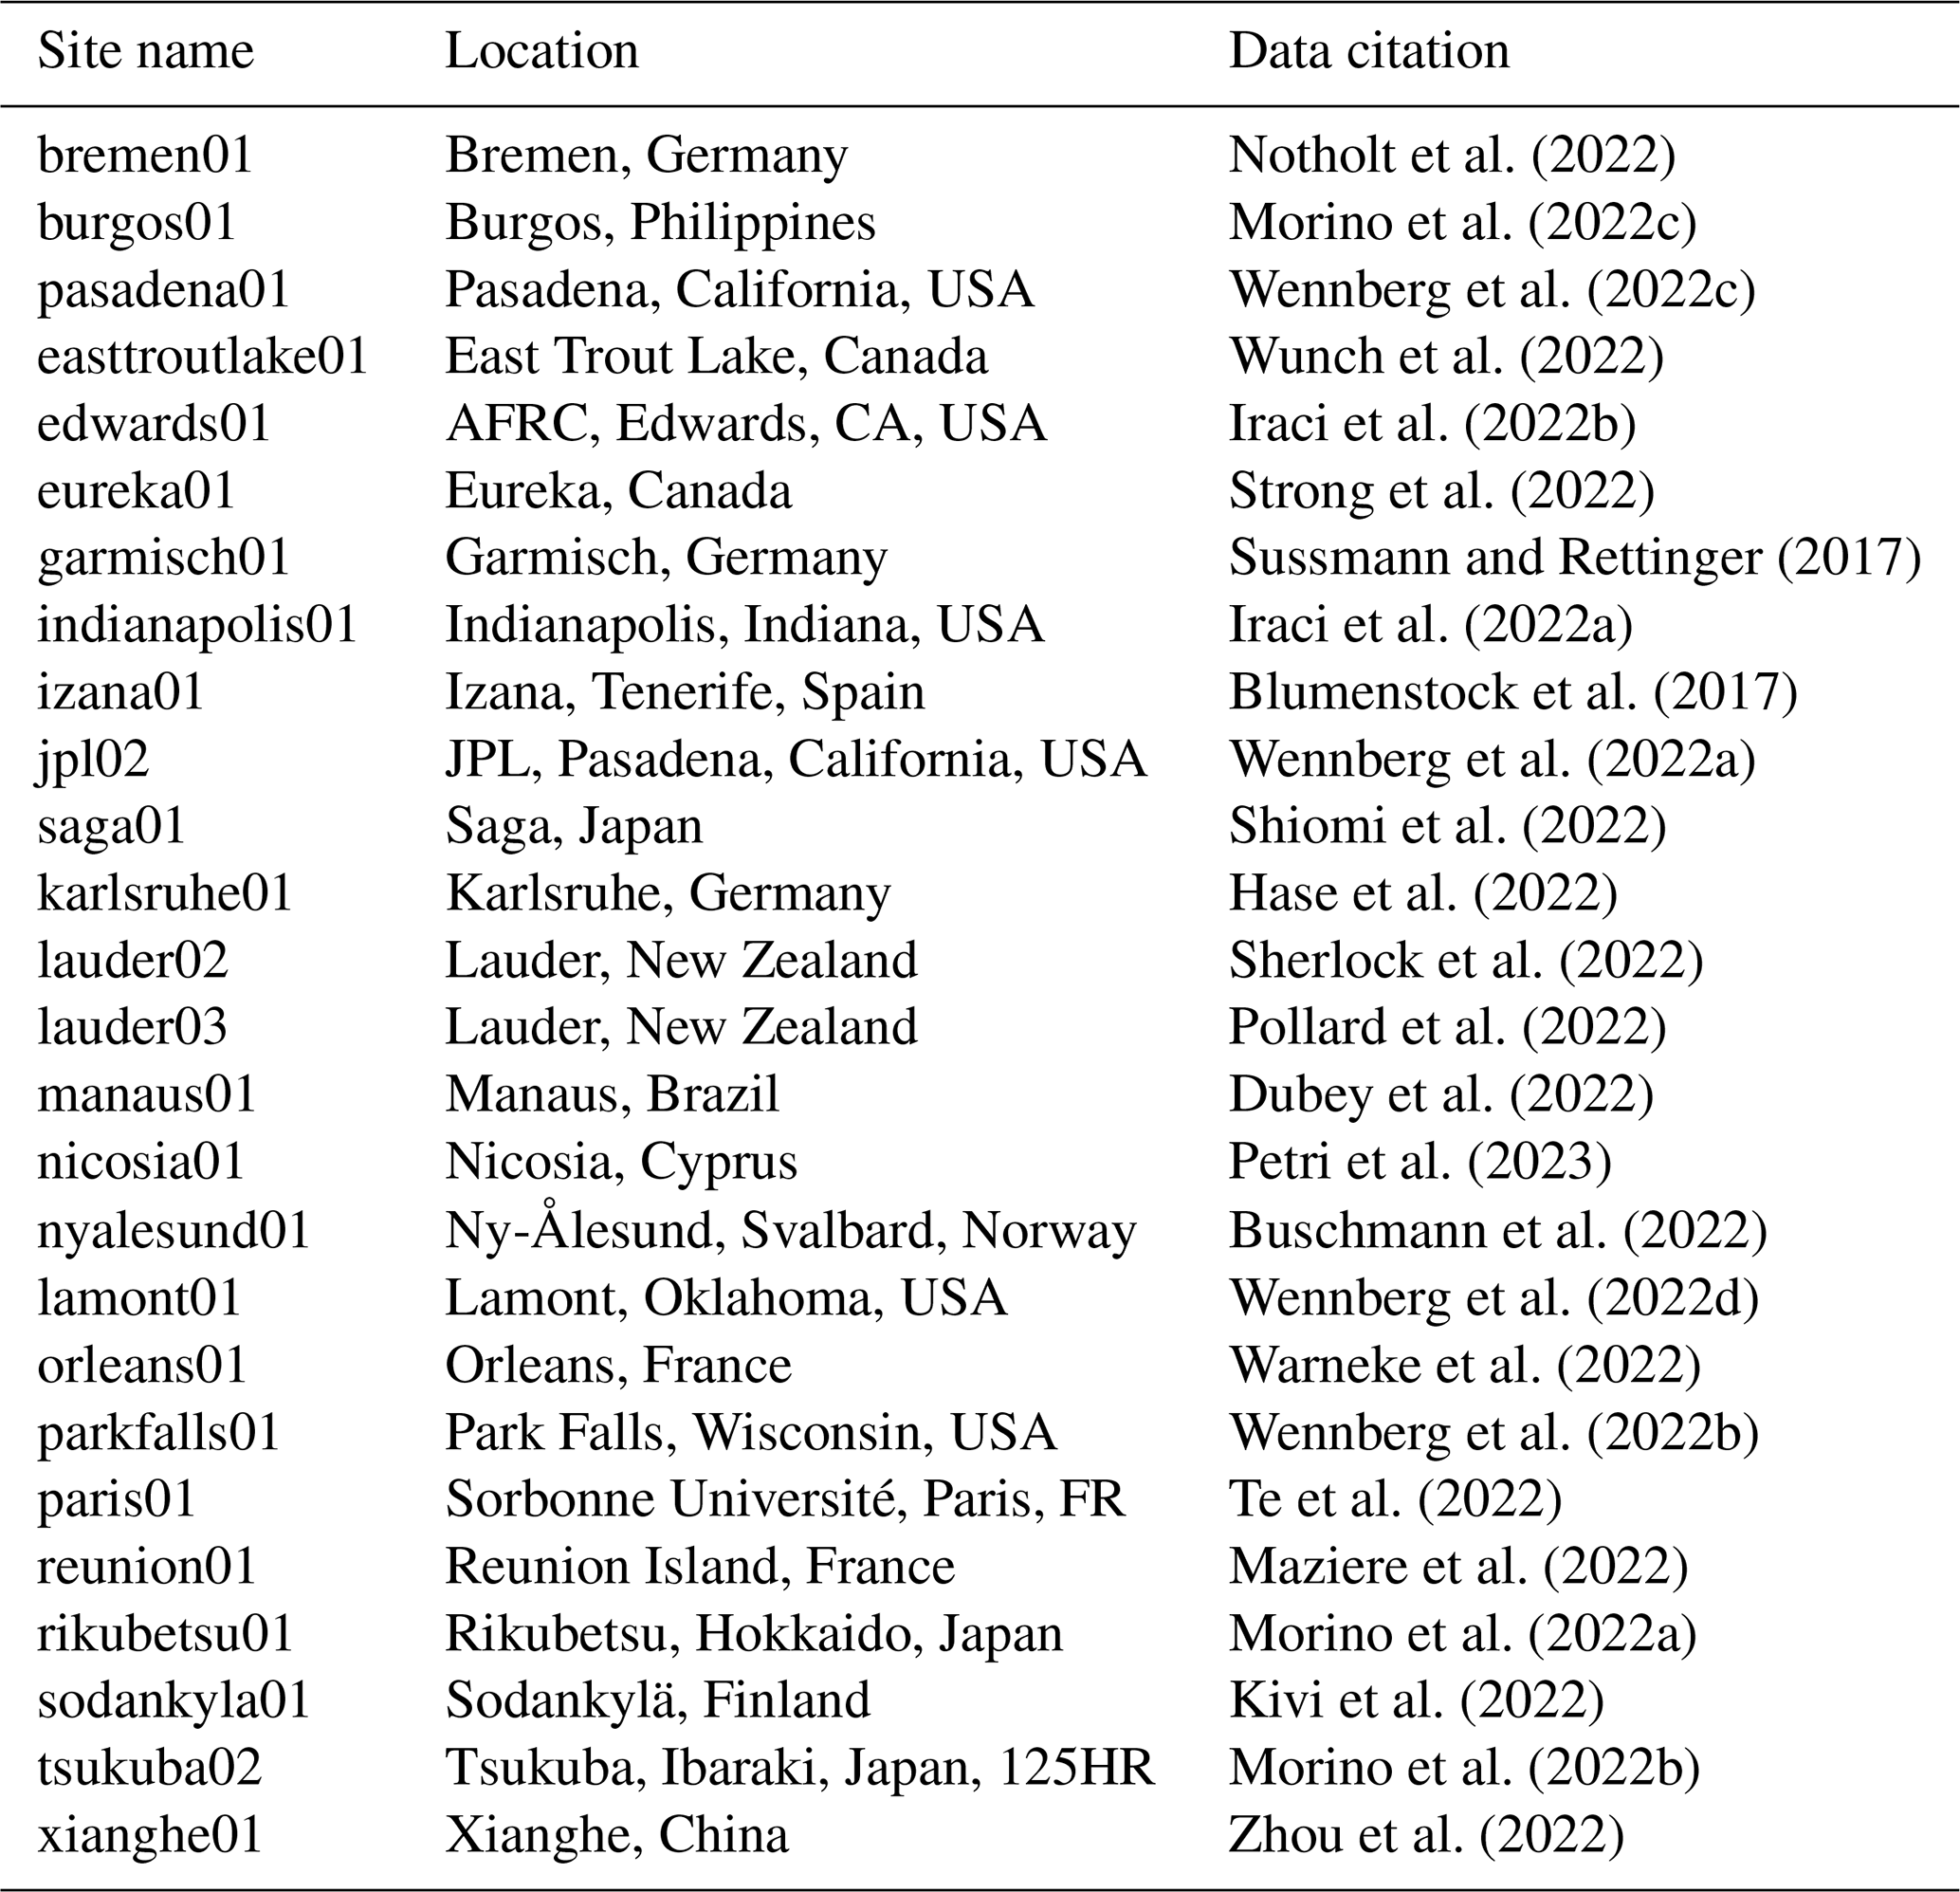
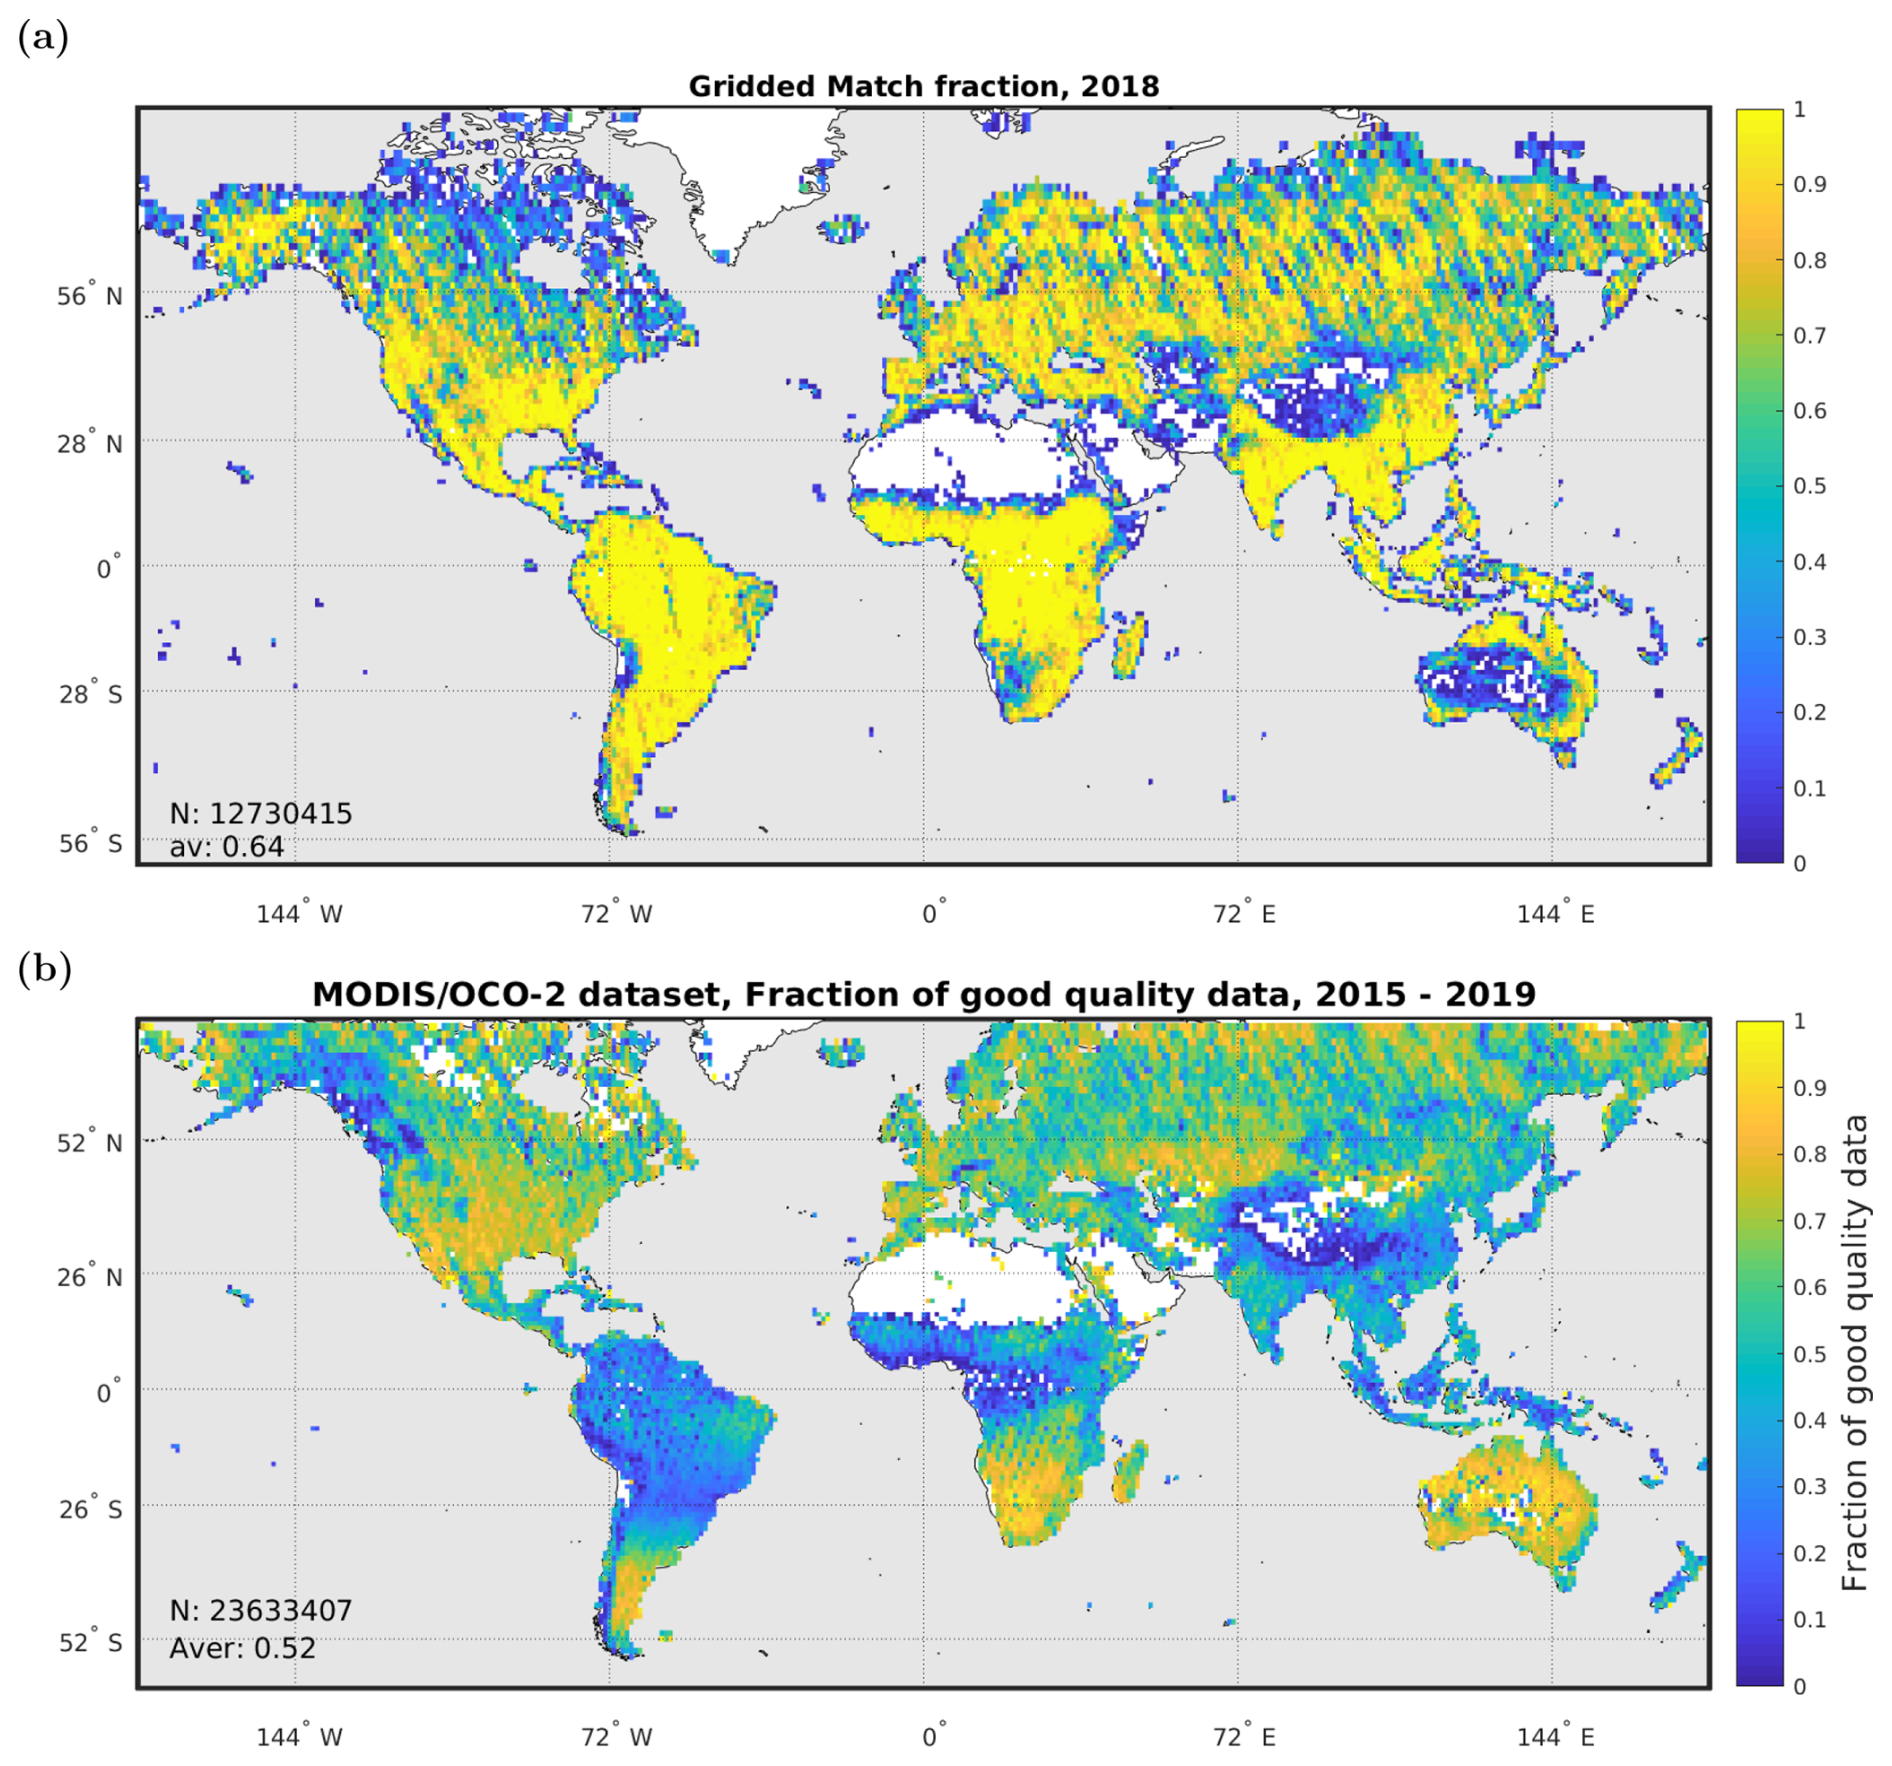
Figure A1(a) Fraction of OCO-2 data points (without quality filtering) with matching MODIS data for 1° × 1° grid cells. The fraction is only shown for grid cells which have at least one MODIS data point. N means the total number of MODIS data points. The average fraction (64 %) of OCO-2 data points with matching MODIS data is calculated over grid cells which have a nonzero fraction. Example for 1 year: 2018. (b) Fraction of good-quality data for each 1° × 1° grid cell in the collocated MODIS–OCO-2 dataset.
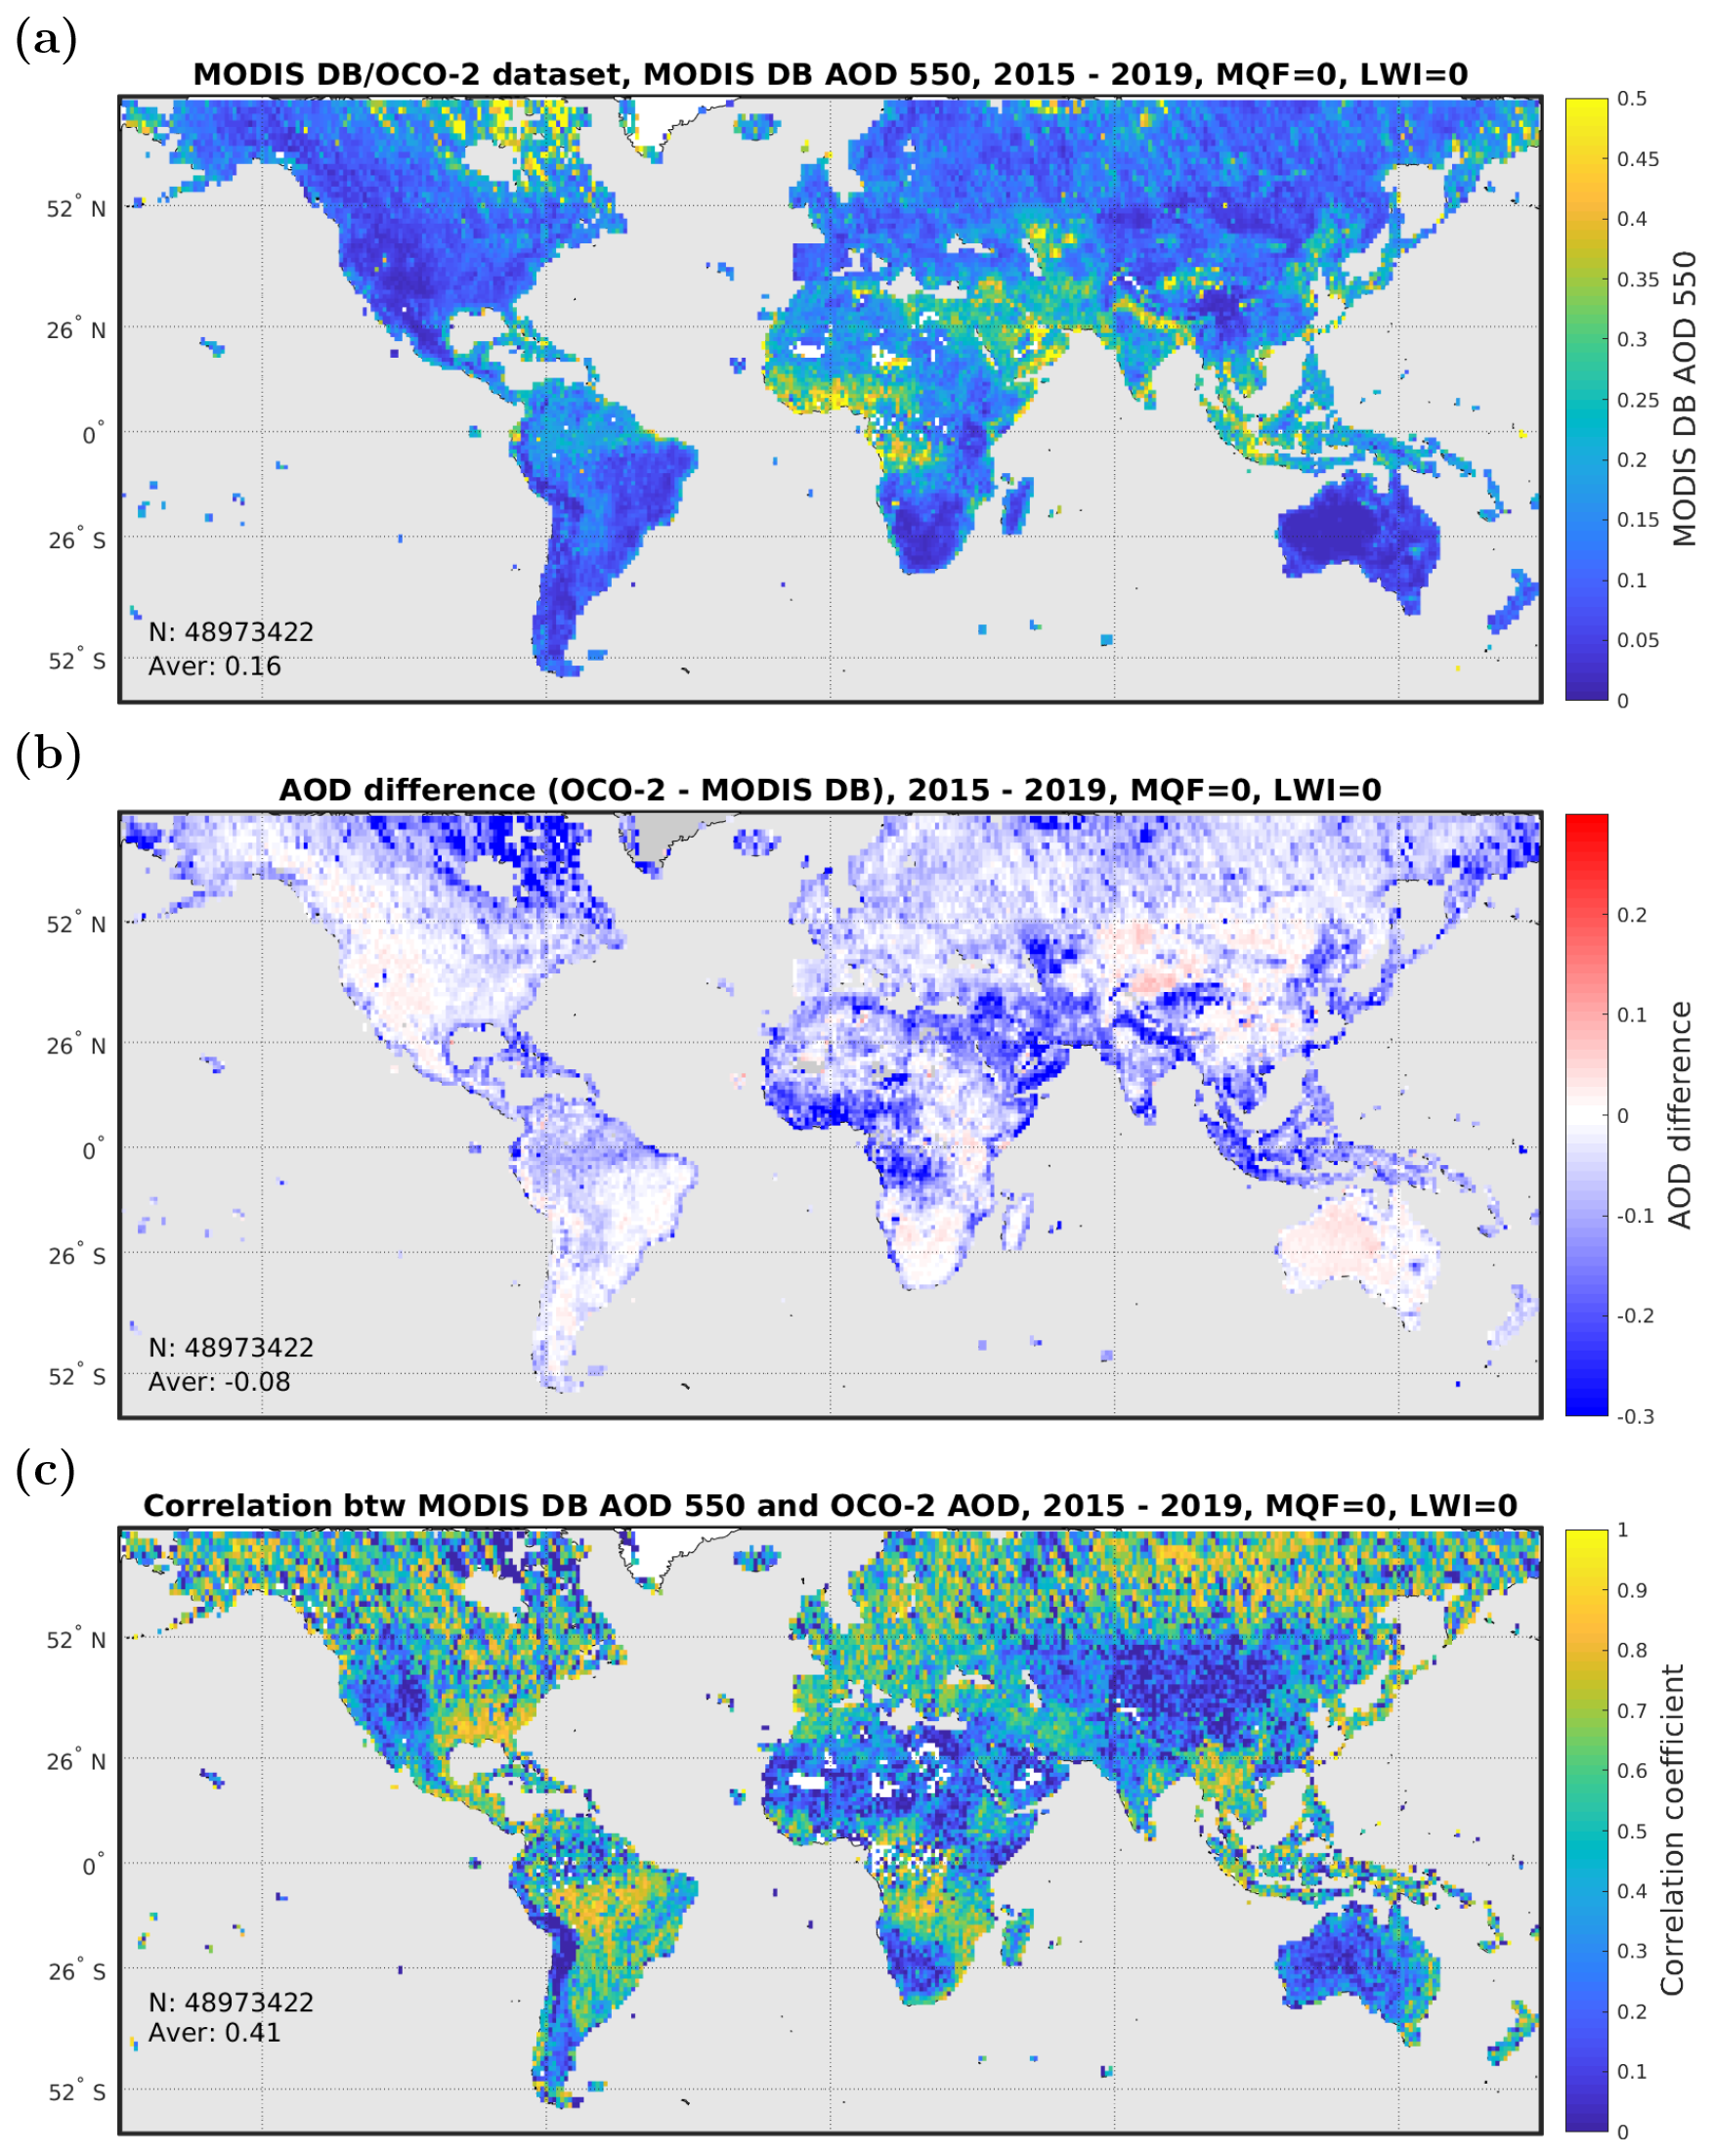
Figure A2Same as Fig. 1, but for MODIS Deep Blue (DB).
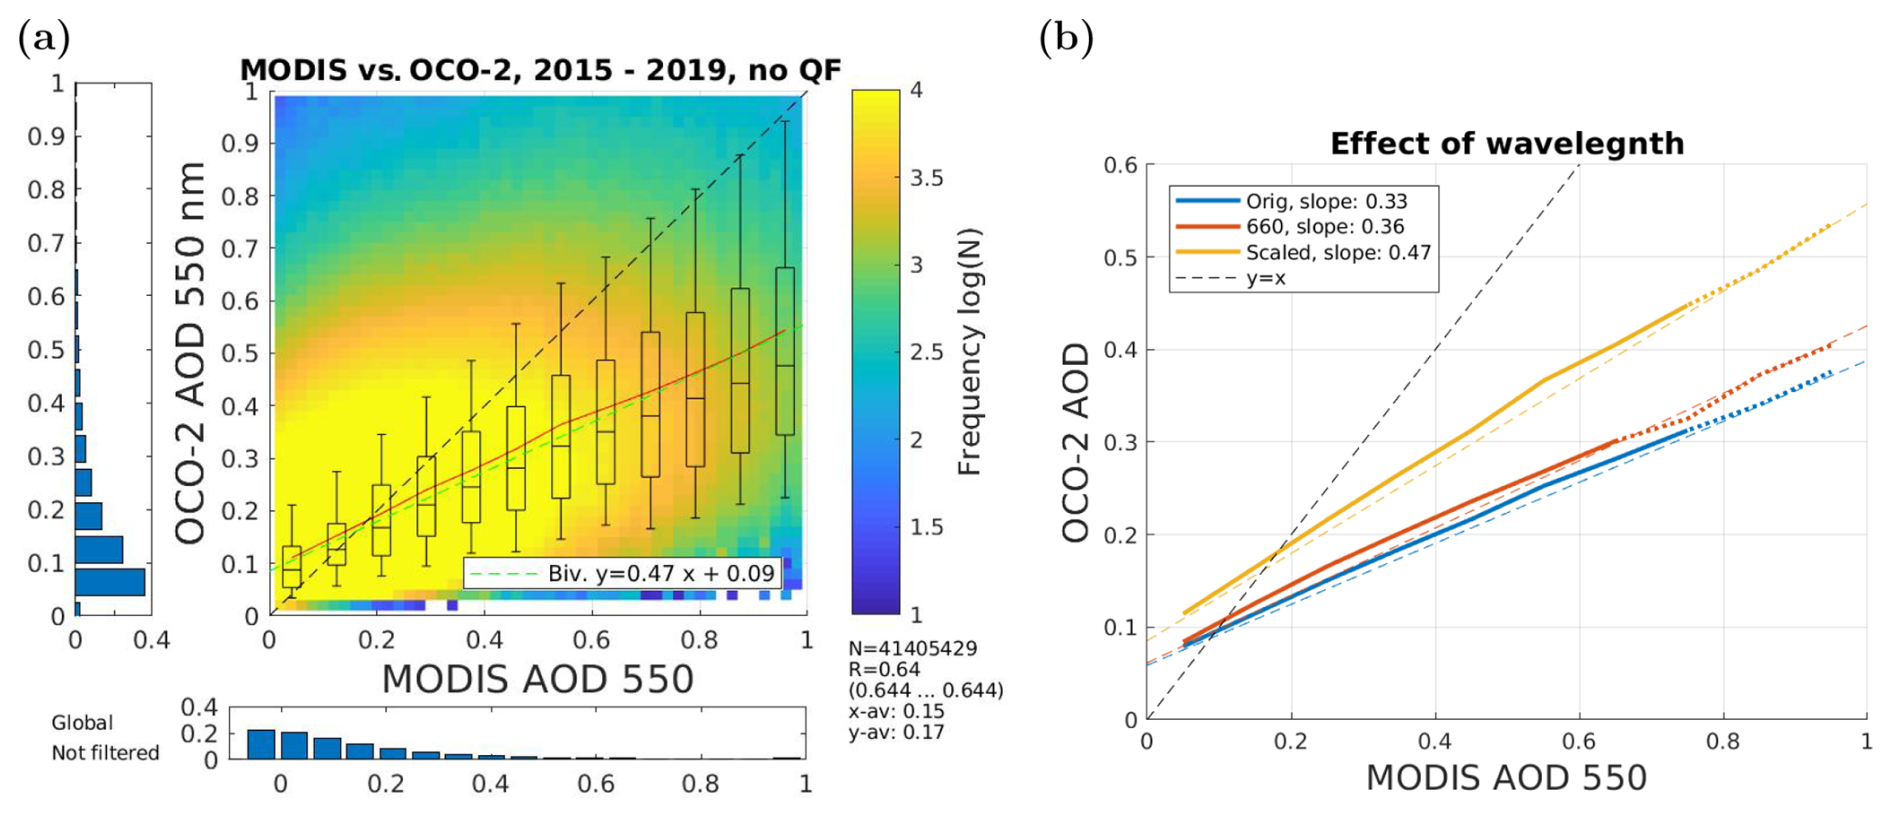
Figure A3(a) AOD comparison with OCO-2 AOD scaled from 755 to 550 nm using the Ångström exponent from collocated MERRA-2 data. The red line shows binned mean values, the dashed green line shows a bivariate linear fit, the boxes show the interquartile range, and the whiskers show the 9th and 91st percentiles for MODIS AOD bins. (b) Comparison of OCO-2 AOD against MODIS AOD for three different cases: the original comparison between MODIS AOD at 550 nm and OCO-2 total AOD at 755 nm (“Orig”, blue line), MODIS AOD at 660 nm vs. OCO-2 AOD at 755 nm (“660”, red line), and MODIS AOD at 550 nm vs. OCO-2 AOD scaled to 550 nm (“scaled”, yellow line). Solid lines show bin-averaged OCO-2 AOD (for MODIS AOD bins); the dotted part corresponds to bins with less than 1 % of all data. Dashed lines show bivariate linear fits. OCO-2 quality filtering has not been applied.
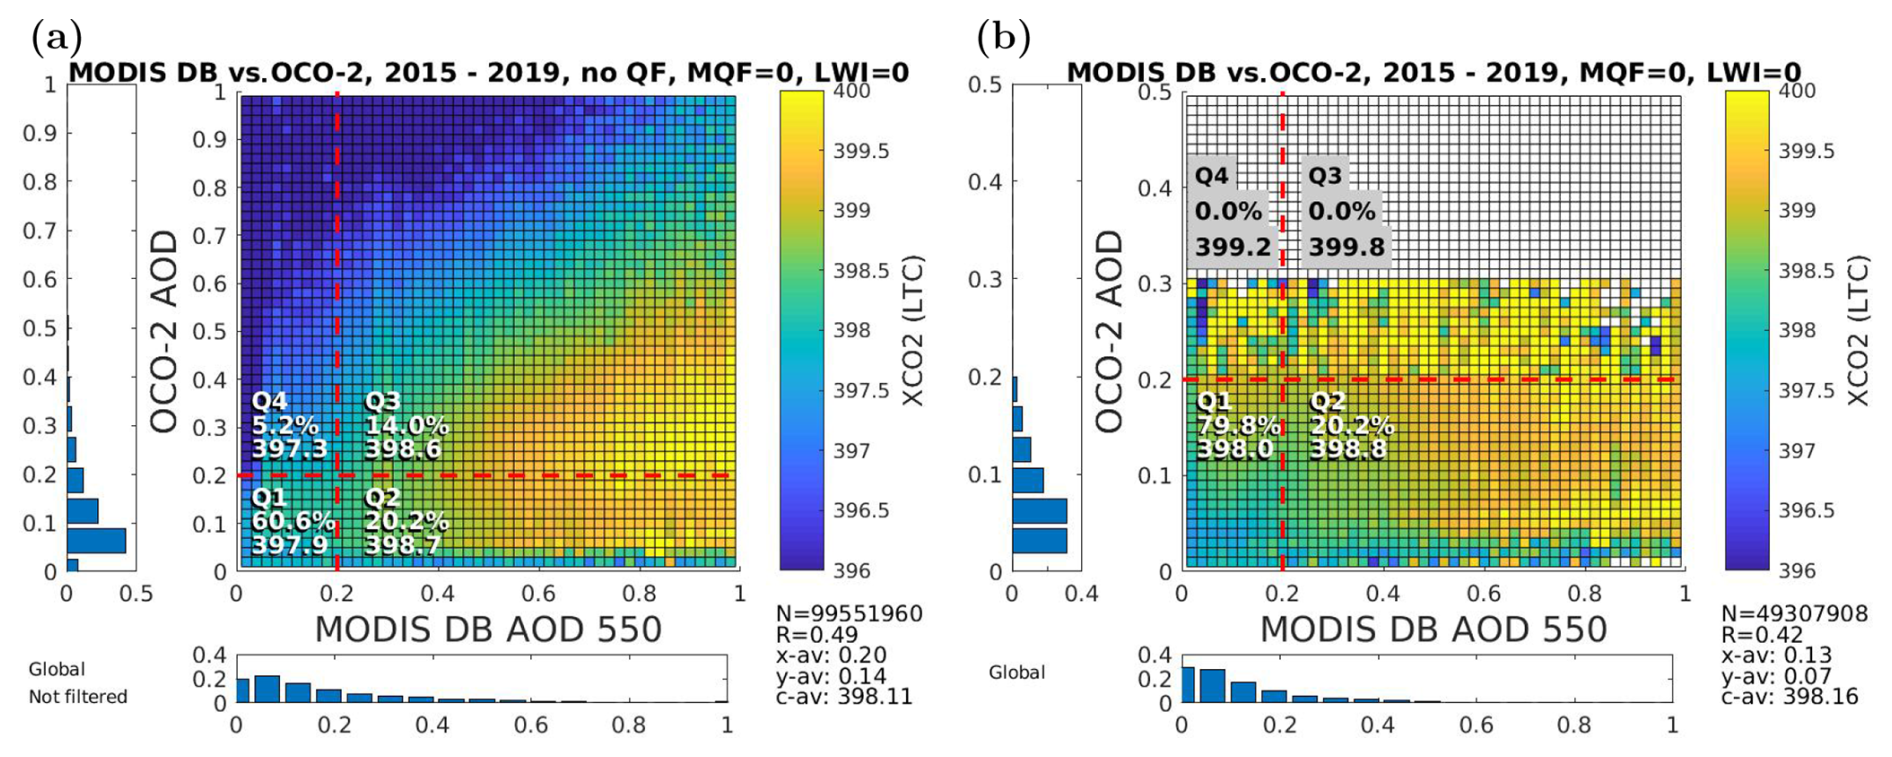
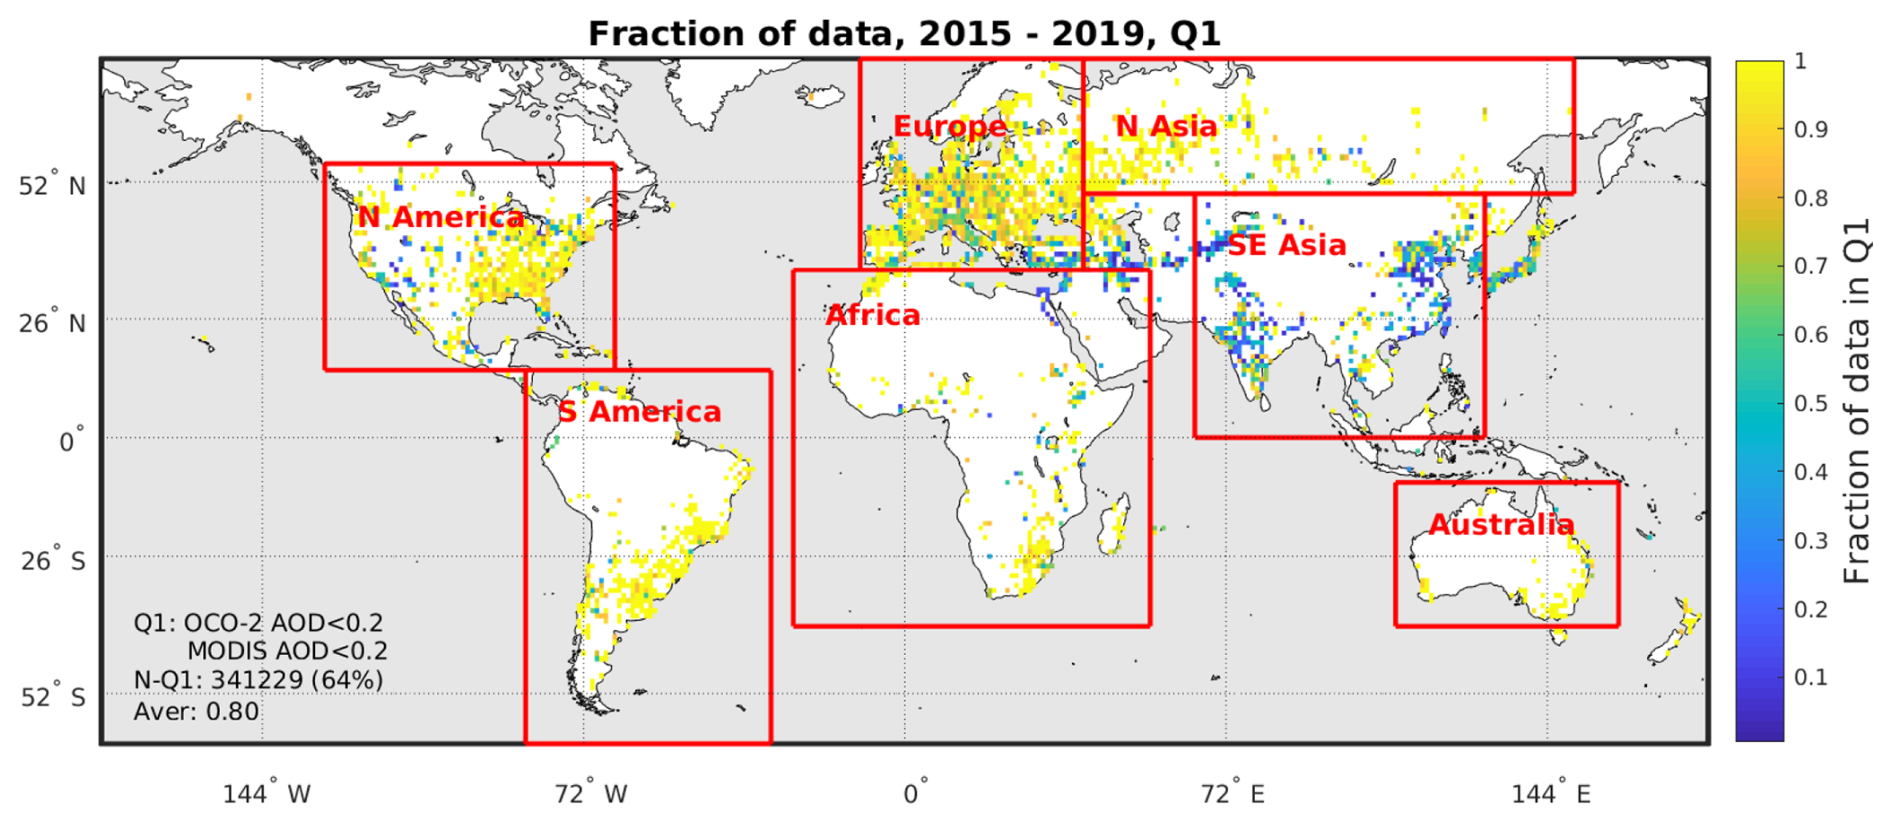
Figure A5Fraction of data in Q1 for urban pixels (areas of dense human habitation using the urban area mask from https://www.naturalearthdata.com/; last access: 22 April 2024) (NaturalEarth, 2024). Also shown are the seven geographic areas used in this study.
The AERONET data are available from NASA Goddard Space Flight Center at https://aeronet.gsfc.nasa.gov/new_web/data.html (NASA, 2024a). The TCCON data were obtained from the TCCON Data Archive hosted by CaltechDATA at https://tccondata.org (CaltechDATA, 2024) (see Table A4 for references). The MODIS data used in this work can be found and downloaded using the NASA Earthdata Search website at https://www.earthdata.nasa.gov/ (NASA, 2024b). The OCO-2 data were produced by the OCO-2 project at the Jet Propulsion Laboratory, California Institute of Technology, and obtained from the OCO-2 data archive maintained at the NASA Goddard Earth Science Data and Information Services Center (OCO-2 Science Team et al., 2020). The collocated OCO-2–MODIS dataset created in this work and related codes are available as open data (Virtanen, 2024).
TV, HL, and AS conceptualized the study. AL did initial MODIS data processing. TV did most of the data processing and visualization. HL did the OCO-2–TCCON data collocation and OCO-2 anomaly data calculations. RN did data and image processing for the collocated AERONET–OCO-2 data. The first draft of the manuscript was written by TV and HL. All authors contributed to editing the final version of the manuscript.
The contact author has declared that none of the authors has any competing interests.
Publisher’s note: Copernicus Publications remains neutral with regard to jurisdictional claims made in the text, published maps, institutional affiliations, or any other geographical representation in this paper. While Copernicus Publications makes every effort to include appropriate place names, the final responsibility lies with the authors.
We thank the AERONET PIs and their staff for establishing and maintaining the sites used in this investigation. We thank the PIs and others operating the TCCON sites for providing the data (Table A4). We thank the MODIS and OCO-2 science teams for the data used in this study.
This research has been supported by the Research Council of Finland (grant nos. 331829, 337552, 353082, and 359196). Part of this work was carried out at the Jet Propulsion Laboratory, California Institute of Technology, under contract with the National Aeronautics and Space Administration (grant no. 80NM0018D0004).
This paper was edited by Meng Gao and reviewed by Zhenping Yin and four anonymous referees.
Blumenstock, T., Hase, F., Schneider, M., García, O., and Sepúlveda, E.: TCCON data from Izana, Tenerife, Spain, Release GGG2020R0, TCCON data archive, hosted by CaltechDATA [data set], California Institute of Technology, Pasadena, CA, USA, https://doi.org/10.14291/tccon.ggg2020.izana01.R1, 2017. a
Buschmann, M., Petri, C., Palm, M., Warneke, T., Notholt, J., and Engineers, A. S.: TCCON data from Ny-Alesund, Svalbard, Norway, Release GGG2020R0, TCCON data archive, hosted by CaltechDATA [data set], California Institute of Technology, Pasadena, CA, USA, https://doi.org/10.14291/tccon.ggg2020.nyalesund01.R0, 2022. a
Butz, A., Hasekamp, O. P., Frankenberg, C., and Aben, I.: Retrievals of atmospheric CO2 from simulated space-borne measurements of backscattered near-infrared sunlight: accounting for aerosol effects, Appl. Opt., 48, 3322–3336, 2009. a
CaltechDATA: Total Carbon Column Observing Network (TCCON), https://tccondata.org (last access: 22 April 2024), 2024. a
Connor, B., Bösch, H., McDuffie, J., Taylor, T., Fu, D., Frankenberg, C., O'Dell, C., Payne, V. H., Gunson, M., Pollock, R., Hobbs, J., Oyafuso, F., and Jiang, Y.: Quantification of uncertainties in OCO-2 measurements of XCO2: simulations and linear error analysis, Atmos. Meas. Tech., 9, 5227–5238, https://doi.org/10.5194/amt-9-5227-2016, 2016. a, b
Crisp, D., Atlas, R., Breon, F.-M., Brown, L., Burrows, J., Ciais, P., Connor, B., Doney, S., Fung, I., Jacob, D., Miller, C., O'Brien, D., Pawson, S., Randerson, J., Rayner, P., Salawitch, R., Sander, S., Sen, B., Stephens, G., Tans, P., Toon, G., Wennberg, P., Wofsy, S., Yung, Y., Kuang, Z., Chudasama, B., Sprague, G., Weiss, B., Pollock, R., Kenyon, D., and Schroll, S.: The orbiting carbon observatory (OCO) mission, Adv. Space Res., 34, 700–709, https://doi.org/10.1016/j.asr.2003.08.062, 2004. a
Crisp, D., O’Dell, C., Eldering, A., Fisher, B., Oyafuso, F., Payne, V., Drouin, B., Toon, G., Laughner, J., Somkuti, P., McGarragh, G., Merrelli, A., Nelson, R., Gunson, M., Frankenberg, C., Osterman, G., Boesch, H., Brown, L., Castano, R., Christi, M., Connor, B., McDuffie, J., Miller, C., Natraj, V., O’Brien, D., Polonski, I., Smyth, M., Thompson, D., and Granat, R.: Orbiting Carbon Observatory-2 & 3 (OCO-2 & OCO-3) Level 2 Full Physics Retrieval Algorithm Theoretical Basis, https://docserver.gesdisc.eosdis.nasa.gov/public/project/OCO/OCO_L2_ATBD.pdf (last access: 2 June 2023), 2021. a
Crowell, S., Baker, D., Schuh, A., Basu, S., Jacobson, A. R., Chevallier, F., Liu, J., Deng, F., Feng, L., McKain, K., Chatterjee, A., Miller, J. B., Stephens, B. B., Eldering, A., Crisp, D., Schimel, D., Nassar, R., O'Dell, C. W., Oda, T., Sweeney, C., Palmer, P. I., and Jones, D. B. A.: The 2015–2016 carbon cycle as seen from OCO-2 and the global in situ network, Atmos. Chem. Phys., 19, 9797–9831, https://doi.org/10.5194/acp-19-9797-2019, 2019. a
Dubey, M., Henderson, B., Green, D., Butterfield, Z., Keppel-Aleks, G., Allen, N., Blavier, J.-F., Roehl, C., Wunch, D., and Lindenmaier, R.: TCCON data from Manaus, Brazil, Release GGG2020R0, TCCON data archive, hosted by CaltechDATA [data set], California Institute of Technology, Pasadena, CA, USA, https://doi.org/10.14291/tccon.ggg2020.manaus01.R0, 2022. a
Eck, T. F., Holben, B. N., Reid, J. S., Dubovik, O., Smirnov, A., O'Neill, N. T., Slutsker, I., and Kinne, S.: Wavelength dependence of the optical depth of biomass burning, urban, and desert dust aerosols, J. Geophys. Res., 104, 31333–31349, https://doi.org/10.1029/1999JD900923, 1999. a
ESA: Copernicus CO2 monitoring mission requirements document (MRD), Tech. rep. Version 3.0, https://esamultimedia.esa.int/docs/EarthObservation/CO2M_MRD_v3.0_20201001_Issued.pdf (last access: 23 April 2024), 2024. a
Giles, D. M., Sinyuk, A., Sorokin, M. G., Schafer, J. S., Smirnov, A., Slutsker, I., Eck, T. F., Holben, B. N., Lewis, J. R., Campbell, J. R., Welton, E. J., Korkin, S. V., and Lyapustin, A. I.: Advancements in the Aerosol Robotic Network (AERONET) Version 3 database – automated near-real-time quality control algorithm with improved cloud screening for Sun photometer aerosol optical depth (AOD) measurements, Atmos. Meas. Tech., 12, 169–209, https://doi.org/10.5194/amt-12-169-2019, 2019. a
Global Modeling And Assimilation Office: MERRA-2 tavgM_2d_aer_Nx: 2d,Monthly mean,Time-averaged,Single-Level,Assimilation,Aerosol Diagnostics V5.12.4, https://doi.org/10.5067/FH9A0MLJPC7N, 2024. a
Guerlet, S., Butz, A., Schepers, D., Basu, S., Hasekamp, O. P., Kuze, A., Yokota, T., Blavier, J.-F., Deutscher, N. M., Griffith, D. W. T., Hase, F., Kyro, E., Morino, I., Sherlock, V., Sussmann, R., Galli, A., and Aben, I.: Impact of aerosol and thin cirrus on retrieving and validating XCO2 from GOSAT shortwave infrared measurements, J. Geophys. Res.-Atmos., 118, 4887–4905, https://doi.org/10.1002/jgrd.50332, 2013. a
Gupta, P., Levy, R. C., Mattoo, S., Remer, L. A., and Munchak, L. A.: A surface reflectance scheme for retrieving aerosol optical depth over urban surfaces in MODIS Dark Target retrieval algorithm, Atmos. Meas. Tech., 9, 3293–3308, https://doi.org/10.5194/amt-9-3293-2016, 2016. a
Gupta, P., Remer, L. A., Levy, R. C., and Mattoo, S.: Validation of MODIS 3 km land aerosol optical depth from NASA's EOS Terra and Aqua missions, Atmos. Meas. Tech., 11, 3145–3159, https://doi.org/10.5194/amt-11-3145-2018, 2018. a
Hase, F., Blumenstock, T., Dohe, S., Groß, J., and Kiel, M.: TCCON data from Karlsruhe, Germany, Release GGG2020R1, TCCON data archive, hosted by CaltechDATA [data set], California Institute of Technology, Pasadena, CA, USA, https://doi.org/10.14291/tccon.ggg2020.karlsruhe01.R1, 2022. a
He, Q., Zhang, M., Huang, B., and Tong, X.: MODIS 3 km and 10 km aerosol optical depth for China: Evaluation and comparison, Atmos. Environ., 153, 150–162, https://doi.org/10.1016/j.atmosenv.2017.01.023, 2017. a
Holben, B., Eck, T., Slutsker, I., Tanré, D., Buis, J., Setzer, A., Vermote, E., Reagan, J., Kaufman, Y., Nakajima, T., Lavenu, F., Jankowiak, I., and Smirnov, A.: AERONET – A Federated Instrument Network and Data Archive for Aerosol Characterization, Remote Sens. Environ., 66, 1–16, https://doi.org/10.1016/S0034-4257(98)00031-5, 1998. a
Houweling, S., Baker, D., Basu, S., Boesch, H., Butz, A., Chevallier, F., Deng, F., Dlugokencky, E. J., Feng, L., Ganshin, A., Hasekamp, O., Jones, D., Maksyutov, S., Marshall, J., Oda, T., O'Dell, C. W., Oshchepkov, S., Palmer, P. I., Peylin, P., Poussi, Z., Reum, F., Takagi, H., Yoshida, Y., and Zhuravlev, R.: An intercomparison of inverse models for estimating sources and sinks of CO2 using GOSAT measurements, J. Geophys Res.-Atmos, 120, 5253–5266, 2015. a
Hsu, N., Tsay, S.-C., King, M., and Herman, J.: Aerosol properties over bright-reflecting source regions, IEEE T. Geosci. Remote Sens., 42, 557–569, https://doi.org/10.1109/TGRS.2004.824067, 2004. a
Iraci, L., Podolske, J., Hillyard, P., Roehl, C., Wennberg, P. O., Blavier, J.-F., Landeros, J., Allen, N., Wunch, D., Zavaleta, J., Quigley, E., Osterman, G., Barrow, E., and Barney, J.: TCCON data from Indianapolis, Indiana, USA, Release GGG2020R0, TCCON data archive, hosted by CaltechDATA [data set], California Institute of Technology, Pasadena, CA, USA, https://doi.org/10.14291/tccon.ggg2020.indianapolis01.R1, 2022a. a
Iraci, L., Podolske, J., Roehl, C., Wennberg, P. O., Blavier, J.-F., Allen, N., Wunch, D., and Osterman, G.: TCCON data from Armstrong Flight Research Center, Edwards, CA, USA, Release GGG2020R0, TCCON data archive, hosted by CaltechDATA [data set], California Institute of Technology, Pasadena, CA, USA, https://doi.org/10.14291/tccon.ggg2020.edwards01.R0, 2022b. a
Janssens-Maenhout, G., Pinty, B., Dowell, M., Zunker, H., Andersson, E., Balsamo, G., Bézy, J.-L., Brunhes, T., Bösch, H., Bojkov, B., Brunner, D., Buchwitz, M., Crisp, D., Ciais, P., Counet, P., Dee, D., van der Gon, H. D., Dolman, H., Drinkwater, M. R., Dubovik, O., Engelen, R., Fehr, T., Fernandez, V., Heimann, M., Holmlund, K., Houweling, S., Husband, R., Juvyns, O., Kentarchos, A., Landgraf, J., Lang, R., Löscher, A., Marshall, J., Meijer, Y., Nakajima, M., Palmer, P. I., Peylin, P., Rayner, P., Scholze, M., Sierk, B., Tamminen, J., and Veefkind, P.: Toward an operational anthropogenic CO2 emissions monitoring and verification support capacity, B. Am. Meteorol. Soc., 101, E1439–E1451, https://doi.org/10.1175/BAMS-D-19-0017.1, 2020. a
Kivi, R., Heikkinen, P., and Kyro, E.: TCCON data from Sodankyla, Finland, Release GGG2020R0, TCCON data archive, hosted by CaltechDATA [data set], California Institute of Technology, Pasadena, CA, USA, https://doi.org/10.14291/tccon.ggg2020.sodankyla01.R0, 2022. a
LAADS-DAAC: NASA Level-1 and Atmosphere Archive & Distribution System Distributed Active Archive Center, https://ladsweb.modaps.eosdis.nasa.gov/ (last access: 14 November 2024), 2024. a
Lamminpää, O., Hobbs, J., Brynjarsdóttir, J., Laine, M., Braverman, A., Lindqvist, H., and Tamminen, J.: Accelerated MCMC for satellite-based measurements of atmospheric CO2, Remote Sens., 11, 2061, https://doi.org/10.3390/rs11172061, 2019. a, b
Laughner, J. L., Toon, G. C., Mendonca, J., Petri, C., Roche, S., Wunch, D., Blavier, J.-F., Griffith, D. W. T., Heikkinen, P., Keeling, R. F., Kiel, M., Kivi, R., Roehl, C. M., Stephens, B. B., Baier, B. C., Chen, H., Choi, Y., Deutscher, N. M., DiGangi, J. P., Gross, J., Herkommer, B., Jeseck, P., Laemmel, T., Lan, X., McGee, E., McKain, K., Miller, J., Morino, I., Notholt, J., Ohyama, H., Pollard, D. F., Rettinger, M., Riris, H., Rousogenous, C., Sha, M. K., Shiomi, K., Strong, K., Sussmann, R., Té, Y., Velazco, V. A., Wofsy, S. C., Zhou, M., and Wennberg, P. O.: The Total Carbon Column Observing Network's GGG2020 data version, Earth Syst. Sci. Data, 16, 2197–2260, https://doi.org/10.5194/essd-16-2197-2024, 2024. a
Levy, R., and Hsu, C.: MODIS Atmosphere L2 Aerosol Product, NASA MODIS Adaptive Processing System, Goddard Space Flight Center, USA, https://doi.org/10.5067/MODIS/MOD04_L2.006, 2015. a, b
Levy, R. C., Remer, L. A., Kleidman, R. G., Mattoo, S., Ichoku, C., Kahn, R., and Eck, T. F.: Global evaluation of the Collection 5 MODIS dark-target aerosol products over land, Atmos. Chem. Phys., 10, 10399–10420, https://doi.org/10.5194/acp-10-10399-2010, 2010. a, b
Levy, R. C., Mattoo, S., Munchak, L. A., Remer, L. A., Sayer, A. M., Patadia, F., and Hsu, N. C.: The Collection 6 MODIS aerosol products over land and ocean, Atmos. Meas. Tech., 6, 2989–3034, https://doi.org/10.5194/amt-6-2989-2013, 2013. a, b, c
Lindqvist, H., O'Dell, C. W., Basu, S., Boesch, H., Chevallier, F., Deutscher, N., Feng, L., Fisher, B., Hase, F., Inoue, M., Kivi, R., Morino, I., Palmer, P. I., Parker, R., Schneider, M., Sussmann, R., and Yoshida, Y.: Does GOSAT capture the true seasonal cycle of carbon dioxide?, Atmos. Chem. Phys., 15, 13023–13040, https://doi.org/10.5194/acp-15-13023-2015, 2015. a
Maziere, D., M., M. K. S., Desmet, F., Hermans, C., Scolas, F., Kumps, N., Zhou, M., Metzger, J.-M., Duflot, V., and Cammas, J.-P.: TCCON data from Reunion Island (La Reunion), France, Release GGG2020R0, TCCON data archive, hosted by CaltechDATA [data set], California Institute of Technology, Pasadena, CA, USA, https://doi.org/10.14291/tccon.ggg2020.reunion01.R0, 2022. a
Meijer, Y., Andersson, E., Boesch, H., Dubovik, O., Houweling, S., Landgraf, J., Lang, R., and Lindqvist, H.: Editorial: Anthropogenic emission monitoring with the Copernicus CO2 monitoring mission, Front. Remote Sens., 4, 1217568, https://doi.org/10.3389/frsen.2023.1217568, 2023. a
Mendonca, J., Nassar, R., O'Dell, C. W., Kivi, R., Morino, I., Notholt, J., Petri, C., Strong, K., and Wunch, D.: Assessing the feasibility of using a neural network to filter Orbiting Carbon Observatory 2 (OCO-2) retrievals at northern high latitudes, Atmos. Meas. Tech., 14, 7511–7524, https://doi.org/10.5194/amt-14-7511-2021, 2021. a, b
Morino, I., Ohyama, H., Hori, A., and Ikegami, H.: TCCON data from Rikubetsu, Hokkaido, Japan, Release GGG2020R0, TCCON data archive, hosted by CaltechDATA [data set], California Institute of Technology, Pasadena, CA, USA, https://doi.org/10.14291/tccon.ggg2020.rikubetsu01.R0, 2022a. a
Morino, I., Ohyama, H., Hori, A., and Ikegami, H.: TCCON data from Tsukuba, Ibaraki, Japan, 125HR, Release GGG2020R0, TCCON data archive, hosted by CaltechDATA [data set], California Institute of Technology, Pasadena, CA, USA, https://doi.org/10.14291/tccon.ggg2020.tsukuba02.R0, 2022b. a
Morino, I., Velazco, V. A., Hori, A., Uchino, O., and Griffith, D. W. T.: TCCON data from Burgos, Philippines, Release GGG2020R0, TCCON data archive, hosted by CaltechDATA [data set], California Institute of Technology, Pasadena, CA, USA, https://doi.org/10.14291/tccon.ggg2020.burgos01.R0, 2022c. a
NASA: Aerosol Robotic Network, https://aeronet.gsfc.nasa.gov/new_web/data.html (last access: 22 April 2024), 2024a. a
NASA: Earth Science Data Systems, https://www.earthdata.nasa.gov/ (last access: 22 April 2024), 2024b. a
NaturalEarth: Urban Areas, https://www.naturalearthdata.com/downloads/50m-cultural-vectors/50m-urban-areas/ (last access: 22 April 2024), 2024. a, b, c
NOAA Global Monitoring Laboratory: Trends in Atmospheric Carbon Dioxide, https://gml.noaa.gov/ccgg/trends/gl_gr.html (last access: 22 April 2024), 2024. a
Notholt, J., Petri, C., Warneke, T., Deutscher, N., Buschmann, M., Weinzierl, C., Macatangay, R., and Grupe, P.: TCCON data from Bremen, Germany, Release GGG2020R0, TCCON data archive, hosted by CaltechDATA [data set], California Institute of Technology, Pasadena, CA, USA, https://doi.org/10.14291/tccon.ggg2020.bremen01.R0, 2022. a
OCO-2 Science Team, Gunson, M., and Eldering, A.: OCO-2 Level 2 bias-corrected XCO2 and other select fields from the full-physics retrieval aggregated as daily files, Retrospective processing V10r, https://doi.org/10.5067/E4E140XDMPO2, 2020. a, b
O'Dell, C. W., Eldering, A., Wennberg, P. O., Crisp, D., Gunson, M. R., Fisher, B., Frankenberg, C., Kiel, M., Lindqvist, H., Mandrake, L., Merrelli, A., Natraj, V., Nelson, R. R., Osterman, G. B., Payne, V. H., Taylor, T. E., Wunch, D., Drouin, B. J., Oyafuso, F., Chang, A., McDuffie, J., Smyth, M., Baker, D. F., Basu, S., Chevallier, F., Crowell, S. M. R., Feng, L., Palmer, P. I., Dubey, M., García, O. E., Griffith, D. W. T., Hase, F., Iraci, L. T., Kivi, R., Morino, I., Notholt, J., Ohyama, H., Petri, C., Roehl, C. M., Sha, M. K., Strong, K., Sussmann, R., Te, Y., Uchino, O., and Velazco, V. A.: Improved retrievals of carbon dioxide from Orbiting Carbon Observatory-2 with the version 8 ACOS algorithm, Atmos. Meas. Tech., 11, 6539–6576, https://doi.org/10.5194/amt-11-6539-2018, 2018. a, b, c, d, e, f, g
Petri, C., Vrekoussis, M., Rousogenous, C., Warneke, T., Sciare, J., and Notholt, J.: TCCON data from Nicosia, Cyprus, Release GGG2020R0, TCCON data archive, hosted by CaltechDATA [data set], California Institute of Technology, Pasadena, CA, USA, https://doi.org/10.14291/tccon.ggg2020.nicosia01.R0, 2023. a
Pollard, D., Robinson, J., and Shiona, H.: TCCON data from Lauder, New Zealand, 125HR, Release GGG2020R0, TCCON data archive, hosted by CaltechDATA [data set], California Institute of Technology, Pasadena, CA, USA, https://doi.org/10.14291/tccon.ggg2020.lauder03.R0, 2022. a
Remer, L. A., Mattoo, S., Levy, R. C., and Munchak, L. A.: MODIS 3 km aerosol product: algorithm and global perspective, Atmos. Meas. Tech., 6, 1829–1844, https://doi.org/10.5194/amt-6-1829-2013, 2013. a
Rusli, S. P., Hasekamp, O., aan de Brugh, J., Fu, G., Meijer, Y., and Landgraf, J.: Anthropogenic CO2 monitoring satellite mission: the need for multi-angle polarimetric observations, Atmos. Meas. Tech., 14, 1167–1190, https://doi.org/10.5194/amt-14-1167-2021, 2021. a
Sanghavi, S., Nelson, R., Frankenberg, C., and Gunson, M.: Aerosols in OCO-2/GOSAT retrievals of XCO2: An information content and error analysis, Remote Sens. Environ., 251, 112053, https://doi.org/10.1016/j.rse.2020.112053, 2020. a
Sayer, A. M., Munchak, L. A., Hsu, N. C., Levy, R. C., Bettenhausen, C., and Jeong, M.-J.: MODIS Collection 6 aerosol products: Comparison between Aqua's e-Deep Blue, Dark Target, and “merged” data sets, and usage recommendations, J. Geophys. Res.-Atmos., 119, 13965–13989, https://doi.org/10.1002/2014jd022453, 2014. a, b, c
Schneider, A., Friedl, M. A., and Potere, D.: A new map of global urban extent from MODIS satellite data, Environ. Res. Lett., 4, 044003, https://doi.org/10.1088/1748-9326/4/4/044003, 2009. a
Sherlock, V., Connor, B., Robinson, J., Shiona, H., Smale, D., and Pollard, D.: TCCON data from Lauder, New Zealand, 125HR, Release GGG2020R0, TCCON data archive, hosted by CaltechDATA [data set], California Institute of Technology, Pasadena, CA, USA, https://doi.org/10.14291/tccon.ggg2020.lauder02.R0, 2022. a
Shiomi, K., Kawakami, S., Ohyama, H., Arai, K., Okumura, H., Ikegami, H., and Usami, M.: TCCON data from Saga, Japan, Release GGG2020R0, TCCON data archive, hosted by CaltechDATA [data set], California Institute of Technology, Pasadena, CA, USA, https://doi.org/10.14291/tccon.ggg2020.saga01.R0, 2022. a
Sinyuk, A., Holben, B. N., Eck, T. F., Giles, D. M., Slutsker, I., Korkin, S., Schafer, J. S., Smirnov, A., Sorokin, M., and Lyapustin, A.: The AERONET Version 3 aerosol retrieval algorithm, associated uncertainties and comparisons to Version 2, Atmos. Meas. Tech., 13, 3375–3411, https://doi.org/10.5194/amt-13-3375-2020, 2020. a
Strong, K., Roche, S., Franklin, J., Mendonca, J., Lutsch, E., Weaver, D., Fogal, P., Drummond, J., Batchelor, R., and Lindenmaier, R.: TCCON data from Eureka, Canada, Release GGG2020R0, TCCON data archive, hosted by CaltechDATA [data set], California Institute of Technology, Pasadena, CA, USA, https://doi.org/10.14291/tccon.ggg2020.eureka01.R0, 2022. a
Sussmann, R. and Rettinger, M.: TCCON data from Garmisch, Germany, Release GGG2020R0, TCCON data archive, hosted by CaltechDATA, California Institute of Technology, Pasadena, CA, USA, https://doi.org/10.14291/tccon.ggg2020.garmisch01.R0, 2017. a
Taylor, T. E., O'Dell, C. W., Baker, D., Bruegge, C., Chang, A., Chapsky, L., Chatterjee, A., Cheng, C., Chevallier, F., Crisp, D., Dang, L., Drouin, B., Eldering, A., Feng, L., Fisher, B., Fu, D., Gunson, M., Haemmerle, V., Keller, G. R., Kiel, M., Kuai, L., Kurosu, T., Lambert, A., Laughner, J., Lee, R., Liu, J., Mandrake, L., Marchetti, Y., McGarragh, G., Merrelli, A., Nelson, R. R., Osterman, G., Oyafuso, F., Palmer, P. I., Payne, V. H., Rosenberg, R., Somkuti, P., Spiers, G., To, C., Weir, B., Wennberg, P. O., Yu, S., and Zong, J.: Evaluating the consistency between OCO-2 and OCO-3 XCO2 estimates derived from the NASA ACOS version 10 retrieval algorithm, Atmos. Meas. Tech., 16, 3173–3209, https://doi.org/10.5194/amt-16-3173-2023, 2023. a
Te, Y., Jeseck, P., and Janssen, C.: TCCON data from Paris, France, Release GGG2020R0, TCCON data archive, hosted by CaltechDATA [data set], California Institute of Technology, Pasadena, CA, USA, https://doi.org/10.14291/tccon.ggg2020.paris01.R0, 2022. a
Virtanen, T. H.: Data and code for manuscript “A global perspective on CO2 satellite observations in high AOD conditions” by Virtanen et al., https://doi.org/10.57707/FMI-B2SHARE.62269CB9CF944D5595692A5F8EA6B915, 2024. a, b
Virtanen, T. H., Kolmonen, P., Sogacheva, L., Rodríguez, E., Saponaro, G., and de Leeuw, G.: Collocation mismatch uncertainties in satellite aerosol retrieval validation, Atmos. Meas. Tech., 11, 925–938, https://doi.org/10.5194/amt-11-925-2018, 2018. a
Warneke, T., Messerschmidt, J., Notholt, J., Weinzierl, C., Deutscher, N., Petri, C., Grupe, P., Vuillemin, C., Truong, F., Schmidt, M., Ramonet, M., and Parmentier, E.: TCCON data from Orleans, France, Release GGG2020R0, TCCON data archive, hosted by CaltechDATA [data set], California Institute of Technology, Pasadena, CA, USA, https://doi.org/10.14291/tccon.ggg2020.orleans01.R0, 2022. a
Wei, J., Li, Z., Peng, Y., and Sun, L.: MODIS Collection 6.1 aerosol optical depth products over land and ocean: validation and comparison, Atmos. Environ., 201, 428–440, https://doi.org/10.1016/j.atmosenv.2018.12.004, 2019. a
Wennberg, P. O., Roehl, C., Blavier, J.-F., Wunch, D., Landeros, J., and Allen, N.: TCCON data from Jet Propulsion Laboratory, Pasadena, California, USA, Release GGG2020R0, TCCON data archive, hosted by CaltechDATA [data set], California Institute of Technology, Pasadena, CA, USA, https://doi.org/10.14291/tccon.ggg2020.jpl02.R0, 2022a. a
Wennberg, P. O., Roehl, C., Wunch, D., Toon, G. C., Blavier, J.-F., Washenfelder, R., Keppel-Aleks, G., Allen, N., and Ayers, J.: TCCON data from Park Falls, Wisconsin, USA, Release GGG2020R1, TCCON data archive, hosted by CaltechDATA [data set], California Institute of Technology, Pasadena, CA, USA, https://doi.org/10.14291/tccon.ggg2020.parkfalls01.R1, 2022b. a
Wennberg, P. O., Wunch, D., Roehl, C., Blavier, J.-F., Toon, G. C., and Allen, N.: TCCON data from California Institute of Technology, Pasadena, California, USA, Release GGG2020R0, TCCON data archive, hosted by CaltechDATA [data set], California Institute of Technology, Pasadena, CA, USA, https://doi.org/10.14291/tccon.ggg2020.pasadena01.R0, 2022c. a
Wennberg, P. O., Wunch, D., Roehl, C., Blavier, J.-F., Toon, G. C., Allen, N., Dowell, P., Teske, K., Martin, C., and Martin, J.: TCCON data from Lamont, Oklahoma, USA, Release GGG2020R0, TCCON data archive, hosted by CaltechDATA [data set], California Institute of Technology, Pasadena, CA, USA, https://doi.org/10.14291/tccon.ggg2020.lamont01.R0, 2022d. a
Wunch, D., Toon, G. C., Blavier, J.-F. L., Washenfelder, R., Notholt, J., Connor, B. J., Griffith, D. W. T., Sherlock, V., and Wennberg, P. O.: The Total Carbon Column Observing Network, Philos. T. R. Soc. A, 369, 2087–2112, https://doi.org/10.1098/rsta.2010.0240, 2011. a, b
Wunch, D., Wennberg, P. O., Osterman, G., Fisher, B., Naylor, B., Roehl, C. M., O'Dell, C., Mandrake, L., Viatte, C., Kiel, M., Griffith, D. W. T., Deutscher, N. M., Velazco, V. A., Notholt, J., Warneke, T., Petri, C., De Maziere, M., Sha, M. K., Sussmann, R., Rettinger, M., Pollard, D., Robinson, J., Morino, I., Uchino, O., Hase, F., Blumenstock, T., Feist, D. G., Arnold, S. G., Strong, K., Mendonca, J., Kivi, R., Heikkinen, P., Iraci, L., Podolske, J., Hillyard, P. W., Kawakami, S., Dubey, M. K., Parker, H. A., Sepulveda, E., García, O. E., Te, Y., Jeseck, P., Gunson, M. R., Crisp, D., and Eldering, A.: Comparisons of the Orbiting Carbon Observatory-2 (OCO-2) XCO2 measurements with TCCON, Atmos. Meas. Tech., 10, 2209–2238, https://doi.org/10.5194/amt-10-2209-2017, 2017. a
Wunch, D., Mendonca, J., Colebatch, O., Allen, N., Blavier, J.-F. L., Kunz, K., Roche, S., Hedelius, J., Neufeld, G., Springett, S., Worthy, D., Kessler, R., and Strong, K.: TCCON data from East Trout Lake, Canada, Release GGG2020R0, TCCON data archive, hosted by CaltechDATA [data set], California Institute of Technology, Pasadena, CA, USA, https://doi.org/10.14291/tccon.ggg2020.easttroutlake01.R0, 2022. a
Yang, D., Liu, Y., Cai, Z., Chen, X., Yao, L., and Lu, D.: First Global Carbon Dioxide Maps Produced from TanSat Measurements, Adv. Atmos. Sci. 35, 621–623, https://doi.org/10.1007/s00376-018-7312-6, 2018. a
Yokota, T., Yoshida, Y., Eguchi, N., Ota, Y., Tanaka, T., Watanabe, H., and Maksyutov, S.: Global concentrations of CO2 and CH4 retrieved from GOSAT: First preliminary results, Sola, 5, 160–163, 2009. a
Zhou, M., Wang, P., Nan, W., Yang, Y., Kumps, N., Hermans, C., and De Mazière, M.: TCCON data from Xianghe, CaltechDATA [data set], https://doi.org/10.14291/tccon.ggg2020.xianghe01.R0, 2022. a