the Creative Commons Attribution 4.0 License.
the Creative Commons Attribution 4.0 License.
 | 16 Feb 2026
Characterization and operation of a multi-channel Condensation Particle Counter (mc-CPC) for aircraft-based measurements
Sarah Richter
Timo Keber
Martin Heinritzi
Lisa Beck
Laurin Merkel
Sarah Kirchhoff
Jann Schrod
Patrick Weber
Joachim Curtius
Field measurements of aerosol number concentration and aerosol size distribution in the upper troposphere and lowermost stratosphere (UTLS) are crucial for understanding the influence of processes such as new particle formation (NPF) on aerosol budgets, cloud formation and climate. In this study, we present the multi-channel Condensation Particle Counter (mc-CPC) that was designed and set up for airborne measurements and tested during the TPEx campaign onboard a Learjet in 2024. The instrument uses FC-43 (C12F27N) as the working fluid and consists of three individual commercial CPCs (Grimm SKY-CPC), a pressure regulation system and a common inlet. By varying the temperature difference (ΔT) between each pair of saturator and condenser, the cutoff diameter (d50) of each CPC can be adjusted. For the cases presented here, we typically operated two of the CPCs at a ΔT of 36 °C for a direct comparison while the third CPC was set to a ΔT of 15 °C. Two independent calibration setups were used to determine the cutoff and size-dependent counting efficiency of the mc-CPC at various internal and external CPC pressure levels. The experiments in the laboratory showed that the cutoffs of the individual channels were rather independent of the external pressure pexternal and only slightly dependent on the internal CPC pressure pCPC, at least for a pCPC range between 200–350 hPa. A large fraction of flights during TPEx were conducted at an internal pressure of 250 hPa, and therefore the cutoff determined at 250 hPa was used as a fixed value for all internal pressures. For channel 1 and 2 that were operated at the same ΔT, this gave a d50 of 11.3 (±0.7) nm and 12.3 (±0.7) nm, respectively. Channel 3 was set to ΔT = 15 °C and a cutoff diameter of 14.9 (±0.9) nm was determined. In an internal pressure range between 200 and 400 hPa the cutoffs decreased slightly with increasing pCPC. Furthermore, our measurements also indicate that the cutoffs are not influenced by varying sample flows. The mc-CPC was operated for the first time on an aircraft during the TPEx campaign (TropoPause composition gradients and mixing Experiment) in June 2024. We present the first measurements of one research flight and discuss the uncertainties of the collected aerosol data.
- Article
(6512 KB) - Full-text XML
- BibTeX
- EndNote


Aerosol particles play an important role in the atmosphere, e.g. for cloud formation and climate (Szopa et al., 2021). In the planetary boundary layer (PBL) fine aerosols (PM2.5) impact air quality and health (Schraufnagel, 2020; Cheng, 2014; Lee and Romero, 2023; Zhang et al., 2016). In the free troposphere (FT) as well as in the upper troposphere (UT), aerosols have an impact on the global radiation budget through the direct aerosol-radiation interaction and indirectly through aerosol-cloud interaction (Lee and Romero, 2023; Peng et al., 2016). The latter describes the influence of aerosols mostly through their role as cloud condensation nuclei (CCN) or ice nucleating particles (INP) on the formation and properties of clouds and their impact on the radiation budget (Seinfeld and Pandis, 2016; Li et al., 2008; Wang et al., 2013). Aerosols can be directly emitted (primary aerosols) or they can be formed from precursor gases as secondary aerosols (Seinfeld and Pandis, 2016). Freshly formed nucleation mode particles (NMPs) from new particle formation (NPF) are very small in size; here we define them in the diameter range of 1–20 nm (Seinfeld and Pandis, 2016). A large fraction of the aerosols in the atmosphere originates from the nucleation of vapors of ultralow or extremely low volatility (Donahue et al., 2011). To serve as CCN, these small particles need to grow to sizes of at least 50 nm in diameter, which can happen through condensation of trace gases with sufficiently low volatility and through coagulation (Merikanto et al., 2009; Gordon et al., 2017; Seinfeld and Pandis, 2016). It has been estimated that approximately 50 % of all CCN in the troposphere result from nucleation (Gordon et al., 2017; Merikanto et al., 2009; Yu et al., 2014). Hence, particle nucleation has a direct impact on the formation of clouds and therefore on the climate of the earth, because microphysical cloud properties and the amount of cloud cover influence incoming solar radiation and outgoing long-wave radiation as well as precipitation (Lee and Romero, 2023).
To gain a better understanding of the processes and components that drive particle nucleation and growth in the upper troposphere and to reduce the uncertainties that these processes cause in current climate models, field measurements play a significant role. Recent aircraft campaigns (Andreae et al., 2018; Williamson et al., 2019; Curtius et al., 2024) showed that over tropical rain forest and the Pacific and Atlantic Ocean high numbers of several ten thousand aerosol particles per cm3 are frequently observed. These studies suggest that the high number concentrations are a result of new particle formation from gas-phase precursors in the UT. Previous aircraft campaigns taking place in the northern hemisphere highlighted that Aitken mode number particle concentrations in the middle and upper troposphere reach median values between 1000 and 1500 scm−3, for N>14 nm and N>18 nm respectively (Minikin et al., 2003; Schröder and Ström, 1996) and in parts even > 10 000 scm−3 (Hermann et al., 2003). For nucleation mode particles the concentrations are even higher (Rose et al., 2015; Minikin et al., 2003; Hermann and Wiedensohler, 2001). Various sources of NMPs in the UT exist, but they are dominated by local production through new particle formation, defined as the combination of nucleation and initial growth. Upper tropospheric NPF can occur under various atmospheric conditions in the mid-latitudes, for example in the outflow of convective systems (Twohy et al., 2002), mixing of tropospheric and stratospheric air (Khosrawi and Konopka, 2003) or stratospheric air intrusion (Zhang et al., 2024; Joppe et al., 2025). As observations of NMPs in the mid-latitude free troposphere and upper troposphere/lower stratosphere (UTLS) regions are still sparse and the formation mechanisms are not well understood, it is crucial to extend these measurements onboard of aircraft.
To understand the mechanisms that drive NPF in the free troposphere and to estimate how large the initial growth is, aerosol instrumentation is needed that reliably measures the aerosol number concentration as well as the size distribution under varying atmospheric conditions. Condensation particle counters (CPCs) are commonly used in aerosol science due to their ability to deliver reliable results of aerosol number concentrations at diameter sizes of a few nanometers at a fast response of ≥ 1 Hz. To get a rough size distribution of aerosol particles at small sizes with d < 50 nm and a high time resolution several CPCs can be combined where each CPC becomes sensitive at a different particle diameter, the so-called cutoff diameters. The advantages of this concept have been demonstrated in many recent studies using particle instruments for ground-based or aircraft-based measurements using several CPCs with different cutoffs, ranging from 3 to 60 nm (Williamson et al., 2018; Minikin et al., 2003; Hermann and Wiedensohler, 2001; Rose et al., 2015; Dreiling and Jaenicke, 1988; Weigel et al., 2009). Comparing the aerosol number concentration of different channels can provide valuable information about the location of nucleation events, the distribution and origin of NPF in the UT and the underlying aerosol growth processes.
Using a similar approach, we set up a custom integration of three commercial CPC units for aircraft applications. The three channels of the multi-channel Condensation Particle Counter (mc-CPC) are currently operated with FC-43 (Fluorinert) as the working fluid and provide two different cutoffs by adjusting the internal CPC temperatures. A pressure regulation system with a critical orifice ensures a low pressure in the system. The set point was adjusted according to the flight pattern and therefore varied between 200 and 350 hPa. The instrument was used for the first time during the aircraft campaign TPEx. In this study, we describe the design of the mc-CPC, present a detailed characterization of the cutoff diameters and show exemplary results from the Learjet TPEx campaign which took place in June 2024 in Hohn, Germany.
2.1 Description of the SKY-CPC and working fluids
For the mc-CPC we used three commercial SKY-CPCs (Model 5411, Grimm Aerosol Technik GmbH, Germany). The SKY-CPC is a state-of-the-art condensation particle counter that has been designed for airborne applications. The measurement technique is based on the growth of aerosols through the condensation of a working fluid on an aerosol particle. The instrumentation consists of three modules. The saturator is held at temperatures Tsat so that the working fluid (e.g. an alcohol) evaporates and mixes with the sample flow. In the condenser, the temperature Tcon is lower than Tsat to create supersaturation of the working fluid on the aerosol particles and thus activating their growth to optically detectable sizes. The third module is the photo-optical detection cell where the enlarged aerosols are detected through light scattering (Sinclair and Hoopes, 1975; McMurry, 2000). Each particle that has a sufficiently large diameter is detected by the CPC. The smallest size at which particles are activated by the given working fluid is called the Kelvin equivalent size or critical diameter dKelvin (Seinfeld and Pandis, 2016). Aerosols that are smaller than this threshold value dKelvin cannot be activated by the working fluid due to the Kelvin effect. The aerosol diameter at which 50 % of all aerosols are activated and measured is defined as the cutoff diameter or d50. This diameter size depends on various conditions. For example the temperature difference between the saturator and condenser regime, the temperature dependent vapor pressure of the working fluid itself, the pressure in the system and the sample flow rate (Banse et al., 2001).
By default, the SKY-CPC is operated with 1-butanol (CAS: 71-36-3) as its working fluid and the saturator and condenser temperature are set to 36 and 10 °C, respectively, which results in a cutoff diameter of 4 nm at ambient pressures of ∼ 1000 hPa. We set two of the three SKY-CPCs to a saturator temperature of 41 °C and a condenser temperature of 5 °C, yielding a ΔT of 36 °C. The third CPC was operated at 35 and 20 °C for saturator and condenser, respectively (ΔT = 15 °C). The instruments have a constant flow rate QCPC of 0.6 L min−1 that is maintained by a critical orifice, which is located downstream of the detection cell inside the channel block.
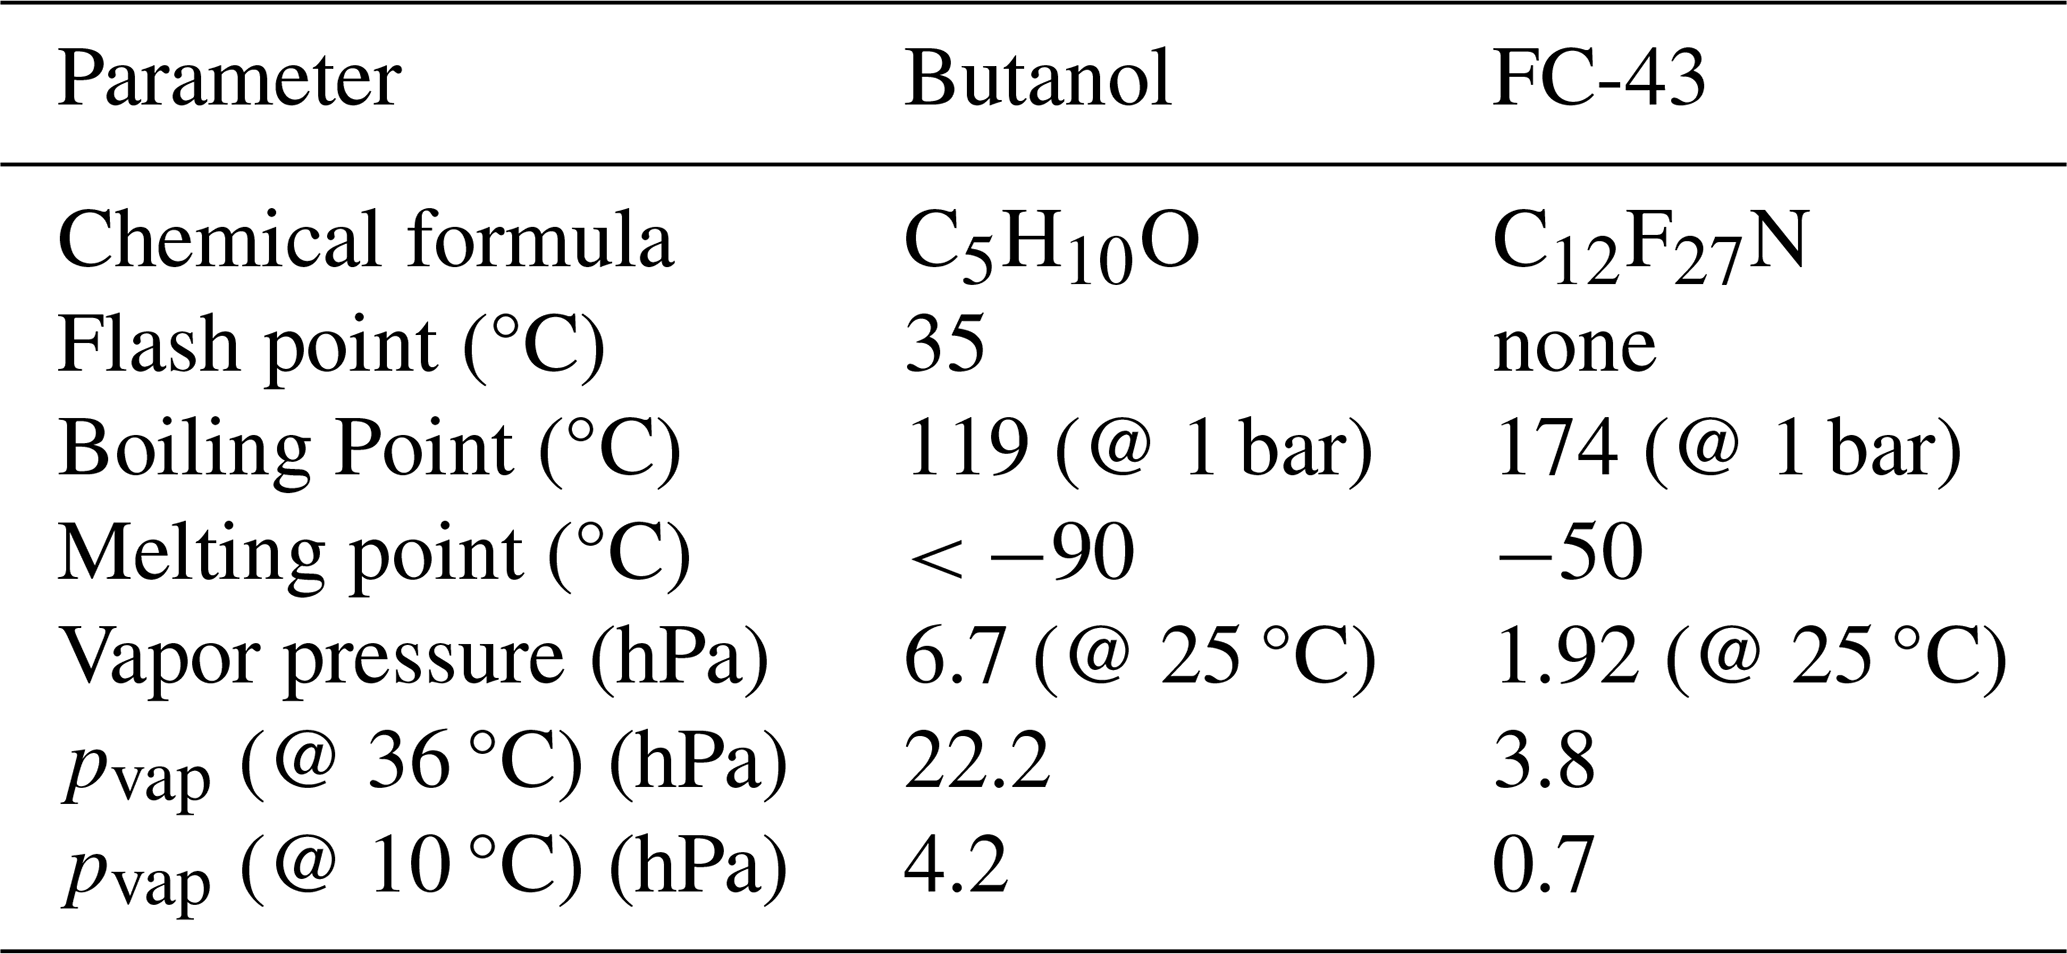
Butanol is a highly flammable and hazardous alcohol with a strong odor. Most of the CPCs used in ground-based research are running with butanol because it is well-proven for many applications as a reliable working fluid (Wlasits et al., 2020; Sem, 2002). It has a rather high vapor pressure of 6.7 hPa at 25 °C (Carl Roth GmbH + Co. KG, 2024), resulting in sufficiently low and well-defined cutoff diameters that increase at low pressures (Hermann et al., 2005; Banse et al., 2001; Weigel et al., 2009; Bauer et al., 2023). Due to its high flammability, aircraft certification of butanol for a CPC is challenging. Therefore, we decided to use perfluorotributylamine (Fluorinert™ FC-43, 3M Performance Materials, St. Paul, Mn, USA, CAS: 311-89-7). Nevertheless, there are some disadvantages of FC-43 compared to butanol. For one, Fluorinert has an extremely high global warming potential (GWP) of ∼ 7000 (Hong et al., 2013), which demands responsible handling. The other disadvantage is the comparably low vapor pressure of 1.92 hPa at 25 °C (3M, 2019). Even though the saturation vapor pressure at typical saturator temperatures for the two fluids are in the same order of magnitude (Table 1), the evaporation of FC-43 is lower, potentially suppressing the activation of the aerosol particles. With a ΔT of 36 °C, butanol can activate aerosols with a diameter of 2 nm whereas the particles that can be activated by FC-43 need to have a diameter of 5 nm (Hinds, 1999). However, some studies showed that the latter problem can be circumvented by decreasing the pressure in the CPCs, which facilitates the evaporation of FC-43, or by increasing the saturator temperature (Williamson et al., 2018; Weigel et al., 2009; Hermann et al., 2005; Gallar et al., 2006). FC-43 has already been used as a working fluid in several airborne CPCs. In Williamson et al. (2018) cutoffs down to 3 nm could be realized by keeping the internal pressure constant at 120 hPa and by increasing ΔT to 36.4 °C. Hermann et al. (2005) did a comparison between butanol and FC-43 operated TSI CPCs at different internal pressures, ranging from 200 to 1000 hPa. They demonstrated that the cutoff of the FC-43 CPC decreased with decreasing pressures while the maximum detection efficiency increased (highest counting efficiency compared to a reference instrument). The CPC operated with butanol showed the opposite effect in this study. Furthermore, Weigel et al. (2009) and Gallar et al. (2006) also used Fluorinert-operated CPCs at different pressures, but these were both custom made. Grimm SKY-CPCs have also been tested at low pressures, but only with butanol, dimethylsulfoxide (DMSO) and water as a working fluid (Hermann and Wiedensohler, 2001; Bundke et al., 2015; Weber et al., 2023b, a; Bauer et al., 2023). As far as we know, the application of FC-43 with a Grimm SKY-CPC has not been tested yet.
Table 1Characteristics of the working fluids Butanol and FC-43 (Carl Roth GmbH + Co. KG, 2024; 3M, 2019). The vapor pressure at SKY-CPC default temperatures 36 and 10 °C was calculated with the Antoine equation (see Appendix A).
2.2 Design of the multi-channel CPC
The mc-CPC was designed for the Learjet TPEx campaign. In Fig. 1 the flow schematic of the mc-CPC, including internal and external structure of the housing is depicted. The instrument consists of a 19 in. (48.3 cm) aircraft rack module including three individual commercially available SKY-CPCs (each 16.5 cm × 21.5 cm × 27 cm), accessory components, a bypass flow system to regulate and reduce the internal pressure and a common inlet system. The mc-CPC has a weight of 34.5 kg and the dimensions are 48 cm × 35 cm × 40 cm and needs to be connected to an external pump to enable a constant flow through the system. This was realized by using a dry scroll pump (IDP-3, Agilent IDP3D01). The mc-CPC as well as the pump are operated at a power supply voltage of 24 V.

Figure 1Schematic of the mc-CPC containing three Grimm SKY-CPCs, a pressure regulation system and an inlet system with a critical orifice. Blue lines represent tubes for liquid, and orange lines are for gases, respectively.
Each SKY-CPC has a removable O-ring sealed 8 mm inlet tube that can be easily plugged in and out. To avoid leakages during low pressures, we replaced the inlet with a leak tight fitting (0.25 in. (6.35 mm) NPT male to 0.25 in. (6.35 mm) tube). The SKY-CPCs were installed in parallel into the rack. Because of the limited space in the housing, the length of each CPC inlet is different (Table B1).
The containers for the working fluid are made of PEEK material (Polyether ether ketone) and both, the reservoir and waste container, have a volume of 200 mL and are attached to the front panel of the instrument (Fig. 1). They can be easily filled or emptied via quick connectors. In order to provide an equal flow to the individual CPCs, we installed an inlet manifold, that connects the individual CPC 0.25 in. (6.35 mm) sampling lines with the overall aerosol port, an 8 mm stainless steel tube. Due to space restrictions, the sampling lines outside the mc-CPC housing needed to be strongly bent. Due to these circumstances, the total lengths of the individual CPC inlet lines, measured from the inlet manifold to the CPC entrance were 58 cm (channel 1), 46.5 cm (channel 2) and 60 cm (channel 3) (Table C1). The data logging of the particle concentration and several other parameters was realized using the Grimm nanoSoftware alongside a LabView-based custom solution.
For the pressure reduction we implemented an 8 mm ball valve in front of the mc-CPC common inlet, that included two interchangeable orifices (0.45 and 0.65 mm). The bypass line of the pressure regulation system consists of two pressure sensors P1 and P2 (Keller Model 23SY, see Fig. 1), a 10 L min−1 flow sensor F (Omron, Model D6F-10A6-000) and a 10 L min−1 solenoid control valve (MKS, 248D). The pressure sensors are installed upstream and downstream of the MKS valve. The control valve is regulated with a PID-controller on the pressure measured by P1, regulating the pressures pCPC inside the CPCs. P2 is recording the pressure in the exhaust line. The flow sensor provides information about the additional flow that is needed to maintain a low and constant pressure at P1. The IDP-3 pump provides the flows Qbypass and QCPC through the bypass and the SKY-CPCs, respectively. For the pressure regulation and the data logging of the pressure and flow sensors we used a LabView program.
2.3 Specifications of the TPEx campaign and the mc-CPC during research flights
2.3.1 The TPEx aircraft campaign
The TPEx aircraft campaign took place at the airbase Hohn in Germany. We conducted eight research flights and one test flight with the Learjet 35A in the time period from 3 to 21 June 2024. One of the main goals of the campaign was the investigation of the extratropical UTLS region. In this context the vertical transport of aerosols from the PBL into the UTLS as well as the effect of NPF was of special interest to us. For more information regarding the TPEx campaign see Joppe et al. (2025), Bozem et al. (2025), and Breuninger et al. (2025).
2.3.2 Learjet 35A aerosol inlet and isokinetic sampling
For the aerosol instrumentation onboard the Learjet a dedicated aerosol inlet with a length of 620 mm was mounted through an exchangeable window. It was designed and provided by the enviscope GmbH. The inlet tip is gold-plated and has a diameter of 1.55 mm to ensure isokinetic sampling at a total flowrate of approximately 20 L min−1 and a true air speed (TAS) of 164 m s−1. Inside the Learjet a flowsplitter divides the sample flow into five aerosol inlets using four 0.25 in. (6.35 mm) tubes placed around a 8 mm aerosol inlet, which was used for the mc-CPC. The flows for all aerosol instruments and also the isokinetic flow regulation system were provided by the mc-CPC IDP-3 dry scroll pump. The pump can ensure a maximum flow rate of 50 L min−1 over the entire pressure range of the flight altitude. The isokinetic flow regulation system was operated with a 50 L min−1 MFC that maintained an additional make-up flow according to the flight conditions.
2.3.3 CPC inlet flow determination
The high flow rates though the IDP-3 pump during TPEx caused some difficulties for the critical mc-CPC flows. The required volume flow QCPC of 0.6 L min−1 for each CPC could not always be maintained during the research flights and was frequently lower. Unfortunately, the Grimm CPC does not log the flow. As an internal verification of the sample flow rate the SKY-CPC only records the pressure drop ratio pd as discrete values upstream and downstream of the CPCs critical orifice. For a choked or critical flow of 0.6 L min−1, the pressure upstream of the orifice needs to be about twice as high as the downstream pressure. If pd is below 2 however, the flow through the orifice is not critical anymore, resulting in erroneously calculated aerosol number concentrations, if no correction is applied. In order to correct for this flow-related error we defined the Flow Factor FF, which is defined similar to pd but uses independent pressure measurements of the mc-CPC peripheral sensors to gain a more detailed understanding of the actual inlet flow:
The FF defines the relationship between the upstream and downstream pressure across the MKS control valve (P1 and P2 in Fig. 1), where the former represents the pressure in the measurement cell of a CPC (pCPC) and the latter is the pressure in the exhaust line pexhaust. The pressure pCPC is rather constant during measurement flights, changing only between 200 and 350 hPa and is maintained by the mc-CPC bypass pressure regulation. However, the flow that provides the low pressures in the bypass (refers to F in Fig. 1) is not constant as it changes with the ambient pressure. The pressurepexhaust on the other hand is dependent on the isokinetic flow in the Learjet inlet and thus on the TAS but also on Qbypass. FF is therefore influenced by several variables and is subject to fluctuations. If FF is lower than 1.9, QCPC is not critical anymore and thus smaller than 0.6 L min−1 which requires a correction of the particle concentration. We use the definition of a choked flow to calculate the corresponding correction factor kFF that was applied to all data when FF < 1.9. A comprehensive description of the flow correction is provided in Appendix C.
2.3.4 Data conversion and data flagging during TPEx
The conversion of the aerosol number concentration Ni to standard temperature and pressure conditions STP was done using a two-step approach. This includes a first scaling of the mc-CPC pressure pCPC to the ambient pressure pambient and a scaling of Tmeas (the temperature of the optics block of the CPC) to Tambient. The ambient conditions were measured by the Learjet sensors. The second step was the final STP conversion to T = 273.15 K and p = 1000 hPa (IUPAC). We also adjusted Ni by the scattered light signal C1 C0 that is monitored in the CPC raw data. Here, C0 and C1 refer to a lower and higher detector threshold. This factor describes the behavior of particle growth in the CPC. A value of C1 C0 < 1 indicates that the growth and thus the diameter size of the aerosol particles is not sufficient to be counted. For a detailed description of this factor and the Ni adjustment see Weber et al. (2023a) and Kirchhoff et al. (2026). A particle loss correction in the inlet line or the pressure-reducing orifice was not applied for most of the data points as we do not have detailed information about the aerosol size distribution that was present in our system during the research flights. Nevertheless, for selected periods with potential NPF events we implemented a particle loss estimation. Furthermore, a pressure-dependent correction of the counting efficiency of the three mc-CPC channels was applied (see Sect. 4.4).
After correcting the mc-CPC data we also applied a data flagging. A high fraction of 84 % of all aerosol number concentrations measured during TPEx was influenced by the above-mentioned flow fluctuations (Sect. 2.3.3). At values FF < 1.2 the data was dismissed due to high uncertainties in the correction factor kFF; in this range a small change in FF leads to large differences in kFF. Data that were collected in the FF range between 1.2 and 1.5 were flagged accordingly. The exact relation between FF and the volumetric flow rate QCPC can be found in Table C1.
Channel 1 and 2 of the mc-CPC were operated at the same saturator and condenser temperatures, which resulted in almost identical cutoff diameters (4.5). The two comparable channels were used as a measure to investigate the overall data qualitiy and consistency of the channels. For correct performance, the ratio Ch1 Ch2 should be close to 1. We assume that a non-systemantic point-by-point deviation of 20 % is within the range of statistical uncertainties, which was calculated to a maximum 22 % (see Appendix C). In the case of higher deviations, the data will be examined individually.
2.3.5 Identification of nucleation events
Another goal was to examine if new particle formation occurs in the extratropical UT similar to the tropics (Williamson et al., 2019; Curtius et al., 2024). The difference between the CPC channels 1 and 2 (lower cutoff) vs. channel 3 (higher cutoff) can give us an indication whether the air masses contained particles in the size-range between the two cutoff diameters, which most likely have formed by recent NPF a few hours ago. Note that growth rates in the UT are highly variable and therefore the time between fresh nucleation and our measurements can differ (Curtius et al., 2024; Kupc et al., 2020). To define a new particle formation event we used the following relation (Weigel et al., 2011, 2009; Curtius et al., 2024):
Here Nsmall refers to the CPC channel with a smaller cutoff than Nlarge. By using this definition even systematic differences or a measurement uncertainty of 30 % for each channel are not interpreted as NPF events.
To characterize the three individual CPCs of the mc-CPC we used two different calibration setups, one being located at the Goethe University Frankfurt (GUF) at the Institute for Atmospheric and Environmental Sciences (IAU). The second one was located at the Forschungszentrum Jülich (FZJ) at the Institute of Climate and Energy Systems (ICE-3), where we conducted the experiments at the IAGOS calibration lab. For both experiments we used the mc-CPC in its Learjet configuration with the 0.45 mm orifice upstream of the inlet lines. Both calibration setups consist of an aerosol generation system, an aerosol size selection, the mc-CPC and a reference instrument. However, they differed in terms of the aerosol generation and composition, the type of reference instrument and its internal pressure. Here, we provide a detailed description.
At both measurement sites, we characterized the mc-CPC at different internal pressures pCPC ranging from 200–750 hPa, where the range of 200–350 hPa is of special interest for the aircraft settings because these were the most frequent conditions during TPEx. Nevertheless, we also did measurements at 500 and 750 hPa to cover the whole range of free tropospheric conditions.
3.1 Calibration at GUF
3.1.1 Calibration setup
In Fig. 2 the schematic of the calibration setup for the mc-CPC characterization at GUF is given.

Figure 2Schematic of the calibration setup at GUF for the mc-CPC cutoff diameter determination, using α-pinene as an aerosol type. The mc-CPC was operated under low-pressure conditions (grey dotted line) while the TSI 3776 CPC measured at atmospheric pressure.
The generation of the aerosol particles was realized via nucleation of α-pinene ozonolysis products by using a custom-made flow tube. The flow tube setup consists of a 2 m stainless steel tube with a diameter of 72 mm, a set of five MFCs providing different flow rates, a UV lamp for ozone generation and a H2O and α-pinene bubbler (Fig. 2).
For the setup, we used pressurized dry air that was filtered through a HEPA filter. The ozone was produced by flushing a UV lamp at a flow rate of 0.05 L min−1. A carrier flow of 1 L min−1 transported the ozone-air mixture into the chamber. For the α-pinene (Sigma Aldrich, 98 %) we used a cold reservoir at a constant temperature of 10 °C. A small flow of 0.005 L min−1 was flushed over the liquid and an additional carrier flow of 1 L min−1 introduced the mixture into the chamber. The wet flow was generated with a 0.8–1.4 L min−1 flow through the bubbler, which was filled with ultrapure water. For the latter setting we used an additional overflow at the end of the flow tube to keep the sample flow constant. This adds up to a total flow of 3 L min−1 which was kept constant for all experiments. With this setting a total particle number concentration up to 40 000 cm−3 can be reached.
The flow tube is connected to an electrostatic classifier (TSI, model 3082) for a monodisperse sample. The aerosols are first charged in an x-ray neutralizer and are then size selected by their electrical mobility in the Differential Mobility Analyzer (nano-DMA, Vienna type). The recirculating sheath flow of the classifier was constant at 15 L min−1 for almost all measurements. This guaranteed a particle size selection of diameters between 3 and 60 nm. For an aerosol diameter of 80 nm as an upper limit, the sheath flow was reduced to 10 L min−1, which is lower than the recommended ratio between sheath flow and aerosol flow of 1 : 5. Thus the error for this particle size was adjusted.
The monodisperse aerosol flow was divided between the mc-CPC and a reference CPC by a Y-splitter. We used a TSI model 3776 CPC as the reference instrument, which has a d50 of 2.5 nm and an aerosol flow of 1.5 L min−1. Together with the sample flow of the mc-CPC a maximum flow rate of 9.5 L min−1 was needed when operating the mc-CPC at 200 hPa. This results in a flow deficit of 6.5 L min−1 that was compensated by a particle free mixing flow implemented after the classifier. At higher internal pressures, the mc-CPC flow was correspondingly smaller.
As the sample flow of the TSI CPC is regulated by pressure differences along the sample path, it cannot be used in low-pressure regimes. It thus measured at laboratory ambient pressure throughout all experiments.
3.1.2 Evaluated parameters
The reference CPC was operated at ambient or external pressures of ∼ 1000 hPa while the pressure inside the mc-CPC was adjusted to 200, 250, 300 and 350, 500 and 750 hPa. The TSI CPC as well as the mc-CPC were STP corrected (IUPAC). Besides the internal pressure, also the inlet flow of the SKY-CPCs was adapted. At each internal pressure stage, an electrical mobility scan was performed at each sample flow listed in Table C1 and was then corrected with kFF.
3.1.3 Measurement procedure
To reach a stable concentration and size distribution of α-pinene aerosol in the flow tube and in the particle counters, the flow tube was conditioned 45 min before the measurements. One measurement includes an aerosol size scan with the nDMA, having a step size of minimum 3 min and ranging from 3 to 80 nm. For each diameter step the first 15 and last 10 s were discarded to avoid a data distortion due to rapid and non-representative changes in the particle concentration. Each measurement cycle includes a background determination by turning off the voltages of the classifier.
We performed the experiment numerous times to cover a wide range of internal pressures and flows. Measurements at pressures higher than 350 hPa were only conducted for critical flows (FF > 1.9).
A particle loss correction calculated with the Particle Loss Calculator (PLC) (von der Weiden et al., 2009) was applied for the TSI reference CPC with regards to its inlet line to ensure a realistic counting efficiency. The mc-CPC setup for the Learjet was not changed for the characterization in the lab. Here, we only calculated particle losses in terms of an additional inlet line that was installed to connect the mc-CPC with the reference instrument. Because of the low-pressure regime in the mc-CPC system we adapted the PLC accordingly.
3.2 Calibration at FZJ
3.2.1 Calibration setup
The calibration setup at FZJ comprises an aerosol generation system, an nDMA for size selection, a mixing chamber and a Faraday Cup Electrometer (FCE) as well as a butanol SKY-CPC and the mc-CPC (see Fig. 3). For our experiments we used the FCE as a reference instrument.

Figure 3Schematic of the calibration setup at FZJ for the mc-CPC cutoff diameter determination. Here NaCl was used as the calibration aerosol and a Faraday Cup Electrometer (FCE) as the reference instrument. The whole system was operated under low-pressures pexternal by using a critical orifice (blue dashed line). The pressure pCPC in the mc-CPC (grey dashed line) was adapted separately (adapted from Weber et al., 2023b).
We used NaCl as the calibration aerosol generated by a nebulizer with filtered air. The aerosol sample flow of 3 L min−1 was dried by a diffusion dryer. For particle selection we used a Vienna-type DMA (Model M-DMA 55-U, Grimm Aerosol Technik GmbH & Co. KG, Ainring, Germany) with a sheath flow of 6 L min−1 and a sample flow of 0.7 L min−1. With this, a lower and upper diameter size limit of 2.5 and 116 nm was achieved. A pressure-reducing orifice was installed downstream the DMA (Fig. 3), which leads to a pressure reduction in the mixing chamber, where also the monitoring of the pressure took place. In the low-pressure mixing chamber, which has a volume of 500 mL, the monodisperse aerosol flow was mixed with a particle-free dilution flow. The latter ranged from 0–10 L min−1 and was adjusted by a MFC matching to the inlet flows of the particle instruments. The aerosol flow entered a sample line, from where it was distributed to the aerosol instruments. These consisted an FCE (Model 5.705, Grimm) and a butanol SKY-CPC (Model 5411, Grimm), of which we used the former one as the reference instrument, and the mc-CPC. All instruments were able to measure at low pressures and had an inlet line of 25 cm. A comprehensive description of the calibration setup can be found in Weber et al. (2023b).
3.2.2 Evaluated parameters
At FZJ the sample flow QCPC in the mc-CPC channels was constant at a targeted flow of 0.6 L min−1 throughout all experiments. Similar to the measurements at GUF we changed the internal pressure pCPC in a range of 200 to 700 hPa for measurements including the pressure-reducing orifice. In addition to pCPC also the external pressure of the mc-CPC was adjusted to 300, 400, 550 and 1000 hPa, which corresponds to the internal pressure of the FCE. These values were selected to mimic the ambient conditions during a research flight and to examine the influence of the pressure difference Δp between pexternal and pCPC on the overall mc-CPC performance. Another series of characterizations without including the orifice in front of the mc-CPC was carried out at 200, 300, 400, 550 and 700 hPa, where pCPC=pexternal to examine the particle losses due in the tube constriction and the pressure change.
3.2.3 Measurement and data analysis procedure
In the FZJ setup the particle source is primary particles which only need a short time to stabilize and to reach a constant signal in the aerosol instruments. The size selection of the DMA was carried out for 30 s for each diameter or voltage level. Thereby the first 15 s of each size selection were dismissed to avoid data impairment. A particle loss correction was applied to the 25 cm long inlet lines for the mc-CPC and the FCE data (von der Weiden et al., 2009). In case of the mc-CPC this includes particle losses for all given pressures pCPC and flow rates QCPC. The FCE was particle loss corrected according to the varying external pressures pexternal. In case of the FCE data, the following corrections were applied additionally: offset correction, multiple charge and flow rate correction (Weber et al., 2023a). All mc-CPC data were STP corrected to pexternal and Tmeas. We corrected the FCE data by the temperature of the laboratory Tlab. A pressure correction was not done for the FCE as it already operated at pexternal.
3.3 Data evaluation methodology
To estimate the performance of a CPC, two parameters are commonly used. The counting or plateau efficiency ηmax and the cutoff diameter d50. To derive the counting efficiency ηmax of the individual mc-CPC channel, the particle number concentration of the respective CPC at a specific diameter is compared to a reference instrument, in our case a TSI 3776 CPC (GUF) and a Grimm 5.705 FCE (FZJ). This leads to the following equation, which is dependent on the aerosol diameter dp:
The so-called cutoff curve, which can be retrieved from the comparison between the counting efficiency ηi and the particle diameter, can be represented by a logistic sigmoid fit function:
Here d50 refers to the aerosol diameter at which the counting efficiency between the mc-CPC channel i and the reference instrument reaches 50 %. d0 describes the onset diameter at which the particles get initially activated and dp is the aerosol diameter selected by the DMA. The efficiency ηmax stands for the plateau region, where the counting efficiency ηi reaches its maximum value and remains stable with increasing dp. ηmin on the other hand refers to the lowest detection efficiency derived by equation 4 and is usually zero. Note that the sigmoid function can still be used to calculate the cutoff d50 at 50 % of the efficiency range between ηmin and ηmax even when ηmax is not 1, which is the case for many CPC calibrations (Hermann et al., 2005; Weigel et al., 2009). A discussion on this formula can be found in Appendix D.
In this chapter we present several data sets of comprehensive measurements to characterize the mc-CPC with respect to the flight conditions as encountered during TPEx. The parameters we investigate are:
-
The influence of the CPC sample flow on the CPC performance
-
The influence of the internal CPC pressure on its performance for both calibration setups
-
The influence of the pressure reducing orifice on the CPC performance at various external pressures
-
The influence of internal and external pressure differences on the CPC performance
4.1 Influence of the sample flow
During the TPEx aircraft campaign, the flow rates of the SKY-CPCs were critical for only 16 % of the measurements. This raises two questions: (1) is the cutoff diameter influenced by the changing flows and (2) how is the data quality affected by it. To answer the first question we determined mc-CPC cutoff diameters at the GUF laboratory (Sect. 3.1) for different combinations of four pressures and four flows.

Figure 4Counting efficiencies of mc-CPC channel 1 with sigmoidal fit curves for pCPC = 250 hPa and pexternal = 1000 hPa and different flows (indicated as flow factor FF in the color bar). As a reference instrument a TSI 3776 was used which was operated at ambient pressure (pexternal = 1000 hPa). Panel (a) shows data without flow correction and respective fits, where panel (b) is with flow correction kFF for each data set and their fit curves. The error bars in panel (a) represent the combined uncertainty of the counting efficiency, derived from the standard deviations of the two aerosol instruments. Error bars were omitted in panel (b) for sake of clarity.
Figure 4 depicts the averaged counting efficiencies for each size bin from channel 1 at an internal CPC pressure of 250 hPa and an external pressure pexternal of 1000 hPa. In Fig. 4a the counting efficiency is displayed without the flow correction. The asymptotic counting efficiency ηmax for the lowest flow of 0.39 L min−1 or FF 1.2 reaches a maximum value of 57 % only. The critical flow of roughly 0.6 L min−1 gives a maximum efficiency of 81 % and a d50 of 11.9 nm. Figure 4b represents the same data as Fig. 4a but includes the flow correction (as described in Appendix C). All data points that were measured at FF < 1.9 are now in line with the target cutoff curve at FF ≥ 1.9 (dark blue). Here, the difference in the asymptotic efficiencies is less than 5 % between the individual cutoff curves. Regarding the cutoff diameter, the largest difference of 0.8 nm occurs between the target flow and FF = 1.2, where the cutoff is slightly higher for lower flows. Still, the deviation is small and within the uncertainty, pointing to the importance of applying the flow correction. This result is also representative for channel 2 and 3 of the mc-CPC. This leads to the conclusion that the prolonged residence time of the aerosols in the CPC system is not affecting the cutoff diameter. Furthermore, the results demonstrate that the flow correction is valid for the laboratory calibration measurements and that the reduction of the sample flow has a negligible influence on the d50 and was therefore disregarded. Consequently, the cutoff characterization in the following plots is only discussed for the flow corrected parameters.
4.2 Comparison of the two calibration setups
Here, we present the results of the mc-CPC characterization at the Goethe University Frankfurt (GUF) and at the Forschungszentrum Jülich (FZJ). In Fig. 5a the cutoff measurements of channel 1 at GUF are shown at a constant external pressure of 1000 hPa and a varying pCPC in the range of 200 to 750 hPa. Figure 5b depicts comparable measurements from FZJ with a pexternal of 400 hPa and pCPC from 200 to 315 hPa. All data points shown in Fig. 5 and also in the following plots are normalized by their plateau efficincy ηmax (see Fig. E1 for the raw data). The cutoff diameters and plateau efficiencies derived from the raw data are listed in Table 2. The focus here is on the pressure range between 200 and 350 hPa, as these were the pressures at which the mc-CPC was operated during the TPEx campaign. Note that the differences in the measurement setups arise due to technical limitations, which mainly concern the differences in the external pressures and the test aerosol.

Figure 5Counting efficiencies normalized by the plateau efficiency for channel 1 of the mc-CPC measured (a) at GUF with a constant external pressure of 1000 hPa and a TSI 3776 reference instrument, where measurements at different sample flows are averaged and (b) at FZJ with a constant pexternal = 400 hPa using an FCE as reference instrument. Both with varying internal pressures (as indicated by the color bar). The fits are derived from Eq. (4). The error bars are the standard deviation.
Table 2Cutoff diameters (d50) and plateau counting efficiency ηmax derived from Eq. (4) for channel 1 (ΔT = 36 °C) measured with the calibration setup at Goethe University Frankfurt (GUF) and Forschungszentrum Jülich (FZJ). The parameters determined for pCPC = 250 hPa at FZJ are the average of two measurements and the GUF data are averaged values over all measurements at different flows. The d50 error describes the bandwidth of the DMA transfer function.
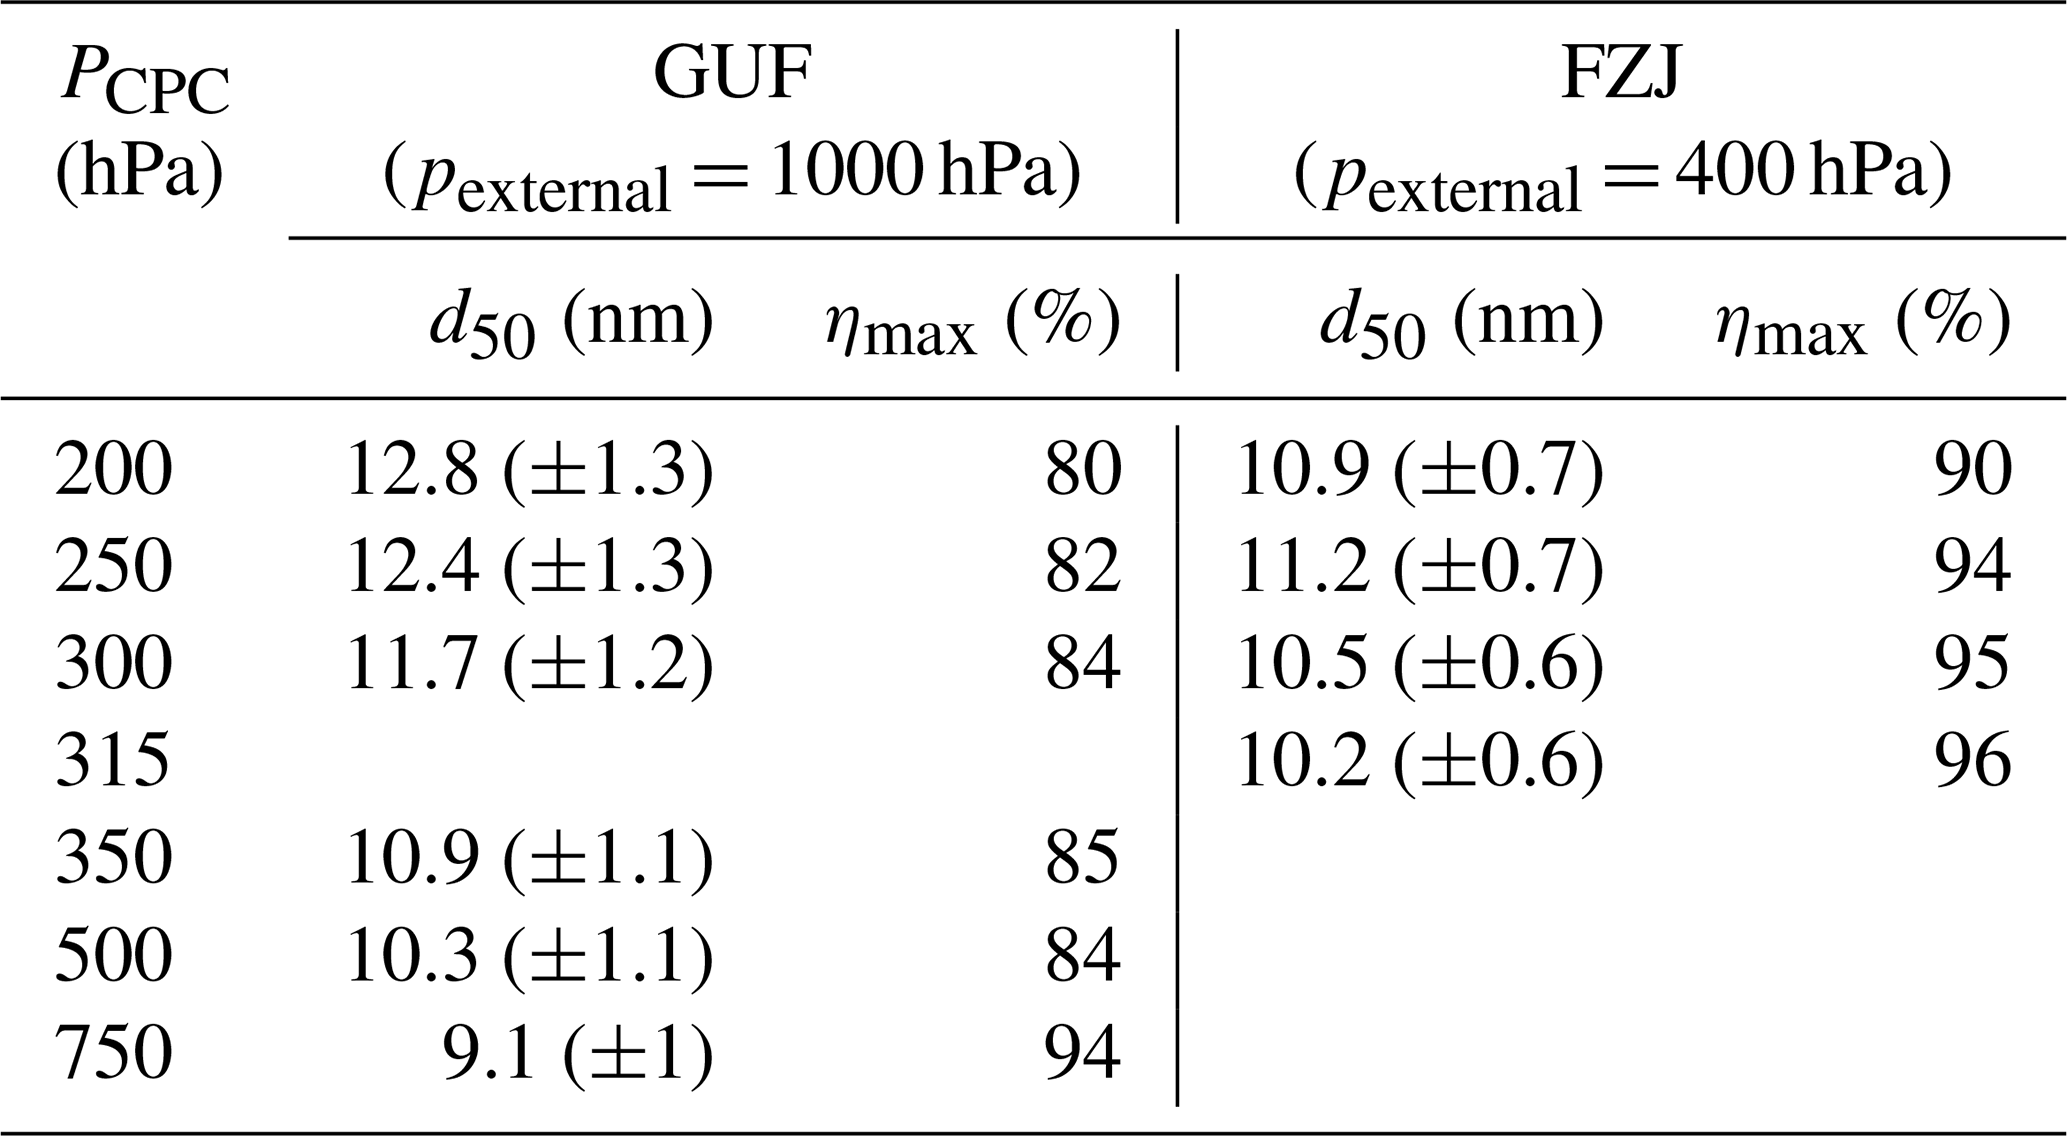
The direct comparison between the two calibration setups of Fig. 5a and b shows that the overall fit progression follows a similar trend. Still slight differences in the plateau efficiencies as well as in the cutoffs are visible. However, the measurements taken at FZJ show much higher efficiencies throughout all pressure stages compared to the GUF measurements, i.e. when the data is not normalized by ηmax (see Table 2). At a pCPC of 250 hPa ηmax is 94 % for FZJ and 82 % for GUF, respectively. This difference of roughly 10 % stays rather constant at comparable internal pressures, which results in a difference in the cutoff diameter as well. When obtaining the cutoff diameters from Fig. 5a for the GUF measurements at 250 hPa internal pressure, channel 1, 2 (operated at ΔT = 36 °C) and 3 (operated at ΔT = 15 °C) reached cutoff diameters of 12.4, 12.1 and 16.4 nm, respectively (Figures for channels 2 and 3 are presented in Appendix E). The experiments at FZJ for the same channels showed d50 values of 11.2, 12 and 14.7 nm. The cutoff diameter is therefore in agreement for both setups for all three channels when considering the uncertainties Δd50 of the cutoff determination listed in Table 2.
Both laboratory experiments show that with increasing internal pressures the plateau efficiency increases while the cutoff decreases, but this effect is stronger at GUF than at FZJ (Table 2). This is true for all three channels in the given pressure range of 200–350 hPa. For the FZJ experiments the cutoff diameter shifts by ∼ 1 nm to smaller values when increasing the pressure from 200 to 315 hPa, where the differences are in the range of uncertainty. Moreover, the ratio between the channels with smaller cutoff diameters (1 and 2) and the channel with larger cutoff (3) stays rather constant within 1 nm (Table E2). At GUF we saw a decrease of less than 2 nm in d50 while changing pCPC from 200 to 350 hPa, though the differences become larger when increasing the pressure even further. This is similar to the results from Bauer et al. (2023) who noted the same trend with identical Grimm instruments using butanol as the working fluid. Previous studies using FC-43 with CPCs from other manufacturers indicate that the cutoff of the respective instrument shifts to smaller sizes at lower internal pressures (Williamson et al., 2018; Hermann et al., 2005; Weigel et al., 2009).
Figure 5 illustrates that the increase of pCPC leads to an enhanced CPC performance and this behavior was reproduced for both experimental setups. Furthermore, the d50 changes only slightly for the pCPC pressure range of 200–350 hPa. At FZJ we also changed the external CPC pressure pexternal to mimic different flight levels, which could not be done at GUF. As the FZJ measurements are thus more representative for the conditions during the TPEx flight campaign, we will proceed with discussing these results, but comparable measurements, which were performed at GUF, are documented in the Appendix for completeness.
4.3 Tests without pressure reduction by critical orifice
One reason for the discrepancy between the data shown in Fig. 5 could be caused by the particle losses in the inlet system due to the pressure-reducing orifice. To verify how large its influence on the cutoff diameter and the counting efficiency of the CPCs is, we removed the orifice and did diameter scans for pressures listed in Table 3 which represent flight altitudes between 11 500 and 3000 m. For these measurements the electrometer and the mc-CPC were operating at the same pressures, where Δp = pexternal−pCPC = 0.
Table 3Cutoff diameters and counting efficiencies of mc-CPC channel 1, 2 and 3, operated without pressure-reducing orifice for varying pressures. FCE is used as the reference instrument. The values listed are derived from Eq. (4). The d50 error is given as the DMA mobility bandwidth error.


Figure 6Normalized counting efficiency for (a) channel 1 and (b) channel 3 derived from FZJ measurements at different ambient pressures (colorbar) with FCE data. The pressure-reducing orifice was not used during these experiments, therefore internal and external pressure are the same. The error bars are the standard deviation of each CPC diameter step.
In Fig. 6a and b the normalized counting efficiencies for channel 1 and channel 3 are depicted, respectively, color-coded by the pressure. The results for channel 2 are included in Table 3. Similar to Fig. 5b, the dependence of the pressure on the CPC performance changes, at least for channel 1 and 2. For 200 hPa we determined a d50 of 11.9, 11.7 and 13.5 nm for all three channels, which leaves only a difference of less than 3 nm between the “small” and the “large” CPC channels. Still, the values are in a similar size range as the cutoffs determined with the default mc-CPC setup (Tables 2 and E2). The smallest cutoff diameters of 8.2 and 8.8 nm were reached for channel 1 and 2 at 700 hPa. During the pressure increase, the counting efficiency for the two channels reaches a maximum of 100 % (±5 %) for all pressure stages, which is higher than for the orifice-including measurements. This suggests that the critical orifice installed before the mc-CPC inlet causes particle losses. Especially particles in the size range were the plateau efficiency reaches its maximum seem to be affected. This could explain the small difference between the cutoff diameters measured with and without orifice and the larger differences regarding the plateau efficiency.
However, this behavior is not fully reproducible for channel 3. At 550 hPa and 700 hPa, the trend reverses and the onset diameter as well as the cutoff moves to larger diameters. From the raw data in Table 3 we can also determine that the plateau efficiency stays rather constant between 200 and 550 hPa but decreases drastically to 56 % at 700 hPa. We cautiously suggest that the drop in the CPC performance at 700 hPa is due to a reduced FC-43 diffusion rate in the saturator and a small ΔT. The diffusion rate is highly dependent on the pressure, being enhanced at lower pressure levels. By increasing pCPC to 700 hPa we possibly also decreased the diffusion of FC-43 into the center of the saturator, which consequently could have had an unfavorable effect on the particle activation. The much higher saturator temperature of channel 1 and 2 may have balanced out the effect of the high pressure. Note, that these are assumptions, which need further investigation. Nevertheless, the trend of an increased CPC performance at increased pressures up to 400 hPa is reproducible even without the orifice, which leads to the conclusion that the limiting factor is not the particle loss through the orifice but the geometry of the inlet line.
4.4 Influence of the external CPC pressure
In Fig. 7 the normalized counting efficiencies of all three channels at a constant internal CPC pressure of 250 hPa and at four external pressures are depicted. The cutoff diameters as well as the plateau counting efficiency of the raw data are listed in Table 4. For the graphical representation of the raw mc-CPC data, see Appendix F.

Figure 7Counting efficiencies normalized by the plateau efficiency of all three mc-CPC channels (a–c), color-coded by the external pressures. The internal pressure pCPC is 250 hPa for all panels. The error bars represent the standard deviation. Note that for pexternal = 300 and 400 hPa the depicted data is averaged for two measuremement cycles.
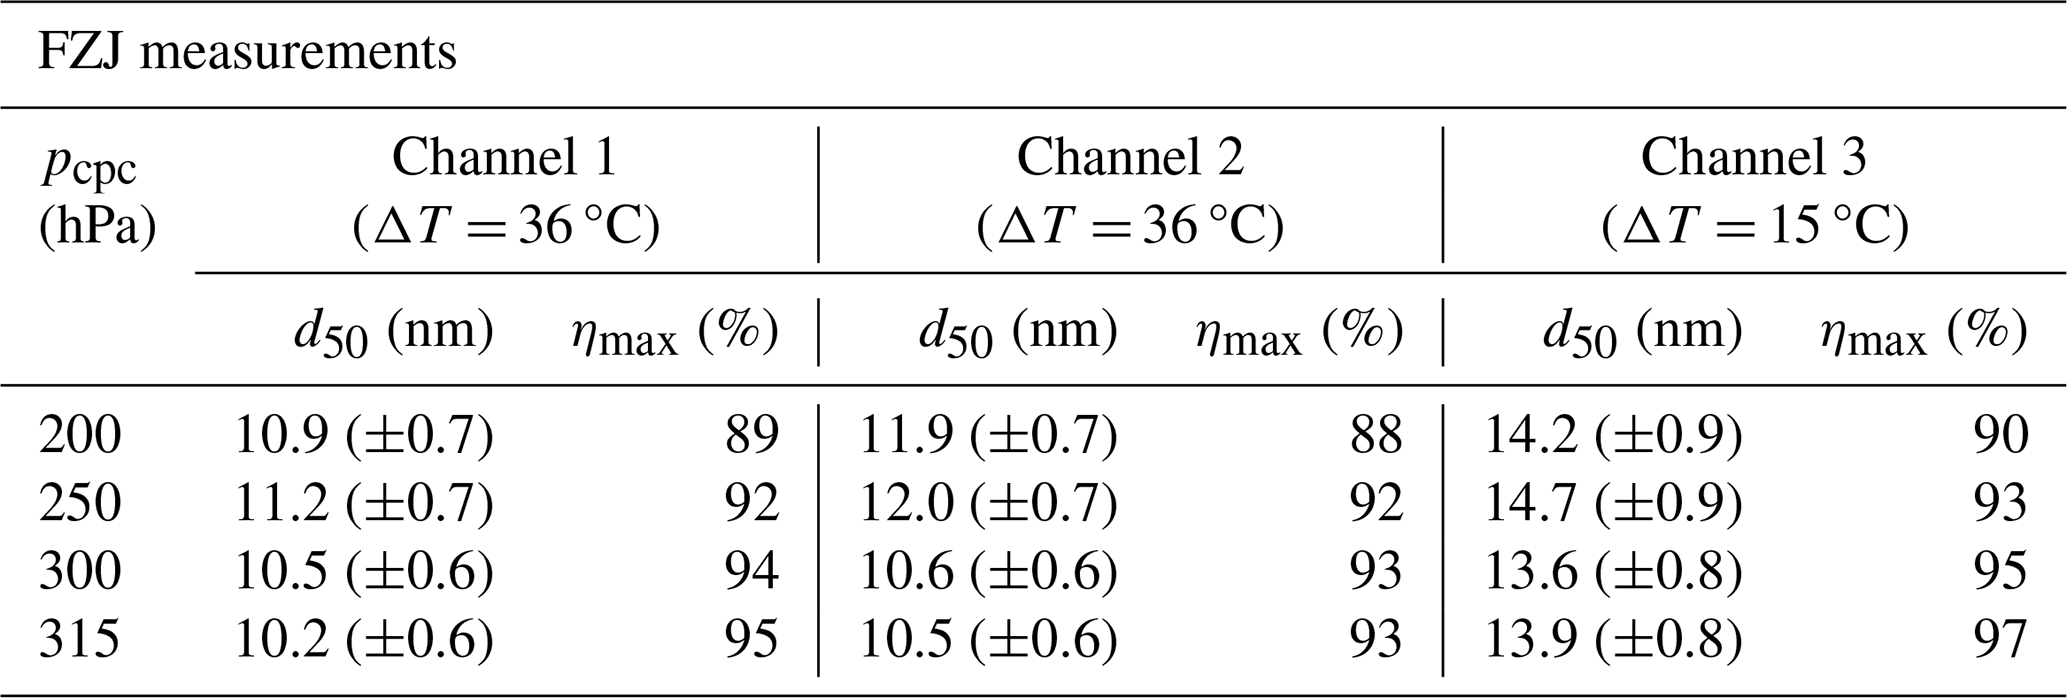
Table 4Cutoff diameters and counting efficiencies (Eq. 4) of mc-CPC channel 1, 2 and 3, operated in the Learjet configuration for varying external pressures and at a fixed internal pressure of 250 hPa. The FCE was used as the reference instrument. The d50 error is given as the DMA mobility bandwidth error.

From Table 4 one can directly derive a dependency of the counting efficiency with the external pressure, which is reproducible for all three mc-CPC channels. The higher pexternal and thus the higher Δp, the lower is the plateau efficiency. This can probably be explained by increased inlet line losses resulting from the higher pressure drop and thus the higher flow that is provided by the mc-CPC bypass system. However, the differences between pressure levels are rather small. The smallest counting efficiency could be derived at pexternal 1000 hPa being the same for each channel at 87 %. The maximum ηmax is associated with the lowest pexternal of 300 hPa (Δp = 50 hPa) and gives values from 94 % to 96 % for channel 1–3, respectively. In total the change in efficiency is less than 10 % for all channels in the external pressure range of 300 to 1000 hPa.
Note that the cutoff diameters determined for the different pressures are relatively constant. In case of channel 1, d50 ranges from 11.1 to 11.4 nm which is within the uncertainty, while the deviations for channel 2 and 3 were somewhat larger, ranging from 12 to 12.6 nm and from 14.7 to 15.2 nm, respectively, which is still within their uncertainty. The differences in the channels are probably due to statistical deviations.
The measurements indicate that the cutoff diameters are not strongly dependent on the external pressures and also the plateau efficiency is only to a minor degree influenced by pexternal. For our aircraft measurements, this means that varying altitudes do not alter the cutoff but the plateau efficiency changes slightly with altitude. Hence, the measurement data of the research flight presented in Sect. 5 were corrected by the raw counting efficiency according to the pCPC and the ambient pressure pexternal (see Fig. G1 for the summarized data).
4.5 Synthesis of the laboratory measurements
Figure 8a depicts the cutoff diameters of the three CPCs at varying internal pressures. The color code refers to the Δp between upstream (pexternal) and downstream (pCPC) pressure of the critical orifice. With an increase in CPC pressure the cutoff decreases. In the displayed measurement range of 160 to 700 hPa the cutoffs of channels 1 and 2 decrease by about 5 nm. This relation arises for channel 3 as well, but only at lower pressures of up to 400 hPa. The cutoffs of all channels seem to be rather independent of the pressure change between pexternal and pCPC although the counting efficiency shows higher values when Δp is low. During the TPEx campaign the pressure difference between the ambient and the CPC pressure was most of the time lower than 200 hPa which leads to a difference in ηmax of 5 %–10 % (Fig. G1).

Figure 8(a) FZJ measurements for all mc-CPC channels plotted as cutoff diameters dependent on pCPC, color coded by Δp = pexternal−pCPC; and (b) normalized counting efficiencies with corresponding cutoff diameters measured and averaged at pCPC = 250 hPa and pexternal = 300 and 400 hPa. The data points represent the mean values of two measurement stes for pexternal = 300 and 400 hPa in each case at two different days. The error bars are the standard deviation of these four combined measurements.
Looking at the internal pressure range of 200–350 hPa it becomes apparent that the cutoff changes only slightly. For Channel 1 this means a decrease of ∼ 1 nm with increasing pCPC, channel 2 drops about 1.6 nm and channel 3 decreases 1.2 nm. This indicates that the overall decrease in cutoff with pCPC is rather constant for all channels, at least in the relevant pressure range. We therefore decided to use only one characteristic cutoff diameter per channel for the pressure range of 200–350 hPa. With the most commonly observed pressures of pCPC during TPEx at around 250 hPa (46 %) and pexternal of 300–400 hPa (23 %), the cutoffs are determined to be 11.3 nm regarding channel 1, 12.3 nm for channel 2 and 14.9 nm for channel 3, as shown in Fig. 8b. The channels 1 and 2 have the same ΔT of 36 °C, which should in theory result in a comparable cutoff. With our measurements, we show that this is true within the range of uncertainty. Note that the cutoff difference between the smallest and the largest channel is only 3.6 nm. This is rather small regarding the large difference in ΔT. We also observed that the performance of the CPC (cutoff diameter and plateau efficiency) is decreasing at low pressures and not the other way around, as Hermann et al. (2005), Weigel et al. (2009) and Williamson et al. (2018) presented. As another striking feature it needs to be pointed out that at a pressure of 550 hPa the cutoff of channel 3 suddenly increased with the pressure, which we have not seen for the other channels. First, we want to emphasize that the previous studies that investigated the enhanced efficiency of FC-43 at lower pressures used different CPC instruments than we did (e.g. TSI CPCs). Furthermore, there are studies that examined the behavior of Grimm CPCs at low pressures (Weber et al., 2023b; Bauer et al., 2023) and observed a similar relationship as we did, but were using butanol as the working fluid. Due to the different measurement setups, these studies cannot directly be compared to ours. Currently, we can only speculate about the reasons for this behavior in our system. We tentatively propose that altering diffusion rates in combination with the relatively long mc-CPC inlet lines could have caused the dropping CPC performance for all three channels with decreasing pressures in the range of 200 to 400 hPa. However, also the increasing cutoff sizes observed for channel 3 at pCPC > 400 hPa could be a result of varying diffusion rates. The diffusion of gases is dependent on the temperature and the pressure; low pressures and high temperatures are most favorable. On the other hand, the diffusion losses of aerosols to the wall are also affected by these parameters and additionally by the length of the inlet lines. The diffusion losses of small particles are high at low pressures (in the size range of 2–35 nm five times higher for 200 hPa than for 1000 hPa). Our inlet line is rather long, which enhances the particle losses even further. This could explain the large cutoffs that we observed even at the highest ΔT. When increasing the pressure in the range of 200 to 400 hPa, the aerosol diffusion coefficient decreases, which could have led to lower cutoff diameters. We assume that saturator temperatures of 41 and 35 °C, respectively, in this pressure regime are high enough for the FC-43 to reach the center of the saturator and to reach supersaturation (Hermann et al., 2005). A further increase of pCPC could have caused unsaturated sections in the saturator due to a lowered FC-43 diffusion rate (Hermann et al., 2005; Bauer et al., 2023). This seems to have an effect only on the performance of channel 3, as the cutoff diameters of channel 1 and 2 still decrease with increasing pCPC (Fig. 8a).
With these results, we can conclude that the mc-CPC in this configuration is best suitable for low internal pressures. For aircraft campaigns that focus on different flight levels, a pressure regulation seems to be useful. Especially when flying in the UTLS region it might be appropriate to remove the orifice and thus the pressure regulation to avoid the additional particle losses.
In the course of the TPEx campaign we performed eight research flights (RF) in different regions of Germany, the North Sea and the Baltic Sea. Figure 9 shows the time series of several variables measured during RF04 on 12 June 2024. The take-off and landing took place at the airbase in Hohn, Germany. The flight was 3.5 h long and was conducted over the Baltic Sea in a northerly direction towards Sweden. In the following section, we will discuss the factors that could influence the particle number concentration and related variables measured by the mc-CPC. An in-depth discussion of the aerosol data and possible atmospheric implications is beyond the scope of this study and will be presented elsewhere.

Figure 910 s average time series of different parameters during the research flight 4 (RF04) on 12 June 2024 starting from Hohn, Germany with the Learjet 35A. (a) Internal pressure of the mc-CPC system, the ambient pressure and the Flow Factor (FF = pexhaust pCPC) which transfers to the sample flow, (b) aerosol number concentration (STP, kFF and pCPC corrected) for three CPC channels ΔT (channel 1&2) = 36 °C, ΔT (channel 3) = 15 °C and flagged data (FF between 1.2–1.5) is represented by dots and (c) aerosol number concentration between channel 1 and 3, colored in light blue are areas with potential NPF events (Eq. 2). The inlet line losses for 13 nm particles were determined to 22 %.
The internal pressure pCPC measured by the mc-CPC peripheral system was set to 200 hPa during RF04. Figure 9a shows that this value could be maintained during the whole flight, even in the altitude transition regimes. Note that the flight altitude varied only between 330 and 215 hPa, which is favorable for a constant pCPC of 200 hPa. The flow factor FF in Fig. 9a represents the sample flow rate of the CPCs. In the time between 10:40 and 12:30 UTC the FF value is most of the time below a value of 1.7 (refers to a flow of < 0.55 L min−1). This indicates that the flow through the CPCs during this time was neither critical nor constant. FF is strongly dependent on the flight altitude and pump performance, but it steadily increases with flight altitude, approaching a critical constant flow. Between 12:35 and 13:55 UTC FF reached a value > 1.9 which leads to a critical flow of 0.6 L min−1 through the individual CPCs.
The particle number concentration of the three channels in Fig. 9b shows close agreement over most of the first half of the flight. As we could not perform a quantitative particle loss correction because of the unknown size distribution, the measured concentrations represent lower limits of the ambient aerosol concentration. Nevertheless, as all channels are subject to similar particle losses due to their common inlet, the identification of NPF events should not be affected strongly. Furthermore, the general concentration range and relative trends of the total concentration are well represented by the measurements. In Fig. 9c, the difference in particle concentration N11–15 between channel 1 and 3 underlines the similarity between the channels. During the first half of the flight N11–15 is often below 500 scm−3 and rather constant, showing only a few higher concentration peaks. In addition, the NPF criteria Eq. (2) (light blue markers in Fig. 9c) was only fulfilled for a few seconds (e.g. 11:33 UTC), which indicates that in this part of the flight the aerosols were mainly Aitken mode particles and not freshly formed. However, in the second part of the flight and especially in the time from 12:30 to 13:45 UTC, the differences between the channels increase significantly, and the NPF criteria indicates NPF events. At the highest altitude of 11.3 km (215 hPa) the NPF criteria (Eq. 2) was permanently fulfilled, suggesting that the aerosols in this layer are most likely recently formed. When calculating the particle number concentration N11–15 in this altitude between channel 1 and channel 3 we get an average concentration of ∼ 1000 scm−3 for the whole flight level. Compared to the first flight level (8 km, 330 hPa) this is 4 times higher. An estimation of the particle losses in the inlet line of the Learjet and the mc-CPC for the highest flight level gives particle losses of ∼ 22 % for 13 nm aerosols (von der Weiden et al., 2009). The highest loss rates occur for the smallest particles (82 % for 3 nm aerosols), due to the high diffusion losses at low pressures. Therefore, it is likely that the concentration of nucleation mode particles are much higher than we measured.
Figure 9 demonstrates that even though the differences in the cutoffs of the individual channels are rather small, we are still able to differentiate between them and more importantly, to identify possible NPF events.
In Fig. 10 the aerosol concentration measured by channel 1 and 2 as 10 s averages are presented as a scatter plot. All data points measured at FF > 1.2 were included in the figure. Here, we clearly see that the deviations between the channels are frequently rather high, in some cases exceeding a factor 2. Especially in a concentration regime of 300–1000 scm−3 these variations are pronounced. The color bar demonstrates that the deviations are high especially for phases were FF is small (yellow crosses). By excluding FF values that are smaller than 1.5 we gain an excellent correlation of r2 = 0.96. Almost 80 % of the data points at FF > 1.5 are within the uncertainty of 20 %. Individual data handling is needed, when deviations exceed this uncertainty. Nevertheless, for critical flows (FF > 1.9) the data points lie almost exclusively on the 1 : 1 line. This finding supports our assumption that the flow fluctuations caused most of the variation in the data between channel 1 and 2. We will focus on keeping the Flow Factor > 1.9 in future aircraft campaigns to avoid these fluctuations.

Figure 10Scatter plot of channel 1 and 2 (d50 of 11.3 and 12.3 nm) from RF04, as 10 s average data. The squares represent data points collected during the flight at FF > 1.5 and the crosses show data in a FF range of 1.2 to 1.5. Both figures are color-coded by the Flow factor (pexhaust pCPC), measured by the mc-CPC peripheral.
We designed and set up a multi-channel CPC for aircraft measurements from three individual SKY-CPCs realizing different cutoff sizes of 11.3 nm (channel 1), 12.3 nm (channel 2) and 14.9 nm (channel 3), where channels 1 and 2 have the same cutoff within their uncertainties. We chose channel 1 and 2 to be redundant in order to provide additional checks of the performance and reliability in flight. To keep the pressure in the instrument constant despite changing altitudes, we installed a pressure regulating bypass system. We performed comprehensive mc-CPC calibrations with two independent setups at GUF and FZJ, comparing two characterization methods. Both calibrations investigated the influence of different internal CPC pressures on the counting efficiency and the cutoff diameter. The results of both calibrations showed that the cutoff is only to a small degree dependent on pCPC in the range of 200–350 hPa. Moreover, we showed that the cutoffs were comparable for both experiments, even though the setups differed in several aspects. Another observation from the GUF and FZJ calibration is the correlation of the performance of channel 1 and 2 with the internal pressure: the higher the pressure, the higher the counting efficiency and the lower the cutoff. For channel 3 (ΔT 15 °C) the trend reversed for pressures > 400 hPa. This behavior was observed for measurements with and without the pressure-reducing orifice. The use of the mc-CPC in this arrangement is therefore only suitable for pressures between 200 and 400 hPa, as otherwise, the cutoffs will diverge too much and a comparison between the channels becomes difficult. This makes the pressure-reducing orifice inevitable. Still, the diverging cutoff diameters at internal pressures > 400 hPa could be a benefit for future ground-based measurements, as changes in the cutoff diameter could be rather quickly realized by changing the internal pressure. Therefore, a comprehensive examination of the pressure-cutoff dependency at different ΔT could be of further interest. Furthermore, the influence of the pressure difference Δp between internal and external CPC pressure on the CPC performance was investigated. The results showed that although the counting efficiency is higher when Δp is small, the cutoffs did not change. This implies that the application of the mc-CPC is not only possible for upper tropospheric but also for ground-based measurements (with pexternal ∼ 1000 hPa) and only needs minor corrections.
In order to improve the performance of the mc-CPC for upcoming campaigns, we plan a few adjustments. One thing is to shorten and straighten the individual inlet lines outside the mc-CPC housing to decrease particle line losses. To reduce the particle losses even further, the orifice changing ball valve could be replaced by a valve that switches between a pressure-reducing orifice and an 8 mm tube. By this adaption, one can switch between a constant pressure stage and a free-floating instrument, depending on the flight level. Another aim is to use all three channels at different cutoffs to gain more information about the air masses and potential NPF events.
The mc-CPC was operational for the first time as part of the TPEx aircraft campaign. Research flight 04 showed a stable internal mc-CPC pressure during all flight levels. The aerosol measurement data during TPEx was affected by non-critical and thus fluctuating sample flows. For future campaigns, it is recommendable to use a separated pump for the mc-CPC to avoid flow and pressure fluctuations. Nevertheless, after data correction and data flagging the measurements of channel 1 and 2, which were both operated at a ΔT of 36 °C show an excellent agreement (r2 = 0.96).
To calculate the vapor pressure pvap of butanol in the CPC, we used the following equation with the corresponding parameters b = 46.78 and c = 11.26 (Baron and Willeke, 2001), where T is given in Kelvin and can be replaced by the CPC temperatures Tsat and Tcon.
For the vapor pressure of FC-43 dependent on the saturator and condenser temperature, the following equation was used (Baron and Willeke, 2001; 3M, 2019):
Here the parameters a and b are determined to 10.511 and 2453, respectively (3M, 2019).
The Table summarizes the inlet line length inside and outside the mc-CPC housing. Combining the dimensions of all inlet lines this results in an inlet line of 143 cm for channel 1, 131.5 cm for channel 2 and 145 cm for channel 3 with an uncertainty of ±8 cm respectively.
Table B1Dimensions of the individual CPC inlet lines with reading error, the common mc-CPC inlet and the Learjet aerosl inlet.

Due to non-critical sample flows in the individual mc-CPC CPCs, we applied a flow correction to all data that were collected at FF < 1.9. This was done after the campaign. Here we measured the sample flow of each CPC with a TSI flowmeter (Series 5200) at different internal pressures and FFs. The pressure inside the CPC was changed according to pCPC during the TPEx camaign. The Flow Factor varied from 1.1 to > 1.9. This gives us a flow rate measured by the TSI flow meter that corresponds to a specific flow factor, which can be derived from Eq. (1). With this correlation we can estimate a correction factor for each CPC and pressure (see Fig. C1b). The correction factor for three different flows are highlighted in Table C1. The pressure pCPC did not affect the flow rate in the CPCs when FF was constant (Fig. C1a). Therefore all measurements for a wide range of flows and four different inlet pressures are combined to one fit function that is applied for every laboratory and campaign data set.
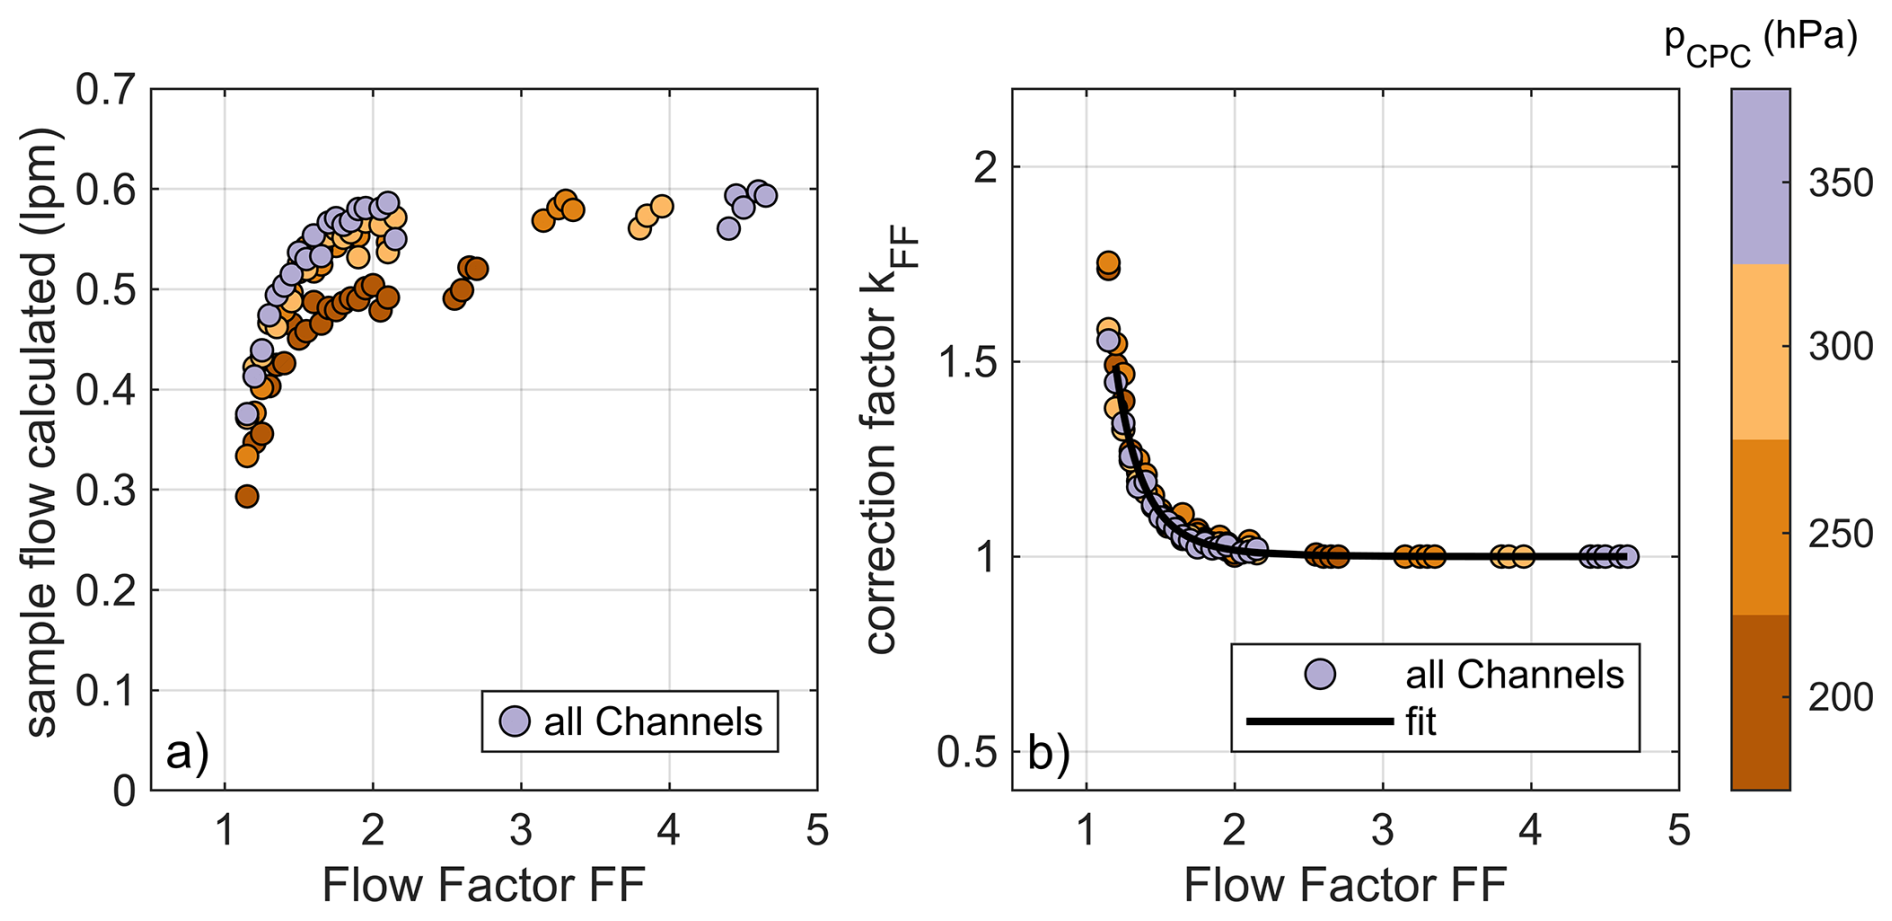
Figure C1(a) Sample flow of all three mc-CPC channels combined measured by a TSI flowmeter against the Flow Factor FF, (b) correction factor kFF (= flowmax flow) derived from the sample flow, color coded by the internal pressure. The measurements were done at GUF. The data points represent averaged data.
The flows for pCPC = 200 hPa as depicted in Fig. C1 are lower than the 0.6 L min−1 that were observed for higher values of pCPC. The measurements shown represent an average of several measurements, and for some measurements also a flow of 0.6 L min−1 was observed, as expected. We think that the sometimes lower flows are actually an artefact, but we were not able to fully resolve this issue with the available instrumentation. Still, this issue needs further investigation in the future. The correction factor kFF was calculated by normalizing the flow of measurement series i to the maximum flow (which should be ∼ 0.6 L min−1). In the case of pCPC = 200 hPa we did not account for an extra flow correction due to the reasons meantioned above.
Table C1Examplary flow factors (determined by the pressure regulation system), corresponding flows (measured by TSI flow meter) and their correction factors.

The following fit function was derived from the data depicted in Fig. C1 and was applied to all lab and flight measurement data collected at FF < 1.9 (excluding data points at FF < 1.2):
The uncertainty of the flow factor FF was determined to a relative error of 8 %, which results out of a reading and an instrumental error of pexhaust and pCPC. With this a ΔkFF kFF was estimated to a value of 19 %. The overall error for the aerosol number concentration Ni,corr can be determined by the following:
This includes an instrumental error of the aerosol concentration of 10 %, an 5 % error resulting from the STP correction and an 5 % error that comes from the pressure adjustment which was determined by the plateau efficiency. The error is an upper limit, for higher FFs, it becomes smaller.
Many research groups are using the adapted exponential fit defined by Wiedensohler et al. (2018) to determine the CPC specific parameters:
To compare whether the exponential fit or the sigmoidal fit represents the calibration data more properly we present the data here using both methods. Figure D1 shows the counting efficiency of channel 3 measured without pressure-reducing orifice.
Even through the cutoffs and plateau counting efficiencies derived from Fig. D1a and b do not differ much, the sigmoidal fit represents the progression of the data more accurately than the exponential fit.
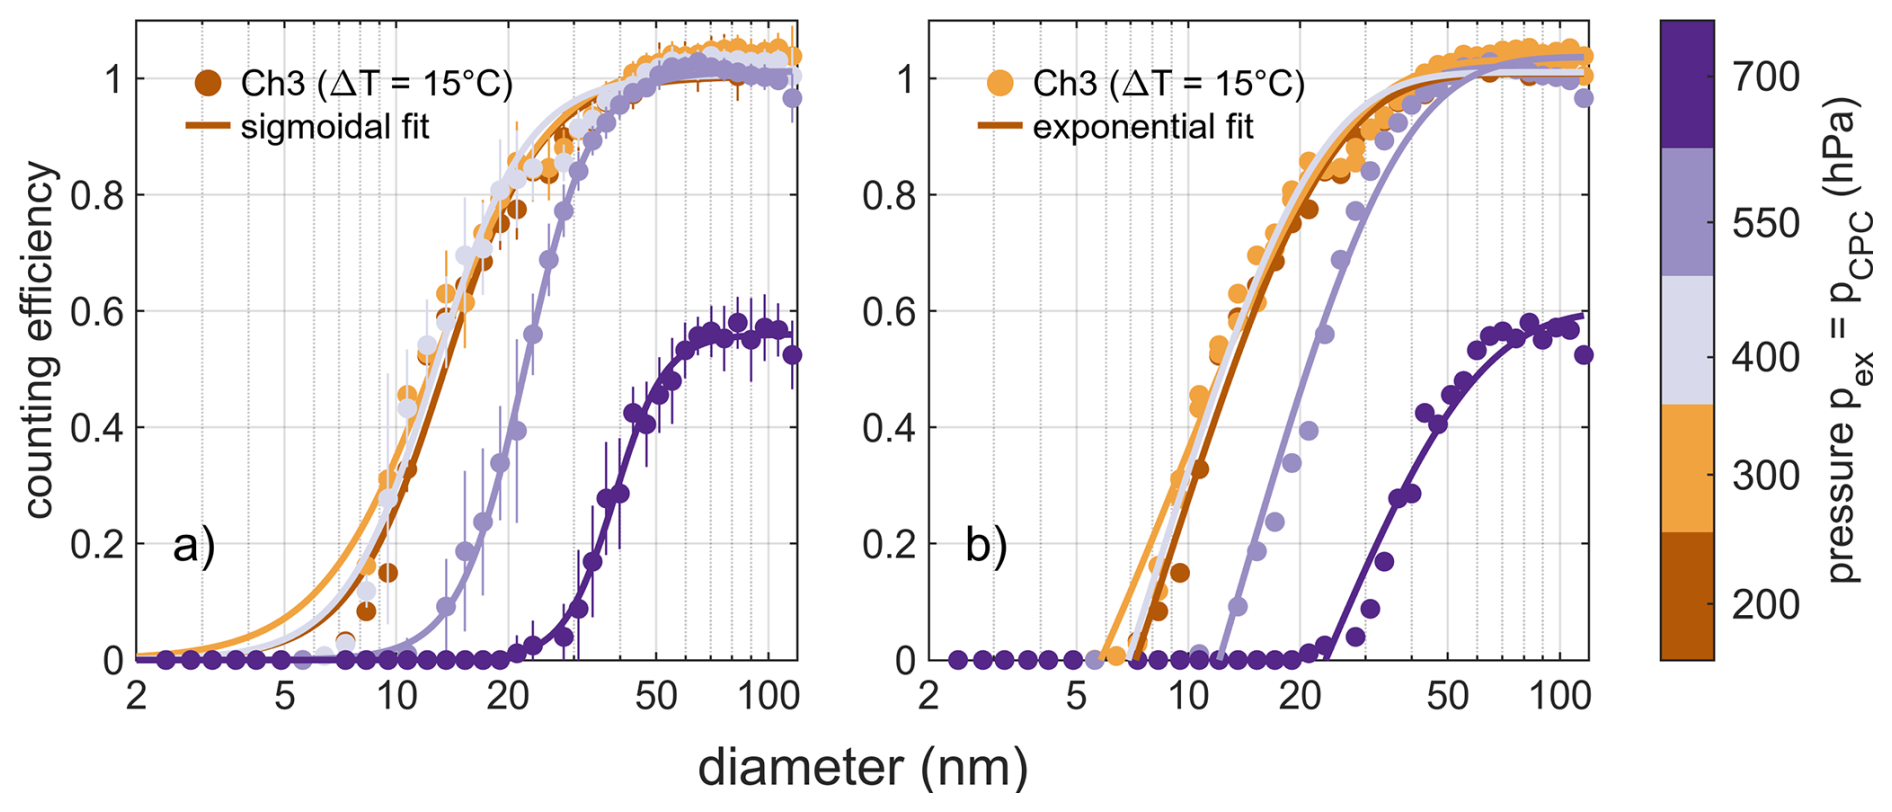
Figure D1Counting efficiency of channel 3 measured without mc-CPC pressure-reducing orifice at FZJ at different pressures (colorbar). In panel (a) the data is represented through a sigmoidal fit and in panel (b) with an exponential approach.
Here the cutoff diameters and the counting efficiencies of all three mc-CPC channels and for all measurements done at GUF and FZJ are depicted. The following plots show the raw data of the counting. As a reference instrument we used the FZJ FCE. The corresponding cutoff diameters and plateau efficiencies are listed in Tables E1 and E2.
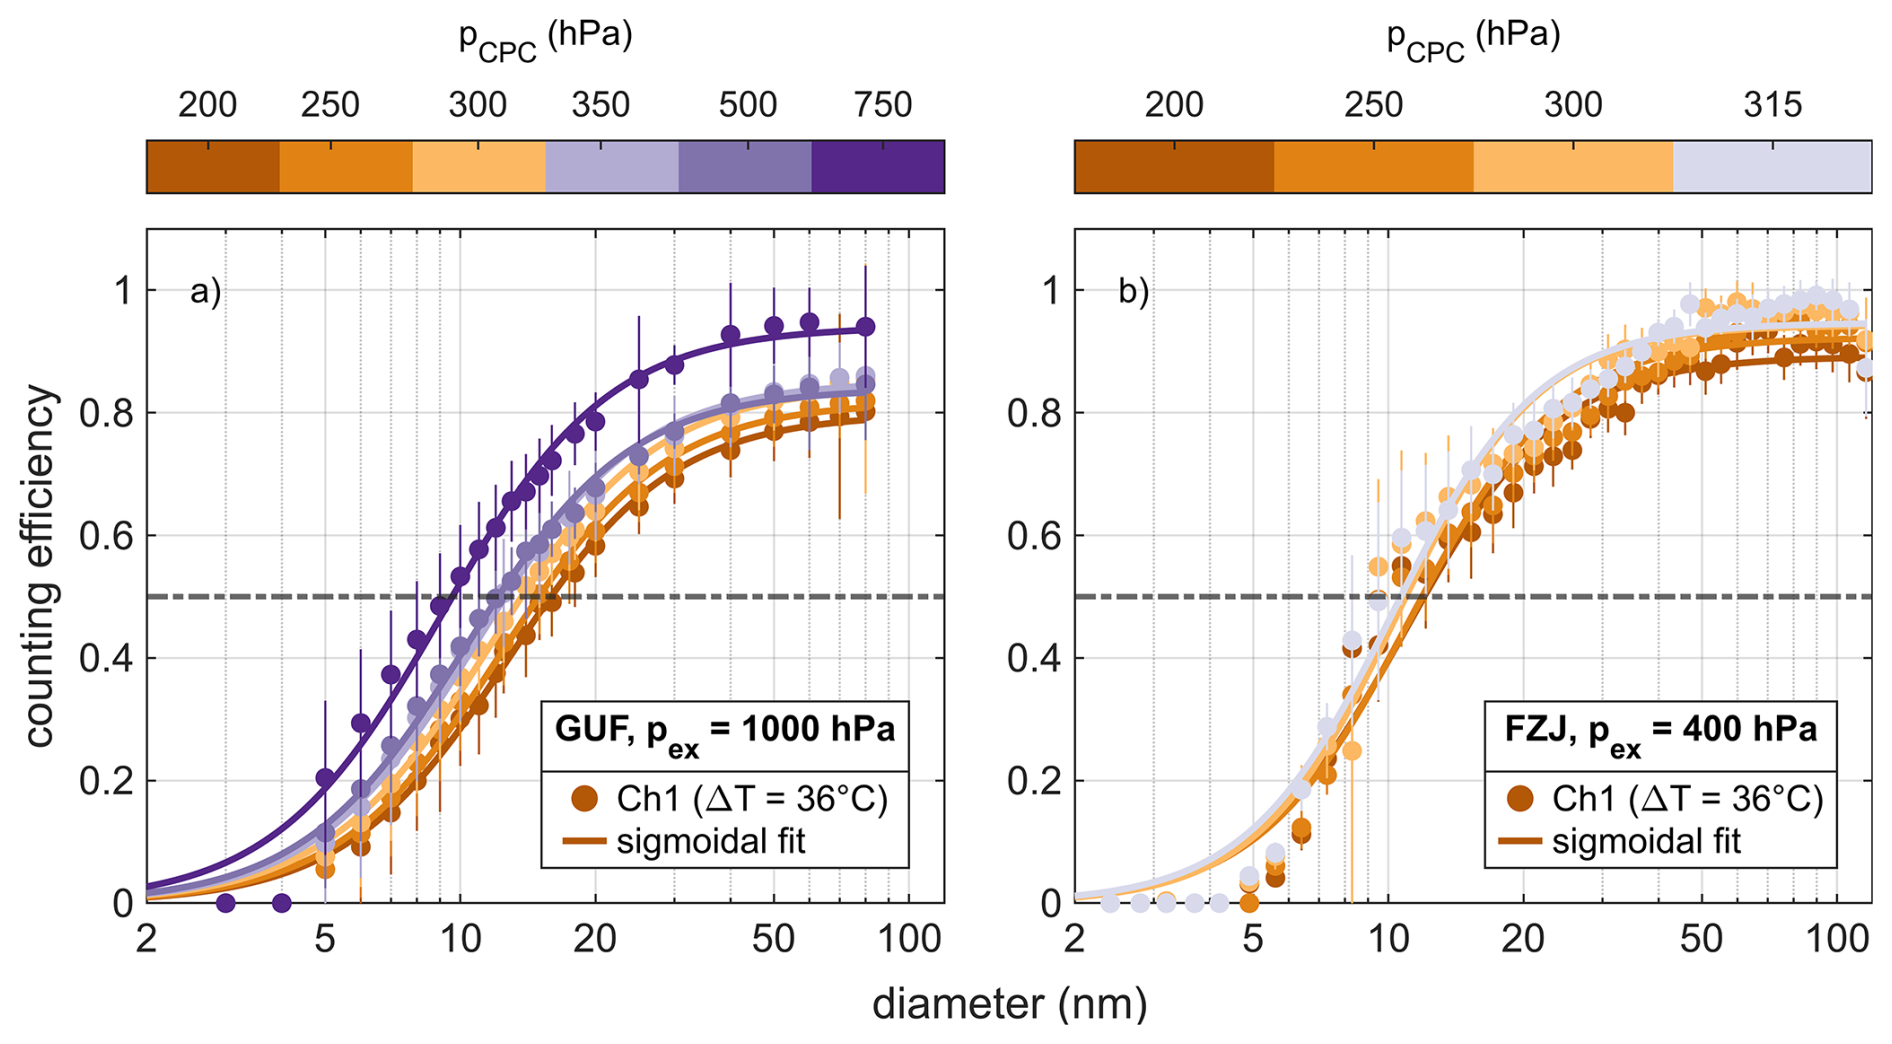
Figure E1Counting efficiency for channel 1 of the mc-CPC determined at (a) GUF for different pCPC values and a fixed pexternal value of 1000 hPa and (b) FZJ for different pCPC and a fixed pexternal of 400 mbar.
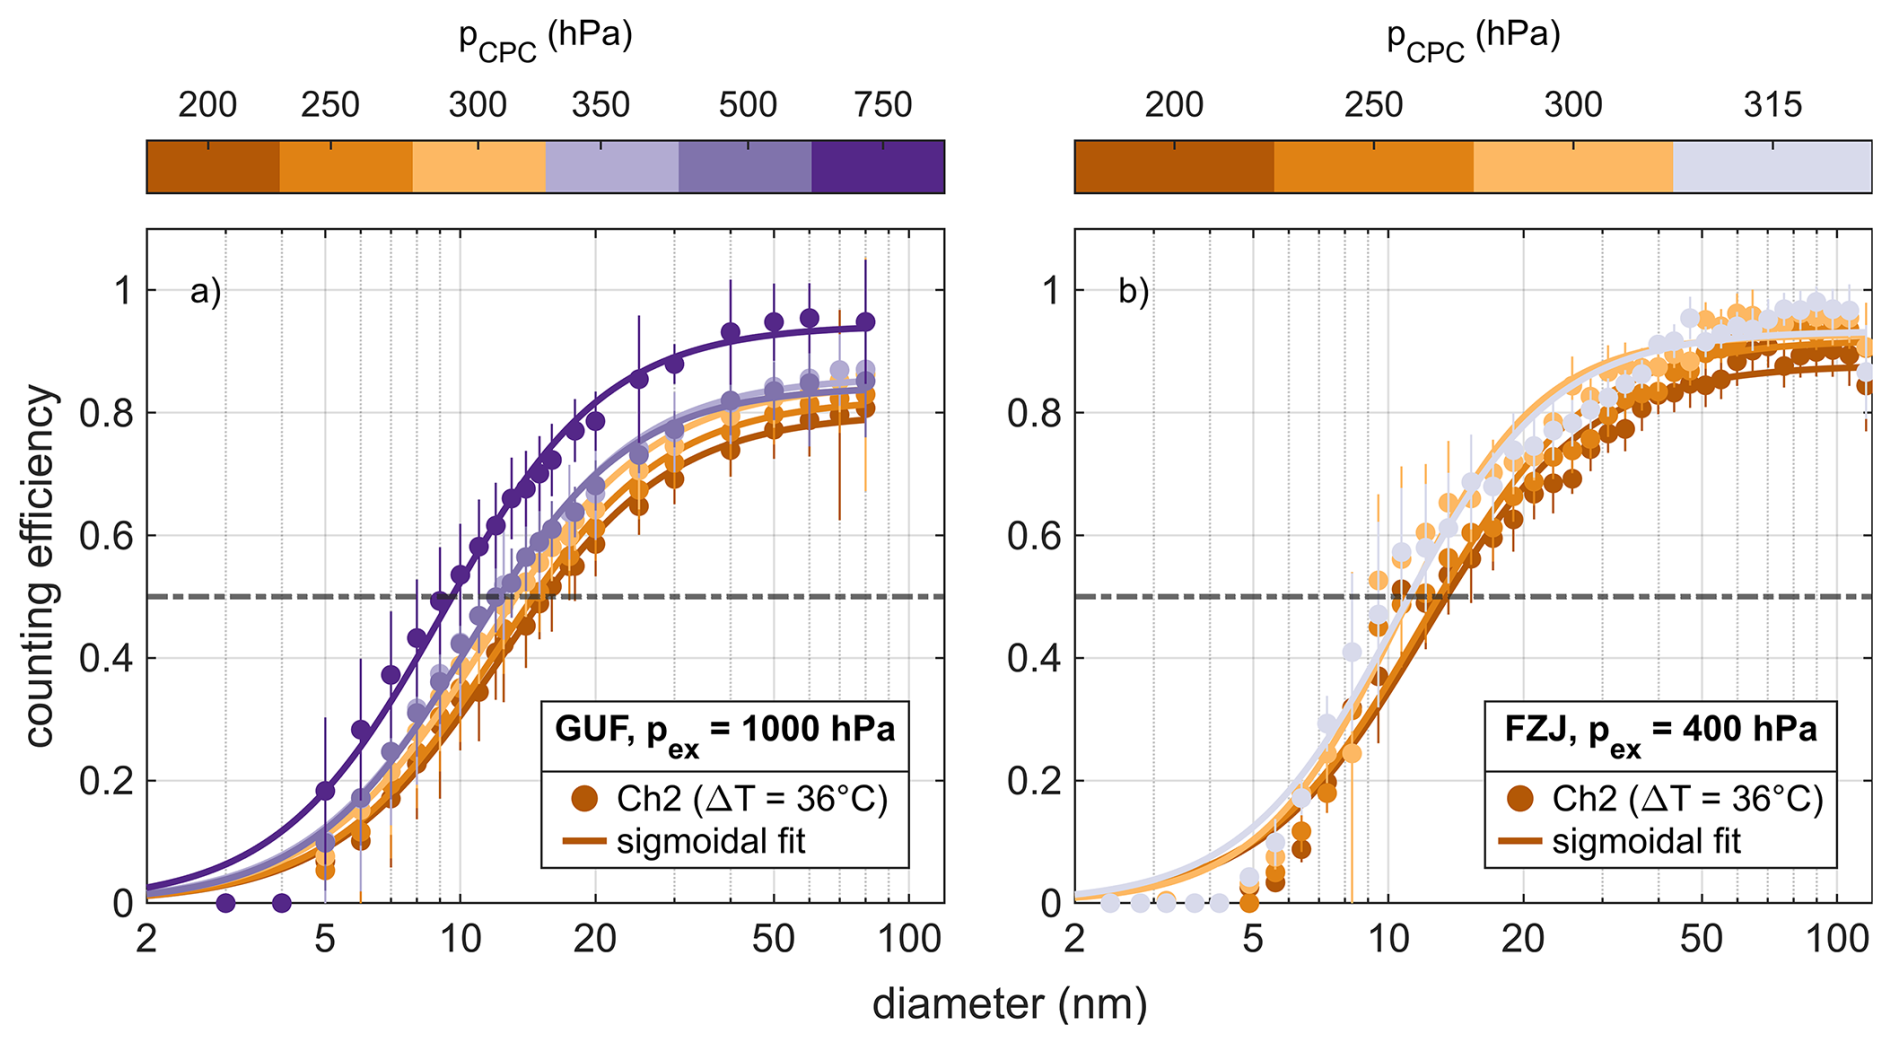
Figure E2Counting efficiency for channel 2 of the mc-CPC determined at (a) GUF for different pCPC values and a fixed pexternal value of 1000 hPa and (b) FZJ for different pCPC and a fixed pexternal of 400 mbar.
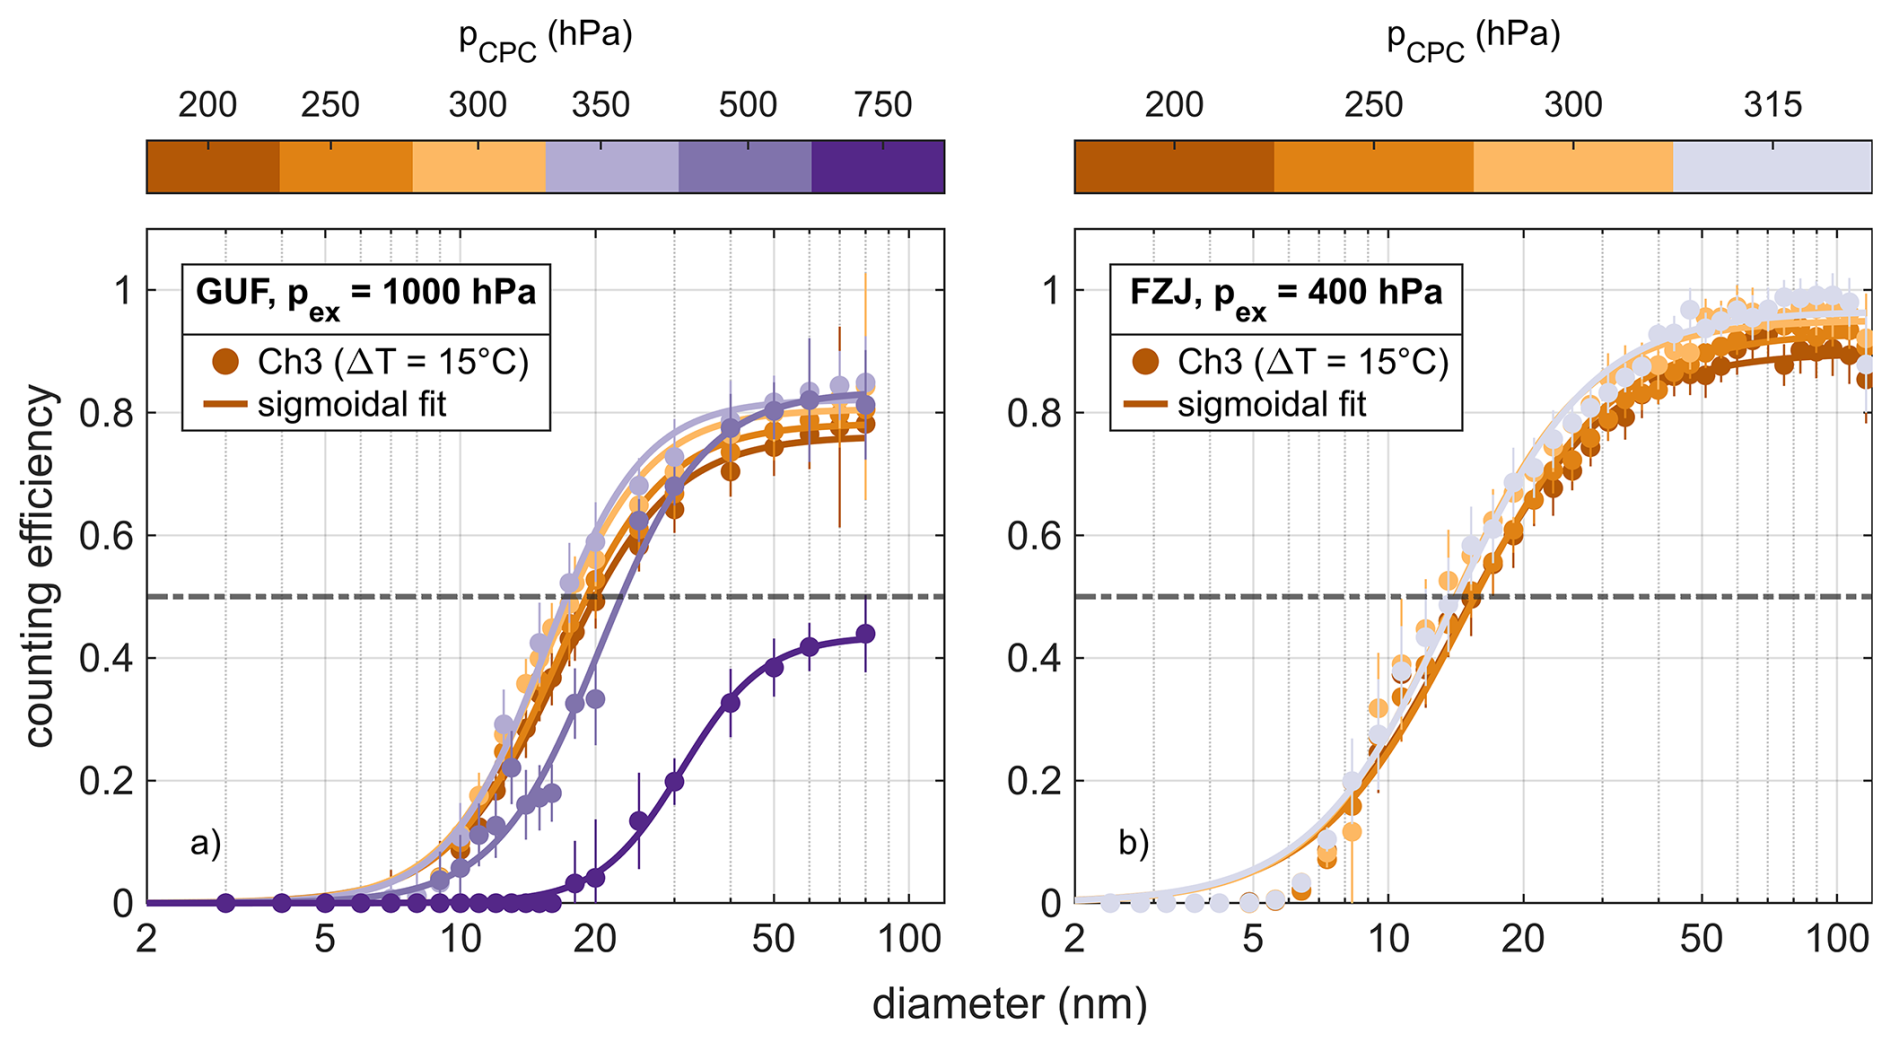
Figure E3Counting efficiency for channel 3 of the mc-CPC determined at (a) GUF for different pCPC values and a fixed pexternal value of 1000 hPa and (b) FZJ for different pCPC and a fixed pexternal of 400 mbar.
Table E1Cutoff diameter and plateau efficiency for all three mc-CPC channels derived at GUF for different internal CPC pressures pCPC and at a constant external pressure pexternal of 1000 hPa.
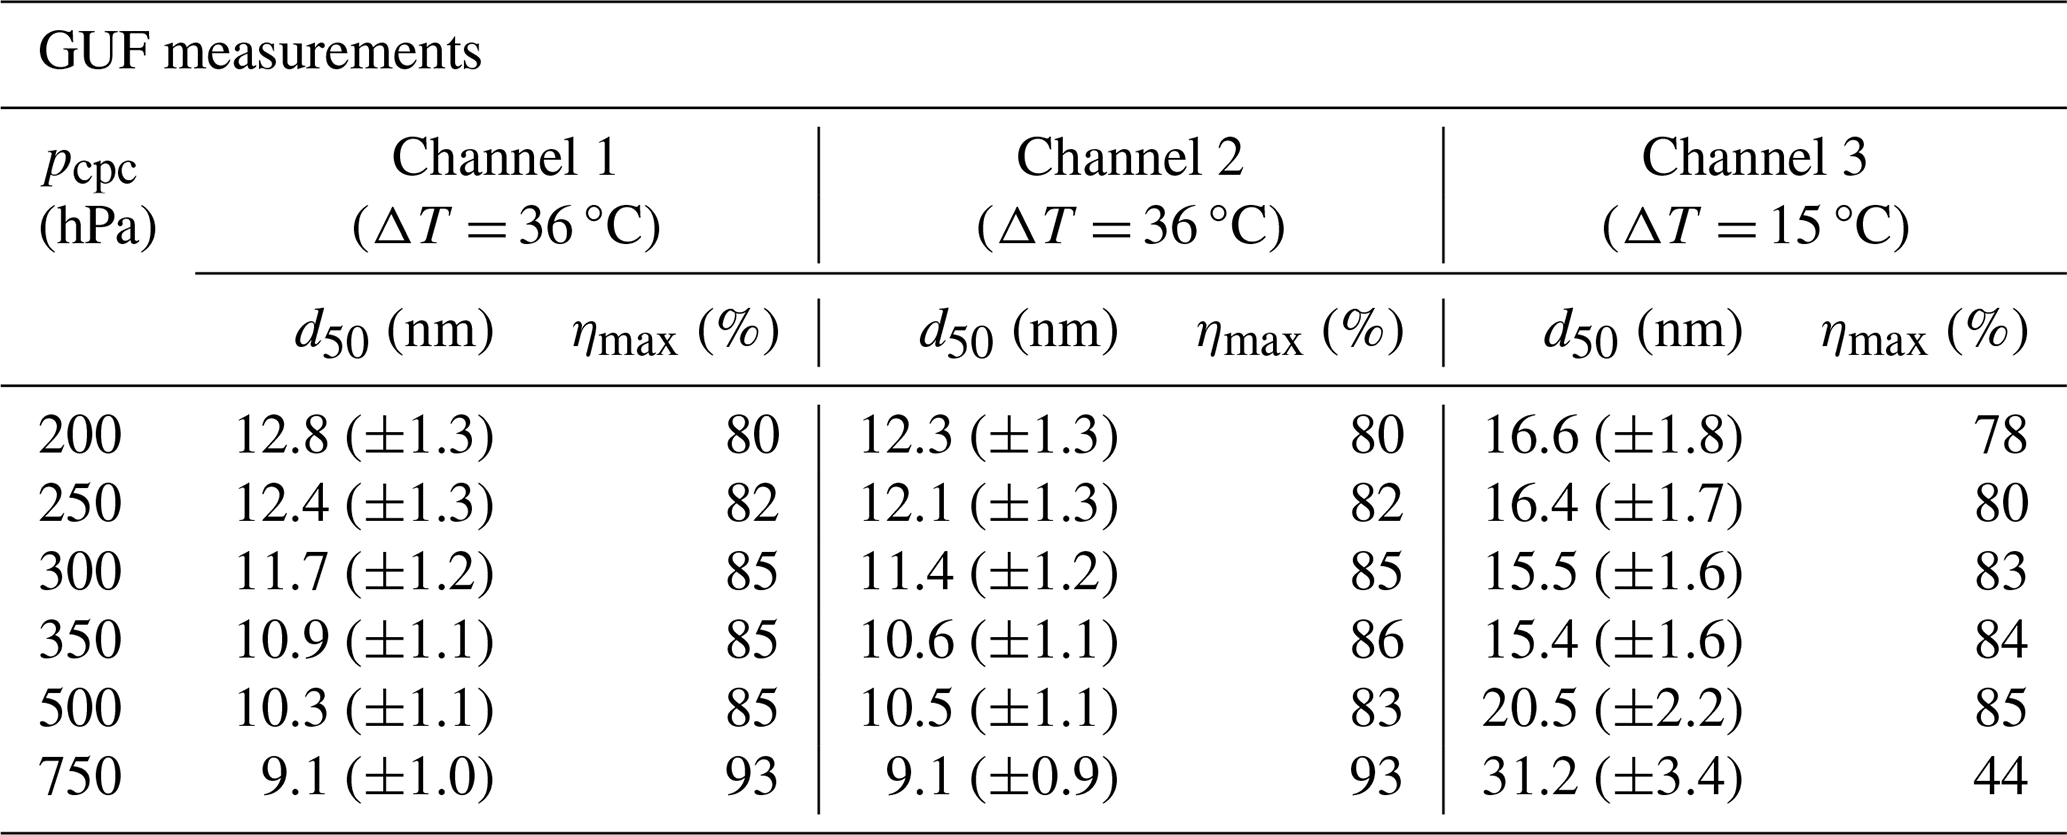
Table E2Cutoff diameter and plateau efficiency for all three mc-CPC channels derived at FZJ for different internal CPC pressures pCPC and at a constant external pressure pexternal of 400 hPa. At pCPC = 250 hPa two measurement cycles are averaged.
The raw data of all three mc-CPC channels measured at a fixed pCPC and a variable pexternal are depicted in Fig. F1. Here we can see that the asymptotic counting efficiency is lowered when the difference between ambient and CPC pressure is high.

Figure F1Raw counting efficiencies of all three mc-CPC channels (a–c), colored by the external pressures. The internal pressure pCPC is 250 hPa for all panels. The error bars represent the standard deviation. Note that for pexternal = 300 and 400 hPa the depicted data is averaged for two measurememnt cycles.
In Fig. G1 all mc-CPC calibrations and the determined counting efficiency at FZJ are illustrated. The Figure shows that the higher the difference between the pressures inside and outside of the mc-CPC, the lower the counting efficiency.
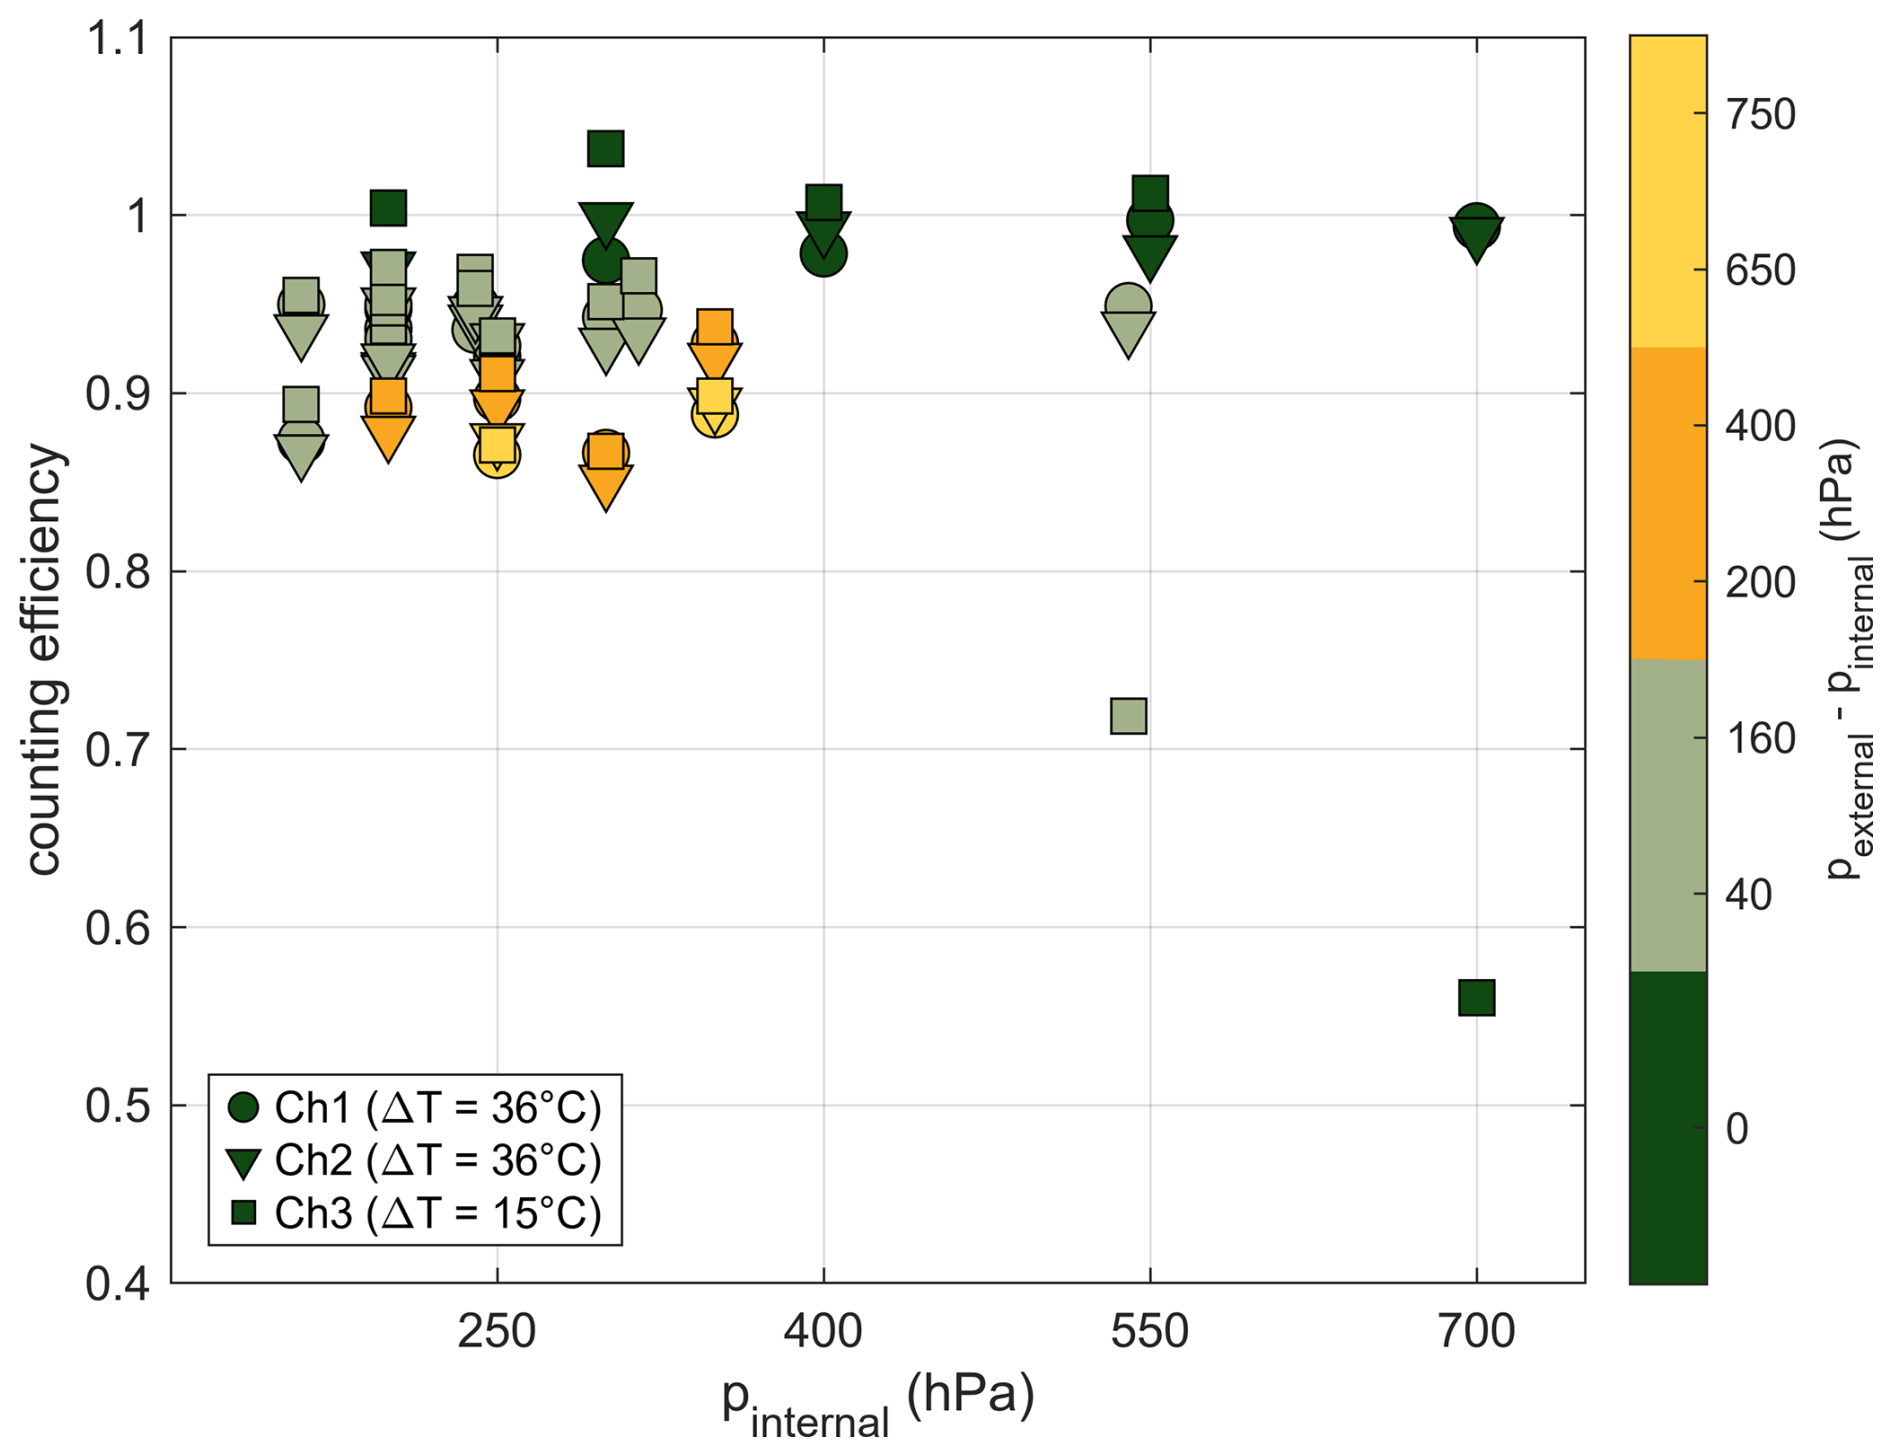
Figure G1Counting efficiency for all three mc-CPC channels at various internal CPC pressures, colored by four distinct Δp.
The data that was used to create the plots in the main text as well as in the Appendix can be found on the Zenodo repository https://doi.org/10.5281/zenodo.18315404 (Richter, 2026).
SR wrote the paper, did the data analysis and the plots. TK, LM, MH and SR designed and constructed the mc-CPC. JC conceived the project. SR performed the mc-CPC characterization setup and the corresponding measurements at GUF. PW and SK performed the calibration setup at FZJ. PW, SK and SR carried out the measurements at FZJ. LB, MH, JS and JC gave valuable input regarding the characterization in the lab. SR, TK and JS prepared and operated the mc-CPC during the TPEx campaign. All authors commented on the paper.
At least one of the (co-)authors is a member of the editorial board of Atmospheric Measurement Techniques. The peer-review process was guided by an independent editor, and the authors also have no other competing interests to declare.
Publisher's note: Copernicus Publications remains neutral with regard to jurisdictional claims made in the text, published maps, institutional affiliations, or any other geographical representation in this paper. The authors bear the ultimate responsibility for providing appropriate place names. Views expressed in the text are those of the authors and do not necessarily reflect the views of the publisher.
This article is part of the special issue “The tropopause region in a changing atmosphere (TPChange) (ACP/AMT/GMD/WCD inter-journal SI)”. It is not associated with a conference.
We want to thank Peter Hoor, Heiko Bozem and the enviscope team for the TPEx organization. A special thanks to Philipp Joppe, who operated the mc-CPC during the TPEx flight RF04 and all other contributors who participated in the campaign. We also want to thank Ralf Weigel who provided us with a test sample of FC-43. We further want to thank the ICE-3 at FZJ for the cooperation and for using the IAGOS calibration lab.
This research has been supported by the Deutsche Forschungsgemeinschaft (grant no. 428312742).
This open-access publication was funded by Goethe University Frankfurt.
This paper was edited by Charles Brock and reviewed by two anonymous referees.
3M: Safety data sheet: 3M™ Fluorinert™ Electronic Liquid FC-43, https://multimedia.3m.com/mws/media/64889O/fluorinert-electronic-liquid-fc-43.pdf (last access: 11 July 2025), 2019.
Andreae, M. O., Afchine, A., Albrecht, R., Holanda, B. A., Artaxo, P., Barbosa, H. M. J., Borrmann, S., Cecchini, M. A., Costa, A., Dollner, M., Fütterer, D., Järvinen, E., Jurkat, T., Klimach, T., Konemann, T., Knote, C., Krämer, M., Krisna, T., Machado, L. A. T., Mertes, S., Minikin, A., Pöhlker, C., Pöhlker, M. L., Pöschl, U., Rosenfeld, D., Sauer, D., Schlager, H., Schnaiter, M., Schneider, J., Schulz, C., Spanu, A., Sperling, V. B., Voigt, C., Walser, A., Wang, J., Weinzierl, B., Wendisch, M., and Ziereis, H.: Aerosol characteristics and particle production in the upper troposphere over the Amazon Basin, Atmos. Chem. Phys., 18, 921–961, https://doi.org/10.5194/acp-18-921-2018, 2018.
Banse, D. F., Esfeld, K., Hermann, M., Sierau, B., and Wiedensohler, A.: Particle counting efficiency of the TSI CPC 3762 for different operating parameters, J. Aerosol Sci., 32, 157–161, https://doi.org/10.1016/s0021-8502(00)00060-4, 2001.
Baron, P. A. and Willeke, K.: Aerosol measurement: principles, techniques, and applications, 20th edn., Wiley-Interscience, New York, XXIII, 1131 pp., ISBN 0471356360, 2001.
Bauer, P. S., Spät, D., Eisenhut, M., Gattringer, A., and Weinzierl, B.: Pressure-dependent performance of two CEN-specified condensation particle counters, Atmos. Meas. Tech., 16, 4445–4460, https://doi.org/10.5194/amt-16-4445-2023, 2023.
Bozem, H., Joppe, P., Li, Y., Emig, N., Afchine, A., Breuninger, A., Curtius, J., Hofmann, S., Ismayil, S., Kandler, K., Kunkel, D., Kutschka, A., Lachnitt, H.-C., Petzold, A., Richter, S., Röschenthaler, T., Rolf, C., Schneider, L., Schneider, J., Vogel, A., and Hoor, P.: The TropoPause Composition TOwed Sensor Shuttle (TPC-TOSS): a new airborne dual platform approach for atmospheric composition measurements at the tropopause, Atmos. Meas. Tech., 18, 6545–6568, https://doi.org/10.5194/amt-18-6545-2025, 2025.
Breuninger, A., Joppe, P., Wilsch, J., Schwenk, C., Bozem, H., Emig, N., Merkel, L., Rossberg, R., Keber, T., Kutschka, A., Waleska, P., Hofmann, S., Richter, S., Ungeheuer, F., Dörholt, K., Hoffmann, T., Miltenberger, A., Schneider, J., Hoor, P., and Vogel, A. L.: Organic aerosols mixing across the tropopause and its implication for anthropogenic pollution of the UTLS, Atmos. Chem. Phys., 25, 16533–16551, https://doi.org/10.5194/acp-25-16533-2025, 2025.
Bundke, U., Berg, M., Houben, N., Ibrahim, A., Fiebig, M., Tettich, F., Klaus, C., Franke, H., and Petzold, A.: The IAGOS-CORE aerosol package: instrument design, operation and performance for continuous measurement aboard in-service aircraft, Tellus B: Chemical and Physical Meteorology, 67, 28339, https://doi.org/10.3402/tellusb.v67.28339, 2015.
Cheng, Y.-S.: Mechanisms of Pharmaceutical Aerosol Deposition in the Respiratory Tract, AAPS PharmSciTech, 15, 630–640, https://doi.org/10.1208/s12249-014-0092-0, 2014.
Curtius, J., Heinritzi, M., Beck, L. J., Pöhlker, M. L., Tripathi, N., Krumm, B. E., Holzbeck, P., Nussbaumer, C. M., Hernández Pardo, L., Klimach, T., Barmpounis, K., Andersen, S. T., Bardakov, R., Bohn, B., Cecchini, M. A., Chaboureau, J.-P., Dauhut, T., Dienhart, D., Dörich, R., Edtbauer, A., Giez, A., Hartmann, A., Holanda, B. A., Joppe, P., Kaiser, K., Keber, T., Klebach, H., Krüger, O. O., Kürten, A., Mallaun, C., Marno, D., Martinez, M., Monteiro, C., Nelson, C., Ort, L., Raj, S. S., Richter, S., Ringsdorf, A., Rocha, F., Simon, M., Sreekumar, S., Tsokankunku, A., Unfer, G. R., Valenti, I. D., Wang, N., Zahn, A., Zauner-Wieczorek, M., Albrecht, R. I., Andreae, M. O., Artaxo, P., Crowley, J. N., Fischer, H., Harder, H., Herdies, D. L., Machado, L. A. T., Pöhlker, C., Pöschl, U., Possner, A., Pozzer, A., Schneider, J., Williams, J., and Lelieveld, J.: Isoprene nitrates drive new particle formation in Amazon's upper troposphere, Nature, 636, 124–130, https://doi.org/10.1038/s41586-024-08192-4, 2024.
Donahue, N. M., Epstein, S. A., Pandis, S. N., and Robinson, A. L.: A two-dimensional volatility basis set: 1. organic-aerosol mixing thermodynamics, Atmos. Chem. Phys., 11, 3303–3318, https://doi.org/10.5194/acp-11-3303-2011, 2011.
Dreiling, V. and Jaenicke, R.: Aircraft measurement with condensation nuclei counter and optical particle counter, Journal of Aerosol Science, 19, 1045–1050, https://doi.org/10.1016/0021-8502(88)90097-3, 1988.
Gallar, C., Brock, C. A., Jimenez, J. L., and Simons, C.: A Variable Supersaturation Condensation Particle Sizer, Aerosol Science and Technology, 40, 431–436, https://doi.org/10.1080/02786820600643339, 2006.
Gordon, H., Kirkby, J., Baltensperger, U., Bianchi, F., Breitenlechner, M., Curtius, J., Dias, A., Dommen, J., Donahue, N. M., Dunne, E. M., Duplissy, J., Ehrhart, S., Flagan, R. C., Frege, C., Fuchs, C., Hansel, A., Hoyle, C. R., Kulmala, M., Kürten, A., Lehtipalo, K., Makhmutov, V., Molteni, U., Rissanen, M. P., Stozkhov, Y., Tröstl, J., Tsagkogeorgas, G., Wagner, R., Williamson, C., Wimmer, D., Winkler, P. M., Yan, C., and Carslaw, K. S.: Causes and importance of new particle formation in the present-day and preindustrial atmospheres, J. Geophys. Res., 122, 8739–8760, https://doi.org/10.1002/2017JD026844, 2017.
Hermann, M. and Wiedensohler, A.: Counting effciency of condensation particle counters at low-pressures with illustrative data from the upper troposphere, 975–991, Journal of Aerosol Science, https://doi.org/10.1016/S0021-8502(01)00037-4, 2001.
Hermann, M., Heintzenberg, J., Wiedensohler, A., Zahn, A., Heinrich, G., and Brenninkmeijer, C. A. M.: Meridional distributions of aerosol particle number concentrations in the upper troposphere and lower stratosphere obtained by Civil Aircraft for Regular Investigation of the Atmosphere Based on an Instrument Container (CARIBIC) flights, J. Geophys. Res., 108, https://doi.org/10.1029/2001JD001077, 2003.
Hermann, M., Adler, S., Caldow, R., Stratmann, F., and Wiedensohler, A.: Pressure-dependent efficiency of a condensation particle counter operated with FC-43 as working fluid, Journal of Aerosol Science, 36, 1322–1337, https://doi.org/10.1016/j.jaerosci.2005.03.002, 2005.
Hinds, W. C.: Aerosol Technology: Properties, Behavior, and Measurement of Airborne Particles, 2nd edn., Wiley-Interscience, s.l., 483 pp., ISBN 0471194107, 1999.
Hong, A. C., Young, C. J., Hurley, M. D., Wallington, T. J., and Mabury, S. A.: Perfluorotributylamine: A novel long-lived greenhouse gas, Geophys. Res. Lett., 40, 6010–6015, https://doi.org/10.1002/2013GL058010, 2013.
Joppe, P., Schneider, J., Wilsch, J., Bozem, H., Breuninger, A., Curtius, J., Ebert, M., Emig, N., Hoor, P., Ismayil, S., Kandler, K., Kunkel, D., Kurth, I., Lachnitt, H.-C., Li, Y., Miltenberger, A., Richter, S., Rolf, C., Schneider, L., Schwenk, C., Spelten, N., Vogel, A. L., Cheng, Y., and Borrmann, S.: Transport of Biomass Burning Aerosol into the Extratropical Tropopause Region over Europe via Warm Conveyor Belt Uplift, Atmos. Chem. Phys., 25, 15077–15103, https://doi.org/10.5194/acp-25-15077-2025, 2025.
Khosrawi, F. and Konopka, P.: Enhanced particle formation and growth due to mixing processes in the tropopause region, Atmospheric Environment, 37, 903–910, https://doi.org/10.1016/S1352-2310(02)00976-7, 2003.
Kirchhoff, S., Weber, P., Bischof, O. F., Steiner, G., Kunath, C., Keck, L., Fruhmann, V. M., Krasa, H., Bergmann, A., Petzold, A., and Bundke, U.: Evaluation of DMSO as Working Fluid in Condensation Particle Counters, Atmos. Meas. Tech., submitted, 2026.
Kupc, A., Williamson, C. J., Hodshire, A. L., Kazil, J., Ray, E., Bui, T. P., Dollner, M., Froyd, K. D., McKain, K., Rollins, A., Schill, G. P., Thames, A., Weinzierl, B. B., Pierce, J. R., and Brock, C. A.: The potential role of organics in new particle formation and initial growth in the remote tropical upper troposphere, Atmos. Chem. Phys., 20, 15037–15060, https://doi.org/10.5194/acp-20-15037-2020, 2020.
Lee, H. and Romero, J.: Climate Change 2023: Synthesis Report: Contribution of Working Groups I, II and III to the Sixth Assessment Report of the Intergovernmental Panel on Climate Change, IPCC, Geneva, Switzerland, 35–115, https://doi.org/10.59327/IPCC/AR6-9789291691647, 2023.
Li, G., Wang, Y., and Zhang, R.: Implementation of a two-moment bulk microphysics scheme to the WRF model to investigate aerosol-cloud interaction, J. Geophys. Res., 113, https://doi.org/10.1029/2007JD009361, 2008.
McMurry, P. H.: The History of Condensation Nucleus Counters, Aerosol Science and Technology, 33, 297–322, https://doi.org/10.1080/02786820050121512, 2000.
Merikanto, J., Spracklen, D. V., Mann, G. W., Pickering, S. J., and Carslaw, K. S.: Impact of nucleation on global CCN, Atmos. Chem. Phys., 9, 8601–8616, https://doi.org/10.5194/acp-9-8601-2009, 2009.
Minikin, A., Petzold, A., Ström, J., Krejci, R., Seifert, M., van Velthoven, P., Schlager, H., and Schumann, U.: Aircraft observations of the upper tropospheric fine particle aerosol in the Northern and Southern Hemispheres at midlatitudes, Geophysical Research Letters, 30, https://doi.org/10.1029/2002GL016458, 2003.
Peng, J., Hu, M., Guo, S., Du, Z., Zheng, J., Shang, D., Levy Zamora, M., Zeng, L., Shao, M., Wu, Y.-S., Zheng, J., Wang, Y., Glen, C. R., Collins, D. R., Molina, M. J., and Zhang, R.: Markedly enhanced absorption and direct radiative forcing of black carbon under polluted urban environments, Proceedings of the National Academy of Sciences of the United States of America, 113, 4266–4271, https://doi.org/10.1073/pnas.1602310113, 2016.
Richter, S.: Characterization and operation of a multi-channel Condensation Particle Counter (mc-CPC) for aircraft-based measurements, Zenodo [data set], https://doi.org/10.5281/zenodo.18315404, 2026.
Rose, C., Sellegri, K., Freney, E., Dupuy, R., Colomb, A., Pichon, J.-M., Ribeiro, M., Bourianne, T., Burnet, F., and Schwarzenboeck, A.: Airborne measurements of new particle formation in the free troposphere above the Mediterranean Sea during the HYMEX campaign, Atmos. Chem. Phys., 15, 10203–10218, https://doi.org/10.5194/acp-15-10203-2015, 2015.
Carl Roth GmbH + Co. KG: Safety data sheet – 1-Butanol ≥ 99.5 %, for synthesis, Article No. 7724, Version 1.0, Karlsruhe, Germany, http://www.carlroth.de (last access: 1 July 2025), 2024.
Schraufnagel, D. E.: The health effects of ultrafine particles, Experimental & Molecular Medicine, 52, 311–317, https://doi.org/10.1038/s12276-020-0403-3, 2020.
Schröder, F. and Ström, J.: Aircraft measurements of sub micrometer aerosol particles (> 7 nm) in the midlatitude free troposphere and tropopause region, Atmospheric Research, 333–356, https://doi.org/10.1016/S0169-8095(96)00034-8, 1996.
Seinfeld, J. H. and Pandis, S. N.: Atmospheric Chemistry and Physics: From Air Pollution to Climate Change, New York Academy of Sciences Series, John Wiley & Sons Incorporated, Newark, 1149 pp., ISBN 9781118947401, 2016.
Sem, G. J.: Design and performance characteristics of three continuous-flow condensation particle counters: a summary, Atmospheric Research, 62, 267–294, https://doi.org/10.1016/S0169-8095(02)00014-5, 2002.
Sinclair, D. and Hoopes, G. S.: A continuous flow condensation nucleus counter, Journal of Aerosol Science, 6, 1–7, https://doi.org/10.1016/0021-8502(75)90036-1, 1975.
Szopa, S., Adhikary, B., Artaxo, P., Berntsen, T., Collins, W. D., Fuzzi, S., Gallardo, L., Klimont, Z., Zanis, P., Naik, V., Kiendler-Scharr, A., Liao, H., and Unger, N.: Short-lived Climate Forcers, IPCC 2021: Climate Change 2021: The Physical Science Basis. Contribution of Working Group I to the Sixth Assessment Report of the Intergovernmental Panel on Climate Change, edited by: Masson-Delmotte, V., Zhai, P., Connors, S. L., Goldfarb, L., Gomis, M., Huang, M., Waterfield, T., Yelekçi, K., Yu, R., Zhu, B., Pirani, A., Péan, C., Berger, S., Caud, N., Chen, Y., Leitzell, K., Lonnoy, E., Matthews, J., and Maycock, T. K., Cambridge University Press, Cambridge, United Kingdom and New York, NY, USA, 817–922, https://doi.org/10.1017/9781009157896.008, 2021.
Twohy, C. H., Clement, C. F., Gandrud, B. W., Weinheimer, A. J., Campos, T. L., Baumgardner, D., Brune, W. H., Faloona, I., Sachse, G. W., Vay, S. A., and Tan, D.: Deep convection as a source of new particles in the midlatitude upper troposphere, J. Geophys. Res., 107, AAC 6-1–AAC 6-10, https://doi.org/10.1029/2001JD000323, 2002.
von der Weiden, S.-L., Drewnick, F., and Borrmann, S.: Particle Loss Calculator – a new software tool for the assessment of the performance of aerosol inlet systems, Atmos. Meas. Tech., 2, 479–494, https://doi.org/10.5194/amt-2-479-2009, 2009.
Wang, Y., Khalizov, A., Levy, M., and Zhang, R.: New Directions: Light absorbing aerosols and their atmospheric impacts, Atmospheric Environment, 81, 713–715, https://doi.org/10.1016/j.atmosenv.2013.09.034, 2013.
Weber, P., Bischof, O. F., Fischer, B., Berg, M., Schmitt, J., Steiner, G., Keck, L., Petzold, A., and Bundke, U.: A new working fluid for condensation particle counters for use in sensitive working environments, Aerosol Research, 1, 1–12, https://doi.org/10.5194/ar-1-1-2023, 2023a.
Weber, P., Bischof, O. F., Fischer, B., Berg, M., Hering, S., Spielman, S., Lewis, G., Petzold, A., and Bundke, U.: Characterisation of a self-sustained, water-based condensation particle counter for aircraft cruising pressure level operation, Atmos. Meas. Tech., 16, 3505–3514, https://doi.org/10.5194/amt-16-3505-2023, 2023b.
Weigel, R., Hermann, M., Curtius, J., Voigt, C., Walter, S., Böttger, T., Lepukhov, B., Belyaev, G., and Borrmann, S.: Experimental characterization of the COndensation PArticle counting System for high altitude aircraft-borne application, Atmos. Meas. Tech., 2, 243–258, https://doi.org/10.5194/amt-2-243-2009, 2009.
Weigel, R., Borrmann, S., Kazil, J., Minikin, A., Stohl, A., Wilson, J. C., Reeves, J. M., Kunkel, D., de Reus, M., Frey, W., Lovejoy, E. R., Volk, C. M., Viciani, S., D'Amato, F., Schiller, C., Peter, T., Schlager, H., Cairo, F., Law, K. S., Shur, G. N., Belyaev, G. V., and Curtius, J.: In situ observations of new particle formation in the tropical upper troposphere: the role of clouds and the nucleation mechanism, Atmos. Chem. Phys., 11, 9983–10010, https://doi.org/10.5194/acp-11-9983-2011, 2011.
Wiedensohler, A., Wiesner, A., Weinhold, K., Birmili, W., Hermann, M., Merkel, M., Müller, T., Pfeifer, S., Schmidt, A., Tuch, T., Velarde, F., Quincey, P., Seeger, S., and Nowak, A.: Mobility particle size spectrometers: Calibration procedures and measurement uncertainties, Aerosol Science and Technology, 52, 146–164, https://doi.org/10.1080/02786826.2017.1387229, 2018.
Williamson, C., Kupc, A., Wilson, J., Gesler, D. W., Reeves, J. M., Erdesz, F., McLaughlin, R., and Brock, C. A.: Fast time response measurements of particle size distributions in the 3–60 nm size range with the nucleation mode aerosol size spectrometer, Atmos. Meas. Tech., 11, 3491–3509, https://doi.org/10.5194/amt-11-3491-2018, 2018.
Williamson, C. J., Kupc, A., Axisa, D., Bilsback, K. R., Bui, T., Campuzano-Jost, P., Dollner, M., Froyd, K. D., Hodshire, A. L., Jimenez, J. L., Kodros, J. K., Luo, G., Murphy, D. M., Nault, B. A., Ray, E. A., Weinzierl, B., Wilson, J. C., Yu, F., Yu, P., Pierce, J. R., and Brock, C. A.: A large source of cloud condensation nuclei from new particle formation in the tropics, Nature, 574, 399–403, https://doi.org/10.1038/s41586-019-1638-9, 2019.
Wlasits, P. J., Stolzenburg, D., Tauber, C., Brilke, S., Schmitt, S. H., Winkler, P. M., and Wimmer, D.: Counting on chemistry: laboratory evaluation of seed-material-dependent detection efficiencies of ultrafine condensation particle counters, Atmos. Meas. Tech., 13, 3787–3798, https://doi.org/10.5194/amt-13-3787-2020, 2020.
Yu, H., Ortega, J., Smith, J. N., Guenther, A. B., Kanawade, V. P., You, Y., Liu, Y., Hosman, K., Karl, T., Seco, R., Geron, C., Pallardy, S. G., Gu, L., Mikkilä, J., and Lee, S. H.: New particle formation and growth in an isoprene-dominated Ozark Forest: From sub-5 nm to CCN-active sizes., Aerosol Science and Technology, 12, 1285–1298, https://doi.org/10.1080/02786826.2014.984801, 2014.
Zhang, J., Chen, Z., Lu, Y., Gui, H., Liu, J., Wang, J., Yu, T., and Cheng, Y.: Observations of New Particle Formation, Subsequent Growth and Shrinkage during Summertime in Beijing, Aerosol Air Qual. Res., 16, 1591–1602, https://doi.org/10.4209/aaqr.2015.07.0480, 2016.
Zhang, J., Gong, X., Crosbie, E., Diskin, G., Froyd, K., Hall, S., Kupc, A., Moore, R., Peischl, J., Rollins, A., Schwarz, J., Shook, M., Thompson, C., Ullmann, K., Williamson, C., Wisthaler, A., Xu, L., Ziemba, L., Brock, C. A., and Wang, J.: Stratospheric air intrusions promote global-scale new particle formation, Science, 385, 210–216, https://doi.org/10.1126/science.adn2961, 2024.
- Abstract
- Introduction
- Methods
- CPC calibration
- Results and discussion
- First results of TPEx
- Conclusion
- Appendix A: Antoine equation
- Appendix B: Dimensions of the Learjet aerosol inlet and the mc-CPC inlet
- Appendix C: Flow correction and uncertainties
- Appendix D: Cutoff determination
- Appendix E: Cutoffs during GUF and FZJ measurements
- Appendix F: Counting efficiencies at different ambient pressures
- Appendix G: Counting efficiency for FZJ
- Data availability
- Author contributions
- Competing interests
- Disclaimer
- Special issue statement
- Acknowledgements
- Financial support
- Review statement
- References