the Creative Commons Attribution 4.0 License.
the Creative Commons Attribution 4.0 License.
 | 20 Feb 2026
3D transport characteristics of ozone pollution affected by tropical cyclones over the Greater Bay Area, China: insights from a radar wind profiler network, surface observations, and model simulations
Yuanjian Yang
Chenjie Qian
Minxuan Zhang
Chenchao Zhan
Zhenxin Liu
Pak Wai Chan
Xueyan Bi
Simone Lolli
Tropical cyclones (TC) exert a profound influence on the dynamics of ground-level ozone (O3) pollution in the Greater Bay Area (GBA) of China's Guangdong-Hong Kong-Macao. Although TC-related O3 transport processes are well recognized, their three-dimensional characteristics are still inadequately characterized. This study provides the first comprehensive observational analysis of O3 pollution transport mechanisms in the GBA under the influence of TC, integrating high-temporal-resolution wind profile measurements with hourly meteorological and air quality data and model simulations. The findings indicate that TC activity accounts for 39.9 % of O3 pollution episodes in the region, with pollutants advection from northern mainland areas to coastal cities. When TCs are located at a distance of approximately 1800–2000 km, horizontal transport mechanisms dominate (about 54.26 %), facilitating the conveyance of inland ozone to coastal regions. As the proximity of the TC decreases to within 1000–1700 km, the descending air currents intensify, driving ozone from coastal areas into the boundary layer and resulting in reduced O3 concentrations inland while they increase along the coast. In particular, when TCs approach Taiwan (less than 800 km, NE), increased vertical wind shear occurs about 34.25 % than before, with the contribution of vertical mixing also sharply rising by over 34.15 %. This is especially evident over coastal zones, where it facilitates the injection of free-atmosphere ozone into the boundary layer. This mechanism prolongs surface O3 pollution episodes. Our findings offer critical insights for O3 pollution mitigation strategies in the GBA and are of relevance for other globally significant bay regions susceptible to TC impacts, including Hangzhou Bay (China), Tokyo Bay (Japan), and the Bay of Bengal (India).
- Article
(14285 KB) - Full-text XML
- BibTeX
- EndNote


Tropical cyclones (TC) are among the most destructive weather systems. However, as they approach, the weather is generally characterized by strong solar radiation, high temperature, and light wind, which is favorable for photochemical production and accumulation of ozone (O3) (Parker et al., 2013), which easily causes tropical cyclone-related ozone pollution (TC-O3) events (Luo et al., 2018; Yim et al., 2019; Huang et al., 2021). The compound TC-O3 events have significant climate and environmental impacts, such as worsening air quality and contributing to crop yield reduction (Mills et al., 2018), increasing environmental and health risks, particularly respiratory diseases associated with exposure to ozone (Wang et al., 2020) and affecting socioeconomic activities (Feng et al., 2019). Therefore, it is urgent to clarify the causes of TC-O3 events to respond appropriately. The Guangdong-Hong Kong-Macao Greater Bay Area (GBA), a region in southern China that covers a total area of 56 000 km2 with a population of more than 70 million, is one of the most economically active zones in the world. In summer and fall, the GBA is susceptible to TCs and has a high O3 concentration (Li et al., 2019; Liu and Wang, 2020), making it an ideal place to study the TC-O3 events.
The peripheral circulation of TCs facilitates the generation, accumulation, and transport of O3 in both vertical and horizontal directions. Due to the distinctive characteristics of the wind field, the three-dimensional transport of pollutants becomes increasingly complex and dynamic with varying times. Vertically, the downward flows associated with the peripheral circulation of TC create a warm and dry environment that promotes the formation of O3 in the presence of sufficient precursors (Deng et al., 2019). Furthermore, adiabatic warming due to downdrafts can form widespread air stagnation, inhibit convection (Lolli et al., 2019) and further exacerbating the accumulation of O3 near the surface (Wei et al., 2016; Zhan et al., 2020; Lin et al., 2024; Shi et al., 2021). Horizontally, strong winds can extend hundreds of kilometers and facilitate long-range transport of O3 and its precursors, such as nitrogen oxides (NOx) and volatile organic compounds (VOC) (Wang et al., 2022; Itahashi, 2023; Xu et al., 2023). Therefore, O3 pollution occurs. TC dynamic changes in wind fields across different regions not only accelerate the air mass exchange between source and downwind areas, but also influence cross-regional air quality, thus expanding and exacerbating the spread of O3 pollution. This interregional transport significantly alters the distribution of O3 concentration in inland areas, escalating local pollution events into regional problems. Furthermore, the influence of peripheral circulation of TCs on the structure of O3 is not a static event. Under such meteorological conditions, the processes of O3 generation, transport, and decomposition are interconnected, promoting persistent and spatially extensive pollution. Previous studies on the impact of TC on increasing O3 concentration were mainly based on numerical simulations. Although three-dimensional observational data from soundings, satellites, and lidars are available, there remains a relative scarcity of integrated high-resolution vertical observations specifically addressing TC-influenced O3 distribution. It is important to note that ozone concentrations in both the troposphere and stratosphere can be influenced during TC-O3 events. Previous studies have shown that tropical cyclone (TC) activity can cause alterations in ozone concentrations within the troposphere (Das et al., 2016; Chen et al., 2021; Li et al., 2021). Additionally, TCs have the potential to transport significant amounts of stratospheric ozone to the surface (Chen et al., 2022), which may exacerbate local O3 pollution. Furthermore, Li et al. (2020) analyzed 18 years of ozone-sounding data and found that TC reduces ozone levels in the stratospheric region over the western Pacific, suggesting that TC can induce variations in ozone concentrations between the troposphere and the tropopause. Hence, enhancing field observations to complement and verify numerical model results is crucial to improving our understanding of the complex mechanisms underlying O3 transport and formation under the influence of TCs.
Due to the limitations of observational instrumentation, obtaining detailed vertical profiles of atmospheric structure is often problematic. Differences in observational methods and algorithms can also lead to discrepancies in acquired vertical atmospheric information (Guo et al., 2016, 2019; Shi et al., 2020). However, within the boundary layer, where O3 pollution occurs predominantly, wind profile measurements offer an advantage in terms of high precision and continuity, which are fundamental to accurately characterizing the three-dimensional transport of O3 (Zhang et al., 2020). Furthermore, the GBA has a relatively dense network of wind profile radars that have been widely applied in air pollution research studies (Jiang et al., 2013; Wu et al., 2015; Liu et al., 2020). By monitoring changes in wind speed, wind direction, and boundary layer height, wind profile radar data provide important empirical support for studying O3 pollution processes under various weather conditions (e.g., TCs, sea-land wind circulation, and wildfires). These data help to improve our understanding of the spatial and temporal distribution characteristics of O3, as well as the transport and accumulation processes under complex wind field conditions.
It should be noted that the location peripheral circulation of TC will constantly change with the movement of TC, producing different effects on the atmospheric environment. For example, Huang et al. (2006) found that when a TC is approximately 700 to 1000 km distant from the GBA, the area is susceptible to the influence of the peripheral circulation of the TC, resulting in serious O3 pollution. Chow et al. (2018) reported that 38.7 % of O3 pollution in Hong Kong occurred when TCs were located close to Taiwan and 58.2 % occurred when TCs were located between Taiwan and Hong Kong. Recently, Zhang et al. (2024) found that heatwave events in the GBA are triggered by three TC-related synoptic patterns, and the transformation of these synoptic patterns as TCs move impacts the formation of heatwave and O3 pollution in the GBA. Therefore, it is crucial to consider the TC dynamic movement when estimating the influence of its peripheral circulation on O3 pollution.
TCs generated over the western Pacific Ocean generally follow three main tracks: westward moving, northwestward moving and northeastward recurving. The TC near Taiwan and close to the GBA is promoting TC-O3 events (Lam et al., 2018; Zhang et al., 2024). This study analyzed O3 pollution in the GBA and TCs from June to October 2015 to 2023 to evaluate the relationship between TCs and O3 pollution. TC Bailu was then selected for an in-depth case study. Based on radar data of the wind profile, air pollutants and meteorological data, this study investigates changes in the structure of the boundary layer under the influence of TC and its impact on O3 pollution. Two key scientific questions are addressed: (1) What are the characteristics of the winds in the boundary layer affected by the peripheral circulation of the TC as the TC moves? (2) How do changes in winds affect the spatial distribution of O3 pollution in the GBA? The following sections are organized as follows: Sect. 2 describes the data and methods. Section 3 presents the main results and discussion, and the conclusions are summarized in Sect. 4.
2.1 The wind profile radar network
Depending on the TC movement track, three wind profile radar stations along the TC's track within the GBA were selected, namely Huadu (HD; 23.4° N, 113.2° E), Guangzhou (GZ; 22.7° N, 113.5° E) and Hong Kong (HK; 22.3° N, 114.2° E). The locations of these three radars are shown in Fig. 1c. Wind profile radars mainly detect the wind field by using the atmospheric turbulence scattering of electromagnetic waves, providing data on horizontal wind direction, horizontal wind speed, vertical wind speed, and atmospheric refractive index structure constant (Cn2) at different heights. These radars have 1 h averaged data (OOBS) and real-time detection data (ROBS), and the vertical resolution is 60 m. The blind zones of the wind profiler radar are 100 m in HD and GZ, while it is 300 m in HK. Furthermore, Cn2 is an important indicator reflecting changes in turbulence intensity, which decreases exponentially with height overall and may have a maximum value or deviate from the normal value at the top of the boundary layer (Angevine et al., 1994; Stull, 2012). This study uses this feature to determine the height of the boundary layer (BLH).
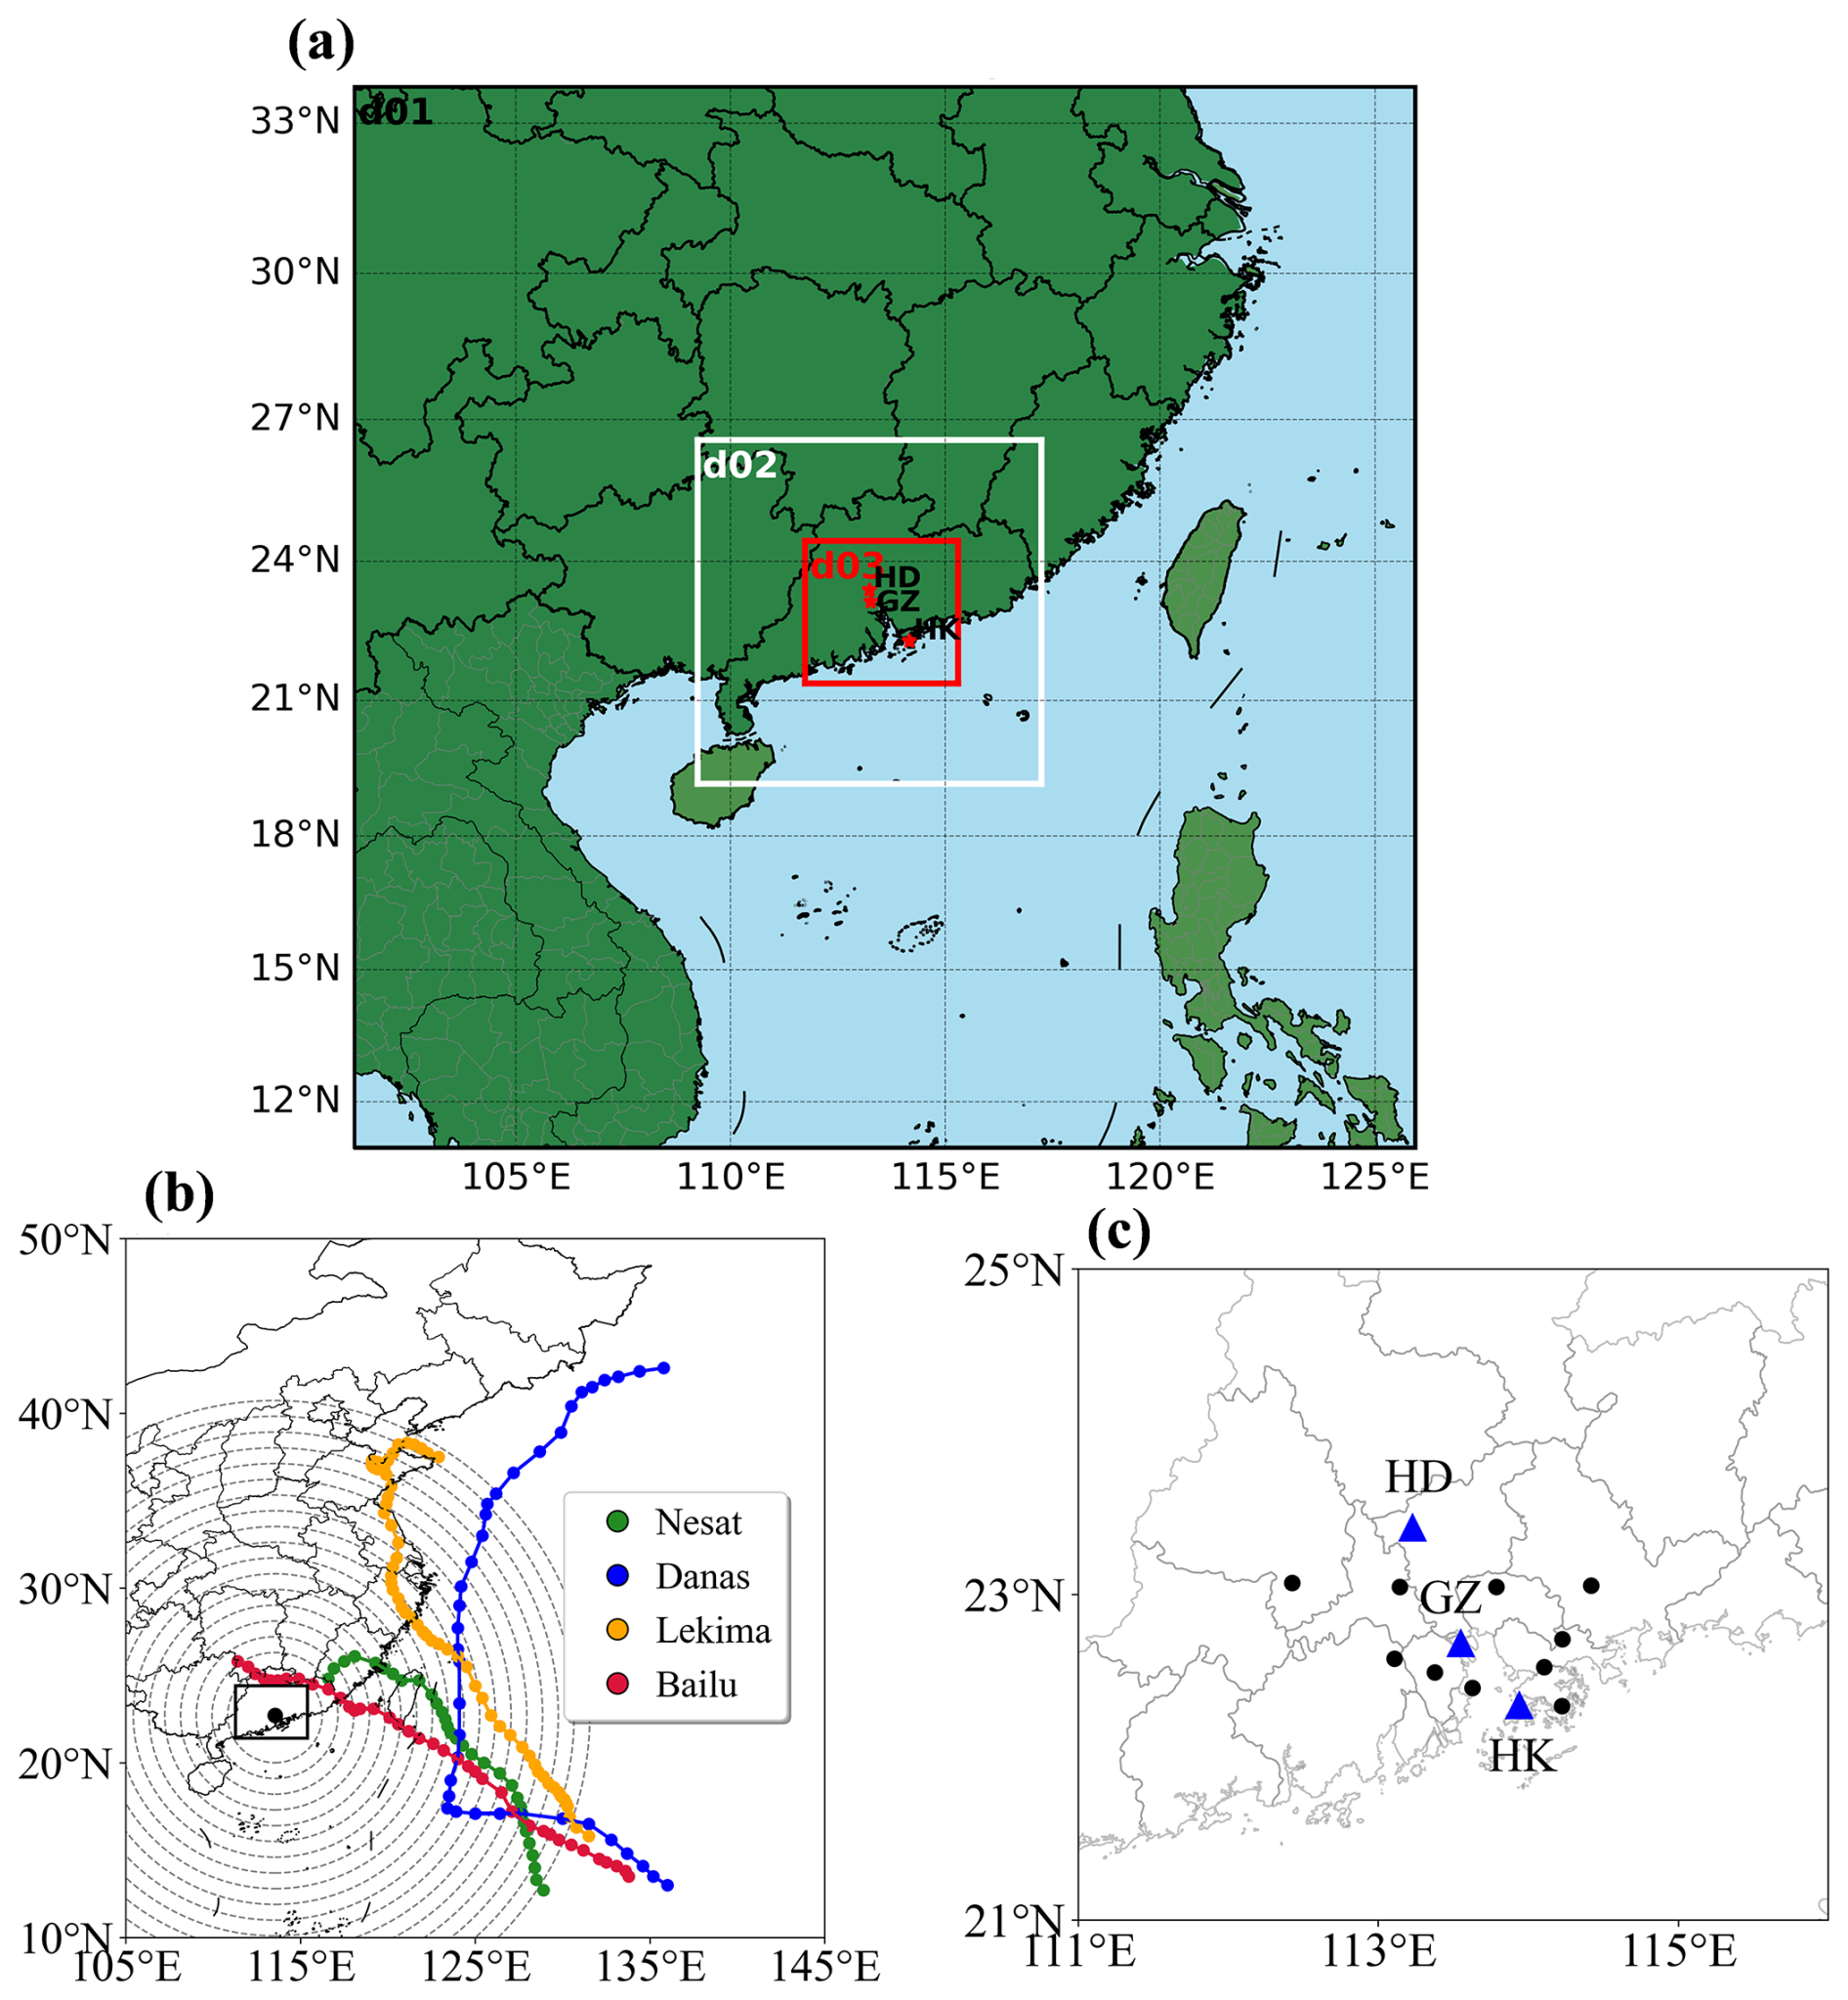
Figure 1(a) the simulation domain is illustrated, with three monitoring sites annotated: Huadu (23.4° N, 113.2° E), Guangzhou (22.7° N, 113.5° E) and Hong Kong (22.3° N, 114.2° E). These locations are strategically positioned to capture spatial variations within the study area. (b) Tropical Cyclone Nesat, Lekima, Danas, Bailu. The gray dashed circles are centered on the wind profiler radar in the middle of the GBA at GZ (black dot; 22.7° N, 113.55° E), representing distances of 300–2000 km from the GBA, with intervals of 100 km between concentric circles. (c) Locations of the HD, GZ, and HK stations in the GBA. The black box indicates the location of the GBA. The black dots indicate the locations of the 10 cities shown in Fig. 3.
2.2 The TC best track dataset
The TC track information in Fig. 1b was obtained from the best TC track dataset from the China Meteorological Administration (https://tcdata.typhoon.org.cn/, last access: 7 March 2025). This dataset includes comprehensive TC tracks in the Northwest Pacific and the South China Sea since 1949, with detailed records of the latitude and longitude of the TC, minimum central pressure, and maximum wind speed near the center at a resolution of 6 h. This dataset provides high precision in coastal and inland areas of the Northwest Pacific region (Ying et al., 2014; Lu et al., 2021). In this study, the TC days were defined as when the TC track enters the region defined by 10–30° N latitude and 100–130° E longitude (Zhang et al., 2024). There are three main types of TC tracks in China: the westward tracks (moving from the east of the Philippines westward, often making landfall in Guangdong and Hainan), the northwest tracks (extending northwest, frequently making landfall in Taiwan, Fujian, and Zhejiang), and the recurving tracks (heading northwest but veering northeast when approaching the eastern coast of China) (Luo et al., 2023).
2.3 Surface observations
The air quality data in the GBA were obtained from the National Urban Air Quality Platform of the National Environmental Monitoring Center (https://air.cnemc.cn:18007/, last access: 15 March 2025), while the data for the HK station were obtained from the Interactive Center of Environmental Protection of the Hong Kong Environmental Protection Department (https://cd.epic.epd.gov.hk/EPICDI/air/station/, last access: 20 March 2025). According to the national standard in China, the maximum daily 8 h average O3 concentration (MDA8) should not exceed 160 µg m−3 (https://www.mee.gov.cn/ywgz/fgbz/bz/bzwb/dqhjbh/dqhjzlbz/201203/t20120302_224165.shtml, last access: 15 January 2025). The criterion for O3 pollution in the GBA is defined as occurring when more than one-third of the selected stations record concentrations exceeding the threshold, drawing on an analogous approach used in previous studies to define regional heatwave events in this area (Zhang et al., 2024).
Furthermore, to investigate the spatiotemporal characteristics of pollutants influenced by the TC Bailu, hourly NO2, O3, and CO concentration data from the HD, GZ, and HK stations were analyzed due to their proximity to wind profile radar and alignment with the TC Bailu. Meteorological conditions, including 2 m temperature, 2 m pressure, 10 m wind direction and speed, relative humidity, and precipitation, were also assessed for their impact on O3 concentrations during the TC Bailu event. Meteorological data for the HD and GZ stations were obtained from the China Meteorological Information Center (http://data.cma.cn/, last access: 6 March 2025), while data for the HK station were gathered from the Hong Kong Observatory (https://www.hko.gov.hk/, last access: 18 March 2025).
2.4 Recirculation index
The recirculation index (RI) is calculated to assess the ventilation capacity of the atmosphere and is applicable in situations where pollutants are transported out and then back due to changes in the direction of the wind. It is the cumulative ratio of the vector distance to the cumulative scalar distance of the wind. The formula for determining RI at various heights is expressed as follows Eq. (1) (Zeng et al., 2022; Wu et al., 2015):
where ks is the starting time, ke is the ending time, T is the average time interval, generally 24 h, uk is the radial wind, vk is the zonal wind. RI ranges from 0 to 1. The lower the RI, the worse the horizontal transport capacity of the wind. When RI is close to 1, it indicates significant horizontal transport. In this study, the RI was calculated using wind profile data and RI = 0.6 was selected as a threshold to assess the contribution of pollutants to the return flow of GBA (Chen et al., 2016).
2.5 HYSPLIT model
The Hybrid Single-Particle Lagrangian Integrated Trajectory (HYSPLIT) model is a widely used atmospheric transport model that can calculate the movement trajectories of individual particles or gases in the atmosphere (Lichiheb et al., 2024). It is often used to analyze the transport and diffusion of materials in the past atmospheric environment (Su et al., 2015). The online version is available at https://www.ready.noaa.gov/HYSPLIT_traj.php (last access: 10 April 2025). This study used the HYSPLIT online backward trajectory module to analyze air mass trajectories at different vertical heights to determine the source of air masses during O3 pollution events. Heights of 0, 500, 1500, and 2000 m represent the ground, the middle of the boundary layer, the top of the boundary layer, and above the boundary layer, respectively.
2.6 Vertical wind shear
Vertical wind shear (VWS) plays an important role in the dispersion of air pollutants, and therefore was calculated here to check its effects on O3 pollution. The formula is calculated as follows Eq. (2) (Zhang et al., 2020):
Where, VWS is the vertical wind shear (units: m s−1), uz1 and uz2 represent the zonal wind at the height of z1 and z2, respectively; and vz1 and vz2 represent the meridional wind at the height of z1 and z2. z1 is the height above the ceiling and z2 is the height below the ceiling.
2.7 NMF
Non-negative Matrix Factorization (NMF) is a matrix decomposition technique that factorizes all elements into non-negative values. It achieves nonlinear dimensionality reduction, yielding results that are more interpretable and physically plausible (Brunet et al., 2004; Lee and Seung, 1999). Furthermore, NMF can identify the contributions of different emission sources to air pollutants without requiring extensive chemical composition data. As NMF is a purely mathematical (statistical) decomposition method, it should be applied in conjunction with approaches that provide a scientifically robust interpretation (Luo et al., 2018). Given a non-negative matrix A of O3 concentrations with dimensions n×m (where n represents the number of observations and m the number of monitoring stations), the NMF factors A into two non-negative matrices as follows:
Matrix W (n×r, where r is the number of NMF factors) is the composition of each factor, and matrix H (r×m) is the contribution of each factor (Malley et al., 2014). The NMF solution is obtained through an iterative process, beginning with randomly initialized values and converging when the Euclidean distance between A and W⋅H is minimized. In this study, the rank r was set to 2, allowing the concentration of O3 to be decomposed into two sources: local formation and regional transport. To improve the stability of the factorization, the NMF algorithm was executed 200 times with different random initializations (Zong et al., 2023).
2.8 WRF-Chem
This study used the WRF-Chem (Weather Research and Forecasting model coupled with Chemistry) model with a three-tiered nested grid configuration. The first nested grid (d01) encompassed the majority of Bai Lu's trajectory from formation to landfall, centered at 113.6° E/22.8° N with a horizontal resolution of 27 km. The second and third grids focused on southern coastal China and the Pearl River Delta region, respectively, with resolutions of 9 and 3 km. Each grid consisted of horizontal dimensions of 103 × 103, 100 × 100, and 133 × 124 cells. The model utilized a Mercator projection with 30 vertical levels that spanned from the surface to 50 hPa.
The initial and boundary meteorological conditions for the simulation are derived from the NCEP FNL data, which provide a resolution of 1° × 1°. Anthropogenic emissions for 2016 at a 0.25° × 0.25° spatial resolution were generated by the Tsinghua University's Multi-resolution Emission Inventory for China (MEIC) (Li et al., 2017; Geng et al., 2024). Biogenic VOCs emissions at a 0.5° × 0.5° spatial resolution are sourced from the Megan emission inventory. The settings of the key parameters are detailed in Table 1 (Li et al., 2015, 2020).
Table 1The main configuration options of the models used in the simulations.

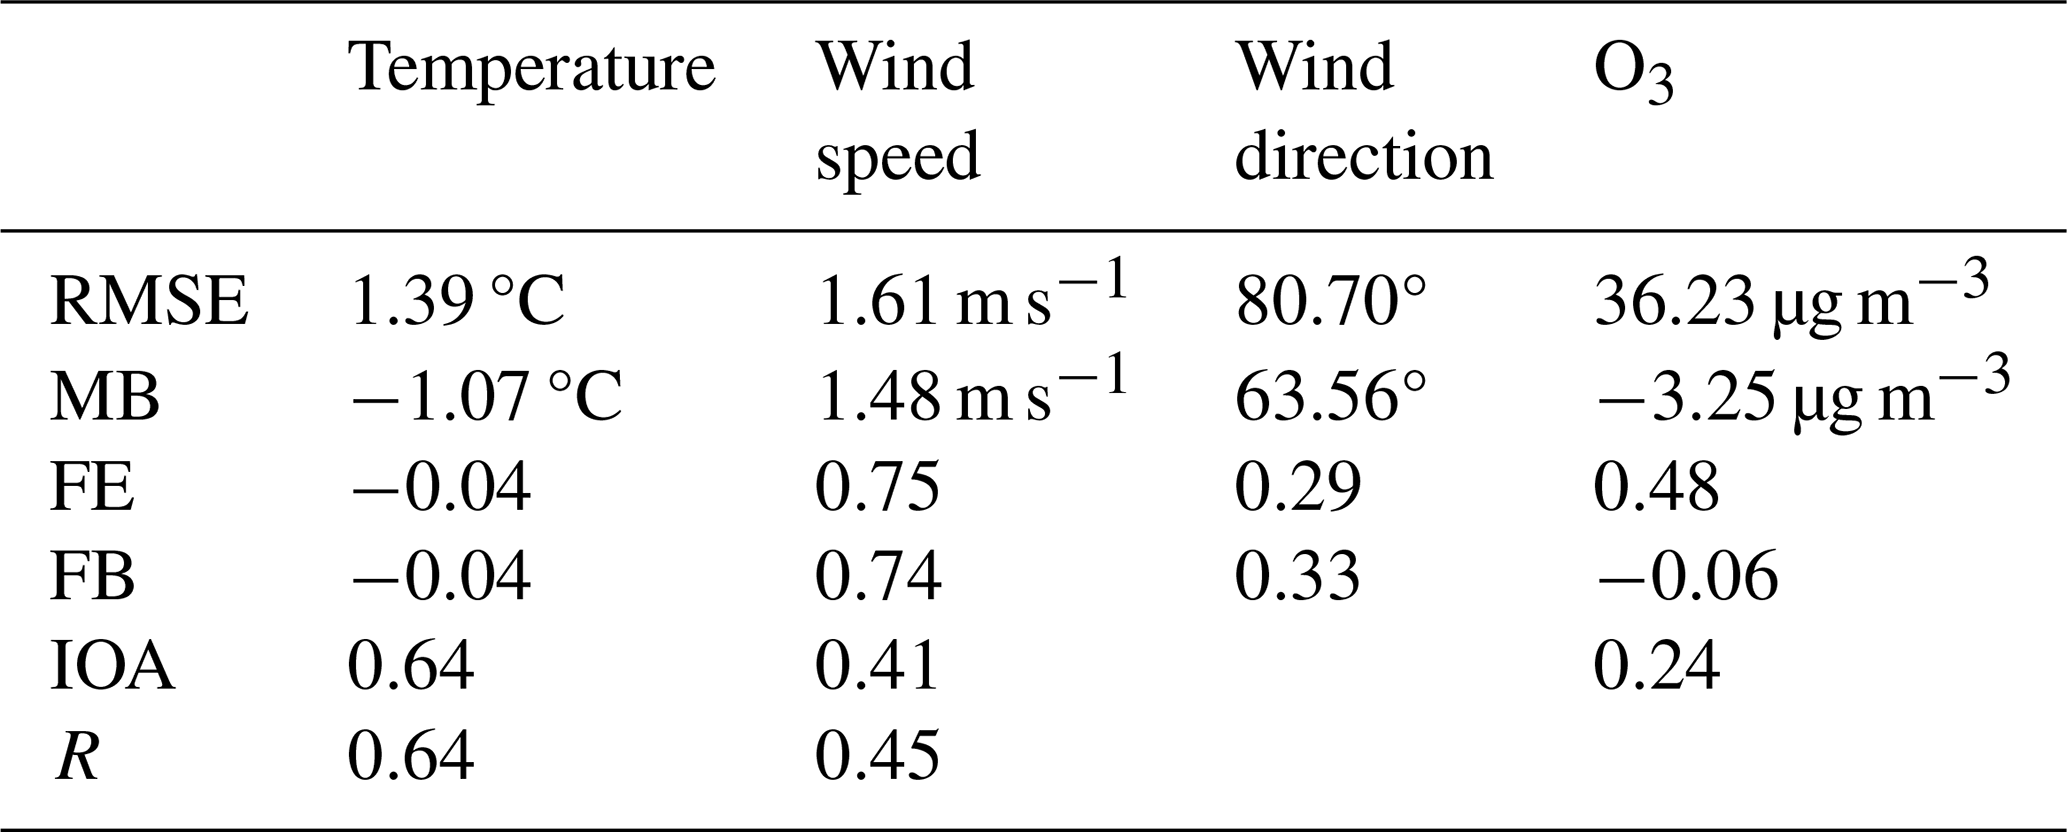
The validation statistics presented in Table 2 highlight the robustness of the model's performance across key variables. This was achieved by comparing the simulated meteorological fields with observational data from domestic surface weather stations, and by evaluating the ozone simulation results against monitoring data from the National Environmental Monitoring Center's National Urban Air Quality Platform and the Hong Kong Environmental Protection Department's Environmental Protection Interactive Center. The temperature is simulated with high precision, showing only a minor underestimation of about 1 °C. Although wind speed demonstrates a slight overestimation and ozone shows an underestimation, overall agreement between simulated and observed values remains strong. The RMSE values for temperature (1.39 °C), wind speed (1.61 m s−1), and ozone (36.23 µg m−3) indicate good precision, and the MB values (−1.07 °C for temperature, +1.48 m s−1 for wind speed, −3.25 µg m−3 for ozone) reveal consistent biases that are within acceptable ranges for modeling purposes. The FE and FB metrics further validate the model's ability to capture the essential features of these variables. With IOA and R values ranging from 0.24 to 0.64, the simulation demonstrates a solid foundation for reliable predictions, confirming its applicability for subsequent analyses.
Table 2Statistical Validation of Meteorological Variables and Ozone in the WRF-Chem Model.
The calculation formula for the parameters is as follows:
Note: F: Simulated value; : Mean of simulated values; O: Observed value; : Mean of observed values; N: Sample size.
3.1 Tropical Cyclones and ozone pollution in the GBA
An O3 pollution day is defined when the maximum daily 8 h average O3 concentration (MDA8) exceeds 160 µg m−3. As shown in Fig. 2a, when the TCs move from the northwest Pacific to Taiwan, there were at least 2 d of O3 pollution at each point in the grid. The three TC tracks that affect the China traverse regions (10–30° N, 100–130° E) contributed to O3 pollution in the GBA. These include the westward tracks, the northwest tracks, and the recurving tracks. Of all TC track periods in Fig. 2a, 408 d were TC days, including 205 d on the westward tracks, 76 d on the northwest tracks and 127 d on the recurving tracks (Fig. 2b). In general, 39.9 % of O3 pollution days in the GBA was associated with TC activity presence, with these tracks contributing 6.5 %, 10.6 %, and 22.8 %, respectively (Fig. 2b). These results were consistent with previous studies that indicated that TCs were among the most favorable weather systems for O3 pollution episodes in the GBA (Jiang et al., 2015; Yang et al., 2019; Lin et al., 2024; Xu et al., 2024).
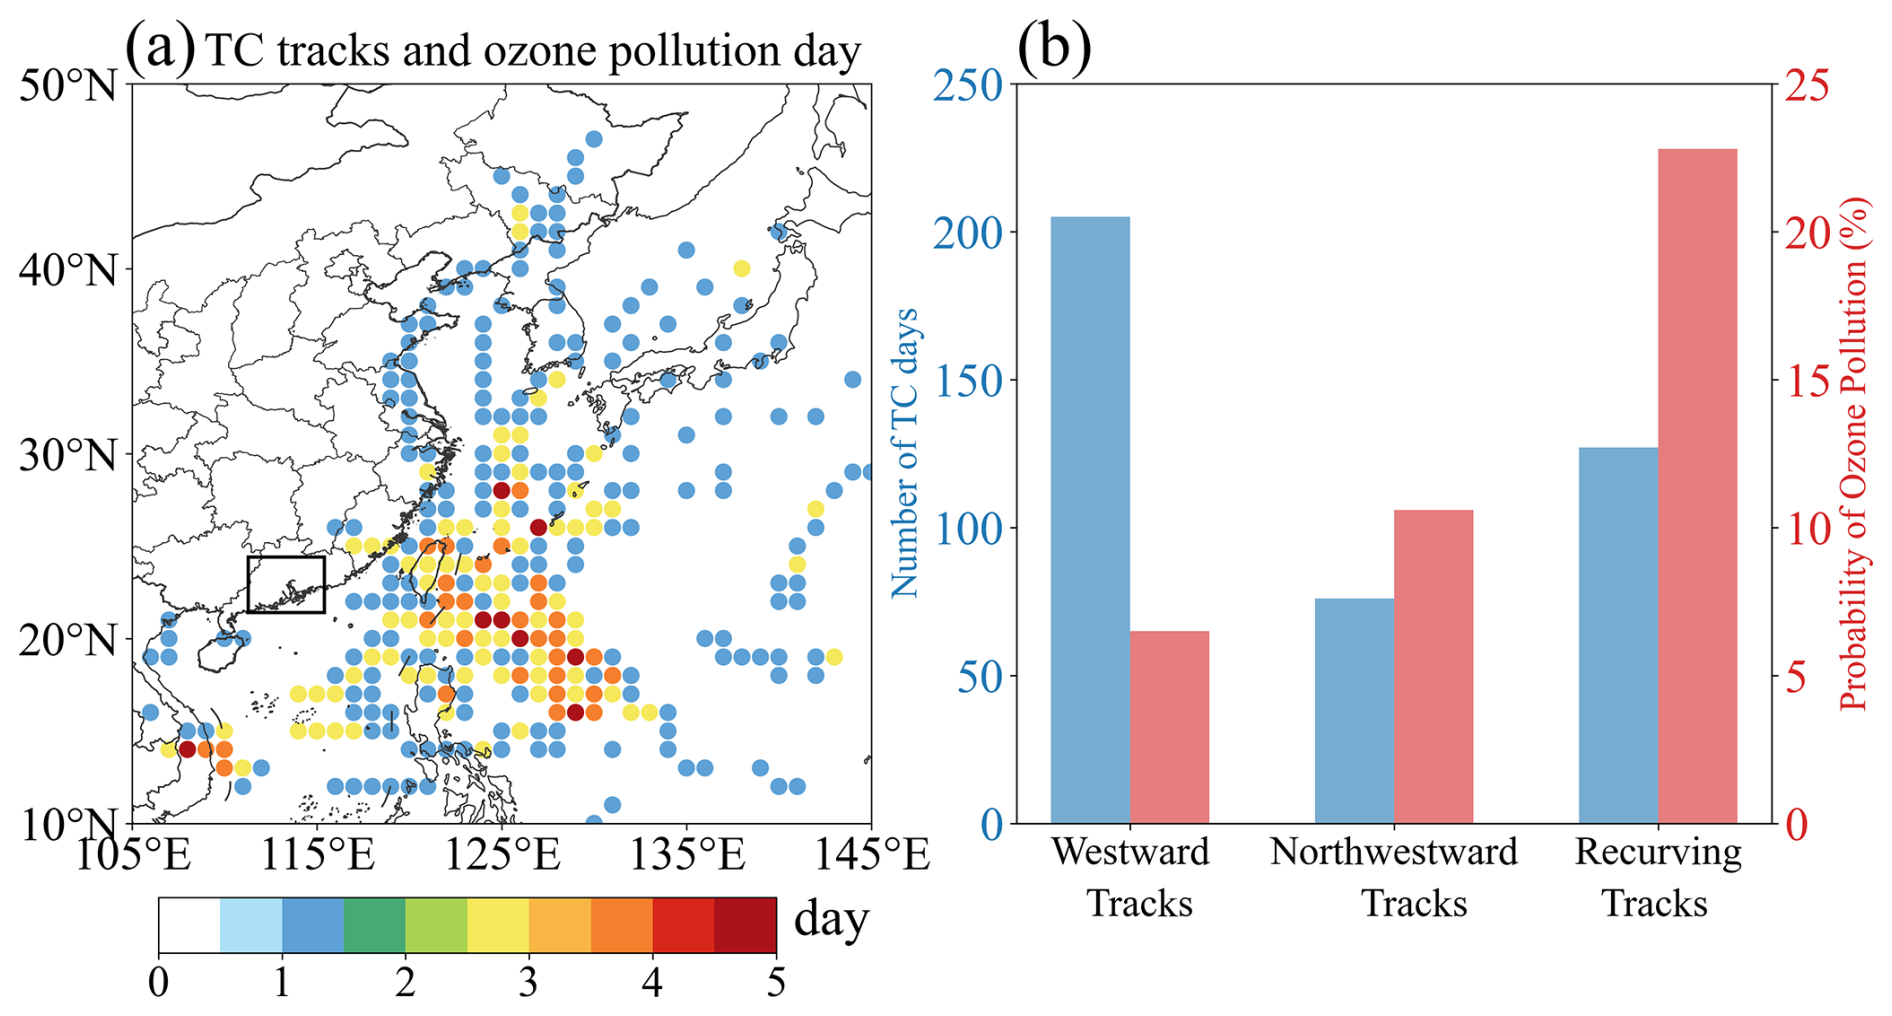
Figure 2(a) Spatial distribution (in days) of tropical cyclone (TC) activity and days of ozone (O3) pollution from June to October during the period 2015 to 2023, at a resolution of 1° × 1° (unit: day). (b) The number of westward tracks, northwest tracks and westward tracks (blue bar chart, unit: day); probability of O3 pollution on each track (red bar chart, unit: %).
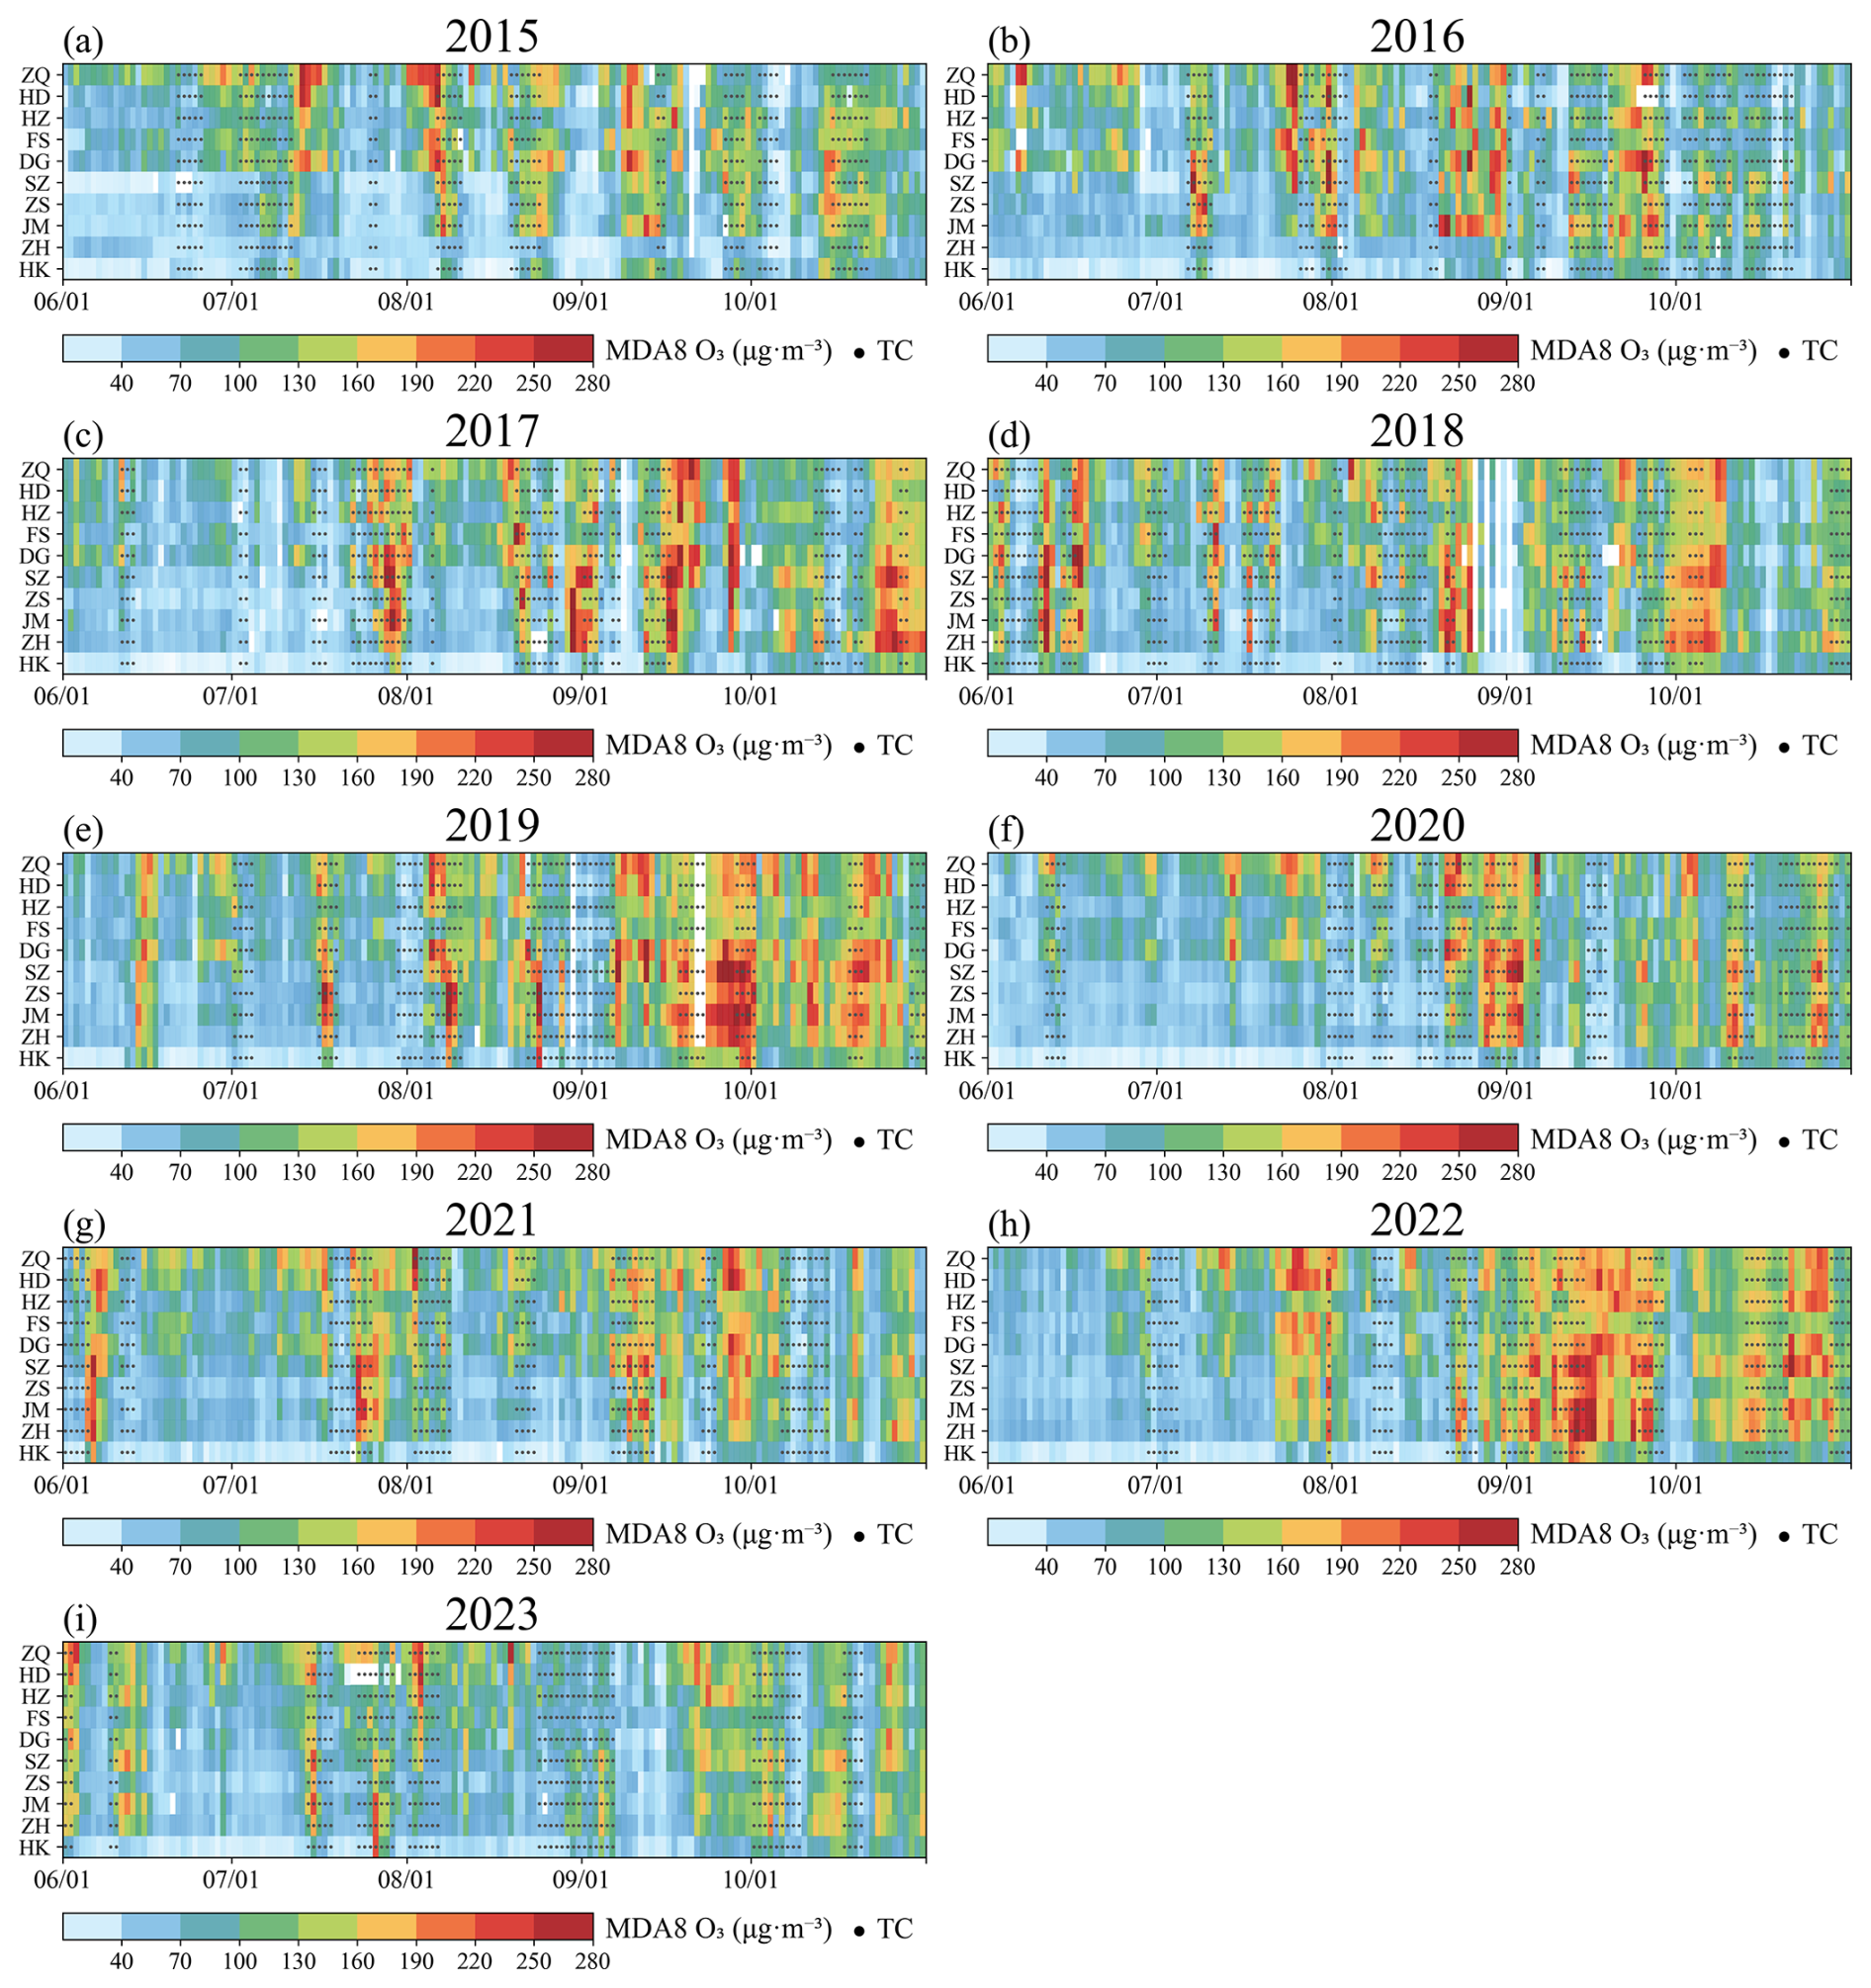
Figure 3The maximum daily 8 h average (MDA8) O3 in 10 cities in the GBA in (a) 2015, (b) 2016, (c) 2017, (d) 2018, (e) 2019, (f) 2020, (g) 2021, (h) 2022, and (i) 2023 from June to October. The national standard for ambient air quality for MDA8 O3 is 160 µg m−3 in China. These cities are sorted by latitude. The black dots represent the days of TC, where the TC track enters (10–30° N, 100–130° E).
By examining the MDA8 O3 concentrations in 10 cities in the GBA, we observed notable seasonal variations and differences in O3 levels between cities during June to October (Fig. 3). In particular during fall (September to October), there was a tendency to higher levels of O3, increasing the probability of O3 pollution events. Cities located at higher latitudes, often with mountainous landscapes, generally exhibited higher O3 concentrations, a pattern that may be attributed to photochemical environments more conducive to ozone formation as well as terrain features favoring ozone accumulation. In contrast, lower-latitude cities tended to have lower ozone levels. This pattern was especially evident when the TCs affected the GBA. In addition, there was a significant movement of O3 pollution from inland cities to coastal cities on days influenced by TC activity. During this period, four TCs were selected following three typical tracks for further study to examine the spatial distribution of O3. These include Nesat, Bailu (westward track), Danas (northwest track), and Lekima (recurving track) (Fig. 3c). The phenomenon also demonstrated the transportation of high-concentration O3 pollution from inland areas to coastal regions (Fig. 4).
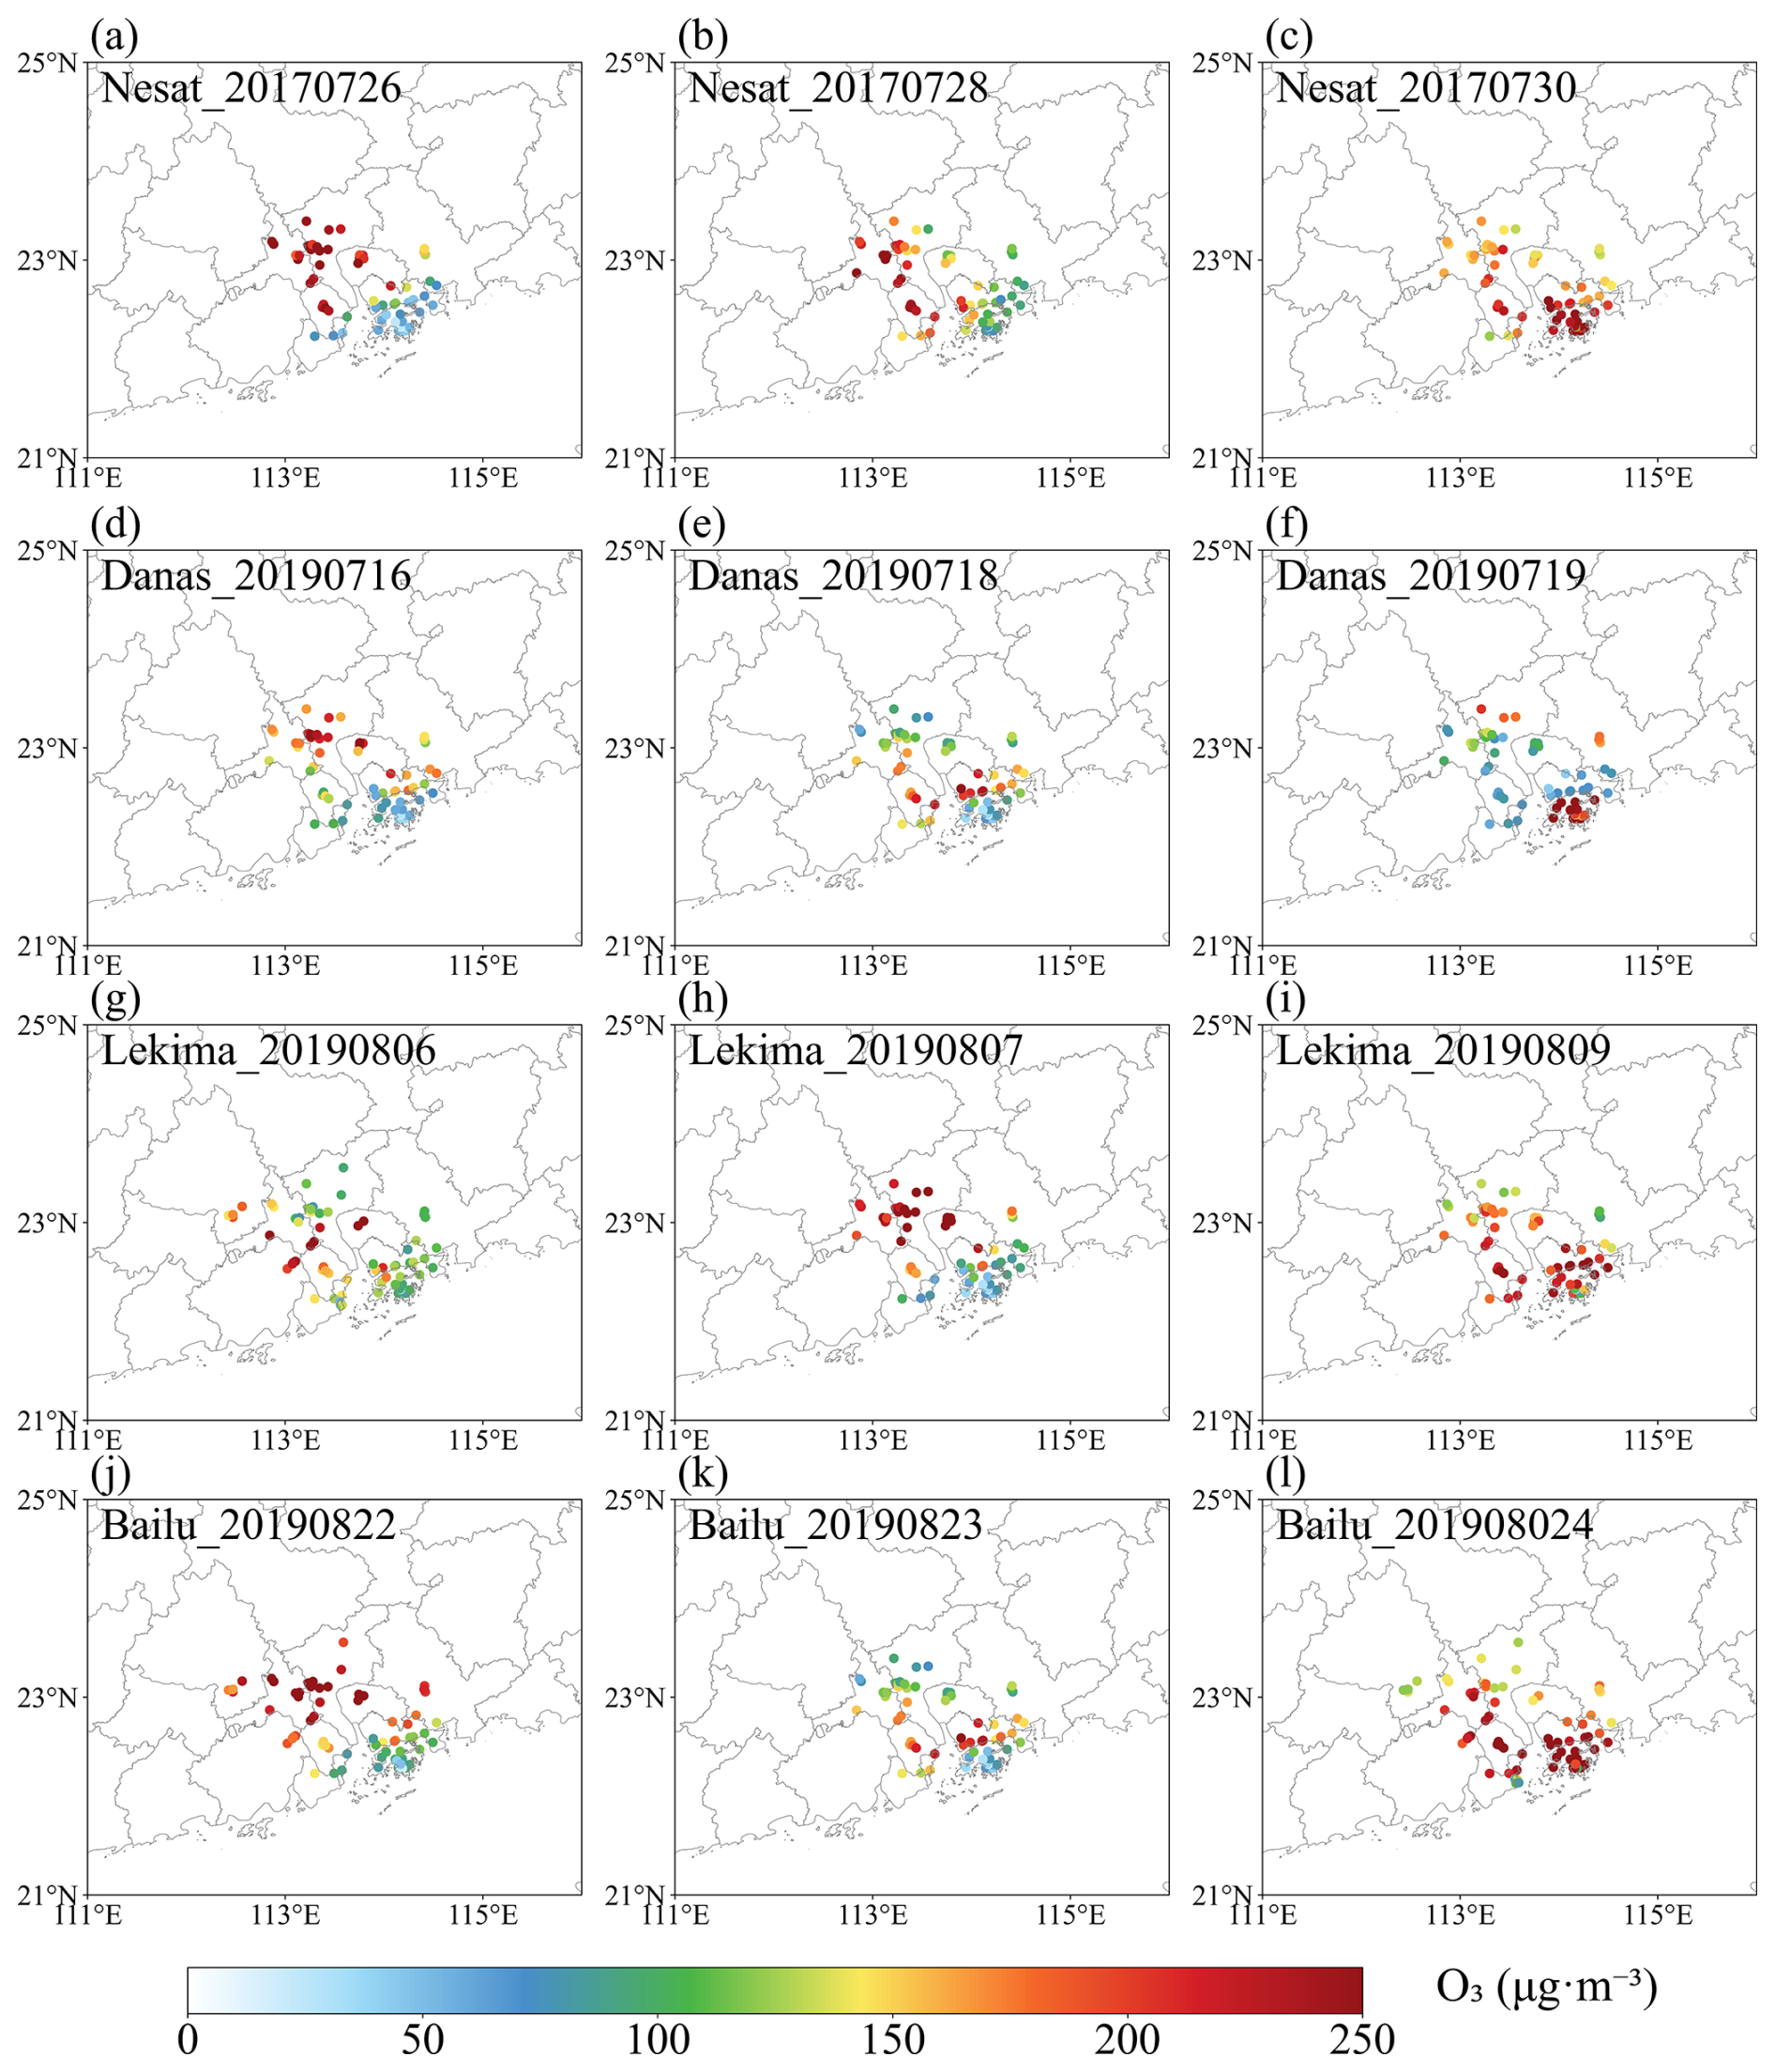
Figure 4Spatial distribution of MDA8 O3 surface concentrations in the GBA during (a–c) TC Nasat, (d–f) TC Danas, (g–i) TC Lekima and (j–l) TC Bailu.
3.2 Spatial characteristics of ozone pollution caused by TC Bailu
During the influence of TC Bailu, the GBA had comprehensive meteorological observations, wind profile radar detections (Fig. 2b), and environmental monitoring data, providing a robust data foundation for research. Furthermore, compared to TC Nasat, Danas, and Lekima, the TC Bailu track was almost parallel to the wind profile radars, allowing better observation of the O3 transport path. Therefore, we used TC Bailu as a case study to further investigate the mechanisms behind this phenomenon.
TC Bailu formed in the northwest Pacific Ocean (113.8° E, 13.5° N) at 16:00 LT (local time) on 20 August 2019, with the intensity of a tropical storm. From 21 to 24 August, Bailu moved northwestward and gradually approached the GBA. The GBA was under the influence of Bailu's peripheral circulation. On 25 August morning, TC Bailu made landfall on the coast of Fujian and its intensity gradually weakened after landfall, eventually dissipating in the afternoon of 26 August. To better understand the relationship between the Bailu TC position and the three wind profile radar stations, Table 3 shows the distances between the TC center and the HD, GZ, and HK stations from the generation phase until before landfall.
Table 3Distances between the TC center and the HD, GZ, and HK stations, from the generation phase to before landfall.
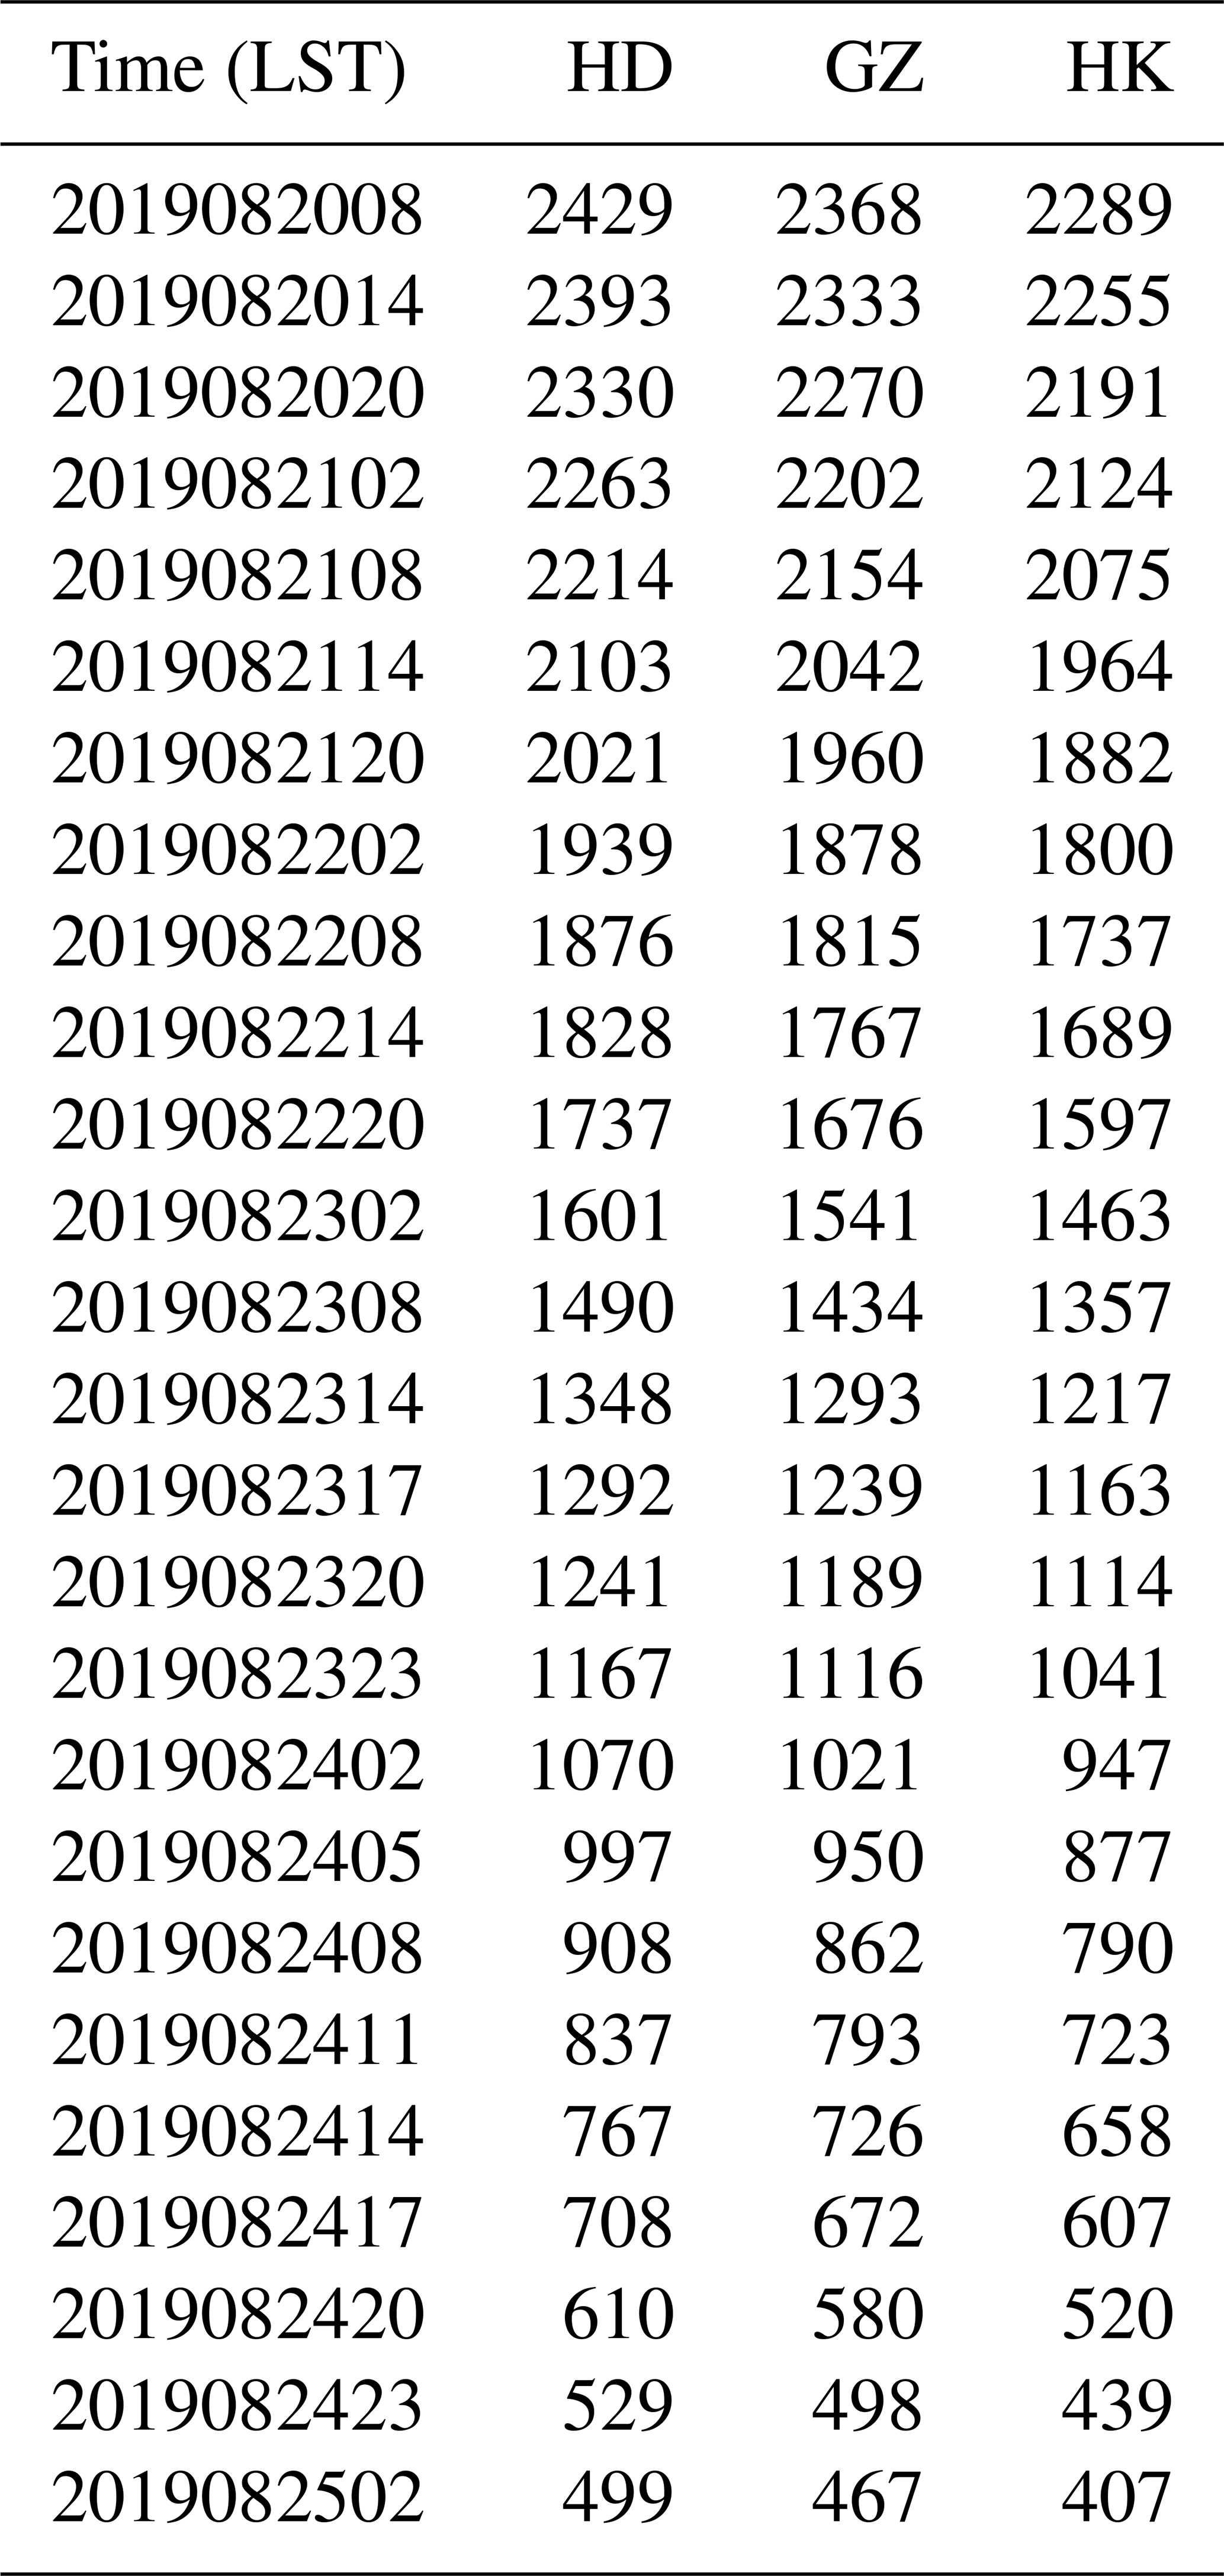
Note: Time is displayed as YYYYMMDDHH: Year YYYY, Month MM, Day DD, Hour HH (LST: UTC+8). Distance is measured in kilometers. The TC best track dataset provided position data every 6 h, and the frequency of the best track updates was increased to every 3 h for the 24 h before landfall and during its activity over land in China. Therefore, the distances between the Bailu TCand the wind profile radar at specific times in Figs. 5 to 9 are derived from the linear interpolation of the data in the table.
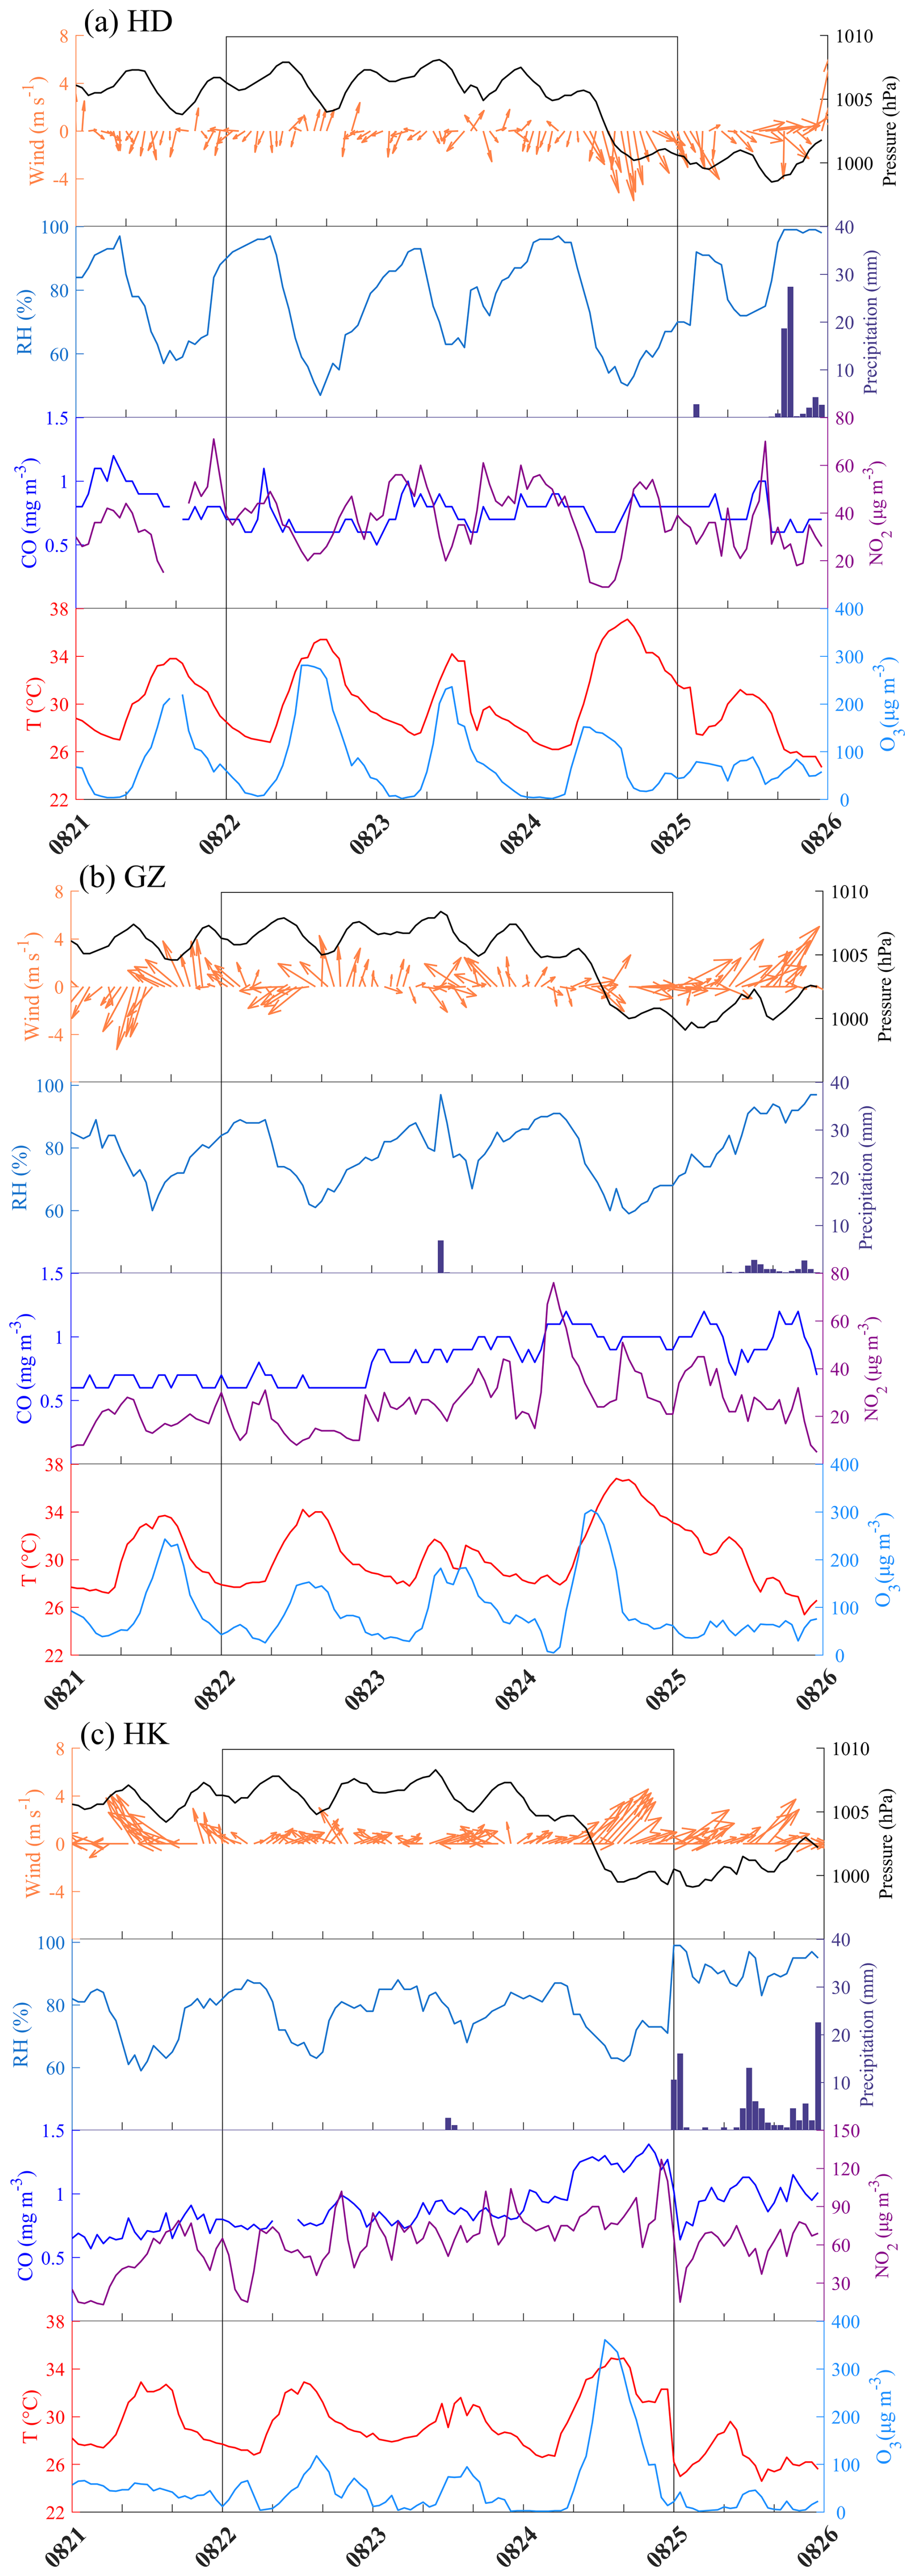
Figure 5Time series of wind, air pressure, relative humidity (RH), 24 h precipitation, CO, NO2, temperature of 2 m (T), and O3 at (a) HD, (b) GZ, and (c) HK stations from 21 to 25 August 2019. The black boxes indicate the study period.
As shown in Fig. 5, the concentration of O3 at the HD station was as high as 281 µg m−3 at 15:00 LT on 22 August, which was related to a higher temperature (35.1 °C), low humidity (47 %) and weak winds (2.1 m s−1) that promoted the formation and accumulation of O3. On 23 August, the O3 concentration decreased as the temperature decreased. On 24 August, the O3 concentration decreased significantly. However, the temperature increased and the precursors of O3 (NO2 and CO) remained almost unchanged. This suggested that O3 may be transported downwind under the influence of TC Bailu (Fig. 5a). The changes in NO2 and CO concentrations were evaluated based on general trends rather than fluctuations observed at a single time point. Although a noticeable minimum in NO2 concentration was recorded on August 24, this does not impact our conclusion regarding the transport of O3 downstream from TC Bailu to the HD station. At the downstream stations, GZ, and HK, O3 concentrations increased from 23 to 24 August. At GZ station, the O3 concentration even reached 304 µg m−3 on 24 August. Given that NO2 and CO concentrations also increased, the increase in O3 concentration at the GZ station was the result of both local O3 formation and regional O3 transport (Fig. 5b). The increase in O3 concentrations resulted from both local O3 formation and regional O3 transport. However, given that TC Bailu had a relatively short time frame from formation to landfall (21–25 August), we posit that the concentrations of local O3 and its precursors fluctuated during this period. The significant changes observed in O3 concentrations were primarily driven by external factors, particularly regional transport of O3. Research has shown that the interaction between the TC's outer circulation and large-scale meteorological conditions plays a crucial role in the variation of O3 concentrations, especially under conditions of high temperatures and intense solar radiation (Wang et al., 2024). Regarding the HK station, the NO2 and CO concentrations did not change much. As a developed city, Hong Kong has a high car ownership rate, leading to numerous sources of NOx emissions and high CO levels. This significantly enhances the titration effect of ozone at night, resulting in lower O3 concentrations on 22 and 23 August. The O3 concentration on 23 August was slightly lower due to the decrease in temperature. However, on 24 August, the O3 concentration at the HK station suddenly increased to 361 µg m−3, which was four times higher than on 23 August. Therefore, the high ozone levels recorded at the HK station on 24 August were significantly affected by TC transport. This phenomenon was also confirmed by changes in wind. On 24 August, the dominant wind at the HK station was southwest, which was different from the northwest at the upstream HD and GZ stations. The two air flows converged at the HK station, resulting in severe O3 pollution at the HK station (Fig. 5c).
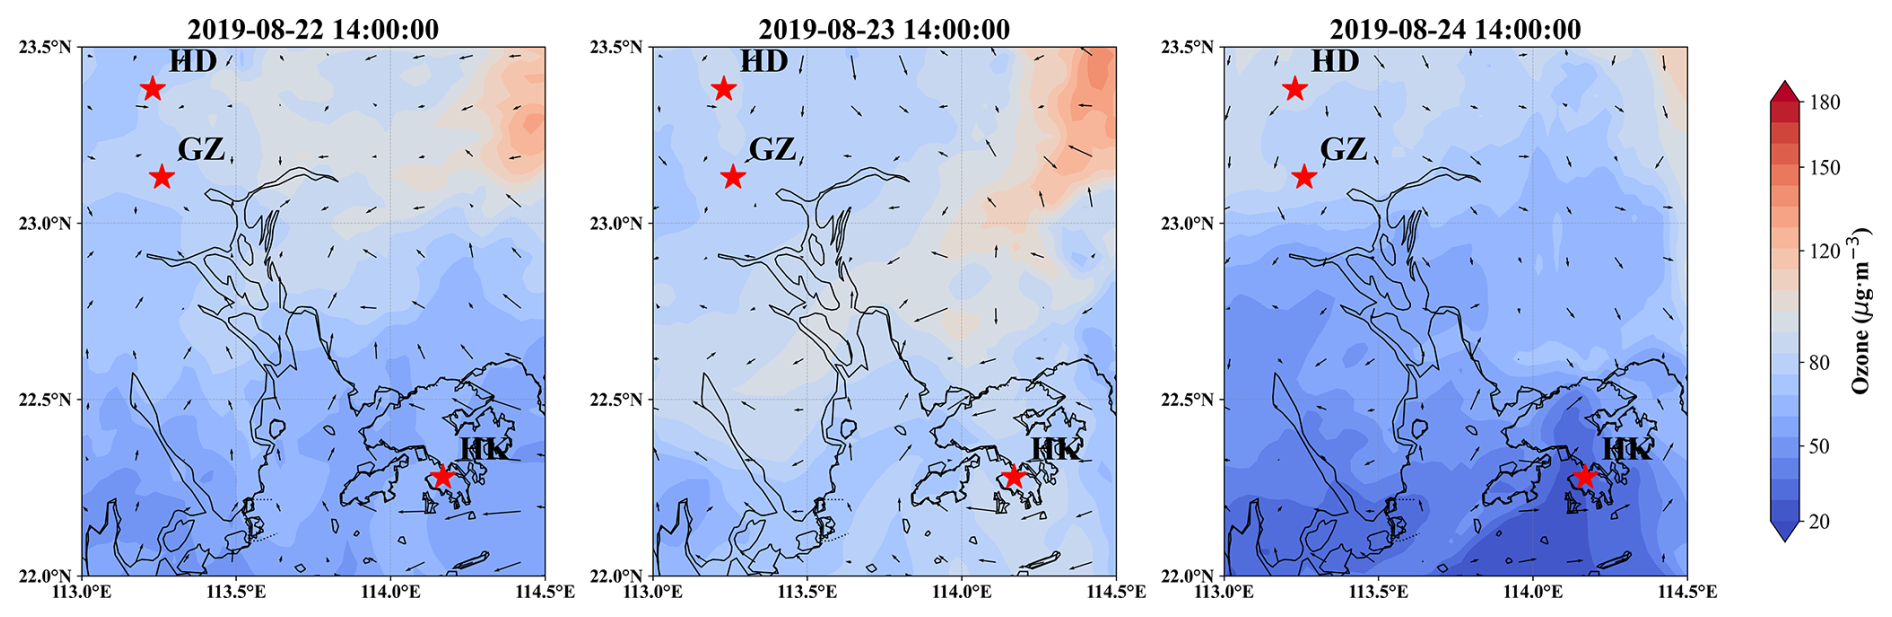
Figure 6This figure illustrates the spatiotemporal distribution of ozone concentrations and wind fields simulated by WRF-Chem at different times within the Pearl River Delta region. The stars in the figure denote the locations of three radar stations.
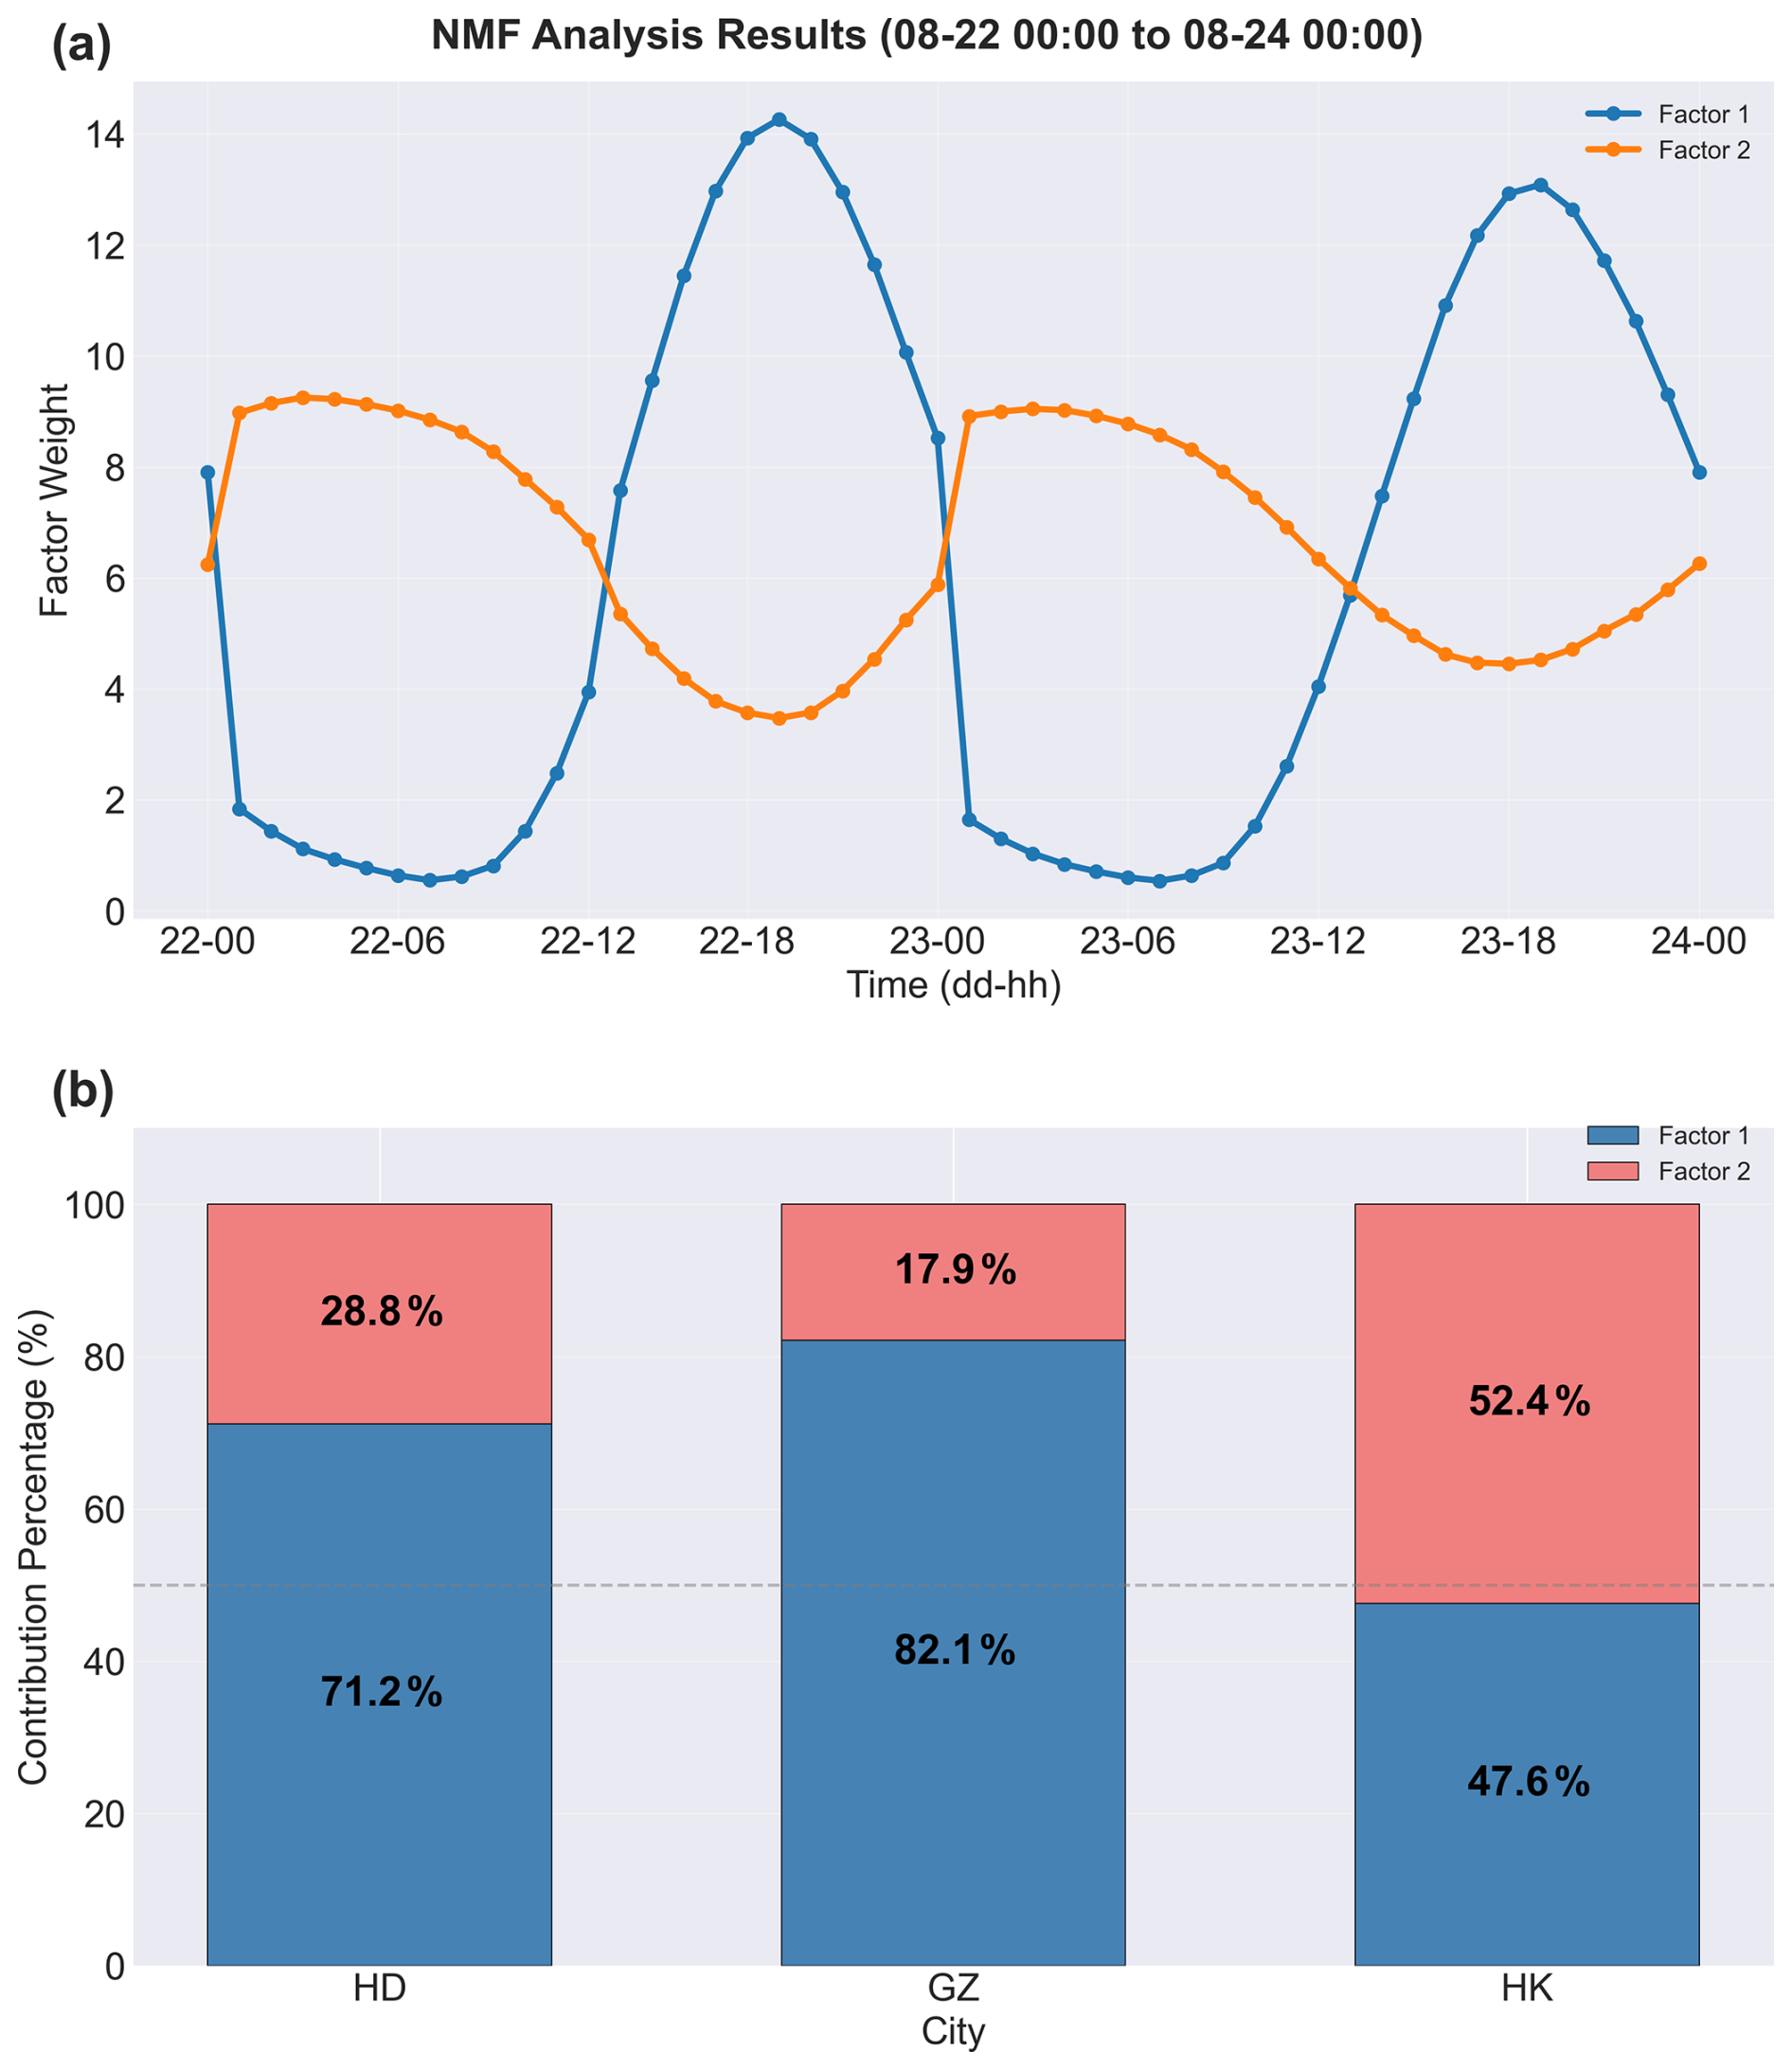
Figure 7(a) Two factor time series (22–24 August). (b) Proportion of local generation and regional transmission in HD, GZ and HK.
The results of the model corroborate the aforementioned analysis. In Fig. 6, wind speeds around the HD station are relatively weak, supporting limited regional transport. Additionally, the non-negative matrix factorization (NMF) results indicate that local emission contributions account for 78.9 % of the ozone at the HD station, which is consistent with the backward trajectory analysis shown in Fig. 7. This further confirms that the observed ozone during this period was primarily generated locally over inland areas. Moreover, there is distinct ozone transport from the northeast to the southern regions during 22–23 August. This transport pattern occurred under generally low surface-level ozone concentrations across the Greater Bay Area, with minimal regional accumulation differences – a regime dominated by local photochemistry and boundary-layer processes during the pre-TC period. Additionally, on 24 August, the wind direction near the Hong Kong station changed from northeast to southwest. However, the convergence zone of the south and north winds in the model is located north of the Hong Kong station. This discrepancy arises because, following typhoon landfall, the model slightly overestimates the typhoon's northern position. Notably, in coastal areas close to the TC track, the typical photochemically driven diurnal signal weakened systematically, reflecting the increasing influence of synoptic-scale dynamics on ozone redistribution.
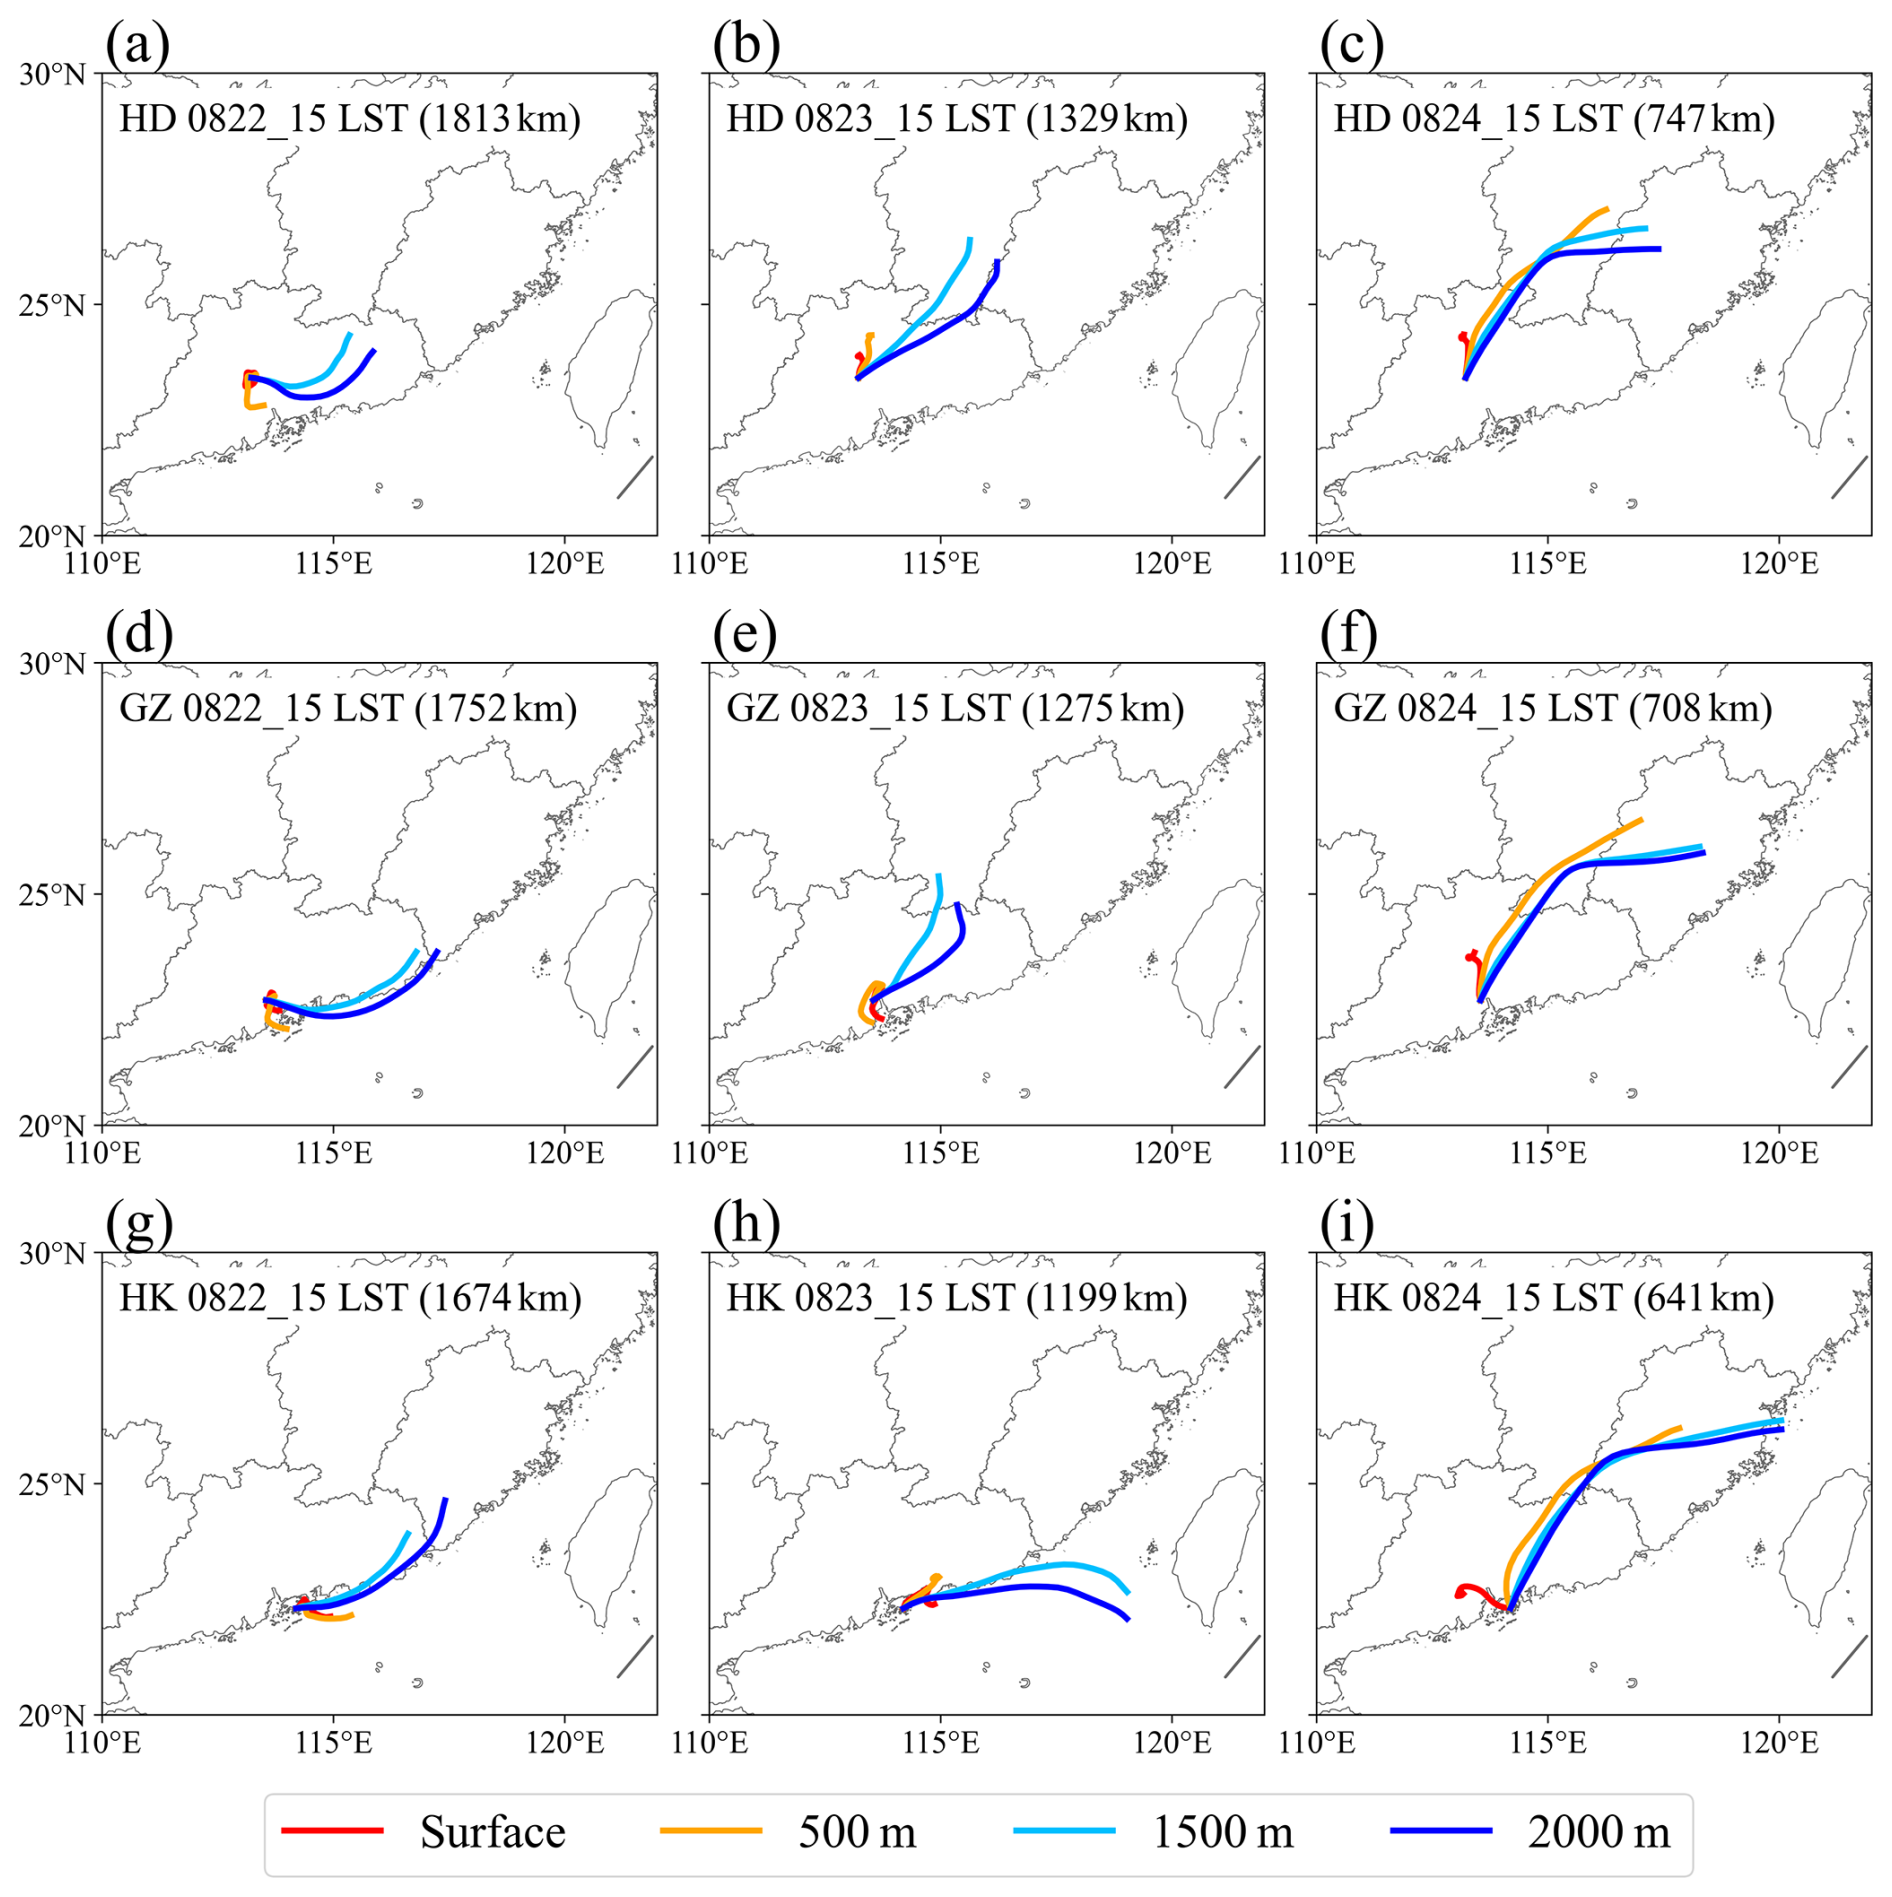
Figure 824 h backward trajectories of (a–c) HD station, (d–f) GZ station, and (g–i) HK station at different vertical heights. (Heights of 0, 500, 1500, and 2000 m represent the surface, the middle of the boundary layer, the top of the boundary layer, and above the boundary layer, respectively. The distance in the character brackets on the top left of the subplot indicated the distance from TC Bailu to the wind profile radars at that moment.)
We applied non-negative matrix factorization (NMF) for source apportionment, which identified two primary factors (local production and regional transport). The patterns of diurnal variation in Fig. 7a allow us to identify Factor 1 as local production and Factor 2 as regional transport, since local emissions typically peak in the afternoon, while regional transport often shows higher contributions during the early morning (Zong et al., 2023). Figure 7b shows that local production contributes 71.2 % of the ozone at the HD station, significantly higher than the contribution from regional transport. This finding aligns with the spatial distribution shown in Fig. 6 and is further supported by the backward trajectory analysis presented in Fig. 8.
In summary, the high concentrations of O3 observed at the HD station from 22 to 23 August were primarily attributed to local photochemical production, as weak winds limited regional transport. On 24 August, the O3 levels at the HD station decreased significantly due to wind changes that improved transport, moving O3 to downstream regions. As a result, elevated O3 concentrations were observed at the GZ and HK stations, especially at the HK stations, where the winds converged.
3.3 Transport of ozone pollution affected by TC Bailu
From Sect. 3.2 above, the regional transport of O3 induced by the peripheral circulation of TC Bailu was the main driver of coastal O3 pollution in the GBA. In this section, we used high resolution boundary layer observation data to describe the three-dimensional transport of O3, both in the horizontal and vertical dimensions.
3.3.1 Horizontal transport and accumulation by recirculation
Based on the 24 h backward trajectories, the air masses within the boundary layer circulated around the HD station, while the air masses above the boundary layer originated from the northeast (Fig. 8a–c). In terms of GZ and HK stations, air masses above the boundary layer on 22 to 23 August also came from the northeast, while air masses within the boundary layer came from the South China Sea region (Fig. 8d–h). Then on 24 August, the surface and 500 m air mass transport pathways crossed the HD and GZ stations, advecting O3 from HD to GZ and then to HK (Fig. 8f and i). Based on the distance from TC Bailu to the wind profile radars, when this distance was approximately 1600 to 1800 km, an influx of air masses from other regions occurred in the high-altitude layers of the GBA, persisting until TC Bailu made landfall.
Figure 9 further illustrated the vertical profiles of the horizontal wind at these three stations. On 23 August, as TC Bailu approached (about 1000–1600 km away from the GBA), the wind speed in and above the boundary layer increased, and the wind speed above the boundary layer increased even more. When Bailu was located near Taiwan on 24 August (15:00 LT, approximately 600–700 km from the GBA), the wind speed continued to increase, but the wind direction in the upper boundary layer shifted from northeast to north or northwest (Fig. 9a). Regarding the GZ and HK stations, the wind speed in the boundary layer gradually strengthened and deepened from 24 August, accompanied by an increase in O3 concentrations. Additionally, the height of the boundary layer in the GBA was lower compared to the previous 2 d, indicating a more stable atmospheric boundary structure that was unfavorable for the dispersion of pollutants (Fig. 9b–c).
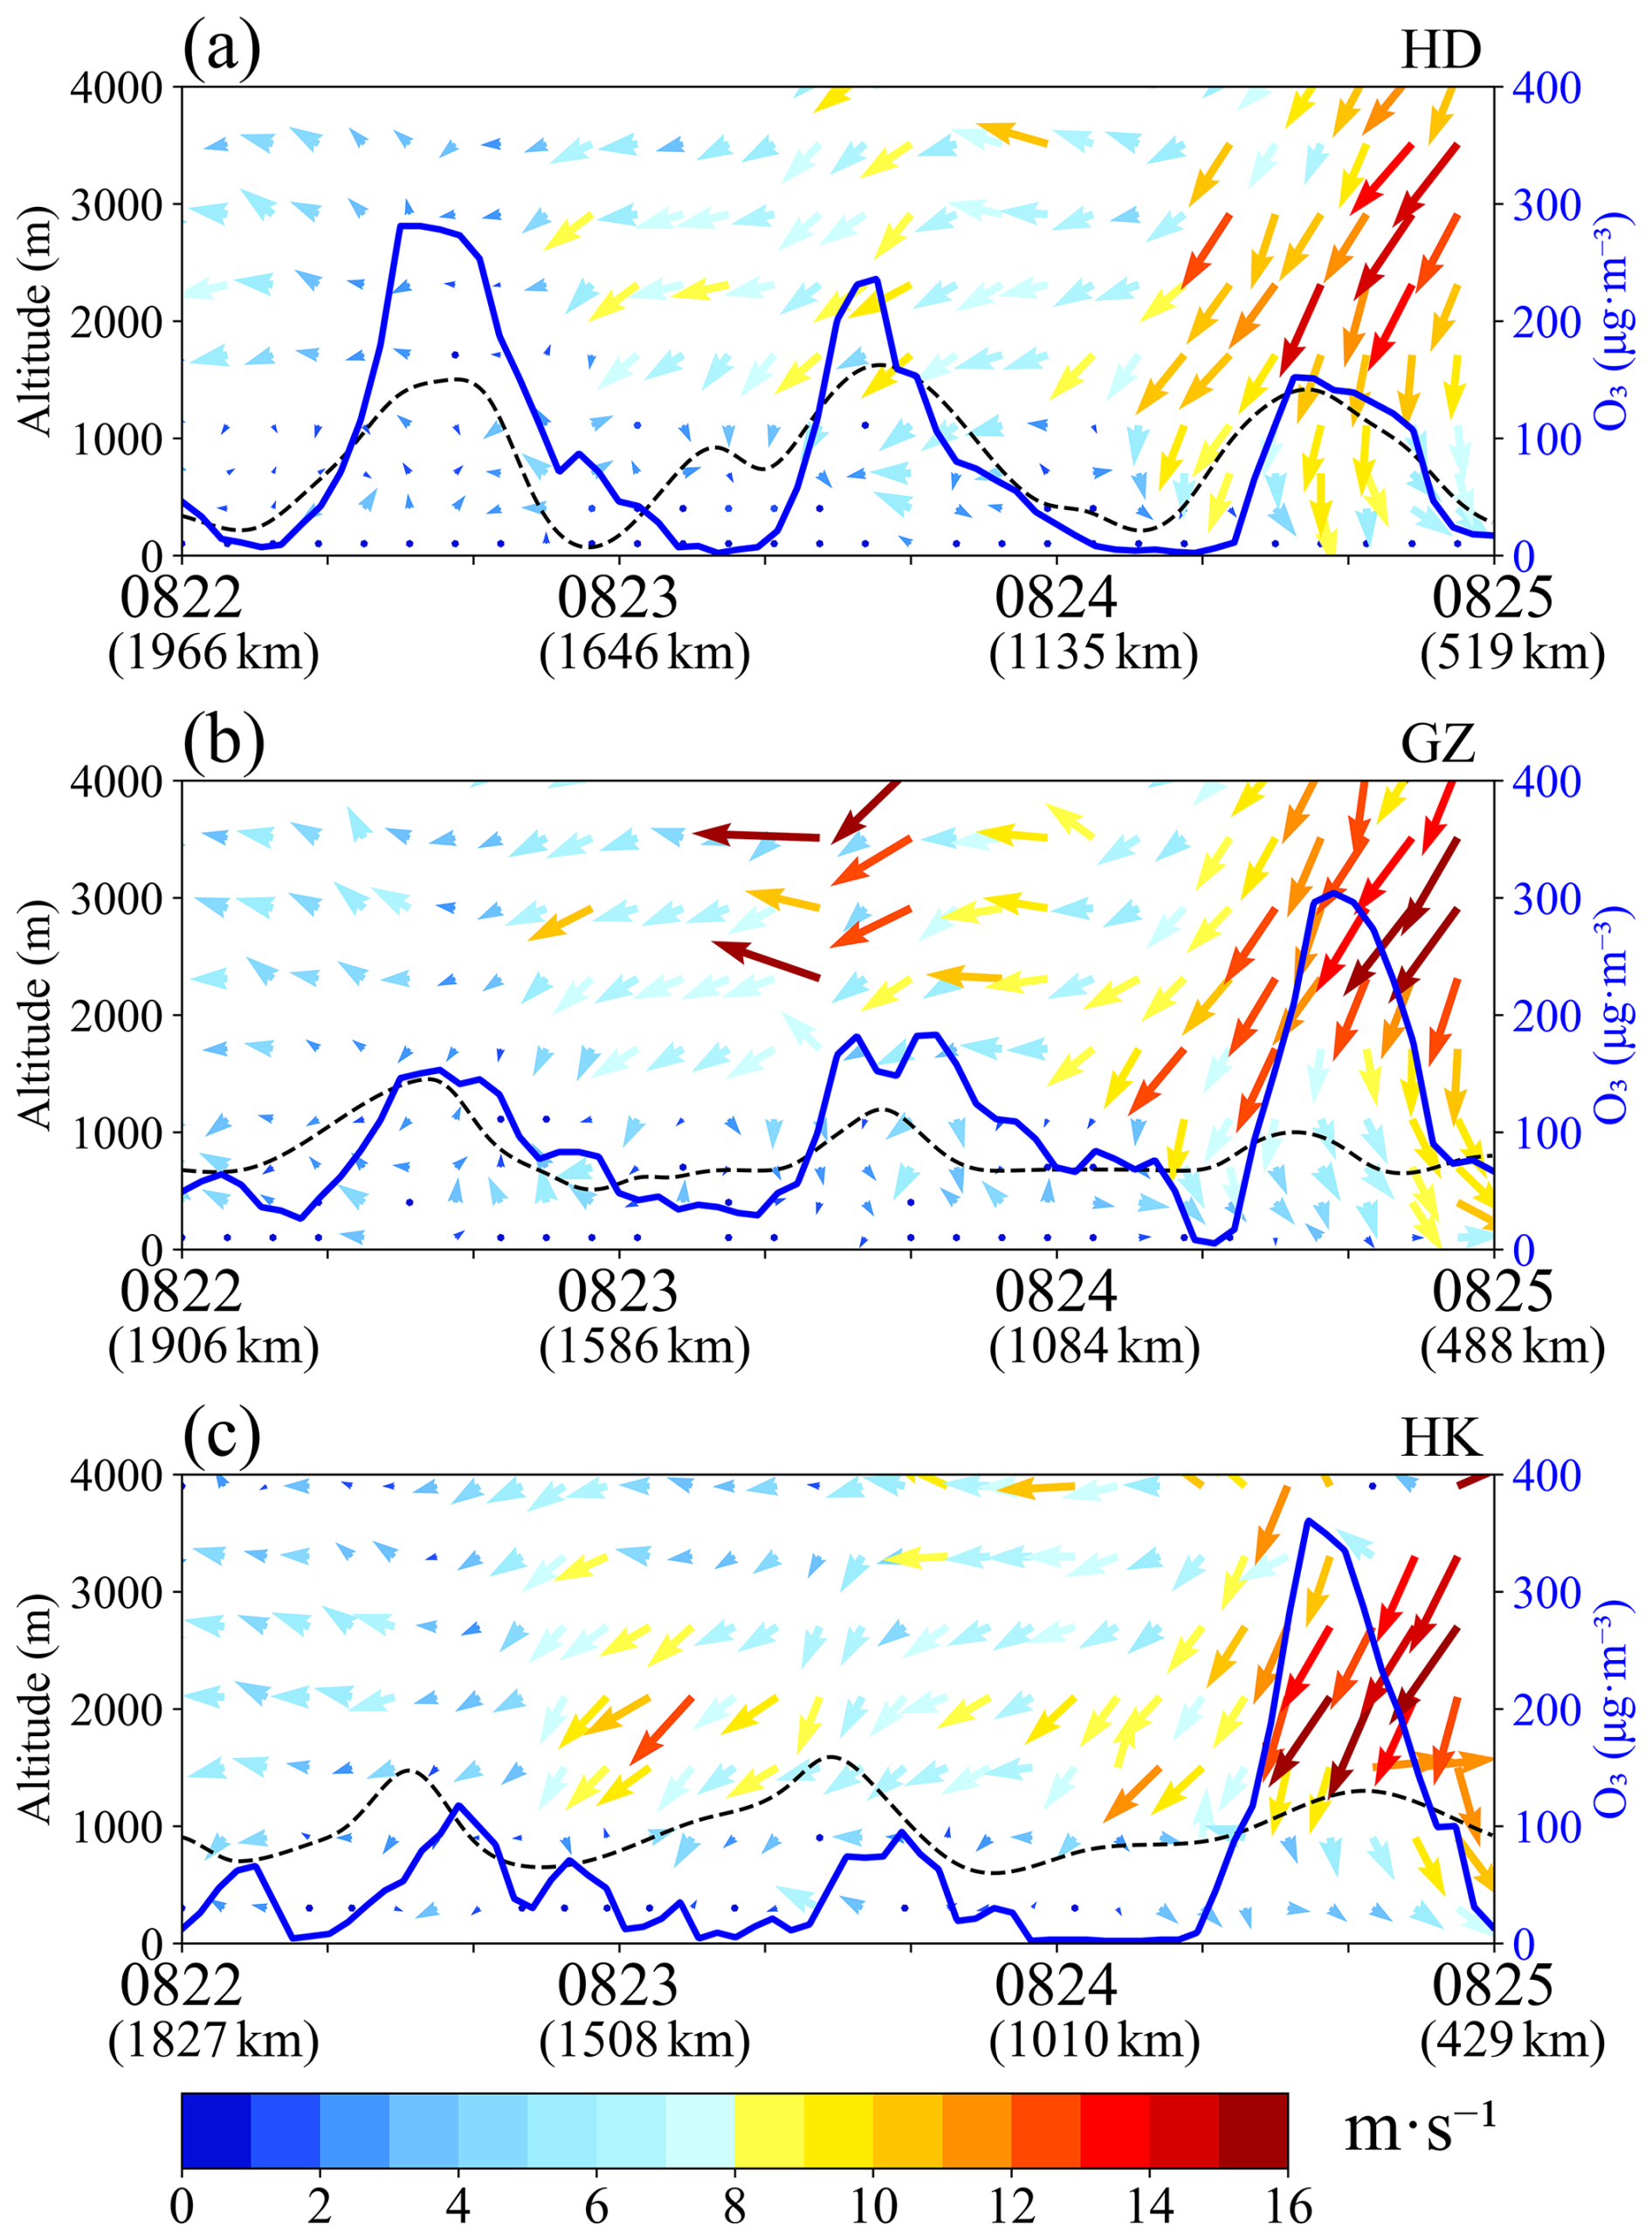
Figure 9Horizontal wind (vector arrows) measured by wind profile radar at the (a) HD, (b) GZ, and (c) HK stations from 22 to 25 August. The black dashed and blue lines represent the height of the boundary layer and the concentration of O3, respectively. The distance in brackets below the date on the x-axis represents the distance from TC Bailu to the wind profile radars at that moment.
Since the direction of the wind in the GBA changed significantly due to TC Bailu, it was possible that the dispersed O3 was transported back to the local area, prolonging the O3 pollution. In this study, the Recirculation Index (RI) was used to evaluate the effect of wind on re-accumulation of O3. As illustrated in Fig. 10, at the three stations, the RI was less than 0.6 within the boundary layer from 22 to 23 August and greater than 0.6 outside the boundary layer, when TC Bailu was approximately 1800–2000 km from the GBA. This configuration could have trapped O3 into the surrounding areas. On 24 August (about 500–1000 km from the GBA), the RI increased and the O3 concentration decreased at the HD station, while the opposite was observed at the GZ and HK stations. In particular, at the HK station, the surface wind direction changed from southeast (21 August) to westerly (22 and 23 August) and then to strong southwest (24 August). The near-surface convergence effect trapped O3 near the surface even though the diffusion conditions aloft were favorable (Fig. 5c). Additionally, it is important to note that the scanning height of the HK radar is 300 m. Consequently, when analyzing ground-level O3 concentrations in Hong Kong, we primarily rely on the wind direction reported by the local meteorological station for our assessments and analyses. Although favorable high-altitude dispersion conditions can facilitate the spread of O3, excessive convergence effects near the surface can create a “bottleneck”, trapping O3 close to the ground and inhibiting its upward movement.
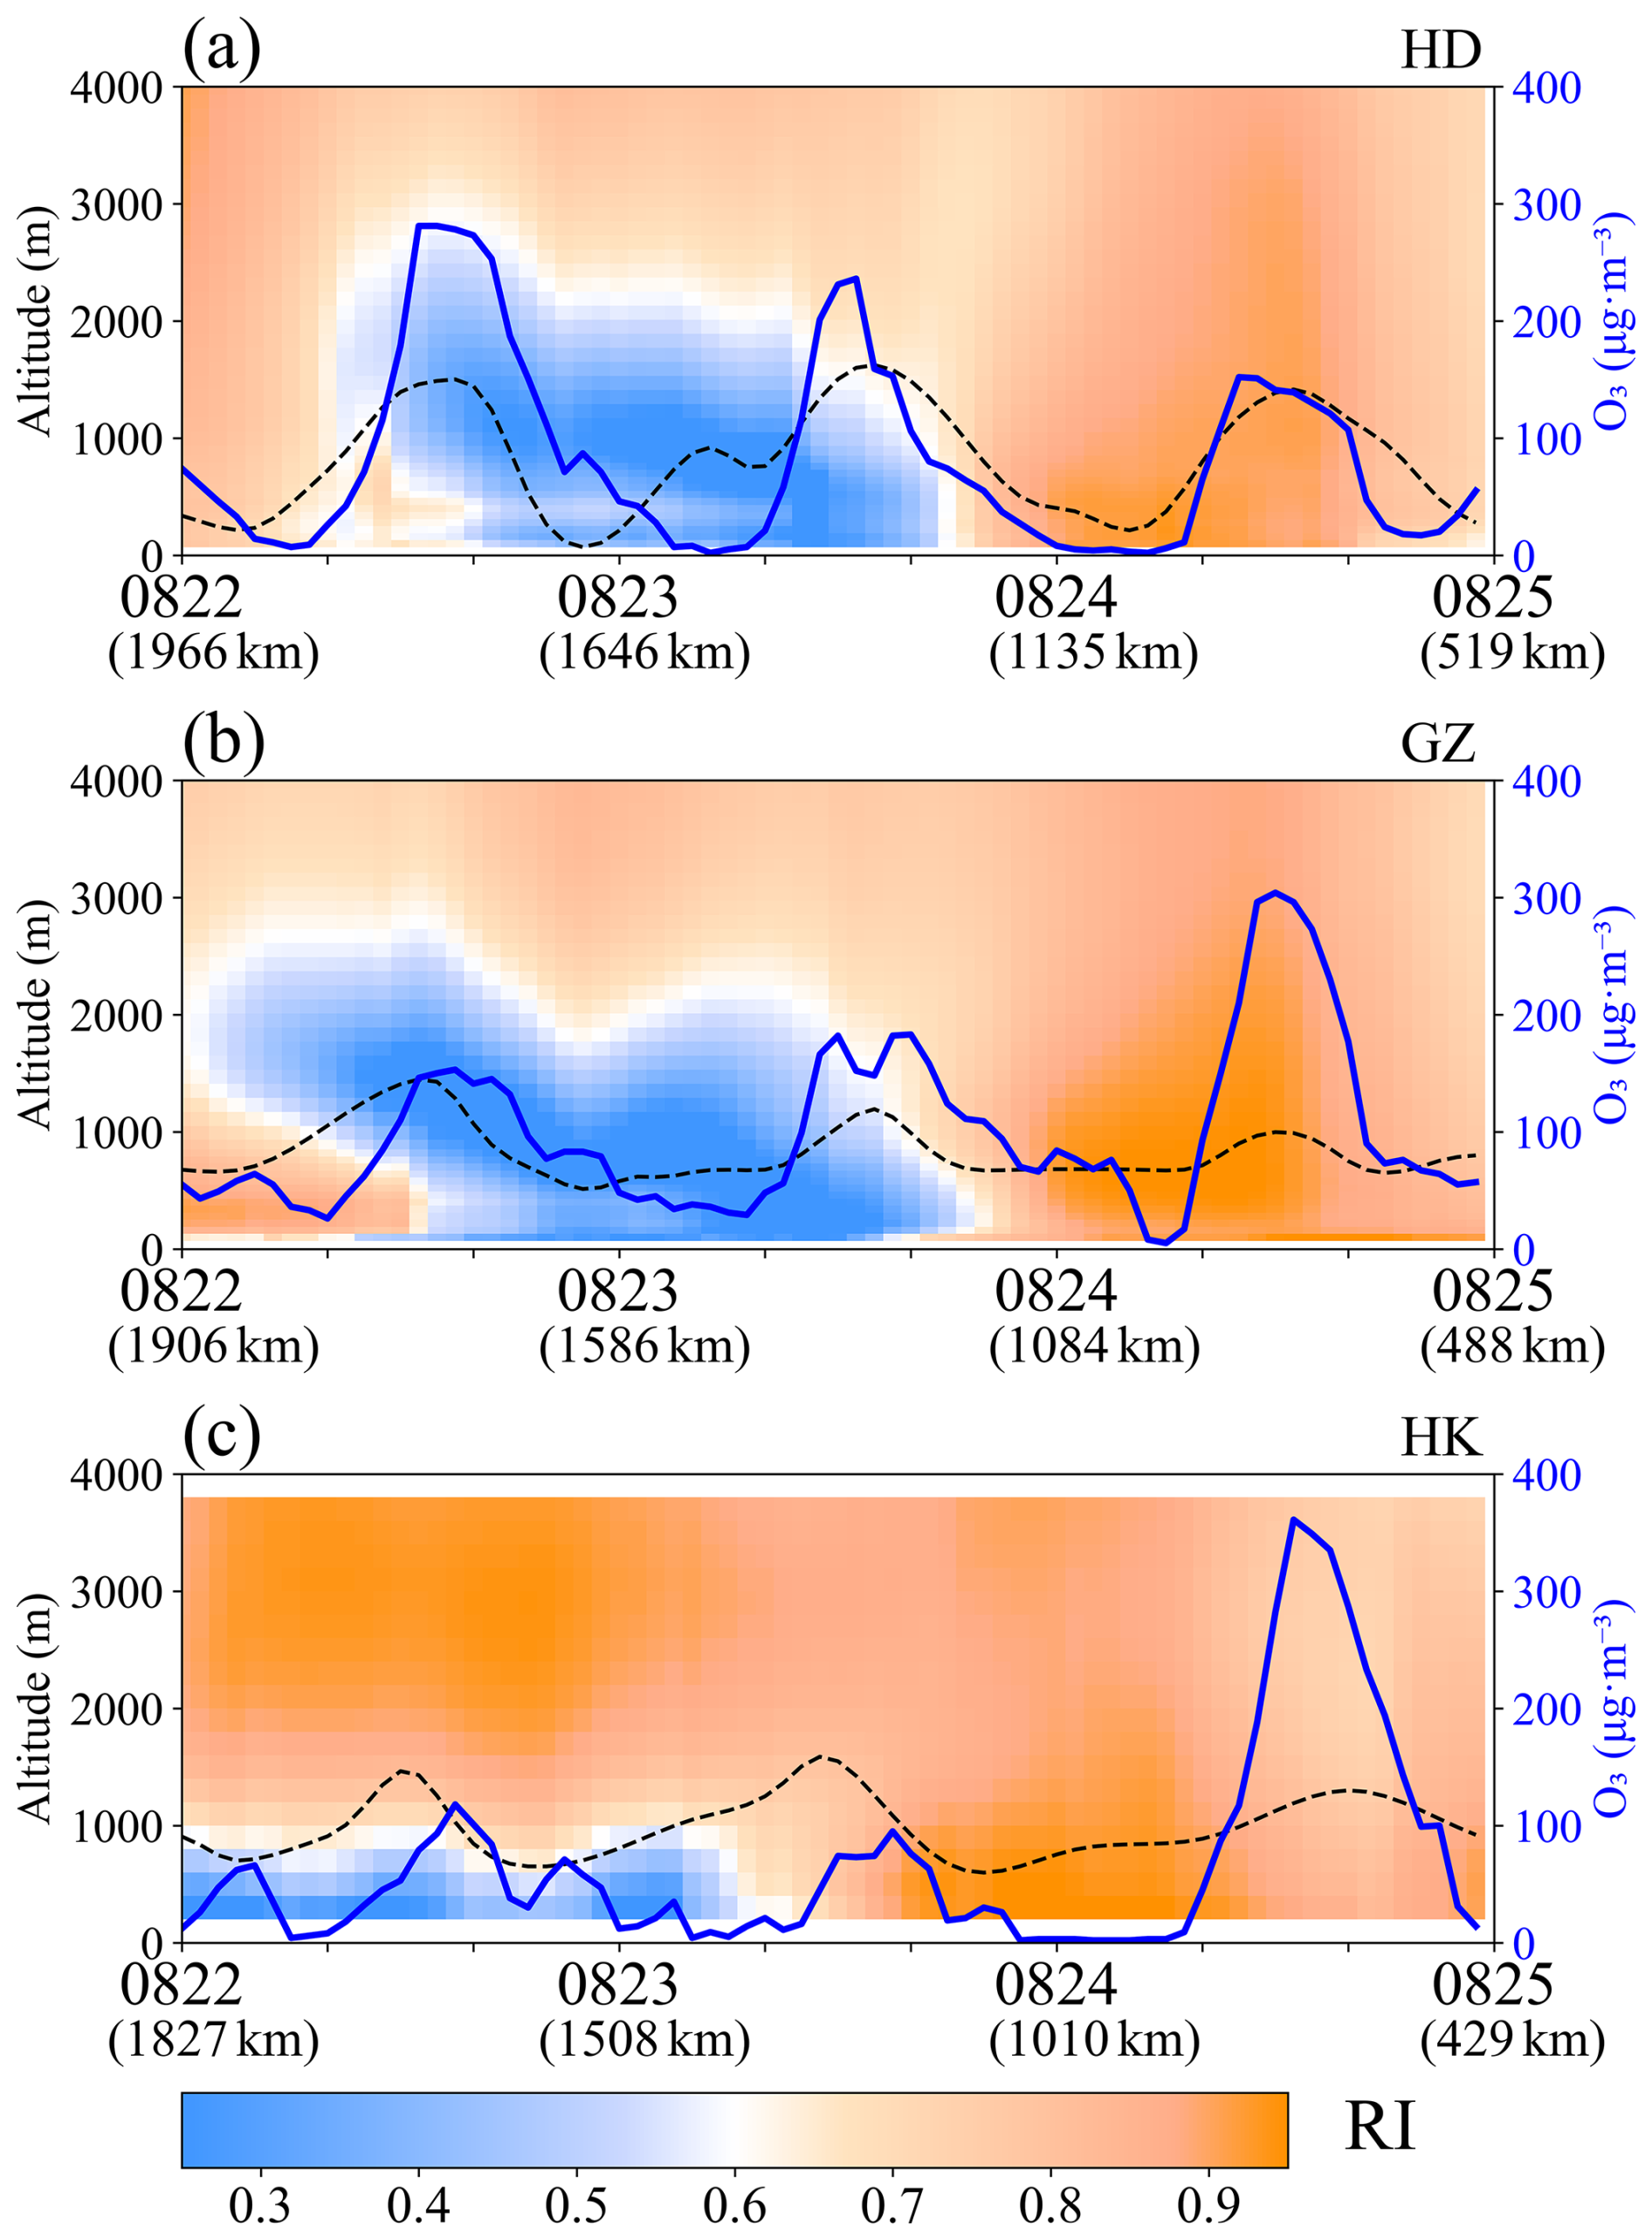
Figure 10The recirculation index (shaded) was calculated using the wind profile radar at (a) the HD station, (b) the GZ station, and (c) the HK station from 22 to 25 August. Black dashed and blue lines represent the height of the boundary layer and the concentration of O3, respectively. The distance in brackets below the date on the x-axis represents the distance from TC Bailu to the wind profile radars at that moment.
Figure 11 shows that on 23 August at midnight, when the typhoon was still far from the Pearl River Delta region, subsiding flow occurred at the height of the boundary layer across all three sites. This facilitated notable transport of ozone from the upper boundary layer to the lower part of the layer. However, after approximately 12:00 pm LT on 23 August, the near-surface recirculation index increased at all three locations, with horizontal advection intensifying. Although ozone concentrations at higher altitudes remained largely unchanged, a significant low-value zone formed below the boundary layer in all regions, likely caused by ozone dispersion due to horizontal wind conditions.
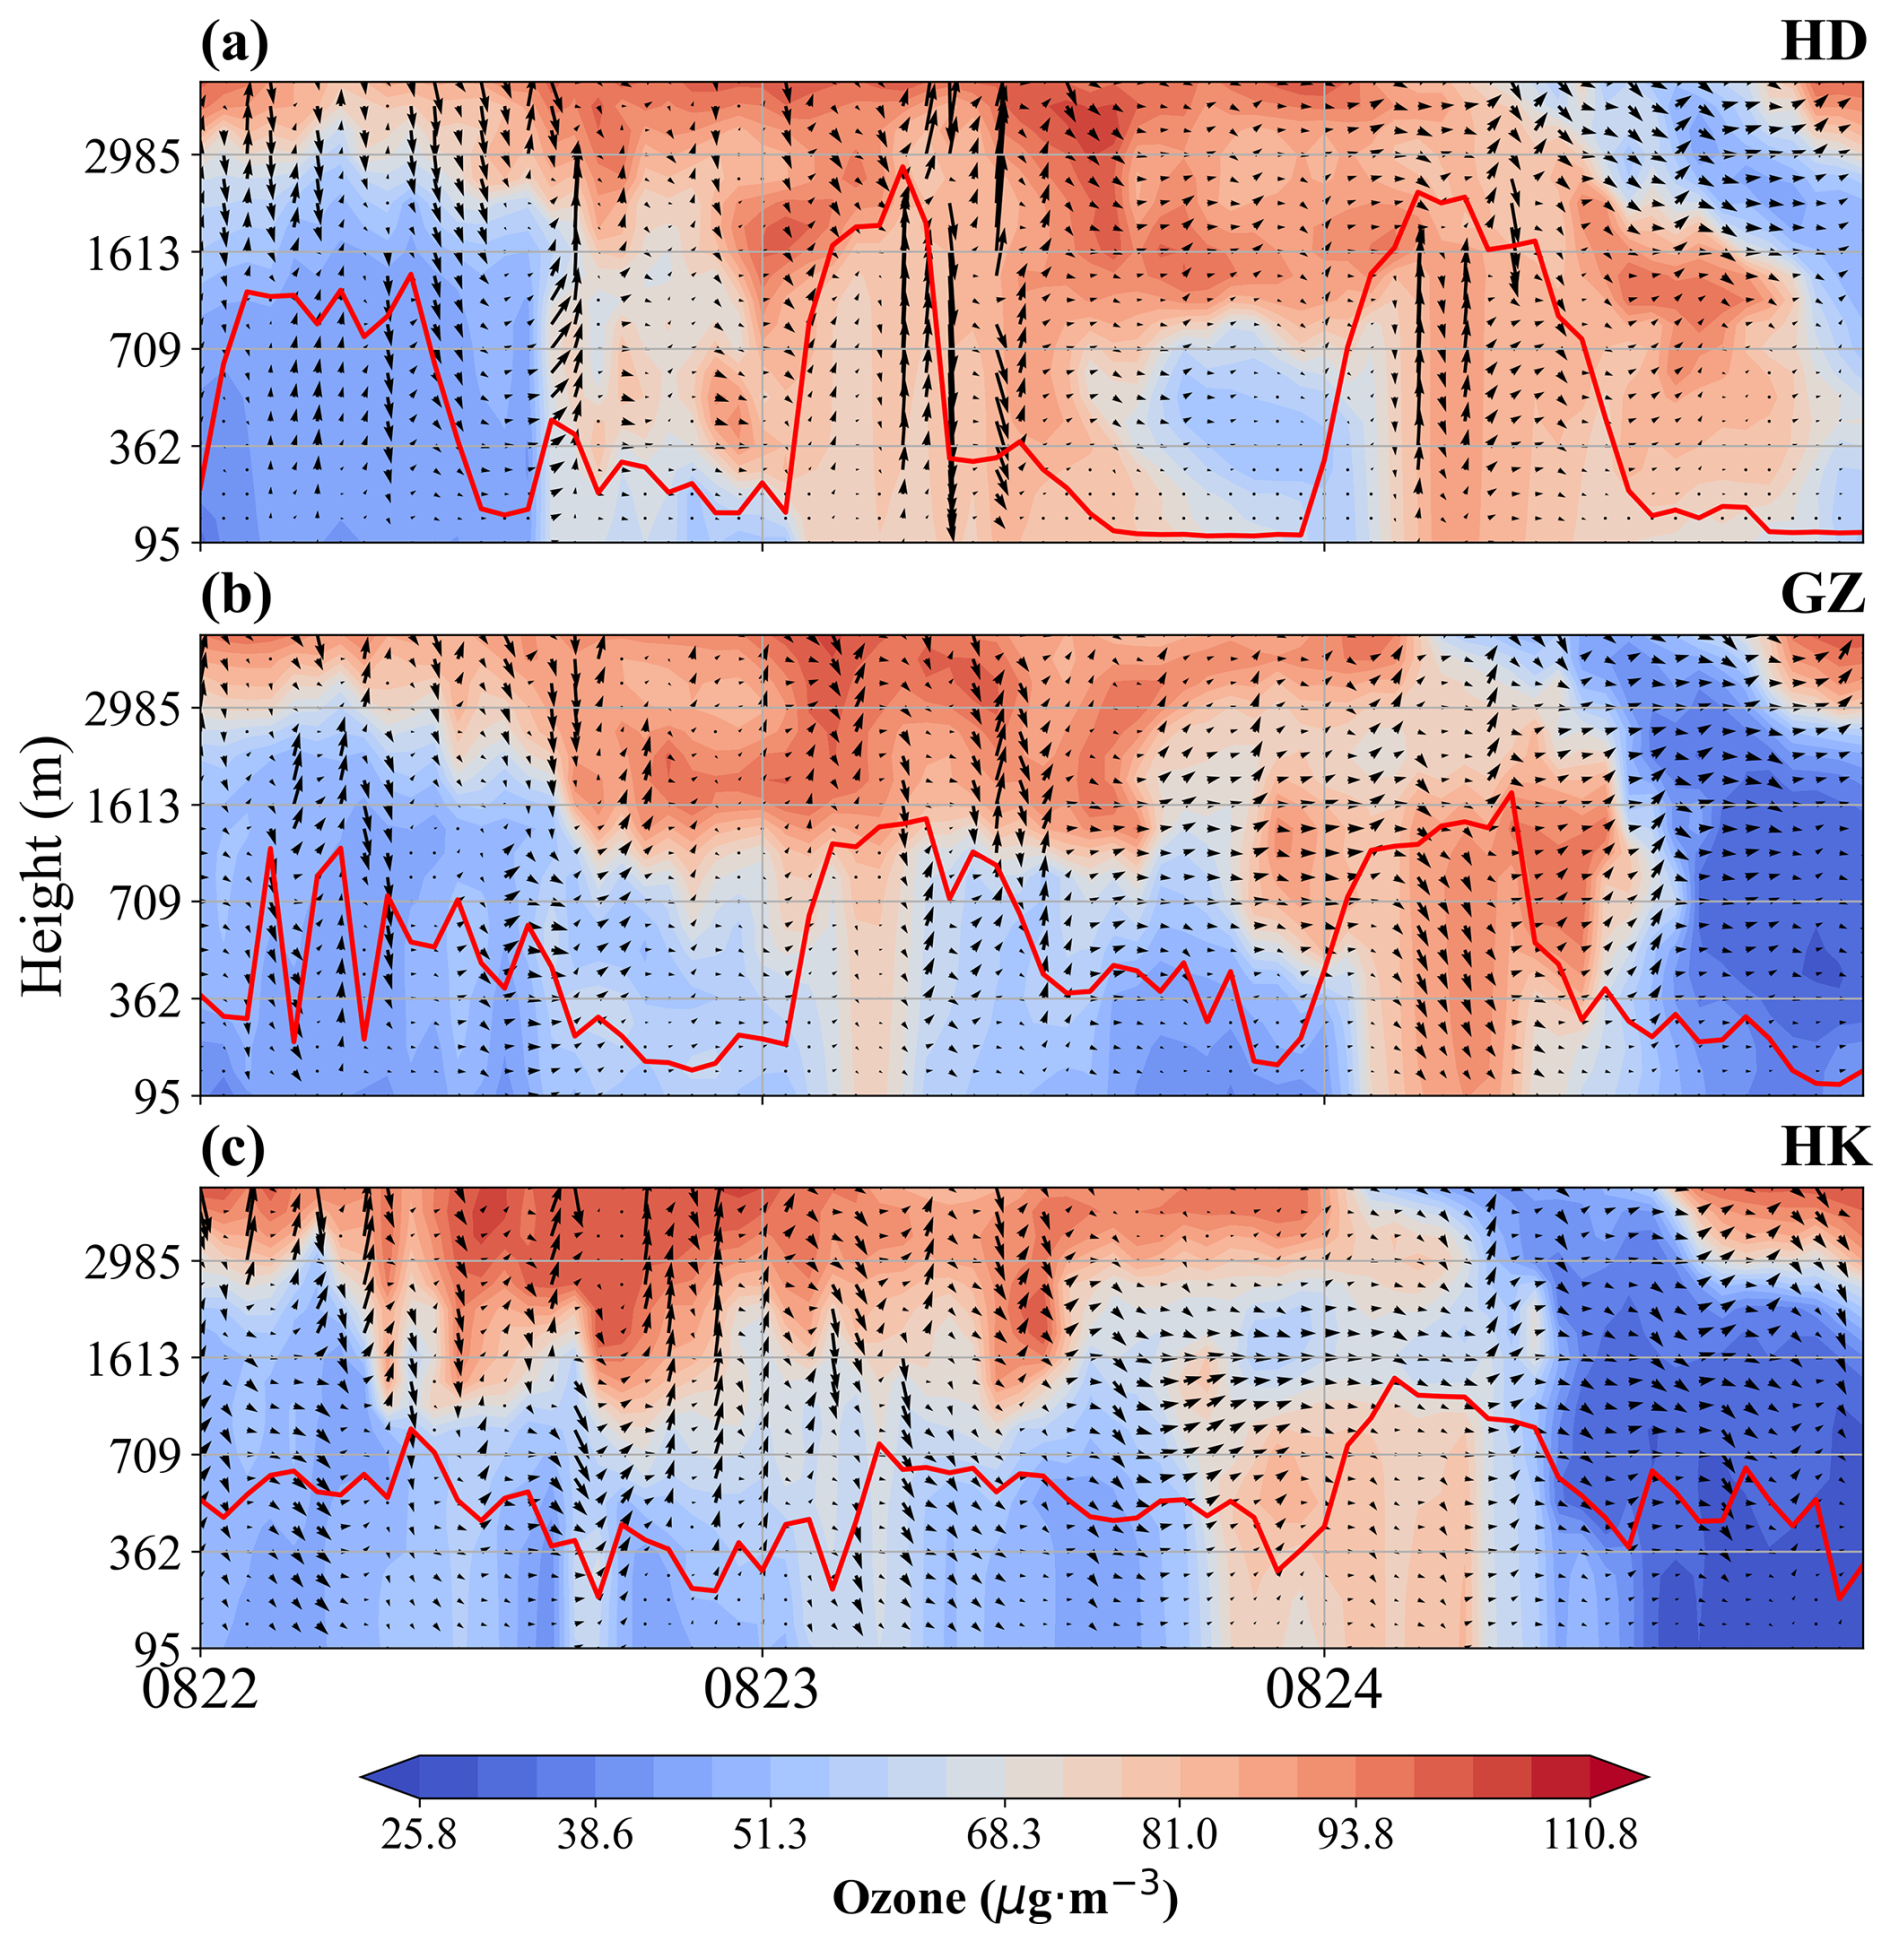
Figure 11The figure displays time series of the simulated ozone and wind profile between 00:00 LT on 22 August and 00:00 LT on 25 August at three sites (Huadu, Guangzhou and Hong Kong). The vertical wind speed has been amplified by a factor of 10 to enhance clarity. In the figure, the red line indicates the height of the boundary layer.
3.3.2 Entrainment and vertical mixing in the boundary layer
The convergence and divergence of the horizontal wind influences the vertical wind speed. Updrafts (convergence) can transport heat and O3 from the lower layers to higher layers, while downdrafts (divergence) are the opposite. Figure 12 shows the vertical wind at the HD station, the GZ station and the HK station during the period under study. From 22 to 23 August (about 1000–2000 km away from the GBA), all three stations had strong downdrafts within the boundary layer, especially during the O3 peak. However, on 24 August (14:00 LT, 767 km from the GBA), updrafts appeared at the HD station (Fig. 12a), which transported O3 upward. At the GZ and HK stations, there were still strong downslopes within 3 km (Fig. 12b–c). On 24–25 August, differences in RI in GZ indicated that the concentration of O3 within the boundary layer was significantly influenced by local convergence effects, resulting in the accumulation of O3 near the surface. This phenomenon may be attributed to the topography and level of urbanization in GZ, which led to reduced wind speeds within the boundary layer, thus limiting the vertical mixing of O3. These combined topographic and urban effects weakened the ventilation capacity of the boundary layer, thus promoting the retention and accumulation of pollutants near the surface. However, Hong Kong exhibited smaller wind speeds along with nearly identical vertical wind speeds inside and outside the boundary layer, suggesting a more uniform dynamic structure that facilitated stronger vertical mixing of O3. In this case, O3 transported horizontally from the upstream could be effectively carried to the surface.
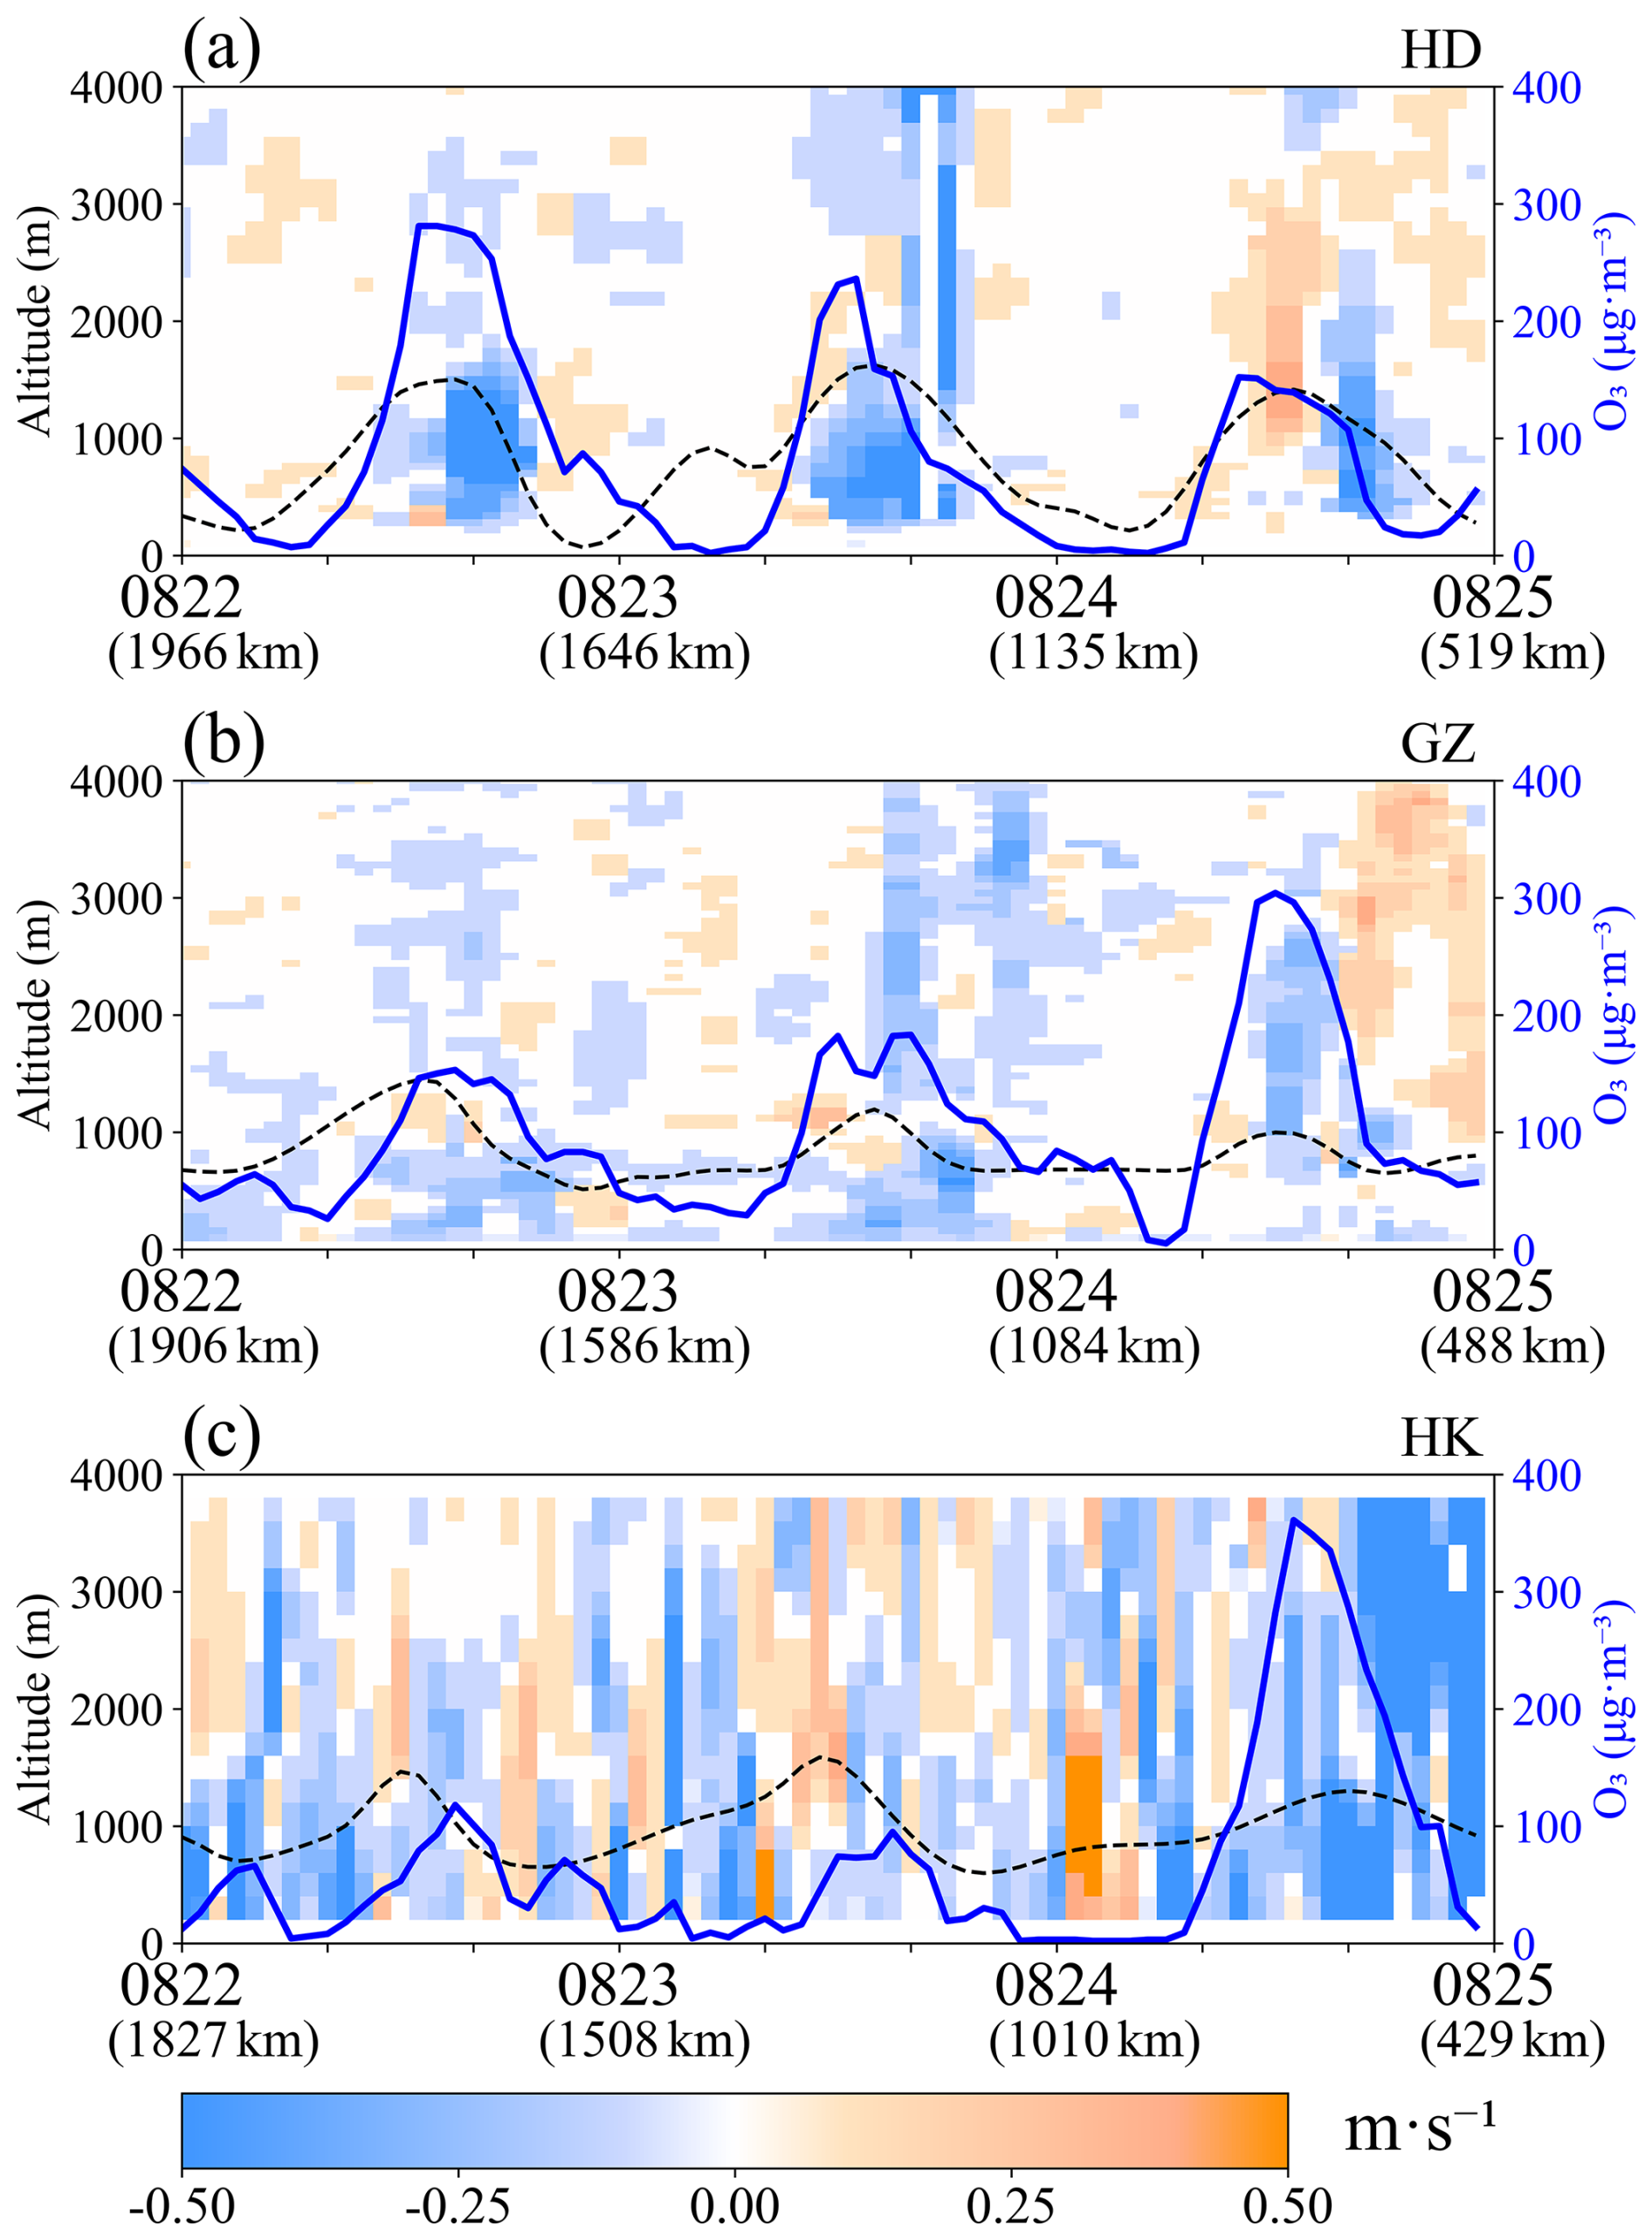
Figure 12Vertical wind speed (color filled) was measured by wind profile radar at the (a) HD, (b) GZ, and (c) HK stations from 22 to 25 August. The black dashed and blue lines represent the height of the boundary layer and the concentration of O3, respectively. The distance in brackets below the date on the x-axis represents the distance from TC Bailu to the wind profile radars at that time.
On the other hand, VWS can improve the vertical mixing of O3 in the boundary layer by transporting ozone from altitude to the surface, thus modifying its vertical structure (Zhang et al.,2020). As shown in Fig. 13, on 22 August (15:00 LT, about 1600–1800 km away from the GBA), the VWS centers were visible around 1.5 and 2.5 km, with a maximum of 70 m s−1 at the GZ station. On 23 August (15:00 LT, about 1000–1300 km from the GBA), the HD station had a more consistent wind direction in the upper part of the boundary layer (Fig. 9a) and the VWS was relatively small (Fig. 13a). However, the wind direction was more complex at the GZ and HK stations in the upper part of the boundary layer (Fig. 9b–c), leading to an increase in VWS with values around 7 m s−1 within the boundary layer (Fig. 13b–c). On 24 August (15:00 LT, about 600–800 km away from the GBA), obvious VWS appeared within the boundary layer at all three stations. VWS centers were most pronounced around 1 km at the HD and GZ stations. The higher height of the boundary layer at the Hong Kong station facilitated the entrainment of ozone transported from the inland above the boundary layer (Li et al., 2025), which was then brought to the near-surface by vertical wind shear.
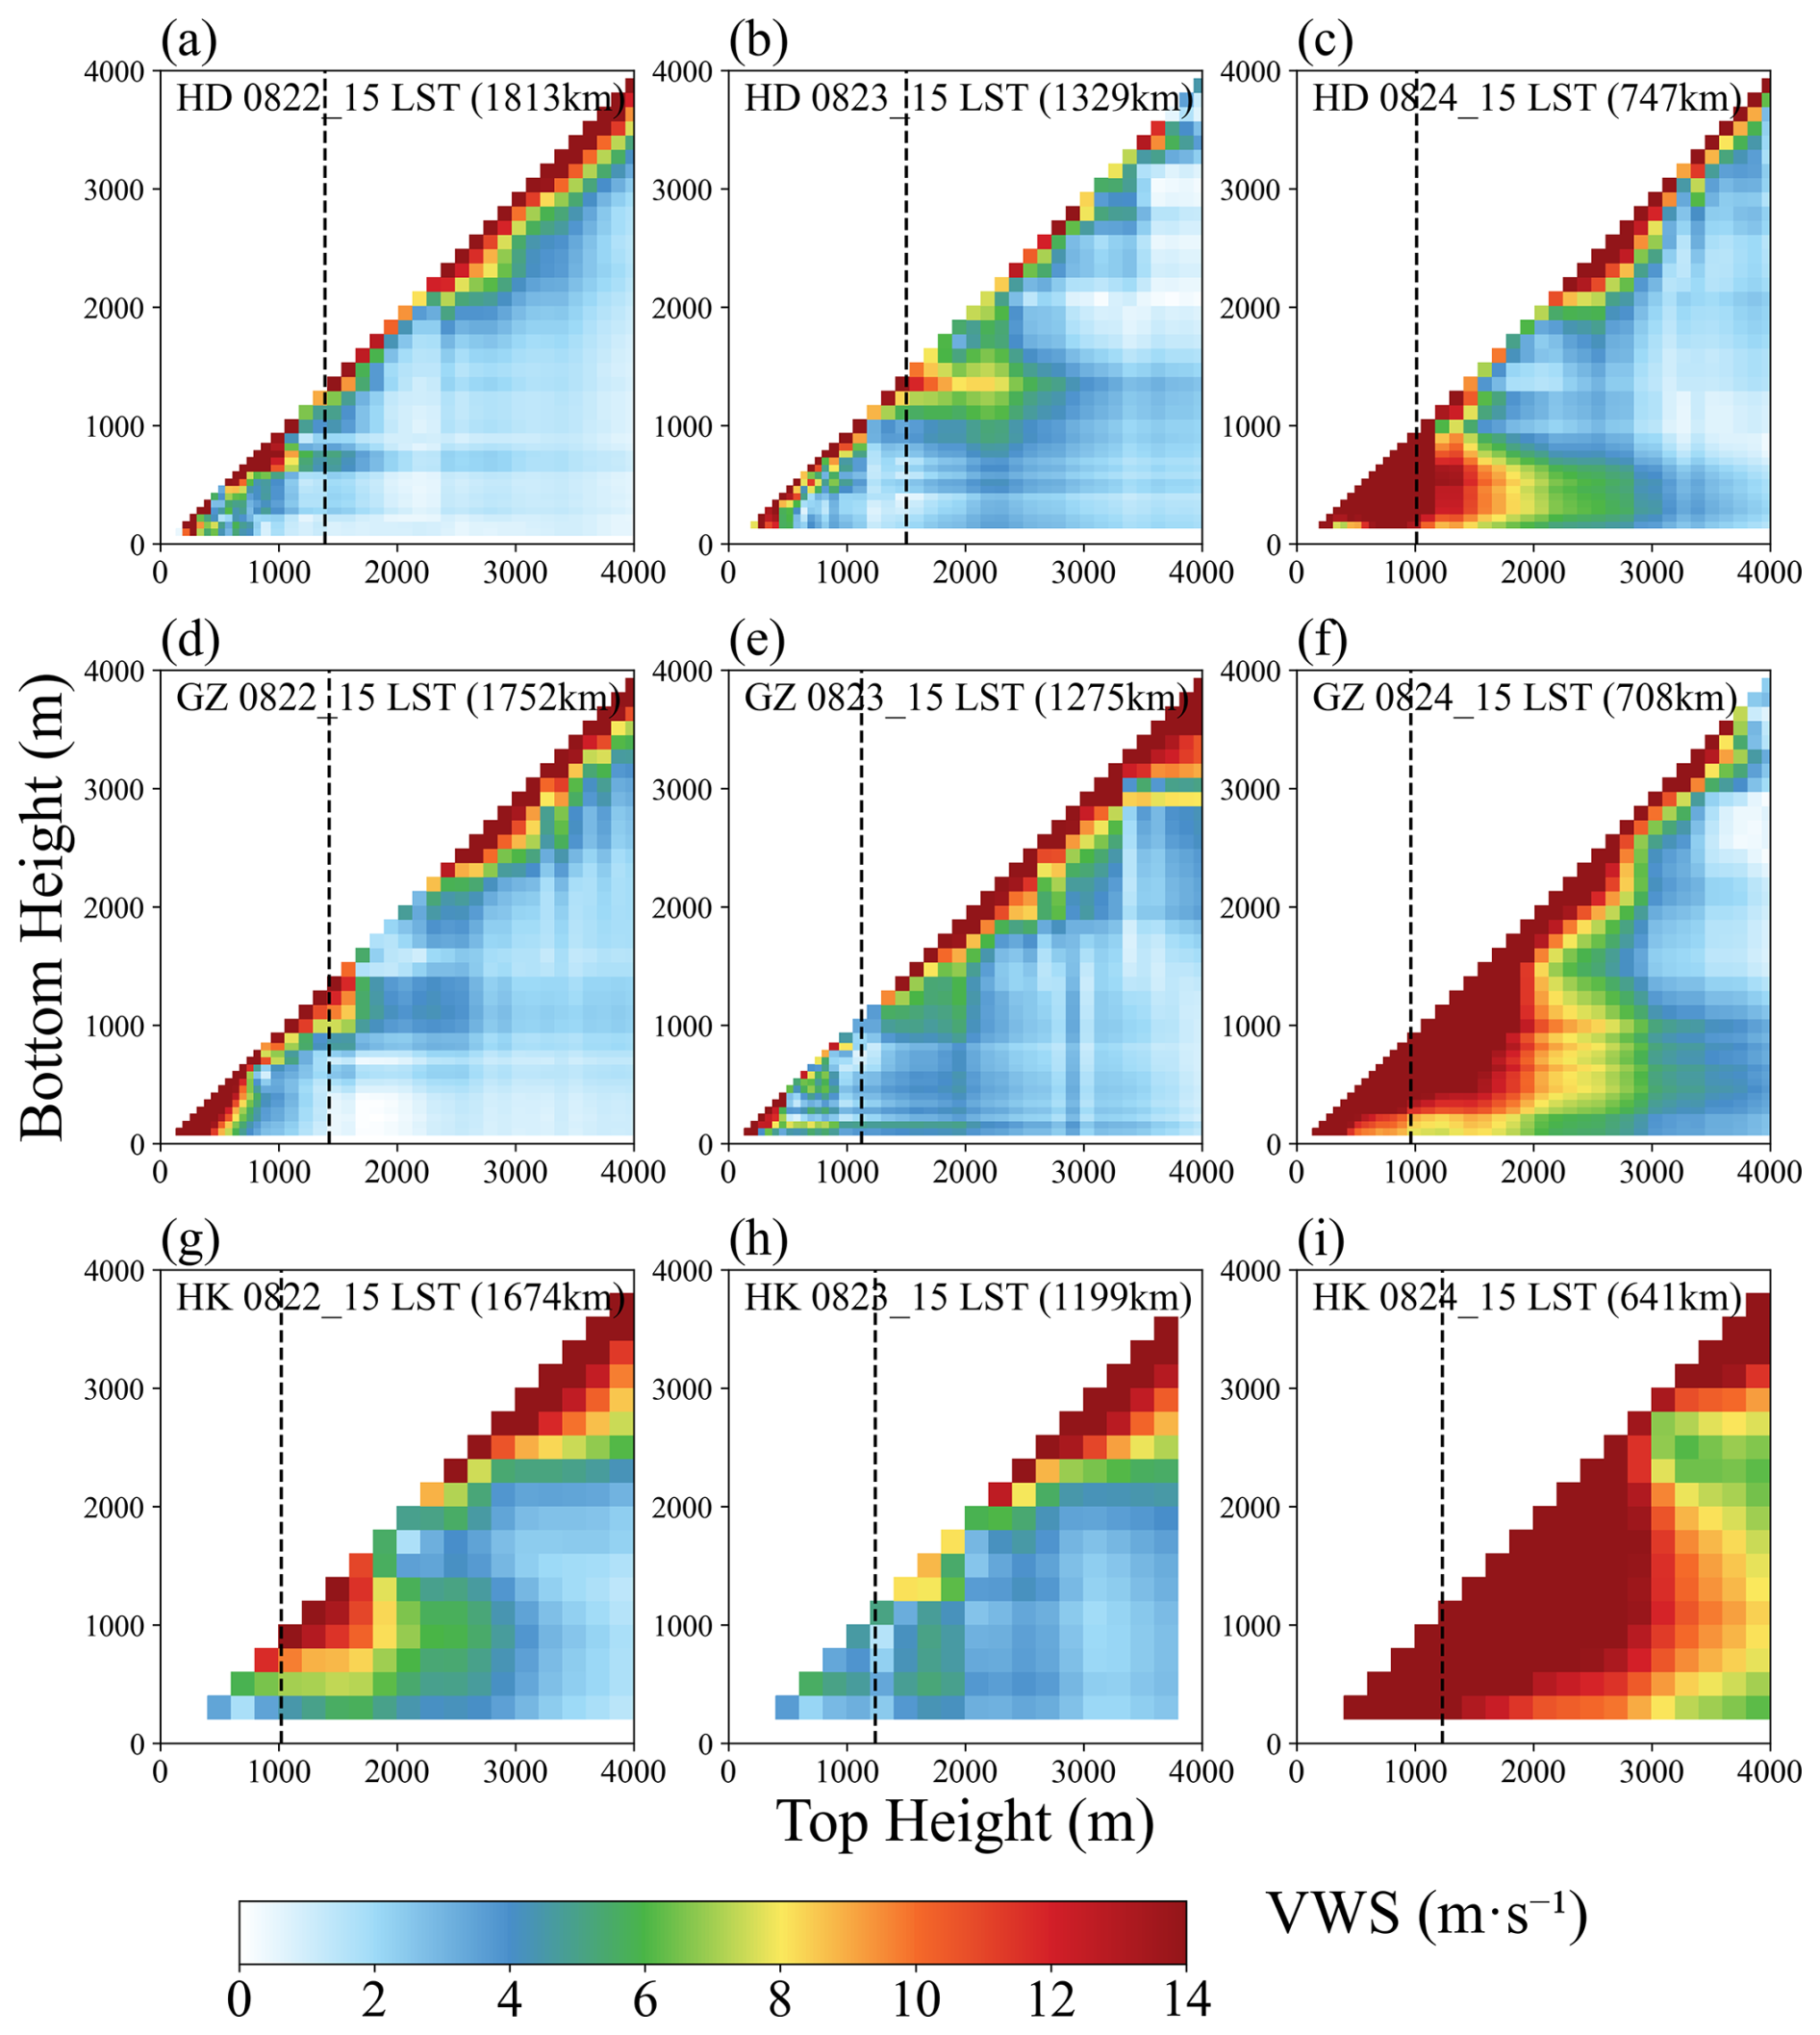
Figure 13Vertical Wind Shear (VWS) from 22 to 24 August at (a–c) HD station, (d–f) GZ station, and (g–i) HK station. The black dashed line represents the height of the boundary layer. The distance in character brackets at the top left of the subplot indicated the distance from TC Bailu to the wind profile radars at that moment.
In this study, we extracted the advection term (advh) for ozone, the vertical transport term (advz), and the turbulent mixing term (vmix) from the WRF-Chem model, and set all negative contributions of ozone formation within the Pearl River Delta region to zero, considering only positive contributions. According to Eq. (9):
where represents the sum of positive contributions from a specific process among the three processes within the Pearl River Delta region, and denotes the total positive contributions from all three processes. The ratio is used to quantify the contribution of each dynamic process to ozone pollution.
Given that horizontal and vertical transport dominate while turbulent mixing plays an auxiliary role, we performed normalization on the contribution rates of the three processes to analyze their trends. We observed significant fluctuations in the contribution rates of horizontal and vertical transport between 22 August and 20:00 LT on 23 August. From 20:00 LT on 20 August to 04:00 LT on 25 August, vertical transport strengthened and stabilized, while horizontal transport weakened and stabilized. Between 04:00 and 20:00 LT on 25 August, the contribution rate of turbulent mixing increased dramatically (by over 34.15 %), accompanied by a sharp decline in vertical transport contributions and a significant increase in horizontal transport contributions. By 20:00 LT on 25 August, turbulent mixing contributions stabilized, while vertical transport contributions gradually increased and horizontal transport contributions decreased.
We calculated the average contribution rates of the three processes during three key stages (horizontal and vertical transport dominance period, enhanced vertical transport period, and enhanced turbulent mixing period), as shown in the table below.
We selected the areas of Huadu, Guangzhou, and Hong Kong as representative centers for the Pearl River Delta region and analyzed the relationship between typhoon distance from the regional center and its contribution rate. The results show that the influence of the typhoon on the region exhibits a significant distance dependence: there is a certain correlation between the contribution rate and the inverse of the distance. The specific fitting formulas are as follows:
Of particular note is the significant inverse relationship between the turbulent mixing contribution and the typhoon distance from the regional center (Table 4 and Fig. 14). When the typhoon is far from the Pearl River Delta, its contribution to turbulent mixing is relatively low; as the typhoon approaches the region, the contribution rate increases gradually. However, when the typhoon is near the region, the growth rate of the contribution rate significantly accelerates, indicating that turbulent mixing has a more pronounced effect on the Pearl River Delta when the typhoon is at close range.
Table 4Contribution rates of three transport processes averaged over three key periods.
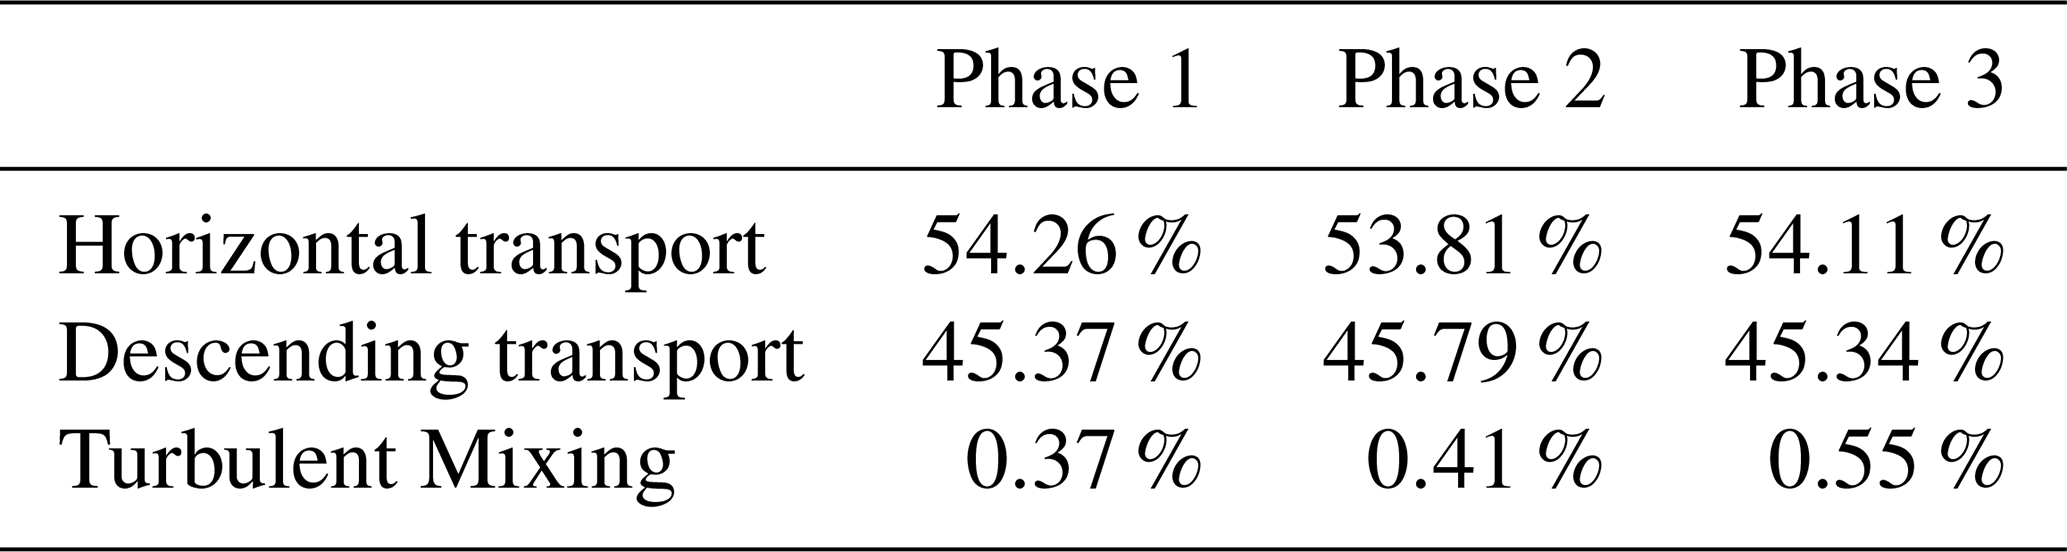
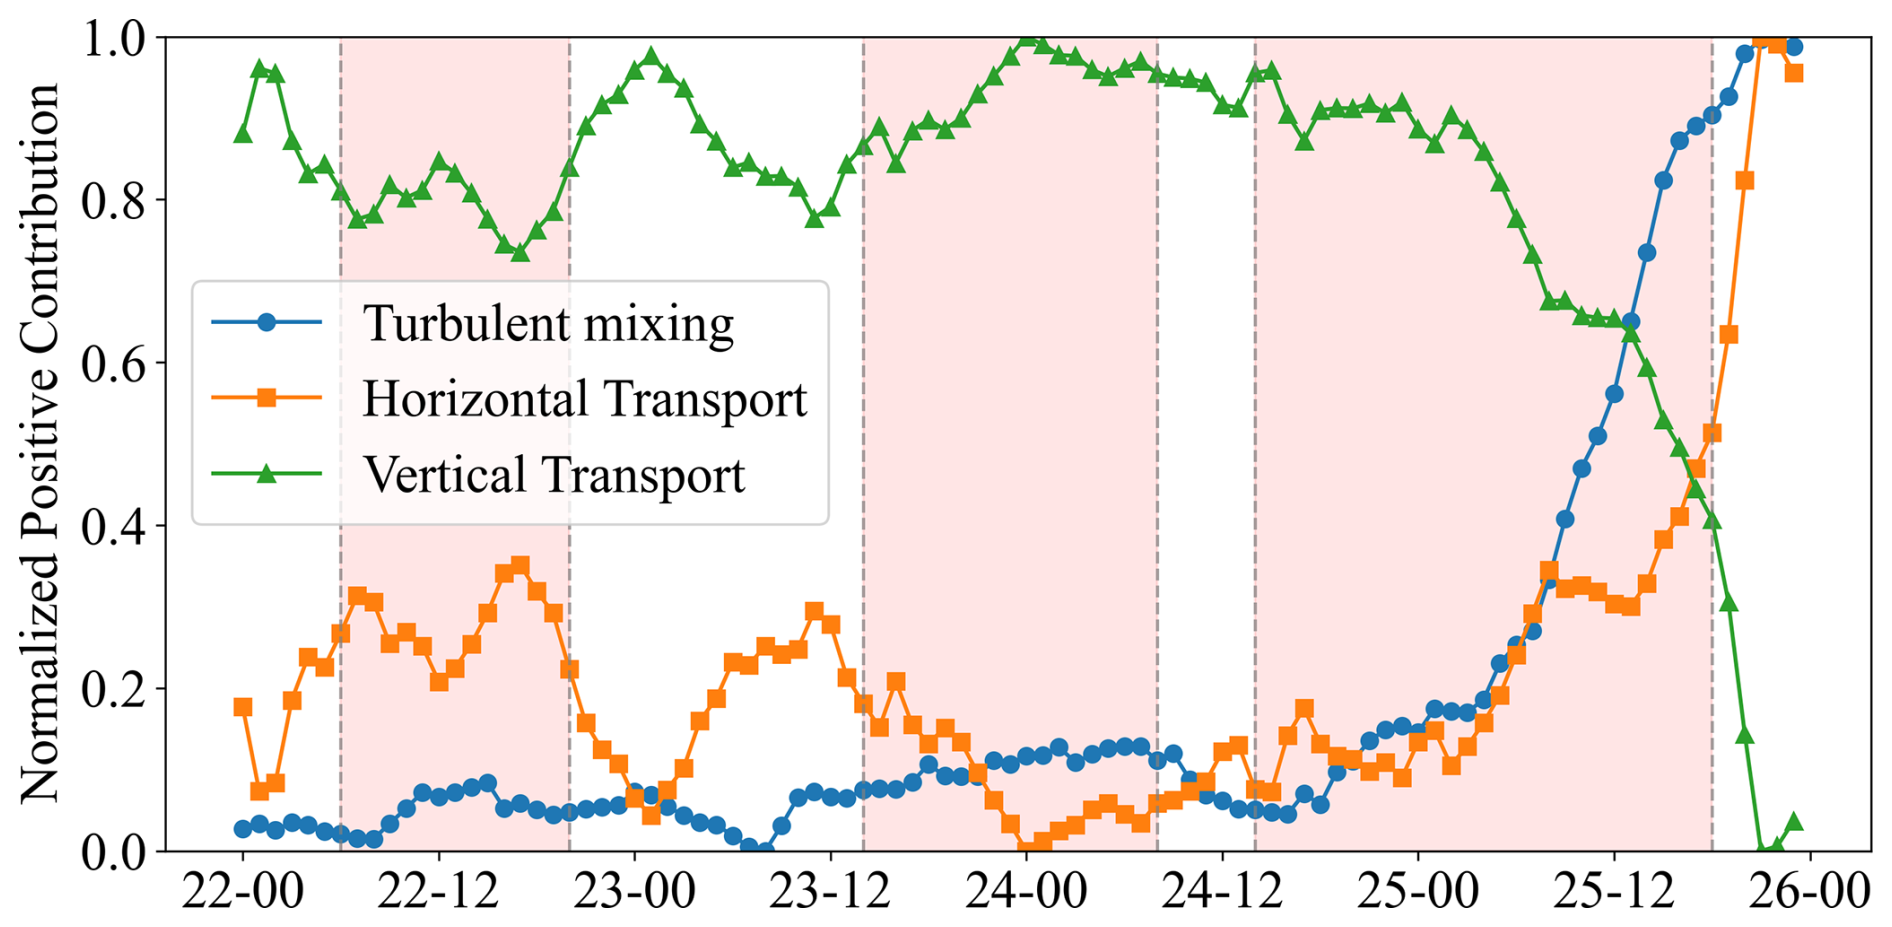
Figure 14This normalized time series shows the contributions of three dynamical processes (horizontal transport, vertical transport, and turbulent mixing) to ozone pollution in the Pearl River Delta region. The dashed lines divide the processes into three distinct periods: a period dominated by horizontal and descending transport (Period I), a period with enhanced descending transport (Period II), and a period characterized by increased turbulent mixing (Period III).
3.3.3 A schematic diagram of 3-D ozone transport affected by TCs
This study dynamically revealed how the peripheral circulation of TC changed the higher concentration of O3 in the GBA region. There were three main phases. The first phase was dominated by the downdrafts. When TC was closed enough (around 1800–2000 km), the GBA was primarily controlled by horizontal and descending airflow (Fig. 15a), horizontal airflow transported inland O3 towards coastal areas. The second phase involved the descent of airflow. As TC approached (approximately 1000–1800 km), subsidence in the PBL facilitated downward transport of upper-layer O3 into the PBL. This caused reduced surface O3 concentrations in the inland regions due to horizontal dispersion, weakening positive contributions. Furthermore, the change in the direction of the surface wind then caused O3 to recirculate and accumulate near the surface, especially for coastal areas (Fig. 15b). The third phase demonstrated vertical mixing. As the TC moved near Taiwan (less than 800 km), the horizontal transport of O3 began to strengthen. Furthermore, entrainment and strong vertical mixing led to an increase in O3 concentration at the surface (Fig. 15c). Li et al. (2022) also found that airflow in the periphery of TC can enhance the vertical mixing of O3. Our results confirmed this statement and provide the first observational evidence for a complete picture of the transport of O3 pollution due to TCs within the boundary layer. In addition, studies have demonstrated that chemical processes also play a significant role in variations in ozone concentration. These include biogenic volatile organic compounds (BVOCs) that serve as precursors for ozone formation, elevated temperatures, enhanced solar radiation, and increased relative humidity in the peripheral regions of typhoons, creating favorable conditions for ozone production. Furthermore, the interaction between anthropogenic and biogenic sources can accelerate ozone formation (Wang et al., 2022). Although these processes have been systematically examined in the existing literature, the present study focuses primarily on the dynamic processes of ozone transport during typhoon events. We intend to further explore the underlying mechanisms in subsequent research.
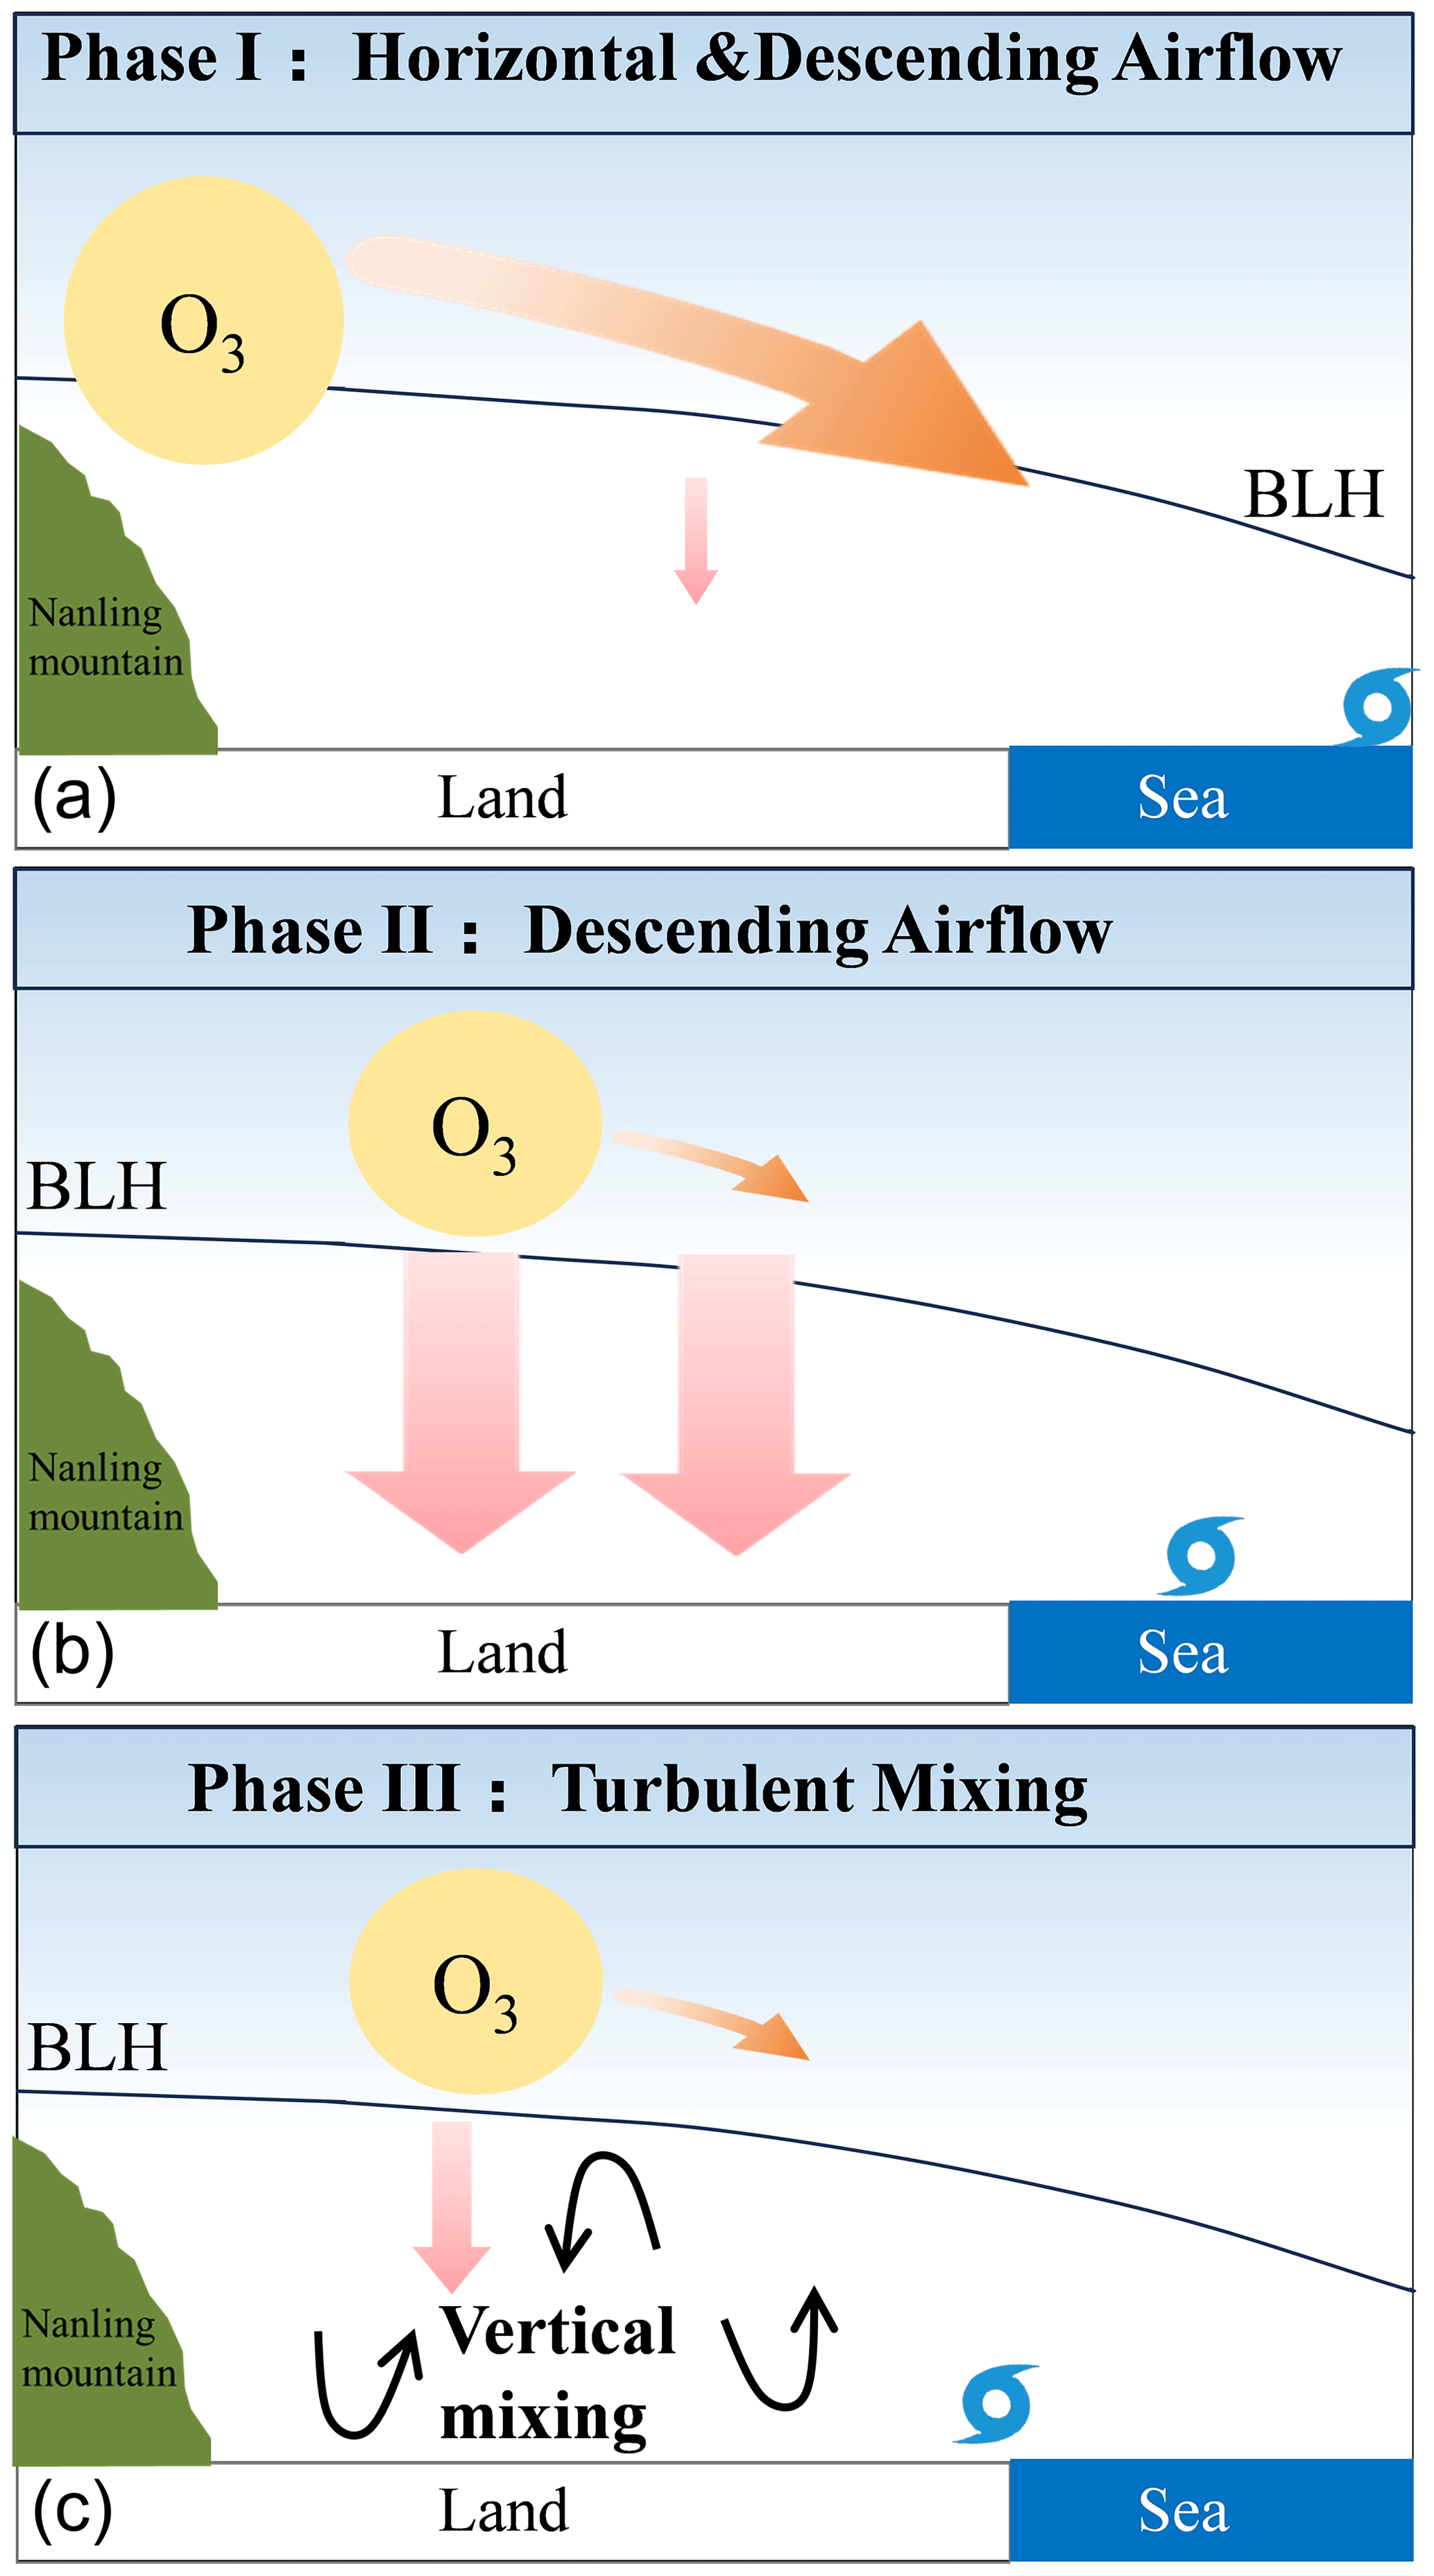
Figure 15A schematic diagram illustrating the dynamic response of airflow and O3 within the height of the boundary layer height (BLH) of the GBA to the approaching tropical cyclone (TC). (a) Phase I: Horizontal & Downdraft Control – the pink arrows represent the downdraft airflow from the periphery of the TC, the orange arrows indicate the northeasterly winds that transport O3 horizontally across the GBA. (b) Phase II: Descending Airflow. (c) Phase III: Vertical Mixing – the black arrows depict the vertical mixing of air and O3 within the boundary layer.
O3 pollution in the GBA is closely related to TC. However, the characteristics of the winds of the boundary layer influenced by the peripheral circulation of TCs and their impacts on the spatial variations in O3 remain unclear. This study comprehensively examined this problem using vertical observations from the wind profile radar combined with surface O3 and meteorological observations. The main findings are summarized below.
TC activity is responsible for 39.9 % of O3 pollution days in the GBA. With TCs, the spatial evolution of O3 pollution is marked by its transport from inland cities to coastal cities. The transport process can be roughly divided into three phases, depending on the dominant factors (downdrafts, horizontal wind, and vertical mixing):
-
When TC was closed enough (about 1800–2000 km), the GBA was primarily controlled by horizontal and descending airflow, horizontal airflow transported inland O3 towards coastal areas.
-
As TC approached (about 1000–1800 km), the subsidence of the planetary boundary layer (PBL. improved the downward transport of upper-level O3 into the PBL. This process led to a decrease in surface O3 concentrations in inland areas due to horizontal dispersion, weakening positive contributions to surface O3 levels.
-
As TC moved near Taiwan (less than 800 km), the horizontal transport of O3 increased. simultaneously, vertical wind shear increased significantly, capturing O3 in the boundary layer and improving mixing, causing O3 pollution to move to coastal areas.
Our work provides the first observational evidence of O3 pollution in the GBA affected by the peripheral circulation of TC, presenting a three-dimensional perspective of O3 transport in the boundary layer. These results can be applied to other regions susceptible to TC and contribute to local O3 pollution prevention strategies. However, we acknowledge insufficient research on the other two typical TC paths (northwest track and recurving track). Future studies should conduct more in-depth analyses of these paths to fully understand the impact of different TC tracks on O3 pollution.
All the data used in this paper are publicly available. The datasets that are analyzed and used to support the findings of this study are available in public domain. Hourly meteorological data and wind profile radar data can be obtained from the National Meteorological Information Center of the China Meteorological Administration (CMA, http://data.cma.cn/). The HK station meteorological data was obtained from the Hong Kong Observatory (https://www.hko.gov.hk/). The hourly NO2, O3 and CO concentrations at ground level for the HD and GZ stations are obtained from the National Environmental Monitoring Center's national urban air quality platform (https://air.cnemc.cn:18007/), while data for the HK station were obtained from the Hong Kong Environmental Protection Department's Environmental Protection Interactive Center (https://cd.epic.epd.gov.hk/EPICDI/air/station/). The CMA released the best tropical cyclone track data set (https://tcdata.typhoon.org.cn/).
YY: Conceptualization, Methodology, Investigation, Formal Analysis, Writing-Original Draft, Writing – Review & Editing, Supervision, Project Administration; CQ: Investigation Data Curation, Simulation, Visualization. MZ: Investigation, Resources. CZ: Investigation, Software. ZL: Investigation, Resources. XB: Investigation, Resources; PC: Writing – Review & Editing; GM: Methodology, Writing – Review & Editing; SL: Methodology, Writing – Review & Editing.
At least one of the (co-)authors is a member of the editorial board of Atmospheric Measurement Techniques. The peer-review process was guided by an independent editor, and the authors also have no other competing interests to declare.
Publisher's note: Copernicus Publications remains neutral with regard to jurisdictional claims made in the text, published maps, institutional affiliations, or any other geographical representation in this paper. The authors bear the ultimate responsibility for providing appropriate place names. Views expressed in the text are those of the authors and do not necessarily reflect the views of the publisher.
We acknowledge the High-Performance Computing Center of Nanjing University of Information Science & Technology for supporting this work.
This research was supported by a State Key Laboratory of Resources and Environmental Information System grant. The authors appreciate the Hong Kong Observatory for providing the essential data used in this research.
This research has been supported by the National Natural Science Foundation of China (grant nos. 42175098, 42521006 and 42222503) and a State Key Laboratory of Resources and Environmental Information System grant.
This paper was edited by Haichao Wang and reviewed by three anonymous referees.
Angevine, W. M., White, A. B., and Avery, S. K.: Boundary-layer depth and entrainment zone characterization with a boundary-layer profiler, Boundary Layer Meteorology, 68, 375–385, https://doi.org/10.1007/BF00706797, 1994.
Brunet, J. P., Tamayo, P., Golub, T. R., and Mesirov, J. P.: Metagenes and molecular pattern discovery using matrix factorization, Proceedings of the National Academy of Sciences of the United States of America, 101, 4164–4169, https://doi.org/10.1073/pnas.0308531101, 2004.
Chen, X., Feng, X., Fan, S., and Liu, J.: Application of recirculation index in air quality research, Acta Scientiae Circumstantiae, 36, https://doi.org/10.13671/j.hjkxxb.2015.0517, 2016.
Chen, Z., Liu, J., Cheng, X., Yang, M., and Wang, H.: Positive and negative influences of typhoons on tropospheric ozone over southern China, Atmos. Chem. Phys., 21, 16911–16923, https://doi.org/10.5194/acp-21-16911-2021, 2021.
Chen, Z., Liu, J., Qie, X., Cheng, X., Shen, Y., Yang, M., Jiang, R., and Liu, X.: Transport of substantial stratospheric ozone to the surface by a dying typhoon and shallow convection, Atmos. Chem. Phys., 22, 8221–8240, https://doi.org/10.5194/acp-22-8221-2022, 2022.
Chow, E. C. H., Li, R. C. Y., and Zhou, W.: Influence of Tropical Cyclones on Hong Kong Air Quality, Advances in Atmospheric Sciences, 35, 1177–1188, https://doi.org/10.1007/s00376-018-7225-4, 2018.
Das, S. S., Ratnam, M. V., Uma, K. N., Subrahmanyam, K. V., Girach, I. A., Patra, A. K., Aneesh, S., Suneeth, K. V., Kumar, K. K., Kesarkar, A. P., Sijikumar, S., and Ramkumar, G.: Influence of tropical cyclones on tropospheric ozone: possible implications, Atmos. Chem. Phys., 16, 4837–4847, https://doi.org/10.5194/acp-16-4837-2016, 2016.
Deng, T., Wang, T., Wang, S., Zou, Y., Yin, C., Li, F., Liu, L., Wang, N., Song, L., Wu, C., and Wu, D.: Impact of typhoon periphery on high ozone and high aerosol pollution in the Pearl River Delta region, Sci. Total Environ., 668, 617–630, https://doi.org/10.1016/j.scitotenv.2019.02.450, 2019.
Feng, Z., De Marco, A., Anav, A., Gualtieri, M., Sicard, P., Tian, H., Fornasier, F., Tao, F., Guo, A., and Paoletti, E.: Economic losses due to ozone impacts on human health, forest productivity and crop yield across China, Environment International, 131, 104966, https://doi.org/10.1016/j.envint.2019.104966, 2019.
Geng, G., Liu, Y., Liu, Y., Liu, S., Cheng, J., Yan, L., Wu, N., Hu, H., Tong, D., Zheng, B., Yin, Z., He, K., and Zhang, Q.: Efficacy of China's clean air actions to tackle PM2.5 pollution between 2013 and 2020, Nature Geoscience, 17, 987–994, https://doi.org/10.1038/s41561-024-01540-z, 2024.
Guo, J., Miao, Y., Zhang, Y., Liu, H., Li, Z., Zhang, W., He, J., Lou, M., Yan, Y., Bian, L., and Zhai, P.: The climatology of planetary boundary layer height in China derived from radiosonde and reanalysis data, Atmos. Chem. Phys., 16, 13309–13319, https://doi.org/10.5194/acp-16-13309-2016, 2016.
Guo, J., Li, Y., Cohen, J. B., Li, J., Chen, D., Xu, H., Liu, L., Yin, J., Hu, K., and Zhai, P.: Shift in the temporal trend of boundary layer height in China using long-term (1979–2016) radiosonde data, Geophysical Research Letters, 46, 6080–6089, https://doi.org/10.1029/2019GL082666, 2019.
Huang, J. P., Fung, J. C. H., and Lau, A. K. H.: Integrated processes analysis and systematic meteorological classification of ozone episodes in Hong Kong, Journal of Geophysical Research: Atmospheres, 111, D20309, https://doi.org/10.1029/2005JD007012, 2006.
Huang, T., Yang, Y., O'Connor, E. J., Lolli, S., Haywood, J., Osborne, M., Cheng, J. C. H., Guo, J., and Yim, S. H. L.: Influence of a weak typhoon on the vertical distribution of air pollution in Hong Kong: A perspective from a Doppler LiDAR network, Environmental Pollution, 276, 116534, https://doi.org/10.1016/j.envpol.2021.116534, 2021.
Itahashi, S.: Severe level of photochemical oxidants (Ox) over the western coast of Japan during autumn after typhoon passing, Sci. Rep., 13, 16369, https://doi.org/10.1038/s41598-023-43485-0, 2023.
Jiang, D., Wang, C., Wu, D. D., Huang, X. J., Tan, H., Li, F., and Deng, T.: Diurnal variation of atmospheric boundary layer over Wushan station, Guangzhou using wind profiler radar, Journal of Tropical Meteorology, 29, 129–135, https://doi.org/10.3969/j.issn.1004-4965.2013.01.016, 2013.
Jiang, Y. C., Zhao, T. L., Liu, J., Xu, X. D., Tan, C. H., Cheng, X. H., Bi, X. Y., Gan, J. B., You, J. F., and Zhao, S. Z.: Why does surface ozone peak before a typhoon landing in southeast China?, Atmos. Chem. Phys., 15, 13331–13338, https://doi.org/10.5194/acp-15-13331-2015, 2015.
Lam, Y. F., Cheung, H. M., and Ying, C. C.: Impact of tropical cyclone track change on regional air quality, Sci. Total Environ., 610–611, 1347–1355, https://doi.org/10.1016/j.scitotenv.2017.08.100, 2018.
Lee, D. D. and Seung, H. S.: Learning the parts of objects by non-negative matrix factorization, Nature, 401, 788–791, https://doi.org/10.1038/44565, 1999.
Li, D., Vogel, B., Müller, R., Bian, J., Günther, G., Ploeger, F., Li, Q., Zhang, J., Bai, Z., Vömel, H., and Riese, M.: Dehydration and low ozone in the tropopause layer over the Asian monsoon caused by tropical cyclones: Lagrangian transport calculations using ERA-Interim and ERA5 reanalysis data, Atmos. Chem. Phys., 20, 4133–4152, https://doi.org/10.5194/acp-20-4133-2020, 2020.
Li, D., Vogel, B., Müller, R., Bian, J., Günther, G., and Riese, M.: Tropical cyclones reduce ozone in the tropopause region over the western Pacific: An analysis of 18 years ozonesonde profiles, Earth's Future, 9, e2020EF001635, https://doi.org/10.1029/2020EF001635, 2021.
Li, K., Jacob, D. J., Liao, H., Zhu, J., Shah, V., Shen, L., Bates, K. H., Zhang, Q., and Zhai, S.: A two-pollutant strategy for improving ozone and particulate air quality in China, Nature Geoscience, 12, 906–910, https://doi.org/10.1038/s41561-019-0464-x, 2019.
Li, M., Song, Y., Mao, Z., Liu, M., and Huang, X.: Impacts of thermal circulations induced by urbanization on ozone formation in the Pearl River Delta region, China, Atmospheric Environment, 127, 382–392, https://doi.org/10.1016/j.atmosenv.2015.10.075, 2015.
Li, M., Liu, H., Geng, G., Hong, C., Liu, F., Song, Y., Tong, D., Zheng, B., Cui, H., Man, H., Zhang, Q., and He, K.: Anthropogenic emission inventories in China: a review, National Science Review, 4, 834–866, https://doi.org/10.1093/nsr/nwx150, 2017.
Li, N., Liang, J., Liu, W., Gu, C., Li, J., Xu, Y., Tang, K., Liao, H., and Hu, J.: Mechanisms of high-temperature ozone suppression in Eastern China: a meteorological perspective, Environmental Research Letters, 20, 094001, https://doi.org/10.1088/1748-9326/adf1ba, 2025.
Li, Y., Zhao, X., Deng, X., and Gao, J.: The impact of peripheral circulation characteristics of typhoon on sustained ozone episodes over the Pearl River Delta region, China, Atmos. Chem. Phys., 22, 3861–3873, https://doi.org/10.5194/acp-22-3861-2022, 2022.
Lichiheb, N., Ngan, F., and Cohen, M.: Improving the atmospheric dispersion forecasts over Washington, D.C. using UrbanNet observations: A study with HYSPLIT model, Urban Climate, 55, 101948, https://doi.org/10.1016/j.uclim.2024.101948, 2024.
Lin, H., Ding, K., Huang, X., Lou, S., Xue, L., Wang, Z., Ma, Y., and Ding, A.: Impacts of Northward Typhoons on Autumn Haze Pollution Over North China Plain, Journal of Geophysical Research: Atmospheres, 129, e2023JD040465, https://doi.org/10.1029/2023JD040465, 2024.
Liu, B., Guo, J., Gong, W., Shi, L., Zhang, Y., and Ma, Y.: Characteristics and performance of wind profiles as observed by the radar wind profiler network of China, Atmos. Meas. Tech., 13, 4589–4600, https://doi.org/10.5194/amt-13-4589-2020, 2020.
Liu, Y. and Wang, T.: Worsening urban ozone pollution in China from 2013 to 2017 – Part 2: The effects of emission changes and implications for multi-pollutant control, Atmos. Chem. Phys., 20, 6323–6337, https://doi.org/10.5194/acp-20-6323-2020, 2020.
Lolli, S., Khor, W. Y., Matjafri, M. Z., and Lim, H. S.: Monsoon season quantitative assessment of biomass burning clear-sky aerosol radiative effect at surface by ground-based lidar observations in Pulau Pinang, Malaysia in 2014, Remote Sensing, 11, 2660, https://doi.org/10.3390/rs11222660, 2019.
Lu, X., Yu, H., Ying, M., Zhao, B., Zhang, S., Lin, L., Bai, L., and Wan, R.: Western North Pacific Tropical Cyclone Database Created by the China Meteorological Administration, Advances in Atmospheric Sciences, 38, 690–699, https://doi.org/10.1007/s00376-020-0211-7, 2021.
Luo, C., Shang, S., Xie, Y., He, Z., Wei, G., Zhang, F., Wang, L., and Li, X.: Effects of Terrain near Taiwan Island on Typhoons with Different Tracks and Typhoon Waves, Water, 15, 3661, https://doi.org/10.3390/w15203661, 2023.
Luo, M., Hou, X., Gu, Y., Lau, N. C., and Yim, S. H. L.: Trans-boundary air pollution in a city under various atmospheric conditions, Science of the Total Environment, 618, 132–141, https://doi.org/10.1016/j.scitotenv.2017.11.001, 2018.
Malley, C. S., Braban, C. F., and Heal, M. R.: The application of hierarchical cluster analysis and non-negative matrix factorization to European atmospheric monitoring site classification, Atmospheric Research, 138, 30–40, https://doi.org/10.1016/j.atmosres.2013.10.019, 2014.
Mills, G., Sharps, K., Simpson, D., Pleijel, H., Broberg, M., Uddling, J., Jaramillo, F., Davies, W. J., Dentener, F., Van den Berg, M., Agrawal, M., Agrawal, S. B., Ainsworth, E. A., Büker, P., Emberson, L., Feng, Z., Harmens, H., Hayes, F., Kobayashi, K., Paoletti, E., and Van Dingenen, R.: Ozone pollution will compromise efforts to increase global wheat production, Global Change Biology, 24, 3560–3574, https://doi.org/10.1111/gcb.14157, 2018.
Parker, T. J., Berry, G. J., and Reeder, M. J.: The influence of tropical cyclones on heat waves in Southeastern Australia, Geophysical Research Letters, 40, 6264–6270, https://doi.org/10.1002/2013GL058257, 2013.
Shi, W., Tang, J., Chen, Y., Chen, N., Liu, Q., and Liu, T.: Study of the Boundary Layer Structure of a Landfalling Typhoon Based on the Observation from Multiple Ground-Based Doppler Wind Lidars, Remote Sensing, 13, 4810, https://doi.org/10.3390/rs13234810, 2021.
Shi, Y., Hu, F., Xiao, Z., Fan, G., and Zhang, Z.: Comparison of four different types of planetary boundary layer heights during a haze episode in Beijing, Sci. Total Environ., 711, 134928, https://doi.org/10.1016/j.scitotenv.2019.134928, 2020.
Stull, R. B.: An introduction to boundary layer meteorology, Springer Science & Business Media, 13, ISBN 978-90-277-2769-5, 2012.
Su, L., Yuan, Z., Fung, J. C. H., and Lau, A. K. H.: A comparison of HYSPLIT backward trajectories generated from two GDAS datasets, Sci. Total Environ., 506–507, 527–537, https://doi.org/10.1016/j.scitotenv.2014.11.072, 2015.
Wang, J., Wang, P., Tian, C., Gao, M., Cheng, T., and Mei, W.: Consecutive Northward Super Typhoons Induced Extreme Ozone Pollution Events in Eastern China, npj Climate and Atmospheric Science, 7, 244, https://doi.org/10.1038/s41612-024-00786-z, 2024.
Wang, N., Huang, X., Xu, J., Wang, T., Tan, Z. M., and Ding, A.: Typhoon-boosted biogenic emission aggravates cross-regional ozone pollution in China, Science Advances, 8, eabl6166, https://doi.org/10.1126/sciadv.abl6166, 2022.
Wang, Y., Wild, O., Chen, X., Wu, Q., Gao, M., Chen, H., Qi, Y., and Wang, Z.: Health impacts of long-term ozone exposure in China over 2013–2017, Environment International, 144, 106030, https://doi.org/10.1016/j.envint.2020.106030, 2020.
Wei, X., Lam, K. S., Cao, C., Li, H., and He, J.: Dynamics of the Typhoon Haitang Related High Ozone Episode over Hong Kong, Advances in Meteorology, 2016, 6089154, https://doi.org/10.1155/2016/6089154, 2016.
Wu, M., Wu, D., and Fan, S.: Meteorological condition associated with poor air quality over Pearl River Delta based on the data of radar wind profiler, Acta Scientiae Circumstantiae, 3, https://doi.org/10.13671/j.hjkxxb.2014.0896, 2015.
Xu, J., Zhou, D., Gao, J., Huang, X., Xue, L., Huo, J., Fu, Q., and Ding, A.: Biogenic emissions-related ozone enhancement in two major city clusters during a typical typhoon process, Applied Geochemistry, 152, 105634, https://doi.org/10.1016/j.apgeochem.2023.105634, 2023.
Xu, J., Zhang, Z., Zhao, X., and Zhang, J.: Synthetically impacts of the topography and typhoon periphery on the atmospheric boundary layer structure and special regional pollution pattern of O3 in North China Plain, Atmospheric Environment, 330, 120566, https://doi.org/10.1016/j.atmosenv.2024.120566, 2024.
Yang, Y., Yim, S. H. L., Haywood, J., Osborne, M., Chan, J. C. S., Zeng, Z., and Cheng, J. C. H.: Characteristics of heavy particulate matter pollution events over Hong Kong and their relationships with vertical wind profiles using high-time-resolution Doppler lidar measurements, Journal of Geophysical Research: Atmospheres, 124, 9609–9623, https://doi.org/10.1029/2019JD031140, 2019.
Yim, S. H. L., Hou, X., Guo, J., and Yang, Y.: Contribution of local emissions and transboundary air pollution to air quality in Hong Kong during El Niño-Southern Oscillation and heatwaves, Atmospheric Research, 218, 50–58, https://doi.org/10.1016/j.atmosres.2018.10.021, 2019.
Ying, M., Zhang, W., Yu, H., Lu, X., Feng, J., Fan, Y., Zhu, Y., and Chen, D.: An overview of the China Meteorological Administration tropical cyclone database, Journal of Atmospheric and Oceanic Technology, 31, 287–301, https://doi.org/10.1175/JTECH-D-12-00119.1, 2014.
Zeng, L., Wu, Z., Fan, S., Zheng, J., Qi, X., and Li, H.: The influence of local reflux index profile of Guangzhou boundary layer based on wind profiler radar on the pollutant concentration, Acta Scientiae Circumstantiae, 42, 1–8, https://doi.org/10.13671/j.hjkxxb.2021.0519, 2022.
Zhan, C., Xie, M., Huang, C., Liu, J., Wang, T., Xu, M., Ma, C., Yu, J., Jiao, Y., Li, M., Li, S., Zhuang, B., Zhao, M., and Nie, D.: Ozone affected by a succession of four landfall typhoons in the Yangtze River Delta, China: major processes and health impacts, Atmos. Chem. Phys., 20, 13781–13799, https://doi.org/10.5194/acp-20-13781-2020, 2020.
Zhang, M., Yang, Y., Zhan, C., Zong, L., Gul, C., and Wang, M.: Tropical cyclone-related heatwave episodes in the Greater Bay Area, China: Synoptic patterns and urban-rural disparities, Weather and Climate Extremes, 44, 100656, https://doi.org/10.1016/j.wace.2024.100656, 2024.
Zhang, Y., Guo, J., Yang, Y., Wang, Y., and Yim, S. H. L.: Vertical wind shear modulates particulate matter pollutions: A perspective from radar wind profiler observations in Beijing, China, Remote Sensing, 12, 546, https://doi.org/10.3390/rs12030546, 2020.
Zong, L., Yang, Y., Xia, H., Yuan, J., and Guo, M.: Elucidating the impacts of various atmospheric ventilation conditions on local and transboundary ozone pollution patterns: A case study of Beijing, China, Journal of Geophysical Research: Atmospheres, 128, e2023JD039141, https://doi.org/10.1029/2023JD039141, 2023.