the Creative Commons Attribution 4.0 License.
the Creative Commons Attribution 4.0 License.
 | 08 Jan 2026
A simplified system to quantify storage of carbon dioxide, water vapor and heat within a maize canopy
Taqi Raza
Bruce B. Hicks
Joel N. Oetting
Neal S. Eash
The canopy storage of CO2, latent heat, and sensible heat within agricultural crops has not yet been fully examined, particularly on small farms situated in complex terrain. Reported canopy storage terms are consistently smaller than those found in forest ecosystems, such that they are often neglected. Our multiport profile system has been developed to examine these storage terms. The system sequentially samples air from four heights to a single non-dispersive Infrared Gas Analyzer (IRGA). Following laboratory testing, the system has been field proven in an east Tennessee maize crop in 2023. The new system enables quantifications of CO2, latent and sensible heat atmospheric storage terms and, with supporting temperature measurements, allows improved examination of the surface heat energy budget and the net air-surface exchange of CO2. It offers a valuable tool for a better understanding of gas-energy fluxes on small farms on topographically varied landscapes.
- Article
(4384 KB) - Full-text XML
- BibTeX
- EndNote


-
A unique multiport system simplifies measuring CO2 and water vapor gradients in a plant canopy.
-
The system eliminates the effects of sensor calibration differences.
-
Field tests illustrate the ruggedness of the design, suitable for remote and demanding circumstances.
-
Addition of temperature sensors permits application to surface heat storage and energy balance applications.
In the last few decades, significant work has attempted to improve our understanding of gaseous exchanges between soils, plants, and the atmosphere. These improvements have been incorporated in land-surface models and numerically-based weather predictions as well as in assessment of atmospheric fluxes of carbon dioxide (Lamas Galdo et al., 2021), water vapor (Wang et al., 2023), and heat over vegetated landscapes (e.g., Hoeltgebaum and Nelson, 2023).
Observations of the surface heat budget over forests have shown that the balance expressed by the familiar relationship:
Here, Rn is net radiation, G is soil heat flux, H is sensible heat flux and LE is latent heat flux (q. v. Wilson et al., 2002). Measurements of the turbulent fluxes of H and LE are usually by the eddy covariance (EC) methodology (Nicolini et al., 2018), which is also used to measure the flux of carbon dioxide – . In practice, Rn is measured using well-accepted sensors and ground heat flux plates are installed in the soil to determine G. Routine EC measurements are now made at more than 1000 locations globally (c.v. Fluxnet; Pastorello et al., 2020).
An important factor emerging from many experimental studies using eddy covariance is that storage terms contribute substantially to energy closure of vegetated areas and to the quantification of evapotranspiration (McCaughey and Saxton, 1988; Hoeltgebaum and Nelson, 2023). In concept, errors in the surface heat balance can be attributed to many additional factors, including omission of the heat used in photosynthesis and the storage of heat in plant biomass, in the air below the height of micrometeorological flux measurement and in the soil layer below or above or both the depth of G measurement. If the site is not flat, horizontal and homogeneous for a considerable distance upwind, then gravity flows, and advection must be expected to play a role. Investigation of these various contributing factors requires measurement of the relevant variables as they change with space and with time; especially challenging due to temporal (particularly diurnal) changes in air temperature and humidity (Varmaghani et al., 2016) as well as in concentrations of carbon dioxide (herein represented by [CO2]).
There are several other possible reasons for energy closure errors in EC experimentation, such as loss of low- or high-frequency flux components, non-optimal coordinate rotation, and the use of inappropriate averaging times (Massman and Lee, 2002; Meyers and Hollinger, 2004; Oetting et al., 2024). Finnigan (2006) reported that the atmospheric heat storage term is underestimated when the average sampling time is large. Neglecting canopy storage terms in studies of Net Ecosystem Exchange (NEE) can also cause substantial errors (Raza et al., 2023). Fewer than 30 % of known experimental locations apply a profile measurement system to calculate the temporal variations in storage terms (Papale et al., 2006). Many studies report that energy balance closure is an unsolved problem for a variety of vegetation types: the sum of sensible and latent heat flux is found to be 10 %–30 % lower than the available energy (Wilson et al., 2002; Twine et al., 2000; Leuning, 2012; Russell et al., 2015; Raza et al., 2023).
In the case of agricultural cropping systems, atmospheric storage terms are usually considered to be small and are often ignored (Nicolini et al., 2018; Raza et al., 2024). Assessments of storage terms within agricultural ecosystems are few and differ from those well documented by researchers in the case of forest ecosystems studies (Mayocchi and Bristow, 1995; Wilson et al., 2002; Hicks et al., 2020). Most results of heat storage in forest environments focus on the atmospheric component of the total heat storage.
This paper focusses on the need for detailed measurements of water vapor and carbon dioxide profiles and concentrations in the atmospheric surface roughness layer, as arose in the decade-long sequence of field studies conducted by the University of Tennessee in Lesotho, Zimbabwe, Ohio and Tennessee (see Eash et al., 2013; O'Dell et al., 2014, 2015; Hicks et al., 2021, 2022). The surface roughness layer is that layer of air in contact with the surface below the height at which familiar micrometeorological flux/gradient relationships apply. These studies have concentrated on aspects of the surface energy balance and crop carbon dioxide exchange in areas different from conventional agricultural-meteorology experiments, namely in areas of complex terrain and small plots common in farming communities in Africa and much of eastern North America. These experiments have increasingly indicated the importance of detailed temperature and concentration measurements in the surface roughness layer.
A central requirement has been the need to describe water vapor and CO2 concentrations in more detail than conventional micrometeorology normally provides. To this end, the present paper describes an experimental procedure that builds upon air-sampling systems of the past but is streamlined to provide the requisite measurements with the desired time and space detail, in areas often distant from immediate technical support. Some illustrations of its field utility are provided, using observations from a study of a maize canopy in eastern Tennessee in 2023.
The measurement system described here is an outgrowth of experience with eight preceding field studies, conducted at locations in Lesotho, Zimbabwe, Tennessee, and Ohio (Eash et al., 2013; O'Dell et al., 2014, 2015; Hicks et al., 2021, 2022). These demonstrated the need for a reliable yet technically simple system to measure gas concentrations within and above a growing crop. To satisfy the basic requirements for time continuity and reliability of the data record, a new multi-port sampling system was developed.
To avoid consequences of individual sensor offsets when gradients are computed, the new system is designed to use a single detection system, in this case an infrared CO2/H2O gas analyzer (IRGA; LI-COR-850, Lincoln, NE). Figure 1 presents a schematic description of the apparatus. The system is designed to maintain continuous airflow through all intake tubes, to cycle through all heights of measurement in one minute (7.5 s for each height) and to minimize the switching time between samplings.
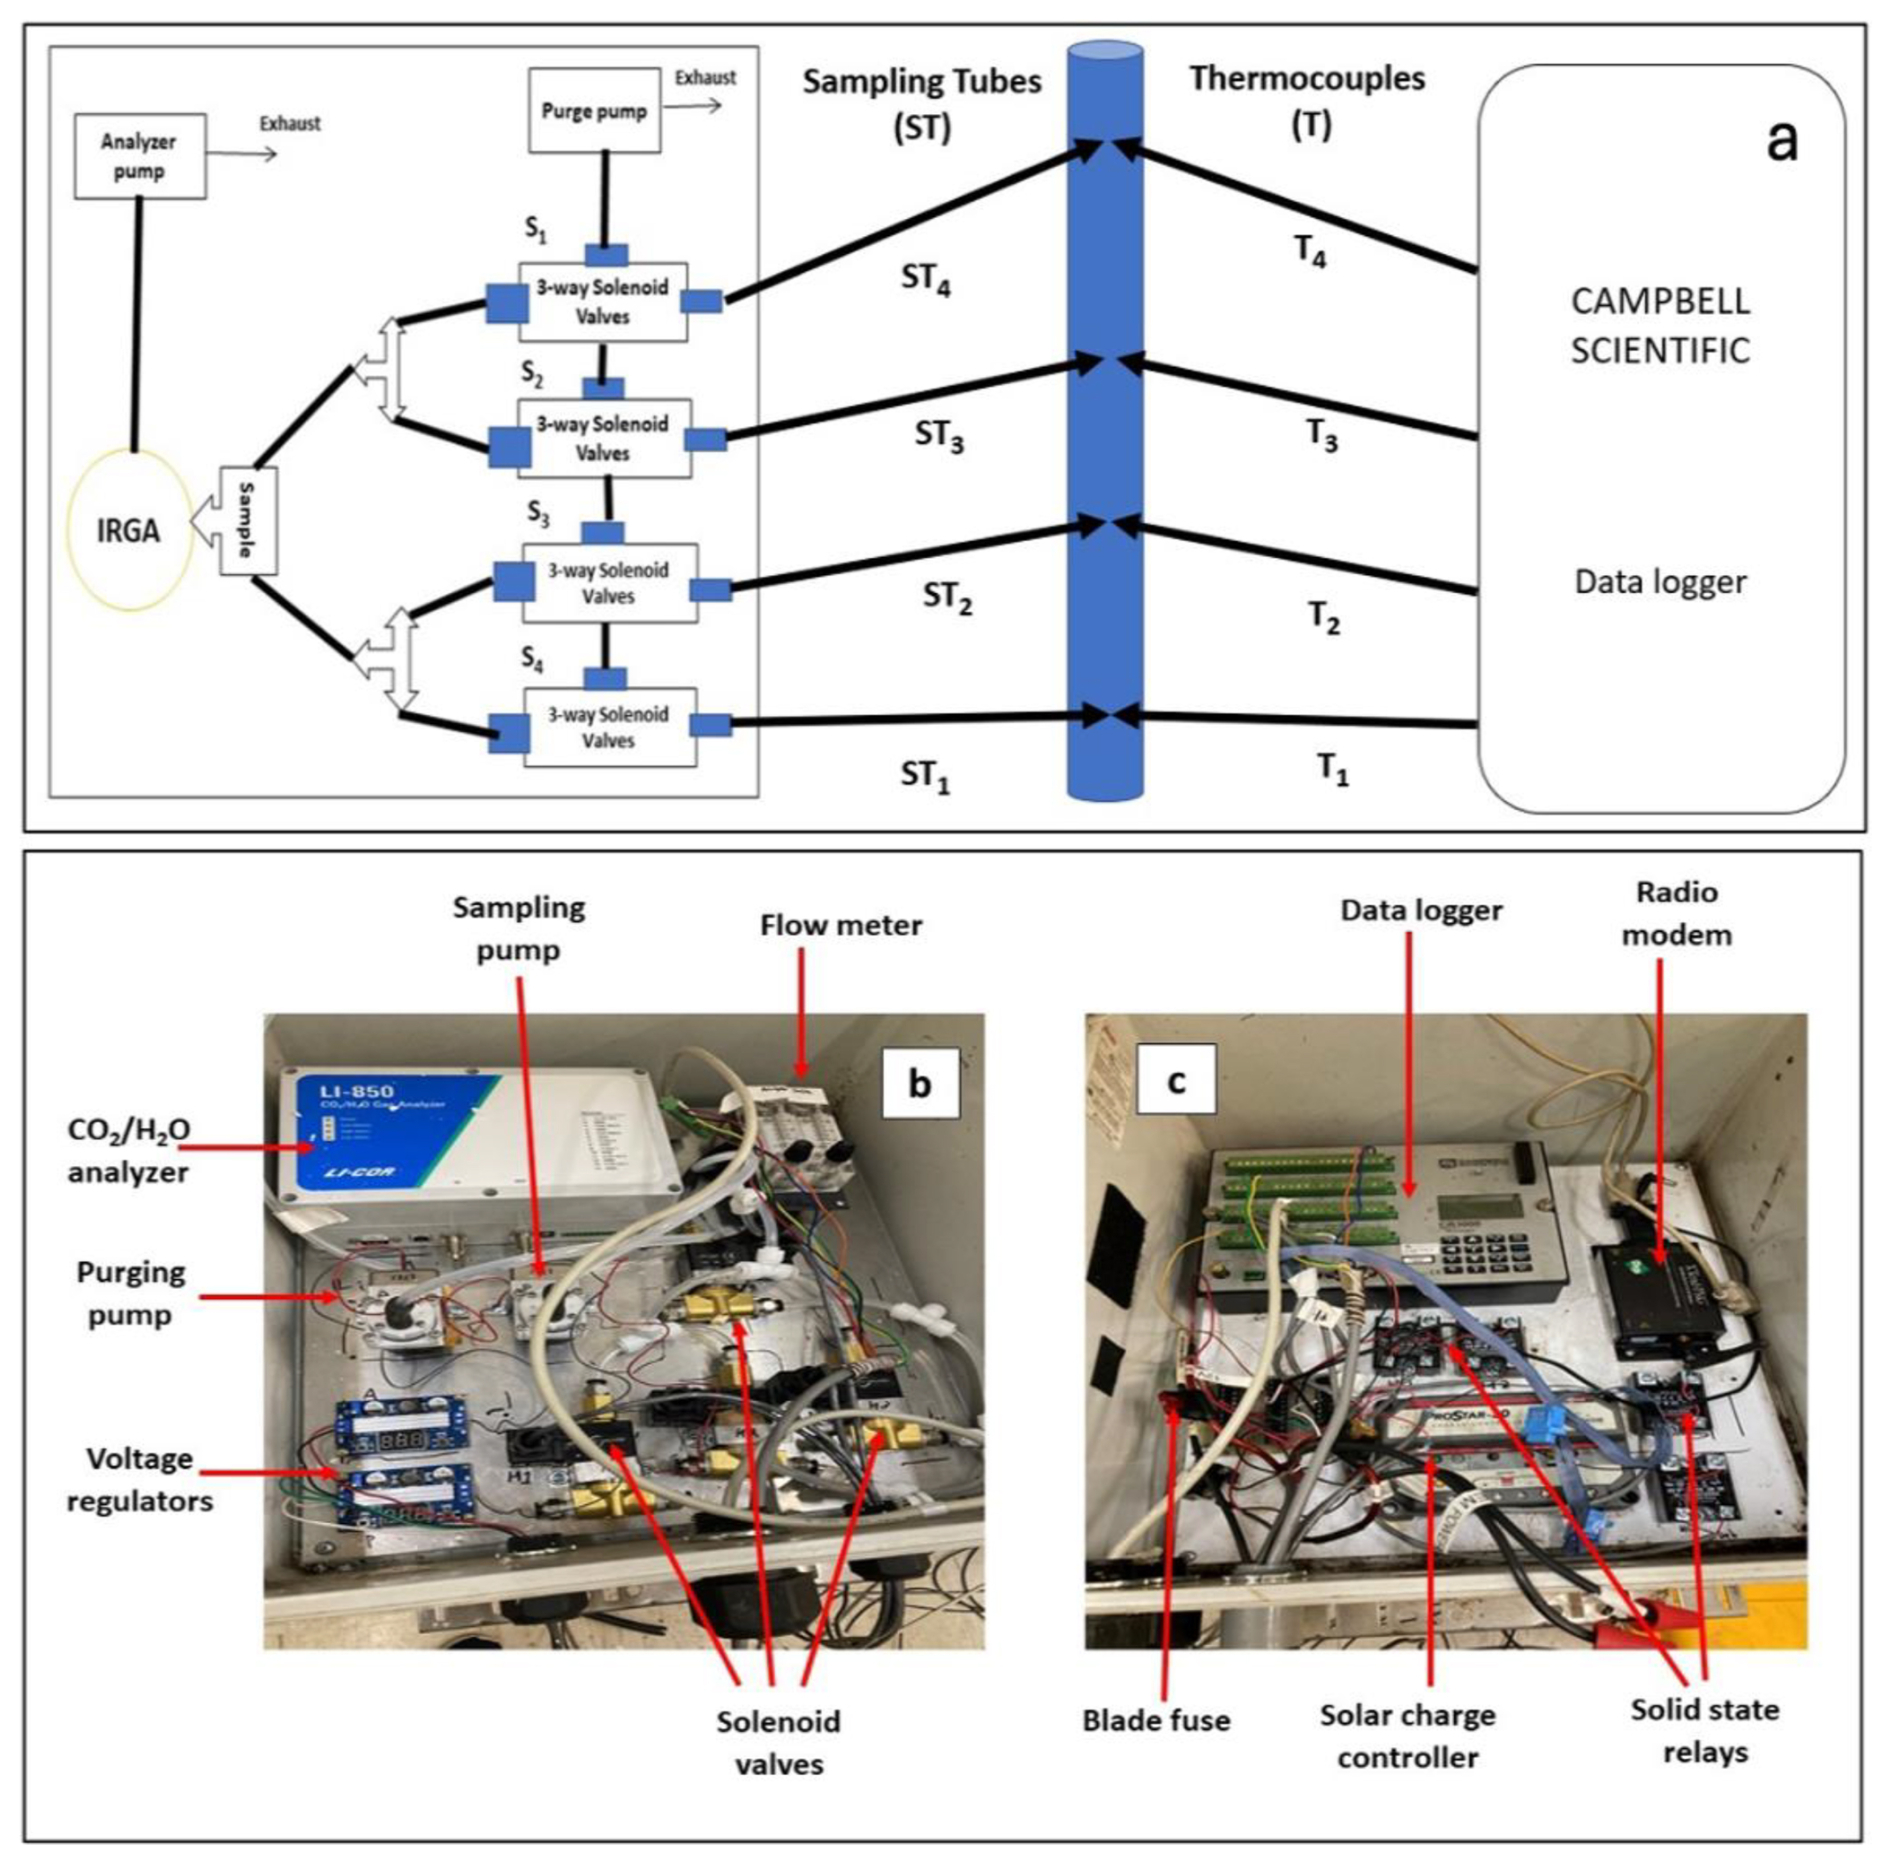
Figure 1Details of the multi-port sampling system: (a) schematic diagram of the manifold for profile sampling of CO2 and H2O, (b) a photograph of the analyzer, pump, and manifold system, (c) the data logger for data collection.
The system uses two small pumps [Model TD-3LSA, Brailsford & CO., Inc. Antrium, NH, USA], one pump (the purge pump) draws in air at a constant rate through all intake tubes to minimize hygroscopic interactions along the tube walls. Another pump (the sampling pump) pushes the drawn air to the IRGA. The sampling pump is mounted close to the IRGA so that air smoothly enters the IRGA at ambient pressure. When sampling the airflow through a specific tube the flow rate is maintained at 1000 mL min−1. The flow rates through the other three tubes are then maintained at 700 mL min−1 by flow meters [LZQ-7 flowmeter, 101.3 KPa, Hilitland, China]. The switching between sampling tubes is controlled by four three-way brass and stainless-steel solenoid valves [231Y-6, Ronkonkoma, NY, USA]. Each sampling tube is 10.5 m long, to ensure samples from each sampling height have the same transit time. The purge pump manifold and all sampling tubes are constructed of the same kind of urethane [BEV-A-LINE, Polyethylene material, Cole Parmer, City, State]. Before entering the analyzer, the air is passed through a 1 µm pore filter [LI-6262, LI-COR, Lincoln, NE, USA] to avoid the accumulation of debris, dirt, particles, etc., that can cause contamination in the analyzer optical cells. The air outlet of the purge pump and IRGA are open directly to the atmosphere. Digitizing is at 5 Hz frequency. The data system is arranged to record averages and standard deviations at a pre-arranged periodicity, depending on the research goal but typically 5, 10 or 15 min.
The performance of the system for measurement of CO2 and H2O profiles was examined extensively before its field deployment. The apparatus was first flushed with nitrogen (N2) gas to create a zero-carbon dioxide environment. Subsequently, a known concentration of CO2 (430 ppm) at ambient pressure was fed through the intake tubes sequentially and system outputs were measured. This process allowed determination of the time needed to reach stable measurement readings.
To derive a continuous record of concentrations at each height of interest (in the preliminary configuration, four of them), switching between heights was set at every 7.5 s allowing each of the heights to be sampled twice in every minute. The laboratory tests showed that after the IRGA received a step change in CO2 concentration, it took approximately 1.8 s to achieve a steady output. During the laboratory evaluation period, the recorded error was less than 0.5 % in [CO2] between sampling heights. An accuracy error of less than 1 % is well within the acceptable range for the IRGA now used according to the specifications provided by the manufacturer and much less than higher errors common in measurements of this kind (Montagnani et al., 2018).
An ongoing field study of a maize crop in East Tennessee provided an opportunity to test the new sampling system in experimentally demanding circumstances. The experiment was conducted at a 23 ha plot of agricultural farmland, near Philadelphia, in Loudon County Tennessee (35.673° N, 84.465° W). The site is typical agricultural land used for mainly maize and soybean production, in slightly rolling terrain that presents a challenge to EC measurements, with local slope varying from 1 % to 5 % depending on location. For the present purpose, it is not necessary to provide details of the experiment or of the analysis resulting from it. Such detailed examination of the observations will be presented elsewhere. The mean annual temperature and precipitation of the site are 13.5 °C and 140 cm respectively. The soil was classified as an Alcoa Loam (fine, thermic Rhodic Paleudult) according to the USDA-NRCS (2018). The experiment extended through the entire growth cycle, from which data for six weeks during the months of May and June 2023 have been extracted for the present illustrative purpose. Maize planting was on 25 April with Dekalb hybrid 66-06 at a density of approximately 81 000 plants per ha, the illustrations relate to a period of rapid growth of the canopy, from soon after emergence (in early May) to tasseling (in June).
In the field test considered here, the system was used to measure at heights of 0.11 m, 0.5h, 1+h, 2+h, where h is maize canopy height (in meters) above the soil surface. Note that one intake was permanently set at 0.11 m, and the three other heights were adjusted as the maize grew. Sampling intakes were positioned on a 3.5 m steel mast. Thermocouples at the same height as gas sample intakes were used to measure temperature gradients; these were aspirated within a white PVC pipe shield of 1.9 cm diameter (Fig. 2a) that also served as a radiation shield.
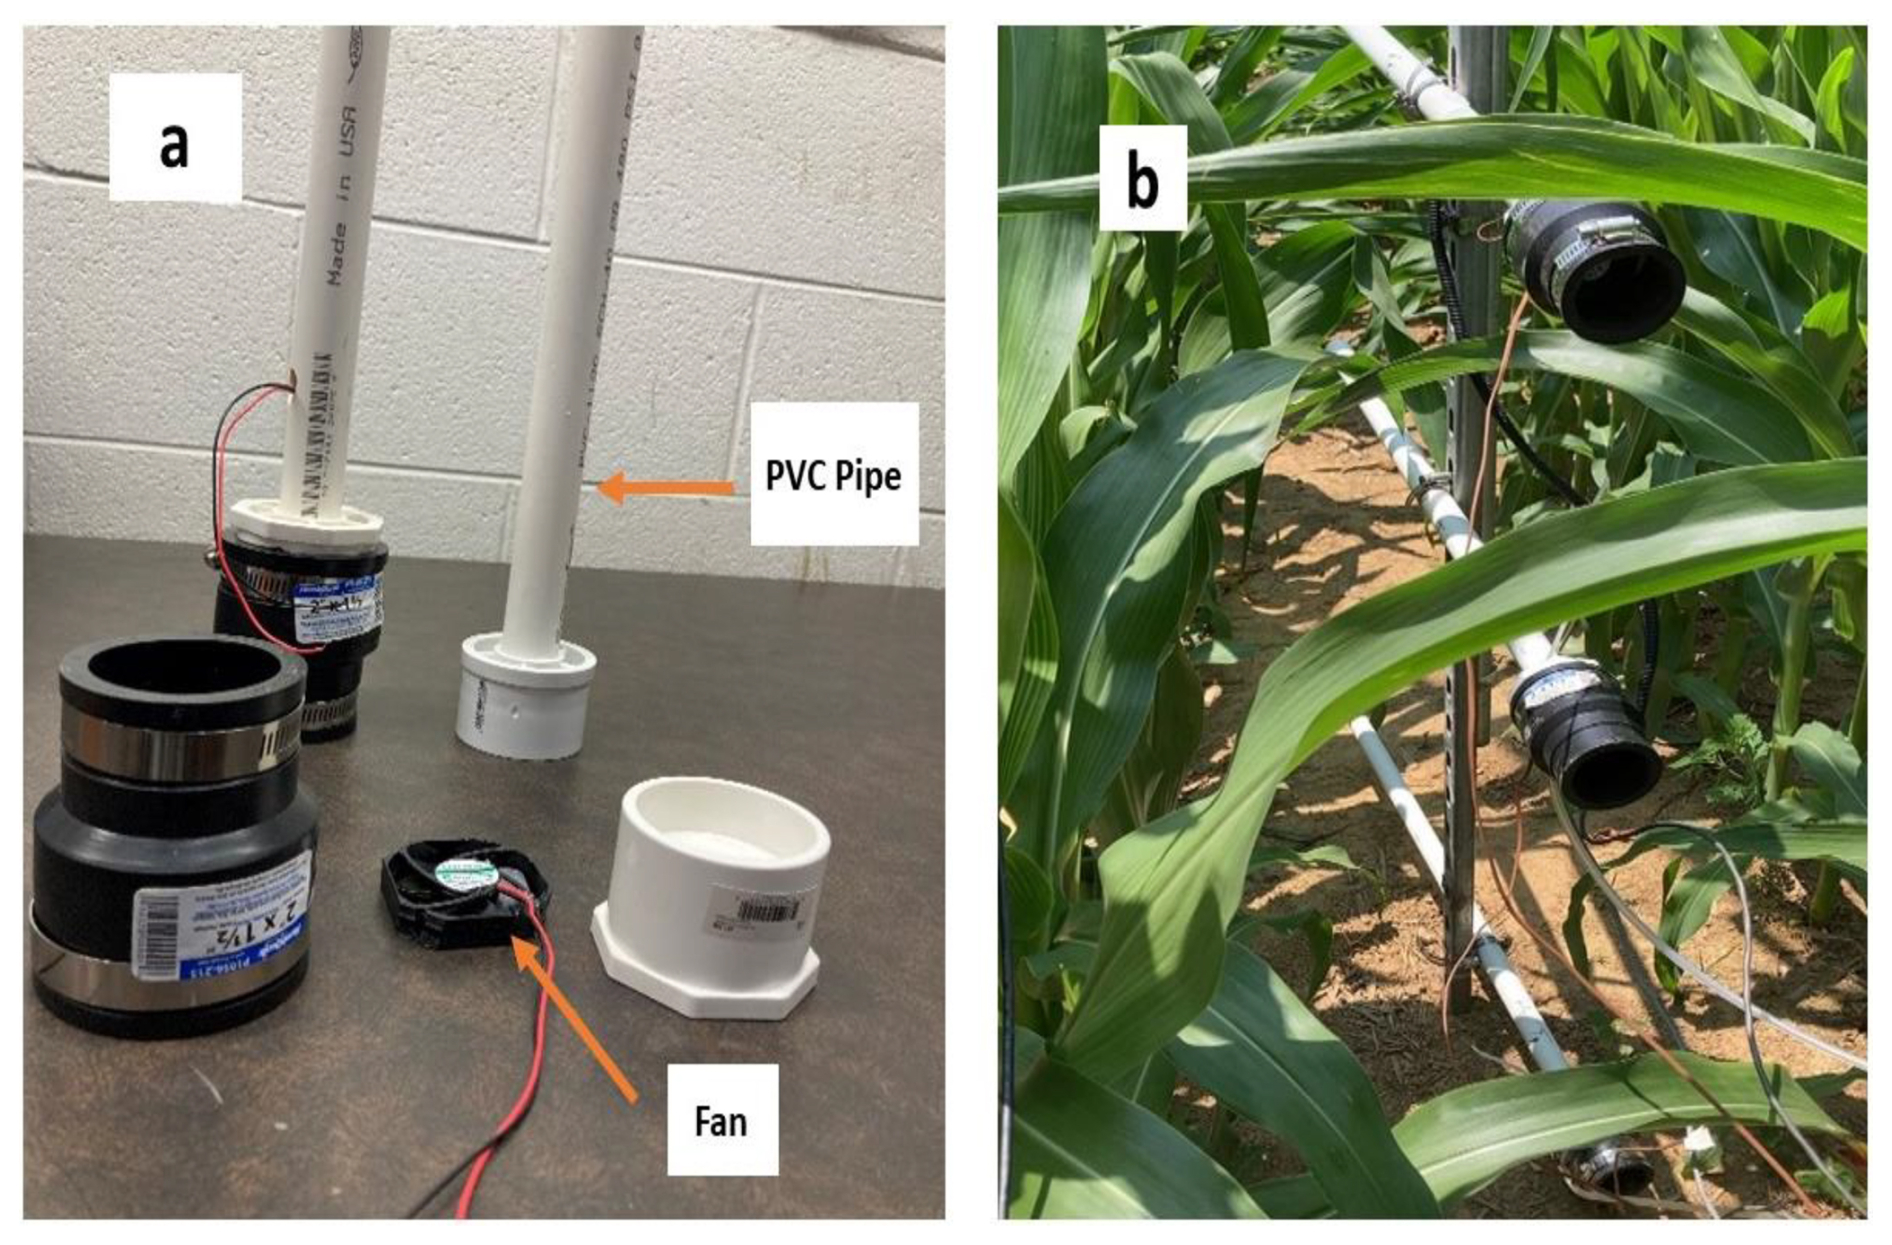
Figure 2(a) Installation components at each height of the new profile system, showing the aspirated CO2 intake tubes and thermocouples. (b) Deployment in a maize canopy; the two lowest heights are shown.
Two tripods and a horizontal bar supported an eddy covariance system (adjusted as the crop grew to maintain a height about 2 m above the crown) and supporting micrometeorological measurements – an IRGASON [CO2/H2O] open path gas analyzer system, [Campbell Scientific, Logan, Utah], a net radiometer [Kipp & Zonen, OTT HydroMet B.V., Delft, the Netherlands], infrared radiometers [IRs-S1-111-SS, Apogee Instruments Inc., City, State, USA], and type T thermocouples [Omega, City, State, USA]. The entire observation system was visually inspected every week for signs of leakage, condensation, and contamination. The IRGASON gas analyzer used for eddy covariance was independent of the IRGA used for concentration gradient measurements. The availability of the EC system and its supporting measurements enabled the tests of the new sampling system to extend to investigation of such matters as the height of origin of thermal eddies, as will be reported later.
3.1 Results – CO2
Within a nocturnal strongly stratified surface roughness layer, previous experiments have revealed the ubiquity of pooling of CO2 emitted by soil biota and root respiration. Figure 3 presents average diurnal cycles of CO2 concentrations measured over the six weeks from 18 May to 29 June at four heights, two within the canopy and two above. Error bounds correspond to ±1 SE (standard error) of the mean.
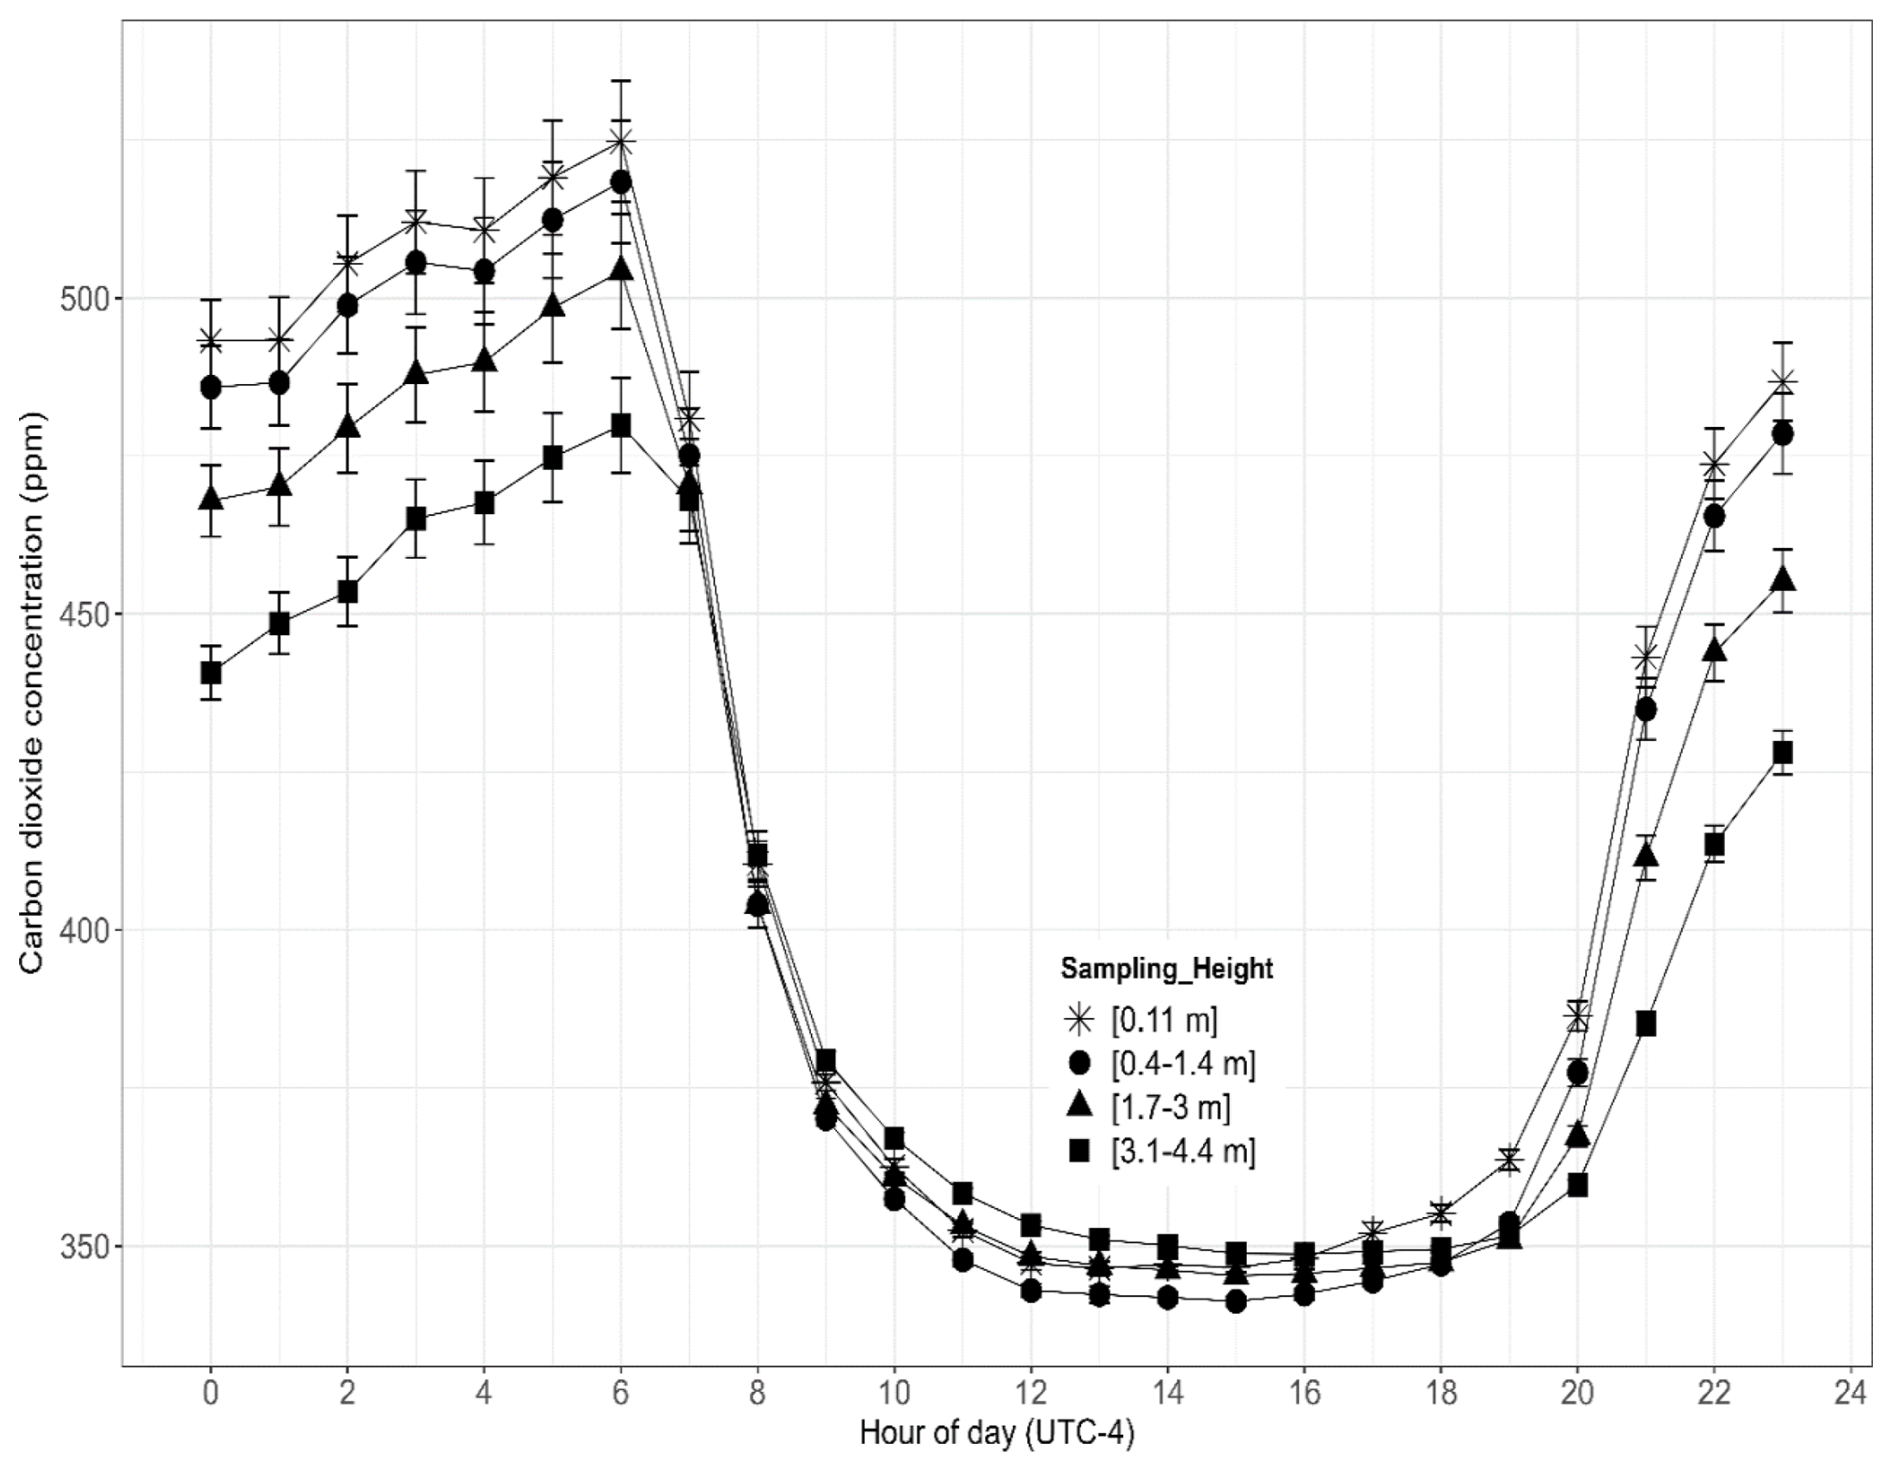
Figure 3Average diurnal cycle of CO2 obtained using the new system described here, for the six weeks. Symbols correspond to different heights of measurements with error bars corresponding to ±1 SE (standard error).
The variability of CO2 was found to be higher at nighttime than in daytime. The greatest variability was recorded within the canopy, at height 1 (0.11 m) and height 2 (0.4–1.4 m).
The observations confirm the generally accepted features of nocturnal accumulation of CO2 effluxes from the soil but with detail sufficient to warrant detailed examination. The close tracking of the records for the different measurement heights provides confidence in the performance of the sampling system and indicates that the same causative mechanisms affect all of the heights similarly. The nighttime results that are plotted support the assumptions made elsewhere that changes in the surface impacts the stratified atmosphere above, are mostly in accord with expectations of CO2 profile linearity (Galmiche and Hunt, 2002; Verma and Rosenberg, 1976), a result that is supported by close examination of CO2 averages over shorter nighttime periods. Following 06:00 LT (local time), about the average time of sunrise, the average concentrations of CO2 dropped rapidly as photosynthesis commenced and as convection started to mix surface air with the overlying atmosphere. At all heights this initial decrease was followed by a more rapid loss rate until concentrations dropped to about 350 ppm in the afternoon (12:00 to 18:00 LT), much lower than ambient concentrations thereby reflecting the efficiency with which the maize crop extracted CO2 from the air. Near sunset, [CO2] started to increase and continued to build until reaching maximum values immediately before dawn. Concentrations within the canopy do not differ significantly, although the 0.11 m height values always exceed those further above the soil surface. In general, [CO2] decreased with increasing height. All of these observations align well with contemporary views of the post-sunrise initiation of photosynthesis and its continuation through the following daylight hours.
The nocturnal accumulation of CO2 observed here is not unusual. In many climatic regions, nighttime soil temperatures remain high enough to sustain microbial and soil respiration activities, resulting in CO2 accumulation in the stratified air above the ground. After the sun rises, increased light availability increases stomatal activity and photosynthesis rates.
3.2 Results – H2O
As in Fig. 3, Fig. 4 shows the average diurnal cycle constructed from 15 min H2O concentration observations. At all heights a sharp increase in [H2O] was recorded in the morning at the same time as the sudden decrease for [CO2] seen in Fig. 3.
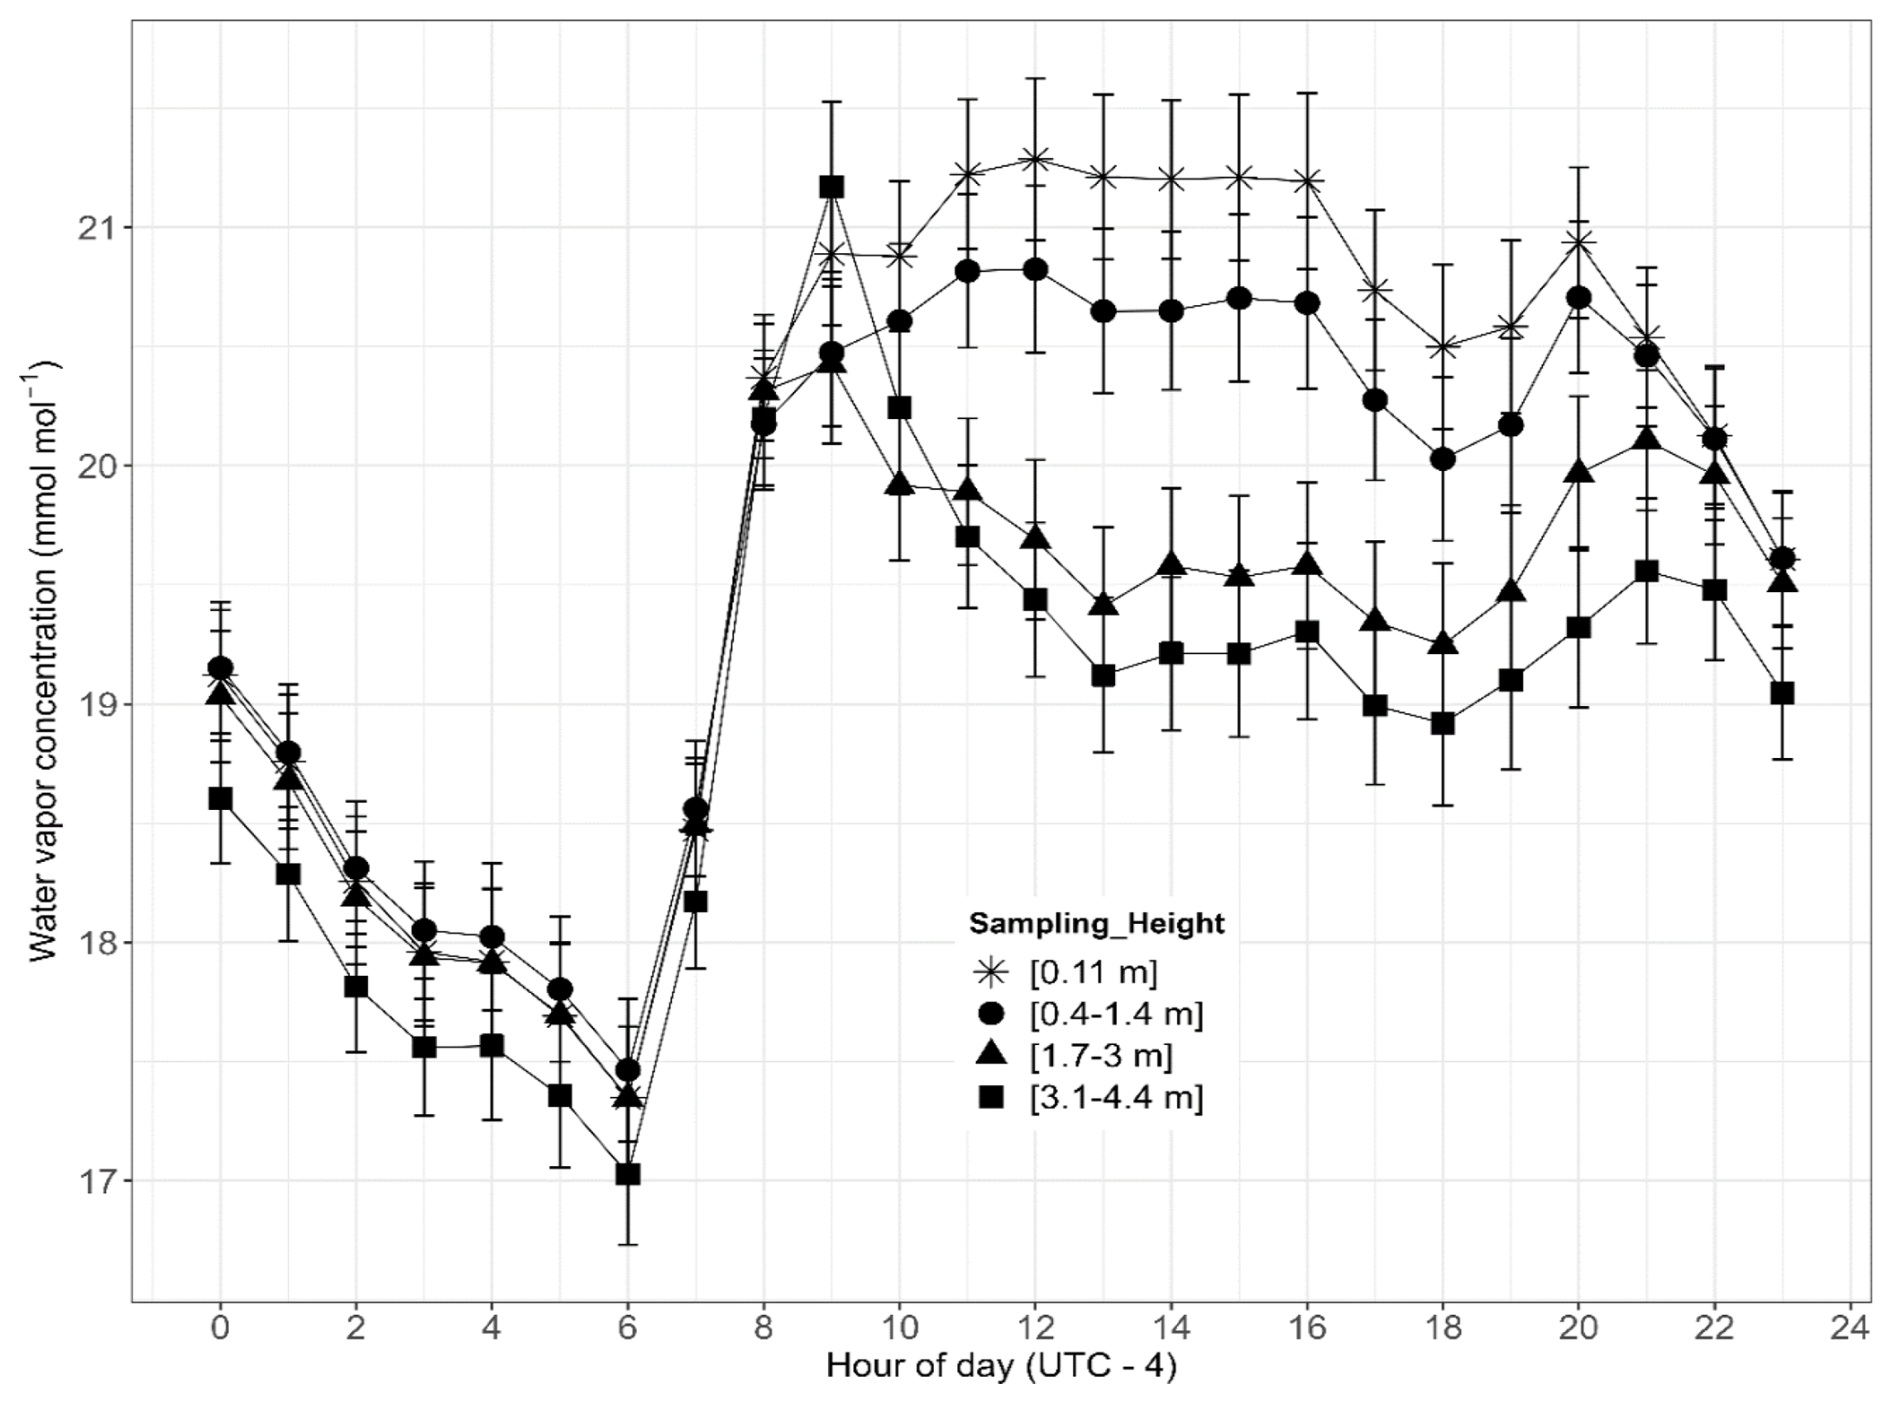
Figure 4Average diurnal cycle of the vertical profile of water vapor concentration averaged over six weeks as in Fig. 3. Symbols correspond to different heights of measurements with error bars corresponding to ±1 SE (standard error).
Subsequently, [H2O] peaked at about 09:00 LT and, within the canopy, maintained this concentration throughout the daylight hours. Above the canopy, average concentration decreased, and a different concentration constancy was attained. After the period around sunset had passed, at about 20:00 LT, [H2O] started decreasing approximately linearly with time until sunrise approached. The H2O concentration generally decreased as the measurement height increased for both day and night because a constant source of water vapor was the soil surface, with crop evapotranspiration adding H2O in the daytime. Dewfall is expected to be important, a contribution that can be uniquely addressed using the new sampling system.
Figures 3 and 4 reveal considerably different cycles of CO2 and H2O. At night, Fig. 3 shows a more striking [CO2] gradient than does Fig. 4 for [H2O]. The reason is presumed to be that CO2 continues to be emitted from the soil at night and accumulates within the stratified layer of air, whereas there is no parallel process influencing H2O concentrations. In daytime, there is little consistent [CO2] gradient information derivable from Fig. 3, but for [H2O] in Fig. 4 there is a clearly visible [H2O] gradient structure. This suggests a slow-down of CO2 exchange in the afternoons while evaporation continued.
The processes of evaporation from the soil surface and evapotranspiration from leaves are linked with solar radiation. Overall, the present results highlight changes in the vertical distribution of water vapor and its temporal variability, indicating near simultaneity of changes on CO2 and H2O concentrations following dawn (compare Figs. 3 and 4).
3.3 Results – atmospheric storage
Vertical profile data can also be used to explore how various atmospheric storage fluxes influence the CO2 status and energy budget of the maize crop. In accordance with many studies of the surface energy budget using EC systems, atmospheric storage terms refer to depletion or accumulation of scalar quantities (CO2, H2O, etc.) in a hypothetical control volume beneath the height of turbulent flux measurement by EC. A storage flux is defined as the rate of change of dry molar concentrations of the same variables within the same control volume. Both concepts relate most directly to the conditions of “perfect” micrometeorology. In practice, natural complexities of surroundings and exposures interfere to the extent that measurements will be site-specific. Moreover, the covariances are statistical quantities, with well-recognized error margins associated with every quantification of them. During this study, the storage fluxes of scalar quantities (CO2, water vapor, etc.) were calculated using the ICOS (Integrated Carbon Observation System) methodology (Montagnani et al., 2018). For the case of CO2,
Here, Jc is the storage term of CO2 (for example) within the ith layer over which Δc is measured, Δzi is the thickness of this layer and Δt is the measurement time step; ρd is dry air density, and N is the number of layers (number of measurements points). To calculate the storage terms as described by Eq. (2), raw data were averaged into 15 min periods, yielding the results plotted in Fig. 5.
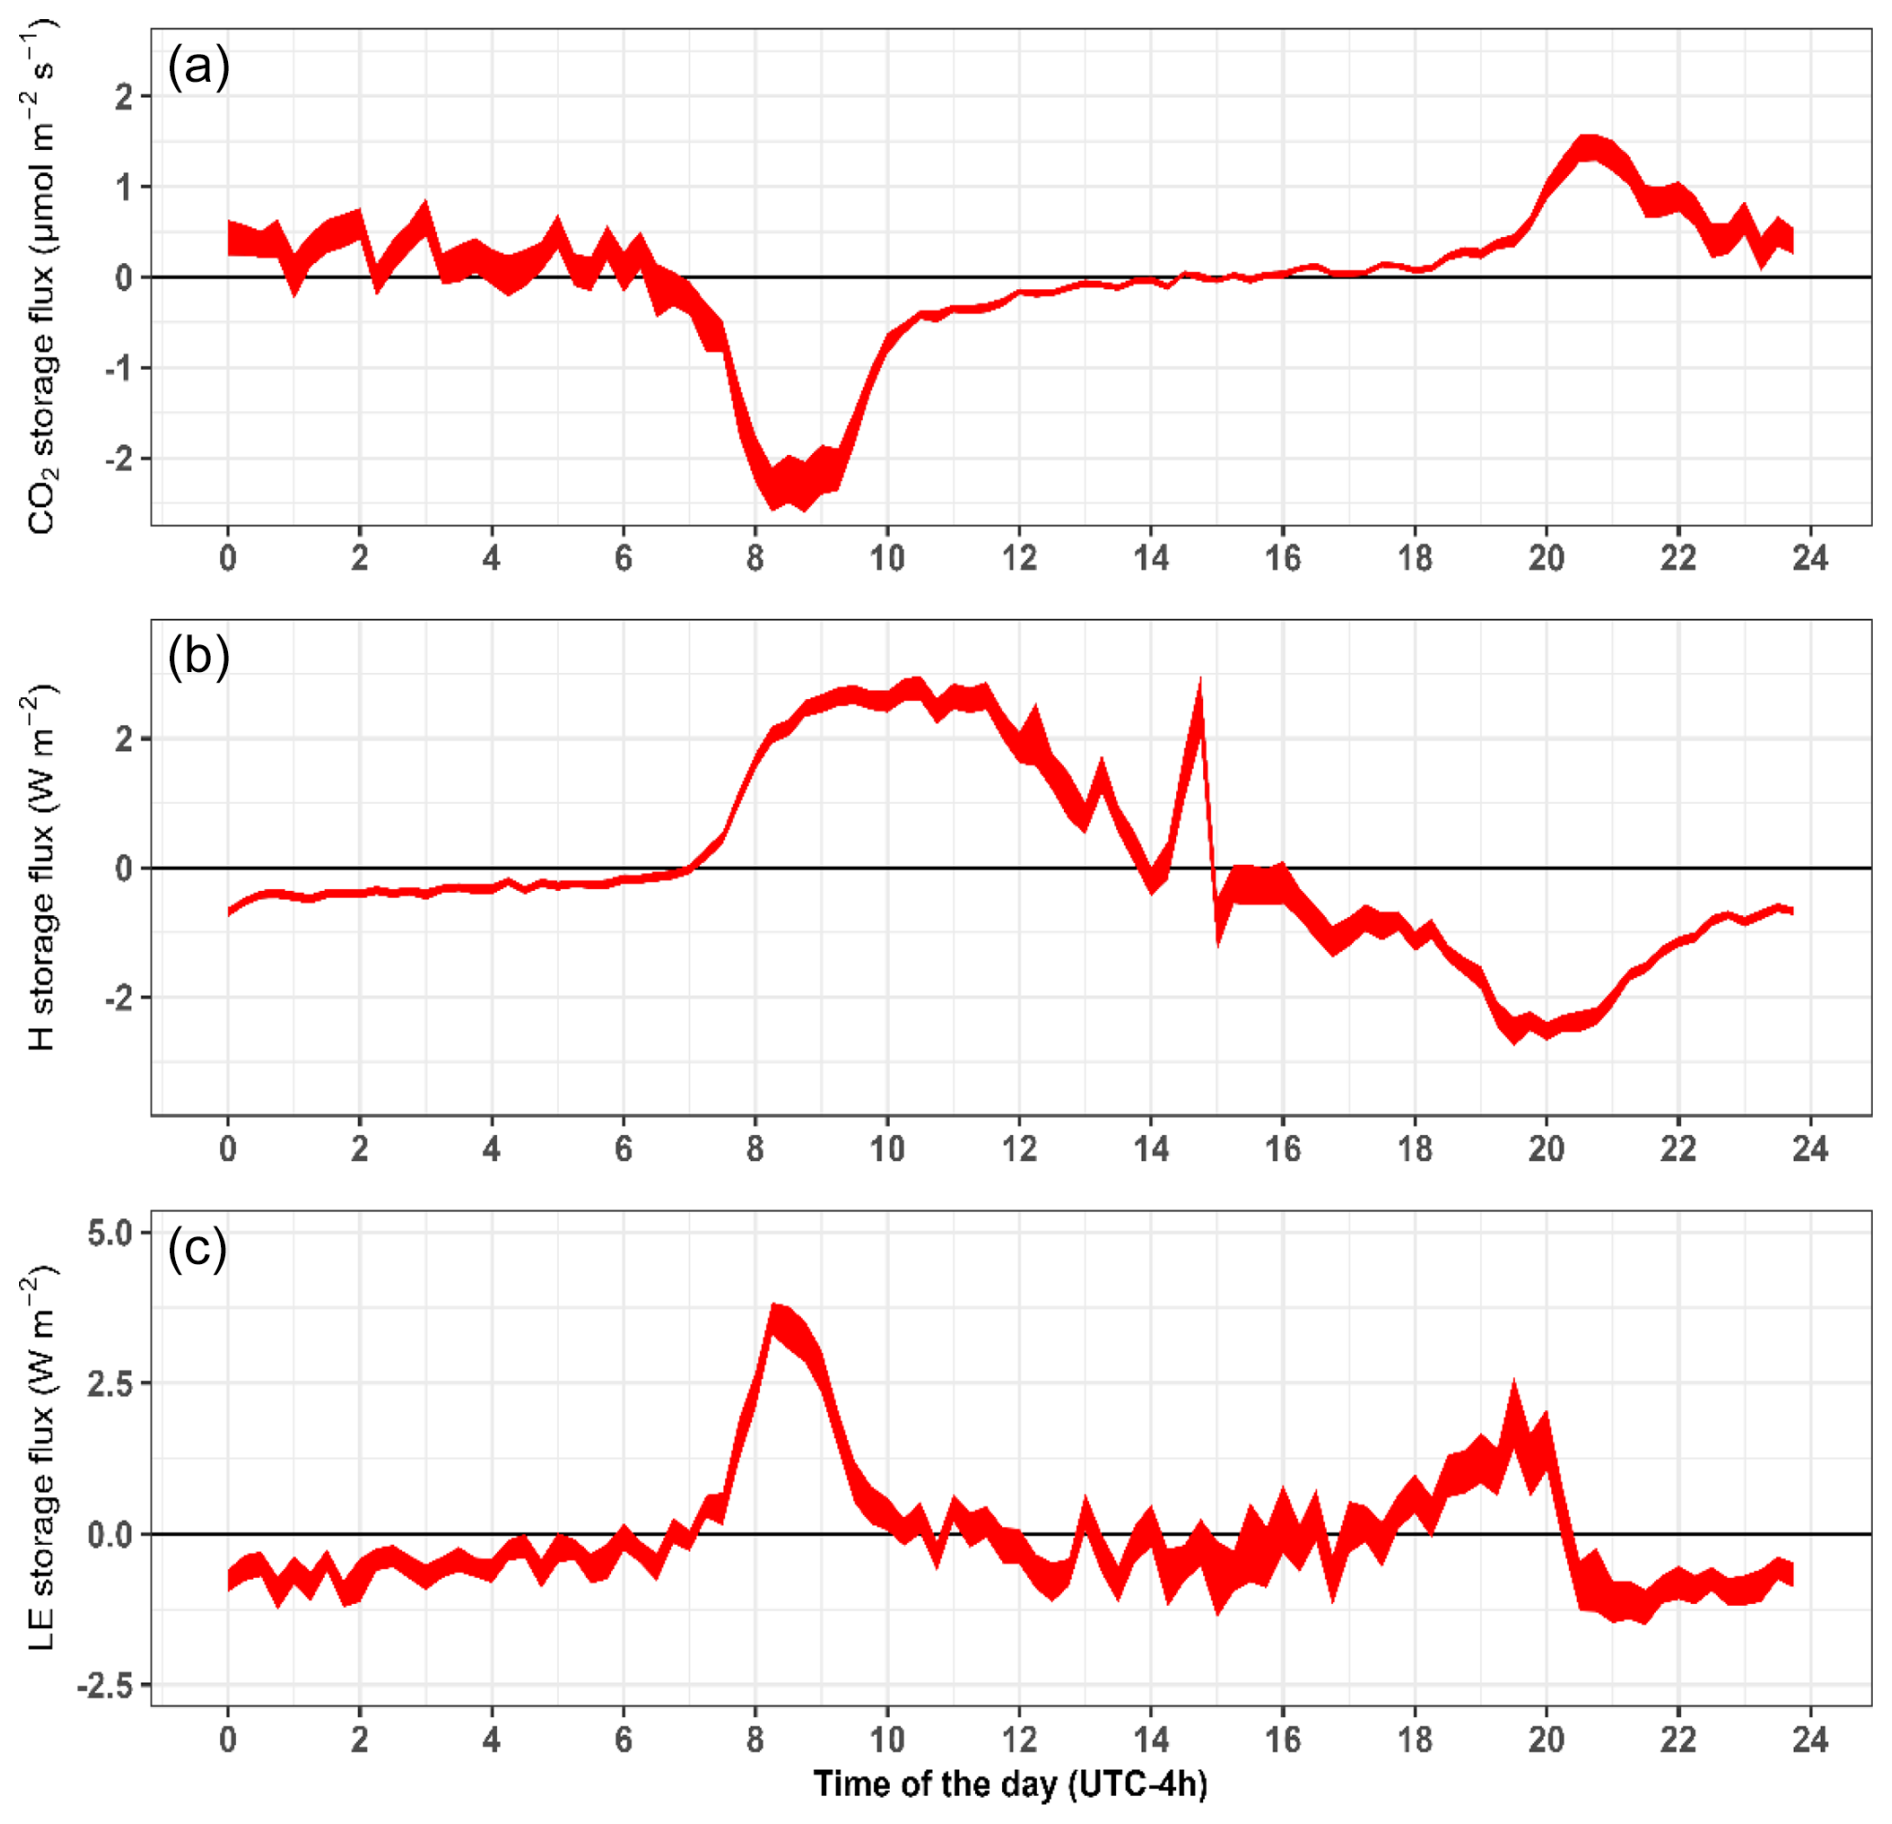
Figure 5Diurnal patterns of CO2 atmospheric storage (a), sensible heat storage (b) and latent heat storage (c) of the maize crop in early stages of growth (see Table 1). The widths of the traces correspond to ±1 SE (standard error) on the means.
CO2 storage (Fig. 5a) exhibited a larger magnitude and more variation at nighttime compared to daytime, due to the CO2 pooling and the intermittency of incursions from air aloft.
During the night, photosynthesis did not occur, and CO2 emitted from the soil accumulated in the overlying stratified atmosphere (Ryan and Law, 2005; Davidson and Janssens, 2006). Soon after sunrise, the nighttime stratification began to weaken, and photosynthesis commenced. The trapped CO2 was consumed by photosynthesis and mixed with air above the canopy as unstable stratification evolved. Minimal CO2 storage during the daytime can be due to the instability and strong mixing then prevailing, as well as to the photosynthetic removal of CO2 from the air to which the vegetation was exposed. More efficient exchange between plant and atmosphere then results in low storage of CO2 in the air space below the uppermost height of [CO2] measurement. At night, subcanopy ventilation by intermittent gusting results in a large variation between negative and positive CO2 storage.
Observations such as these are facilitated by the profile sampling system now advocated. In the future, it is planned to use the new capability to revisit the quality assurance methodology of EC determinations by comparing atmospheric storage to the statistical uncertainty of the covariances. In this context, note that Fig. 5b indicates sensible heat atmospheric storage terms equivalent, on average, to about 2 W m−2 in the late morning, followed by a downward trend through the afternoon until reaching a minimum a few hours after sunset. The irregularity seen soon after noon is presently unexplained. Clearly, individual shorter-term averages could display greater averages and increased scatter, but this remains to be explored. In comparison, Finkelstein and Sims (2001) derive uncertainties associated with 30 min EC evaluations of the sensible heat covariance in the range 5 % to 10 % in daytime.
The nocturnal sensible (Fig. 5b) and latent (Fig. 5c) heat energy storage remained low and slightly negative until sunrise, about 06:00 LT. As the air cooled during the night, sensible heat storage in the air mass remained slightly negative as its temperature decreased. After sunrise, the air mass warmed and the sensible heat storage rose to a maximum value of about 2 W m−2 between 12:00 and 12:30 LT. Afterwards, the sensible heat storage rate declined, reaching negative values a few hours before sunset and attaining a minimum value (about −1.5 W m−2) a few hours before midnight. The sensible heat storage subsequently trended to near-zero constancy until being disrupted by sunrise at about 07:00 LT.
Latent heat storage (Fig. 5c) fluctuated near zero for most of the daylight hours, after exhibiting a major positive excursion (>4 W m−2) during the few hours after sunrise. After about 21:00 LT, latent heat storage fluctuations like the variations seen in Fig. 5a occurred until sunrise, with an average of about −0.5 W m−2. Comparison with Fig. 5a indicates that the post-sunrise increases in latent heat storage coincided with the decrease in CO2 storage. The sensible heat storage appears to have been delayed by a fraction of an hour. Interpretation of these observations requires consideration of dewfall and its evaporation.
Table 1Height adjustment during the crop growth stage and maximum and minimum storage terms. V1 is the first leaf emergence, Vn is when the nth leaf fully emerged, and VT is the tasseling stage. Height 1 (H1) was kept constant throughout the experiment while the other three heights (H2, H3, and H4) changed as the plants grew. Negative and positive signs represent the 2.5th percentile (minimum) and 97.5th percentile (maximum) quartile values observed during the different periods.
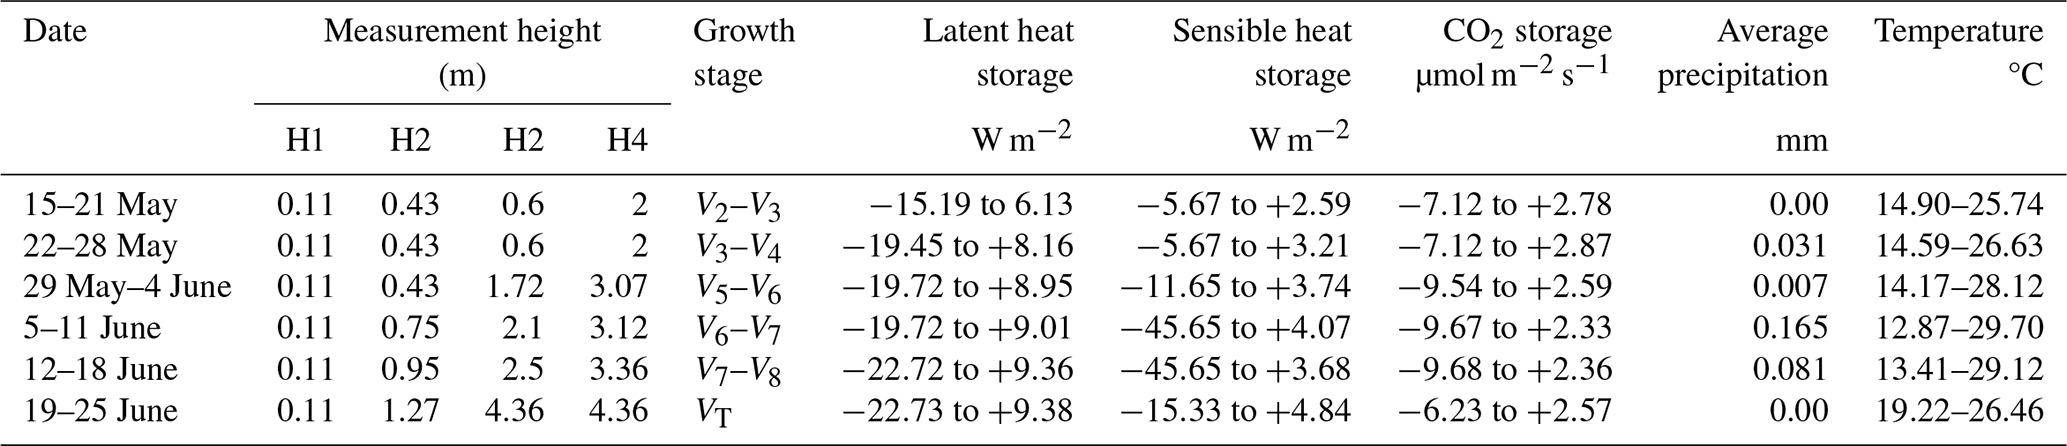
Table 1 lists some of the plant growth characteristics during the six-weeks considered here. Also listed are the magnitudes of maximum and minimum storage terms during each of the sampling periods, shown here to exemplify the ability of the new sampling system to reveal such extremes. Detailed examination of the plant-atmosphere interaction for the entire growing season will be presented elsewhere. During the six-week evaluation period, CO2 atmospheric storage increased as the plant grew and as the soil warmed (increasing subsurface heterotrophic CO2 generation) but not substantially; the highest storage rate was found at the VT (tasseling) stage and the minimum at the V2 growth stage, five weeks earlier. Similarly, latent heat storage increased significantly, presumably due to increasing leaf area and transpiration. Latent and sensible heat storage was found higher in the VT growth stage than in other growth stages. As the crop grew, different processes became prominent causes of the storage of energy and CO2. When the maize was in its early growth stage, the canopy was not fully developed, the soil was cooler, and CO2 storage did not show much change. However, there were substantial variations in the sensible and latent energy storage terms as the crop grew (see Table 1).
The field evaluation of the multi-port profile system demonstrated its effectiveness in measurement of CO2 and H2O concentrations at different heights within the surface roughness layer. The multiple-height profile system aided substantially to understanding CO2 and H2O concentration variations and their vertical profiles, thereby facilitating precise assessments of their exchanges, storage, and overall balance within the growing maize ecosystem. The observations reveal that different processes became prominent at different growth stages, which influenced the atmospheric storage of heat energy and gas and the associated fluxes as the canopy developed. An issue remaining to be addressed is that condensation of water in the sampling tubes was sometimes observed; this will affect measurement accuracy and steps to eliminate the problem are presently being reviewed.
The 2023 field experience with the new system indicates that canopy data obtained from the vertical profile observations offer potential for many applications in future studies such as evaluation of soil-plant-atmospheric models that rely on the precise estimation of CO2, heat and water vapor fluxes. Note that the definition of the heat storage used here (as in Eq. 2) omits warming of the biomass. This omission accounts for the differences between the storage terms now computed and those published previously (e.g., Hicks et al., 2022).
The simplicity of the sampling system device contributes to its success – it suffered few disruptions during the testing period. This new measurement system will be employed in future studies of air-surface exchange when moderated by the presence of a crop and especially when operation in remote locations is required. It requires less power, a single IRGA and has a low maintenance cost as compared to traditional systems (e.g. EC). These features reduce operation complexity and maintenance requirement, making it more suited for resource limited or remote locations, particularly small farms holder. Measurements made will permit improved quantification of storage terms – atmospheric, biological, in the soil, and all contributing to a better understanding of the surface heat energy balance. Sub-canopy measurements will help track how respiration, evaporation, photosynthesis, etc. vary through the depth of the canopy. Such studies will also help to evaluate micrometeorological models, such as those describing the variation of gases, temperature, and water vapor within a canopy. This new device is now being used for the assessment of canopy gas emissions, starting with carbon dioxide but future studies will include nitrous oxide. In summary, this new device has the potential to improve our understanding of soil–plant–atmosphere interactions, particularly within plant canopies.
Codes used to creat the results in the study are available on the request from traza@vols.utk.edu or taqiraza85@gmail.com.
Data is available upone request from traza@vols.utk.edu or taqiraza85@gmail.com.
TR: Data curation, Formal analysis, Methodology, Visualization, Writing – original draft. BBH: Supervision, Methodology, Visualization, Writing – revision and editing. JNO: Formal analysis, writing and reviewing. NSE: Supervising, Funding acquisition, Project administration, Writing – review & editing.
The contact author has declared that none of the authors has any competing interests.
Publisher's note: Copernicus Publications remains neutral with regard to jurisdictional claims made in the text, published maps, institutional affiliations, or any other geographical representation in this paper. While Copernicus Publications makes every effort to include appropriate place names, the final responsibility lies with the authors. Views expressed in the text are those of the authors and do not necessarily reflect the views of the publisher.
This work was supported by the University of Tennessee, Knoxville. The authors thank David R. Smith (Senior Technical Specialist, BESS, UTK), Wesley C. Wright (Senior Research Associate, BESS, UTK), Scott Karas Trucker (Senior Technical Specialist, BESS, UTK) and Josh Watson (Farmer) for their support.
This work was supported by DuPont Tate & Lyle Bio Products Company.
This paper was edited by Russell Dickerson and reviewed by three anonymous referees.
Davidson, E. and Janssens, I.: Temperature sensitivity of soil carbon decomposition and feedbacks to climate change, Nature, 440, 165–173, https://doi.org/10.1038/nature04514, 2006.
Eash, N. S., O'Dell, D., Sauer, T. J., Hicks, B. B., Lambert, D. L., and Thierfelder, C.: Real-time carbon sequestration rates on smallholder fields in Southern Africa, Institute of Agriculture, University of Tennessee, Knoxville, TN, https://act-africa.org/lib.php?f=wcca6-poster-session-6-abstracts#page=17 (last access: 18 November 2025), 2013.
Finkelstein, P. L. and Sims, P. F.: Sampling error in eddy correlation flux measurements, J. Geophys. Res.-Atmos., 106, 3503–3509, https://doi.org/10.1029/2000JD900731, 2001.
Finnigan, J.: The storage flux in eddy flux calculations, Agr. Forest Meteorol., 136, 108–113, https://doi.org/10.1016/j.agrformet.2004.12.010, 2006.
Galmiche, M. and Hunt, J. C. R.: The formation of shear and density layers in stably stratified turbulent flows: linear processes, J. Fluid Mech., 455, 243–262, https://doi.org/10.1017/S002211200100739X, 2002.
Hicks, B. B., Eash, N. S., O'Dell, D. L., and Oetting, J. N.: Augmented Bowen ratio analysis I: site adequacy, fetch and heat storage (ABRA), Agr. Forest Meteorol., 290, 108035, https://doi.org/10.1016/j.agrformet.2020.108035, 2020.
Hicks, B. B., Lichiheb, N., O'Dell, D. L., Oetting, J. N., Eash, N. S., Heuer, M., and Myles, L.: A statistical approach to surface renewal: The virtual chamber concept, Agrosyst. Geosci. Environ., 4, ee20141, https://doi.org/10.1002/agg2.20141, 2021.
Hicks, B. B., Oetting, J. N., Eash, N. S., and O'Dell, D. L.: Augmented Bowen ratio analysis, II: Ohio comparisons, Agr. Forest Meteorol., 313, 108760, https://doi.org/10.1016/j.agrformet.2021.108760, 2022.
Hoeltgebaum, L. E. B. and Nelson, L. D.: Evaluation of the storage and evapotranspiration terms of the water budget for an agricultural watershed using local and remote-sensing measurements, Agr. Forest Meteorol., 341, 109615, https://doi.org/10.1016/j.agrformet.2023.109615, 2023.
Lamas Galdo, M. I., Rodriguez García, J. D., and Rebollido Lorenzo, J. M.: Numerical model to analyze the physicochemical mechanisms involved in CO2 absorption by an aqueous ammonia droplet, Int. J. Environ. Res. Publ. Health, 18, 4119, https://doi.org/10.3390/ijerph18084119, 2021.
Leuning, R.: Estimation of scalar source/sink distributions in plant canopies using lagrangian dispersion analysis: corrections for atmospheric stability and comparison with a multilayer canopy model, Bound.-Lay. Meteorol., 96, 293–314, https://doi.org/10.1023/A:1002449700617, 2012.
Massman, W. and Lee, X.: Eddy covariance flux corrections and uncertainties in long-flux studies of carbon and energy exchanges, Agr. Forest Meteorol., 113, 121–144, https://doi.org/10.1016/S0168-1923(02)00105-3, 2002.
Mayocchi, C. L. and Bristow, K. L.: Soil surface heat flux: some general questions and comments on measurements, Agr. Forest Meteorol., 75, 43–50, https://doi.org/10.1016/0168-1923(94)02198-S, 1995.
McCaughey, J. H. and Saxton, W. L.: Energy balance storage fluxes in a mixed forest, Agr. Forest Meteorol., 44, 1–18, https://doi.org/10.1016/0168-1923(88)90029-9, 1988.
Meyers, T. P. and Hollinger, S. E.: An assessment of storage terms in the surface energy balance of maize and soybean, Agr. Forest Meteorol., 125, 105–115, https://doi.org/10.1016/j.agrformet.2004.03.001, 2004.
Montagnani, L., Grünwald, T., Kowalski, A., Mammarella, I., Merbold, L., Metzger, S., Sedlák, P., and Siebicke, L.: Estimating the storage term in eddy covariance measurements: the ICOS methodology, Int. Agrophys., 32, 551–567, https://doi.org/10.1515/intag-2017-0037, 2018.
Nicolini, G., Aubinet, M., Feigenwinter, C., Heinesch, B., Lindroth, A., Mamadou, O., Moderow, U., Mölder, M., Montagnani, L., Rebmann, C., and Papale, D.: Impact of CO2 storage flux sampling uncertainty on net ecosystem exchange measured by eddy covariance, Agr. Forest Meteorol., 248, 228–239, https://doi.org/10.1016/j.agrformet.2017.09.025, 2018.
O'Dell, D., Sauer, T. J., Hicks, B. B., Lambert, D. M., Smith, D. R., Bruns, W. A., Basson, A., Marake, M. V., Walker, F., Wilcox, M. D., and Eash, N. S.: Bowen ratio energy balance measurement of carbon dioxide (CO2) fluxes of no-till and conventional tillage agriculture in Lesotho, Open J. Soil Sci., 4, 87–97, 2014.
O'Dell, D., Sauer, T. J., Hicks, B. B., Thierfelder, C., Lambert, D. M., Logan, J., and Eash, N. S.: A short-term assessment of carbon dioxide fluxes under contrasting agricultural and soil management practices in Zimbabwe, J. Agric. Sci., 7, https://doi.org/10.5539/jas.v7n3p32, 2015.
Oetting, J., Hicks, B., and Eash, N.: On recursive partitioning to refine coordinate rotation in Eddy covariance applications, Agr. Forest Meteorol., 346, 109873, https://doi.org/10.1016/j.agrformet.2023.109873, 2024.
Papale, D., Reichstein, M., Aubinet, M., Canfora, E., Bernhofer, C., Kutsch, W., and Yakir, D.: Towards a standardized processing of Net Ecosystem Exchange measured with eddy covariance technique: algorithms and uncertainty estimation, Biogeosciences, 3, 571–583, https://doi.org/10.5194/bg-3-571-2006, 2006.
Pastorello, G., Trotta, C., Canfora, E., Chu, H., Christianson, D., Cheah, Y. W., Poindexter, C., Chen, J., Elbashandy, A., Humphrey, M., and Isaac, P.: The FLUXNET2015 dataset and the ONEFlux processing pipeline for eddy covariance data, Sci. Data, 7, 225, https://doi.org/10.6084/m9.figshare.12295910, 2020.
Raza, T., Hicks, B., Oetting, J., and Eash, N.: On the agricultural eddy covariance storage term: measuring carbon dioxide concentrations and energy exchange inside a maize canopy, in: Proceedings of the 103rd AMS Annual Meeting, 8–12 January 2023, Denver, Colorado, USA, https://ui.adsabs.harvard.edu/abs/2023AMS...10314707R (last access: 18 November 2025), 2023.
Raza, T., Oetting, J., Eash, N., Hicks, B., and Lichiheb, N.: Assessing energy balance closure over maize canopy using multiport system and canopy net storage, in: Proceedings of the 104th AMS Annual Meeting, 28 January–1 February 2024, Baltimore, Maryland, USA, https://ui.adsabs.harvard.edu/abs/2024AMS...10439160R/abstract (last access: 18 November 2025), 2024.
Russell, E. S., Liu, H., Gao, Z., Finn, D., and Lamb, B.: Impacts of soil heat flux calculation methods on the surface energy balance closure, Nature, 214, 189–200, https://doi.org/10.1038/nature04514, 2015.
Ryan, M. and Law, B.: Interpreting, measuring, and modeling soil respiration, Biogeochemistry, 73, 3–27, https://doi.org/10.1007/s10533-004-5167-7, 2005.
Twine, T. E., Kustas, W. P., Norman, J. M., Cook, D. R., Houser, P. R., Meyers, T. P., Prueger, J. H., Starks, P. J., and Wesely, M. L.: Correcting eddy-covariance flux underestimates over a grassland, Agr. Forest Meteorol., 103, 279–300, https://doi.org/10.1016/S0168-1923(00)00123-4, 2000.
USDA-NRCS: Soil Survey Staff, Natural Resources Conservation Service, United States Department of Agriculture, Web Soil Survey, https://websoilsurvey.sc.egov.usda.gov/App/WebSoilSurvey.aspx (last access: November 2018), 2018.
Varmaghani, A., Eichinger, W. E., and Prueger, J. H.: A diagnostic approach towards the causes of energy balance closure problem, Open J. Mod. Hydrol., 6, 101, https://doi.org/10.4236/ojmh.2016.62009, 2016.
Verma, S. B. and Rosenberg, N. J.: Vertical profiles of carbon dioxide concentration in stable stratification, Agricult. Meteorol., 16, 359–369, https://doi.org/10.1016/0002-1571(76)90005-4, 1976.
Wang, X., Zhong, L., Ma, Y., Fu, Y., Han, C., Li, P., Wang, Z., and Qi, Y.: Estimation of hourly actual evapotranspiration over the Tibetan Plateau from multi-source data, Atmos. Res., 281, 106475, https://doi.org/10.1016/j.atmosres.2022.106475, 2023.
Wilson, K.B., Goldstein, A., Falge, E., Aubinet, M., Baldocchi, D., Berbigier, P., Bernhofer, C., Ceulemans, R., Dolman, H., Field, C., Grelle, A., Ibrom, A., Law, B., Kowalski, A., Meyers, T., Moncrieff, J., Monson, R., Oechal, W., Tenhunen, J., Valentini, R., and Verma, S.: Energy balance closure at FLUXNET sites, Agr. Forest Meteorol., 113, 223–243, https://doi.org/10.1016/S0168-1923(02)00109-0, 2002.