the Creative Commons Attribution 4.0 License.
the Creative Commons Attribution 4.0 License.
 | 25 Mar 2026
VOLCANO3 – a Miniaturized Chemiluminescence Ozone Monitor for Drone-Based Measurements in Volcanic Plumes
Maja Rüth
Nicole Bobrowski
Ellen Bräutigam
Alexander Nies
Jonas Kuhn
Thorsten Hoffmann
Niklas Karbach
Bastien Geil
Ralph Kleinschek
Stefan Schmitt
Ulrich Platt
High levels of bromine monoxide (BrO) observed in volcanic plumes indicate significant catalytic destruction of tropospheric ozone (O3) at local to regional scales. The underlying chemical mechanisms are still incompletely understood and the quantification of O3 concentrations and their distribution in volcanic plumes remain a major challenge. Common atmospheric O3 measurement techniques (UV absorption spectroscopy and electrochemical sensors) suffer from strong interferences, especially from sulphur dioxide (SO2), which is low in the atmospheric background but a main constituent of volcanic plumes (ppmv levels). This problem can be circumvented by using chemiluminescence (CL) O3 monitors, which have negligible interference with SO2 and other trace gases commonly found in volcanic plumes. However, volcanic plume measurements with modern CL O3 monitors are impractical because they are heavy and bulky. Here we report on the development and application of a lightweight version of a CL O3 instrument (l.5 kg, shoebox size) that can be mounted to a commercially available drone. Besides measurements of vertical O3 profiles over several hundred metres, we present drone-based CL O3 measurements in the volcanic plume of Mount Etna in Italy. Within 3 km of the emitting craters we measured an anti-correlation between SO2 and O3 concentrations, corresponding to ozone reductions by up to 60 % in the volcanic plume with respect to the surrounding atmosphere.
- Article
(4284 KB) - Full-text XML
-
Supplement
(1619 KB) - BibTeX
- EndNote


Earth's stratospheric ozone (O3) layer absorbs the short-wavelength part of the solar ultraviolet radiation, enabling life as we know it. Besides its prominent role and abundance in the stratosphere, O3 is an important oxidant in the troposphere. Globally, tropospheric O3 is the most important precursor of hydroxyl radicals (OH), which drive chemical conversion and removal of many pollutants and greenhouse gases. At the same time, tropospheric O3 itself acts as a greenhouse gas, contributing to global warming. While today surface O3 concentrations are routinely monitored (e.g. Cooper et al., 2014), measurements of the vertical profile with high spatial and temporal resolution in the lower troposphere, in particular the planetary boundary layer are rare, yet highly desirable. Consequently, there remain major gaps in our understanding of tropospheric O3 sources and sinks, interaction of transport processes with O3 chemistry, and the detailed impact of O3 on the atmospheric composition.
For a long time, O3 has been measured with chemiluminescence (CL) techniques. In fact, nitric oxide (NO) and ethylene CL measurements of O3 have been the standard method in the United States (US EPA, 2023) and are considered the most reliable O3 measurement methods (e.g. Long et al., 2014; Long et al., 2021). However, unfortunately – and despite their advantages in certain applications (see Sect. 2.1, below) ethylene CL monitors are no longer produced commercially. Today and since several decades, most O3 measurements use short-path UV-absorption spectroscopy (e.g. Dunlea et al., 2006; Williams et al., 2006), which is much easier to implement, cost-effective, and, in most environments, similarly accurate. Such devices measure O3 concentrations by detecting the attenuation of radiation around 254 nm. Typically, absorption measurement paths are a few tens of cm and the light intensity without O3 absorption needs to be monitored (e.g. once a minute) by passing the air through an O3-remover (“O3 scrubber”). But volcanic and biomass burning plumes are examples of tropospheric environments, where the applicability of UV absorption O3 monitors is questionable, because of interfering UV absorption due to SO2, volatile organic carbon species, fine aerosol, and mercury vapour. For example, looking at the absorption cross-sections of O3 and SO2, it can be recognised that the sensitivity to SO2 is about a factor of 100 lower than that to O3 by considering the wavelength which the O3 maximum absorption, where many UV-monitors operate (≈254 nm). Under most atmospheric conditions these interferences (especially due to SO2) are negligible (Kleindienst et al., 1993; Williams et al., 2006) since ambient SO2 levels are typically comparable to or lower than O3 levels. Therefore, UV monitors can reliably measure O3 at most remote, urban, and industrial locations. However, when probing volcanic emissions, SO2 mixing ratios may reach values up to several ten ppmv and therefore can exceed O3 mixing ratios by factors of 1000 or more (usual background O3 mixing ratios are several ten ppbv). Consequently, SO2 typically dominates UV absorption in volcanic plumes and prohibits an accurate quantification of the O3 UV absorption signal (Kleindienst et al., l993; Leston et al., 2005; Williams et al., 2006). The correction of the data with simultaneously measured SO2 (Kelly et al., 2013) or the application of selective SO2 scrubbers (Surl et al., 20l5; Vance et al., 20l0), however, are difficult and – at best – introduce significant additional uncertainty.
A similar problem can occur in biomass burning plumes, typically containing high levels of hydrocarbons and particles, which can also produce false O3 signals in the UV (Cavanagh and Verkouteren, 2001; Kleindienst et al., 1993).
Other O3 measurement techniques, which have been used for several decades, for instance electrochemical sensors for balloon-borne profile measurements of the atmospheric background (Witte et al., 2017) show strong cross interferences to higher amounts of nitrogen dioxide and SO2 (Schenkel and Broder, 1982; Cross et al., 2017), which also makes them unreliable in near-source plume environments.
The VOLCANO3 instrument implements the “traditional” CL O3 measurement technique in a compact, robust, and light-weight setup. It can be mounted to a commercial drone and thereby provides accurate and interference-free O3 measurements with meter-scale spatial resolution in all tropospheric environments. In this work we focus on the application of drone-based CL O3 measurements in volcanic plumes with the goal of improving the understanding of volcanic plumes and their impact on the atmospheric composition.
Volcanic gases and ozone
Volcanoes are a key component of Earth's element cycles and have an impact on their local environment, particularly the surrounding atmosphere. However, their impact can also be regional and global in scale when emissions increase during eruptions or when quiescently degassing for a long time (e.g. Marti and Ernst, 2008; von Glasow, 2010).
The primary volcanic gas emissions, i.e. water vapour, carbon dioxide (CO2), sulfur species (SO2, H2S), and hydrogen halides (HCl, HF, HBr, HI) mix and interact with the surrounding atmosphere, creating a unique atmospheric environment (e.g. Carroll and Holloway, 1994; Kuhn et al., 2022). For example, high amounts of secondary reactive halogen species, especially bromine monoxide (BrO), have been detected in volcanic plumes (e.g. Bobrowski et al., 2003, 2007; Kern et al., 2009; von Glasow, 20l0; Gliß et al., 20l5; General et al., 20l5). This indicates heterogeneous photochemical reaction cycles (referred to as bromine explosion, see Platt and Janssen, l995; Wennberg, 1999), involving volcanic halogen halides, aerosol particles, and atmospheric oxidants (mainly O3, see Bobrowski et al., 2007; Kern et al., 2009; Jourdain et al., 20l6). The reactive cycles include the catalytic destruction of O3, which has led to the widespread assumption that O3 levels in volcanic plumes are depleted with respect to the atmospheric background.
The conclusion that the observed amounts of reactive halogens in volcanic plumes lead to depleted O3 levels is, however, by no means trivial. Field studies (using CL as well as short-path UV absorption instruments) have shown varying degrees of O3 depletion across different volcanoes, in some cases up to 90 % O3 loss compared to ambient levels were reported (e.g. at Mount St. Helens, USA, see Hobbs et al., l982). In other cases, no O3 depletion was found (e.g. at Kilauea, Hawaii, USA, see Roberts, 20l8) which was explained by low concentrations of halogens and is supported by measurements of e.g. Kern et al. (2020). Elementary calculations assuming a constant influx of O3, a basic turbulent mixing scheme and the BrO self-reaction as a rate determining step for the O3 destruction in volcanic plumes, suggest that the influx should largely compensate O3 destruction. Therefore, these simple calculations predict negligible (<1 %) O3 destruction in volcanic plumes (Rüth, 2023). Conversely, model studies with more evolved multiphase atmospheric chemistry mechanisms predict significant destruction of O3 in volcanic plumes (e.g. Surl et al., 2021; Nies et al., 2025, see Supplement Fig. S1) in accordance with some observations (e.g. Surl et al., 2015).
Measuring O3 levels in volcanic plumes is challenging and often relies on substantial logistical efforts such as aircrafts or requires specific meteorological or topographical conditions to access the plume with ground-based instruments. The aim of this study is to provide a technique for reliable O3 measurements in volcanic plumes. Building upon previous studies, this work focuses on employing gas-phase chemiluminescence (CL)-based O3 monitors on a drone for volcanic plume measurements (Hobbs et al., 1982; Vance et al., 2010; Carn et al., 2011).
After a short summary of the CL O3 monitor principle (Sect. 2), we introduce our small and lightweight CL O3 monitor, VOLCANO3 (Sect. 3). In Sect. 4, we present field measurements including planetary boundary profiles and O3 measurements in the volcanic plume of Mt. Etna, Italy, which show significant O3 depletion compared to the ambient atmosphere. We further discuss future technical developments (Sect. 5) and applications (Sect. 6) of VOLCANO3.
The operation principle of CL O3-Monitors relies on the generation of chemiluminescent species through reactions involving O3. By measuring the emitted photon flux, it is possible to infer the concentration of O3. There are various CL reactions involving O3 that are employed in CL O3 monitors. In this study we used C2H4 which we further motivate below in Sect. 2.1. Nederbragt et al. (l965) were the first to make use of this chemiluminescent reaction to determine O3 near an accelerator and Warren and Babcock (l970) then described the construction and calibration of such a monitor.
The reaction of O3 with C2H4 produces various products (detailed in e.g. Kleindienst et al., 1993; Rüth, 2023), including electronically excited species that emit photons upon de-excitation. The number of emitted photons, directly measured by a photomultiplier tube (PMT), is proportional to the O3 concentration and thus to the O3 volume mixing ratio . In addition to being proportional to the O3 mixing ratio, the number of photons emitted per second is influenced by several other parameters, including the quantum yield of the reaction, the ambient temperature and pressure, as well as the concentration of C2H4, regulated through the C2H4 flow () in mL s−1 (or 10−6 m3 s−1). In order to determine the O3 volume mixing ratio (), the measured photomultiplier tube (PMT) signal has to be converted according to the theoretical description and calibrated experimentally using an O3 generator,
where γ denotes the number of photons generated per second, Q the detector quantum efficiency of the PMT, k1(T) denotes the reaction rate constant of O3 with C2H4 in cm3 molec. s−1, p is the ambient pressure in Pa, T the ambient temperature in K, Vcell the measurement cell volume (in this study 20 mL), ftot the flow rate of the pump in mL s−1 (or 10−6 m3 s−1) with the residence time in the cell, kb the Boltzmann constant and is the “conversion factor” given in 10−6 Ks J−1 (or Ks/Pa mL = Ks/(Pa m3)).
Note that the quantum efficiency Q also includes the probability of a CL photon to actually reach the photocathode of the PM. We estimate this probability at about 15 % for a reflectivity of the reaction chamber walls of RW=0.7. For an in-depth description of the theoretical basis see (Rüth, 2023; Bräutigam, 2022).
Selection of chemiluminescence technique
The ethylene chemiluminescence (ET-CL) reaction was selected for ozone detection in UAV applications because it provides high photon yield in the visible range (λ≈ 440 nm) and operates stably without active drying. In contrast, the nitric oxide chemiluminescence (NO-CL) reaction produces electronically excited NO2*, emitting primarily in the red–near-infrared region with a broad maximum around 1200 nm (Clough and Thrush, 1967). These long-wavelength photons have lower energy and are detected with markedly reduced quantum efficiency by standard photomultipliers, requiring active cooling to suppress high dark current noise. Such detector assemblies substantially increase mass and power consumption, which is a critical aspect of UAV applications.
The effect of water vapour also differs fundamentally between the two chemiluminescence systems. For NO-CL, water acts as an efficient collisional quencher of NO2* emission, strongly reducing signal intensity and linearity (Matthews et al., 1977). For ET-CL, in contrast, water vapour slightly enhances the chemiluminescence signal through secondary excitation of formaldehyde and OH* products, leading to a small positive bias rather than suppression (Kleindienst et al., 1993). Consequently, the humidity response of ET-CL can be accounted for in the measurement uncertainty, whereas NO-CL requires complete gas drying and thermal stabilisation to achieve reproducible sensitivity. Measurements with the VOLCANO3 instrument are typically performed in volcanic plumes that have cooled to ambient atmospheric temperature, so that atmospheric water vapour concentration cannot exceed local saturation level. Typical H2O concentrations range from 1000–20 000 ppmv and are lower at high altitudes and cold atmospheric temperatures. This adds an uncertainty of O3 measurements of not more than about ±4 ppbv even when assuming a relatively high 10 000 ppmv water vapour content as “standard”. Note that even though water vapour is the most abundant component of volcanic emissions, its mixing ratio cannot exceed saturation level.
Considering these differences in spectral emission and related detector requirements as well as the response to humidity, the ET-CL configuration provides the favourable analytical performance, stability under ambient conditions, and compatibility with compact, low-power UAV payload operation.
Although ethylene is flammable, only a very small amount of gas was used, contained in a sealed aluminum minicylinder. The instrument was usually operated in the open atmosphere. The gas volume was far below limits typically relevant for hazardous classification. Consequently, the ET-CL setup did not represent a relevant safety risk during field deployment.
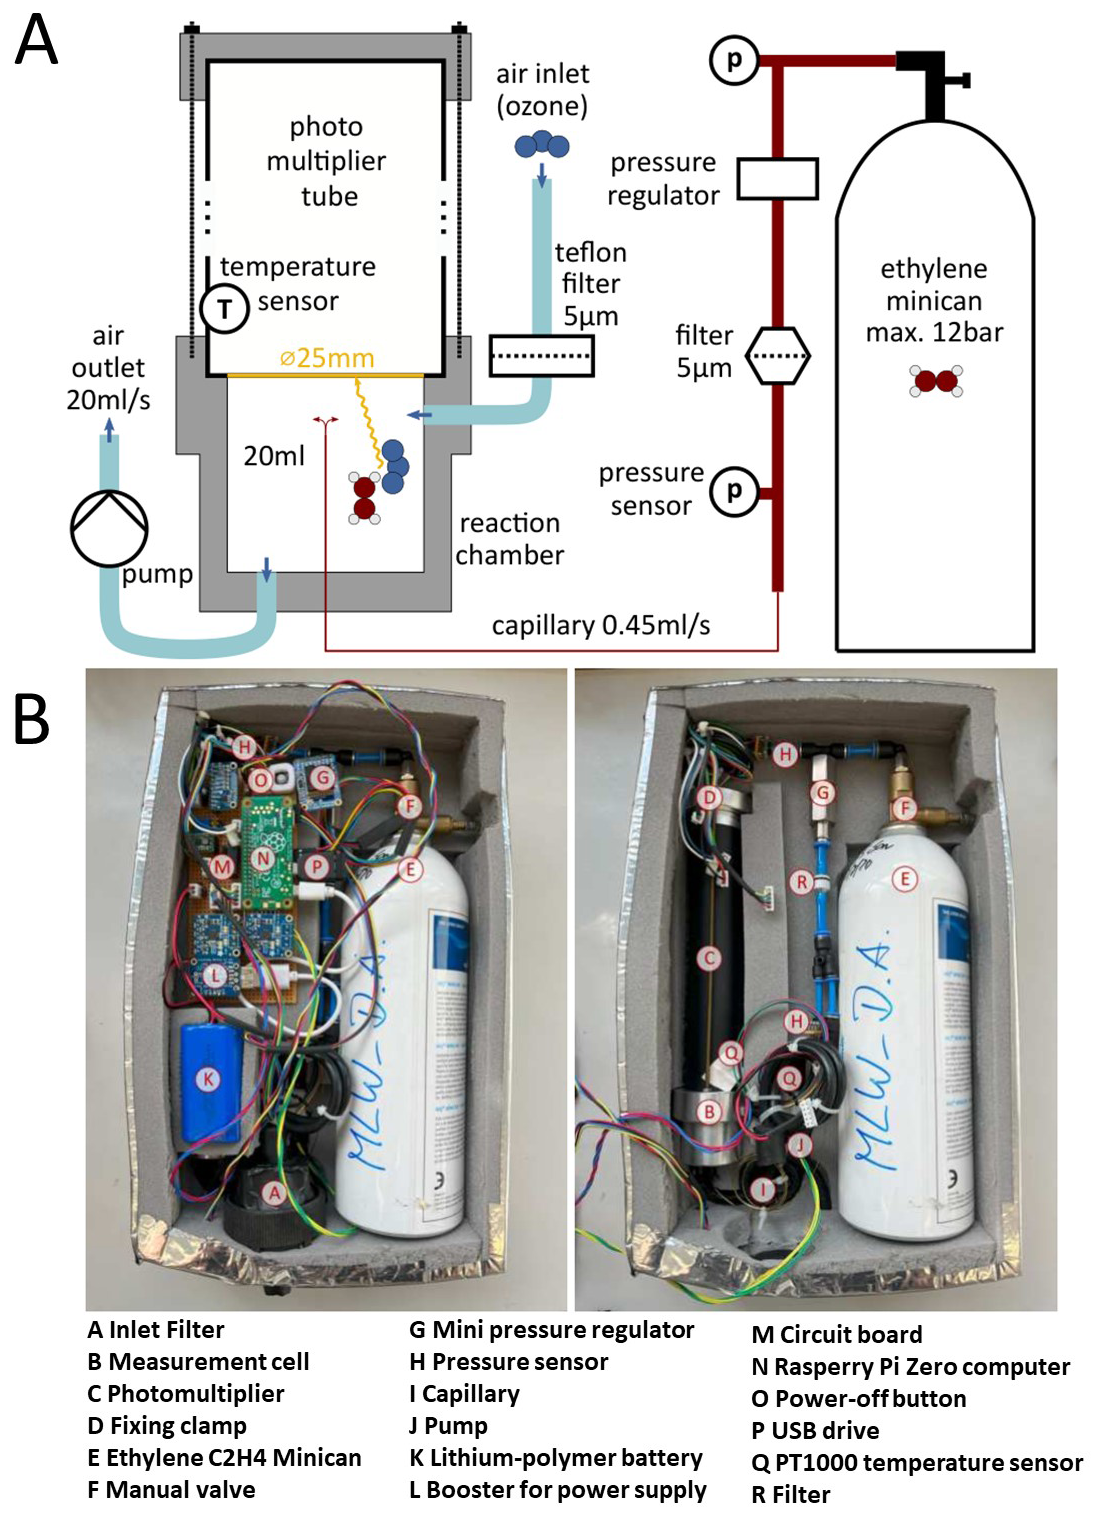
Figure 1(A) Schematic drawing of the CL O3 monitor setup (without the electronics). Figure taken from Bräutigam (2022). (B) Fully assembled monitor with the cover open in the photo on the left. In the photo on the right, the electronics have been removed to provide a better view of all parts of the monitor.
3.1 Configuration
In Fig. 1A a simplified schematic drawing of the monitor VOLCANO3 is shown (Bräutigam, 2022) and Fig. 1B displays a photograph of the instrument. It has the dimensions cm and weighs around 1.5 kg. VOLCANO3 consist of the following components: (1) a reaction chamber, (2) a pump, (3) an ethylene minican (4) a photomultiplier module, (5) a circuit board and a Raspberry Pi computer and (6) a lithium-polymer battery. Ambient air enters the instrument through an aerosol filter (A: Schematic drawing of the CL O3 monitor setup (without the electronics). Figure taken from Bräutigam (2022). B (part A)) and is then directed through a black Teflon hose (two windings to suppress ambient light entering the measurement cell through the hose) into the measurement cell (aluminium with a volume V=20 mL, Fig. 1b, (part B)), where it is mixed with C2H4. The measurement cell is fixed to the PMT (Fig. 1b, (part C)) enabling the measurement of the photons emitted by the air + ethylene mixture. The PMT (Hl0493-00l from Hamamatsu Photonics GmbH) is the central part of the instrument and main reason for the weight and size reduction due to its internal high voltage supply and preamplifier electronics. In contrast to the most commonly applied CL-monitors, the PMT is operated without temperature stabilisation (rather the temperature effect is compensated during signal evaluation, see Sect. 3.2), thus significantly reducing the power consumption of the monitor to only 3 W. Ethylene is supplied from a minican (Vbottle=1 L, maximum overpressure Pa (Fig. 1b, (part E)). The C2H4 flow into the measurement cell is regulated via a pressure regulator and a capillary.
The gas mixture leaves the instrument through the airflow generated by the pump (model G 6/0l-K-LC). Ambient temperature and pressure, as well as the temperature at the PMT are also monitored in order to convert the measured signal to the O3 mixing ratio. All relevant data (date, time, temperature, ambient pressure, output voltage of the PMT, pressure of the minican) is recorded by the microprocessor (Fig. 1b, (part N)) on a USB drive (Fig. 1b, (part P)) and also shown on a small display to ensure operational functionality of the device during the measurement.
3.2 CL-Monitor Characterization
3.2.1 PMT Dark current
Since the PMT used is not temperature stabilised, the dark current (measurable signal if no photons hit the photosensitive area) is a temperature-dependent variable for which a correction is required. The temperature dependence of the dark current compiled from several measurements is shown in Fig. 2.
In order to subtract the dark current as a function of temperature from the data the Richardson function (see Eq. 3) is fitted:
The parameters a1, b1, c1 are determined at regular intervals. Typical values are mV K−2, K, and mV.
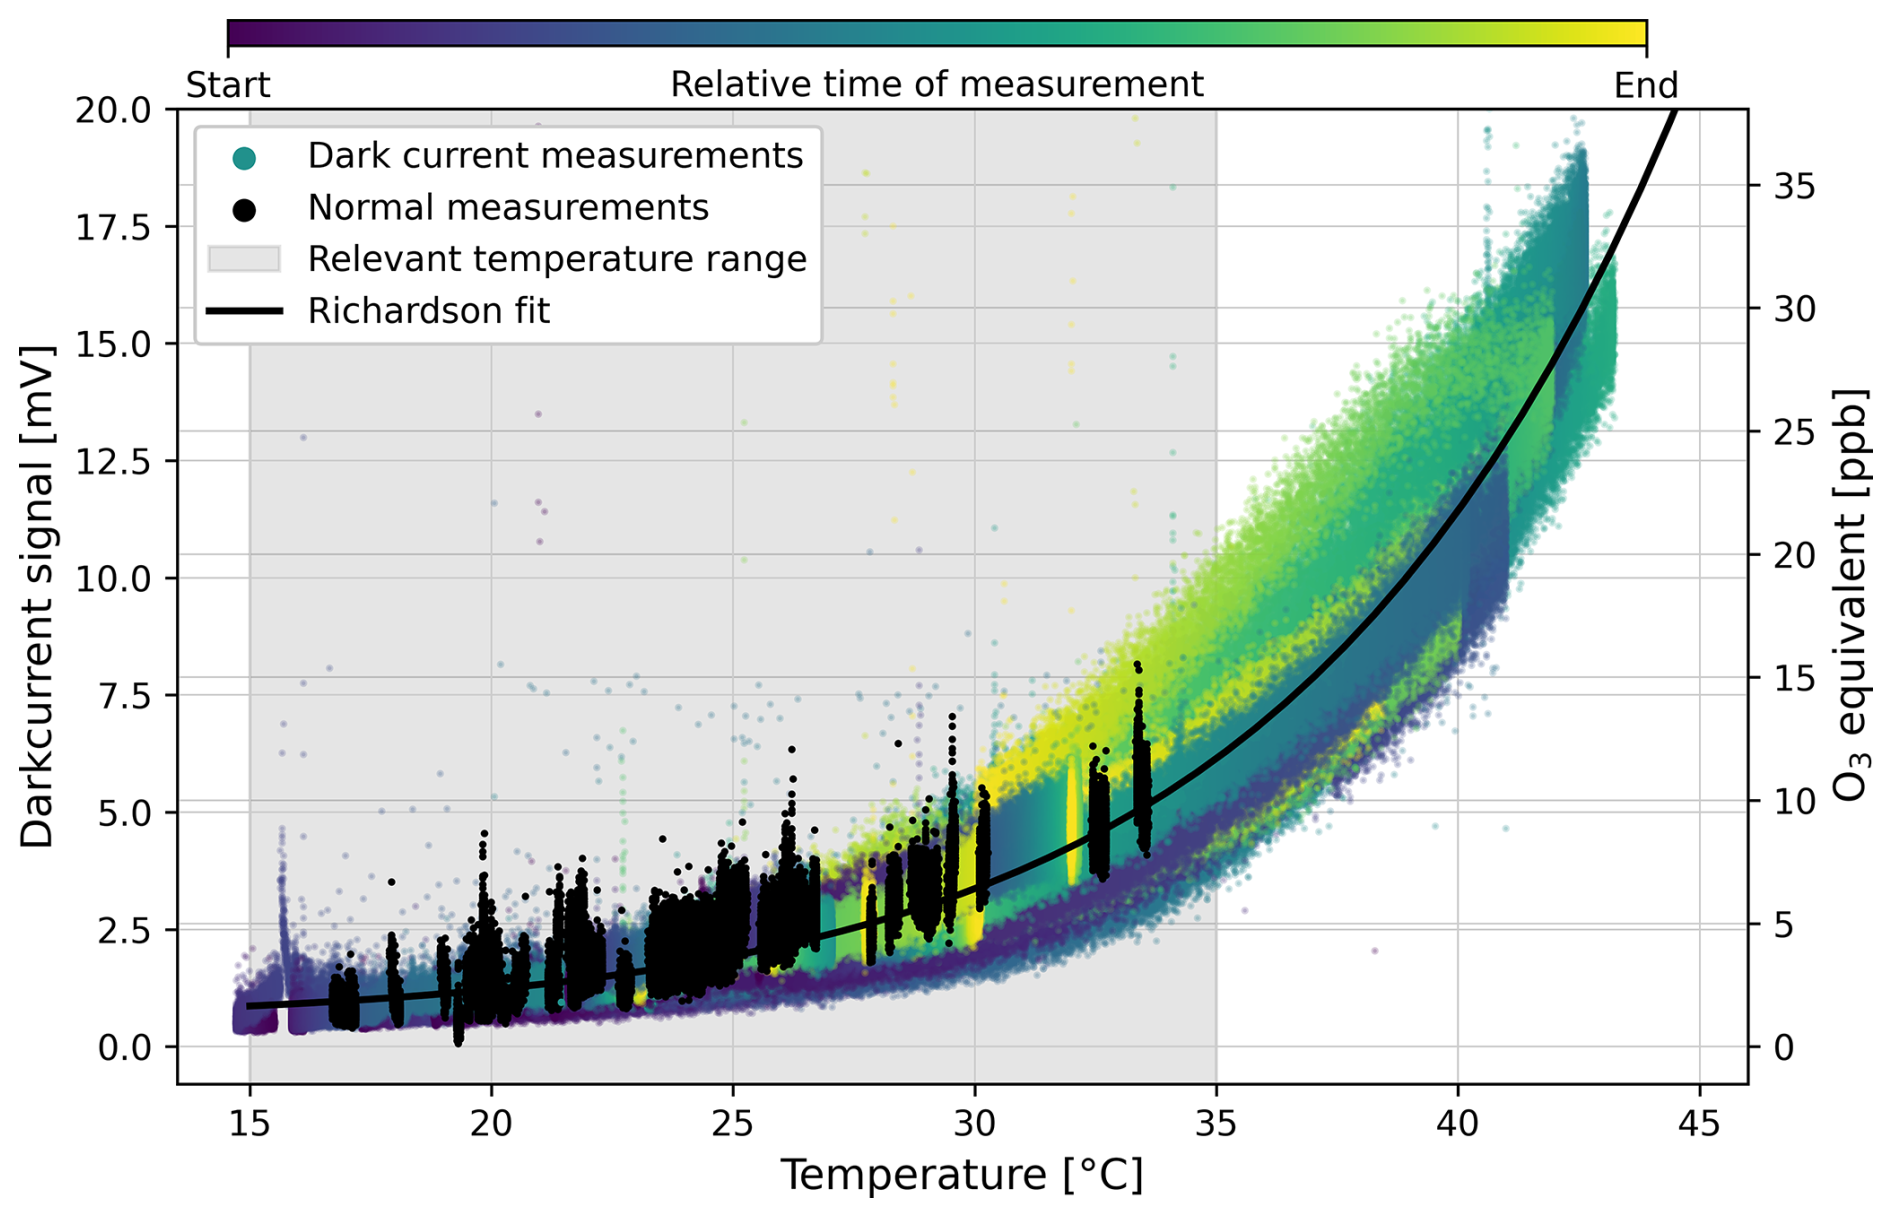
Figure 2Temperature dependence of the dark current. The colour shade of the datapoints indicate time from blue (start of the measurement) towards yellow (end of the measurement). The black points represent “normal” O3 measurements during which also dark current periods were recorded. The data is fitted with a Richardson fit (see Eq. 3, parameters: mV K−2, K, mV) which is then used to correct the temperature dependence of the dark current.
The uncertainty arising from the dark current correction is determined by the mean deviation of the measurement to the fit S0,mean, leading to a propagation into the uncertainty of the O3 determination of only 1 ppbv. Temperature is the dominant driver of the dark current signal, minor signal deviations are additionally corrected by an easy pragmatical solution, subtracting the S0,mean from each measurement. Then the dark current corrected signal Scorr is calculated as:
where S is the measured signal, S0(T) the temperature dependent dark current as derived by Eq. (3), and S0,mean the mean fit residuals from the dark current temperature correction given in mV, because the output signal of the PMT is measured in mV.
3.2.2 Calibration
The CL method is not a direct measurement technique, therefore, in order to calculate the O3 mixing ratio from the measured PMT-signal an experimental calibration is needed, based on the theoretical considerations in Sect. 2. (Eqs. 1 and 2):
where acal represents the calibration constant.
Combining the above Eqs. (2) and (5) we obtain an equation for the O3 mixing ratio :
where ccon is the theoretically determined conversion factor (see Sect. 2). Here, no calibration offset is necessary, since any potential offset in the data is taken care of by applying the dark current correction.
The CL O3 monitor is calibrated using an O3 generator, in our study primarily the Ozone Calibration Source Model 306 by 2B Technologies. It is a portable O3 generator and can provide O3 in the range of 0 to 1000 ppbv. Additionally, the O3 generator ANYSCO type SYCOS KT-O3/SO2, which can provide 0 and 150 ppbv of O3, was used. In both instruments, ambient air is used as the feed gas and ozone is generated photolytically by UV irradiation of oxygen-containing air. Before entering the photolysis chamber, the incoming air is cleaned, and in the case of the O3 generator ANYSCO type SYCOS KT-O3/SO2 it is additionally dried by passage through a silica-gel drying tube.
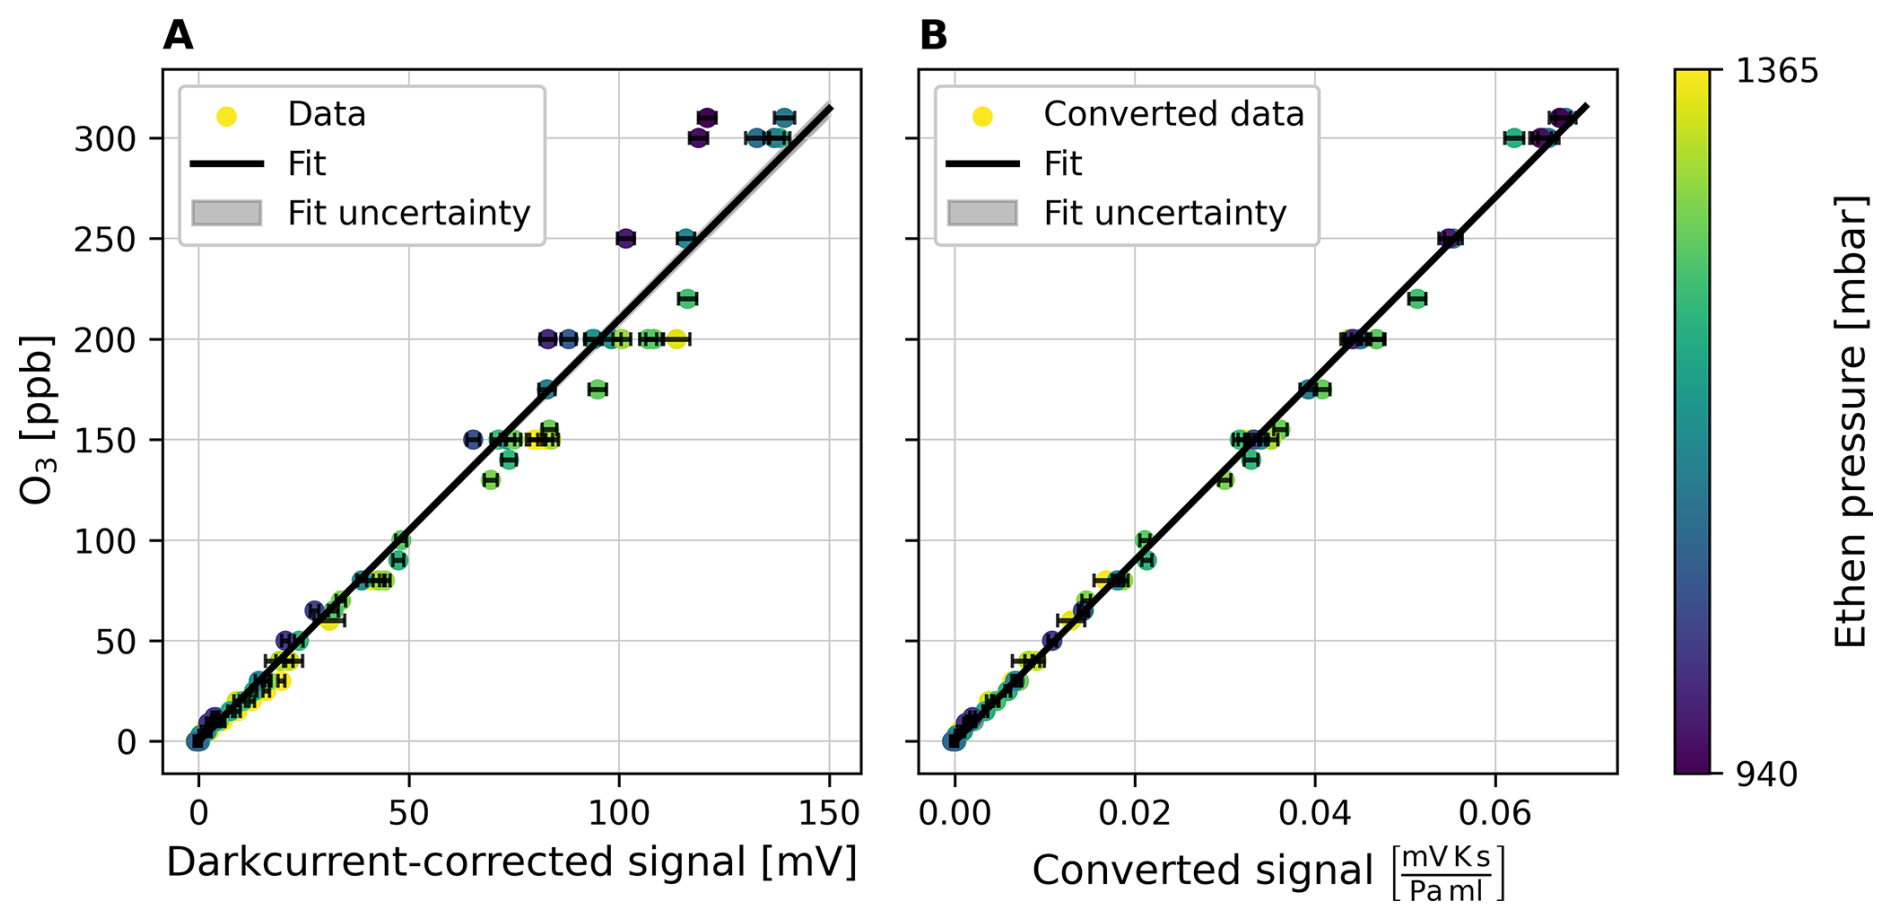
Figure 3Calibration plot of the CL O3 monitor. To obtain the data points, the signal is averaged over periods of constant O3 mixing ratios and the uncertainty is given by the standard deviation. The color of the data points indicates the respective C2H4 pressure pC2H4. On the left side, the calibration plot with the dark current corrected signal is shown. Strong deviations from the calibration fit can be seen in the data points. After the conversion, on the right side, the calibration curve fits the data points significantly better. For both cases the calibration fit with the fit parameters as well as root mean squared error (RSME) is shown.
For calibration the CL O3 monitor is directly connected to the O3 generator using a hose. We set the ozone mixing ratio at discrete steps (e.g. 0, ∼ 10, ∼ 50, ∼ 100, ∼ 150 ppbv) and held each step for several minutes to ensure sufficient statistical averaging. For each of these steps of constant O3, the mean and the standard deviation of the converted signal are calculated and plotted against the sampled O3 mixing ratios as shown in Fig. 3. A linear fit is performed; its fit parameters are then used for the calculation of the O3 concentrations. Although VOLCANO3 demonstrated stable behaviour, it is advisable to perform a regular calibration check before each measurement campaign.
3.2.3 Detection limit and measurement uncertainty
Both, the detection limit and the measurement uncertainty are crucial characteristics of any instrument. Following the definition of Gold (20l9) the detection limit (also referred to as limit of detection (LoD)) is the “minimum single result which, with a stated probability, can be distinguished from a suitable blank value” (Gold, 20l9, p. 399). To determine the uncertainty of the mixing ratio of O3, error propagation is applied to Eq. (6) for :
Signal uncertainty, ΔS, is deduced from the standard deviation σS of constant O3 periods, represented by:
ΔS0 is the uncertainty from temperature-corrected dark current, approximated as the mean deviation from the measurement to the fit, around 0.5 mV. Calibration uncertainty is quantified by Δacal=24 (hPa mL/(mV K))
The uncertainty from signal conversion is estimated from the mean deviation of experimental data to theoretical description, about 4 %.
The fifth term in Eq. (7) accounts for the well-established positive interference of water vapour on ethylene chemiluminescence. This interference is approximately 3–4 ppbv O3 per 10 000 ppmv H2O. As volcanic plume measurements are conducted at ambient atmospheric conditions, water vapour cannot exceed local saturation and typically ranges between 1000 and 20 000 ppmv.
To include this effect in the instrument uncertainty, we assume a typical value of 10 000 ppmv and thus treat the humidity bias as a constant additive systematic uncertainty, , given by:
For a representative signal of S=20 mV, corresponding to O3 mixing ratio of 40 ppbv, the uncertainty analysis is:
The detection limit, assuming mV, is approximated as:
3.2.4 Response time
In order to determine the response time of the monitor experimentally, step changes in the O3 mixing ratios are of interest. To circumvent the ozone generator's response time, one can produce a consistent O3 mixing ratio using the generator, but without attaching the hose to the monitor. Once a stable mixing ratio is achieved, the hose can be swiftly connected and disconnected to and from the monitor, respectively. The step change recorded in this manner should reflect the response time of the O3 monitor.
To these increasing and decreasing step changes exponential increases and decreases are fitted, respectively. For the calculation of the response time increases and decreases are treated equally and only fits with a R2 larger than 0.9 are used. The experimental response time changes of the monitor, determined from 25 step changes fulfilling the above requirements, results to s.
4.1 Vertical atmospheric profile
Vertical atmospheric O3 profiles in the planetary boundary layer (PBL) with a high spatial resolution are still surprisingly rare. Some O3 profiles were taken in the frame of this study using an UAV (Matrice300 RTK) as a vehicle to transport the VOLCANO3 monitor to different heights of the PBL. One example of our measurement results is given in Fig. 4. The measurement was carried out at the southern flank of Etna, at Piano Vettore, Italy on 16 June 2023 and shows the increase of O3 mixing ratios from about 50 ppbv to nearly 100 ppbv for an elevation change from about 1700 to about 2500 m a.s.l.
4.2 Measurements in the volcanic plume of Mt. Etna
As mentioned in the introduction, the CL technique has particularly unique advantages when applied to O3 determination in volcanic plumes. Therefore, we performed a first measurement campaign at the volcano Mt Etna to investigate the O3 distribution of its plume.
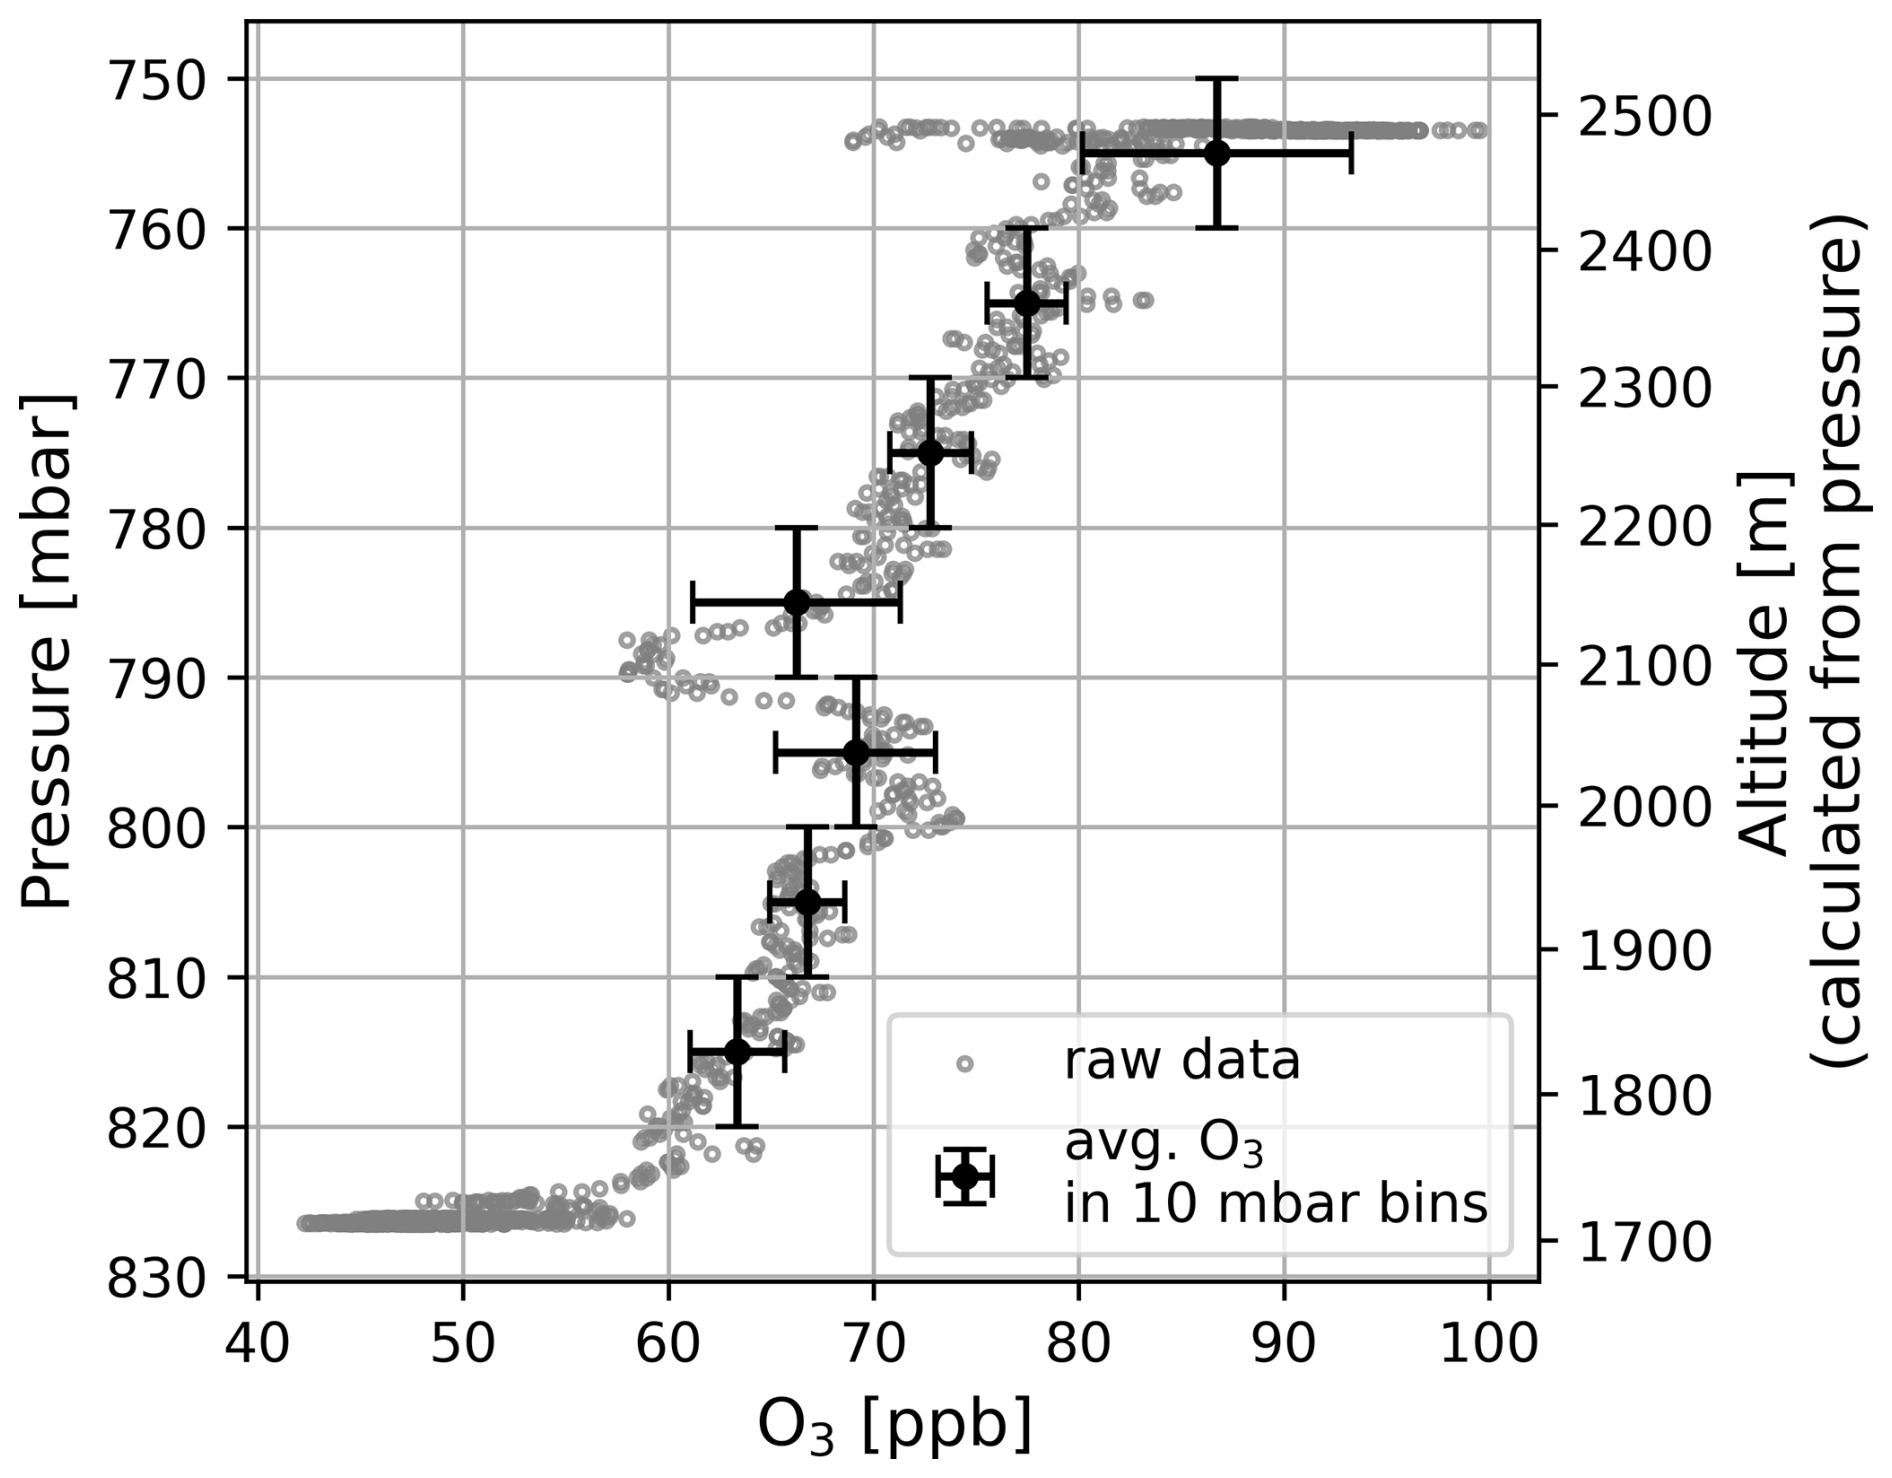
Figure 4Vertical O3 profile for a measurement performed at Piano Vettore on 16 June 2023 during the Mt. Etna field campaign. The data points (and uncertainties) are determined by averaging the O3 mixing ratio for all data points within a pressure bin of 10 mbar. The O3 mixing ratio increases with height (increases with decreasing ambient pressure).
4.2.1 Measurement Site and conditions
Mt. Etna, located at the eastern coast of Sicily, is one of the most active volcanoes globally and is characterized by significant continuous gas emissions. Geological evidence suggests it has been active for approximately 0.6 million years. The summit area of Etna, reaching to about 3350 m above sea level during the campaign had four active summit craters: Bocca Nuova (BN), Voragine (VOR), Southeast crater (SEC), and Northeast crater (NEC).
Our field measurement campaign was conducted from 5 to 18 June 2023. During this period, Etna exhibited continuous outgassing primarily at Bocca Nuova and Southeast crater, with moderate SO2 fluxes and consistently high CO2 levels (INGV National Institute of Geophysics and Volcanology, 2023a, b).
4.2.2 Instrumentation and data evaluation
The measurement campaign employed the following instruments:
-
CL O3 monitor “VOLCANO3”
-
SO2/CO2 sensor “little-RAVEN” (Karbach et al., 2022) with 868 MHz radio link (RFDesign, approx. 3 km range), GPS module for time and position (MTK3339 Adafruit), Alphasense electrochemical SO2 sensor (calib. range: 0–16 ppmv), CO2 sensor (K30 FR Senseair, not used in this work), temperature, humidity & pressure sensor (BME280). Total weight: approx. 300 g
-
Drone “Matrice 300 RTK”, DJI, https://enterprise.dji.com/de/matrice-300/specs (last access: 21 December 2025)
The little-RAVEN sensor system, designed around an ESP microcontroller (ESP32 from Espressif), manages various sensors to determine SO2, CO2, temperature, humidity, pressure, and GPS location. It logs data onto internal memory and also transmits it to a ground station, allowing real-time localisation of the plume and confirming plume gas measurements. For this work, Little-RAVEN was used as a stand-alone system which could be attached to the measurement drone to provide the aforementioned information simultaneously with the ozone measurements. The Matrice 300 RTK drone, with a maximum payload of 2.7 kg, was utilized for carrying the VOLCANO3 CL O3 monitor and the little-RAVEN system. The total equipment weight for the measurements was approximately 15 kg, including the instruments, the drone, and the ground station consisting of a notebook, a tripod and an antenna.
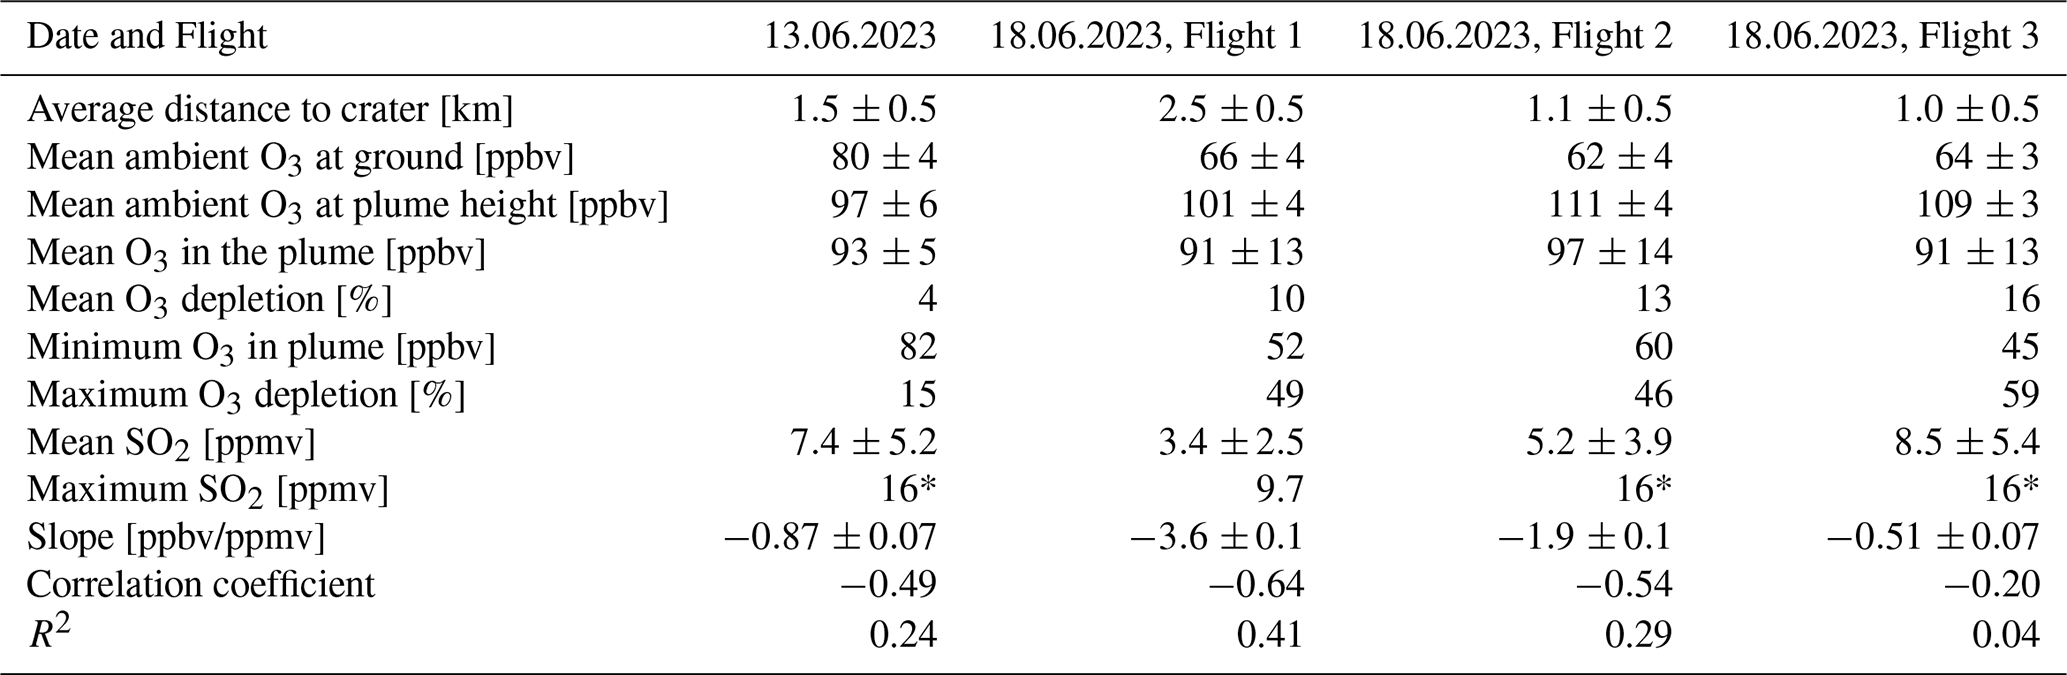
Table 1Summary of the plume measurement results. Mean ambient O3 levels at the ground and at the height of the plume are determined by averaging over the respective periods determined by the ambient pressure (and excluding data points with SO2 mixing ratios larger than 0.5 ppbv). The maximum SO2 value marked with a * indicates that the sensor was in saturation and the real value is likely higher than reported. The mean O3 inside the plume is obtained by averaging over periods for which SO2>0.5 ppmv and below 16 ppmv. The mean O3 depletion is determined by comparing the mean O3 inside the plume with the mean ambient O3 at height of the plume. The maximum O3 depletion is calculated using the minimum O3 value inside the plume and comparing it to the ambient O3 at height of the plume.
4.2.3 Volcanic plume measurements and results
During the campaign, a total of four drone flights through the volcanic plume were conducted. The flight paths of all four plume measurements are shown in Fig. 5 and the main findings of the four plume measurements are summarised in Table 1.
Flight 1) On June l3th, the VOLCANO3 mounted on the drone sampled the BN plume (black flight path in Fig. 5). The drone started at the Barbagallo craters (the upper pyroclastic cone from the 2002 eruption), south westerly of the SEC. Figure S2 displays the data obtained from this flight. The meteorological conditions were sunny with some clouds and with wind blowing mainly from North with low wind speeds. Due to the low wind speeds the plume rose before drifting to the south.
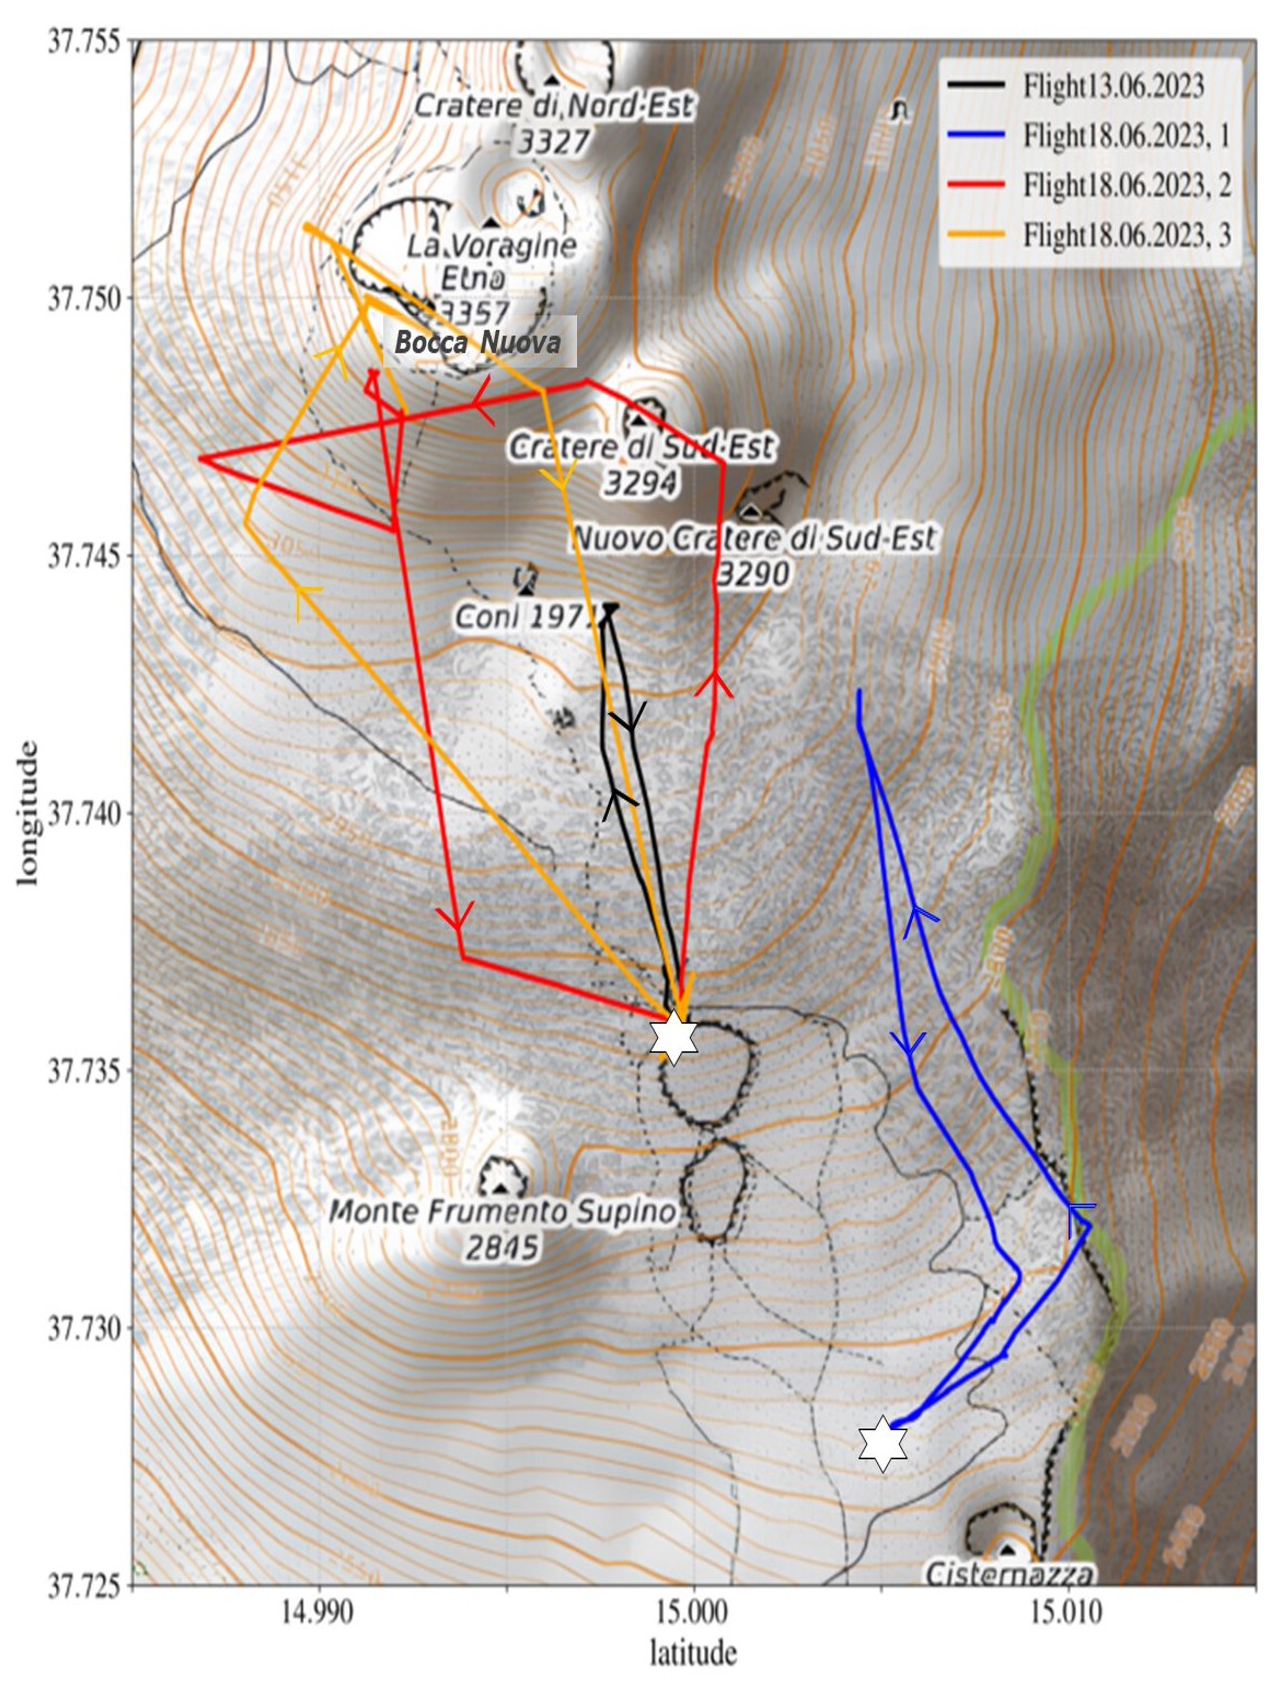
Figure 5Map of the summit area of Etna with the flight paths for the four plume measurements. The measurement on 13 June, as well as 18 June, 3, sampled the BN plume. The first flight on 18 June, 1, manoeuvred through the SEC plume and the second flight on 18 June, 2, first sampled the SEC plume before measuring the BN plume. The white stars indicate the launch and return points of the drone. Map data: © OpenStreetMap contributors (OpenStreetMap), SRTM | Map display: © Open-TopoMap (CC-BY-SA).
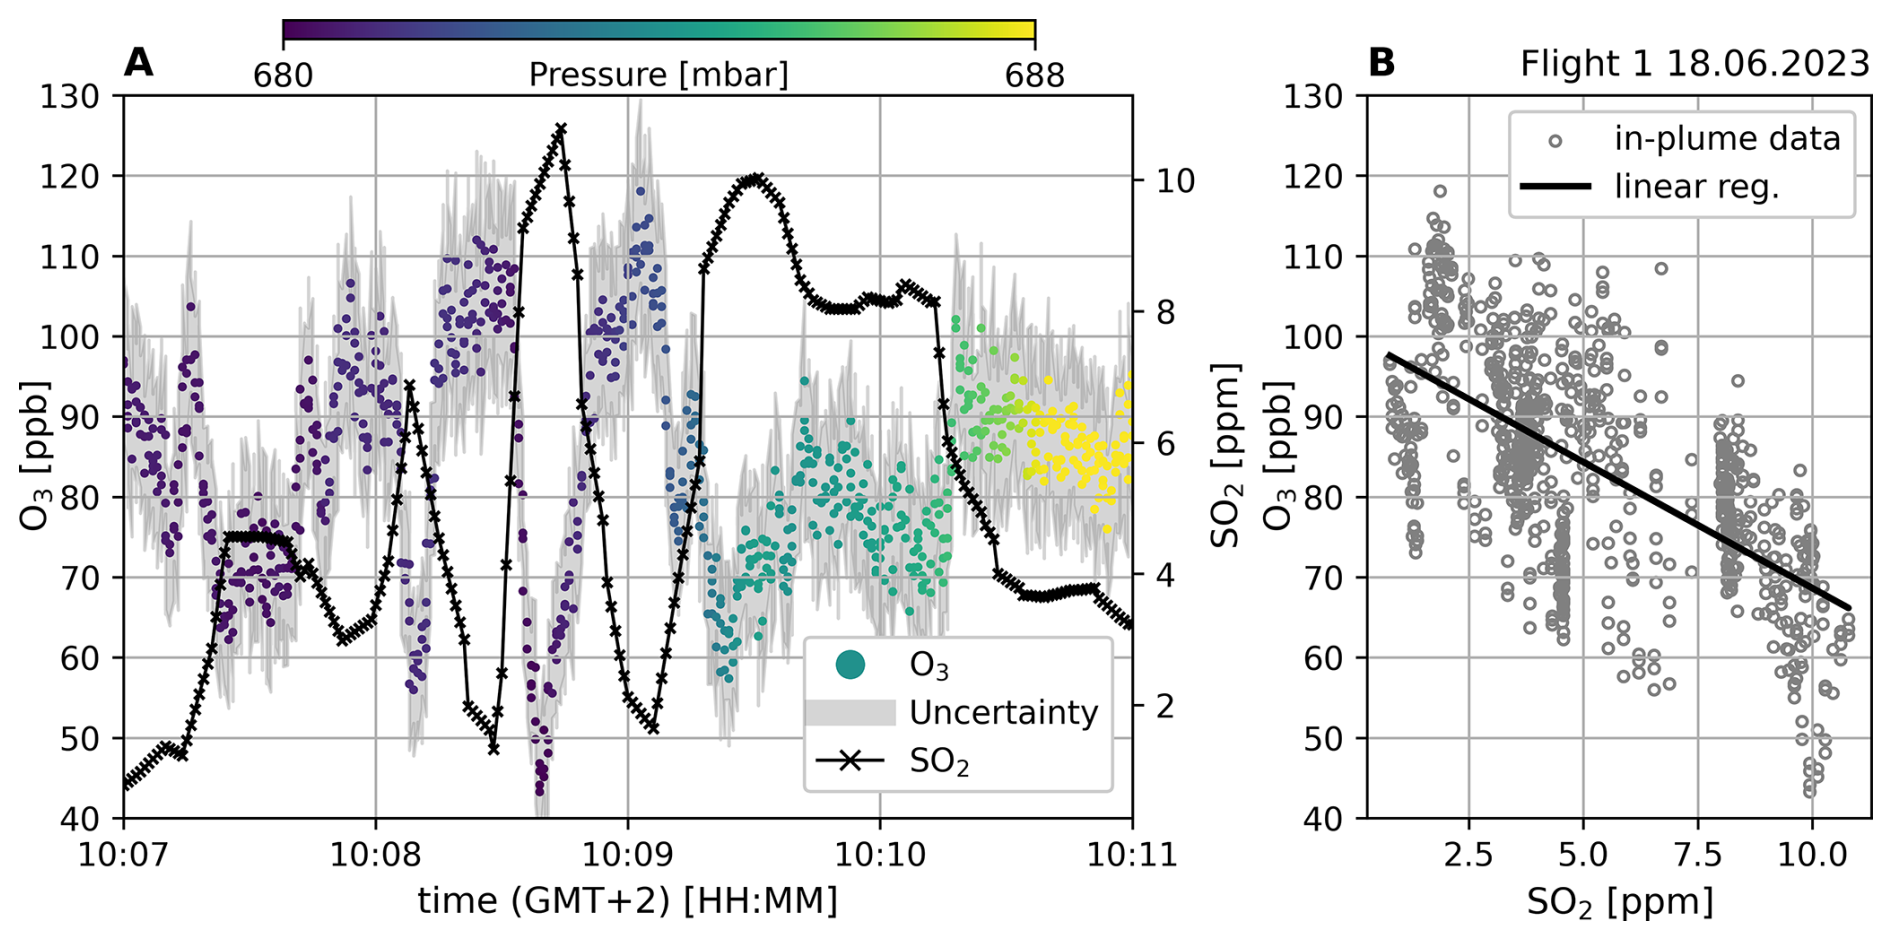
Figure 6Plume measurement from 18 June 2023 measuring the SEC plume (see Fig. 5 blue line). Panel (A) shows the time series from the CL instrument and a co-deployed (multi-gas) SO2 sensor. The colour-coding indicates ambient pressure during sampling and the grey shaded area marks the uncertainty of the CL O3 measurement. Panel (B) shows a correlation plot between O3 and SO2 for in-plume data points. In-plume datapoints are defined according to the SO2 mixing ratio for values larger than 1.5 ppm and smaller than the saturation value of 16 ppmv. The correlation has a Pearson correlation coefficient of −0.64 and an R2 of 0.41.
On 18 June three more flights were carried out:
-
Flight 1: The first flight on that day started south-southeast of the Barbagallo craters, north-northwest of the Cisternazza (a subsidence crater from 1792) and the pyroclastic cone from the 2001 eruption and navigated through the SEC plume, the measurement is depicted in Fig. 6 and the flight path shown in Fig. 5 in blue color. O3 and SO2 exhibit a strong anticorrelation with a Pearson correlation coefficient of −0.64 and an R2 value of 0.41 (see Table 1).
-
Flight 2: The subsequent flight first sampled the SEC plume before measuring inside the BN plume. This measurement is shown in Fig. S3, the flight path can be seen in red on Fig. 5.
-
Flight 3: The final flight on the 18 June 2023 focused solely on sampling the BN plume, which can be seen in Fig. S4. The flight path is indicated in orange on Fig. 5.
These two latter flights started from the northern rim of the Barbagallo crater. The weather was sunny, and only little wind, mainly from the north, this meant that the plume ascended and was not pushed down. Although conditions for gas sampling aboard drones were ideal, ground-based measurements within the exhaust plume would have been impossible on that day, illustrating well the strength of the newly developed instrument.
In all of these measurements an anti-correlation of O3 and SO2 levels is visible. The ambient O3 fluctuations are in the range of 5 ppbv, whereas within the plume variations of up to 60 ppbv are observed. Unfortunately, the SO2 sensor is only able to measure SO2 mixing ratios of up to 16 ppmv, leading to higher values being cut off. This obscures part of the correlation. In particular, during the third measurement on the 18 June 2023, the SO2 sensor frequently reaches its maximum value within the plume, at 16 ppmv SO2. Nevertheless, a clear anti-correlation of SO2 and O3 can be observed for all measurement flights, characterized by a R2 of 0.04–0.41.
Based on the first miniaturised VOLCANO3 CL O3 monitor prototype described here a number of improvements of our CL O3 monitor are clearly possible. Our field measurements suggest that the instrument would profit from further size and weight reduction to enhance aerodynamic properties and flight stability of the carrying drone.
The largest components of the instrument are the PMT, the Teflon aerosol filter and the C2H4 minican. Using a smaller aerosol filter would reduce weight and size significantly. The minican itself is voluminous but quite lightweight, although the minican adapter is particularly heavy. A custom-made adapter might solve this problem.
Exploring other gases (or liquids with high vapour pressure) than C2H4 to induce chemiluminescence might lead to a better photon yield of the luminescence and may also present an opportunity to further reduce the size of the instrument. For example, trimethylethylene and tetramethylethylene, (C6H12) might be used. Both species are liquid at room temperature and exhibit a by a factor of 50 higher quantum efficiency and thus emission intensity compared to that of the C2H4-O3 reaction (Pitts Jr. et al., 1971). Storing the reactant in the liquid phase would significantly reduce the volume of the monitor without reducing the amount of reactant available. With the vapour pressure of 185 mbar (ChemSpider, 2023), C6H12 is available with a mixing ratio of %. If the C6H12 flow is set to around 10 % of the total flow, C6H12 could also be supplied to the measurement cell with a mixing ratio of ≈ 2 % (which is the mean mixing ratio of C2H4 in the current setup).
As mentioned above, the PMT is a rather bulky part of the instrument, in principle it could be replace by one or several avalanche photodiodes (also known as silicon photomultipliers), which would save space and weight.
Furthermore, the fraction of CL-photons reaching the detector could be enhanced by lining the interior surface of the present aluminium fluorescence cell (RW≈0.7) with material of higher reflectivity, for instance with “spectralon-type” material (e.g. ODM98 from Gigahertz Optik GmbH), (RW>0.96–0.99), which would enhance the signal by at least a factor of 2, for details see Bräutigam (2022).
Although the current control unit, based on a Raspberry Pi microcomputer is not very large it could still be replaced by a smaller microcomputer unit like an ESP microcontroller for instance. To summarize, there is still room for improvement, but the current instrument is already working excellently.
Our newly developed lightweight VOLCANO3 CL O3 instrument marks a significant advancement in O3 monitoring technology. Weighing only 1.5 kg and with substantially smaller dimensions compared to commercially available CL-O3 monitors (minimum weight of about 15 kg, which is an order of magnitude heavier and a volume more than five times larger as the monitor presented here) (see e.g. https://www.teledyne-api.com/en-us/Products_/Documents/Manual/T265 Manual Addendum_07337.pdf, last access: 21 December 2025).
Additionally, a notable reduction in power consumption was achieved, with VOLCANO3 consuming now about 3 W, which is also several times smaller than current commercially available instruments.
Calibration measurements in Heidelberg, as well as measurements in the field, showed the monitor's capability to reliably measure O3. While signal corrections are imperative for deducing the O3 mixing ratio, a detection limit of 4.16 ppbv and a measurement accuracy of around 7 % for 40 ppbv O3 (∼ 2.8 ppbv) were accomplished, with a response time of s.
With this miniaturised monitor we successfully detected significant O3 depletions within the volcanic plume ranging up to 60 %. While our finding is consistent with measurements by Surl et al. (2015) (15 %–45 %) and Vance et al. (2010) (15 %–40 %), which also indicate a strong anti-correlation between SO2 and O3, the observed O3 depletion within the volcanic plume presents still an intriguing scientific puzzle. For instance, to fully answer the question on O3 distributions in volcanic plumes and if O3 might be a limiting factor on the bromine transformation in volcanic plumes, more comprehensive measurement campaigns are essential and care should be taken to complement the O3 measurements by applying an SO2 sensor which covers the entire range of SO2 mixing ratios in the plume under investigation. It would be worthwhile to study various volcanoes to get a more complete picture. The examination of further high halogen emitting volcanos (additionally to Etna), such as Soufriere Hills and Ambrym as well as rather low halogen emitting volcanos, including the Hawaiian volcanoes such as Kilauea and Mauna Loa, or Copahue in Argentina/Chile would be worth to undertake. Complete plume transects should be conducted in various distances from the volcanic emission source to confirm or disprove our current understanding of the volcanic plume chemistry. Today, our knowledge is mainly based on model studies. Such model studies show for instance a complete ozone depletion in the centre of halogen rich volcanic plume after a relatively short distance from the emission point (about 10 min downwind, Roberts et al., 2014) but a solid experimental proof of these model predictions is still missing.
This CL-O3 monitor applied on an UAV can also be used in other environments to undertake for instance high spatial resolved O3 measurements in biomass burning plumes, over polar ice fields, salt lakes, in the rain forest or cities, to provide high resolution maps of the O3 distribution during day and night (e.g., Guimarães et al., 2019). However, the challenges encountered and the intriguing findings regarding O3 depletion in volcanic plumes highlight the potential.
All relevant data for the conclusions drawn in this manuscript are available on Zenodo: https://doi.org/10.5281/zenodo.17939499 (Rüth et al., 2025).
The supplement related to this article is available online at https://doi.org/10.5194/amt-19-2047-2026-supplement.
MR and EB are the main developers of the VOLCANO3 instrument with support and contributions from UP, RK, JK and NB. MR, NB, AN, TH, NK und BG conducted the field campaign at Mt. Etna and provided complementary data. MR evaluated and analyzed the ozone data. All authors contributed to writing of the manuscript.
At least one of the (co-)authors is a member of the editorial board of Atmospheric Measurement Techniques . The peer-review process was guided by an independent editor, and the authors also have no other competing interests to declare.
Publisher's note: Copernicus Publications remains neutral with regard to jurisdictional claims made in the text, published maps, institutional affiliations, or any other geographical representation in this paper. The authors bear the ultimate responsibility for providing appropriate place names. Views expressed in the text are those of the authors and do not necessarily reflect the views of the publisher.
We thank Christopher Fuchs for his help in the earlier prototype development, Dieter Aletter for his valuable advice and lending us the ozone generator, Heiko Bozem and Peter Hoor for lending us the drone and an ozone generator. We thank two anonymous reviewers and Luke Surl for the careful reading and very helpful suggestions to improve our manuscript. Financial support from TeMaS and TPChange, and DFG Project PL193-23 is gratefully acknowledged. We would also like to thank the Istituto Nazionale di Geofisica e Vulcanologia, Italy, grant “Progetto INGV Pianeta Dinamico (MUSUNGU)” grant – code CUP D53J19000170001 – funded by the Italian Ministry MIUR (“Fondo Finalizzato al rilancio degli investimenti delle amministrazioni centrali dello Stato e allo sviluppo del Paese”, legge 145/2018).
Financial support from TeMaS and TPChange, and DFG Project PL193-23 is gratefully acknowledged. We would also like to thank the Istituto Nazionale di Geofisica e Vulcanologia, Italy, grant “Progetto INGV Pianeta Dinamico (MUSUNGU)” grant – code CUP D53J19000170001 – funded by the Italian Ministry MIUR (“Fondo Finalizzato al rilancio degli investimenti delle amministrazioni centrali dello Stato e allo sviluppo del Paese”, legge 145/2018).
This paper was edited by Dwayne Heard and reviewed by Luke Surl and two anonymous referees.
Bobrowski, N., Hönninger, G., Galle, B., and Platt, U.: Detection of bromine monoxide in a volcanic plume, Nature, 423, 273–276, https://doi.org/10.1038/nature01625, 2003.
Bobrowski, N., von Glasow, R., Aiuppa, A., Inguaggiato, S., Louban, I., Ibrahim, O. W., and Platt, U.: Reactive halogen chemistry in volcanic plumes, Journal of Geophysical Research: Atmospheres, 112, https://doi.org/10.1029/2006JD007206, 2007.
Bräutigam, E.: Construction of an Airborne Chemiluminescence Ozone Monitor for Volcanic Plumes, heiDOK (University of Heidelberg), https://doi.org/10.11588/heidok.00032085, 2022.
Carn, S. A., Froyd, K. D., Anderson, B. E., Wennberg, P., Crounse, J., Spencer, K., Dibb, J. E., Krotkov, N. A., Browell, E. V., Hair, J. W., Diskin, G., Sachse, G., and Vay, S. A.: In situ measurements of tropospheric volcanic plumes in Ecuador and Colombia during TC4, Journal of Geophysical Research: Atmospheres, 116, https://doi.org/10.1029/2010JD014718, 2011.
Carroll, M. R. and Holloway, J. R.: Volatiles in Magmas, Berlin, Boston: De Gruyter, https://doi.org/10.1515/9781501509674, 1994.
Cavanagh, R. R. and Verkouteren, R. M.: Improving the Scientific Basis for Informed Decisions on Atmospheric Issues, NIST-NOAA-Industry Workshop on Atmospheric Measures and Standards, National Institute of Standards and Technology, 2001.
Chemspider: ChemSpider search and share chemistry, Roy. Soc of Chem., https://www.chemspider.com (last access: 21 December 2025), 2023.
Clough, P. N. and Thrush, B. A.: Mechanism of chemiluminescent reaction between nitric oxide and ozone, Trans. Faraday Soc., 63, 915–925, https://doi.org/10.1039/TF9676300915, 1967.
Cooper, O. R., Parrish, D. D., Ziemke, J., Balashov, N. V., Cupeiro, M., Galbally, I. E., Gilge, S., Horowitz, L., Jensen, N. R., Lamarque, J.-F., Naik, V., Oltmans, S. J., Schwab, J., Shindell, D. T., Thompson, A. M., Thouret, V., Wang, Y., and Zbinden, R. M.: Global distribution and trends of tropospheric ozone: An observation-based review, Elementa, 2, 000029, https://doi.org/10.12952/journal.elementa.000029, 2014.
Cross, E. S., Williams, L. R., Lewis, D. K., Magoon, G. R., Onasch, T. B., Kaminsky, M. L., Worsnop, D. R., and Jayne, J. T.: Use of electrochemical sensors for measurement of air pollution: correcting interference response and validating measurements, Atmos. Meas. Tech., 10, 3575–3588, https://doi.org/10.5194/amt-10-3575-2017, 2017.
Dunlea, E. J., Herndon, S. C., Nelson, D. D., Volkamer, R. M., Lamb, B. K., Allwine, E. J., Grutter, M., Ramos Villegas, C. R., Marquez, C., Blanco, S., Cardenas, B., Kolb, C. E., Molina, L. T., and Molina, M. J.: Technical note: Evaluation of standard ultraviolet absorption ozone monitors in a polluted urban environment, Atmos. Chem. Phys., 6, 3163–3180, https://doi.org/10.5194/acp-6-3163-2006, 2006.
General, S., Bobrowski, N., Pöhler, D., Weber, K., Fischer, C., and Platt, U.: Airborne I-DOAS measurements at Mt. Etna: BrO and OClO evolution in the plume, Journal of Volcanology and Geothermal Research, 300, 175–186, https://doi.org/10.1016/j.jvolgeores.2014.05.012, 2015.
Gliß, J., Bobrowski, N., Vogel, L., Pöhler, D., and Platt, U.: OClO and BrO observations in the volcanic plume of Mt. Etna – implications on the chemistry of chlorine and bromine species in volcanic plumes, Atmos. Chem. Phys., 15, 5659–5681, https://doi.org/10.5194/acp-15-5659-2015, 2015.
Gold, V. (Ed.): The IUPAC Compendium of Chemical Terminology: The Gold Book, International Union of Pure and Applied Chemistry (IUPAC), Research Triangle Park, NC, 4 edn., https://doi.org/10.1351/goldbook, 2019.
Guimarães, P., Ye, J., Batista, C., Barbosa, R., Ribeiro, I., Medeiros, A., Souza, R., and Martin, S. T.: Vertical Profiles of Ozone Concentration Collected by an Unmanned Aerial Vehicle and the Mixing of the Nighttime Boundary Layer over an Amazonian Urban Area, Atmosphere, 10, 599, https://doi.org/10.3390/atmos10100599, 2019.
Hobbs, P. V., Tuell, J. P., Hegg, D. A., Radke, L. F., and Eltgroth, M. W.: Particles and gases in the emissions from the 19801981 volcanic eruptions of Mt. St. Helens, Journal of Geophysical Research: Oceans, 87, 11062–11086, https://doi.org/10.1029/JC087iC13p11062, 1982.
INGV National Institute of Geophysics and Volcanology: Bollettino Settimanale sul monitoraggio multiparametrico del vulcano Vulcano del 13/06/2023, https://www.ct.ingv.it/index.php/monitoraggio-e-sorveglianza/prodotti-del-monitoraggio/bollettini-settimanali-multidisciplinari/787 (last access: 2 February 2026), 2023a.
INGV National Institute of Geophysics and Volcanology: Bollettino Settimanale sul monitoraggio multiparametrico del vulcano Vulcano del 20/06/2023, https://www.ct.ingv.it/index.php/monitoraggio-e-sorveglianza/prodotti-del-monitoraggio/bollettini-settimanali-multidisciplinari/790 (last access: 2 February 2026), 2023b.
Jourdain, L., Roberts, T. J., Pirre, M., and Josse, B.: Modeling the reactive halogen plume from Ambrym and its impact on the troposphere with the CCATT-BRAMS mesoscale model, Atmos. Chem. Phys., 16, 12099–12125, https://doi.org/10.5194/acp-16-12099-2016, 2016.
Karbach, N., Bobrowski, N., and Hoffmann, T.: Observing volcanoes with drones: studies of volcanic plume chemistry with ultralight sensor systems, Scientific Reports, 12, 17890, https://doi.org/10.1038/s41598-022-21935-5, 2022.
Kelly, P. J., Kern, C., Roberts, T. J., Lopez, T., Werner, C., and Aiuppa, A.: Rapid chemical evolution of tropospheric volcanic emissions from Redoubt Volcano, Alaska, based on observations of ozone and halogen-containing gases, Journal of Volcanology and Geothermal Research, 259, 317–333, https://doi.org/10.1016/j.jvolgeores.2012.04.023, 2013.
Kern, C., Sihler, H., Vogel, L., Rivera, C., Herrera, M., and Platt, U.: Halogen oxide measurements at Masaya Volcano, Nicaragua using active long path differential optical absorption spectroscopy, Bulletin of Volcanology, 71, 659–670, https://doi.org/10.1007/s00445-008-0252-8, 2009.
Kern, C., Lerner, A. H., Elias, T., Nadeau, P. A., Holland, L., Kelly, P. J., Werner, C. A., Clor, L. E., and Cappos, M.: Quantifying gas emissions associated with the 2018 rift eruption of Kīlauea Volcano using ground-based DOAS measurements, Bulletin of Volcanology, 82, 55, https://doi.org/10.1007/s00445-020-01390-8, 2020.
Kleindienst, T. E., Hudgens, E. E., Smith, D. F., McElroy, F. F., and Bufalini, J. J.: Comparison of Chemiluminescence and Ultraviolet Ozone Monitor Responses in the Presence of Humidity and Photochemical Pollutants, Air & Waste, 43, 213–222, https://doi.org/10.1080/1073161X.1993.10467128, 1993.
Kuhn, J., Bobrowski, N., and Platt, U.: The Interface Between Magma and Earth's Atmosphere, Geochemistry, Geophysics, Geosystems, 23, e2022GC010671, https://doi.org/10.1029/2022GC010671, 2022.
Leston, A. R., Ollison, W. M., Spicer, C. W., and Satola, J.: Potential Interference Bias in Ozone Standard Compliance Monitoring, Journal of the Air & Waste Management Association, 55, 1464–1472, https://doi.org/10.1080/10473289.2005.10464749, 2005.
Long, R. W., Hall, E., Beaver, M., Duvall, R., Kaushik, S., Kronmiller, K., Wheeler, M., Garvey, S., Drake, Z., and McElroy, F.: Performance of the Proposed New Federal Reference Methods for Measuring Ozone Concentrations in Ambient Air, EPA/600/R-14/432, https://cfpub.epa.gov/si/si_public_file_download.cfm?p_download_id=520887&Lab=NERL (last access: 25 January 2021), 2014.
Long, R. W., Whitehill, A., Habel, A., Urbanski, S., Halliday, H., Colón, M., Kaushik, S., and Landis, M. S.: Comparison of ozone measurement methods in biomass burning smoke: an evaluation under field and laboratory conditions, Atmos. Meas. Tech., 14, 1783–1800, https://doi.org/10.5194/amt-14-1783-2021, 2021.
Marti, J. and Ernst, G. J. (Eds.): Volcanoes and the Environment, Cambridge University Press, Cambridge, ISBN 9780521597258, 2008.
Matthews, R. D., Sawyer, R. F., and Schefer, R. W.: Interferences in chemiluminescent measurement of nitric oxide and nitrogen dioxide emissions from combustion systems. Environmental Science & Technology, 11, 1092–1096, 1977.
Nederbragt, G. W., Van Der Horst, A., and Van Duijn, J.: Rapid Ozone Determination Near an Accelerator, Nature, 206, 87–87, https://doi.org/10.1038/206087a0, 1965.
Nies, A., Roberts, T. J., Dayma, G., Fischer, T. P., and Kuhn, J.: Reactive bromine in volcanic plumes confines the emission temperature and oxidation of magmatic gases at the atmospheric interface, Sci. Adv., 11, eadt8607, https://doi.org/10.1126/sciadv.adt8607, 2025.
Pitts Jr., J. N., Kummer, W. A., and Steer, R. P.: Chemiluminescent reactions of ozone with olefins and sulfides, Environmental Science & Technology, 5.10, 1045–1047, https://doi.org/10.1021/es60057a003, 1971.
Platt, U. and Janssen, C.: Observation and role of the free radicals NO3, ClO, BrO and IO in the troposphere, Faraday Discussions, 100, 175, https://doi.org/10.1039/fd9950000175, 1995.
Roberts, T. J.: Ozone Depletion in Tropospheric Volcanic Plumes: From Halogen-Poor to Halogen-Rich Emissions, Geosciences, 8, https://doi.org/10.3390/geosciences8020068, 2018.
Roberts, T. J., Martin, R. S., and Jourdain, L.: Reactive bromine chemistry in Mount Etna's volcanic plume: the influence of total Br, high-temperature processing, aerosol loading and plume–air mixing, Atmos. Chem. Phys., 14, 11201–11219, https://doi.org/10.5194/acp-14-11201-2014, 2014.
Rüth, M.: Constructing a miniaturized chemiluminescence ozone monitor for drone-based measurements in volcanic plumes: a way to resolve the volcanic ozone enigma, Master thesis in physics, Heidelberg, 2023 – 1 Online-Ressource, 93 pp., Illustrationen, Diagramme, https://doi.org/10.11588/heidok.00034520, 2023.
Rüth, M., Bobrowski, N., Bräutigam, E., Nies, A., Kuhn, J., Hoffmann, T., Karbach, N., Geil, B., Kleinschek, R., Schmitt, S., an Platt, U.: VOLACNO3 Data: Plume, vertical profiles and calibration measurements, https://doi.org/10.5281/zenodo.17939499, Zenodo [data set], 2025.
Schenkel, A. and Broder, B.: Interference of some trace gases with ozone measurements by the KI method. Atmospheric Environment, 16, 2187–2190, 1982.
Surl, L., Donohoue, D., Aiuppa, A., Bobrowski, N., and von Glasow, R.: Quantification of the depletion of ozone in the plume of Mount Etna, Atmos. Chem. Phys., 15, 2613–2628, https://doi.org/10.5194/acp-15-2613-2015, 2015.
Surl, L., Roberts, T., and Bekki, S.: Observation and modelling of ozone-destructive halogen chemistry in a passively degassing volcanic plume, Atmos. Chem. Phys., 21, 12413–12441, https://doi.org/10.5194/acp-21-12413-2021, 2021.
US Environmental Protection Agency (EPA): Appendix D to Part 50, Title 40, Reference Measurement Principle and Calibration Procedure for the Measurement of Ozone in the Atmosphere (Chemiluminescence Method), https://www.ecfr.gov/current/title-40/chapter-I/subchapter-C/part-50#Appendix-D-to-Part-50 (last access: 2 February 2026), 2023.
Vance, A., McGonigle, A. J. S., Aiuppa, A., Stith, J. L., Turnbull, K., and von Glasow, R.: Ozone depletion in tropospheric volcanic plumes, Geophysical Research Letters, 37, https://doi.org/10.1029/2010GL044997, 2010.
von Glasow, R.: Atmospheric chemistry in volcanic plumes, Proceedings of the National Academy of Sciences, 107, 6594–6599, https://doi.org/10.1073/pnas.0913164107, 2010.
Warren, G. J. and Babcock, G.: Portable Ethylene Chemiluminescence Ozone Monitor, Review of Scientific Instruments, 41, 280–282, 1970.
Wennberg, P.: Bromine explosion, Nature 397, 299–301, https://doi.org/10.1038/16805, 1999.
Williams, E. J., Fehsenfeld, F. C., Jobson, B. T., Kuster, W. C., Goldan, P. D., Stutz, J., and McClenny, W. A.: Comparison of Ultraviolet Absorbance, Chemiluminescence, and DOAS Instruments for Ambient Ozone Monitoring, Environmental Science & Technology, 40, 5755–5762, https://doi.org/10.1021/es0523542, 2006.
Witte, J. C., Thompson, A. M., Smit, H. G. J., Fujiwara M., Posny, F., Coetzee, G. J. R., Northam, E. T., Johnson, B. J., Sterling, C. W., Mohamad, M., Ogino, S.-Y., Jordan, A., and da Silva, F. R.: First reprocessing of Southern Hemisphere Additional Ozonesondes (SHADOZ) profile records (1998–2015): 1. Methodology and evaluation, J. Geophys. Res. Atmos., 122, 6611–6636, https://doi.org/10.1002/2016JD026403, 2017.