the Creative Commons Attribution 4.0 License.
the Creative Commons Attribution 4.0 License.
 | 25 Mar 2026
All-sky temperature and humidity retrieval from the MWRI-RM onboard the FY-3G satellite
Minghua Liu
Yunfan Yang
Haofei Sun
Ruoying Yin
To investigate the application of deep learning in satellite remote sensing, this study employs brightness temperature observations from the remapped Micro-Wave Radiation Imager-Rainfall Mission (MWRI-RM) onboard the Fengyun-3G (FY-3G) satellite as input data, while temperature and relative humidity profiles (ranging from 1000 to 100 hPa) obtained from ERA5 reanalysis data are used as label data. An Advanced Residual Convolutional Neural Network (AR-CNN) model was developed to retrieve atmospheric temperature and relative humidity profile data. The results show that: (1) The retrieval of temperature profiles achieves a root-mean-square error (RMSE) of approximately 1.24 K, and the RMSE for relative humidity profiles is 12.98 %. (2) A comparison between retrieved and labeled samples reveals consistent results for temperature retrieval but some discrepancies in extreme high and low humidity regions, suggesting the need for further refinement. (3) Gradient-based analyses and perturbation experiments confirm that 118 GHz oxygen channels are critical for mid-to-upper tropospheric temperature (500–200 hPa), indirectly impacting upper-level humidity (200–100 hPa) through thermal coupling, while 183 GHz water vapor channels dominate lower-to-mid tropospheric humidity retrievals (1000–500 hPa) and constrain temperature via moisture-radiation feedbacks. (4) Additional channel ablation experiments demonstrate that channels with smaller frequency offsets mainly affect upper atmospheric layers, whereas larger-offset channels have stronger impacts on lower layers, supporting the spectral contribution patterns identified in previous studies. These findings highlight the model's ability to capture temperature-humidity coupling and confirm the complementary roles of 118 and 183 GHz channels in improving vertical profile retrievals.
- Article
(9618 KB) - Full-text XML
- BibTeX
- EndNote


Vertical profiles of atmospheric temperature and humidity are fundamental state variables governing atmospheric thermodynamics and dynamics. High-precision global monitoring of these parameters is critical for improving numerical weather prediction (NWP) initialization, climate change assessment, and meteorological disaster monitoring (Liu et al., 2010; Ebell et al., 2013; He et al., 2017). With the rapid evolution of data assimilation systems, the demand for meteorological data with high spatiotemporal resolution and vertical accuracy has become increasingly stringent (Xu et al., 2024). While traditional radiosonde networks provide high-precision in situ measurements, their spatial sparsity – particularly over oceans, polar regions, and complex terrain – limits their utility for global-scale applications (Yao and Guan, 2022). Consequently, spaceborne passive microwave radiometry has become indispensable for bridging these observational gaps, offering the unique capability to penetrate non-precipitating clouds and retrieve atmospheric profiles under all-weather conditions (Wang et al., 2010; Duan et al., 2017).
The retrieval of atmospheric profiles from satellite-observed brightness temperatures is a classic ill-posed problem, typically addressed through physical or statistical approaches (Wang et al., 2009; Du et al., 2015). Physical retrieval methods, such as the One-Dimensional Variational (1D-Var) technique, rely on radiative transfer models to iteratively minimize the cost function between simulated and observed radiances. Prominent operational systems, such as the NOAA Microwave Integrated Retrieval System (MiRS), utilize this physical approach to provide all-weather vertical profiles (Boukabara et al., 2011). While physically rigorous, these methods are computationally expensive and sensitive to forward model biases and surface emissivity uncertainties. Conversely, statistical regression methods establish empirical relationships between radiances and geophysical parameters. Operational algorithms like the NOAA Unique Combined Atmospheric Processing System (NUCAPS) often employ eigenvector-based regression as a robust initial guess for subsequent physical retrieval steps (Goldberg et al., 2003). However, these linear statistical baselines often struggle to capture the complex, non-linear mapping between brightness temperatures and fine-scale vertical structures, particularly in the presence of clouds or precipitation (Rosenkranz, 2001).
To address these non-linear complexities, the application of Artificial Neural Networks (ANNs) in atmospheric remote sensing gained traction in the early 2000s. Pioneering studies demonstrated that ANNs could approximate high-dimensional radiative transfer processes with superior computational efficiency. Notably, Aires et al. (2001) developed a variational neural network scheme for retrieving atmospheric water vapor and surface parameters, effectively combining the speed of learning-based methods with physical constraints. Subsequently, Blackwell (2005) introduced a Projected Principal Component Analysis (PPCA) technique coupled with neural networks for the AMSU sounder. This method significantly outperformed traditional linear regression in resolving sharp vertical gradients of temperature and moisture.
In the current era of big data, the transition from shallow ANNs to Deep Learning (DL) has further revolutionized atmospheric retrieval. Modern DL architectures, such as Convolutional Neural Networks (CNNs), can automatically extract spatial features and learn deeper hierarchical representations. This trend is exemplified by recent advancements in operational algorithms; for instance, Pfreundschuh et al. (2022) successfully implemented a neural network-based version of the Goddard Profiling Algorithm (GPROF-NN), demonstrating that DL models can match or exceed the accuracy of traditional Bayesian schemes while significantly reducing computational costs. Similarly, Wang et al. (2021) utilized a Back-Propagation Neural Network (BPNN) to enhance upper-atmosphere temperature retrieval, and Xia et al. (2023) employed an AutoML framework to retrieve land precipitable water vapor (PWV) from AMSR2 observations using over 50 million Global Positioning System (GPS) samples, achieving an RMSE of 3.1 mm across diverse land surfaces. These advanced data-driven approaches leverage massive volumes of historical satellite and reanalysis data, providing a robust pathway for next-generation retrieval systems.
A significant advancement in observational capabilities came with China's April 2023 launch of the FY-3G satellite, equipped with the upgraded Micro-Wave Radiation Imager-Rainfall Mission (MWRI-RM). This instrument integrates 26 channels across oxygen (54/118 GHz) and water vapor (183 GHz) absorption bands, significantly enhancing atmospheric profiling capacity while maintaining all-weather operation (Gu et al., 2023; Zhang et al., 2023a, b). Building on these technological developments, this study presents an Advanced Residual Convolutional Neural Network (AR-CNN) for retrieving temperature and relative humidity profiles from FY-3G/MWRI-RM observations. Our methodology employs brightness temperatures (TBs) from all available channels, supplemented by standardized surface parameter preprocessing (Cadeddu et al., 2009; Cai et al., 2020). Key innovations include a quantitative assessment of the relative contributions of the 118 GHz oxygen and 183 GHz water vapor channels, highlighting their complementary roles in temperature-humidity coupling. Relative humidity was deliberately chosen as the retrieval variable to capture this coupling, allowing the model to learn the joint spectral sensitivities of temperature and moisture. This choice also ensures numerical stability during training, while laying the groundwork for extending the framework to specific humidity or mixing ratio in future developments.
2.1 Instrument Overview
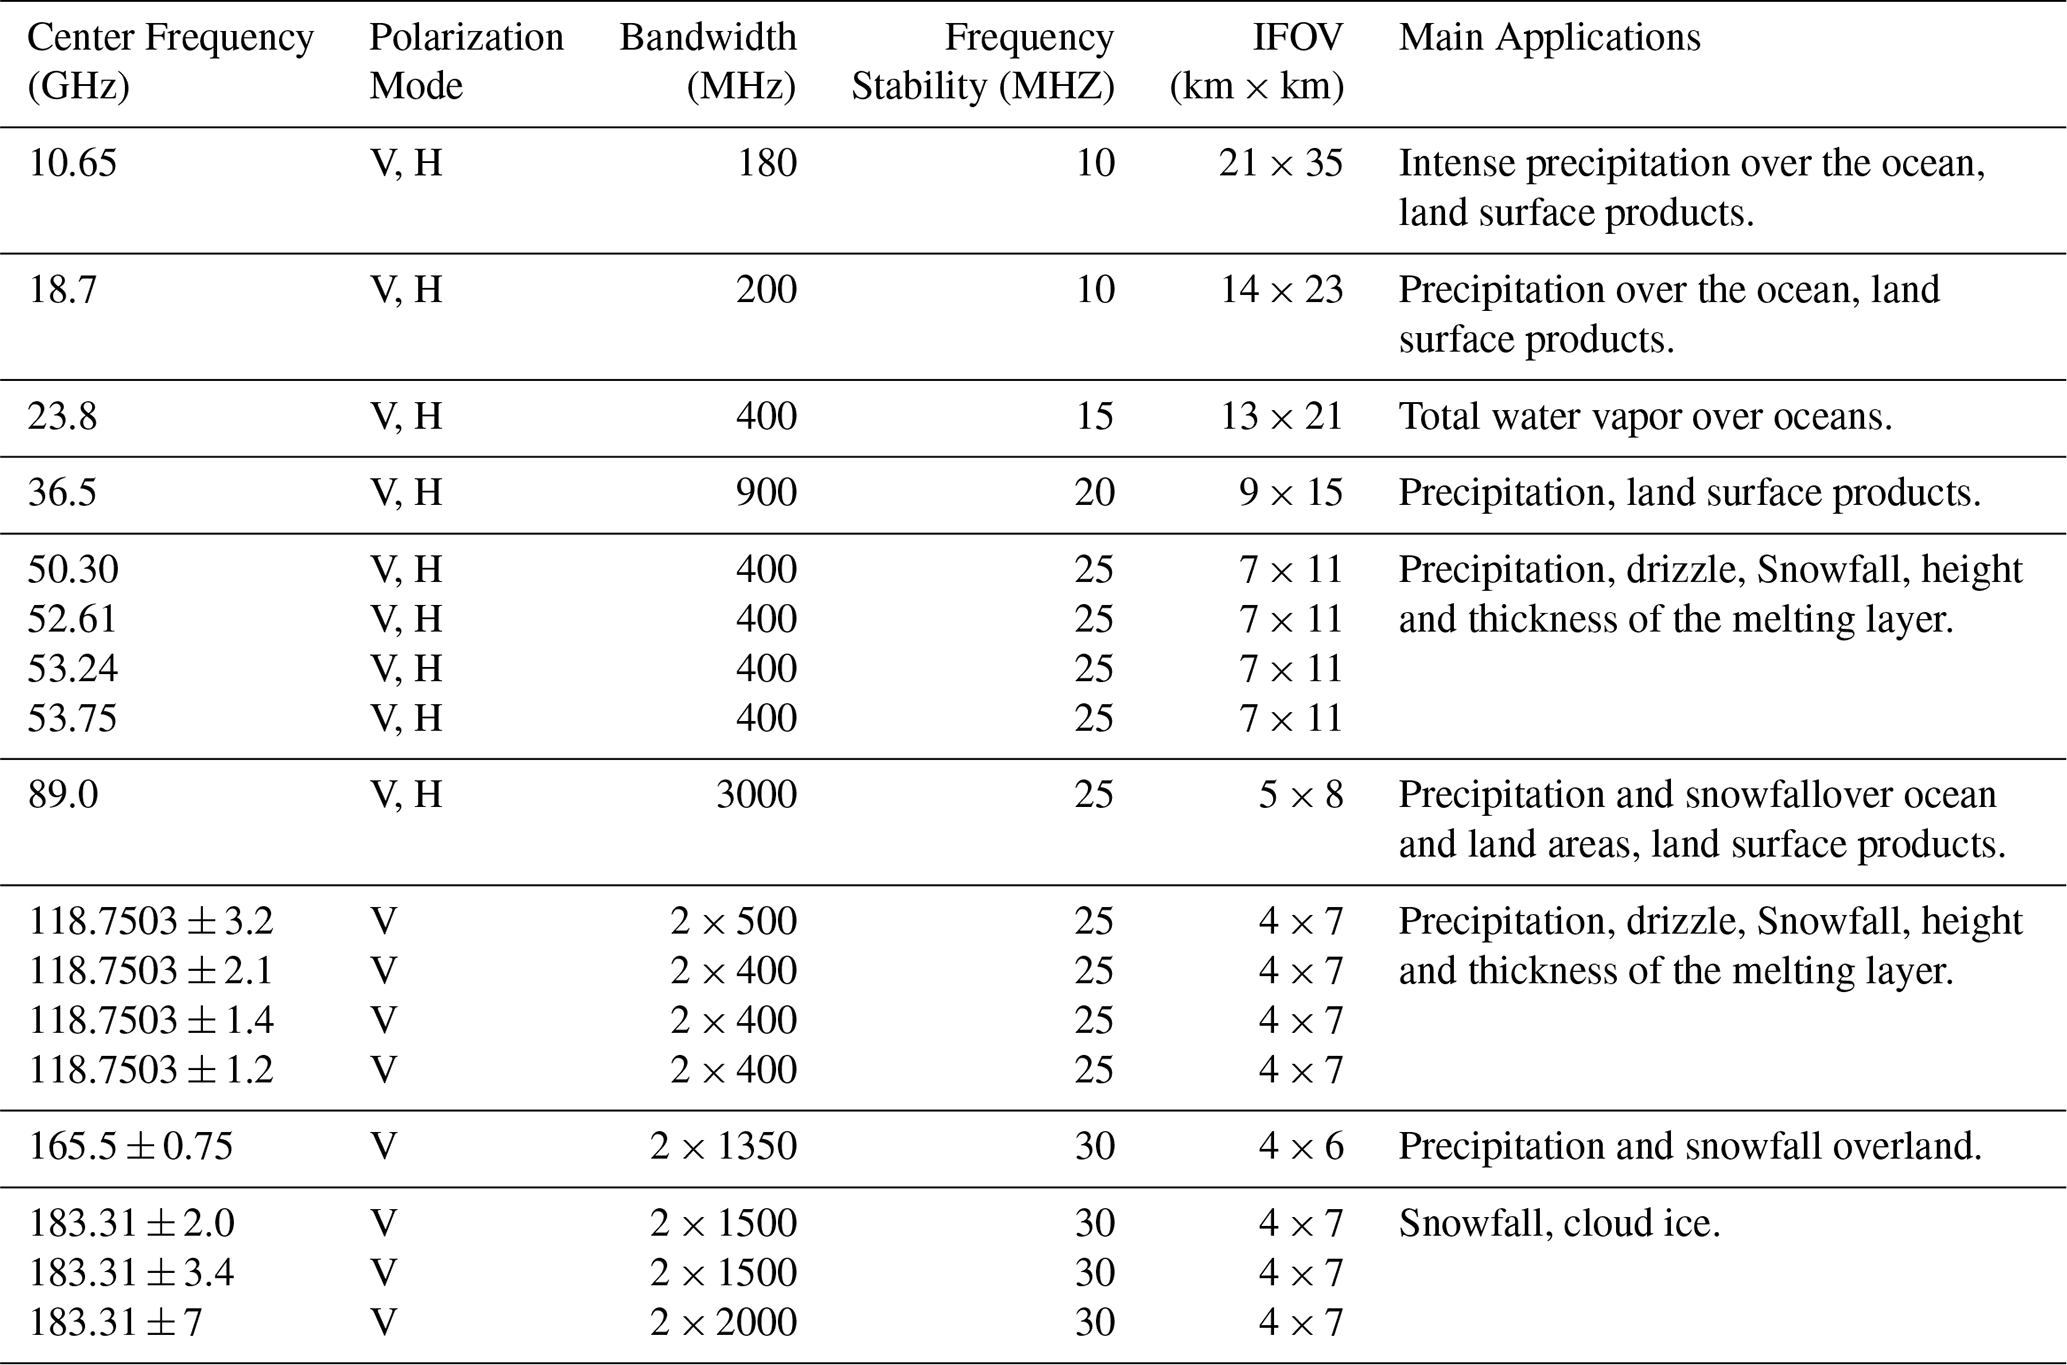
The primary purpose of the MWRI-RM is to collect microwave radiation data from both land and sea surfaces globally, serving the needs of global precipitation measurement. It employs a conical scanning system, featuring 1648 scan lines with 492 sampling points on each line. The MWRI-RM is equipped with 8 feedhorns arranged in two rows. The first row consists of channels at 10, 18.7, 23.8, 36, and 89 GHz, where the 18.7 and 23.8 GHz channels share a common feedhorn. The second row comprises channels at 54, 118, 166, and 183 GHz. Feedhorns in different rows have angular differences in their observation geometries. Detailed frequency settings, polarization modes, and channel specifications are listed in Table 1.
Table 1Channel information of FY-3G/MWRI-RM (Data source: FY-3G_L1 Data User's Guide_MWRI-RM_20230625.pdf (http://nsmc.org.cn, last access: 24 May 2025), Gu et al., 2023).
2.2 Sample Construction
This study utilizes MWRI-RM Level 1 products (raw TBs) from 23 October to 23 November 2023 (UTC), containing TBs from all 26 channels. Since MWRI-RM employs two rows of feedhorns (S1 and S2), scan points with a deviation exceeding 7 km between S1 and S2 were excluded to ensure data quality. Oceanic data were then exclusively selected using the built-in land-sea mask. After remapping using an enhanced BGI algorithm that aligns spatial resolutions and footprint centers (Chen et al., 2024), all channels were resampled to the 23.8 GHz channel's resolution of 13 km × 21 km. ERA5 reanalysis data (Hersbach et al., 2023), providing temperature profiles across 27 levels (1000–100 hPa) at 0.25° resolution, served as training labels. To address spatial resolution differences, ERA5 temperature profiles were spatially interpolated to satellite footprints using nearest-neighbor matching, with temporal alignment achieved through hourly binning of observation times.
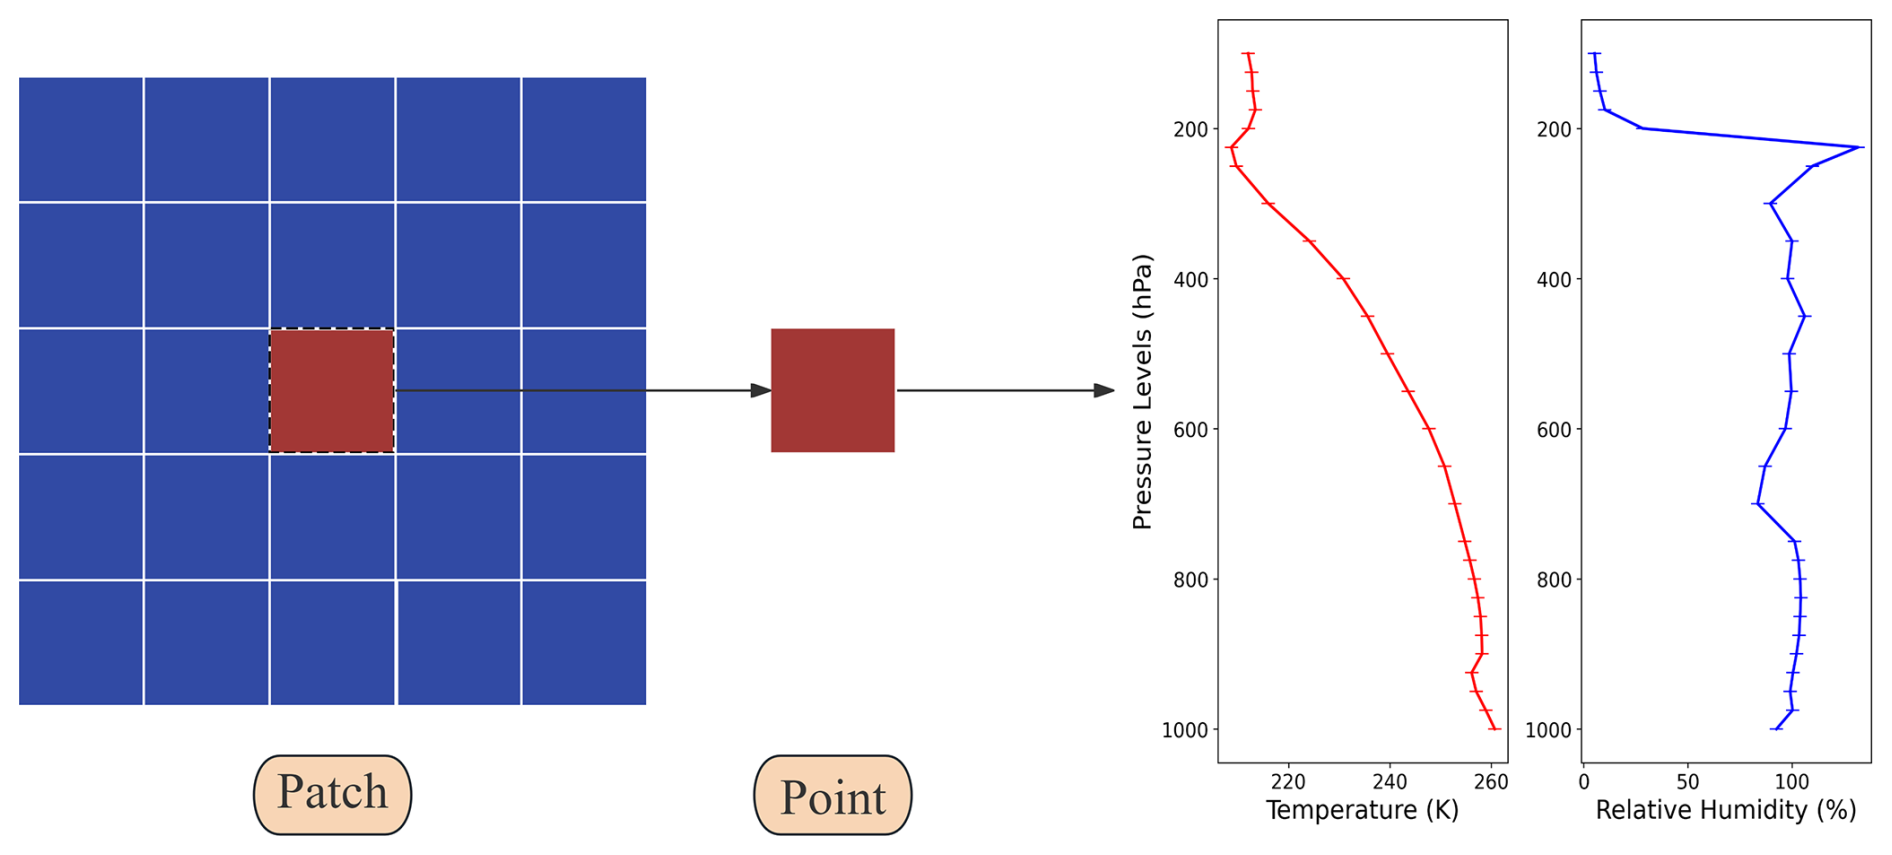
The data were structured as 4D tensors (samples × height × width × channels): 13 100 161 samples each sized 5 × 5 × 26 channels, where the 5 × 5 spatial window was chosen as a practical trade-off that captures meaningful local context at the remapped ∼ 13 × 21 km resolution while keeping training cost tractable. Corresponding ERA5 temperature/relative humidity profiles at sample centers were used as labels (Fig. 1). The dataset was partitioned chronologically into training (80 %, 10 480 128 samples), testing (20 %, 2 620 032), with the final 20 % of training data (2 096 025 samples) allocated for validation.
3.1 AR-CNN Network Algorithm Principles
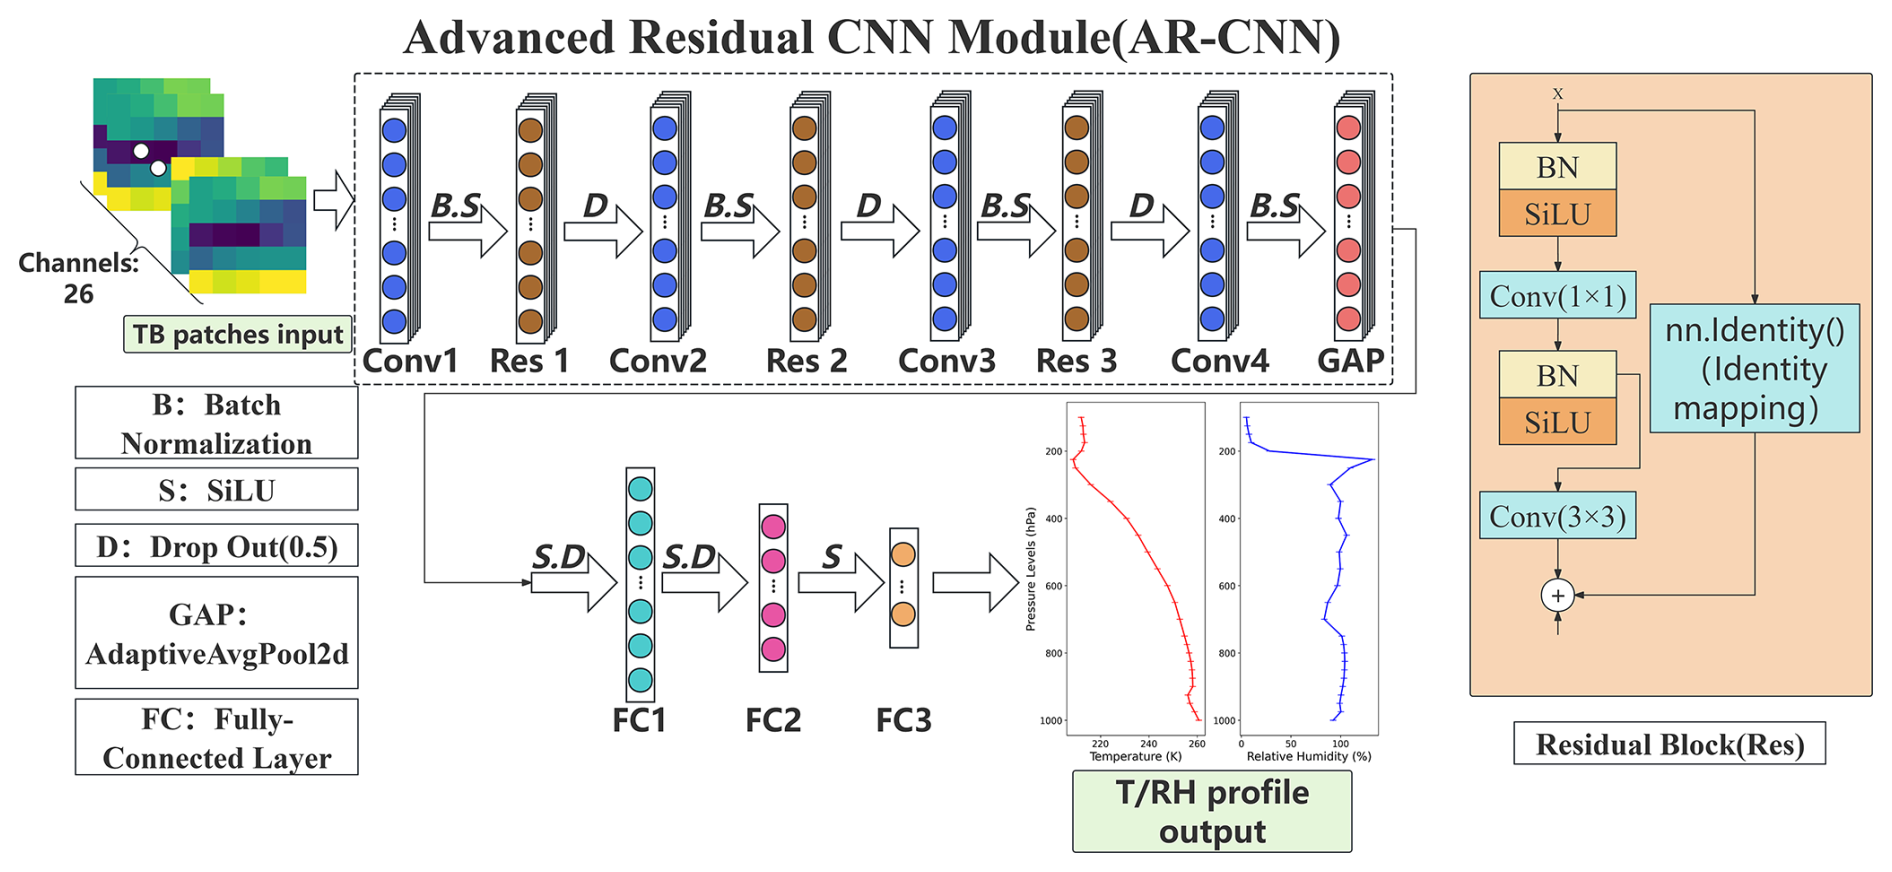
In this study, an Advanced Residual Convolutional Neural Network (AR-CNN) was developed to retrieve temperature and humidity profiles (Fig. 2). The network was implemented using the PyTorch framework and designed to process 5 × 5 satellite TB images with 26 input channels. Its architecture incorporates multiple components including convolutional layers with 3 × 3 kernels, stride = 1, and padding = 1 to maintain spatial dimensions, along with residual blocks, batch normalization, dropout layers, and fully connected layers for hierarchical feature extraction. Sigmoid Linear Unit (SiLU) activation, known for its smooth gradient properties and ability to avoid dead zones, is employed throughout the network (Elfwing et al., 2018). Residual blocks, equipped with skip connections, mitigate gradient vanishing in deep layers (He et al., 2016). A dropout layer with a rate of 0.25 is incorporated to prevent overfitting. The final convolutional layer generates a 512-channel feature map, which is normalized and compressed via adaptive average pooling to 1 × 1 per channel. The fully connected layers retrieve temperature and humidity profiles across 27 layers. An early stopping mechanism is implemented during training to enhance model generalization. For training, we use mean-squared error (MSE) as the loss function and the AdamW optimizer with learning rate 1 × 10⁻⁵. The AR-CNN's design effectively captures multi-level features and improves training efficiency and generalization, making it well-suited for complex image classification tasks. For completeness, we report a preliminary comparison with several baseline models in Table A1. This early-stage comparison was used to calibrate training settings and is not the focus of this study.
3.2 Retrieval Algorithm Validation
In this paper, bias and root-mean-squared error (RMSE) are chosen as evaluation metrics for the accuracy of atmospheric temperature and relative humidity profile retrieval. The specific formulas are as follows:
Where is the xi retrieved value, yi is the target value, and N is the number of samples.
Bias evaluates the systematic error of the model, representing the average difference between the retrieved and true values. A bias of zero indicates no systematic deviation, while a positive or negative bias indicates that the model tends to overestimate or underestimate the target variable, respectively.
Where xi is the retrieved value, yi is the target value, and N is the number of samples.
RMSE assesses the magnitude of errors between retrieved and true values. It is sensitive to large errors due to the squaring of the differences. A lower RMSE indicates better model performance, with smaller deviations between the retrieved and target values.
4.1 Temperature Retrieval
The retrieved temperature profiles show generally consistent performance across pressure levels, with layer-averaged bias (0.11 K) and RMSE (1.24 K) that are broadly uniform through the column (Fig. 3a–b). This stability suggests minimal height-dependent variability in retrieval performance, and a similar pattern appears in the global maps at representative pressure levels in Fig. A1. Nevertheless, the observed vertical RMSE structure (0.97–1.98 K) primarily reflects the instrument's inherent sensitivity characteristics, as evidenced by the Jacobian weighting functions in Fig. 5b showing peak sensitivity at 500–700 hPa with diminishing response above 200 hPa. This vertical sensitivity pattern fundamentally constrains retrieval accuracy in the upper troposphere.
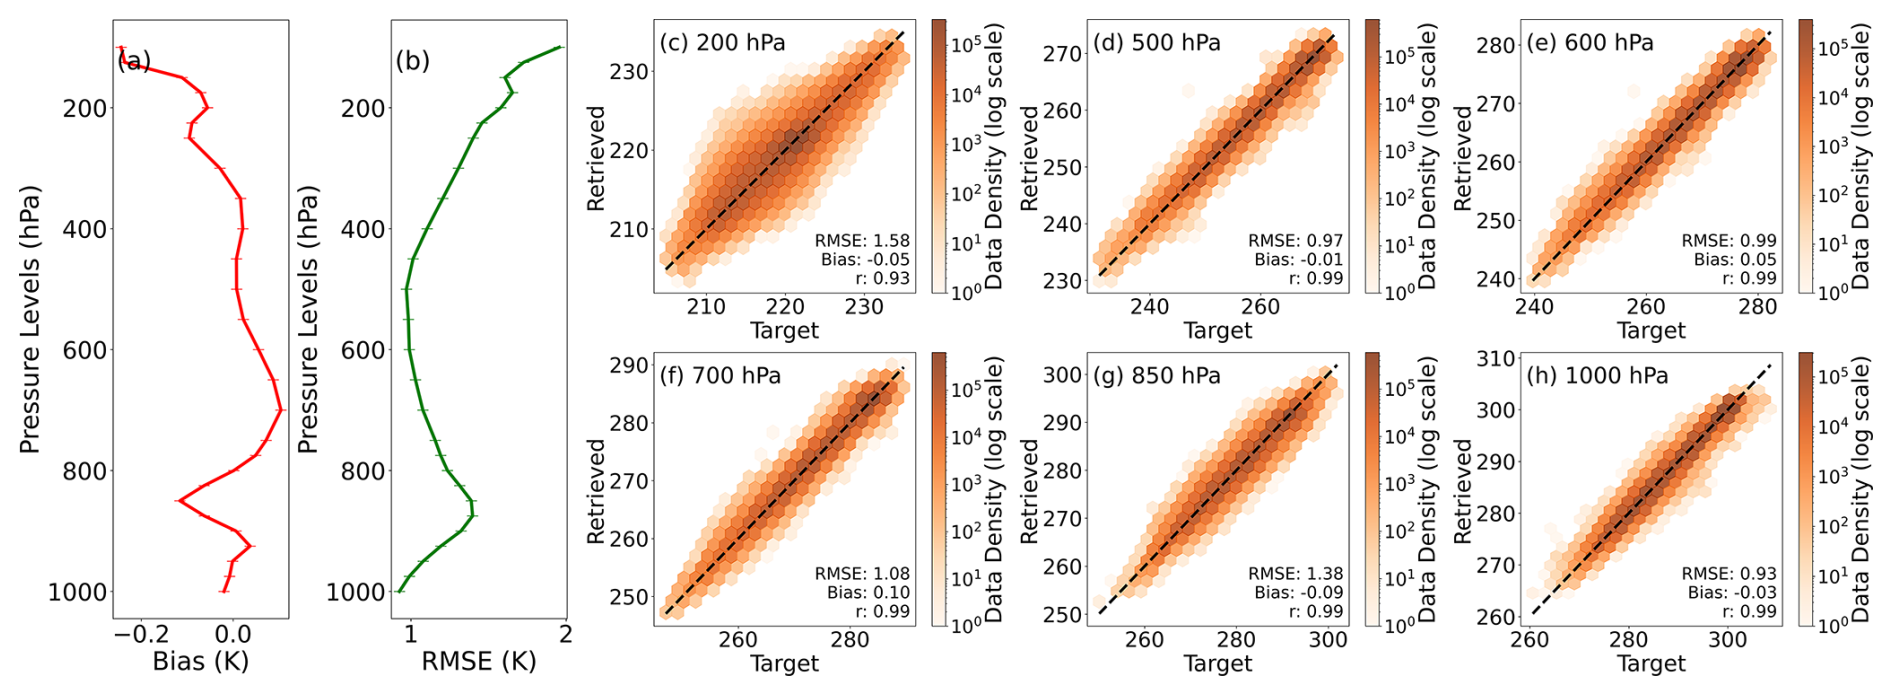
Figure 3(a–b) Bias (K) and RMSE (K) of the retrieved temperature profile; (c–h) two-dimensional histograms of retrieved versus target temperature at specific pressure levels. Color intensity indicates data density on a logarithmic scale, with darker colors representing higher data counts. The dashed black line (y=x) denotes the 1 : 1 reference for perfect agreement, and the Pearson correlation coefficient (r) quantifies the degree of linear consistency. (c) 200 hPa; (d) 500 hPa; (e) 600 hPa; (f) 700 hPa; (g) 850 hPa; (h) 1000 hPa.
In the scatterplots of Fig. 3c–h, the retrieved and reference temperatures align closely along the 1 : 1 line, indicating high consistency across most layers. The data points are densely concentrated and symmetrically distributed at 500–700 hPa, where the retrieval achieves its best performance. Toward the surface, the scatter slightly broadens, particularly near 850 hPa, reflecting stronger surface influence and the variability of sea surface temperature (SST). Such variability complicates near-surface temperature retrieval (Susskind et al., 2003; Stähli et al., 2013), as non-linear surface-atmosphere interactions may not be fully captured by the model. At higher levels, especially around 200 hPa, the points show increased dispersion and a mild underestimation, consistent with the weaker radiometric sensitivity and enhanced dynamical variability in the upper troposphere.
From 850 to 500 hPa, RMSE decreases gradually, reaching about 1 K at 500 hPa, where the temperature field is more homogeneous and radiometric sensitivity peaks. Above 500 hPa, retrieval accuracy decreases again due to reduced signal strength and complex thermodynamic processes involving vertical motion, convection, and phase changes of hydrometeors (Chen and Lin, 2003; Susskind et al., 2003). The decreased sensitivity at these heights (Sahoo et al., 2015) results in lower signal-to-noise ratios and broader scatter, as also depicted in Fig. 3c–h.
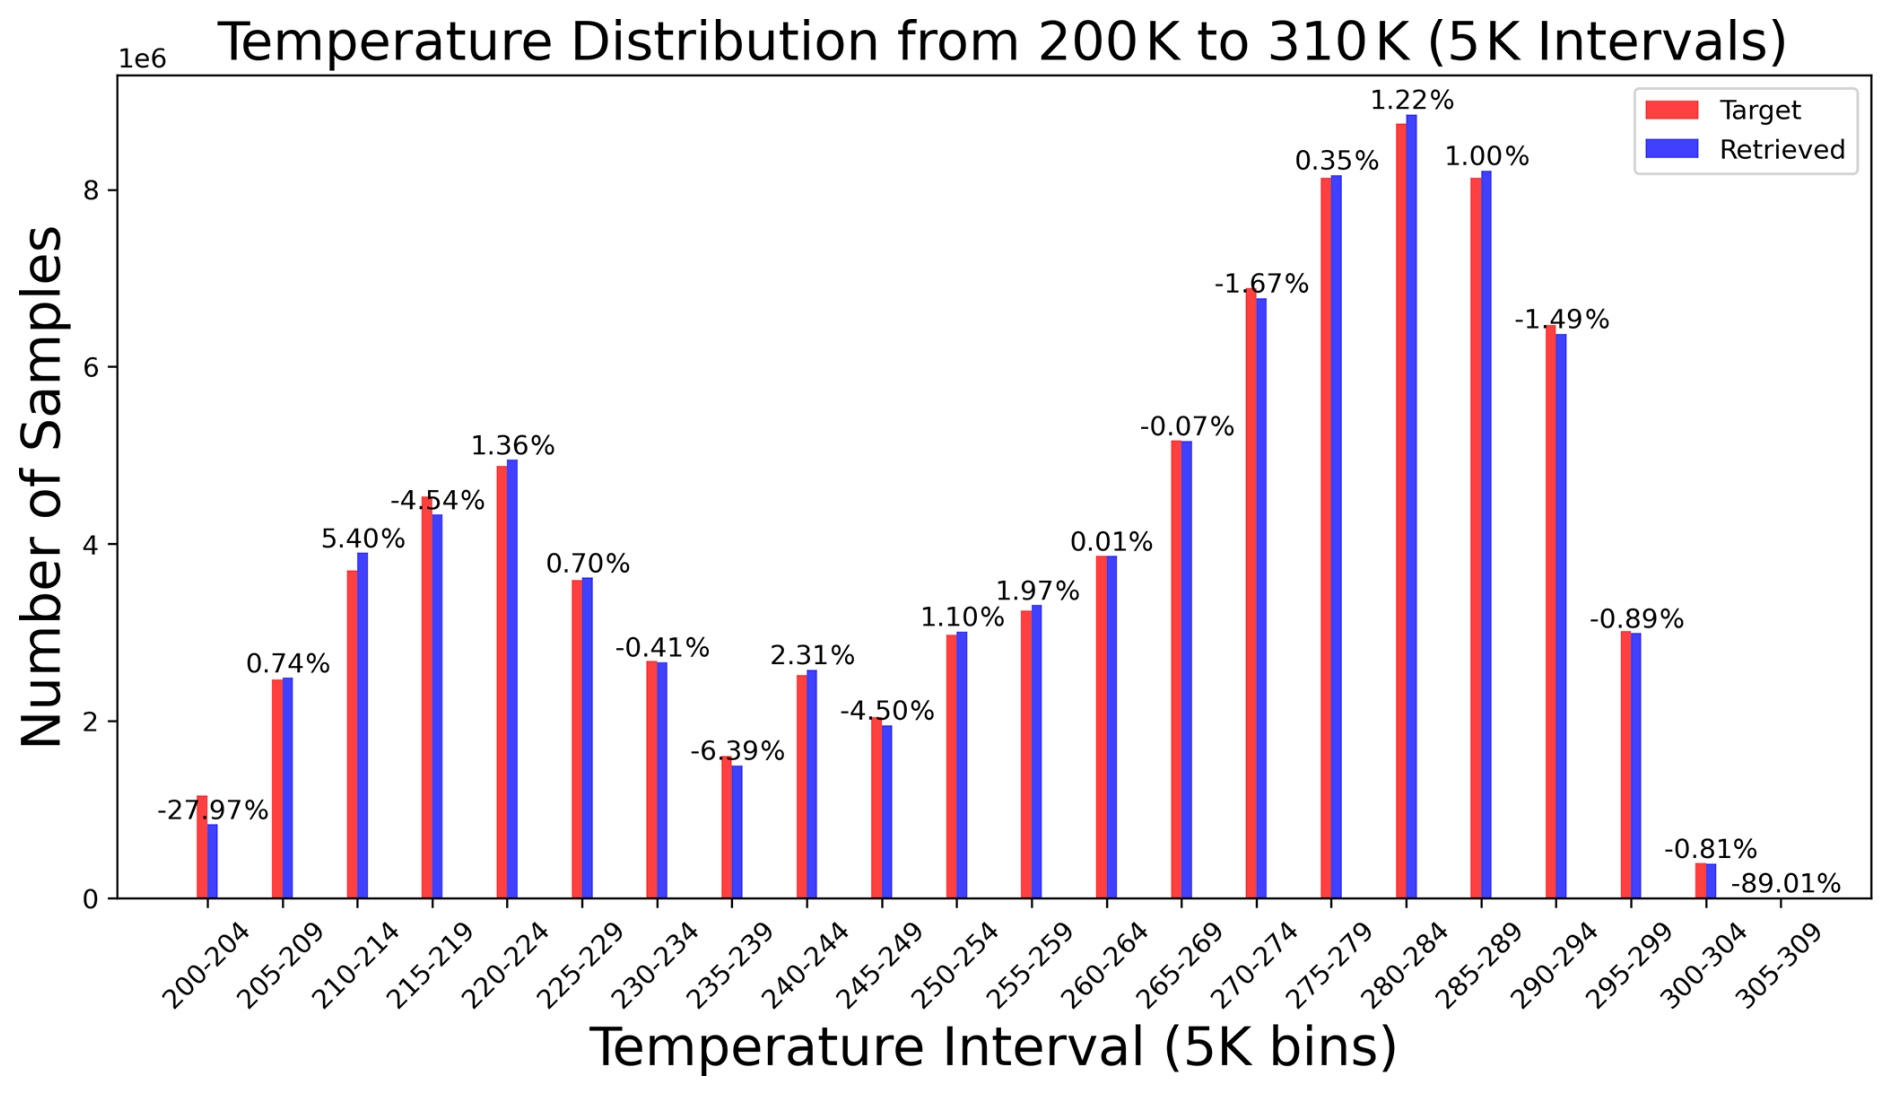
Figure 4Statistics of the number of retrieved and labeled samples in the test set (5 K bins).
The histogram presented in Fig. 4, which compares the counts of retrieved samples with those of labeled samples, discloses the difficulties in accurately retrieving extremely high and low temperatures. This challenge is prevalent in satellite remote sensing, especially in the retrieval of microwave channels, and might originate from data imbalance, in which extreme temperatures are inadequately represented in training datasets. Consequently, the model may exhibit a proclivity towards more common temperature ranges, thereby undermining its performance on extreme values. Moreover, the TB predictors do not explicitly represent meteorological coupling among moisture, pressure, and radiative processes, and these interactions are only partially captured by the ERA5 reanalysis used as labels. This lack of physical representation likely contributes to larger retrieval errors at the warm and cold extremes (Wang et al., 2023). To address these issues, we could employ advanced data preprocessing techniques, such as data augmentation or transfer learning, to enhance the representation of extreme temperatures in training datasets. Additionally, incorporating more comprehensive input features that account for complex meteorological interactions might improve the model's ability to handle extreme temperature retrieval.
The Jacobian analysis for temperature retrieval was performed using the Radiative Transfer for TOVS (RTTOV) model, customized for the MWRI-RM sensor. It provides a physics-based reference for channel sensitivity. To quantify channel usage by the retrieval network, we computed the gradient of the model's output with respect to the input using PyTorch's autograd. The temperature outputs were de-normalized to physical units. The gradient of a scalar objective (sum over output levels) with respect to the input provided the channel-wise sensitivity.
We compute the gradient , where is the scalar objective (sum of output levels). Using autograd, we aggregate the absolute gradients across the batch and spatial dimensions to obtain per-channel attributions:
These attributions are then normalized across channels:
This procedure effectively computes a vector-Jacobian product with v=1, providing a row-sum of the full Jacobian, and reflects end-to-end retrieval sensitivity rather than individual layer weights.
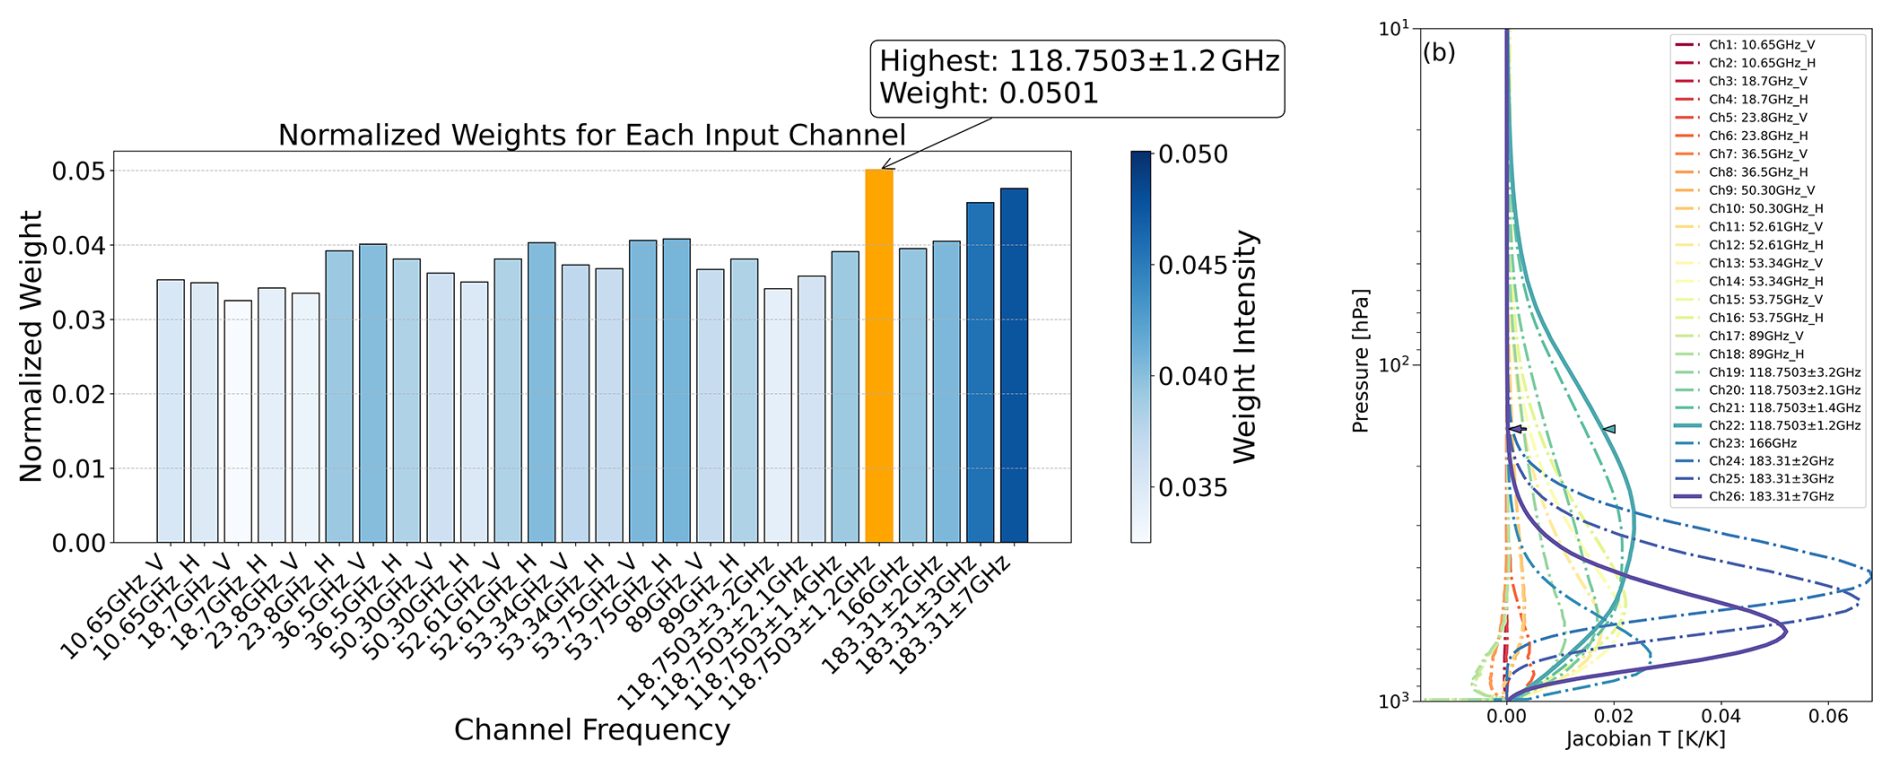
Figure 5(a) Autograd-based sensitivity analysis of input channels for temperature retrieval. The vertical axis represents the mean absolute normalized gradient (, K K−1); (b) Jacobian for temperature, obtained using the RTTOV model tailored for the MWRI-RM sensor. Solid lines denote Channel 22 (118.75 ± 1.2 GHz) and 26 (183.31 ± 7 GHz), while dash-dot lines represent other channels.
Results indicate that the highest weight in temperature profile retrieval resides within the 118.75 ± 1.2 GHz frequency band (Fig. 5a), aligning with the peak sensitivity of temperature Jacobians (Fig. 5b). This highlights the model's utilization of the oxygen absorption line near 118 GHz, a spectral feature with significant sensitivity to mid-to-upper tropospheric temperature distributions (500–200 hPa) and boundary layer thermal structure (1000–850 hPa). Oxygen rotational transitions at 118.75 ± 1.2 GHz dominate radiative transfer in the mid-tropospheric lapse rate region (500–300 hPa) and lower stratosphere-upper troposphere transition (200–100 hPa), which are critical for atmospheric dynamics (Gasiewski and Staelin, 1989; Gasiewski and Johnson, 1993; Xiao et al., 2023; Li and Han, 2025).
Moreover, the 183.31 ± 7 GHz channel, located within the water vapor absorption band, contributes secondarily to temperature profile refinement through moisture-radiation interaction mechanisms. This channel's sensitivity to water vapor variations in the boundary layer and lower troposphere (1000–700 hPa) influences radiance measurements via absorption/emission processes, providing cross-constraints for temperature retrievals in regions with high moisture content (Xiao et al., 2023; Li and Han, 2025). Water vapor's impact on radiative budgets in these layers enhances the model's ability to resolve temperature-humidity coupling, particularly in tropical and maritime environments.
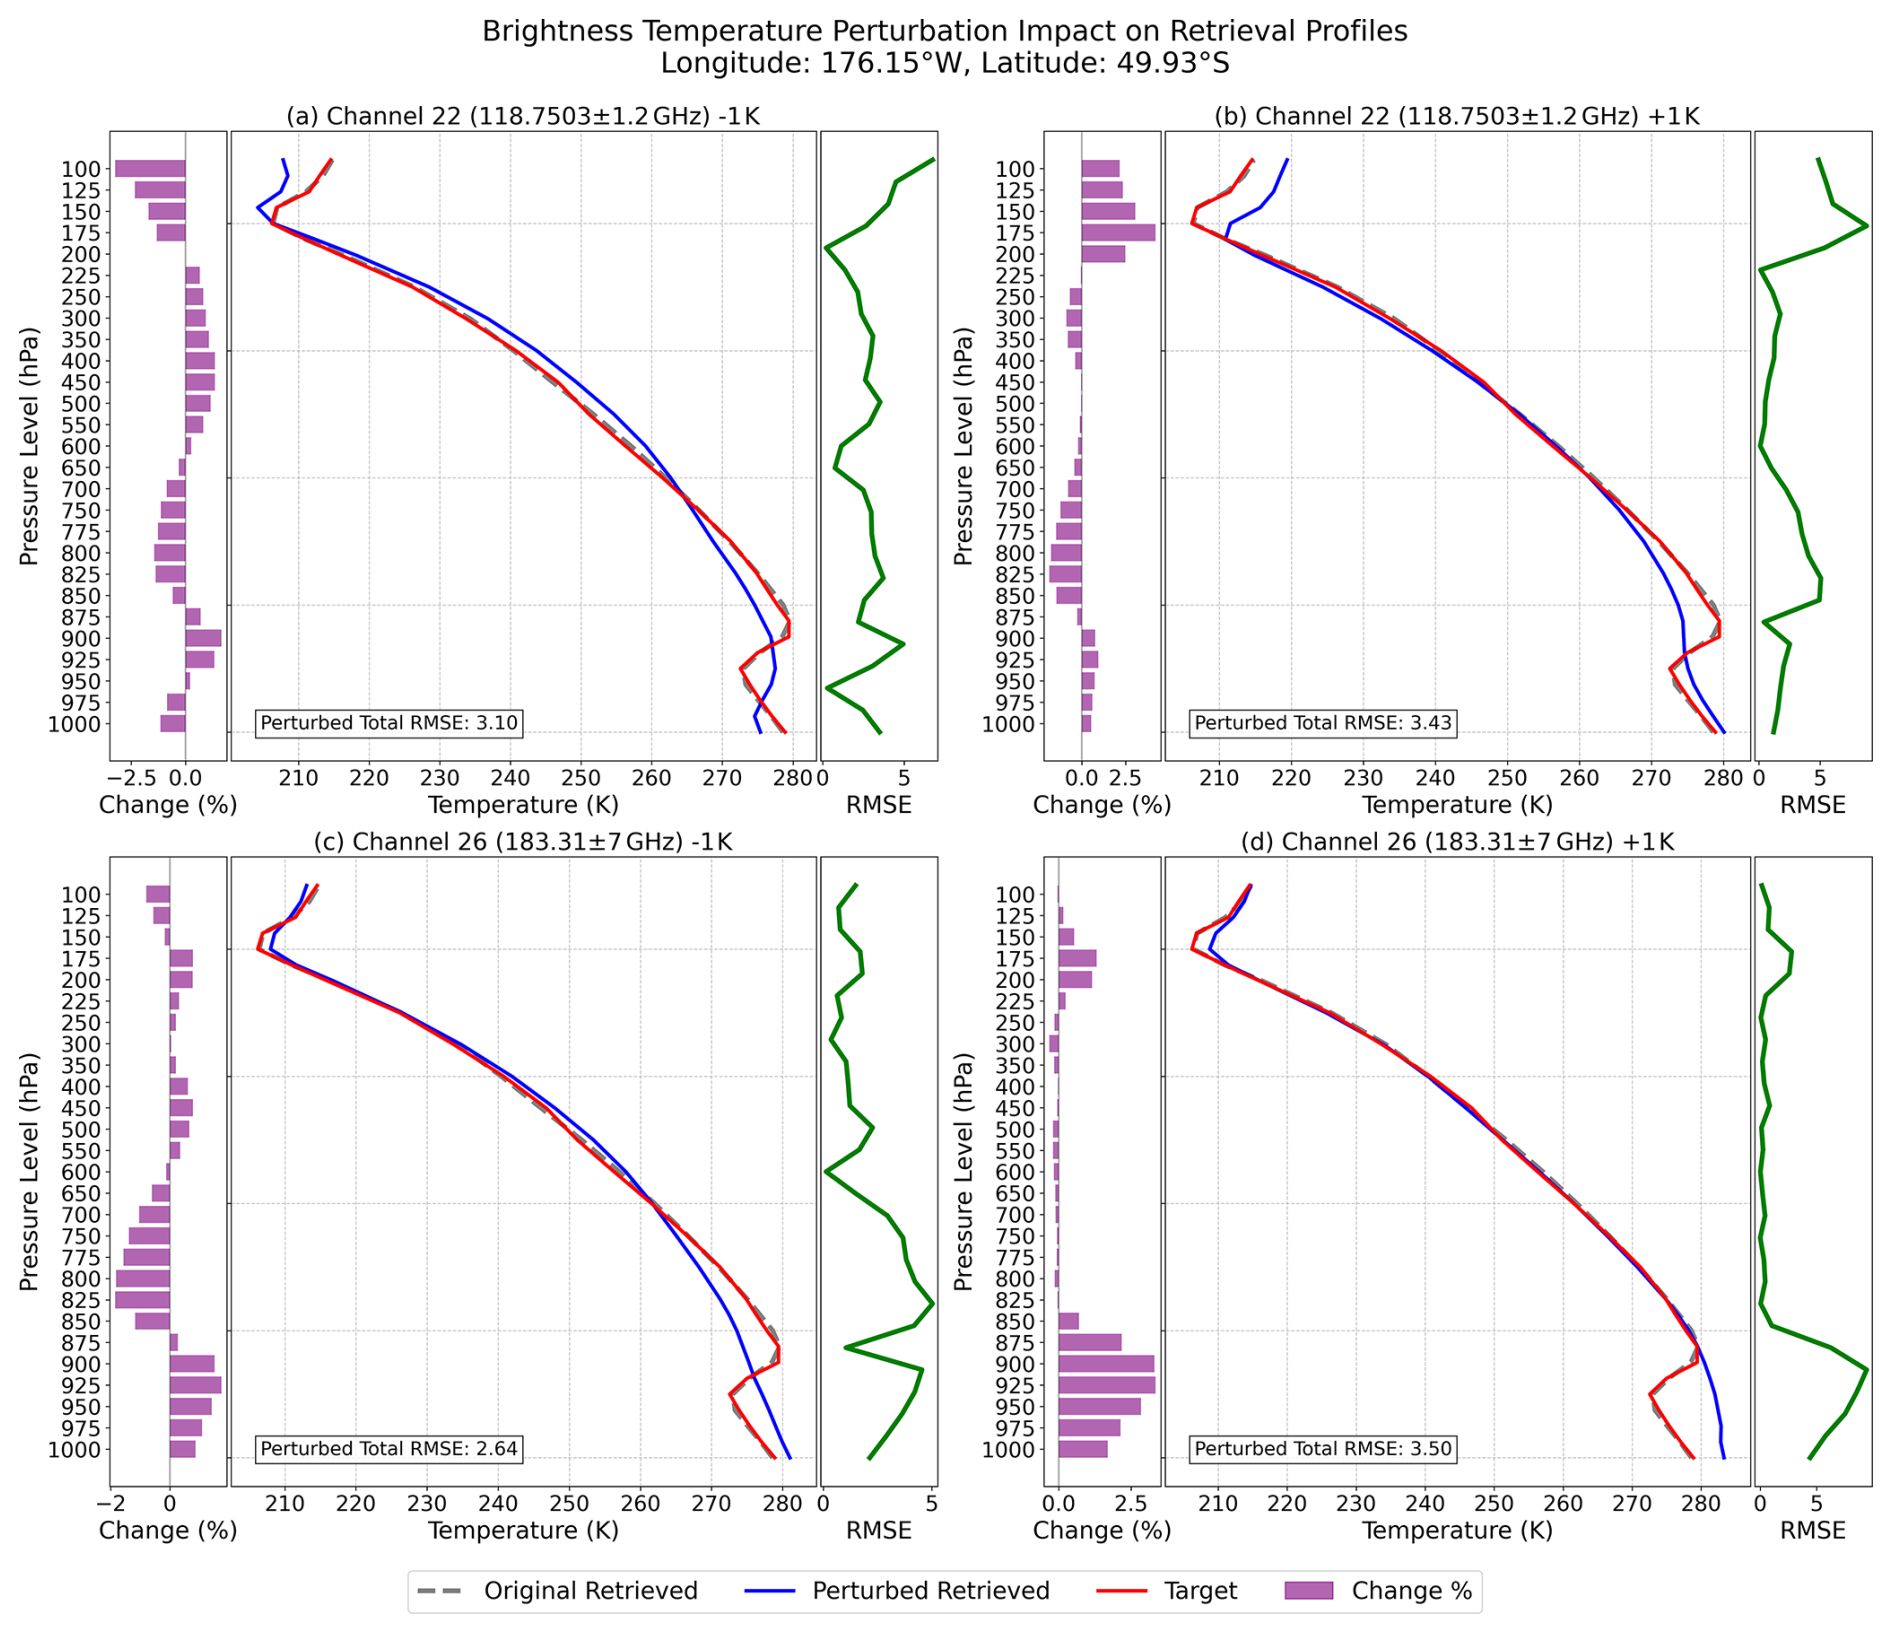
Figure 6Single temperature profile perturbation experiment (±1 K perturbations are introduced to the brightness temperatures of channels 22 and 26). Each subplot adopts a triple-axis composite layout: the left-hand purple bar chart reveals the vertical relative differences of the perturbed retrieval profile from the original profile (calculated as [(perturbed − original) original] × 100 %); the central area presents the temperature profiles comparison (gray dashed line denotes the original retrieval result, blue solid line represents the perturbed retrieval result, and red solid line is the target profile); the right-hand green curve signifies the vertical RMSE between the perturbed retrieval profile and the target profile.
To assess model stability and physical interpretability, we perturbed TBs of the 118.75 ± 1.2 and 183.31 ± 7 GHz channels (Fig. 6). Results show the 118 GHz channel primarily affects temperature retrievals in the mid-to-upper troposphere (500–100 hPa), with discernible but weaker signals extending to the boundary layer (850–1000 hPa). The 183 GHz channel demonstrates significant influence on lower tropospheric temperatures (1000–700 hPa), consistent with its dominant role in boundary layer moisture constraint. These findings align with Jacobian profiles: the 118 GHz channel's oxygen sensitivity peaks in the mid-troposphere, while the 183 GHz channel's water vapor absorption introduces localized temperature adjustments via humidity-radiation interactions.
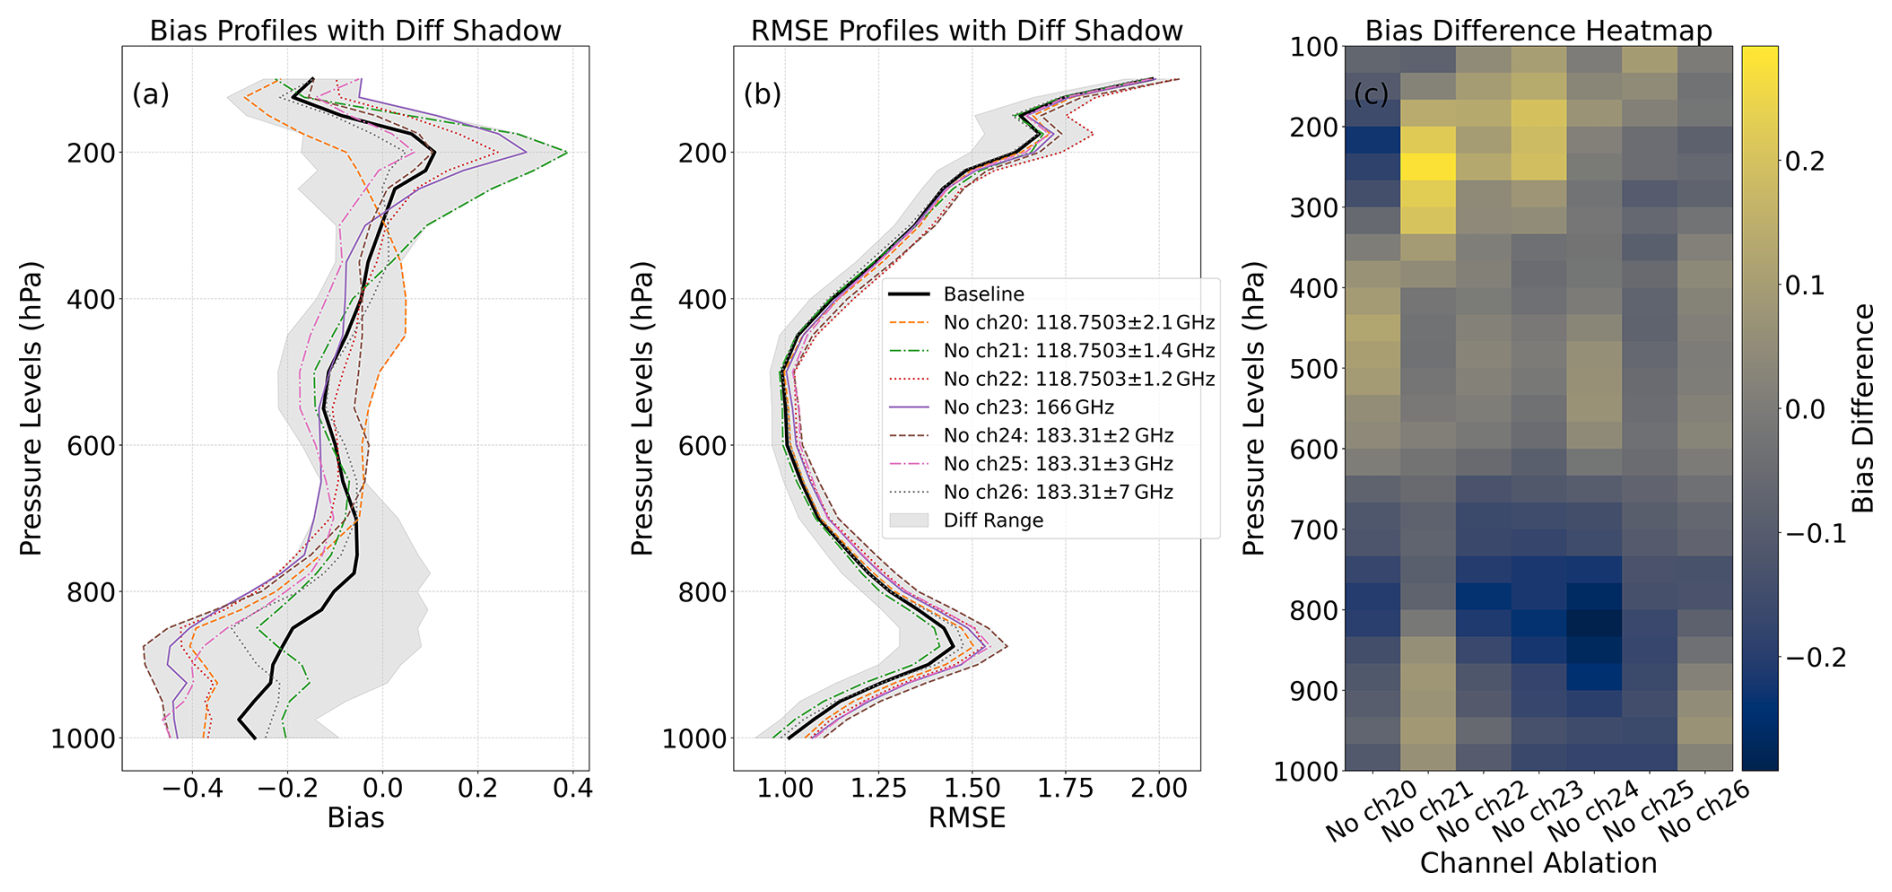
Figure 7Results of channel ablation experiments illustrating the impact of removing individual channels (channels 21–26) on temperature profile retrieval accuracy. In panel (a), vertical bias profiles are shown relative to the baseline (black solid line). In panel (b), the corresponding RMSE profiles are presented. In panel (c), the bias difference heatmap displays the magnitude of deviations relative to the baseline.
Moreover, the channel ablation experiments (Fig. 7) further corroborate these sensitivities. When channels 21–26 are removed individually, the resulting bias and RMSE patterns reveal a clear vertical hierarchy: channels with smaller frequency offsets (particularly around the 118 GHz band) exert a more pronounced influence on higher atmospheric layers, whereas those with larger offsets predominantly affect lower layers. Specifically, the 118.75 ± 1.2 GHz channel, with its relatively small offset, impacts the mid-to-upper troposphere significantly, while the 183.31 ± 7 GHz channel, characterized by a larger offset, mainly modulates the lower troposphere. These distinct vertical sensitivities align well with prior findings by Xiao et al. (2023) and Li and Han (2025).
4.2 Relative Humidity (RH) Retrieval
Across various atmospheric layers, the model demonstrated a relatively consistent performance, presenting a layer-averaged bias of 0.87 % and a RMSE of 12.98 %, as graphically depicted in Fig. 7a–b. The consistent performance indicates the model's general stability in handling different atmospheric conditions, yet the non-zero bias and RMSE values also suggest room for improvement in its accuracy.
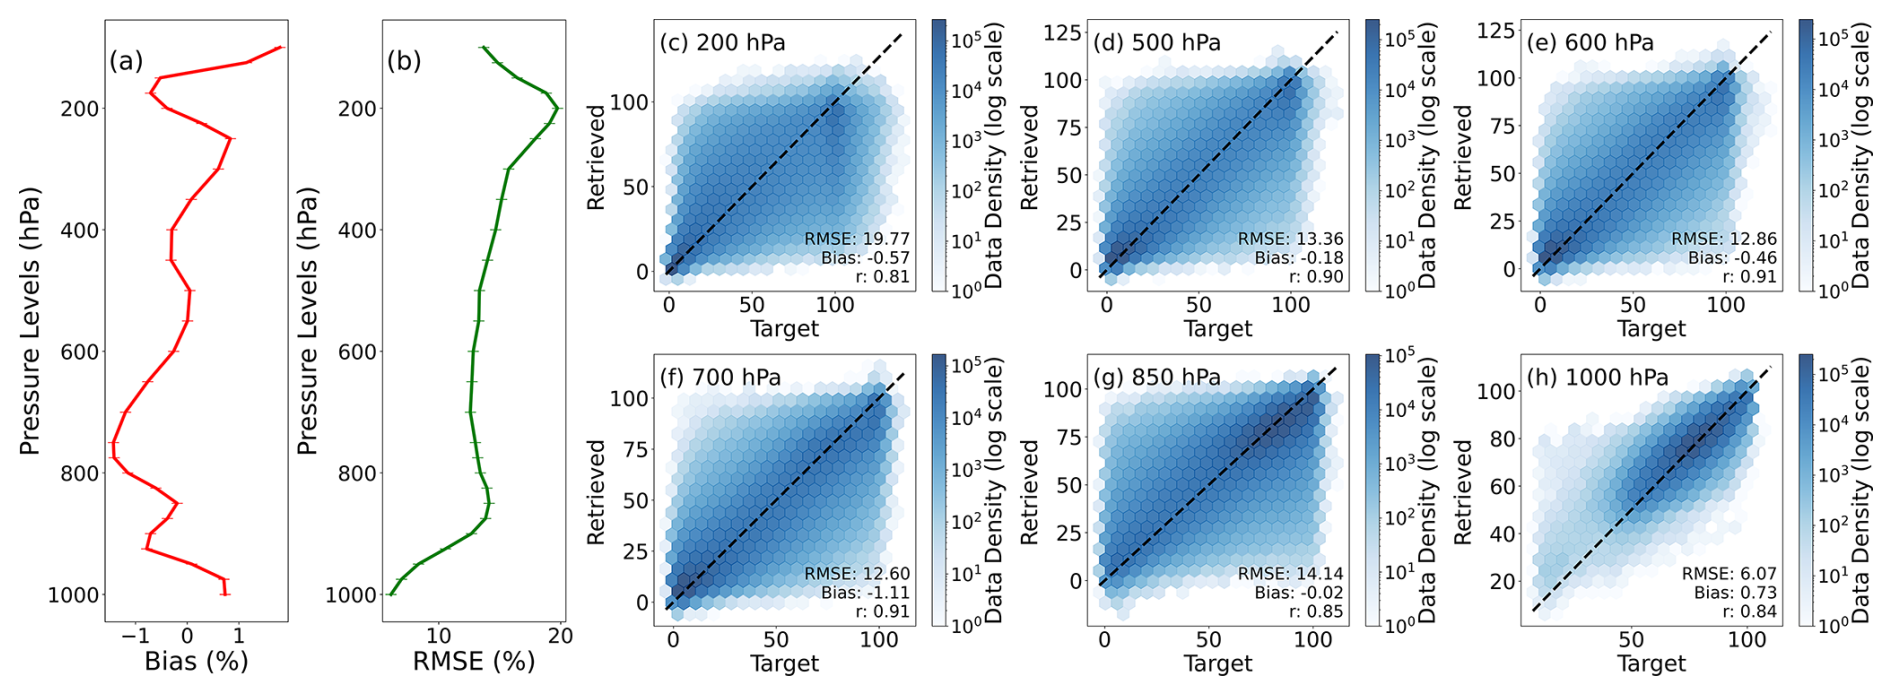
Figure 8(a–b) Bias (%) and RMSE (%) of the retrieved RH profile; (c–h) two-dimensional histograms of retrieved versus target RH at specific pressure levels. Color intensity indicates data density on a logarithmic scale, with darker colors representing higher data counts. The dashed black line (y=x) denotes the 1 : 1 reference for perfect agreement, and the Pearson correlation coefficient (r) quantifies the degree of linear consistency. (c) 200 hPa; (d) 500 hPa; (e) 600 hPa; (f) 700 hPa; (g) 850 hPa; (h) 1000 hPa.
The analysis identified notable RMSE variations, particularly in the lower troposphere around 900 hPa. As height increases from 800 hPa upward, RMSE increases, peaking at around 200 hPa. This trend implies increasing complexity in humidity retrieval at higher altitudes, likely due to enhanced dynamic and turbulent influences in the mid-to-upper troposphere. In this region, convective transport of heat and moisture, along with cloud processes such as particle formation and phase changes, introduce significant uncertainty and alter local humidity distributions. These processes, especially in areas with deep convection or liquid water droplets and ice crystals, obscure the direct link between radiance observations and humidity, challenging the model's ability to accurately retrieve humidity values solely from TBs (Burns et al., 1995, 1997; Blackwell, 2005; Wang et al., 2010; Tan et al., 2015). Figure 8c–h further validate these findings. Figure 9 illustrates the suboptimal retrieval performance in low-humidity regions at low latitudes and high-humidity regions at high latitudes. This graphical representation clearly highlights the difficulties encountered in accurately retrieving extremely high and low relative humidity values. Consistent patterns are evident in the global comparison maps across multiple pressure levels in Fig. A2: while most regions perform well, several extreme-moisture zones in subtropical and other low- to midlatitude regions exhibit relatively larger retrieval errors.
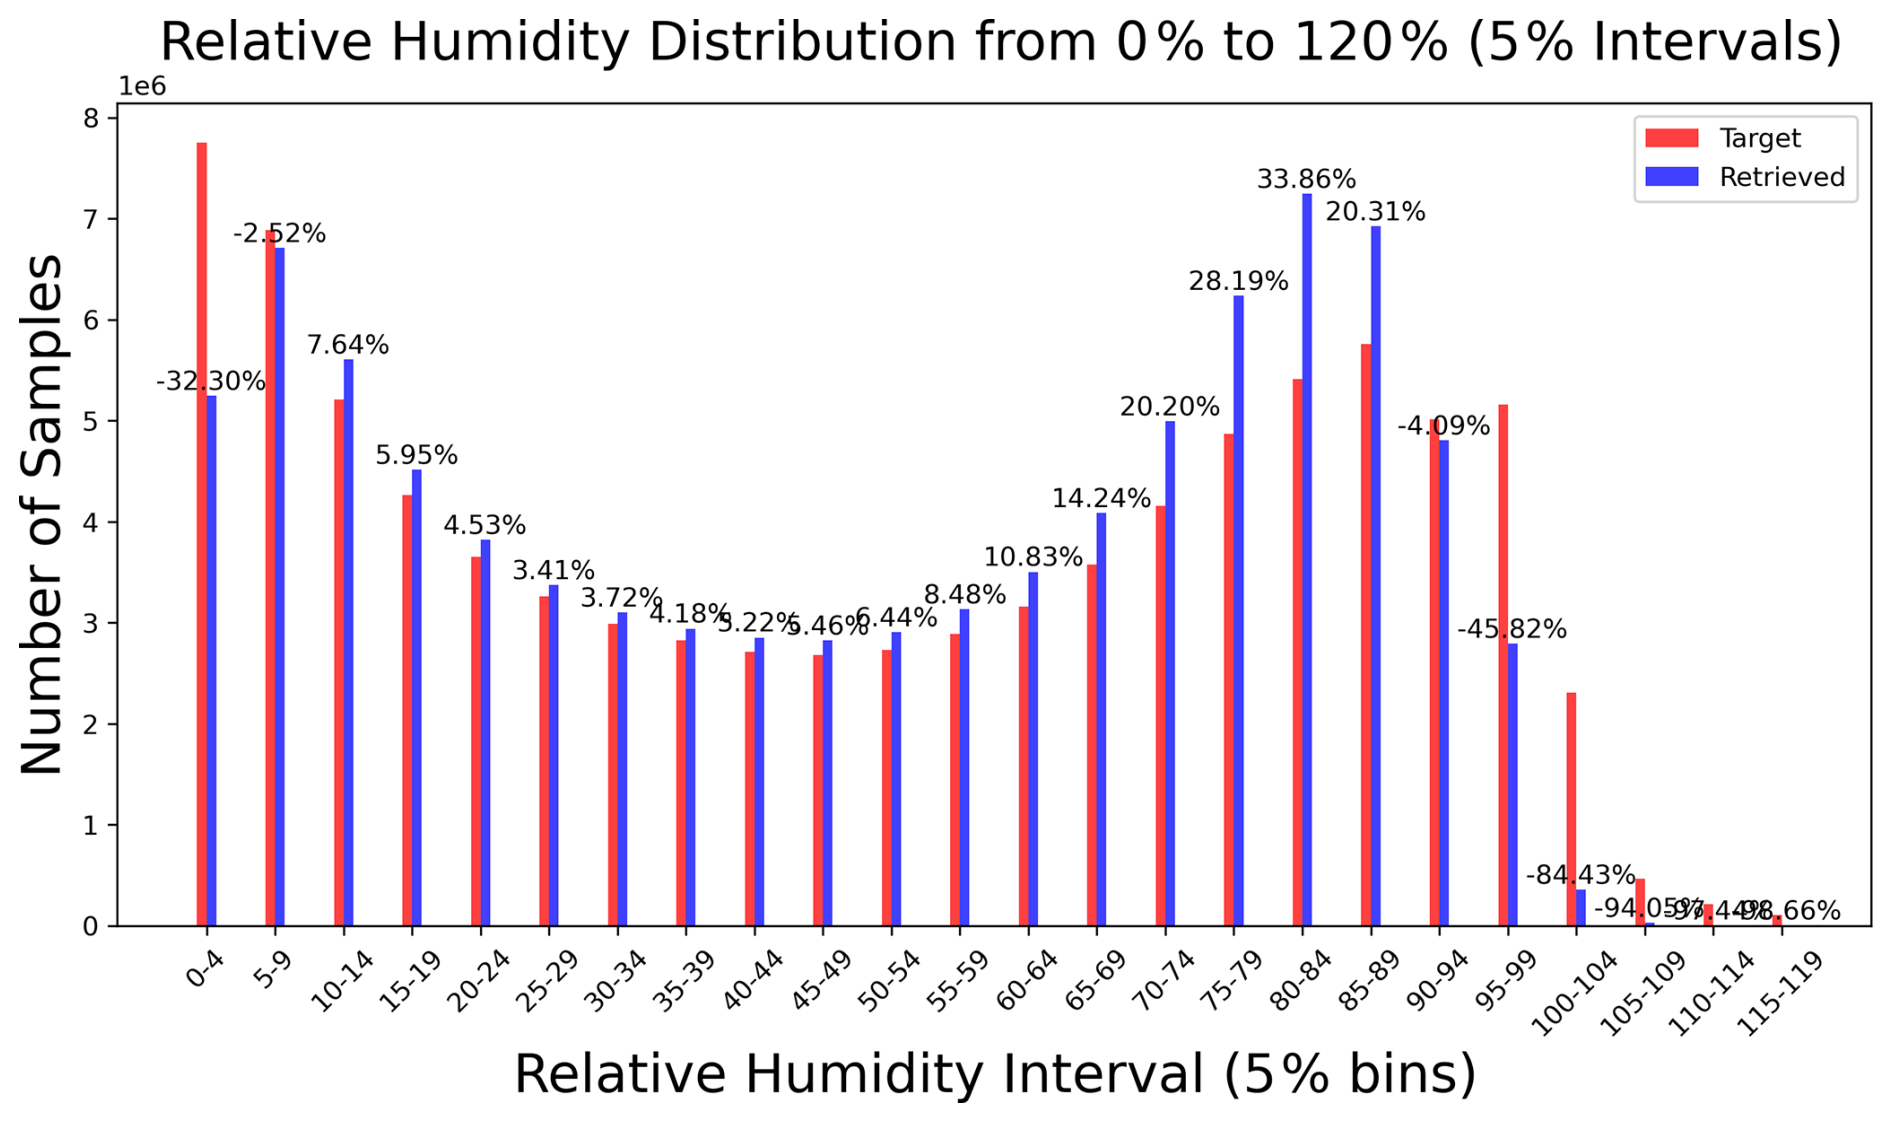
Figure 9Statistics of the number of retrieved and labeled samples in the test set (5 % bins).
Similar to the challenges faced in temperature profile retrieval, the issues in humidity retrieval can be traced back to data-related problems, such as data imbalance in the training dataset, and the complex non-linear relationships between the input variables and the humidity values in extreme conditions. Furthermore, this underrepresentation of extreme events is inherently amplified by the “dampening effect” commonly observed in deep learning models. As recently demonstrated by Boucher and Aires (2023) and Boucher (2024), neural networks optimized via standard loss functions (such as Mean Squared Error) mathematically tend to output the conditional expectation of the target distribution. Consequently, these models naturally penalize severe deviations, pulling predictions toward the statistical mean of the training data and leading to a systematic compression of variance. This theoretical limitation directly explains the observed underestimation of extreme high and low relative humidity in our retrieval results. To enhance retrieval accuracy, we could refine the deep learning model by incorporating high-resolution SST data and advanced surface flux models. Additionally, leveraging data augmentation techniques to expand the diversity of training samples, especially those representing extreme relative humidity conditions, may improve the model's generalization ability. Exploring the potential of hybrid neural network architectures that better capture non-linear ocean-atmosphere interactions could also be a promising avenue for future research. For maritime areas, these variations are primarily linked to SST and surface flux dynamics.
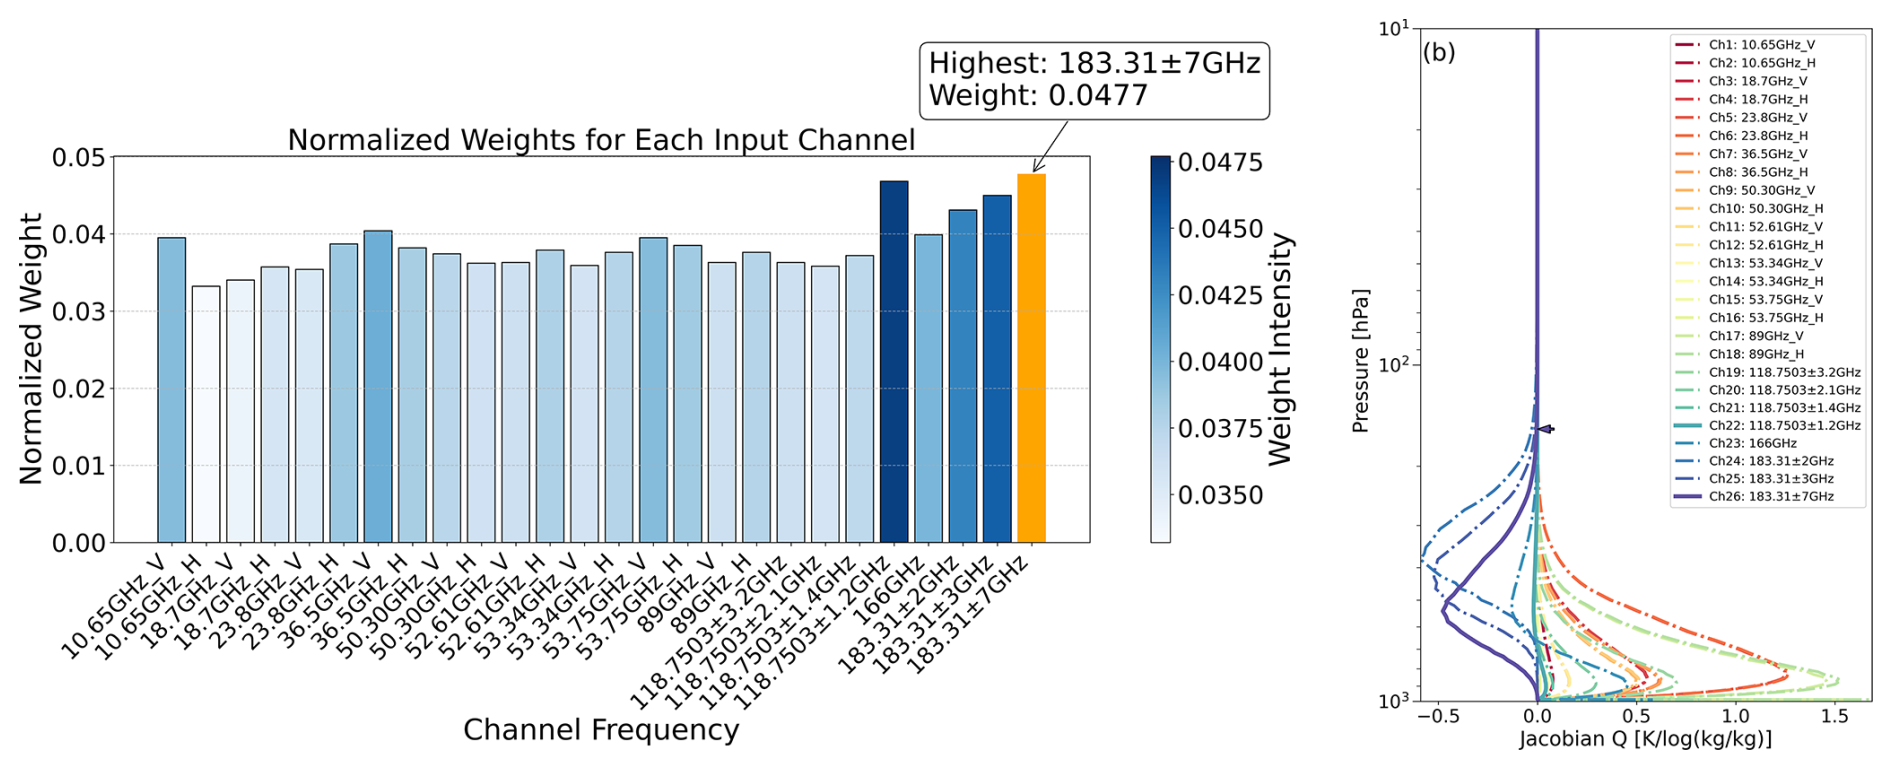
Figure 10(a) Autograd-based sensitivity analysis of input channels for RH retrieval. The vertical axis represents the mean absolute normalized gradient (, % K−1); (b) Jacobian for relative humidity, obtained using the RTTOV model tailored for the MWRI-RM sensor. Solid lines denote Channel 22 (118.75 ± 1.2 GHz) and 26 (183.31 ± 7 GHz), while dash-dot lines represent other channels.
Through gradient-based backpropagation analysis, we first characterize the physical mechanisms of channel contributions to humidity retrieval. The 183.31 ± 7 GHz channel dominates atmospheric humidity profile retrieval, with peak sensitivity concentrated in the boundary layer and lower troposphere (1000–700 hPa) (Fig. 10a–b). This aligns with the direct absorption and emission of water vapor at this frequency, enabling precise resolution of moisture gradients in convective and maritime environments (He et al., 2017; Yao and Guan, 2022; Xiao et al., 2023; Li and Han, 2025). In contrast, the 118.75 ± 1.2 GHz channel is primarily sensitive to mid-to-upper tropospheric temperature distributions (500–200 hPa) via oxygen absorption lines (Xiao et al., 2023; Li and Han, 2025), with negligible direct humidity sensitivity (Fig. 10b). However, perturbation experiments (Fig. 11) reveal unexpected impacts of this channel on upper tropospheric humidity (200–100 hPa), alongside its dominant temperature adjustments. This apparent discrepancy can be attributed to the thermodynamic correlation between temperature and humidity profiles. Additionally, weight diffusion in the convolutional layer architecture may propagate temperature-sensitive features to adjacent humidity retrievals, representing a secondary effect of spatial feature mixing inherent to deep neural networks.
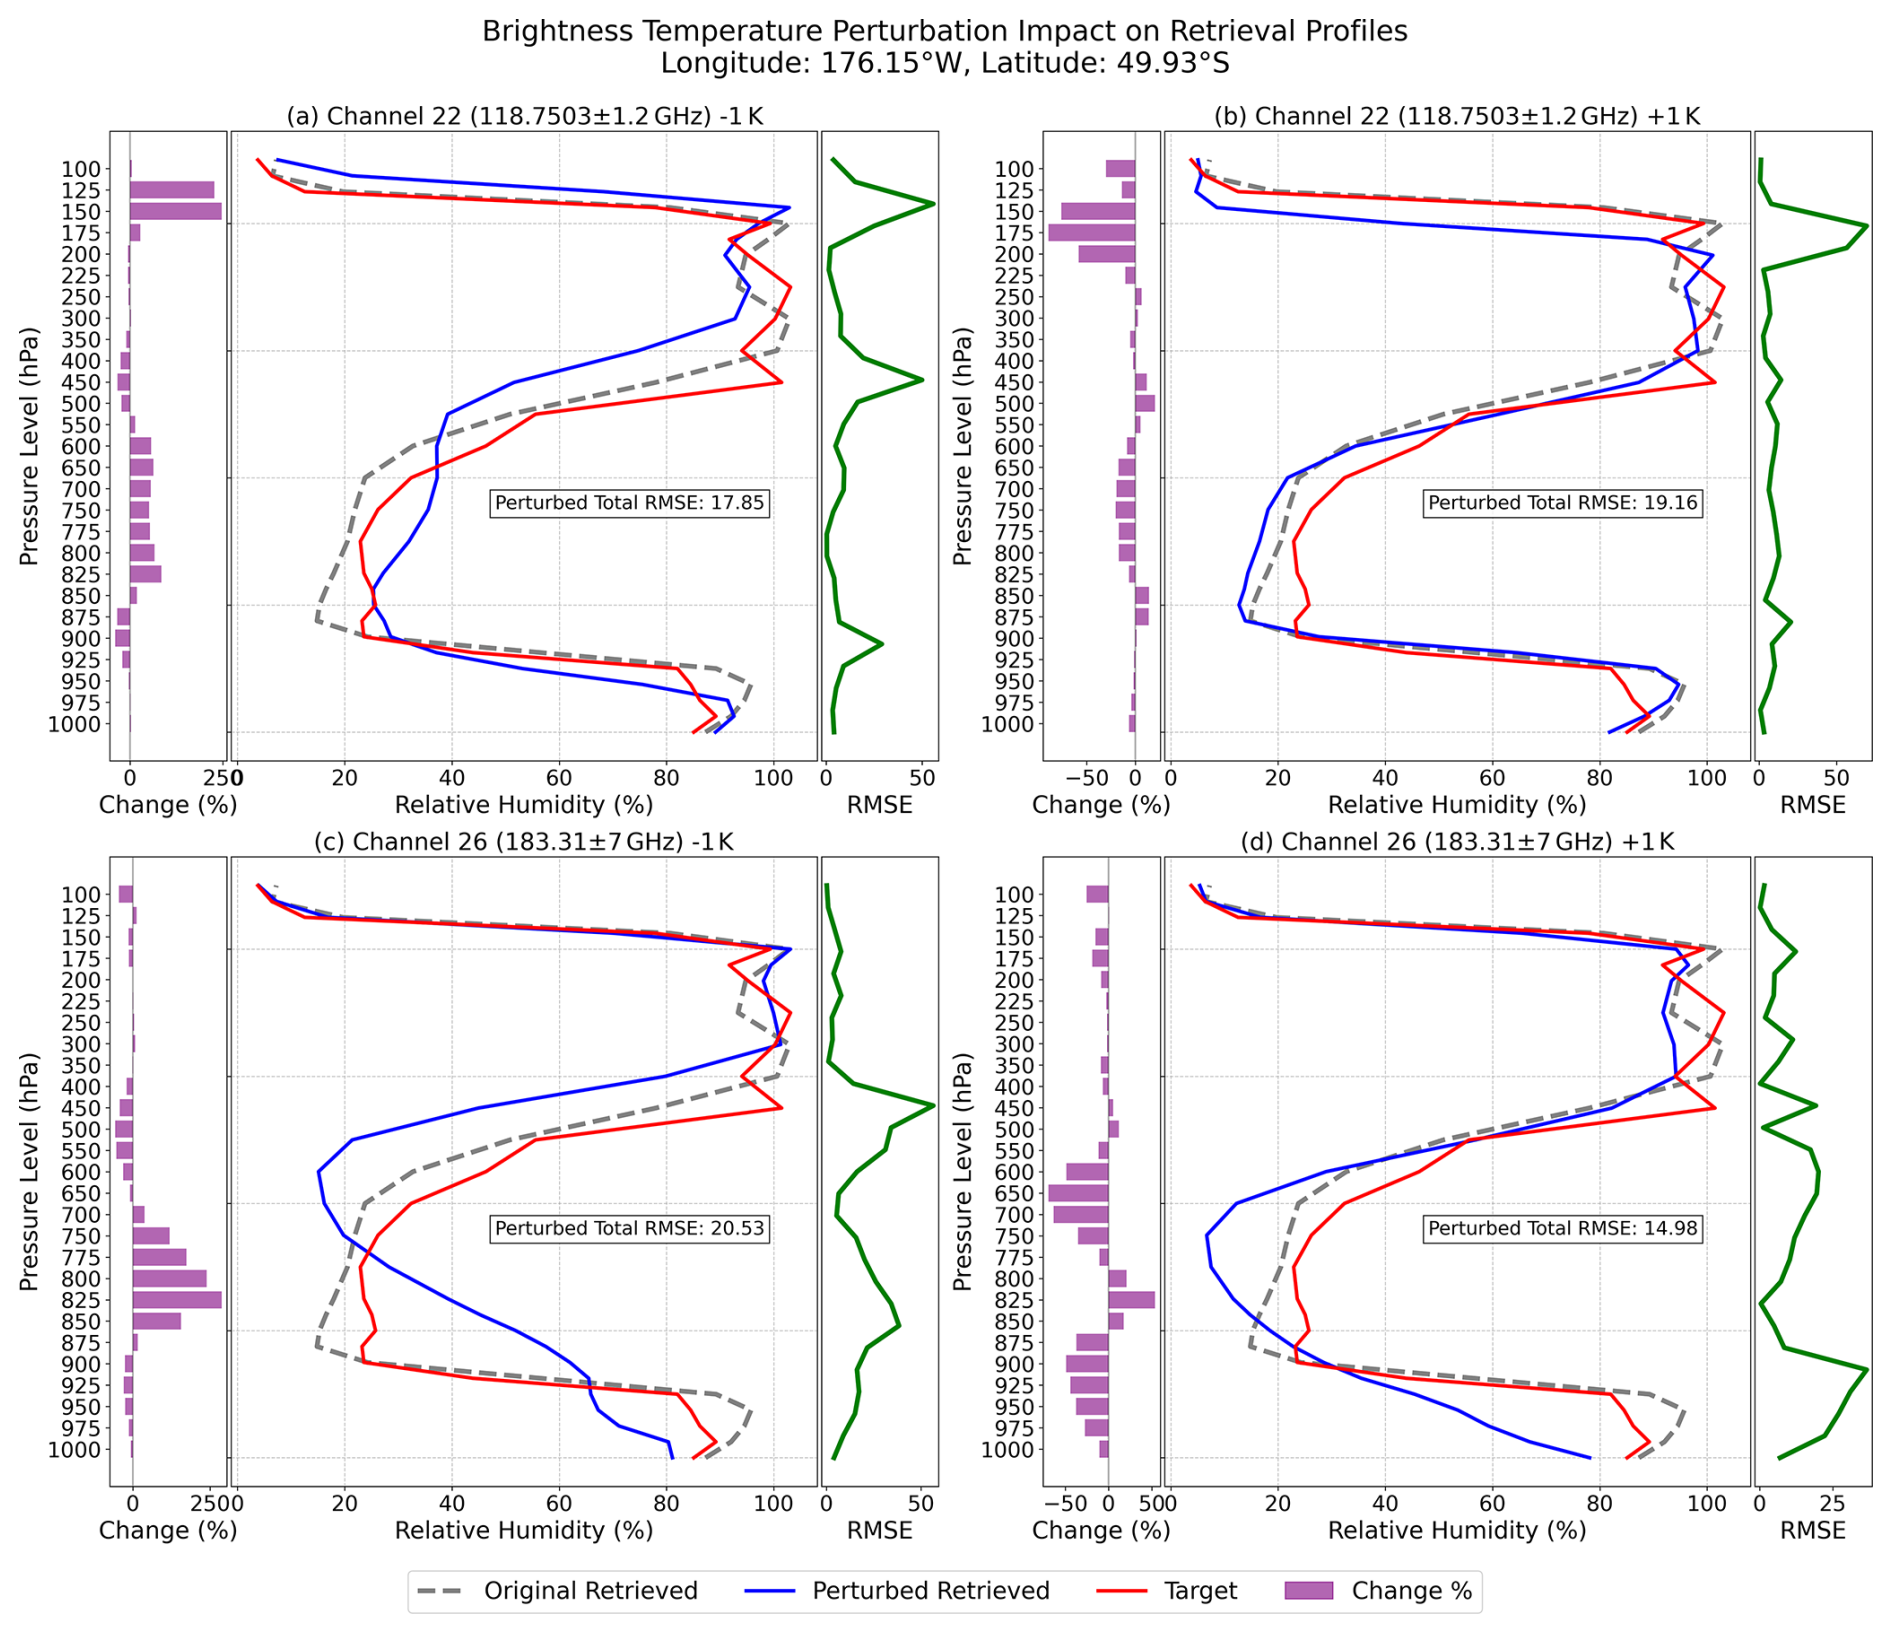
Figure 11Single relative humidity profile perturbation experiment (±1 K perturbations are introduced to the brightness temperatures of channels 22 and 26). Each subplot adopts a triple-axis composite layout: the left-hand purple bar chart reveals the vertical relative differences of the perturbed retrieval profile from the original profile (calculated as [(perturbed − original) original] × 100 %); the central area presents the relative humidity profiles comparison (gray dashed line denotes the original retrieval result, blue solid line represents the perturbed retrieval result, and red solid line is the target profile); the right-hand green curve signifies the vertical RMSE between the perturbed retrieval profile and the target profile.
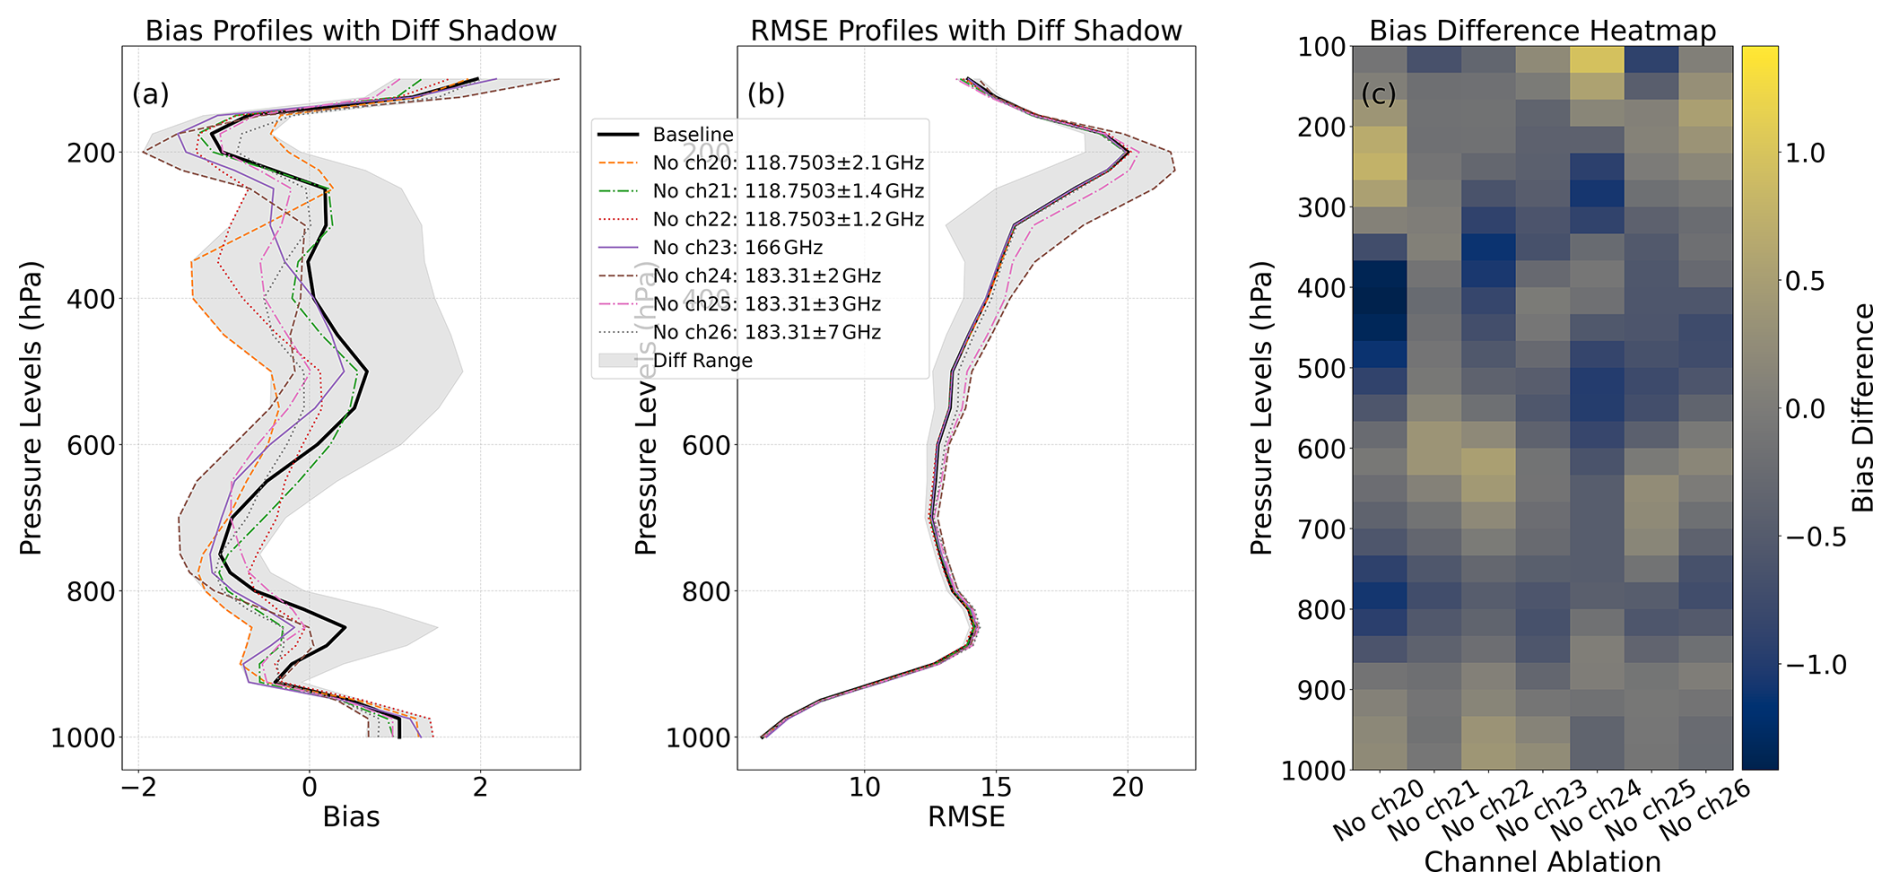
Figure 12Results of channel ablation experiments illustrating the impact of removing individual channels (channels 21–26) on relative humidity profile retrieval accuracy. In panel (a), vertical bias profiles are shown relative to the baseline (black solid line). In panel (b), the corresponding RMSE profiles are presented. In panel (c), the bias difference heatmap displays the magnitude of deviations relative to the baseline.
Moreover, the channel ablation experiments (Fig. 12) further corroborate and refine these sensitivity patterns. When removing channels 21–26 individually, we observe that the 183.31 ± 7 GHz channel (marked by a larger frequency offset) dominates lower-tropospheric humidity constraints. Notably, for channels in the vicinity of 183 GHz, those with smaller frequency offsets (although their impact is not strikingly pronounced), suggest a tentative tendency to influence higher tropospheric layers. In contrast, the 118.75 ± 1.2 GHz channel exerts a more notable influence on upper-level humidity fields, presumably via indirect dynamical pathways. These findings align with prior results by Xiao et al. (2023) and Li and Han (2025), underscoring the distinct vertical contributions of different channels to humidity retrieval. However, our current model's lack of explicit physical constraints leads to certain deviations from traditional interpretations, as highlighted in earlier studies. Future work will focus on integrating physics-informed network designs to disentangle temperature-humidity coupling and enhance the interpretability of subtle vertical signals.
This study employs remapped MWRI-RM sea-surface-observed brightness temperature data, with ERA5 reanalysis temperature and relative humidity profile sets functioning as label data, to retrieve temperature and relative humidity profiles by means of an Advanced Residual Convolutional Neural Network (AR-CNN). The findings can be summarized as follows:
The retrieval of temperature profiles exhibits an RMSE of approximately 1.24 K, while the RMSE for relative humidity profile retrieval is 12.98 %. These values demonstrate a high level of accuracy in both temperature and humidity retrieval, indicating the effective performance of the model in capturing atmospheric variables.
Statistical comparisons between the retrieved and labeled samples show strong consistency for temperature profiles, indicating that the model generalizes well across diverse temperature conditions. However, noticeable discrepancies remain in regions with extremely high or low humidity, reflecting both the limited representation of such cases in the training data and the intrinsic difficulty of resolving water vapor signals from brightness temperatures that lack explicit physical constraints. These limitations suggest that further model refinement and data augmentation will be needed to enhance retrieval performance under extreme conditions.
A comprehensive analysis integrating channel importance and Jacobian matrices validated the model's physical consistency in leveraging spectral information, showing that the 118 GHz band excels in mid-to-upper tropospheric temperature retrieval (500–200 hPa) with indirect upper-tropospheric (200–100 hPa) humidity adjustments via temperature-humidity dynamical coupling, while the 183 GHz band dominates boundary layer to mid-tropospheric moisture profiling (1000–500 hPa) through direct water vapor absorption/emission and provides humidity-driven cross-constraints for temperature estimates. Perturbation experiments revealed that the 118 GHz channel influences upper-tropospheric temperature-humidity covariance, likely due to both physical temperature-driven moisture redistribution and model weight diffusion in deep learning layers, while the 183 GHz channel's impact on lower tropospheric humidity (850–700 hPa) aligns with its strong water vapor sensitivity. Moreover, channel ablation experiments further confirmed these vertical sensitivities, demonstrating that channels with smaller frequency offsets primarily affect upper atmospheric layers, while those with larger offsets exert stronger impacts on lower layers. Notably, since relative humidity is inherently temperature dependent, the relatively high weighting of the 118 GHz channels in humidity retrievals further indicates that the model effectively captures the physical coupling between temperature and moisture. These results highlight the importance of spectral synergy in improving vertical profile retrievals. Future work will focus on introducing explicit physics-based constraints into the network architecture to further enhance layer-specific interpretability and retrieval accuracy.
Table A1Comparison of temperature and humidity profile retrieval accuracy for different models, including root mean square error (RMSE) on training, validation, and test sets, and number of training epochs. (Preliminary baseline comparison used during early experimentation and comprehensive benchmarking is out of scope.)
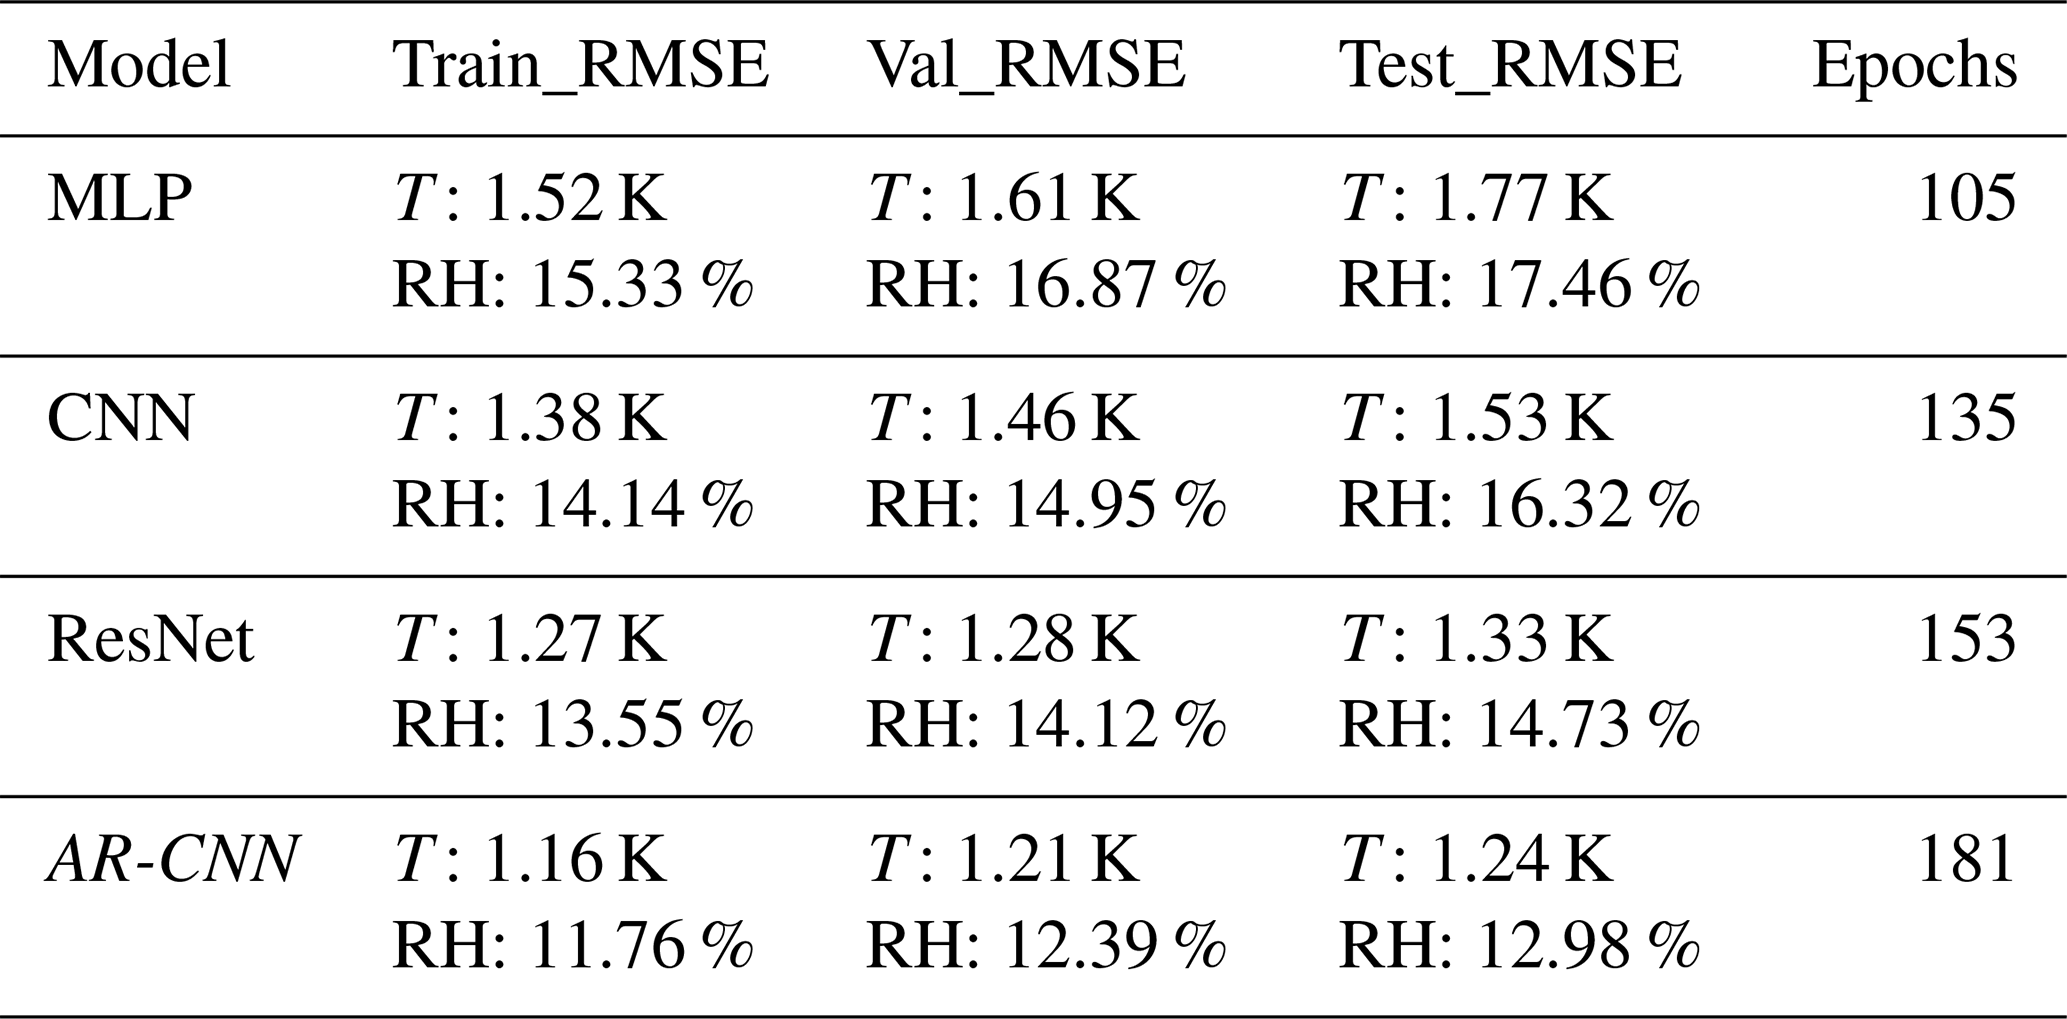
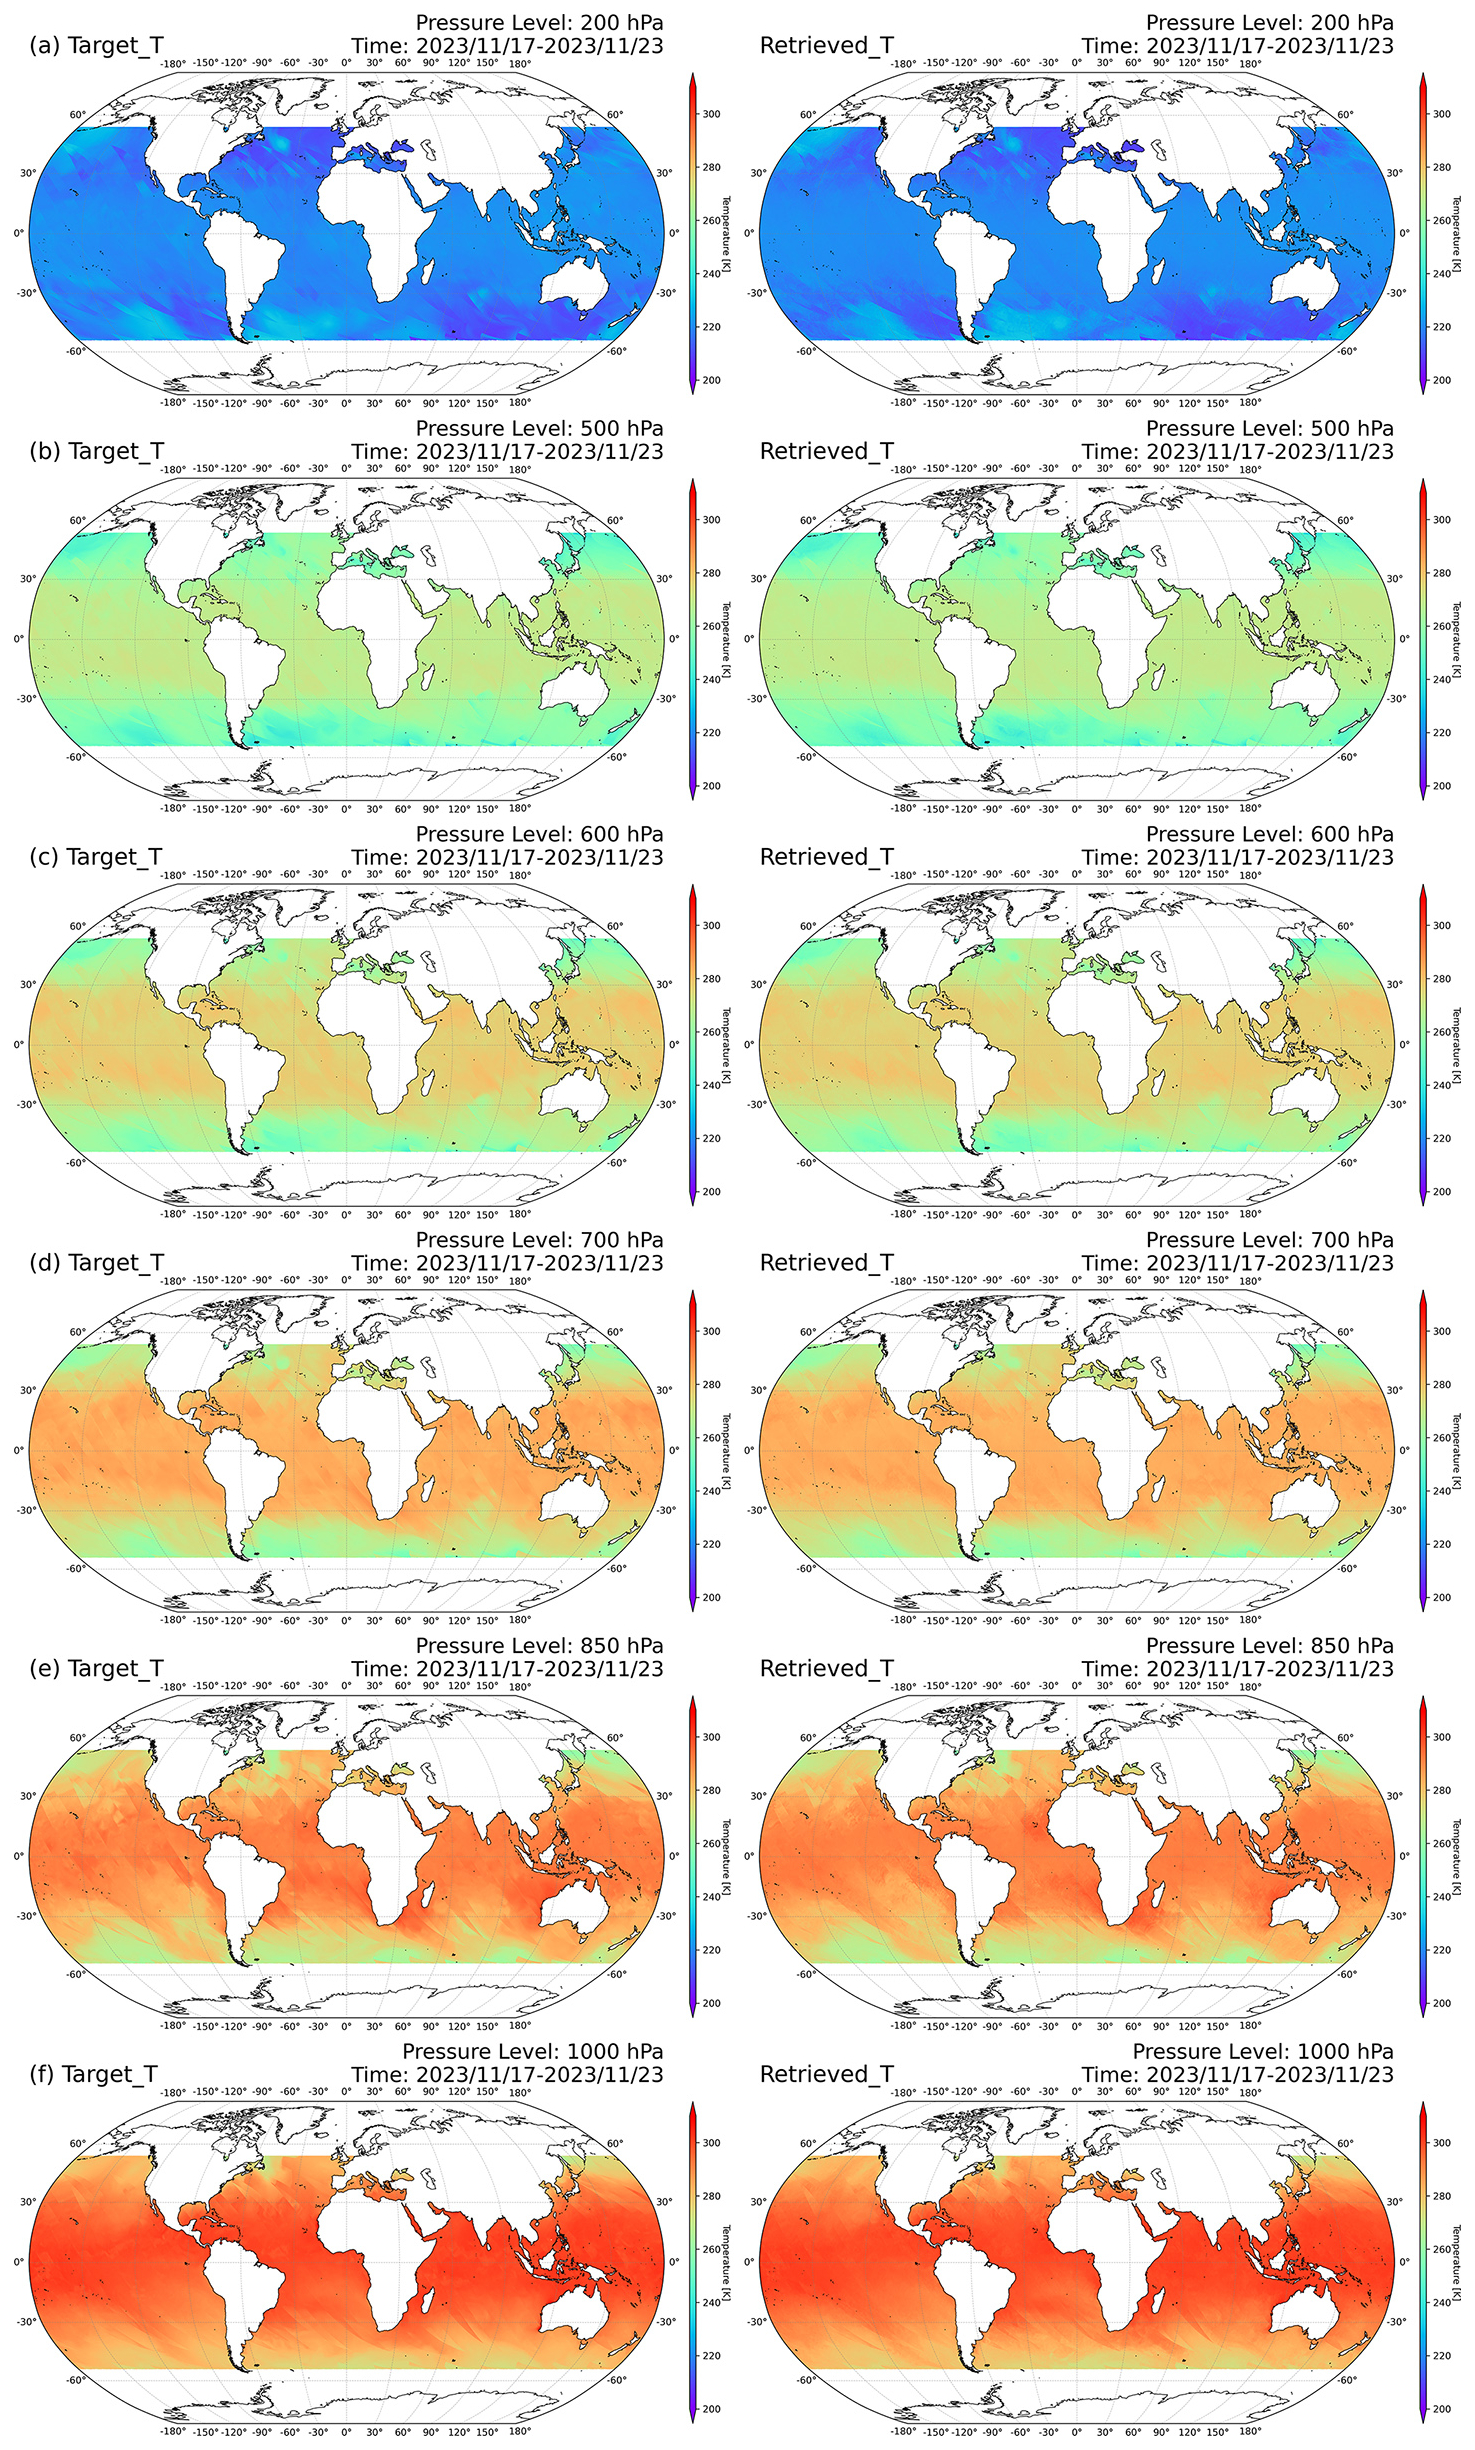
Figure A1Global Comparison Map of the Retrieved Temperature at Specific Pressure Levels. (a) 200 hPa (b) 500 hPa; (c) 600 Pa; (d) 700 hPa; (e) 850 hPa; (f) 1000 hPa.
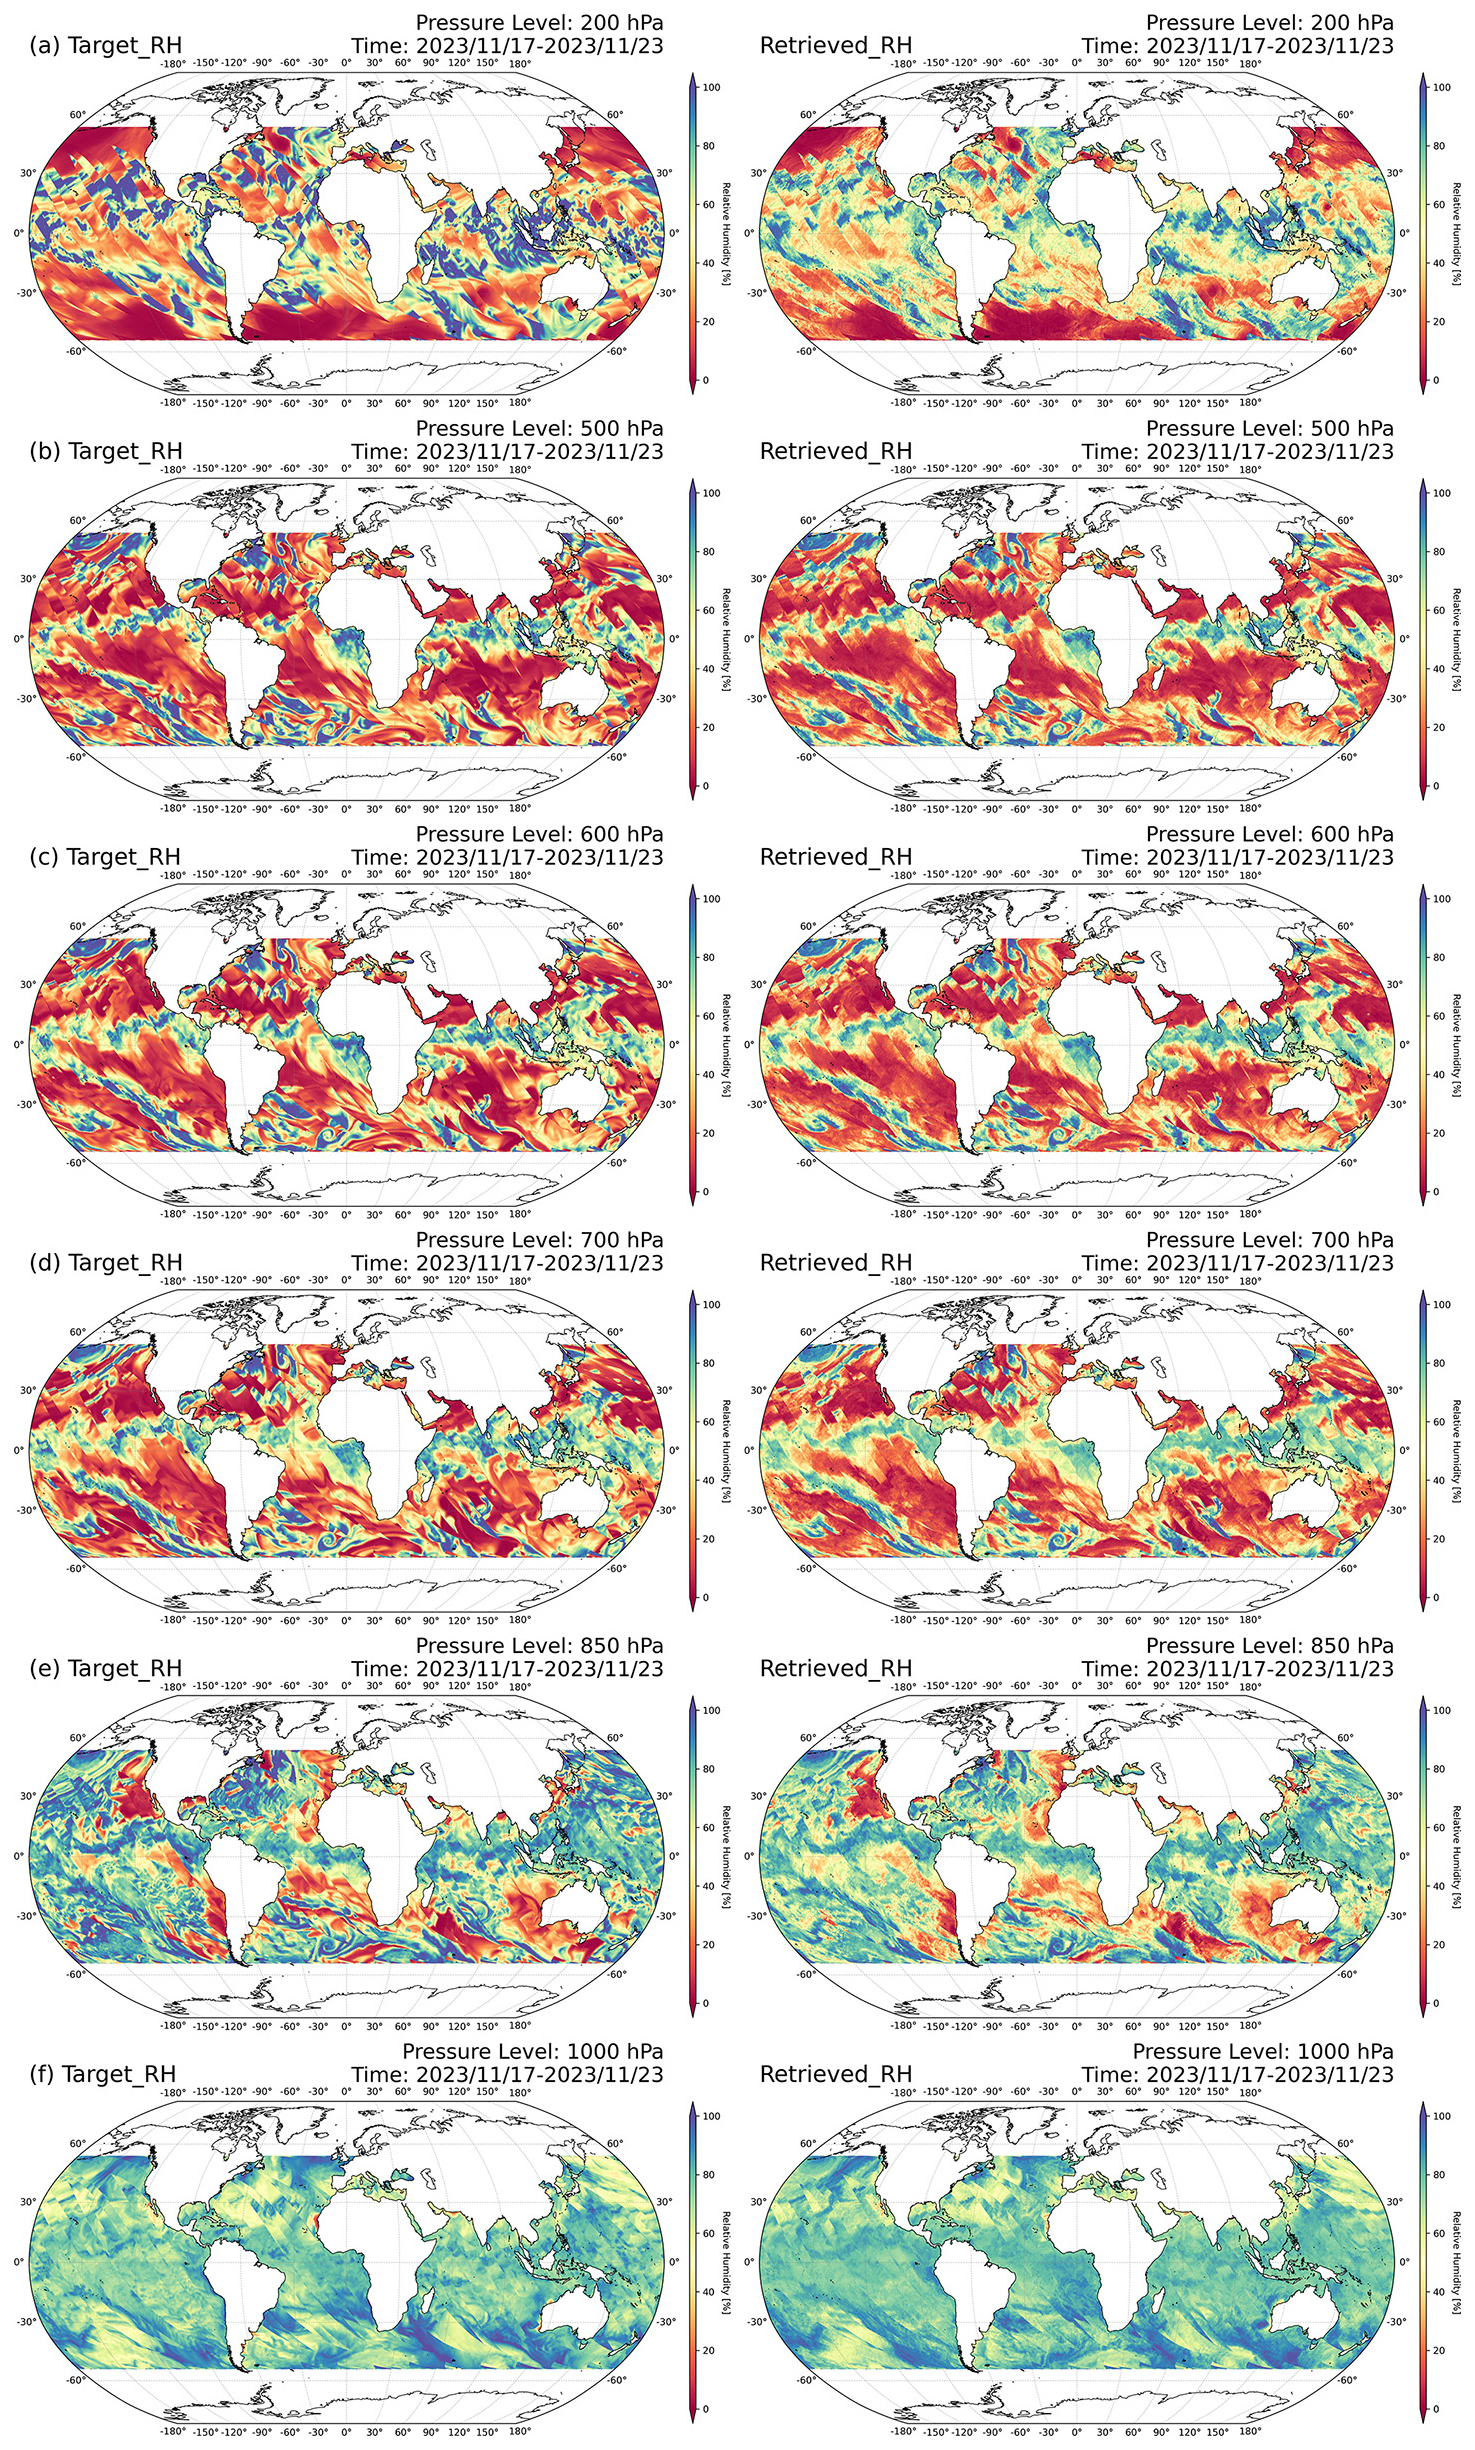
Figure A2Global Comparison Map of the Retrieved Relative Humidity at Specific Pressure Levels. (a) 200 hPa; (b) 500 hPa; (c) 600 Pa; (d) 700 hPa; (e) 850 hPa; (f) 1000 hPa.
The ERA5 data are from the Copernicus Climate Change Service (C3S) Climate Data Store (CDS) (https://doi.org/10.24381/cds.bd0915c6, Hersbach et al., 2023). The training datasets used for this study can be requested from the authors.
In this research, each author played a vital role. WH and ML designed the experiments, setting up the framework, procedures, and variables. ML carried out all experiments, handling equipment and data accurately. HS optimized the experimental code for better efficiency. RY verified the results through rigorous analysis. YY revised and edited the manuscript to meet the journal's high standards. Their combined efforts led to the success of this research.
The contact author has declared that none of the authors has any competing interests.
Publisher's note: Copernicus Publications remains neutral with regard to jurisdictional claims made in the text, published maps, institutional affiliations, or any other geographical representation in this paper. The authors bear the ultimate responsibility for providing appropriate place names. Views expressed in the text are those of the authors and do not necessarily reflect the views of the publisher.
This research was supported by many individuals. We gratefully acknowledge the faculty and senior researchers at the CMA Earth System Modeling and Prediction Centre, especially Bowen Cai for satellite data remapping and Shuting Zhou for RTTOV simulations. We also thank Professors Hao Li and Xiuyu Sun from the Shanghai Academy of AI for Science for guidance on algorithm optimization and model application, which advanced our work in intelligent science and meteorological forecasting. Finally, we are grateful to all mentors who supported this research and its completion.
This research has been supported by the National Natural Science Foundation of China (grant no. U2442219 and 42205158).
This paper was edited by S. Joseph Munchak and reviewed by four anonymous referees.
Aires, F., Prigent, C., Rossow, W. B., and Rothstein, M.: A new neural network approach including first guess for retrieval of atmospheric water vapor, cloud liquid water path, surface temperature, and emissivities over land from satellite microwave observations, J. Geophys. Res., 106, 14887–14907, https://doi.org/10.1029/2001JD900085, 2001.
Blackwell, W. J.: A neural-network technique for the retrieval of atmospheric temperature and moisture profiles from high spectral resolution sounding data, IEEE Trans. Geosci. Remote Sens., 43, 2535–2546, https://doi.org/10.1109/tgrs.2005.855071, 2005.
Boucher, E.: Designing Deep-Learning models for surface and atmospheric retrievals from the IASI infrared sounder, PhD thesis, Sorbonne Université, Paris, France, NNT: 2024SORUS145, https://theses.hal.science/tel-04701253v1 (last access: 23 March 2026), 2024.
Boucher, E. and Aires, F.: Machine learning for satellite retrievals: linear dampening of the extremes and an extreme-oriented learning formulation, Environ. Res. Lett., 18, 024025, https://doi.org/10.1088/1748-9326/acb3e3, 2023.
Boukabara, S.-A., Garrett, K., Chen, W., Iturbide-Sanchez, F., Grassotti, C., Kongoli, C., Weng, F., Liu, Q., Baelen, B., and Sun, N.: MiRS: An all-weather 1DVAR satellite data assimilation and retrieval system, IEEE Trans. Geosci. Remote Sens., 49, 3249–3272, https://doi.org/10.1109/TGRS.2011.2158438, 2011.
Burns, B. A., Wu, X., and Diak, G. R.: Model-derived brightness temperature in AMSU moisture channels for various precipitation structures: Comparison of two radiative transfer formulations, in: 1995 International Geoscience and Remote Sensing Symposium, IGARSS '95: Quantitative Remote Sensing for Science and Applications, Firenze, Italy, 10–14 July 1995, 876–878, https://doi.org/10.1109/IGARSS.1995.521084, 1995.
Burns, B. A., Wu, X., and Diak, G. R.: Effects of precipitation and cloud ice on brightness temperatures in AMSU moisture channels, IEEE Trans. Geosci. Remote Sens., 35, 1429–1437, https://doi.org/10.1109/36.649797, 1997.
Cadeddu, M. P., Turner, D. D., and Liljegren, J. C.: A Neural Network for Real-Time Retrievals of PWV and LWP From Arctic Millimeter-Wave Ground-Based Observations, IEEE Trans. Geosci. Remote Sens., 47, 1887–1900, https://doi.org/10.1109/tgrs.2009.2013205, 2009.
Cai, X., Bao, Y., Petropoulos, G. P., Lu, F., Lu, Q., Zhu, L., and Wu, Y.: Temperature and Humidity Profile Retrieval from FY4-GIIRS Hyperspectral Data Using Artificial Neural Networks, Remote Sens., 12, 1872, https://doi.org/10.3390/rs12111872, 2020.
Chen, H. and Lin, L.: Numerical simulation of temperature profile retrievals from the brightness temperatures in 6 channels near 118.75 GHz, Chin. J. Atmos. Sci., 27, 894–900, https://doi.org/10.3878/j.issn.1006-9895.2003.05.10, 2003.
Chen, K., Cai, B., Han, W., and Suo, Z.: Matching of Observation Footprints in the FY-3G MWRI-RM Using BGI, IEEE J. Sel. Top. Appl. Earth Obs. Remote Sens., 17, 1–12, https://doi.org/10.1109/JSTARS.2024.3468437, 2024.
Du, J., Kimball, J. S., and Jones, L. A.: Satellite microwave retrieval of total precipitable water vapor and surface air temperature over land from AMSR2, IEEE Trans. Geosci. Remote Sens., 53, 2520–2531, https://doi.org/10.1109/TGRS.2014.2361344, 2015.
Duan, S.-B., Li, Z.-L., and Leng, P.: A framework for the retrieval of all-weather land surface temperature at a high spatial resolution from polar-orbiting thermal infrared and passive microwave data, Remote Sens. Environ., 195, 107–117, https://doi.org/10.1016/j.rse.2017.04.008, 2017.
Ebell, K., Orlandi, E., Hünerbein, A., Löhnert, U., and Crewell, S.: Combining ground-based with satellite-based measurements in the atmospheric state retrieval: Assessment of the information content, J. Geophys. Res.-Atmos., 118, 6940–6956, https://doi.org/10.1002/jgrd.50548, 2013.
Elfwing, S., Uchibe, E., and Doya, K.: Sigmoid-weighted linear units for neural network function approximation in reinforcement learning, Neural Netw., 108, 319–331, https://doi.org/10.1016/j.neunet.2017.12.012, 2018.
Gasiewski, A. J. and Johnson, J. T.: Statistical temperature profile retrievals in clear-air using passive 118-GHz O2 observations, IEEE Trans. Geosci. Remote Sens., 31, 106–115, https://doi.org/10.1109/36.210450, 1993.
Gasiewski, A. J. and Staelin, D. H.: Statistical precipitation cell parameter estimation using passive 118-GHz O2 observations, J. Geophys. Res., 94, 18367–18378, https://doi.org/10.1029/JD094iD15p18367, 1989.
Goldberg, M. D., Qu, Y., McMillin, L. M., Wolf, W., Zhou, L., and Divakarla, M.: AIRS near-real-time products and algorithms in support of operational numerical weather prediction, IEEE Trans. Geosci. Remote Sens., 41, 379–389, https://doi.org/10.1109/TGRS.2002.808307, 2003.
Gu, S., Zhang, P., Chen, L., Shang, J., Zhang, H., Lin, M., Zhu, A., Jia, S., Yin, H., Sun, F., Xu, H., Wang, H., Li, L., Wu, Q., Guo, Y., Dou, F., and Wu, S.: Overview and prospect of the detection capability of China's first precipitation measurement satellite FY-3G, Torrential Rain Disasters, 42, 489–498, https://doi.org/10.12406/byzh.2023-106, 2023.
He, K., Zhang, X., Ren, S., and Sun, J.: Deep residual learning for image recognition, in: 2016 IEEE Conference on Computer Vision and Pattern Recognition (CVPR), Las Vegas, NV, USA, 27–30 June 2016, 770–778, https://doi.org/10.1109/CVPR.2016.90, 2016.
He, Q. R., Wang, Z. Z., and He, J. Y.: Retrieval of clear sky temperature and humidity profiles over land using measurements of FY-3C/MWHTS, J. Remote Sens., 21, 27–39, https://doi.org/10.11834/jrs.20176006, 2017.
Hersbach, H., Bell, B., Berrisford, P., Biavati, G., Horányi, A., Muñoz Sabater, J., Nicolas, J., Peubey, C., Radu, R., Rozum, I., Schepers, D., Simmons, A., Soci, C., Dee, D., and Thépaut, J.-N.: ERA5 hourly data on pressure levels from 1940 to present, Copernicus Climate Change Service (C3S) Climate Data Store (CDS) [data set], https://doi.org/10.24381/cds.bd0915c6, 2023.
Li, Z. and Han, W.: Impact of Implementing All-Sky Radiance Assimilation for FY-3E MWHS-2 in the CMA-GFS, Mon. Weather Rev., 153, 847–863, https://doi.org/10.1175/MWR-D-24-0093.1, 2025.
Liu, Y., Mao, J., Liu, J., and Li, F.: Study on BP neural network retrieval method of atmospheric profile using ground-based microwave radiometer, Plateau Meteorology, 29, 1514–1523, 2010.
Pfreundschuh, S., Brown, P. J., Kummerow, C. D., Eriksson, P., and Norrestad, T.: GPROF-NN: a neural-network-based implementation of the Goddard Profiling Algorithm, Atmos. Meas. Tech., 15, 5033–5060, https://doi.org/10.5194/amt-15-5033-2022, 2022.
Rosenkranz, P. W.: Retrieval of temperature and moisture profiles from AMSU-A and AMSU-B measurements, IEEE Trans. Geosci. Remote Sens., 39, 2429–2435, https://doi.org/10.1109/36.964979, 2001.
Sahoo, S., Bosch-Lluis, X., Reising, S. C., and Vivekanandan, J.: Radiometric Information Content for Water Vapor and Temperature Profiling in Clear Skies Between 10 and 200 GHz, IEEE J. Sel. Top. Appl. Earth Obs. Remote Sens., 8, 859–871, https://doi.org/10.1109/JSTARS.2014.2364394, 2015.
Stähli, O., Murk, A., Kämpfer, N., Mätzler, C., and Eriksson, P.: Microwave radiometer to retrieve temperature profiles from the surface to the stratopause, Atmos. Meas. Tech., 6, 2477–2494, https://doi.org/10.5194/amt-6-2477-2013, 2013.
Susskind, J., Barnet, C. D., and Blaisdell, J. M.: Retrieval of atmospheric and surface parameters from AIRS/AMSU/HSB data in the presence of clouds, IEEE Trans. Geosci. Remote Sens., 41, 390–409, https://doi.org/10.1109/TGRS.2002.808236, 2003.
Tan, Q., Yao, Z., Zhao, Z., Han, Z., and Sun, X.: Performance analysis of atmospheric temperature and humidity profile retrieval using multiband microwave radiometer, Remote Sens. Technol. Appl., 30, 170–177, 2015.
Wang, D., Tong, L., Gong, X., Guan, X., Wang, P., and Gao, B.: Retrieval of atmospheric temperature profiles from hyperspectral microwave radiative data based on the neural network, in: Proceedings of the IEEE International Geoscience and Remote Sensing Symposium (IGARSS), Brussels, Belgium, 11–16 July 2021, 7095–7098, https://doi.org/10.1109/IGARSS47720.2021.9554282, 2021.
Wang, H., Liu, D., Xia, Y., Xie, W., and Wang, Y.: Retrieval of atmospheric temperature profile from historical data and ground-based observations by using a machine learning algorithm, Remote Sens., 15, 2717, https://doi.org/10.3390/rs15112717, 2023.
Wang, X., Song, G., Yao, Z., and Li, W.: Study on the retrieval of atmospheric humidity profiles over the northwestern Pacific Ocean using AMSU data, J. Peking Univ. (Nat. Sci. Ed.), 46, 69–78, https://doi.org/10.13209/j.0479-8023.2010.011, 2010.
Wang, Y., Fu, Y., Liu, G., Liu, Q., and Sun, L.: A new water vapor algorithm for TRMM Microwave Imager (TMI) measurements based on a log linear relationship, J. Geophys. Res., 114, D21304, https://doi.org/10.1029/2008JD011057, 2009.
Xia, X., Fu, D., Shao, W., Jiang, R., Wu, S., Zhang, P., Yang, D., and Xia, X.: Retrieving precipitable water vapor over land from satellite passive microwave radiometer measurements using automated machine learning, Geophys. Res. Lett., 50, e2023GL105197, https://doi.org/10.1029/2023GL105197, 2023.
Xiao, H., Han, W., Zhang, P., and Bai, Y.: Assimilation of data from the MWHS-II onboard the first early morning satellite FY-3E into the CMA global 4D-Var system, Meteorol. Appl., 30, e2133, https://doi.org/10.1002/met.2133, 2023.
Xu, X., Han, W., Gao, Z., Li, J., and Yin, R.: Retrieval of atmospheric temperature profiles from FY-4A/GIIRS hyperspectral data based on TPE-MLP: analysis of retrieval accuracy and influencing factors, Remote Sens., 16, 1976, https://doi.org/10.3390/rs16111976, 2024.
Yao, S. H. and Guan, L.: Retrieval of atmospheric temperature and humidity profiles using a machine learning algorithm based on satellite-borne infrared hyperspectral observations, Infrared Laser Eng., 51, 461–472, 2022.
Zhang, P., Gu, S., Shang, J., Zhang, H., Chen, L., Lin, M., Zhu, A., Jia, S., Wu, S., and Xian, D.: Overview of the mission of China's first precipitation satellite – FY-3G, Int. Space, 6, 17–21, 2023a.
Zhang, P., Gu, S., Chen, L., Shang, J., Lin, M., Zhu, A., Yin, H., Wu, Q., Shou, Y., Sun, F., Xu, H., Yang, G., Wang, H., Li, L., Zhang, H., Chen, S., and Lu, N.: FY-3G Satellite Instruments and Precipitation Products: First Report of China's Fengyun Rainfall Mission In-Orbit, J. Remote Sens., 3, 0097, https://doi.org/10.34133/remotesensing.0097, 2023b.