the Creative Commons Attribution 4.0 License.
the Creative Commons Attribution 4.0 License.
 | 01 Apr 2026
Fast and reproducible δ13C-CO2 analysis from 1 mL of ambient atmospheric air using continuous-flow IRMS: from sampling to storage to analysis
Marie-Laure Tiouchichine
Alexandru Milcu
Clément Piel
The stable carbon isotopic ratio (δ13C) of atmospheric carbon dioxide (CO2) is a key tracer for understanding terrestrial carbon dynamics, yet its application in volume-limited systems remains constrained by analytical and sampling requirements. Here, we present a methodology for high-precision δ13C-CO2 analysis of ambient atmospheric CO2 from 1 mL air samples, tailored to the challenges of growth chamber experiments using microcosm model systems and other volume-limited systems. Our approach combines simple vial conditioning, dual-sealing using a malleable self-adhesive butyl-rubber compound to minimise gas leakage, low-temperature storage (−80 °C), and cryogenic pre-concentration coupled to continuous-flow isotope-ratio mass spectrometry (IRMS). The workflow is rapid, low-cost, relies on widely available materials, and avoids laborious sample preparation steps (i.e. purification), enabling other laboratories to reproduce the method easily. Using this approach, a precision of ±0.1 ‰ was achieved under controlled conditions, no statistically detectable isotopic drift for storage durations up to 1-week when vials were kept under low-temperature condition inside zip-lock bags filled with dry CO2-free air. Longer storage times or storage at ambient temperature reduces both precision and accuracy, emphasising the importance of short-term storage at negative temperature. This methodology allows high sampling frequency δ13C-CO2 measurements on 1 mL samples, while minimally perturbing the sampled system and maintaining analytical performance under the tested conditions. It provides a practical solution for studies constrained by sample volume.
- Article
(1772 KB) - Full-text XML
- BibTeX
- EndNote


The stable carbon isotopic ratio (δ13C) of atmospheric CO2 is a widely used tool for tracing carbon sources and sinks, quantifying biogeochemical processes, and constraining global carbon cycle models (Bowling et al., 2008; Ciais et al., 2014; Farquhar et al., 1989). Because key processes such as photosynthesis and respiration fractionate carbon isotopes differently, isotopic measurements provide insights into the balance and dynamics of terrestrial carbon fluxes. These isotopic differences are essential for constraining global carbon cycle models and improving predictions of carbon–climate feedbacks (Tans et al., 1993).
Advances in isotope ratio mass spectrometry (IRMS) and automated gas handling systems have improved the efficiency, cost-effectiveness and accessibility of δ13C-CO2 analysis. Continuous-flow techniques and more stable and sensitive detectors allow rapid processing of large numbers of samples with high analytical precision (Brand, 1996; Fisher et al., 2006; West et al., 2006). These improvements have made stable isotope analysis more widely applicable in ecosystem and atmospheric sciences. However, most existing methods still require sample volumes of several millilitres (Tu et al., 2001), which limits their applicability in experiments where only small amounts of air can be collected or where repeated sampling from the same volume is required. The smaller the measured sample volume and the lower the CO2 mole fraction, the greater the influence of systematic analytical errors. For methods targeting sub-millilitre volume, it is therefore important to identify and minimise all factors contributing to bias or variability, even those that may be negligible at larger volumes.
Laser-based instruments have emerged as alternatives for in situ δ13C-CO2 analysis (Berryman et al., 2011; Steur et al., 2021; 2023, van Geldern et al., 2014). However, commercially available systems typically require 10 to 20 mL of sample to achieve sufficient sensitivity and precision. Simple dilution of smaller samples (e.g., 1 mL into 10–20 mL) is not always a viable solution because, although such instruments can in principle measure CO2 at tens of ppm, the loss of precision becomes substantial and changes in the gas matrix introduced by dilution can generate significant isotopic offsets. Thus, despite operational advantages, off the shelf, readily available laser-based approaches remain unsuitable for high-precision δ13C-CO2 analysis of sub-1 mL atmospheric air sample without substantial additional modifications (Bereiter et al., 2020).
These limitations are particularly evident in growth chamber experiments, where small model systems (e.g. microcosms with plants and soils) are incubated under tightly controlled conditions. One common method to disentangle CO2 sources is the Keeling plot approach, which estimates the isotopic signature of ecosystem respiration by relating δ13C-CO2 to the inverse of CO2 mole fraction during mixture between atmospheric and ecosystem reservoirs (Keeling, 1958; Pataki et al., 2003). The strength of such analyses relies on precision and temporal resolution of δ13C-CO2 measurements, which depend on capturing subtle isotopic variations in constrained headspace volumes, often under limits of sampling frequency and minimal system disturbance (Midwood and Millard, 2011; Pataki et al., 2003; Sperlich et al., 2022; Werner et al., 2006). In microcosm setups withdrawing large air volumes can disrupt experimental conditions or prevent repeated sampling (Gillespie et al., 2020; Guillot et al., 2019; Siegwart et al., 2023). Thus, methods are needed for methods capable of δ13C-CO2 analysis in very small air volumes (∼ 1 mL) at ambient CO2 mole fraction, while maintaining adequate precision, enabling minimally invasive, high-resolution sampling.
Existing methods for small CO2 volumes, often rely on repeated aliquot injections from large reservoir (1–5 L) (Brand et al., 2016; Rothe et al., 2005; Werner et al., 2001), or involve complex sample preparation (e.g., purification, tube-cracker devices) (Schmitt et al., 2011; Walker et al., 2021). Such approaches are incompatible with volume-limited experimental systems and are unsuitable for routine use. To address this, we developed an analytical workflow for measuring δ13C-CO2 of ambient atmospheric CO2 in 1 mL samples, using continuous-flow IRMS. The method uses commercially available equipment, simple and reproducible steps, low cost and widely available consumables, and short processing time. Cryogenic pre-concentration, adapted from small carbonate samples analysis (Fiebig et al., 2005), is optimised for ambient CO2 mole fraction. This setup reduces the required sample volume by an order of magnitude while achieving our target measurement precision of ±0.1 ‰ on δ13C-CO2.
In addition to small-volume challenges, storage prior to analysis can induce isotopic drift through diffusion, leakage, or physicochemical interactions with storage materials, especially over extended period. Such artefact have been documented for several isotopes, including 13C, 18O, 15N, and 2H (Hardie et al., 2010; Kuehfuss et al., 2014; Laughlin and Stevens, 2003; Mortazavi and Chanton, 2002; Nauer et al., 2021; Nelson, 2000; Paul and Skrzypek, 2006) often limiting analysis to hours after collection and reducing flexibility for collaborative or field-based studies.
While our protocol differs in implementation, it is built on similar underlying principles as Steur et al. (2023) for moisture removal and minimising gas leakage (i.e. rapid pre-conditioning with dry CO2-free air and reinforced sealing). Our choices focus on a workflow that is simple, rapid, and low-cost with basic, commercially available consumables, facilitating implementation in laboratories processing large samples numbers or working under logistical constraints. We specifically evaluated the influence of: (1) vial pre-conditioning, (2) septum configurations, (3) dual sealing layer, (4) storage temperature and (5) storage duration, allowing a preservation strategy that extends storage without compromising isotopic integrity.
This paper presents the integrated methodology – from sampling to storage to IRMS analysis – and demonstrate its application in controlled-chamber experiments as well as field contexts. We evaluate precision (closeness of agreement among repeated measurements performed under stable conditions calculated as the standard deviation of the replicates (Belouafa et al., 2017; Squara et al., 2020) and accuracy (closeness of the analytical results to the values of the secondary standard), and its relevance for high-frequency isotopic monitoring while discussing broader potential for carbon-cycle research.
Targeting a precision of ±0.1 ‰ for δ13C-CO2 is a pragmatic choice grounded in both scientific relevance and analytical feasibility. This level of precision is widely recognised in atmospheric and ecological/ecosystem studies as sufficient to resolve biologically meaningful variations, typically 0.3 ‰ to 1 ‰, associated with processes such as respiration or mixing in chamber and field conditions. It is coherent with the precision commonly achieved by continuous-flow IRMS systems using 10–12 mL sample volumes (Breecker et al., 2014; Giammanco et al., 2017; Joos et al., 2008; Leitner et al., 2023; Pataki et al., 2003; Tu et al., 2001). Achieving this same analytical threshold with only 1 mL of air, one order of magnitude less than standard protocols, offers a balance between measurement precision, sample size and operational simplicity, making the method particularly well suited to high-throughput or volume-limited experimental applications.
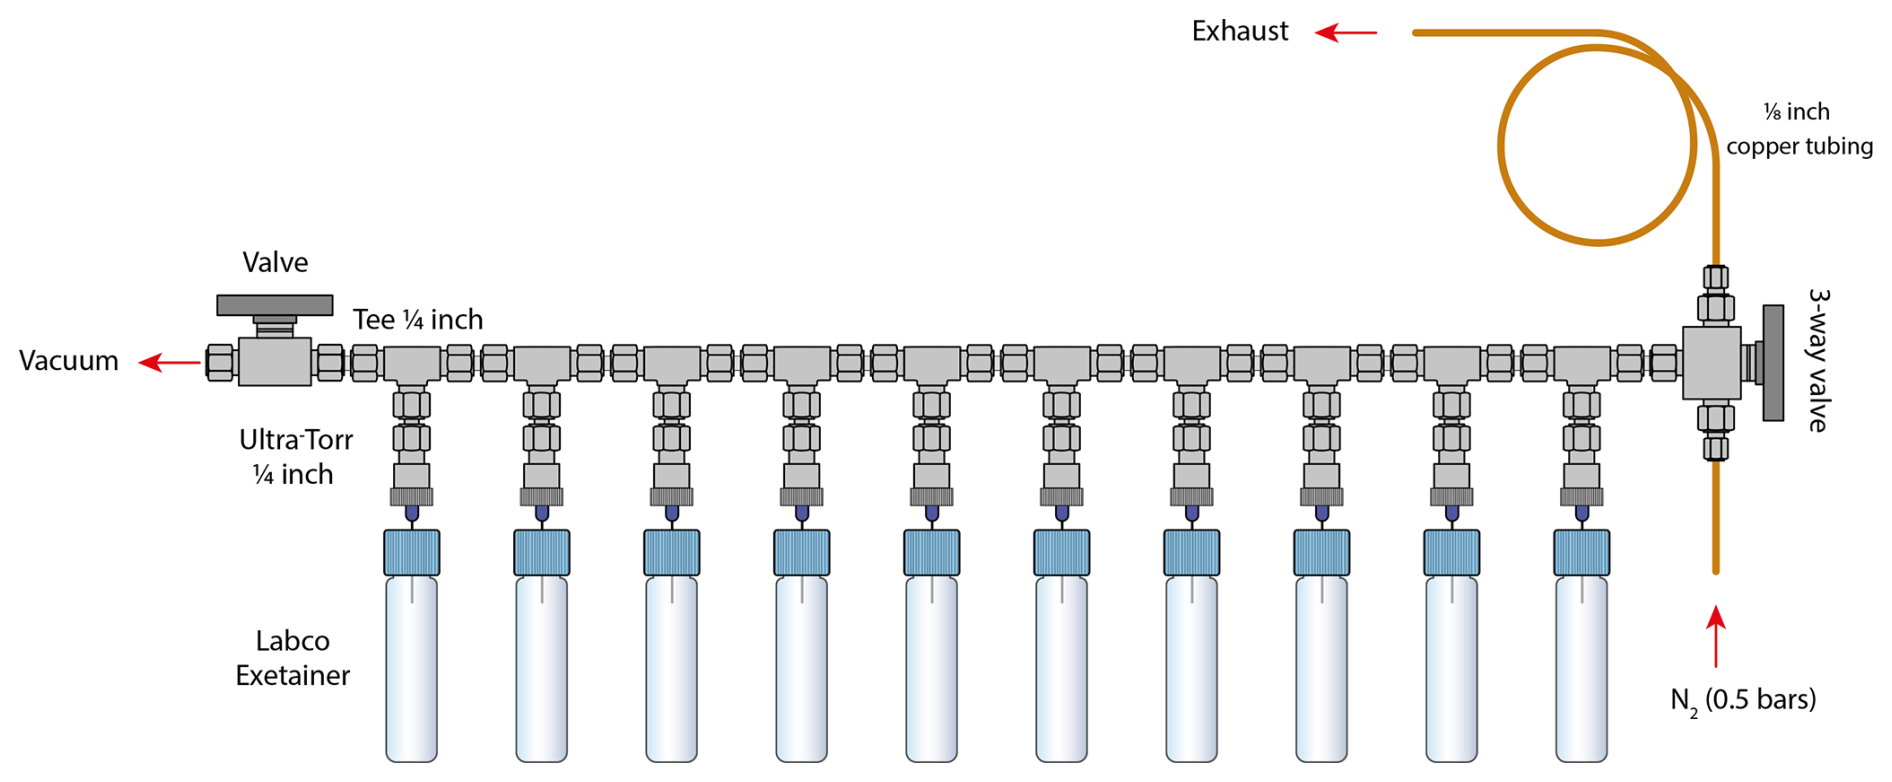
Figure 1Schematic of the vial conditioning manifold. For clarity only 10 vials positions are shown. The conditioning procedure includes: (1) vacuum of the vials to 0.02 mbar (∼ 8 min; two-way valve open, three-way valve closed), (2) filling with N2 gas at 0.5 bars with overpressure (∼ 20 s; two-way valve closed, three-way valve open to the bottom), and (3) restoration to atmospheric pressure (∼ 5 s; two-way valve closed, three-way valve open to the top). A -inch copper tube is connected to the exhaust outlet to minimise ambient CO2 from diffusing into the vials during pressure equilibration. Steps 1, 2 and 3 were repeated four times.
2.1 Vial conditioning: the basics
We used 5.9 mL flat bottom soda exetainers (Labco Limited, UK) with single chlorobutyl septum as sampling vials for CO2 analysis. After closing, the vials were conditioned on a custom-built manifold designed for trace-level CO2 sampling (Fig. 1). This manifold, constructed using Swagelok® fittings and valves (Swagelok Company, USA), consists of twelve interconnected -inch tees (SS-400-3), linked to two manual valves: a two-way valve (SS-43GS4) for vacuum control and a three-way valve (SS-43GXS4) for pressurised nitrogen supply and pressure equilibration. Luer needles (27G 3/4”, Terumo Agani, China) were inserted into Ultra-Torr® fittings (SS-4-UT-6-400), which were connected to each tee. Batches of 12 vials were evacuated simultaneously to a pressure of 0.02 mbar bar over 8 min (two-way valve open, three-way valve closed; Fig. 1), then filled with nitrogen gas (Alphagaz 1, Air Liquid, France) at 0.5 bars (above ambient pressure) for 20 s to establish a slight overpressure (two-way valve closed, three-way valve open to the bottom; Fig. 1). The use of nitrogen reduces the O2 mole fraction of the exetainer bellow ambient when the air sample is added, thus, minimising nitrous oxide production in the IRMS source, and therefore potential interference with CO2 measurements. Helium and argon were both tested but proved unsatisfactory: helium was avoided due to its high diffusivity through the septum during storage, while argon was considered impractical for routine use because of handling constraints and cost. The overpressurised vials were then vented for 5 s to restore atmospheric pressure (two-way valve closed, three-way valve open to the top; Fig. 1). This evacuation–refill cycle was repeated four times, ensuring near-complete removal of any residual CO2 or contaminants through geometric dilution, resulting in a reproducible CO2-free starting atmosphere. After the fourth cycle, the vials were equilibrated to ambient pressure and ready for gas sampling. A control set of vials (blanks) initially showed no detectable CO2 signal under standard analytical settings. To more rigorously evaluate blank integrity, we reprocessed the blank chromatograms using higher sensitive detection parameters – a minimum peak height of 5 mV and start/end thresholds of 1 mV s−1, well below the standard settings used in this study (50 mV peak height, 20 mV s−1 start, 40 mV s−1 end). Under these stringent conditions, small CO2 peaks (10–15 mV) were detected in approximately one-third of the blanks while no peak were detected in the remaining blanks. These detection thresholds are more conservative than those commonly applied in comparable atmospheric CO2 studies (e.g., Leitner et al., 2023), and the low-level background identified remains far below typical analytical detection limits. For reference, typical sample peaks reach amplitudes of ∼ 2 V (Fig. 2B), meaning that the maximum blank peak of 10–15 mV corresponds to a contribution of less than ∼ 1 % of the sample signal.
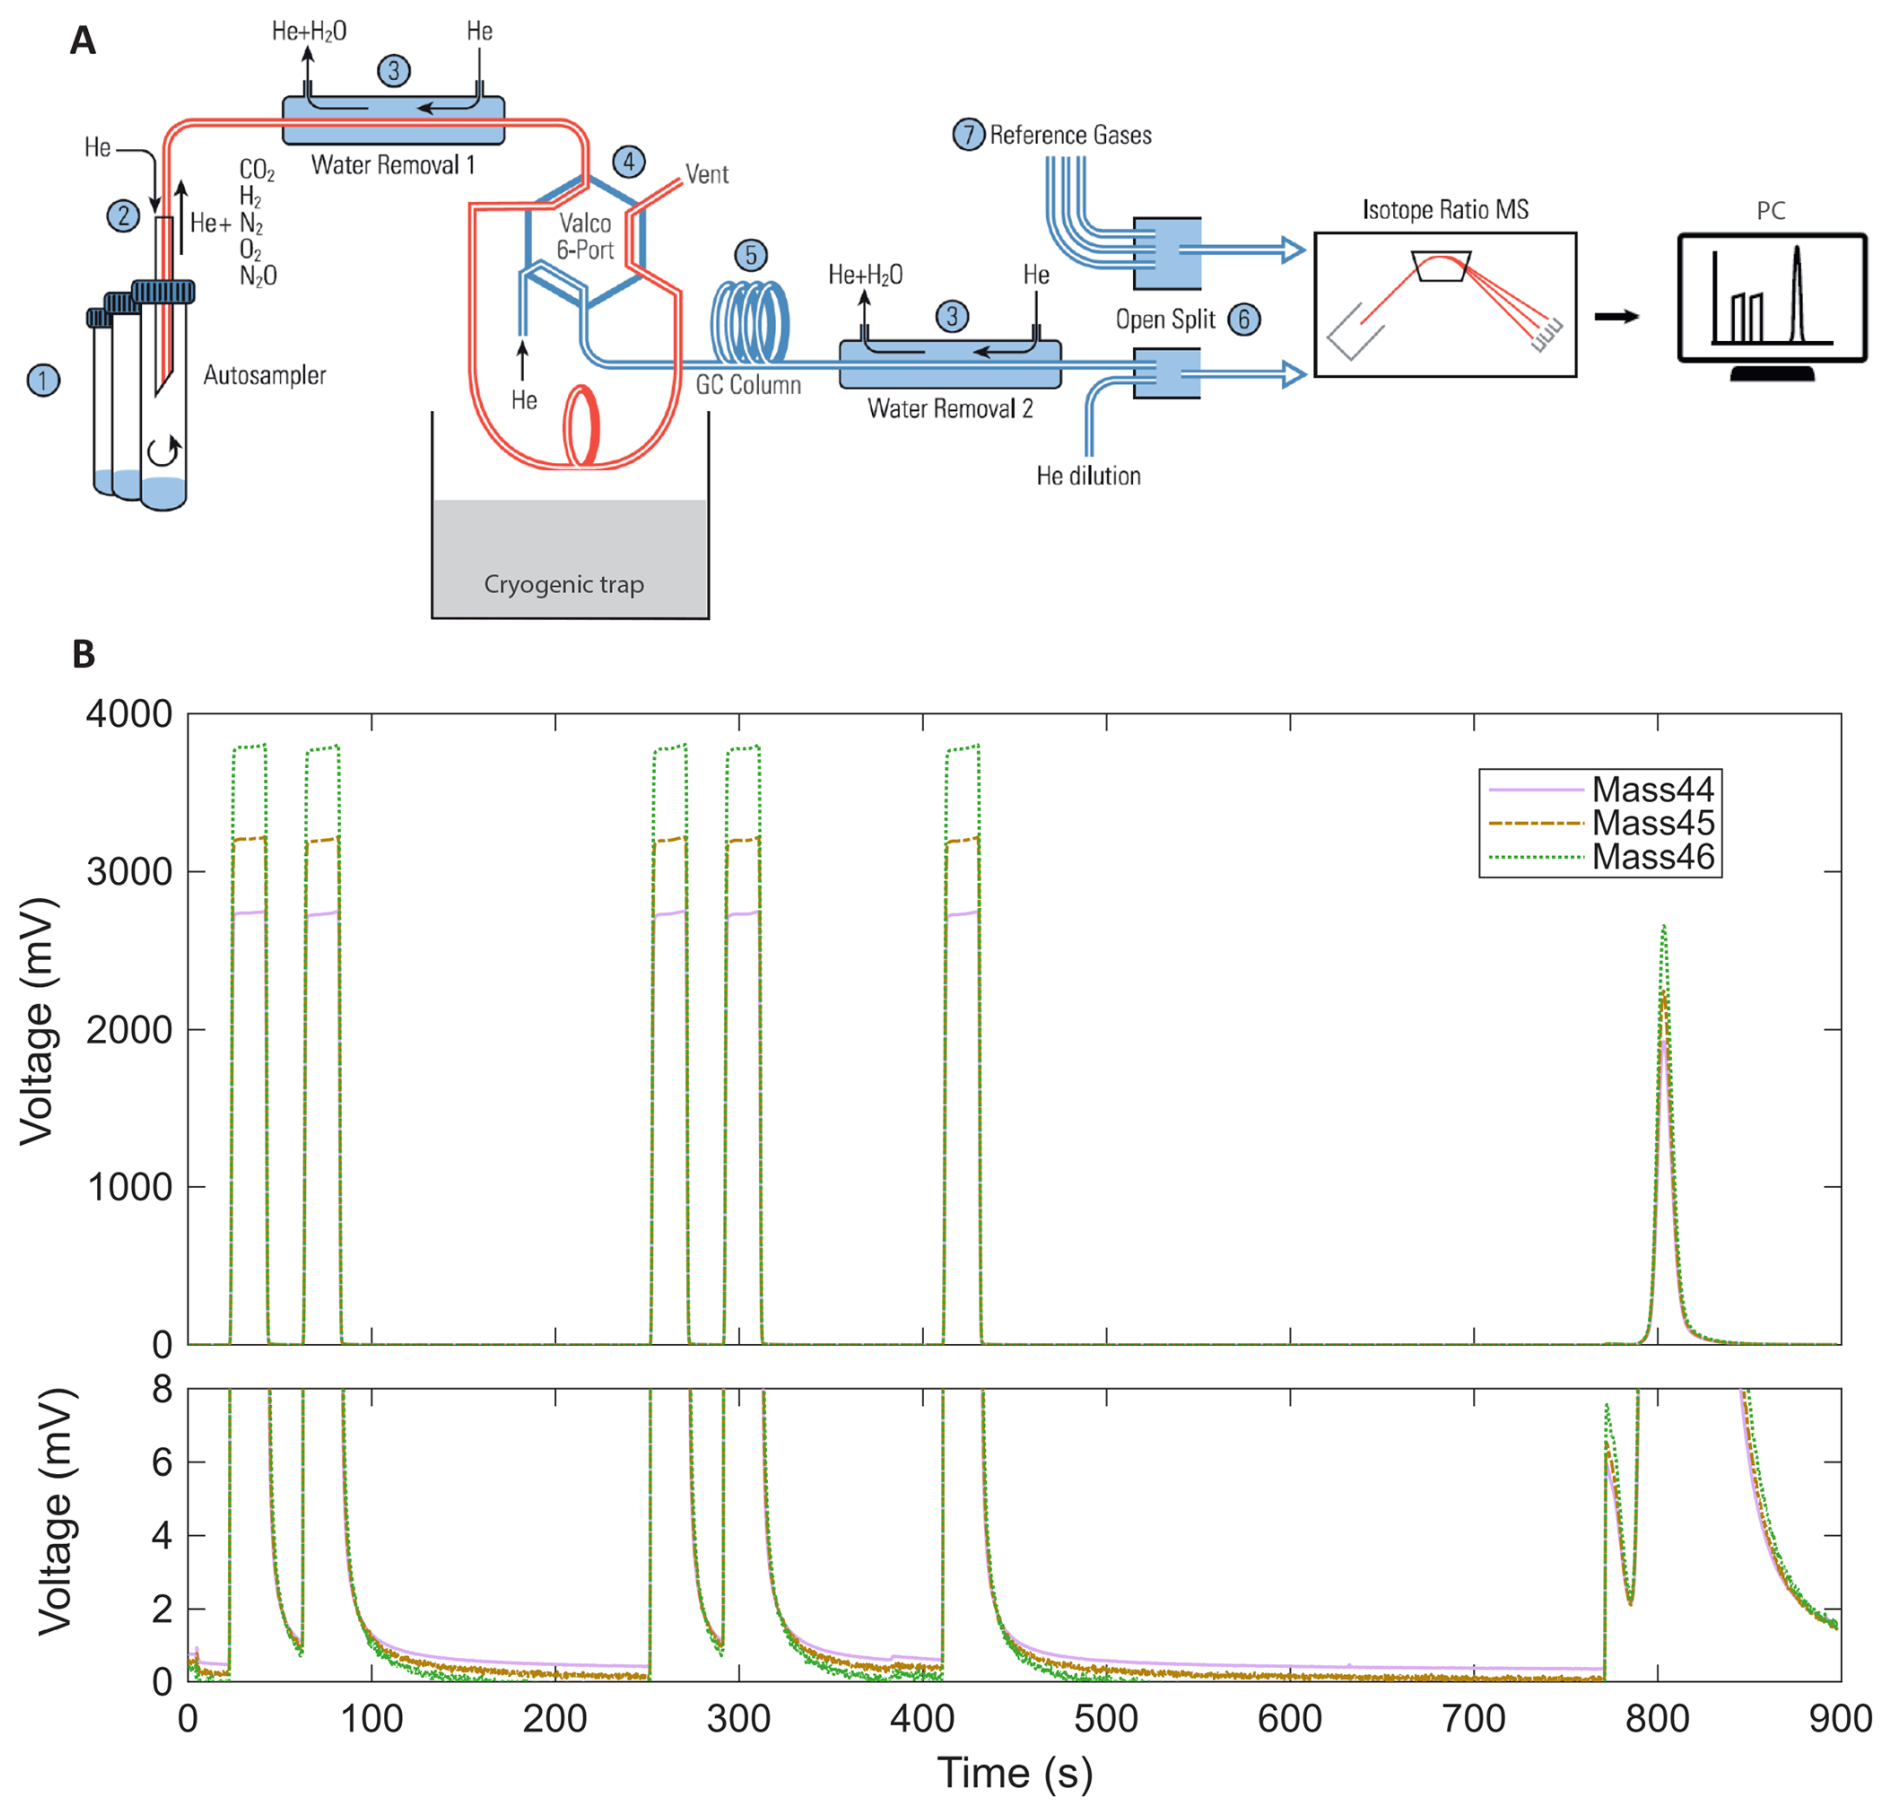
Figure 2(A) Schematic diagram of the analytical setup for δ13C-CO2 measurements adapted from Gas Bench II operating manual (Thermo Fisher Scientific, 2018) (1) sample vials loaded in the autosampler of the GasBench II; (2) injection of sample air into the helium carrier stream; (3) water-removal traps inside the GasBench; (4) 6-port Valco valve connected to the cryogenic trap; (5) separation on the GC column; (6) transfer to the ConFlo IV interface via an open-split with helium dilution; (7) introduction of reference gases through the ConFlo IV before isotope analysis by IRMS Delta V Plus. (B) Representative chromatogram obtained from the analysis of 1 mL of atmospheric air. Ion intensities for 44 (purple solid line), 45 (brown dot dash line), and 46 (green dotted line), corresponding to the different isotopologues of carbon dioxide are shown. The peaks observed between 0 and 450 s correspond to successive injections of a CO2 reference gas. The main peak around 800 s corresponds to the atmospheric air sample. A zoom of the baseline (lower panel) highlights signal stability and flat baseline conditions between injections, demonstrating chromatographic separation and measurement stability. The small peak observed shortly before 800 s likely corresponds to trace contaminants or residual gases eluting prior to CO2, which is sufficiently separated and won't impact the sample analysis.
2.2 Gas sampling
Gas sampling was done using a 1 mL syringe (Soft-Ject, Germany) equipped with a Luer needle 27G 3/4 (Terumo Agani, China). The syringe was first flushed three times with ambient air to remove any residual gases. It was then flushed 3 times with the targeted gas, by injecting and withdrawing it inside the container (chamber, flask or jar for example) without sampling or releasing, to avoid any contamination from prior samples. The syringe was then filled with a volume of air slightly exceeding the targeted volume (1 mL) before being withdrawn from the container. The volume in the syringe was carefully adjusted to 1 mL by expelling the excess air. The air sample was then injected through the septum to the target vial. Three sealing configurations were evaluated: (i) no additional sealing material (septum and cap only), (ii) application of a malleable self-adhesive butyl-rubber compound (Teroson® RB 81, Henkel, Germany), exhibiting excellent resistance to gas and moisture transfer, covering the entire surface of the septum and vial cap (hereafter referred to as simple sealing), and (iii) application of the same butyl-rubber compound both to the top of the cap and around its lower part, directly beneath the sealing ridge and near the threaded area (hereafter referred to as dual sealing). These configurations were tested to minimise potential gas leakage and associated isotopic drift. The butyl-rubber layer applied to the top of the septum was removed for injection and analysis and re-applied only during storage; thus, the syringe needle always penetrated only the septum.
2.3 Isotope analysis
The overall principle of the analytical setup is shown in Fig. 2A. Isotopic analyses of CO2 were performed using a continuous-flow isotope ratio mass spectrometer (IRMS; Delta V Plus, Thermo Fisher Scientific, USA) coupled to a Gas Bench II preparation system and a ConFlo IV. The analytical setup, included an automated cryogenic trap (a U shaped 1/16 stainless steel tube fixed to a pneumatically operated lifting unit and placed above a 2 L dewar of liquid nitrogen), initially designed for carbonate analysis (Fiebig et al., 2005), but adapted here for δ13C-CO2 measurements of atmospheric CO2 mole fraction in small air samples. The method (i.e. protocol refinements in sample handling and peak integration) was adjusted to analyse CO2 at atmospheric mole fraction (∼ 420 ppm), providing ∼ 0.2 µg C per run – an order of magnitude less carbon than in Fiebig et al. (2005), (1.2–3.6 µgC from carbonates). In our workflow, 1 mL of ambient air is added to a vial pre-filled with nitrogen, and the sample is subsequently transported to the IRMS by a helium carrier gas as described previously. This differs from Fiebig et al. (2005) who started with vials saturated in helium and containing CO2 generated from acid–carbonate reactions. Although helium acts as the carrier gas in both methods, our method directly measures the resulting mixed gas phase present in the nitrogen filled sample vial, that is, the combination of N2 and the sampled atmospheric air. Consequently, the full gas composition of the sample, including CO2, N2, O2, Ar, CH4, and N2O, is analysed without prior flushing or dilution in a nearly pure helium vial. The chromatographic conditions were accordingly modified, with the PoraPlot Q column operated at 35 °C instead of 70 °C to improve separation between CO2 and other sample components and to ensure stable retention times, while maintaining adequate peak definition for isotope ratio analysis.
The PAL autosampler initiated each run by moving the needle to the appropriate exetainer, which was then continuously flushed with helium, using a single flushing needle that is fixed to the PAL, to displace atmospheric gases. The automated protocol then began: the air sample was introduced into the Gas Bench II via an automated injection system, where water vapor was removed using a Nafion® membrane. Ten seconds after flushing, the cryogenic trap was lowered into liquid nitrogen, and 20 s later, the Valco valve switched to “load” mode for 360 s to allow CO2 to condense while non-condensable gases were flushed by the helium stream (Brand et al., 2010).
Simultaneously, five rectangular CO2 peaks were injected through the open split by the ConFlo IV for peak positioning and signal normalisation (Fig. 2B). These peaks were generated from compressed high-purity CO2 (≥99.998; N48, Air Liquide, France) supplied from a high-pressure cylinder equipped with an Air Liquide HBS 200-3-2.5 stainless steel two-stage pressure regulators. This CO2 gas was used solely as an internal reference signal and mediator within the analytical sequence and was not used for final isotopic value assignment. The δ13C-CO2 values were ultimately reported relative to the Vienna Pee Dee Belemnite (VPDB) scale using in-house calibrated working standards, as described later in this section. The fifth rectangular peak served as the reference for sample calibration within each run.
At 390 s, the Valco valve returned to “inject” mode, and after a 20 s delay, the stainless tube of the cryogenic trap was lifted out from liquid nitrogen, releasing the trapped CO2 into the helium carrier stream via sublimation. The gas then passed through a second Nafion® trap to remove residual water, followed by a gas chromatography column (PoraPlot Q, 25 m, 0.32 mm, 10 µm film, Agilent) held at 35 °C, which enabled separation of CO2 from gases such as O2, N2 and N2O, thereby ensuring stable ionisation conditions in the mass spectrometer. CO2 was finally introduced into the Delta V Plus via an open split in the ConFlo IV. The analysis also included a CO2 blanking procedure to correct for any background signal originating from the analytical system itself (Paul et al., 2007). This configuration produces a single, well-defined CO2 peak for isotopic analysis from each sample (Fig. 2B).
Memory effects were evaluated, where highly contrasting samples were analysed in a random order. Alternating injections of very high CO2 mole fractions (10 000–20 000 ppm) with highly enriched isotopic signatures (up to 3.5 AT %), followed by samples at atmospheric mole fraction (∼ 420 ppm) and depleted signatures (), did not produce any detectable carry-over (data not shown). These results indicate that memory effects are negligible under our analytical conditions and do not require additional correction.
The δ13C-CO2 values were reported relative to the Vienna Pee Dee Belemnite (VPDB) scale and calibrated using working standard gases. Three ambient air working standards (lately named WS1, 2 or 3; synthetic air mixtures supplied by Air Liquide (“mélange Crystal”), France) were routinely used for δ13C-CO2 calibration. These in-house standards contain CO2 (WS1 380 ±0.9 ppm, ; WS2: 450±0.85 ppm, ; WS3: 450±0.85 ppm, ), 20 % O2 and balance N2.
The working standards were calibrated in-house against two secondary reference gases (R1: 451±0.11 ppm, ; R2: 381.17±0.06 ppm, ) which were analysed and certified by the ICOS-RAMCES group from the Laboratoire des sciences du climat et de l'environnement (LSCE, Gif-sur-Yvette, France). At ICOS-RAMCES, CO2 mole fractions were measured by gas chromatography with a flame ionisation detector after methanisation, and calibrated against NOAA/CMDL primary standards, while isotopic compositions were determined using isotope ratio mass spectrometry (Finnigan MAT 252) traceable to international CO2 reference materials (PDB/VPDB). The absence of argon and the slightly lower O2 content in the synthetic air standards were not expected to significantly affect δ13C-CO2, as all calibrations and measurements were performed using IRMS and GC-based techniques rather than optical instruments, and samples and standards were analysed under identical conditions. All gases were supplied in high-pressure cylinders equipped with Air Liquide HBS 200-3-2.5 stainless steel two-stage pressure regulators to ensure stable outlet pressure and reduce the risk of fractionation. The isotopic range investigated in this study was restricted to values close to the working standards. We did not aim to span the full VPDB scale; consequently, no large-scale compression correction was required within this range.
Regular intercomparison of the working standards confirmed their stability over time, with no detectable drift beyond analytical precision. Three vials containing 1 mL of the same CO2 working standard (WS1 or WS2 or WS3) were analysed at the beginning and end of each daily run to monitor and correct for instrumental drift and to ensure analytical precision. Drift remained below 0.05 ‰ over the longest sequences (4–5 h) with no detectable time-dependent trend. Analysis time per sample was 17 min, and analytical precision of δ13C-CO2 was consistently lower or equal to ±0.1 ‰.
2.4 Statistical analyses
All statistical analyses and visualisations were performed using R software (R-4.4.2, R Core Team, 2024). To assess significant differences in δ13C-CO2 values between two sample groups, Welch's t-tests were applied when variances were unequal, while Student's t-tests were used when the assumption of equal variances held. For datasets involving more than two groups with unequal variances, a Welch's ANOVA was performed, followed by a Games–Howell post-hoc test to evaluate pairwise differences. Standard deviations were calculated for each group to evaluate the precision of the measurements. Impacts on accuracy were assessed by testing whether the mean δ13C-CO2 values differed significantly from the known values of the working standards, using a one-sample t-test.
3.1 Pre-conditioning flush with dry CO2-free air on vial
To minimise background contamination and reduce the risk of isotopic fractionation due to degassing, each vial was systematically flushed for 8 s with dry CO2-free air at a flow rate of 13.5 L min−1, corresponding to approximately 40 vial-volume renewals per second. This pre-conditioning step was performed manually by briefly removing and reinserting the septum cap while applying the continuous dry CO2-free air flow into the vial, in order to remove residual CO2 and stabilise internal pressure before subsequent conditioning. Flushing alone is not sufficient, however; the following four N2 evacuation–refill cycles are essential to completely remove remaining CO2 after vial closing.
To assess the actual impact of this flushing step, we conducted a comparative experiment using vials prepared either with or without this dry CO2-free air flush. In both cases, 1 mL of WS1 was introduced after conditioning (Sect. 2.1 and 2.2), and samples were immediately analysed by IRMS (Sect. 2.3). In the absence of the flushing step, precision is equal to 0.54 ‰ (largely higher than the targeted 0.1 ‰). In contrast, flushing prior to conditioning markedly improves both precision and accuracy, with precision down to ±0.09 ‰ and δ13C-CO2 values aligning even more closely with the nominal standard (Fig. 3).
A Welch's t-test comparing the means of the flushed versus non-flushed samples confirmed that the flushing step significantly improved precision (P-value =0.00056). One-sample t-tests against the nominal WS1 δ13C-CO2 value further showed that only the flushed samples were not statistically different with the standard, demonstrating that the flushing step is essential for achieving both high precision and accurate δ13C-CO2 measurements.
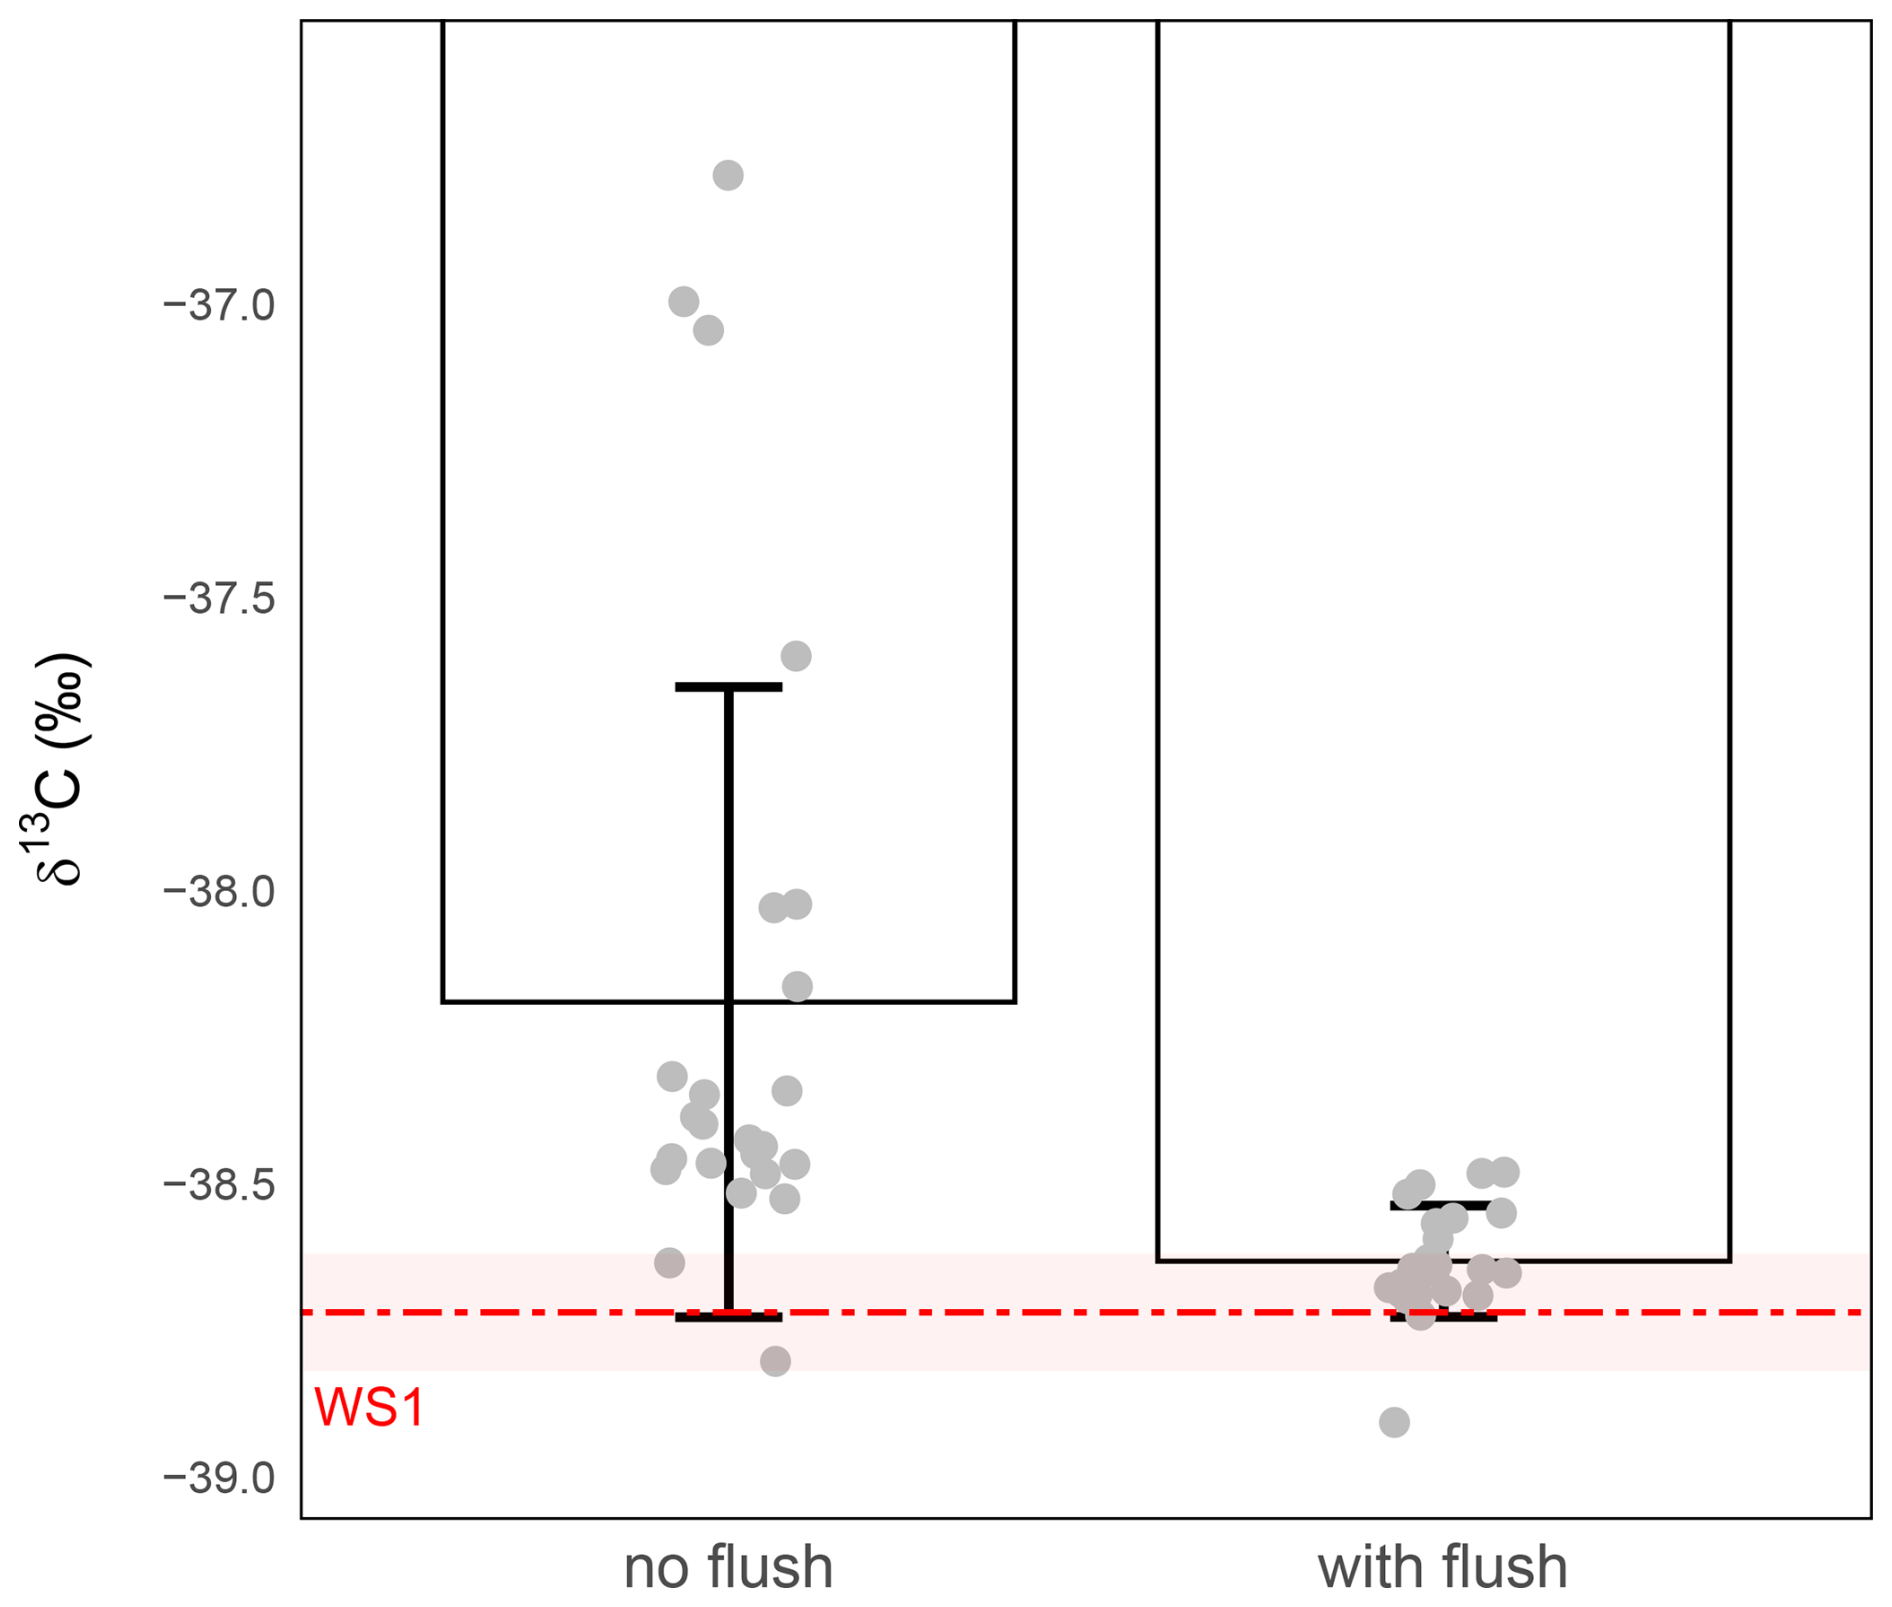
Figure 3Effect of the initial dry CO2-free air flush on δ13C-CO2 analysis in 1 mL gas samples. δ13C-CO2 values (‰) were measured from vials conditioned either without a flushing step (left) or with an 8 s dry CO2-free air flush (right) prior to gas introduction. The red dashed line indicates the expected isotopic value of WS1 and the shaded red band the measurement precision of WS1 (). Grey circles represent individual replicate measurements. Bars show the mean ± standard deviation for each condition. Without flushing, the measured precision was ±0.54 ‰ (n=24), whereas with flushing it was ±0.09 ‰ (n=23).
3.2 Analytical performance of 1 mL ambient atmospheric air samples
A typical chromatogram produced by the method is shown in Fig. 2B. This chromatogram exhibits a single well-defined CO2 peak with sharp Gaussian symmetry and excellent signal-to-noise ratio. The retention time remains stable across replicate injections, indicating consistent flow dynamics and thermal stability of the GC column. Baseline separation is maintained, with no detectable co-elution or interfering species in the target acquisition window. Peak integration was performed within fixed boundaries, and total CO2 signal area was sufficient to ensure accurate δ13C-CO2 calculation despite the low analyte mass (amplitude from 2 to 2.5 V). Across a series of replicate measurements (n=24), performed on independently prepared vials (no storage, dry CO2-free air flush), the analytical precision was consistently equal to ±0.10 ‰.
In situations where CO2 mole fraction largely exceed atmospheric levels – such as in soil incubations where soil respiration leads to accumulation of CO2 in the air space, experiments involving 13C-labelled glucose additions or microbial incubations – the same analytical protocol can be applied to sample volumes as low as 50 µL CO2 without compromising precision (Siegwart et al., 2023). The enhanced signal associated with elevated CO2 mole fraction ensures that even these small volumes generate chromatograms with sufficient peak intensity and resolution for accurate isotopic analysis.
3.3 Effect of septum configuration on short-term storage stability
To assess the impact of septum configuration on the preservation of isotopic integrity during short-term storage, we compared vials sealed with a single septum to those fitted with a double septum (Labco Limited, UK; Sect. 2.1) without any additional sealing material. In both cases, 1 mL of WS1 was injected into the vials (Sect. 2.2), which were then stored for 24 h at room temperature. Isotopic analyses (Sect. 2.3) revealed no statistically significant difference between the two configurations (t-test, p>0.05, assuming equal variances; Fig. 4). In both cases, the precision was larger than 0.1 ‰ (±0.20 ‰ for simple septum vs ±0.16 ‰ for double septum), and the measured δ13C-CO2 values were systematically offset by approximately +1 ‰ relative to the nominal WS1 standard, indicating both isotopic drift and poor accuracy during storage at room temperature.
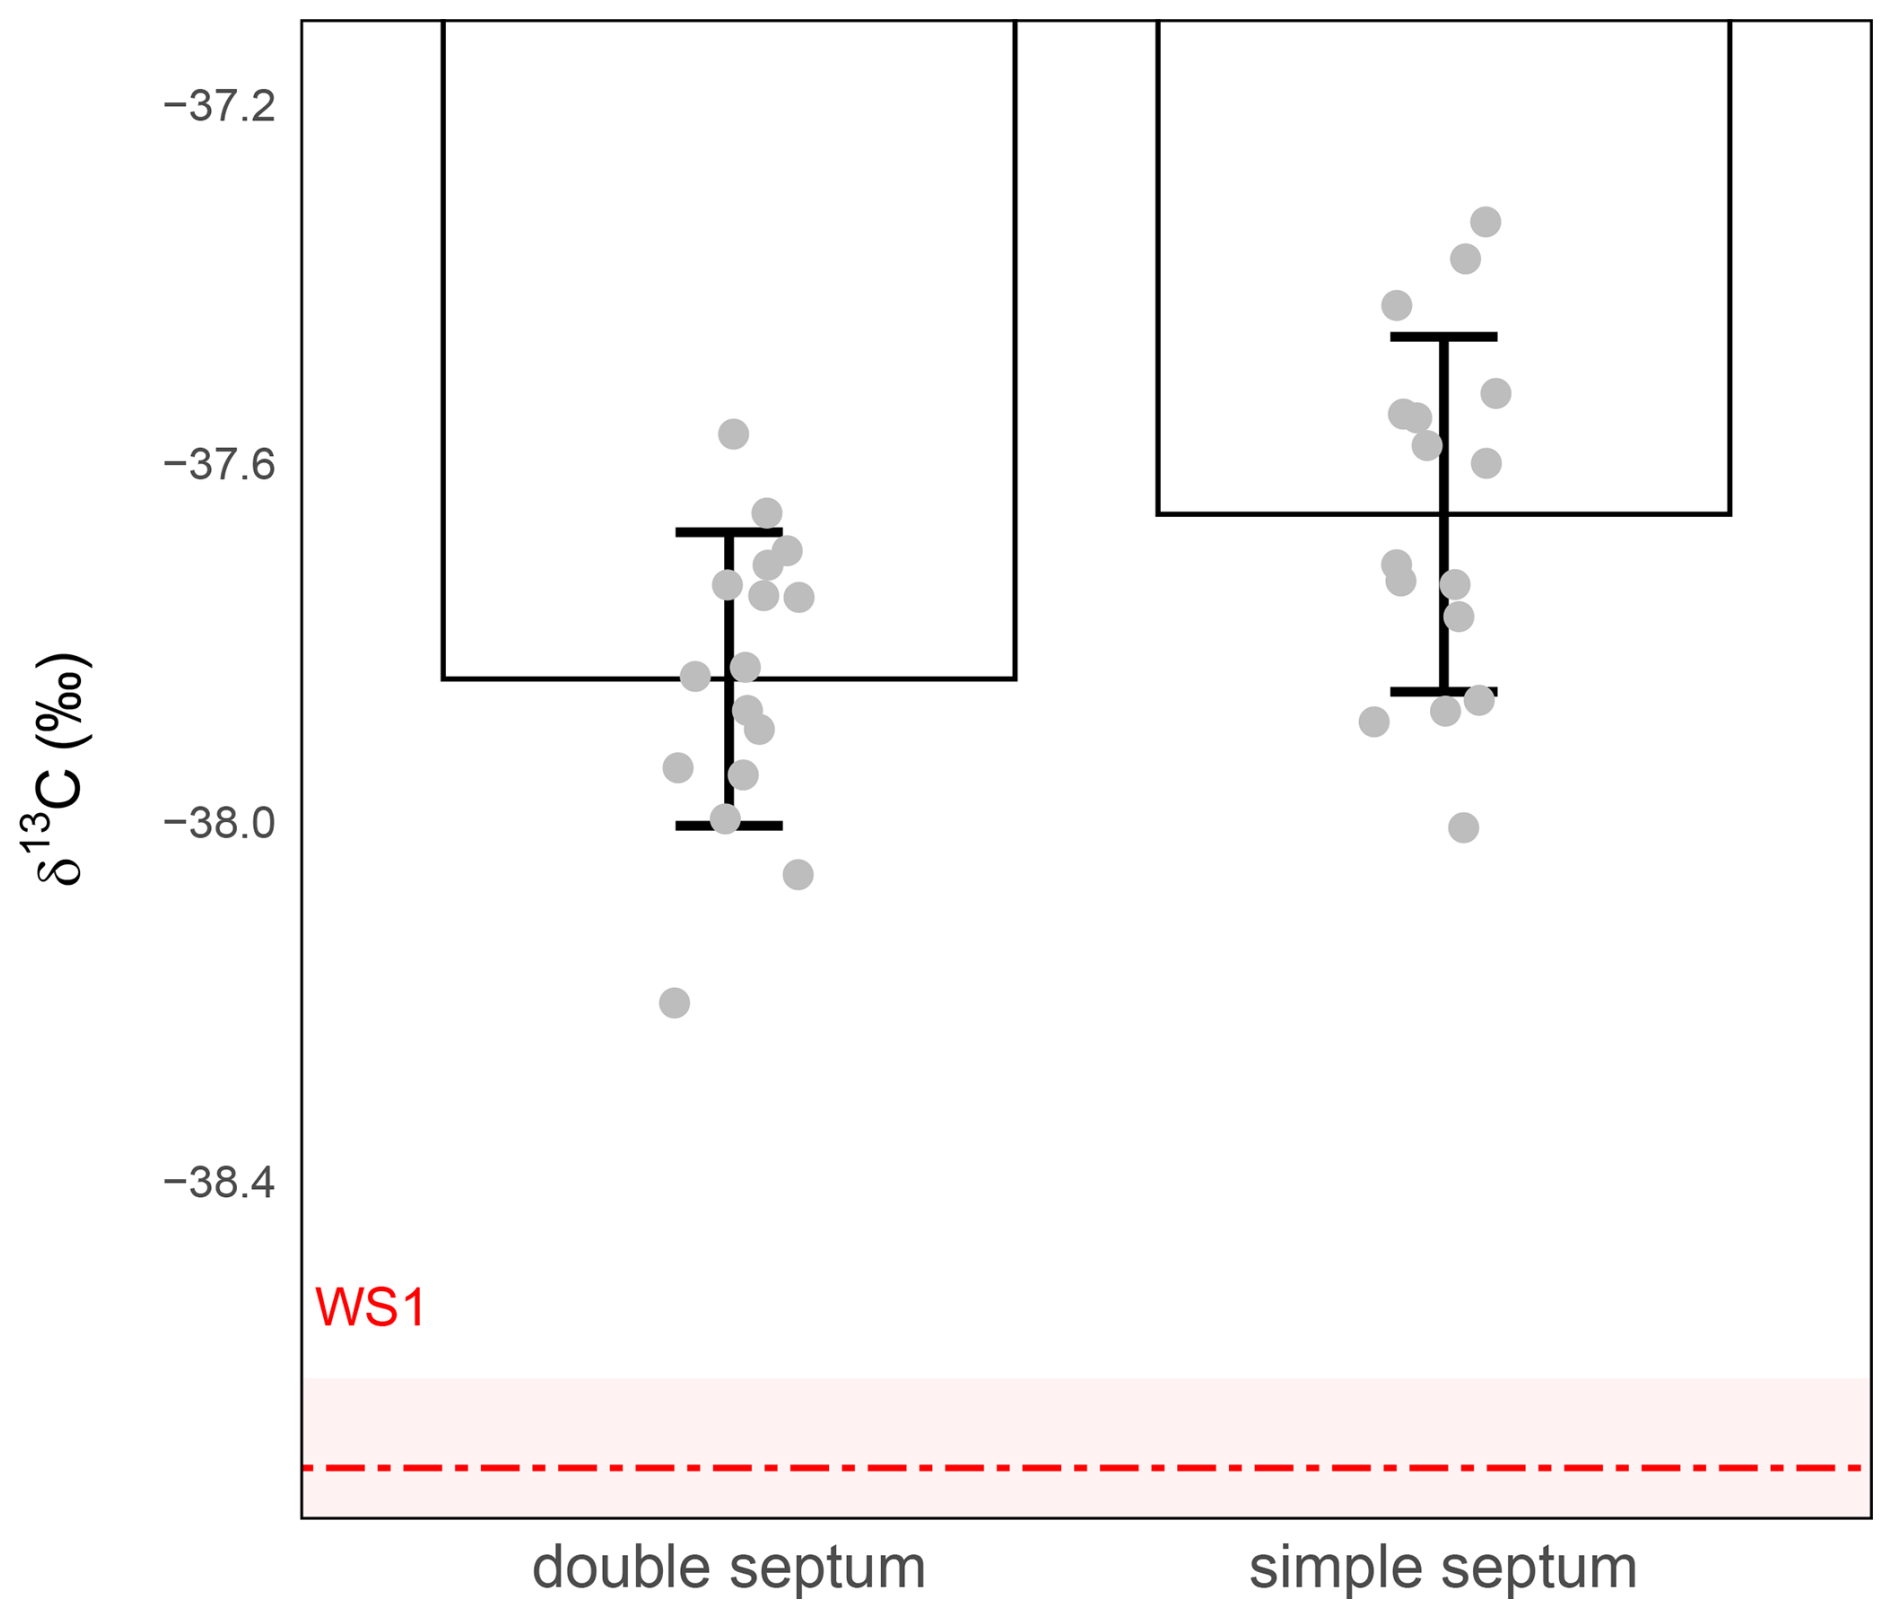
Figure 4Effect of septum configuration on δ13C-CO2 stability during 24 h storage at ambient temperature. δ13C-CO2 values (‰) were measured from 1 mL WS1 in vials sealed with either a single septum (right) or a double septum (left). The red dashed line represents the expected isotopic value of WS1 and the shaded red band the measurement precision of WS1 (). Grey circles represent individual replicate measurements. Bars show the mean ± standard deviation for each condition. Precision was ±0.16 ‰ for the double septum (n=16) and ±0.20 ‰ for the simple septum (n=16).
Although the double septum offered slightly better precision, it did not correct the systematic offset observed in samples stored at room temperature and comes at a higher price. For these reasons, and in the absence of any significant benefit for both accuracy and precision, the single septum configuration was retained for subsequent analyses. These results suggest that the septum configuration was not the cause of the 1 ‰ isotopic shifts. Additional sealing and sample preservation strategies must therefore be explored to improve the stability of small-volume air samples.
3.4 Effect of dual-sealing on short-term storage performance
To further improve sample integrity during storage, we evaluated the effect of applying the butyl-rubber compound either only to the top of the caps, covering the septum (i.e. simple sealing) or both to the top of the cap and around its lower part, directly beneath the sealing ridge and near the thread area (i.e. dual sealing). Both sealing methods aim to reduce the risk of gas leakage, diffusion and associated isotopic drift, particularly over longer storage periods. As in previous tests, 1 mL of WS3 was injected into each vial (Sect. 2.1 and 2.2), which was then stored for 24 h at room temperature. Although dual sealing noticeably improved precision – reducing the standard deviation from ≥0.22 ‰ under simple sealing to ≤0.11 ‰ with dual sealing – and partly limited the magnitude of the δ13C-CO2 shift, both configurations still exhibited a clear loss of accuracy during storage at room temperature. Mean δ13C-CO2 values remained significantly shift relative to the nominal WS3 value (Fig. 5).
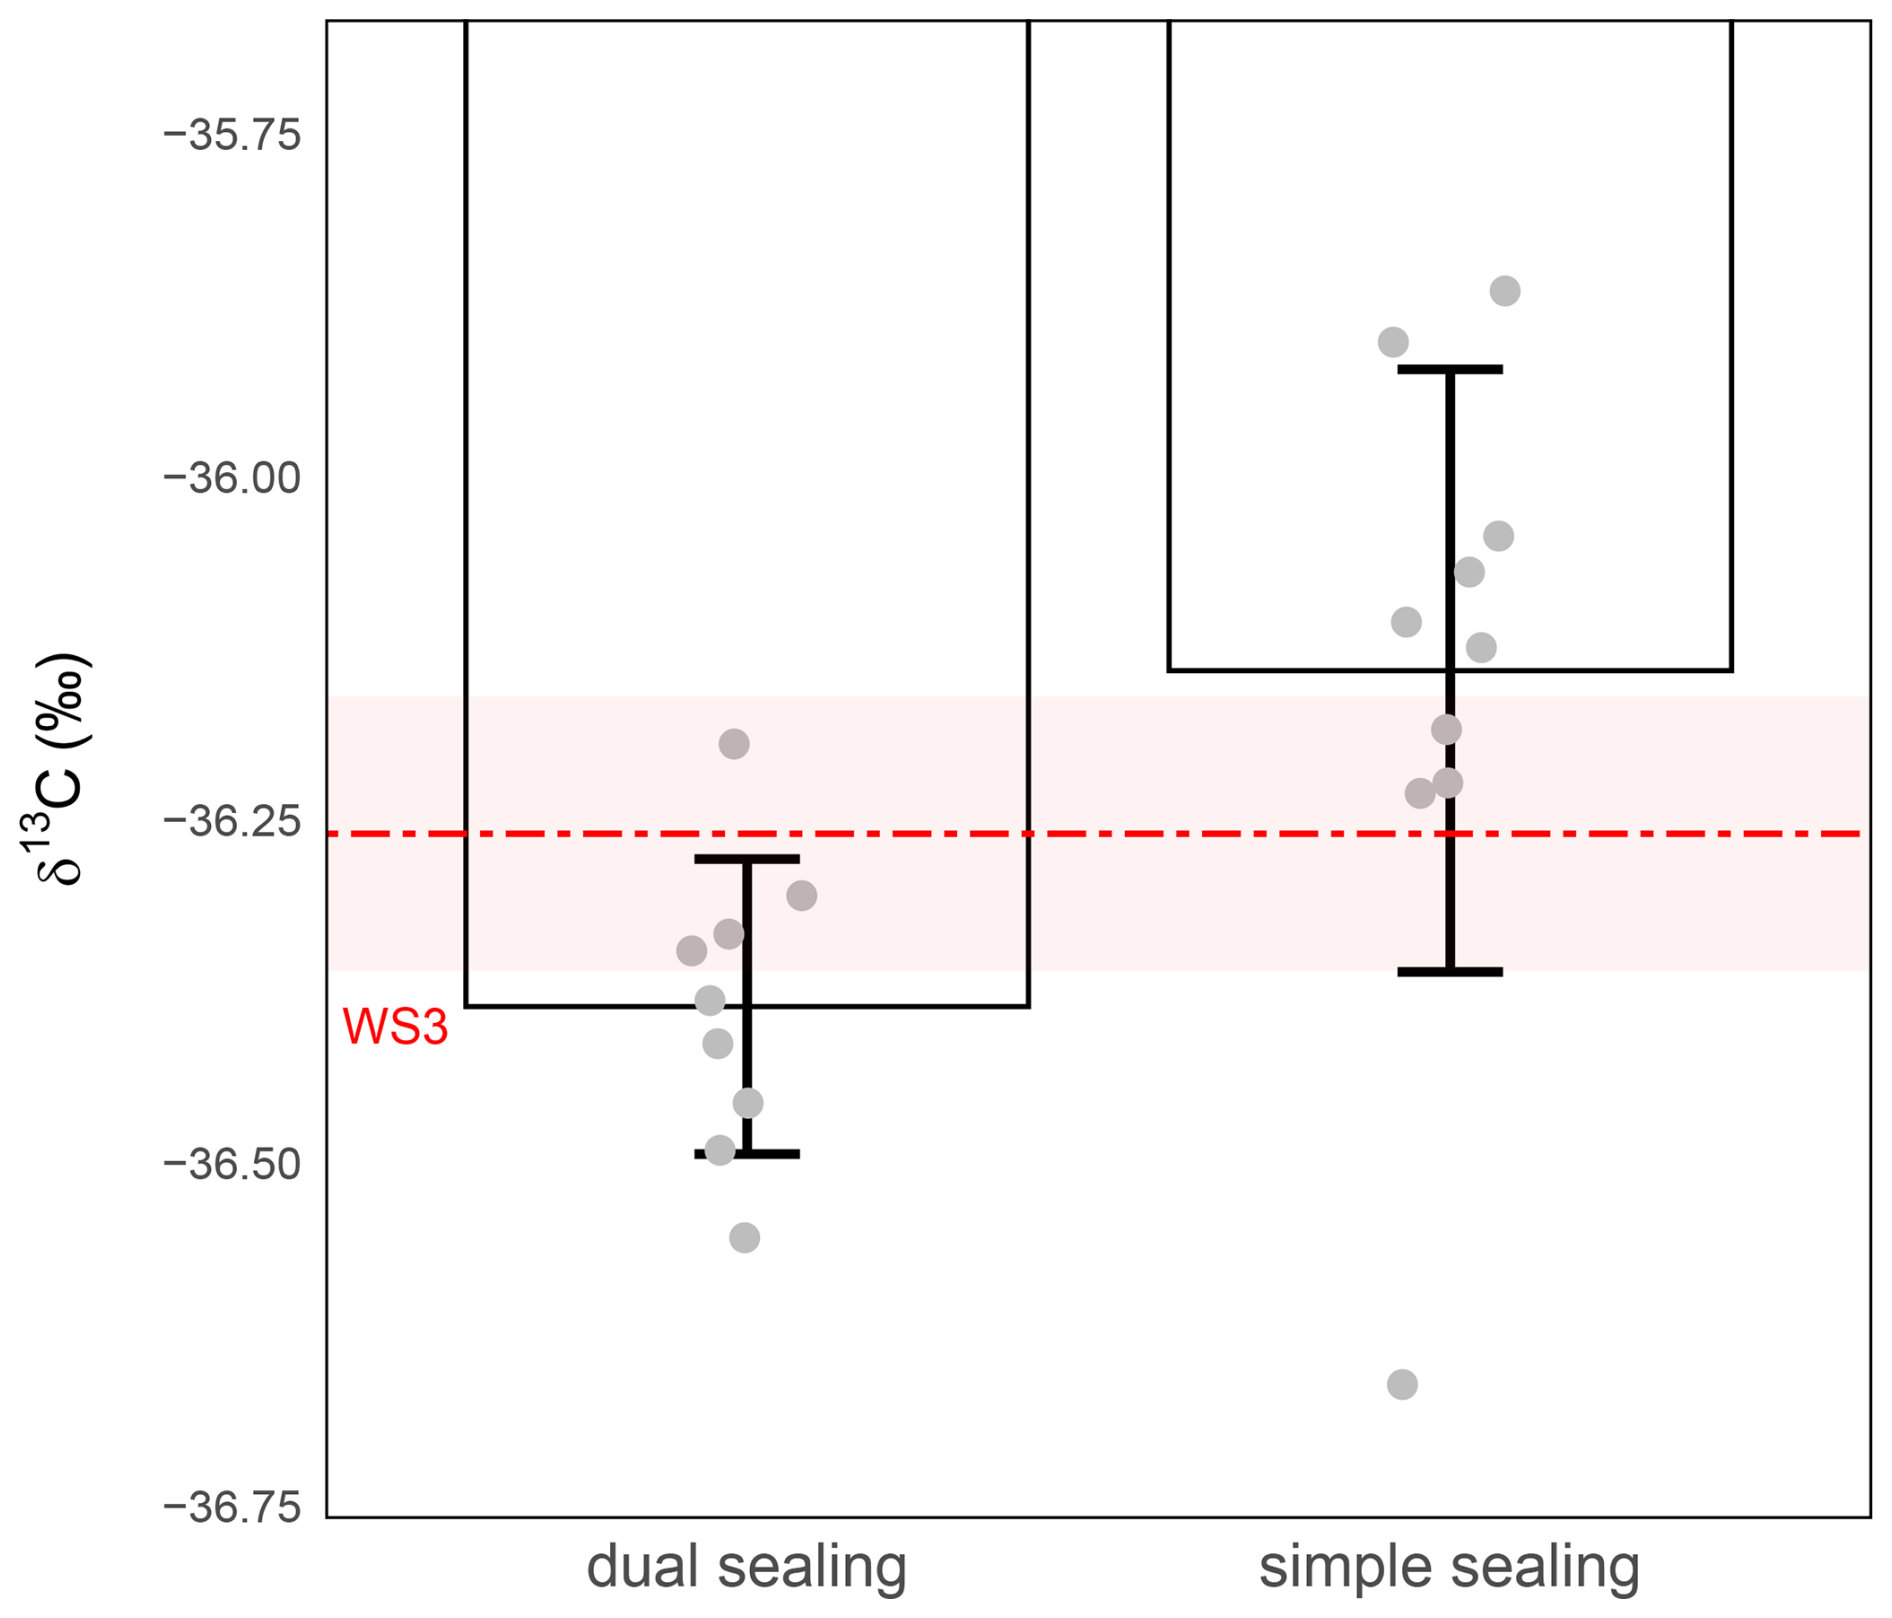
Figure 5Effect of sealing improvement on δ13C-CO2 stability during 24 h storage at ambient temperature. δ13C-CO2 values (‰) were measured from 1 mL WS3 in vials with simple- (right) or dual-sealing (left). The red dashed line represents the expected isotopic value of WS3 and the shaded red band the measurement precision of WS3 (). Grey circles represent individual replicate measurements. Bars show the mean ± standard deviation for each condition. Precision was ±0.22 ‰ with simple sealing (n=10) and ±0.11 ‰ with dual-sealing (n=9).
Welch's t-tests (unequal variances) confirmed that the difference in mean δ13C-CO2 values between the two conditions was statistically significant (P-value =0.00776) indicating improved precision under dual sealing. However, the difference between WS3 nominal value and δ13C-CO2 suggests some depreciation of accuracy under storage at room temperature. Nevertheless, although this dual-sealing method improves performance, the analytical precision of δ13C-CO2 remained above the target threshold of ±0.1 ‰, indicating that additional measures – such as temperature control or more robust sealing systems – may be necessary to achieve optimal storage stability.
3.5 Influence of storage temperature on isotopic signal stability of small-volume air
To assess whether the target precision of ±0.1 ‰ for δ13C-CO2 measurements could be achieved on 1 mL air stored samples, we investigated the effect of storage temperature on isotopic stability (Kornfeld et al., 2012). Vials were flushed with CO2-free air, dual-sealed with butyl-rubber compound, filled with 1 mL of WS2, and stored for 24 h under three different conditions: room temperature (∼ 20 °C), −20, and −80 °C. To minimise the risk of contamination, the vials were placed in sealed zip-lock bags filled with dry CO2-free air ensuring that any potential ingress would not introduce isotopically enriched CO2.
The results reveal a strong temperature dependence in both precision and accuracy (Fig. 6). At room temperature, δ13C-CO2 values showed substantial isotopic drift, being enriched by nearly +1 ‰ relative to WS2, with a dispersion far exceeding the 0.1 ‰ target (precision ±0.50 ‰). Storage at −20 and −80 °C both removed this systematic bias, restoring accuracy relative to nominal WS2 value. For −80 °C storage, mean δ13C values exhibited a very slight positive offset relative to their respective working-standard targets. However, as this offset remains within the margin of the combined analytical precision for both standards and samples, the measured values are sufficiently robust for comparative analysis, where the relative trends are the primary focus rather than absolute accuracy. However, at −20 °C the precision remained above the target (±0.24 ‰), while, in sharp contrast, storage at −80 °C maintained isotopic values integrity, reducing precision to ±0.10 ‰ and thus meeting the required analytical precision.
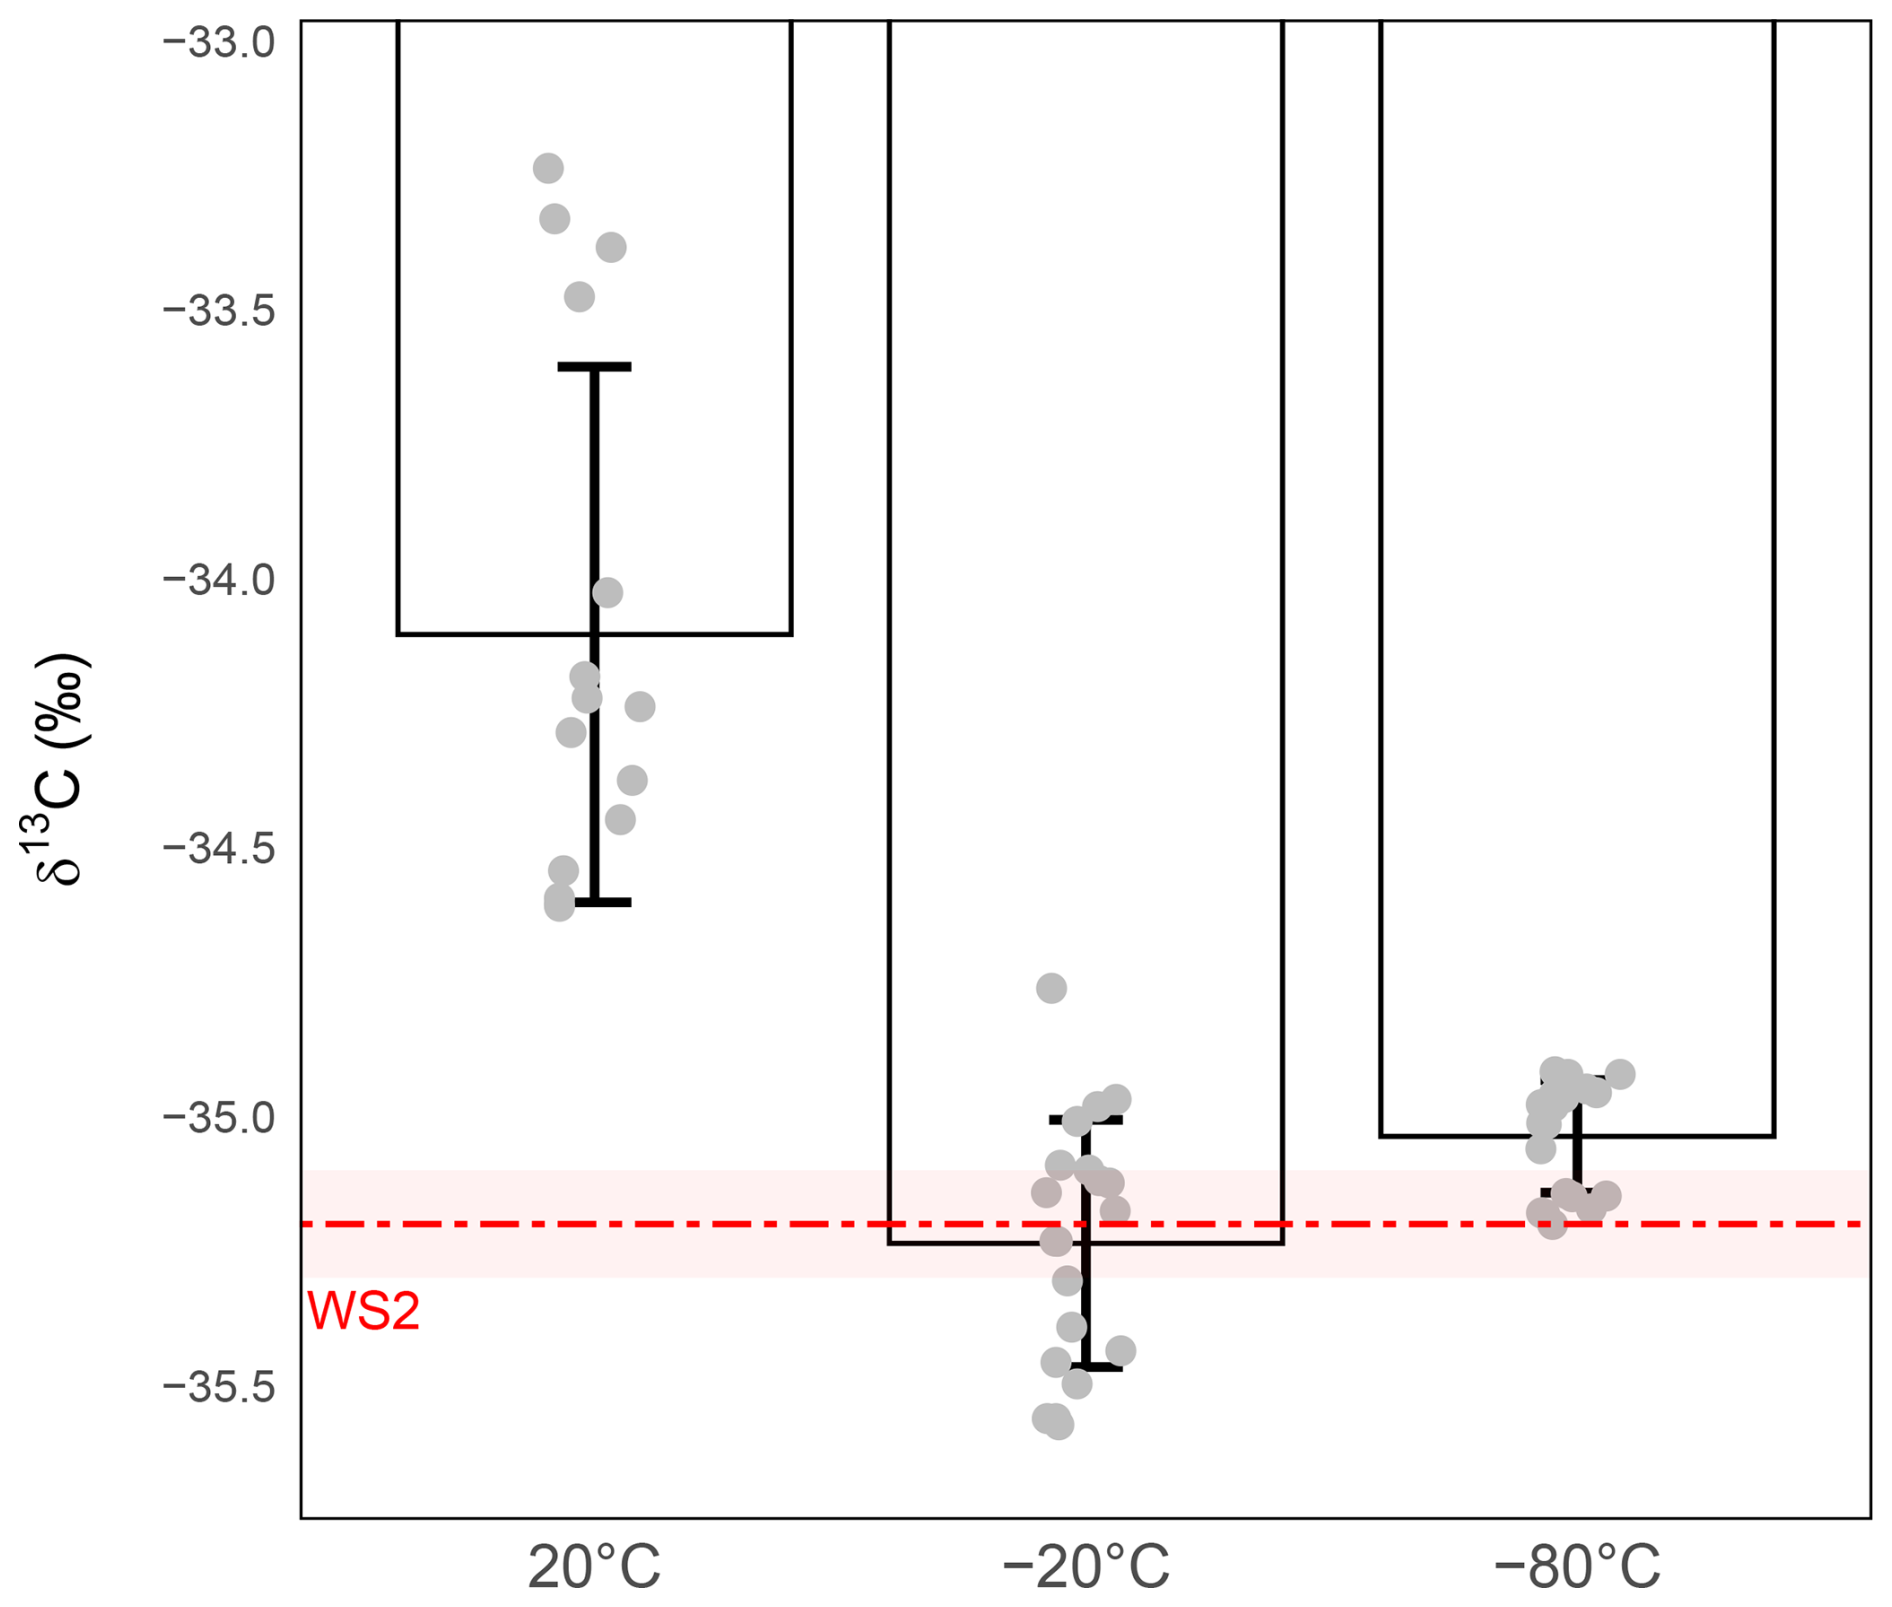
Figure 6Effect of storage temperature on δ13C-CO2 stability during 24 h storage at ambient temperature (left), −20 °C (middle), −80 °C (right). δ13C-CO2 values (‰) were measured from 1 mL WS2. The red dashed line represents the expected isotopic value of WS2 and the shaded red band the measurement precision of WS2 (). Grey circles represent individual replicate measurements. Bars show the mean ± standard deviation for each condition. Precision was ±0.50 ‰ for sample stored at room temperature (n=15), ±0.24 ‰ for sample stored at −20 °C (n=20) and ±0.10 ‰ for sample stored at −80 °C (n=20).
To verify that contamination or leakage did not bias the results at low CO2 levels, a control set of empty vials (flushed, dual-sealed and conditioned but not filled with WS) was stored at −80 °C and analysed using the more sensitive peak-detection settings described in Sect. 2.1. Similarly, under these stringent conditions, small peaks of 10–15 mV were detected in approximately one-third of the blanks, exhibiting trace-level background far below the CO2 signal of real samples. These results confirm both the integrity of the sealing protocol and the absence of significant contamination during storage at −80 °C. Possible mixing effects associated with this background signal are addressed and discussed later (Sect. 4.1).
Based on this finding, a key remaining question concerns the maximum duration over which samples can be stored at −80 °C without significant isotopic drift.
3.6 Effect of storage duration at −80 °C on isotopic stability
To determine the maximum duration over which small-volume air samples can be stored at −80 °C, without compromising isotopic signal, we analysed vials containing 1 mL of WS2 and WS3 stored for 1, 2 and 4 weeks. All samples were flushed with dry CO2-free air and dual-sealing was applied prior to be stored at −80 °C in zip-lock bags full of dry CO2-free air.
The results showed that after 1 week of storage, both precision and accuracy remained within acceptable limits, with precision at or below ±0.1 ‰ (±0.10 ‰ and ±0.09 ‰; Fig. 7). Mean δ13C values exhibited a very slight positive offset relative to their respective working-standard targets. However, as this offset remains within the margin of the combined analytical precision for both standards and samples, the measured values are sufficiently robust for comparative analysis, where the relative trends are the primary focus rather than absolute accuracy. After 2 weeks, the same small offset persisted, but precision deteriorated, with one sample set remained within the ±0.1 ‰ threshold (±0.09 ‰), while the other exceeded it (±0.13 ‰). By 4 weeks, the mean δ13C values still remained close to their nominal targets, but sample-to-sample variability strongly increased, with precision up to 0.3 ‰. This indicates that although the average value is preserved, the precision is compromised, highlighting that storage beyond 2 weeks at these conditions is not recommended for high-precision applications (Fig. 7).
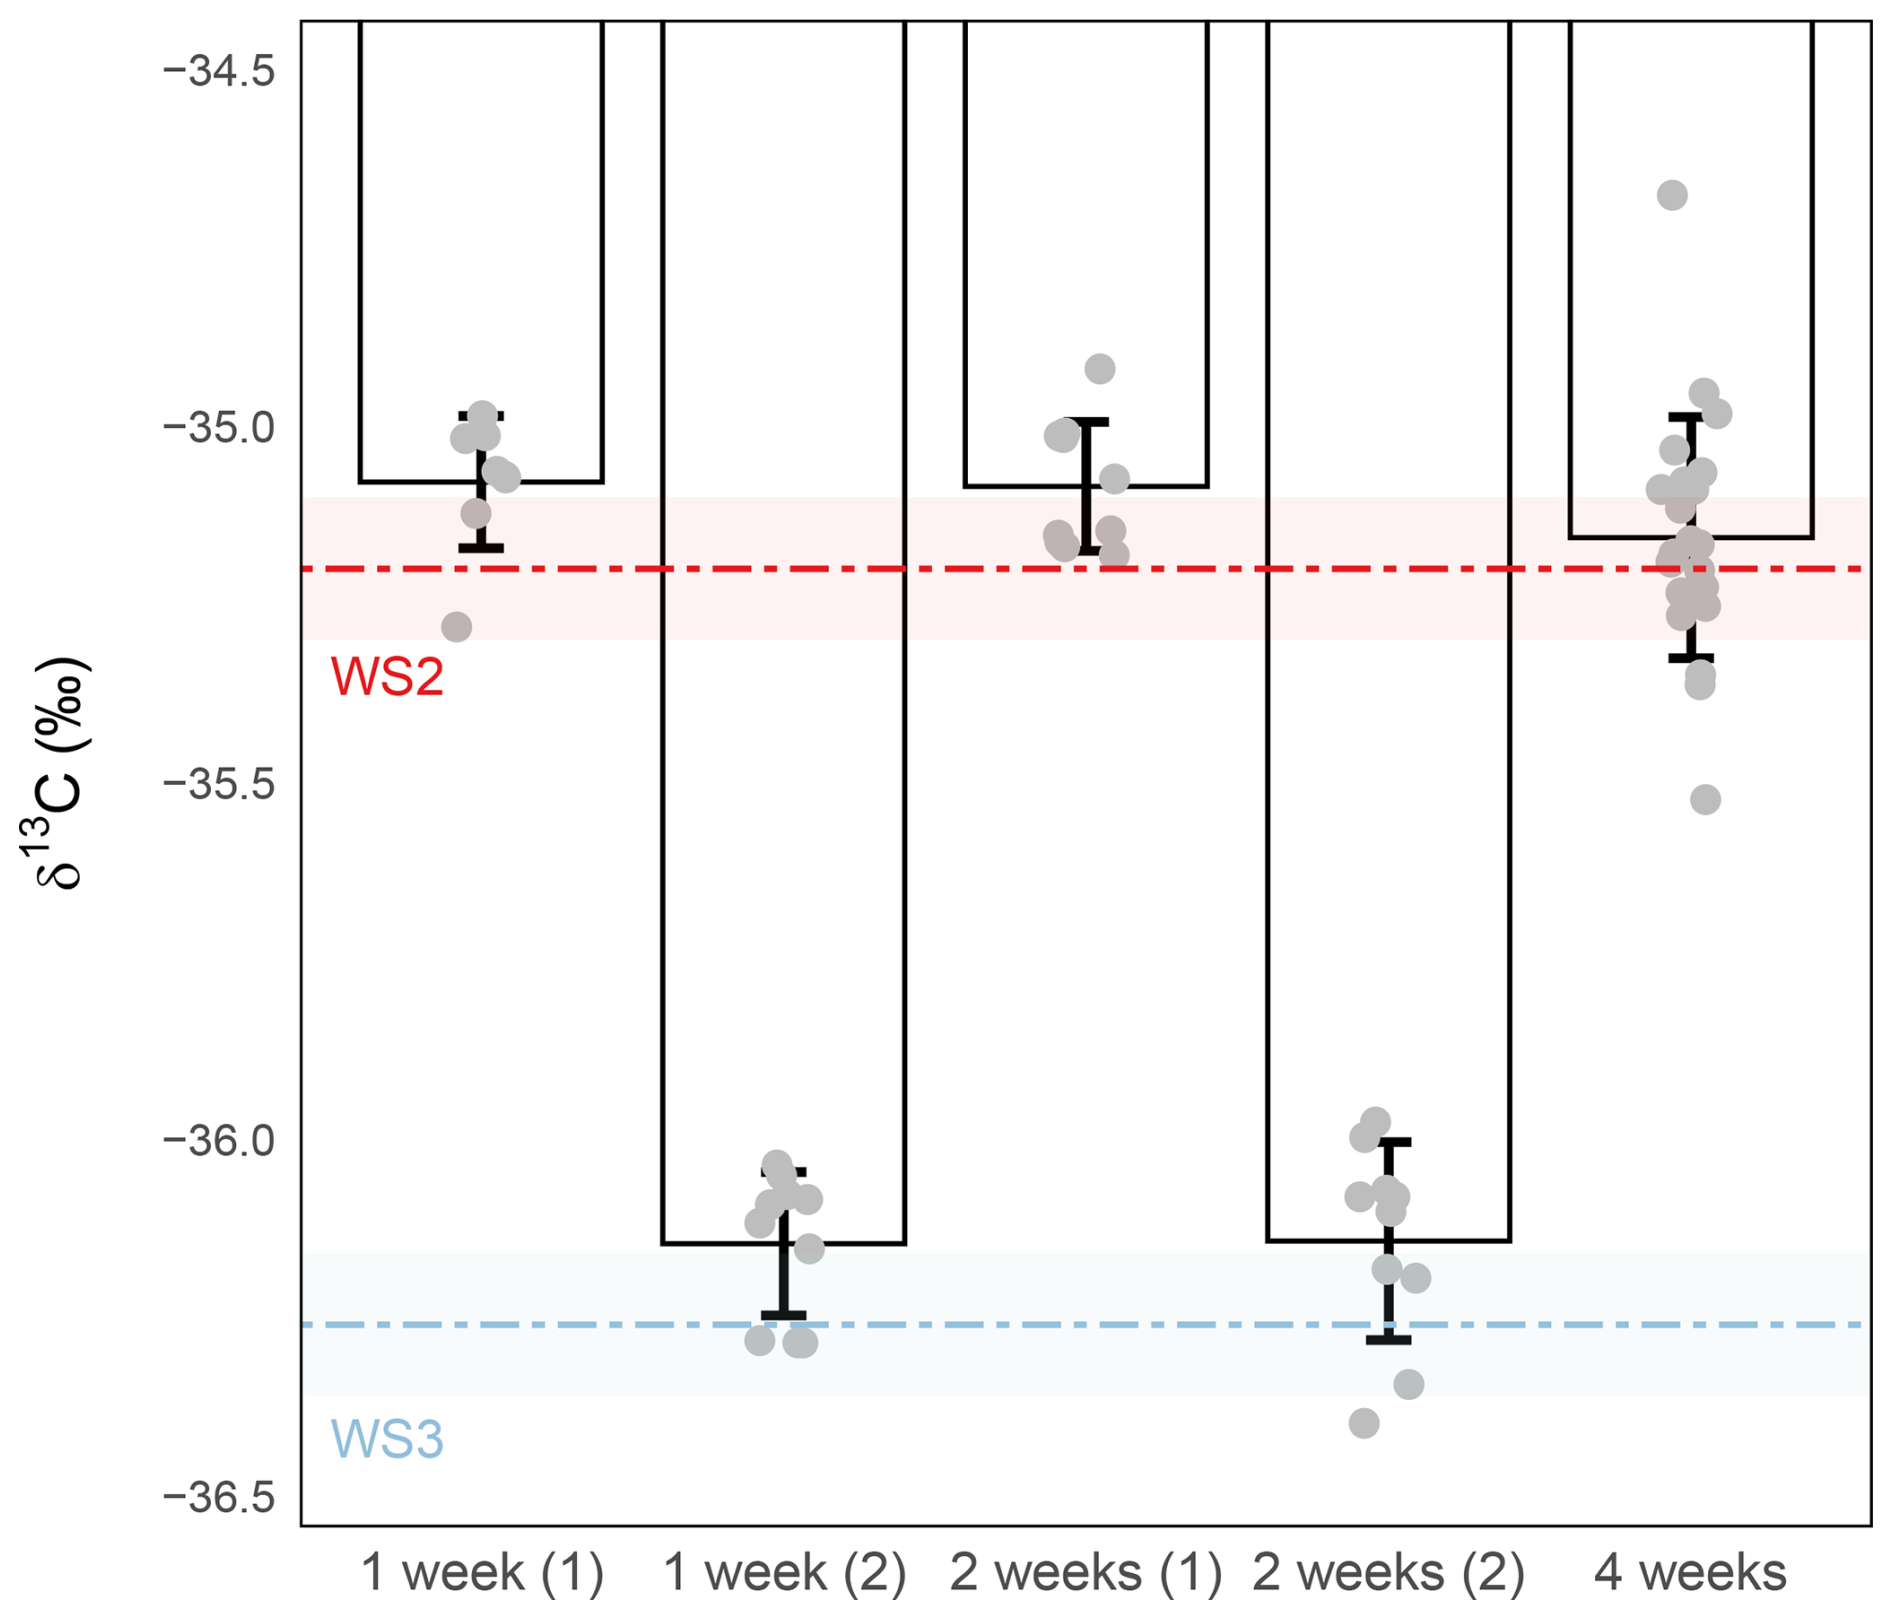
Figure 7Effect of storage duration on δ13C-CO2 stability. Sample were stored at −80 °C for 1- (left), 2- (middle) or 4-weeks (right). δ13C-CO2 values (‰) were measured from 1 mL of WS2 or WS3. The red and light blue dashed lines represent the expected isotopic value of the working standards and the shaded red and blue bands their measurement precision ( and , respectively). Grey circles represent individual replicate measurements. Bars show the mean ± standard deviation for each condition. Precision was ±0.10 ‰ (n=8) and ±0.09 ‰ (n=10) for sample stored for 1-week (sub samples (1) and (2) , respectively), ±0.13 ‰ (n=10) and ±0.09 ‰ (n=10) for sample stored for 2-weeks (sub samples (1) and (2), respectively) and ±0.17 ‰ (n=22) for sample stored for 4-weeks.
4.1 Analytical performance of δ13C-CO2 measurements from 1 mL air samples
The results demonstrate that δ13C-CO2 measurements with a precision of ±0.1 ‰ can be achieved from 1 mL atmospheric air samples when vial preparation, sealing and storage are rigorously controlled. Replicate analyses of samples showed a reproducible precision of ±0.1 ‰, with chromatograms exhibiting stable retention times, symmetrical CO2 peaks and adequate signal intensity (2–2.5 V), despite the low carbon mass (∼ 0.2 µg C per run).
The strong improvement observed after implementing the dry CO2-free air flush (precision reduced from ±0.54 ‰ to ±0.09 ‰) highlights the sensitivity of millilitre-scale samples to residual background CO2. At this volume, even trace contamination represents a measurable fraction of the total CO2 signal. The data therefore quantitatively confirm that pre-conditioning is essential to achieve acceptable precision at this scale.
Blank analyses revealed occasional trace CO2 signals (10–15 mV) under highly sensitive integration settings, despite the instrumental blanking (Paul et al., 2007; Siegwart et al., 2023). Although negligible relative to sample peaks (∼ 2 V), such background becomes proportionally more important at small volumes. However, under the optimised workflow (flush + dual sealing + −80 °C storage), its contribution remains below analytical target precision. Memory effects were not detected under extreme contrast tests, suggesting that the analytical system itself does not impose additional carry-over limitations.
Compared to conventional 10–12 mL protocols, the presented method achieves comparable analytical precision while reducing the required sample volume by approximately one order of magnitude (Breecker et al., 2014; Giammanco et al., 2017; Joos et al., 2008; Leitner et al., 2023; Pataki et al., 2003; Tu et al., 2001). This performance is achieved without custom-built instrumentation, but the data clearly show that the reduction in volume increases susceptibility to storage-related artefacts.
4.2 Mechanisms controlling isotopic drift during storage
The storage experiments demonstrated that temperature is the primary control on δ13C stability over time. At room temperature, δ13C-CO2 values exhibited systematic enrichment (+1 ‰) and large variability, indicating that gas exchange with the exterior of the vial occurred despite improved mechanical sealing. In contrast, storage at −80 °C markedly improved both accuracy and precision. This pattern is consistent with the strong temperature dependence of CO2 diffusion, permeation and adsorption–desorption kinetics reported in cryogenic CO2–polymer interaction studies (Ghiara et al., 2025) and low-temperature membrane systems (Sreenath and Sam, 2023).
Although storage at −80 °C improved isotopic stability, the small residual offset and the progressive degradation of precision after 2–4 weeks indicate that the mechanisms driving isotopic alteration are not yet fully constrained. The recurring slight 13C enrichment observed under non-cryogenic conditions is consistent with preferential diffusive loss of 12CO2, as predicted by kinetic fractionation theory (Cerling and Quade, 1993; Farquhar and Cernusak, 2012) or with external contamination by atmospheric CO2. In addition, adsorption–desorption processes at elastomeric surfaces may contribute, particularly at the millilitre scale where the absolute CO2 inventory is low (Hardie et al., 2010; Spötl and Vennemann, 2003). Experimental studies have shown that CO2 can reversibly adsorb onto polymeric and elastomeric materials, leading to small but measurable changes in headspace composition and, potentially, isotopic ratios (Aoki et al., 2022; Schukraft et al., 2022). The bidirectional deviations observed during extended storage further suggest that multiple processes – diffusive loss, external contamination, pressure-driven leakage, and surface interactions – may operate simultaneously rather than a single systematic drift.
4.3 Practical storage limits, analytical implications, and methodological constraints
Building on the mechanistic considerations discussed above, the temporal stability tests helped define the operational limits of cryogenic storage for millilitre-scale samples. Although −80 °C storage substantially reduces diffusive and surface-mediated exchange processes, it does not entirely suppress them. Under the most optimised conditions of our protocol, δ13C-CO2 values remained preserved within the ±0.1 ‰ analytical target after one week. After two weeks, precision began to degrade in one dataset, and after four weeks dispersion increased markedly, with precision reaching up to 0.3 ‰. Importantly, mean values remained close to nominal targets even after four weeks, indicating that extended storage primarily degrades precision rather than inducing systematic bias. This distinction has important analytical implications. While ensemble averages may remain reliable, applications that rely on individual-sample precision – such as Keeling plot intercept determination (Pataki et al., 2003), isotope mixing models (Phillips and Gregg, 2001), or subtle ecosystem discrimination analyses – are inherently sensitive to degraded precision. In such contexts, precision rather than accuracy becomes the limiting factor. Similar behaviour has been reported in trace-gas storage studies, where variability increases with storage duration even when mean concentration changes remain small (e.g., Mortazavi and Chanton, 2002; Spötl and Vennemann, 2003).
The results therefore suggest a practical analytical window: ≤1 week at −80 °C can be considered optimal; 1–2 weeks acceptable for many routine applications; and longer storage durations unsuitable for high-precision studies requiring sub-0.1 ‰ precision. These limits are consistent with broader observations in small-volume gas storage, where the relative impact of minor leakage, adsorption, or pressure equilibration increases as the absolute gas inventory decreases.
Initial tests were also conducted to evaluate the feasibility of off-site sampling at locations remote from the IRMS facility (data not shown). Vials were prepared according to the protocol described in Sect. 2.1 and transported under low temperatures using dry CO2-free air and insulating containers with dry ice or cold packs. Short-term storage (up to 48 h) at −80 °C indicated that δ13C-CO2 integrity was maintained within analytical precision. These preliminary results suggest that short-term off-site sampling may be feasible under controlled temperature conditions and in remote field campaigns without compromising short-term data quality.
Several methodological constraints must also be acknowledged. The protocol requires access to ultra-low temperature facilities, long-term stability beyond four weeks was not evaluated, and inter-laboratory reproducibility remains to be tested. Moreover, the impact on δ18O-CO2 was not assessed, although it may behave differently due to isotope exchange with residual water, a process known to affect oxygen isotopes even under apparently dry conditions. Performance was assessed using calibrated working standards rather than complex gas matrices derived from biological processes; high humidity, reactive trace gases, or large CO2 gradients typical of field samples may modify storage behaviour.
This study presents a simple and rapid analytical workflow based on widely available commercial materials that enables δ13C-CO2 measurements from 1 mL atmospheric air samples with a precision of ±0.1 ‰ using continuous-flow IRMS coupled to cryogenic pre-concentration. By combining optimised vial flushing, dual sealing, and low-temperature storage, the protocol reduces required sample volume by an order of magnitude compared to conventional approaches while maintaining comparable analytical precision.
Our results demonstrate that storage conditions are the primary control on isotopic reliability at the millilitre scale. Storage at −80 °C preserves δ13C-CO2 values within the targeted analytical precision for up to one week (and remains acceptable up to two weeks, depending on applications), whereas room temperature storage induces significant isotopic drift. These findings define clear operational limits for small-volume sampling and provide quantitative guidance for experimental design.
The method is particularly suited to applications where headspace volume is limited, minimally invasive or high-frequency sampling is required, or experimental systems involve small biological or environmental compartments (e.g. microcosm, controlled chamber, flux studies or soil fauna incubation). While robust for short-term cryogenic storage under the tested conditions, longer storage durations or applications requiring very high isotopic accuracy warrant further validation.
Future work should focus on improving long-term stability through alternative septum materials (e.g. silicone or PTFE-lined), testing storage under atmospheres with contrasting δ13C-CO2 signatures to distinguish diffusive loss from external contamination, assessing inter-laboratory reproducibility, and evaluating applicability to other isotopic systems such as δ18O-CO2. By clearly defining both its capabilities and its practical constraints, this workflow provides a practical analytical approach for high-precision δ13C-CO2 analysis in volume-limited experimental contexts.
The data processing and figure generation were performed using standard functions in R and simple in-house scripts developed specifically for this study. These scripts are not maintained as standalone software but can be provided by the authors upon reasonable request.
The data used in this study consist of calibration measurements, laboratory test experiments, and methodological validation data. These datasets were generated specifically for this work and are not currently available in a public repository. However, the data supporting the results of this study can be provided by the authors upon reasonable request.
JS and CP designed the project. JS, CP, and MLT carried out experiments. JS and CP analysed the data from IRMS and AM performed statistical analyses. JS, CP and AM wrote the manuscript.
The contact author has declared that none of the authors has any competing interests.
Publisher's note: Copernicus Publications remains neutral with regard to jurisdictional claims made in the text, published maps, institutional affiliations, or any other geographical representation in this paper. The authors bear the ultimate responsibility for providing appropriate place names. Views expressed in the text are those of the authors and do not necessarily reflect the views of the publisher.
This study benefited from the CNRS resources allocated to the French Ecotron Research Infrastructure, from the Occitanie Pyrénées-Méditerranée Region and from the European Regional Development Fund (FEDER) co-funding, as well as from the state allocation “Investissements d'Avenir” via AnaEE-France (ANR-11-INBS-0001) and the European Observation Network for Territorial Development and Cohesion. We would also like to thank Sébastien Devidal from the Ecotron of Montpellier for his help.
This research has been supported by the Centre National de la Recherche Scientifique (Support via ECOTRONS Research Infrastructure), the European Regional Development Fund, European Observation Network for Territorial Development and Cohesion (FEDER investments), the Région Occitanie Pyrénées-Méditerranée (FEDER co-funding), and the Agence Nationale de la Recherche (grant no. ANR-11-INBS-0001).
This paper was edited by Frank Keppler and reviewed by three anonymous referees.
Aoki, N., Ishidoya, S., Murayama, S., and Matsumoto, N.: Influence of CO2 adsorption on cylinders and fractionation of CO2 and air during the preparation of a standard mixture, Atmos. Meas. Tech., 15, 5969–5983, https://doi.org/10.5194/amt-15-5969-2022, 2022.
Belouafa, S., Habti, F., Benhar, S., Belafkih, B., Tayane, S., Hamdouch, S., and Abourriche, A.: Statistical tools and approaches to validate analytical methods: methodology and practical examples, Int. J. Metrol. Qual. Eng., 8, https://doi.org/10.1051/ijmqe/2016030, 2017.
Bereiter, B., Tuzson, B., Scheidegger, P., Kupferschmid, A., Looser, H., Mächler, L., Baggenstos, D., Schmitt, J., Fischer, H., and Emmenegger, L.: High-precision laser spectrometer for multiple greenhouse gas analysis in 1 mL air from ice core samples, Atmos. Meas. Tech., 13, 6391–6406, https://doi.org/10.5194/amt-13-6391-2020, 2020.
Berryman, E. M., Marshall, J. D., Rahn, T., Cook, S. P., and Litvak, M.: Adaptation of continuous-flow cavity ring-down spectroscopy for batch analysis of δ13C of CO2 and comparison with isotope ratio mass spectrometry, Rapid Commun. Mass Spectrom., 25, 2355–2360, https://doi.org/10.1002/rcm.5108, 2011.
Bowling, D. R., Pataki, D. E., and Randerson, J. T.: Carbon isotopes in terrestrial ecosystem pools and CO2 fluxes, New Phytol., 178, 24–40, https://doi.org/10.1111/j.1469-8137.2007.02342.x, 2008.
Brand, W. A.: High Precision Isotope Ratio Monitoring Techniques in Mass Spectrometry, J. Mass Spectrom., 31, 225–235, https://doi.org/10.1002/(SICI)1096-9888(199603)31:3<225::AID-JMS319>3.0.CO;2-L, 1996.
Brand, W. A., Assonov, S. S., and Coplen, T. B.: Correction for the 17O interference in δ(13C) measurements when analyzing CO2 with stable isotope mass spectrometry (IUPAC Technical Report), Pure Appl. Chem., 82, 1719–1733, https://doi.org/10.1351/PAC-REP-09-01-05, 2010.
Brand, W. A., Rothe, M., Sperlich, P., Strube, M., and Wendeberg, M.: Automated simultaneous measurement of the δ13C and δ2H values of methane and the δ13C and δ18O values of carbon dioxide in flask air samples using a new multi cryo-trap/gas chromatography/isotope ratio mass spectrometry system, Rapid Commun. Mass Spectrom., 30, 1523–1539, https://doi.org/10.1002/rcm.7587, 2016.
Breecker, D. O., Bergel, S., Nadel, M., Tremblay, M. M., Osuna-Orozco, R., Larson, T. E., and Sharp, Z. D.: Minor stable carbon isotope fractionation between respired carbon dioxide and bulk soil organic matter during laboratory incubation of topsoil, Biogeochemistry, 123, 83–98, https://doi.org/10.1007/s10533-014-0054-3, 2014.
Cerling, T. E. and Quade, J.: Stable carbon and oxygen isotopes in soil carbonates, Geoph. Monog. Series, 78, 217–231, https://doi.org/10.1029/GM078p0217, 1993.
Ciais, P., Sabine, C., Bala, G., Bopp, L., Brovkin, V., Canadell, J., Chhabra, A., Defries, R., Galloway, J., Heimann, M., Jones, C., Le Quéré, C., Myneni, R., Piao, S., and Thornton, P.: Carbon and Other Biogeochemical Cycles, in: In Climate Change 2013: The Physical Science Basis. Contribution of Working Group I to the Fifth Assessment Report of the Intergovernmental Panel on Climate Change Change, 465–570, 2014.
Farquhar, G. D. and Cernusak, L. A.: Ternary effects on the gas exchange of isotopologues of carbon dioxide, Plant Cell Environ., 35, 1221–1231, https://doi.org/10.1111/j.1365-3040.2012.02484.x , 2012.
Farquhar, G. D., Ehleringer, J. R., and Hubick, K. T.: Carbon Isotope Discrimination and Photosynthesis, Annu. Rev. Plant Physiol. Plant Mol. Biol., 40, 503–537, 1989.
Fiebig, J., Schöne, B. R., and Oschmann, W.: High-precision oxygen and carbon isotope analysis of very small (10–30 µg) amounts of carbonates using continuous flow isotope ratio mass spectrometry, Rapid Commun. Mass Spectrom., 19, 2355–2358, https://doi.org/10.1002/rcm.2060, 2005.
Fisher, R., Lowry, D., Wilkin, O., Sriskantharajah, S., and Nisbet, E. G.: High-precision, automated stable isotope analysis of atmospheric methane and carbon dioxide using continuous-flow isotope-ratio mass spectrometry, Rapid Commun. Mass Spectrom., 20, 200–208, https://doi.org/10.1002/rcm.2300, 2006.
Ghiara, E., Lazzari, G., Signorini, V., Ansaloni, L., Alcock, B., and Minelli, M.: Cryo-compressed CO2 sorption and diffusion in elastomers for the CO2 transport chain: Examples of FKM, EPDM and HNBR, Chem. Eng. J., 511, 161826, https://doi.org/10.1016/j.cej.2025.161826, 2025.
Giammanco, S., Krajnc, B., Kotnik, J., and Ogrinc, N.: Temporal analysis of δ13 C, Ann. Geophys., 60, S0663, https://doi.org/10.4401/ag-7305, 2017.
Gillespie, L. M., Fromin, N., Milcu, A., Buatois, B., Pontoizeau, C., and Hättenschwiler, S.: Higher tree diversity increases soil microbial resistance to drought, Commun. Biol., 3, 377, https://doi.org/10.1038/s42003-020-1112-0, 2020.
Guillot, E., Hinsinger, P., Dufour, L., Roy, J., and Bertrand, I.: With or without trees: Resistance and resilience of soil microbial communities to drought and heat stress in a Mediterranean agroforestry system, Soil Biol. Biochem., 129, 122–135, https://doi.org/10.1016/j.soilbio.2018.11.011, 2019.
Hardie, S. M. L., Garnett, M. H., Fallick, A. E., Stott, A. W., Rowland, A. P., and Ostle, N. J.: Testing the use of septum-capped vials for 13C-isotope abundance analysis of carbon dioxide, Rapid Commun. Mass Spectrom., 24, 1805–1809, https://doi.org/10.1002/rcm.4575, 2010.
Joos, O., Saurer, M., Heim, A., Hagedorn, F., Schmidt, M. W., and Siegwolf, R. T.: Can we use the CO2 concentrations determined by continuous-flow isotope ratio mass spectrometry from small samples for the Keeling plot approach?, Rapid Commun. Mass Spectrom., 22, 4029–4034, https://doi.org/10.1002/rcm.3827, 2008.
Keeling, C. D.: The concentration and isotopic abundances of atmospheric carbon dioxide in rural areas, Geochim. Cosmochim. Ac., 13, 322–334, https://doi.org/10.1016/0016-7037(58)90033-4, 1958.
Kornfeld, A., Horton, T. W., Yakir, D., Searle, S. Y., Griffin, K. L., Atkin, O. K., Subke, J., and Turnbull, M. H.: A field-compatible method for measuring alternative respiratory pathway activities in vivo using stable O2 isotopes, Plant Cell Environ., 35, 1518–1532, https://doi.org/10.1111/j.1365-3040.2012.02507.x, 2012.
Kuehfuss, S., Högy, P., and Fangmeier, A.: Influence of long-term CO2 storage on δ13C in vials capped with butyl and butyl/PTFE caps and the relevance for ecological samples, Plant Soil, 383, 99–110, https://doi.org/10.1007/s11104-014-2156-z, 2014.
Laughlin, R. J. and Stevens, R. J.: Changes in Composition of Nitrogen-15-Labeled Gases during Storage in Septum-Capped Vials, Soil Sci. Soc. Am. J., 67, 540–543, 2003.
Leitner, S., Meeran, K., and Watzinger, A.: Stable isotope analysis of atmospheric CO2 using a Gasbench II-Cold Trap-IRMS setting, Rapid Commun. Mass Spectrom., 37, e9647, https://doi.org/10.1002/rcm.9647, 2023.
Midwood, A. J. and Millard, P.: Challenges in measuring the δ13 C of the soil surface CO2 efflux, Rapid Commun. Mass Spectrom., 25, 232–242, https://doi.org/10.1002/rcm.4857, 2011.
Mortazavi, B. and Chanton, J. P.: A rapid and precise technique for measuring δ13 C-CO2 and δ18 O-CO2 ratios at ambient CO2 concentrations for biological applications and the influence of container type and storage time on the sample isotope ratios, Rapid Commun. Mass Spectrom., 16, 1398–1403, https://doi.org/10.1002/rcm.730, 2002.
Nauer, P. A., Chiri, E., Jirapanjawat, T., Greening, C., and Cook, P. L. M.: Technical note: Inexpensive modification of Exetainers for the reliable storage of trace-level hydrogen and carbon monoxide gas samples, Biogeosciences, 18, 729–737, https://doi.org/10.5194/bg-18-729-2021, 2021.
Nelson, S. T.: Sample vial influences on the accuracy and precision of carbon and oxygen isotope ratio analysis in continuous flow mass spectrometric applications, Rapid Commun. Mass Spectrom., 14, 293–297, https://doi.org/10.1002/(SICI)1097-0231(20000229)14:4<293::AID-RCM869>3.0.CO;2-L, 2000.
Pataki, D. E., Ehleringer, J. R., Flanagan, L. B., Yakir, D., Bowling, D. R., Still, C. J., Buchmann, N., Kaplan, J. O., and Berry, J. A.: The application and interpretation of Keeling plots in terrestrial carbon cycle research, Global Biogeochem. Cy., 17, 2001GB001850, https://doi.org/10.1029/2001GB001850, 2003.
Paul, D. and Skrzypek, G.: Flushing time and storage effects on the accuracy and precision of carbon and oxygen isotope ratios of sample using the Gasbench II technique, Rapid Commun. Mass Spectrom., 20, 2033–2040, https://doi.org/10.1002/rcm.2559, 2006.
Paul, D., Skrzypek, G., and Fórizs, I.: Normalization of measured stable isotopic compositions to isotope reference scales – a review, Rapid Commun. Mass Spectrom., 21, 3006–3014, https://doi.org/10.1002/rcm.3185, 2007.
Phillips, D. L. and Gregg, J. W.: Uncertainty in source partitioning using stable isotopes, Oecologia, 127, 171–179, 2001.
R Core Team: R: A language and environment for statistical computing, R Foundation for Statistical Computing, Vienna, Austria, 2024.
Rothe, M., Jordan, A., and Brand, W. A.: Trace gases, δ13C and δ18O of CO2-in-air samples: Storage in glass flasks using PCTFE seals and other effects, in: Proceedings of the 12th IAEA/WMO meeting of CO2 experts, edited by: Worthy, D. and Huang, L., Toronto, September 2003, 64–70, 2005.
Schmitt, J., Schneider, R., and Fischer, H.: A sublimation technique for high-precision measurements of δ13CO2 and mixing ratios of CO2 and N2O from air trapped in ice cores, Atmos. Meas. Tech., 4, 1445–1461, https://doi.org/10.5194/amt-4-1445-2011, 2011.
Schukraft, G. E., Itskou, I., Woodward, R. T., Van Der Linden, B., Petit, C., and Urakawa, A.: Evaluation of CO2 and H2O adsorption on a porous polymer using DFT and in situ DRIFT spectroscopy, J. Phys. Chem. B, 126, 8048–8057, https://doi.org/10.1021/acs.jpcb.2c03912, 2022.
Siegwart, L., Piton, G., Jourdan, C., Piel, C., Sauze, J., Sugihara, S., and Bertrand, I.: Carbon and nutrient colimitations control the microbial response to fresh organic carbon inputs in soil at different depths, Geoderma, 440, 116729, https://doi.org/10.1016/j.geoderma.2023.116729, 2023.
Sperlich, P., Brailsford, G. W., Moss, R. C., McGregor, J., Martin, R. J., Nichol, S., Mikaloff-Fletcher, S., Bukosa, B., Mandic, M., Schipper, C. I., Krummel, P., and Griffiths, A. D.: IRIS analyser assessment reveals sub-hourly variability of isotope ratios in carbon dioxide at Baring Head, New Zealand's atmospheric observatory in the Southern Ocean, Atmos. Meas. Tech., 15, 1631–1656, https://doi.org/10.5194/amt-15-1631-2022, 2022.
Spötl, C. and Vennemann, T. W.: Continuous-flow isotope ratio mass spectrometric analysis of carbonate minerals, Rapid Commun. Mass Spectrom., 17, 1004–1006, https://doi.org/10.1002/rcm.1010, 2003.
Squara, P., Scheeren, T. W., Aya, H. D., Bakker, J., Cecconi, M., Einav, S., and Saugel, B.: Metrology part 1: definition of quality criteria, J. Clin. Monit. Comput., 35, 17–25, https://doi.org/10.1007/s10877-020-00494-y, 2020.
Sreenath, S. and Sam, A. A: Hybrid membrane-cryogenic CO2 capture technologies: A mini-review, Front. Ener. Resear., 11, 1167024, https://doi.org/10.3389/fenrg.2023.1167024, 2023.
Steur, P. M., Scheeren, H. A., Nelson, D. D., McManus, J. B., and Meijer, H. A. J.: Simultaneous measurement of δ13C, δ18O and δ17O of atmospheric CO2 – performance assessment of a dual-laser absorption spectrometer, Atmos. Meas. Tech., 14, 4279–4304, https://doi.org/10.5194/amt-14-4279-2021, 2021.
Steur, P. M., Botter, D., Scheeren, H. A., Moossen, H., Rothe, M., and Meijer, H. A.: Preventing drift of oxygen isotopes of CO2-in-air stored in glass sample flasks: new insights and recommendations, Isot. Environ. Healt. S., 59, 309–326, https://doi.org/10.1080/10256016.2023.2234594, 2023.
Tans, P., Berry, J. A., and Keeling, R.: Oceanic 13C/12C observations: a new window on ocean CO2 uptake, Global Geochem. Cy., https://doi.org/10.1029/93GB00053, 1993.
Thermo Fisher Scientific: GasBench II Operating Manual, Ville: Thermo Fisher Scientific, 2018.
Tu, K. P., Brooks, P. D., and Dawson, T. E.: Using septum-capped vials with continuous-flow isotope ratio mass spectrometric analysis of atmospheric CO2 for Keeling plot applications, Rapid Commun. Mass Spectrom., 15, 952–956, https://doi.org/10.1002/rcm.320, 2001.
van Geldern, R., Nowak, M. E., Zimmer, M., Szizybalski, A., Myrttinen, A., Barth, J. A., and Jost, H. J.: Field-based stable isotope analysis of carbon dioxide by mid-infrared laser spectroscopy for carbon capture and storage monitoring, Anal. Chem., 86, 12191–12198, https://doi.org/10.1021/ac5031732, 2014.
Walker, B. D., Beaupré, S. R., Griffin, S., Walker, J., Druffel, E., and Xu, X.: A sealed-tube method for offline δ13C analysis of CO2 via a gas bench II continuous-flow isotope ratio mass spectrometer, Rapid Commun. Mass Spectrom., 35, e9040, https://doi.org/10.1002/rcm.9040, 2021.
Werner, C., Unger, S., Pereira, J. S., Maia, R., David, T. S., Kurz-Besson, C., David, J. S., and Máguas, C.: Importance of short-term dynamics in carbon isotope ratios of ecosystem respiration (δ13 CR) in a Mediterranean oak woodland and linkage to environmental factors, New Phytol., 172, 330–346, https://doi.org/10.1111/j.1469-8137.2006.01836.x, 2006.
Werner, R. A., Rothe, M., and Brand, W. A.: Extraction of CO2 from air samples for isotopic analysis and limits to ultra high precision δ18O determination in CO2 gas, Rapid Commun. Mass Spectrom., 15, 2152–2167, https://doi.org/10.1002/rcm.487, 2001.
West, J. B., Bowen, G. J., Cerling, T. E., and Ehleringer, J. R.: Stable isotopes as one of nature's ecological recorders, Trends Ecol. Evol., 21, 408–414, https://doi.org/10.1016/j.tree.2006.04.002, 2006.