the Creative Commons Attribution 4.0 License.
the Creative Commons Attribution 4.0 License.
 | 20 Apr 2026
Validation of rainfall data observed by using disdrometer under wet-bulb temperature conditions
Hyeon-Joon Kim
Sung-Ho Suh
Jongyun Byun
This study focuses on the reliability assessment of precipitation data calculated from drop size distribution (DSD) based on disdrometer data observations according to wet-bulb temperature (Tw). Three distinct quality control (QC) methods based on fall velocity were implemented and validated against measurements from tipping-buckets and weighing rain gauges collected from January 2020 to February 2024. The analysis indicated that all QC methods exhibited high reliability (correlation coefficient (CC)>0.98) for rainfall conditions when Tw was above 5 °C, with a mean absolute percentage error (MAPE) of approximately 8.5 %. However, the precision of precipitation measurements exhibited a notable decline when Tw was below 2 °C, as indicated by a CC of less than 0.6 and MAPE exceeding 30 %. This reduction in accuracy can primarily be attributed to the outcomes of the QC methods, which rely on the falling velocity, given that raindrops and solid particles were observed within the specified Tw range. When considering the melting of snow particles at Tw ranging from 0 to 2 °C, the CC approached 0.9, suggesting enhanced measurement reliability. The findings of this study indicate that Tw is a more effective variable than air temperature (Tair) for differentiating the precipitation types. This conclusion arises from the observation that the fall velocity of hydrometeors does not reach the terminal velocity of raindrops, even within the Tair range of 1–5 °C, coupled with the broad distribution of fall velocities. The DSD shape demonstrated stability across multiple QC methods when Tw was equal to or greater than 2 °C. In contrast, considerable variations were observed at lower temperatures, where particles with diameters ranging from 1 to 2 mm exhibited irregular distribution patterns at temperatures below 1 °C. These results suggest that DSD parameters should be derived from disdrometer data obtained under conditions where Tw is above 2 °C to ensure the reliability of the findings. This study provides critical insights for improving precipitation measurement techniques and DSD analyses in regions with variable temperature conditions.
- Article
(10481 KB) - Full-text XML
- BibTeX
- EndNote


Several factors influence the variability in precipitation development, including atmospheric water vapor content, vertical airflow intensity, and temperature and humidity distributions in the vertical profile (Lintner et al., 2017; Padullés et al., 2022). These factors can be categorized as climatological, geographical, or topographical. Climatological factors include alterations in atmospheric water vapor resulting from long-term temperature changes, developmental shifts associated with temperature variations in the upper and lower atmospheric layers, and thermodynamic effects linked to changes in land cover based on climatic characteristics (Dahlström, 2021; Lu et al., 2024). Geographical and topographical factors include the convergence of water vapor due to mountainous terrain, which facilitates vertical precipitation development (Insel et al., 2010; Lee et al., 2014; Kim et al., 2019), and the generation of vertical flow resulting from increased friction at low levels due to coastal topography (Du and Chen, 2019; Yao et al., 2021). Additionally, precipitation development can be influenced by the temperature differential between the sea and air, particularly when cold air from inland regions moves over water bodies during winter (Steenburgh, 2020). Various environmental factors can influence the disparities in warm precipitation processes, such as collision-coalescence, evaporation, and accretion, which are contingent upon the vertical development of precipitation types, including stratiform, convective, and typhoon-related precipitation. Similarly, cold precipitation processes such as snow riming, melting, and ice crystal growth are affected by these environmental variables. These factors contribute to the development of diverse hydrometeors including rain, snow, and graupel, which are influenced by temperature variations (Maheskumar et al., 2018; Yi et al., 2021). Environmental factors that influence precipitation development exert both hydrodynamic effects, including variations in lower-level vertical flow and atmospheric convergence or divergence, and thermodynamic effects, such as increased atmospheric instability resulting from water vapor inflow and differences in vertical temperature distribution. The differences in the development of precipitation due to environmental influences from the perspectives of atmospheric dynamics and thermodynamics ultimately lead to variations in the total precipitation observed at the surface. Therefore, it is crucial to acquire data that accurately reflects the microphysical characteristics of precipitation to enhance precipitation monitoring. Furthermore, analyses based on long-term observational data are essential to identify the universal characteristics that account for the temporal variability of precipitation.
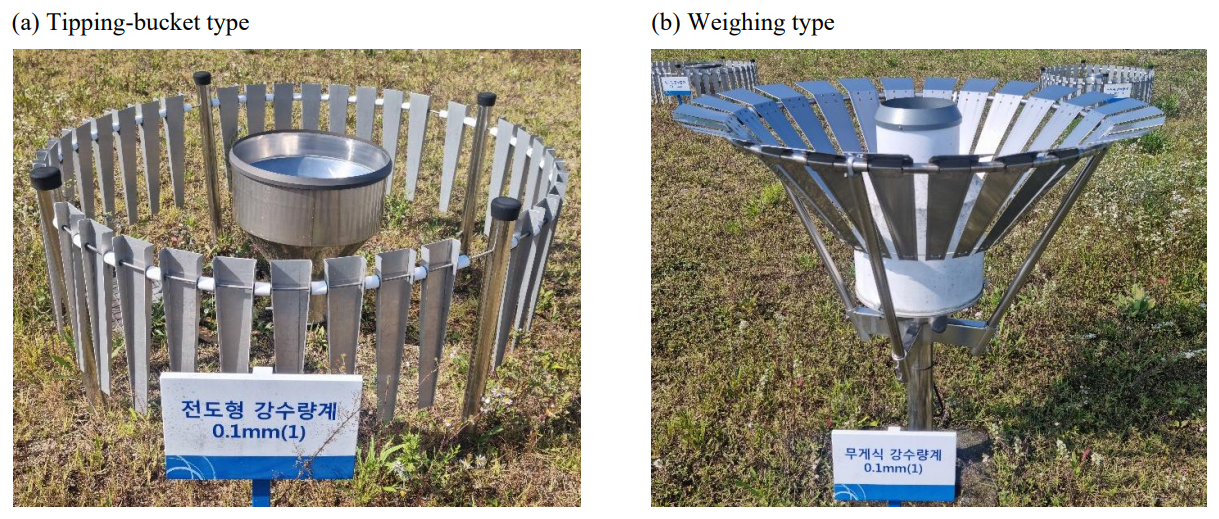
The utilization of long-term observational data considerably reduces errors, mainly by rectifying inaccuracies in the observational data and eliminating outliers. Even among instruments that measure the same meteorological parameters, the threshold values for outlier removal may vary based on the installation conditions and surrounding environment. Additionally, biases in the observed values can arise owing to variations in the observation area and resolution, which are contingent on the type of instrument employed (Sypka, 2019; Segovia-Cardozo et al., 2021). Ground-based rain gauges can be categorized into two types based on their measurement method: tipping-buckets and weighing gauges. Although the tipping-bucket type demonstrates high accuracy in measuring rainfall, its efficacy in measuring snowfall during winter may be inferior to that of the weighing type because the observation value is recorded only when the precipitation in the bucket reaches a predetermined capacity (Savina et al., 2012; Kochendorfer et al., 2020). Comprehending the characteristics of observational instruments and the data they produce is imperative to ensure the reliability of the research findings derived from observational data.
The standard instruments used to observe precipitation include rain gauges and disdrometers. A rain gauge measures the total precipitation accumulated over a specified time interval. In contrast, a disdrometer assesses the size and concentration of precipitation particles, thereby enabling the determination of the precipitation intensity and type. The selection of an appropriate type of rain gauge is contingent on specific observational objectives such as monitoring heavy rain, light rain, or snow. Notable examples of disdrometers include the Particle Size and Velocity (PARSIVEL), Two-dimensional Video Disdrometer (2DVD), Joss-Waldvogel Disdrometer, and Precipitation Occurrence Sensor System. Disdrometers compute the size-specific concentration of particles, known as the Drop Size Distribution (DSD), by analyzing the variations in optical intensity as the particles traverse the observation zone of the sensor. In contrast to data obtained from rain gauges, disdrometer data offer a broader range of applications because they provide physical parameters, such as particle number concentration and fall velocity, and morphological characteristics, such as oblateness.
A typical application of disdrometer data involves formulating Quantitative Precipitation Estimation (QPE) equations, which are used in conjunction with remote sensing data such as radar observations. To derive rainfall information from remote sensing data, researchers can leverage the correlation between rain rate and radar reflectivity values, an observational variable in remote sensing, to measure variations in rainfall (Ji et al., 2019; Tang et al., 2024). Additionally, DSD information obtained from disdrometer observations is instrumental in parameterizing microphysical schemes within numerical weather prediction models (Yang et al., 2019; Iversen et al., 2021). Microphysical schemes can be categorized into bin and bulk types (Hu and Igel, 2023). The bin scheme accurately simulates the distributional differences between hydrometeor types by accounting for their size-dependent number concentration. However, this approach is limited by its high computational demand and the need for substantial hardware resources during the simulation process. Consequently, bulk schemes are predominantly employed in weather prediction models. This approach simulates microphysical processes based on the relationships between particle diameter and concentration distributions for various hydrometeor types. The DSD model considerably influences the quantitative differences in the estimated precipitation property outcomes. As the reliability of the DSD model improves, so does the accuracy of the precipitation simulation and forecasting.
The DSD model used in the QPE and microphysical schemes of remote sensing encompasses various models, such as the Marshall-Palmer, exponential (Marshall and Palmer, 1948), and gamma models (Ulbrich, 1983). The configuration of each model is contingent on the specific parameters being analyzed, with the shape and slope variables in the DSD model varying according to the concentration distribution based on the particle diameter (Smith, 2003; Liu et al., 2021). The DSD is affected by several factors, such as the type of rainfall (Deo and Walsh, 2016), intensity of rainfall (Thomas et al., 2021), and climatological and topographical characteristics of the region where precipitation occurs and develops (Kim et al., 2022). Consequently, it is imperative to acquire DSD model parameters and reflectivity data by collecting highly reliable observational data that accurately represent precipitation characteristics to enhance the precision of rainfall estimations and simulations based on DSD. Furthermore, disdrometer data can be used to estimate rainfall erosivity (Serio et al., 2019). Enhancing the accuracy of rainfall erosivity estimates can facilitate the assessment of the impact of rainfall on soil erosion and serve as a foundation for developing countermeasures through spatial analysis and monitoring of soil erosion risk areas using remote sensing data. Reliable precipitation observational data for estimating rainfall erosivity can aid in analyzing the effects of erosion resulting from alterations in rainfall patterns due to climate change.
Various quality control (QC) methods for disdrometer data have been suggested to enhance the accuracy of derived measurements (Kruger and Krajewski, 2002; Jaffrain and Berne, 2011; Raupach and Berne, 2015). QC approaches for disdrometer data primarily rely on the falling velocity of raindrops. In the absence of a substantial wind influence or particle collisions during descent, the fall velocity of a raindrop tends to increase with its diameter, ultimately reaching a terminal velocity. Terminal velocity is achieved when the forces of air resistance and gravitational pull are in equilibrium, resulting in no further particle acceleration (Wang and Pruppacher, 1977; Ong et al., 2021). Studies have been conducted to determine the terminal velocities of raindrop particles (Atlas et al., 1973; Beard, 1977; Brandes et al., 2002), which have led to the development of QC methods that use terminal velocity measurements. Kruger and Krajewski (2002) elucidated the structural design and operational principles of a 2DVD system, and noted that the recorded data indicated a fall velocity of approximately 400 m s−1. However, this value is not feasible for raindrops. To mitigate the impact of erroneous data (outliers) potentially arising from hardware malfunctions, inaccuracies in data processing, and environmental conditions at the observation site, we employed a comparative analysis of the empirical relationship of raindrops established by Atlas et al. (1973). Furthermore, recognizing that the disdrometer may either underestimate or overestimate the fall velocity of precipitation particles influenced by the horizontal movement due to wind, this study conducted QC by focusing exclusively on the vertical velocity measurements. Jaffrain and Berne (2011) conducted a study to address the uncertainties associated with sampling observations from PARSIVEL disdrometers. They argued that the collected precipitation data exhibit inherent variability and measurement errors attributable to the equipment used, necessitating the development of a method to mitigate these issues and enhance data reliability. The authors proposed a method for eliminating anomalous data, such as outliers (values that are not physically plausible), instances of particle splashing (where the same particle is detected multiple times), and non-meteorological data. This preprocessing approach effectively diminished the sampling uncertainty of various parameters, including rain rate.
Raupach et al. (2015) conducted a study using data from the PARSIVEL and 2DVD to establish a correction factor for number concentration based on observations from the PARSIVEL disdrometer. The authors noted a tendency for PARSIVEL to overestimate the number of small droplets measuring between 0.2 and 0.4 mm and larger particles measuring 2.4 mm or more. Furthermore, the measured fall velocity of larger droplets was lower than the actual terminal velocity. Anomalous data can lead to DSD distortions, which can compromise the accuracy of precipitation measurements and radar-based rainfall estimates. The focus of these studies was primarily on rainfall particles and it was determined that the quantitative accuracy of rainfall estimates improved when the aforementioned QC methods were applied across various environmental conditions.
Snow particles exhibit a variety of forms such as needles, dendrites, and granules, which are influenced by temperature and humidity. These variations in shape arise from the specific conditions under which the particles form and develop, leading to differences in their densities and fall velocities (Barthazy and Schefold, 2006; Vázquez-Martín et al., 2021). Furthermore, snow particles are more susceptible to wind because of their lower density and larger surface area than raindrops. Consequently, fall-velocity-based QC methods for eliminating non-meteorological particles (such as leaves, dust, and insects) are limited in their effectiveness because they primarily target solid particles with low fall velocities. Given the diverse shapes and fall speeds of snow particles, the mixing of raindrops and snow during precipitation events may lead to an underestimation of errors when applying conventional disdrometer QC methods. Therefore, it is imperative to establish objective criteria for differentiating rainfall and snowfall conditions to enhance the accuracy of rainfall analysis using disdrometer data. Ding et al. (2014) emphasized the significance of accurately classifying precipitation types for surface energy balance and hydrological process research. They aimed to develop a method for identifying precipitation types by analyzing 30 years of observational data. Their investigation focused on the correlation between precipitation type and various meteorological variables, including wet-bulb temperature (Tw), relative humidity (RH), and surface elevation. These findings indicate that using Tw as a reference variable for determining precipitation type is more reliable than relying on air temperature (Tair). Furthermore, the proposed model, which incorporated Tw, demonstrated a determination accuracy exceeding 88 %.
This study aims to evaluate the quantitative accuracy of rainfall measurements obtained from a disdrometer in relation to varying Tw conditions. Furthermore, this study seeks to establish environmental criteria to ensure the reliability of the parameters used in the DSD model by using long-term rainfall data collected through disdrometer observations. A comparative analysis of the disdrometer data was performed using different QC methods to examine the discrepancies between these methods under varying Tw conditions.
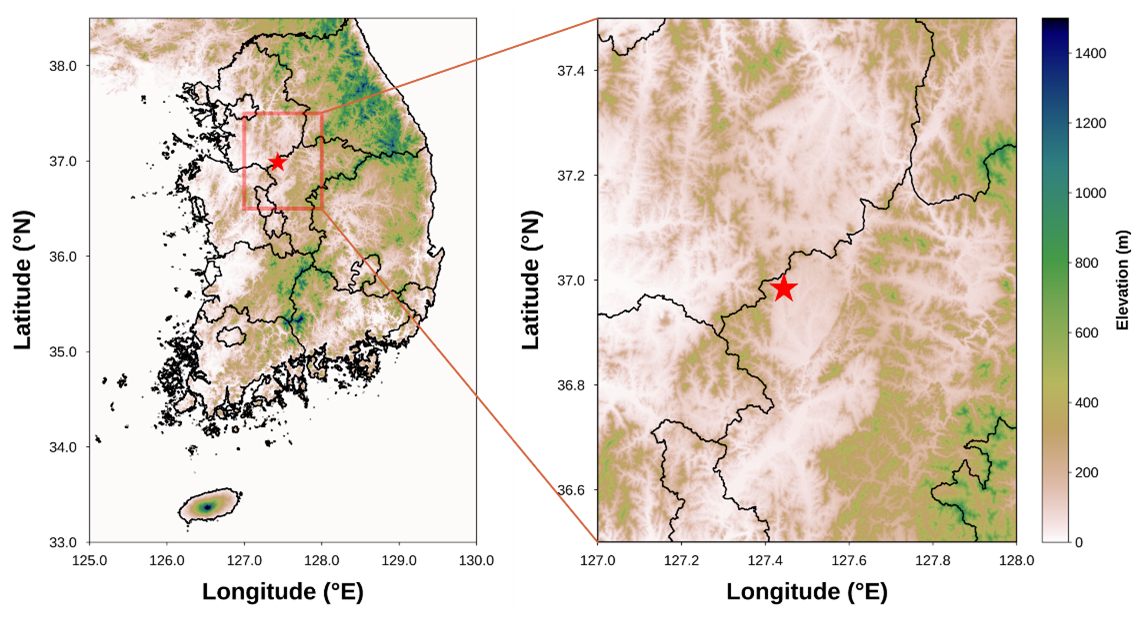
Figure 1Location of ground observation station.
In this study, we evaluated the QC method applied to disdrometer data under varying precipitation conditions. To achieve this, we collected and analyzed regional observational data that accounted for the environmental factors associated with rainfall and snowfall. This study used data from a 2DVD installed at an observatory (Fig. 1) operated by the Weather Radar Center of the Korea Meteorological Administration. The integrity of the 2DVD data was corroborated through comparisons with measurements obtained from the tipping-bucket and weighing rain gauges. The analysis included observational data collected between January 2020 and February 2024.
2.1 Disdrometer
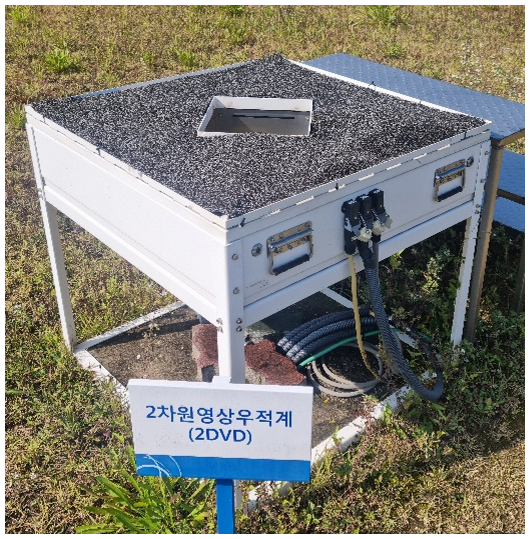
The 2DVD (Kruger and Krajewski, 2002) used for the validity analysis of the disdrometer was an optical disdrometer developed by Joanneum Research. This instrument operates by projecting light through a bulb across a designated observation area and capturing the intensity of the transmitted light using a camera positioned on the opposite side (Fig. 2). When a particle, such as a raindrop, traverses the observation area (10 cm2) illuminated by the light sheet, its diameter is determined by analyzing the reduction in the intensity and width of the light during its passage. Furthermore, the system employs two cameras to observe the particles from orthogonal angles, allowing the fall velocity to be calculated based on the differential height of the light sheet in the two orientations and time taken for the particles to descend. The 2DVD's capability to acquire diameter and fall velocity data for individual particles offers superior temporal, dimensional, and velocity resolution compared to traditional disdrometer data, which typically provide channel-based information. The observational resolution of the camera was approximately 0.2 mm (512 pixels), making the particles smaller than the indistinguishable threshold (Grazioli et al., 2014). For quantitative validation using rain gauge data, the output time resolution was configured to one minute, with data classified at one-minute intervals.
2.2 Rain gauge
Precipitation can occur in liquid droplets and solid particles, such as snow and graupel, when temperatures are at or near 0 °C. To validate the disdrometer data under Tw conditions, an analysis was conducted using data from the tipping-bucket and weighing-type rain gauges (Fig. 3). Each type of rain gauge offers an observational resolution of 0.1 mm and a temporal resolution of 1 min. Both instruments were positioned within a 10 m radius of the 2DVD disdrometer.
Ding et al. (2014) argued that precipitation types such as rain, snow, and sleet co-occur when the Tair or Tw approaches or falls below 0 °C. They recommended using Tw as a more effective criterion for distinguishing between types of precipitation instead of relying solely on Tair. In this study, the temporal resolution of the temperature data differed from that of previous studies, which employed different temporal resolutions. To facilitate objective verification of the applicability of Tw, Tair and Tw were employed as criteria for classifying precipitation types, and a comprehensive analysis was conducted.
3.1 Pre-processing of disdrometer data
A common QC approach for disdrometer data involves excluding non-meteorological data by analyzing fall velocity. In numerous studies (Kruger and Krajewski, 2002; Jaffrain and Berne, 2011; Raupach and Berne, 2015; Kim et al., 2019), this QC process was implemented by establishing a threshold determined by the terminal velocity, as indicated in Eq. (1).
where Vmeasured and Videal represent the observed particle fall velocity (in m s−1) and empirical fall velocity (or terminal velocity), respectively. Constant C denotes the setting constant, which indicates the percentage of the terminal velocity. The proportion of the removed particles may fluctuate based on the value of C. Numerous previous studies have provided validation results using various setting constants. Studies that employed 2DVD data (Kruger and Krajewski, 2002; Thurai and Bringi, 2005; Chang et al., 2009; Wen et al., 2018) predominantly adopted a setting constant of 0.4 (40 %) during data processing. Studies that employed PARSIVEL data for analysis frequently applied a setting constant of 0.6, accounting for 60 % of the cases (Jaffrain and Berne, 2011; Friedrich et al., 2013; Ji et al., 2019; Kim et al., 2019). Given that previous studies have encompassed various precipitation types, such as heavy rainfall, typhoons, orographic rainfall, and thunderstorms, the established 40 % and 60 % QC conditions can be regarded as reliable preprocessing criteria for rainfall events.
Raupach and Berne (2015) used data from a 2DVD instrument to derive correction factors for the drop-diameter channel in the PARSIVEL dataset. The fall velocity filtering technique employed for the 2DVD and PARSIVEL data involved the exclusion of particles exhibiting a terminal velocity exceeding 4 m s−1, as shown in Eq. (2), those with a fall velocity below 3 m s−1, as indicated in Eq. (3), and those larger than 7.5 mm, as shown in Eq. (4).
where D (in mm) is the diameter of the drop (or particle). This study involved a comparative analysis of the outcomes derived from the three QC methods based on fall velocity. Terminal velocity was determined using the equation established by Atlas et al. (1973) (Eq. 5).
Three QC methods were used to evaluate the research findings. Methods 1 and 2 are used for the ±40 % and ±60 % ranges of terminal velocity, respectively, whereas Method 3 is based on the approach proposed by Raupach and Berne (2015).
As the temperature decreased, various hydrometeors intermingled, resulting in a gradual reduction in the proportion of raindrops. Current QC methods are capable of eliminating low-density snow particles; however, to quantitatively compare and validate rainfall measurements obtained from rain gauge observations, particles that exhibit velocities below the threshold established for raindrops in each QC method are categorized as solid meteorological particles. In addition, analyses were conducted under the assumption that the solid particles melted and transformed into raindrops. This method aims to evaluate data from tipping-bucket rain gauges, which may exhibit diminished quantitative accuracy as the proportion of solid particles increases, and facilitate quantitative comparisons of rainfall observations derived from disdrometer data by implementing the QC method as the temperature decreases.
The equivalent-melted diameter (Deq) at which a snow particle can transition into a raindrop while preserving its mass was determined using Eq. (6), established by Delanoë et al. (2005). In this equation, ρ(D) (g cm−3) denotes the density of snow particles as a function of their diameter, while ρw (g cm−3) denotes the density of water. The density of the snow particles was computed based on the formula provided by Tiira et al. (2016) (Eq. 7).
3.2 Raindrop size distribution
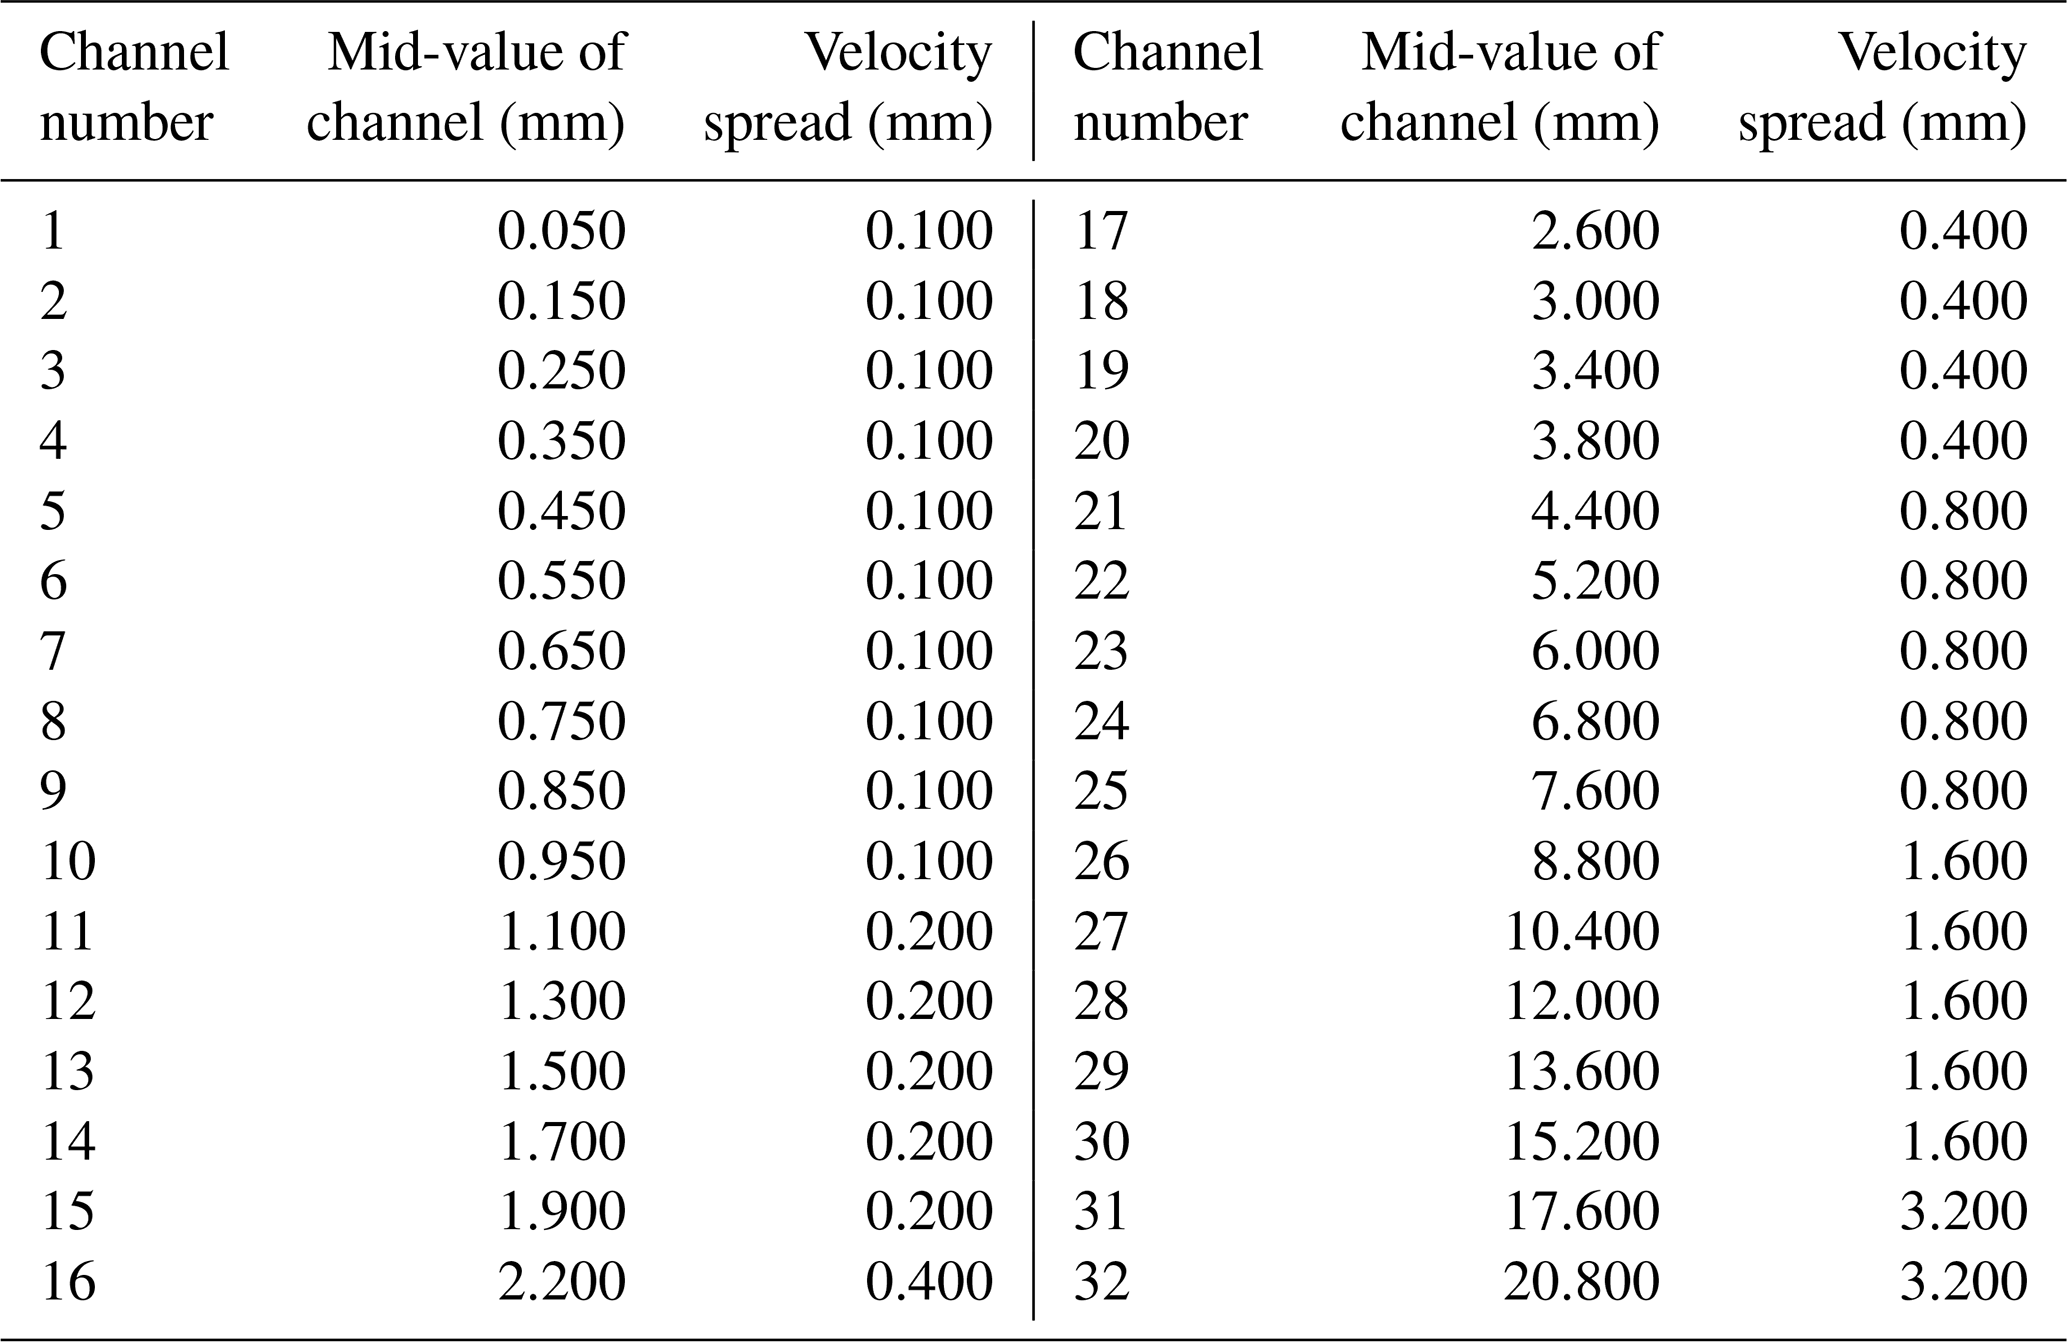
The 2DVD data can be configured to correspond to user-defined diameter bin sizes, which in turn influence the characteristics of the DSD output and the precision of the DSD model parameters (Marzuki et al., 2010). Consequently, this study aims to facilitate the analysis of PARSIVEL and 2DVD data for comparative purposes. To achieve this, 2DVD data were processed using the diameter channel information derived from the PARSIVEL data to compute the rain rate, number concentration, and DSD model parameters. Detailed information regarding the diameter and velocity channels of the PARSIVEL data is provided in the appendices (Tables A13 and A14). The rain rate (R, mm h−1) is calculated using Eq. (8), which incorporates the number concentration and fall velocity for each diameter. In determining the DSD model parameters after the rain rate calculation, data from intervals where the rain rate was 0.1 mm h−1 or greater were considered, thereby minimizing the uncertainty associated with the DSD model. The gamma model, recognized for its reliability in representing DSD characteristics, was selected for analysis. The gamma model is a widely used DSD model that enables the derivation of rainfall characteristics by capturing both the flatness and the overall shape of the number concentration distribution. This model (Eq. 9) is characterized by the shape parameter μ (Eq. 10), slope parameter Λ (mm−1) (Eq. 11), and intercept parameter N0 () (Eq. 12).
The DSD parameters were derived from the nth moment (Mn), as indicated in Eq. (13), along with the η value, computed based on Mn as shown in Eq. (14).
3.3 Wet-bulb temperature
Data from an Automatic Weather Station (AWS) installed at the observatory were used to compute the Tw. The Tair (in °C) and RH (in percentages) values derived from the AWS observations were incorporated into the Tw (in °C) calculation equation proposed by Stull (2011) (Eq. 15) to determine the Tw value. The term “atan” in Eq. (15) denotes the inverse tangent function. The temporal resolution of RH, Tair, and Tw was one minute, which was consistent with the temporal resolution of the disdrometer data.
4.1 Comparison of rainfall by the disdrometer pre-processing method
To validate the three QC methods employed for the disdrometer in this study, a comparative analysis was conducted between the rainfall measurements obtained from the disdrometer and those recorded by rain gauges. This comparison utilizes hourly accumulated rainfall data. Given that the QC methods for the disdrometer were specifically designed to address rainfall, the variable Tw was employed to differentiate between rainfall and snowfall, thereby facilitating the verification of precipitation type. Ding et al. (2014) argued that snow is infrequently detected when Tw exceeds 5 °C. Figure 4 shows the distribution of Tw during the analysis period, specifically for instances when the hourly average Tw was either above or below 5 °C. An examination of the one-minute Tw distribution during periods when the one-hour average Tw was 5 °C or higher (Fig. 4a) revealed a maximum Tw of 26.2 °C, with the highest proportion of values exceeding 20 °C. Conversely, the proportion of values falling below 5 °C was minimal, accounting for less than 5 %. These findings suggest that it is feasible to delineate rainfall periods using the hourly average Tw as a reference when comparing hourly accumulated rainfall values. In contrast, the distribution of one-minute Tw during hours when the average Tw was below 5 °C exhibited a broad range, with minimum and maximum Tw values exceeding 33 °C and a concentration of Tw values around 0 °C. This observation indicates notable variability in Tw under 5 °C or lower, suggesting that the observational area encompasses environmental conditions conducive to detecting diverse hydrometeors.
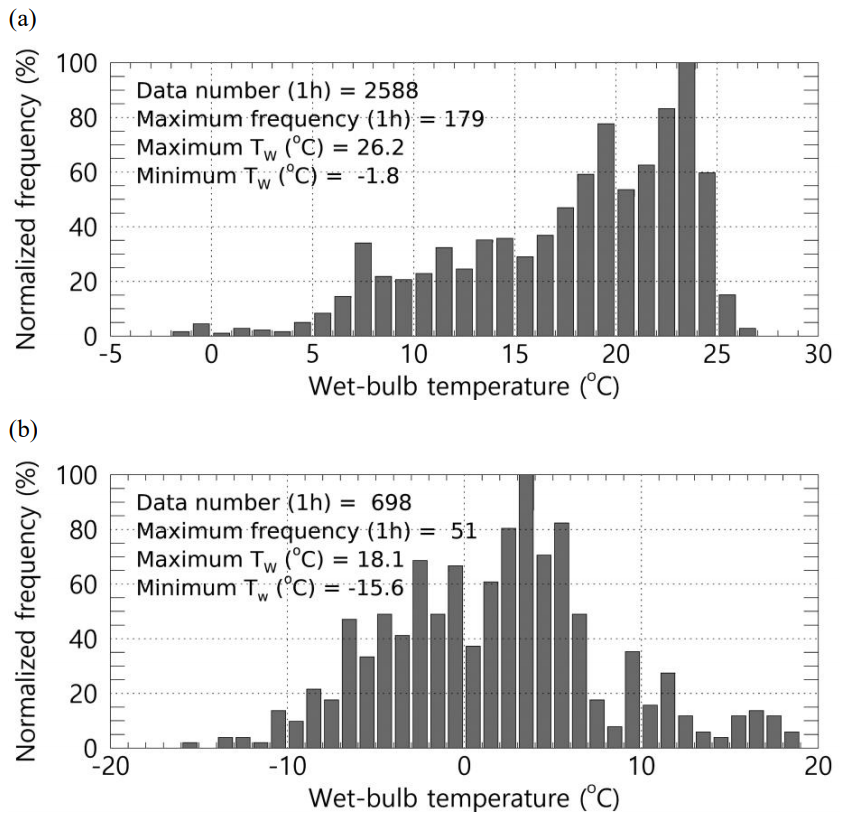
Figure 4Normalized frequency distribution of Tw during the analysis period (when the average hourly Tw is (a) Tw≥5 °C, (b) Tw<5 °C).
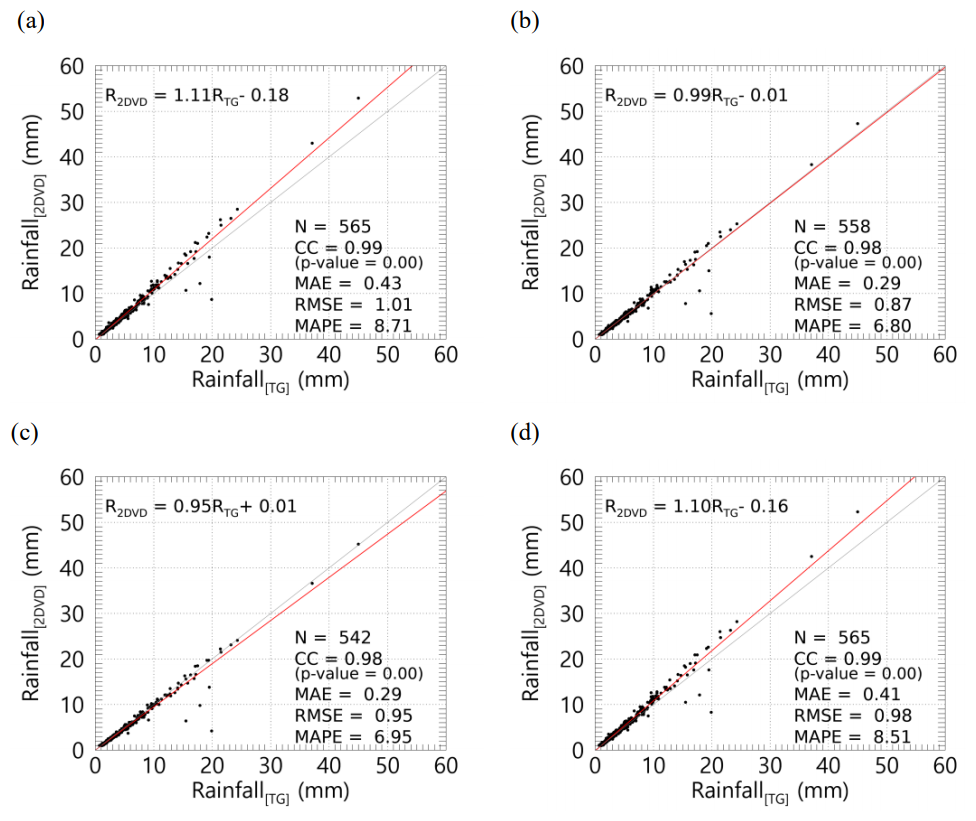
Figure 5Comparison of rainfall observed using the tipping-bucket rain gauge and 2DVD when Tw≥5 °C (a Unfiltered, b Method 1, c Method 2, d Method 3). R2DVD and RTG denote the rainfall obtained from the 2DVD and a tipping-bucket rain gauge, respectively.
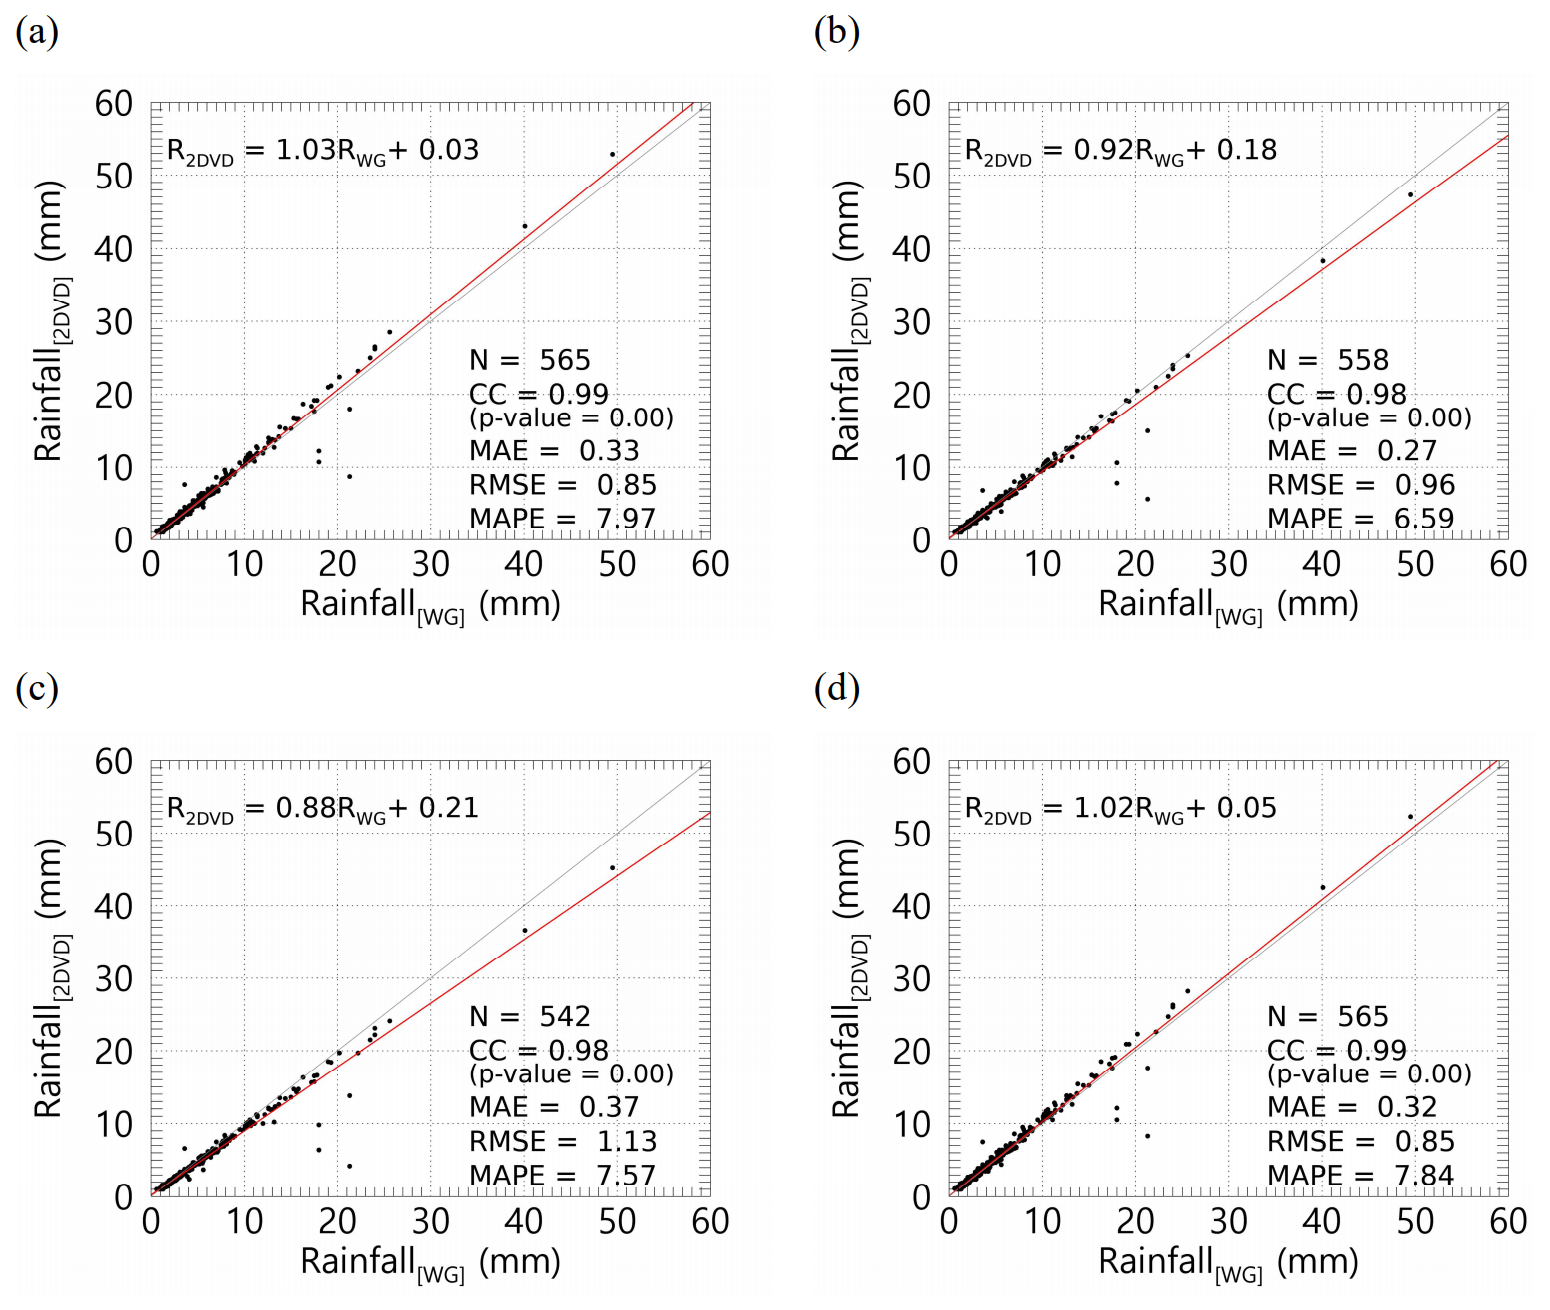
Figure 6Comparison of rainfall observed using the weighing rain gauge and 2DVD when Tw≥5 °C (a Unfiltered, b Method 1, c Method 2, d Method 3). RWG denotes the rainfall obtained from a weighing rain gauge.
Figures 5 and 6 presents a comparative analysis of hourly rainfall measurements obtained from the tipping-bucket and weighing rain gauge, specifically under conditions where the temperature (Tw) equals or exceeds 5 °C, alongside data from the 2DVD observations. The results derived from the unprocessed raw data were analyzed to evaluate the impact of the QC procedures. The findings indicated a strong correlation, exceeding 0.98, between the 2DVD and rain gauge measurements, with a regression line slope of approximately unity. However, the raw data tended to overestimate the 2DVD-derived rainfall estimates compared to the QC-processed results. This discrepancy in the overestimation of the 2DVD data can be attributed to variations in the conditions under which particles are eliminated, which is contingent on the specific QC method employed. Following the application of the QC methods, the mean absolute percentage error (MAPE) demonstrated an overall reduction compared with the raw data, suggesting that all QC methods possess quantitative reliability for rainfall data, with a maximum reduction of approximately 2.1 %.
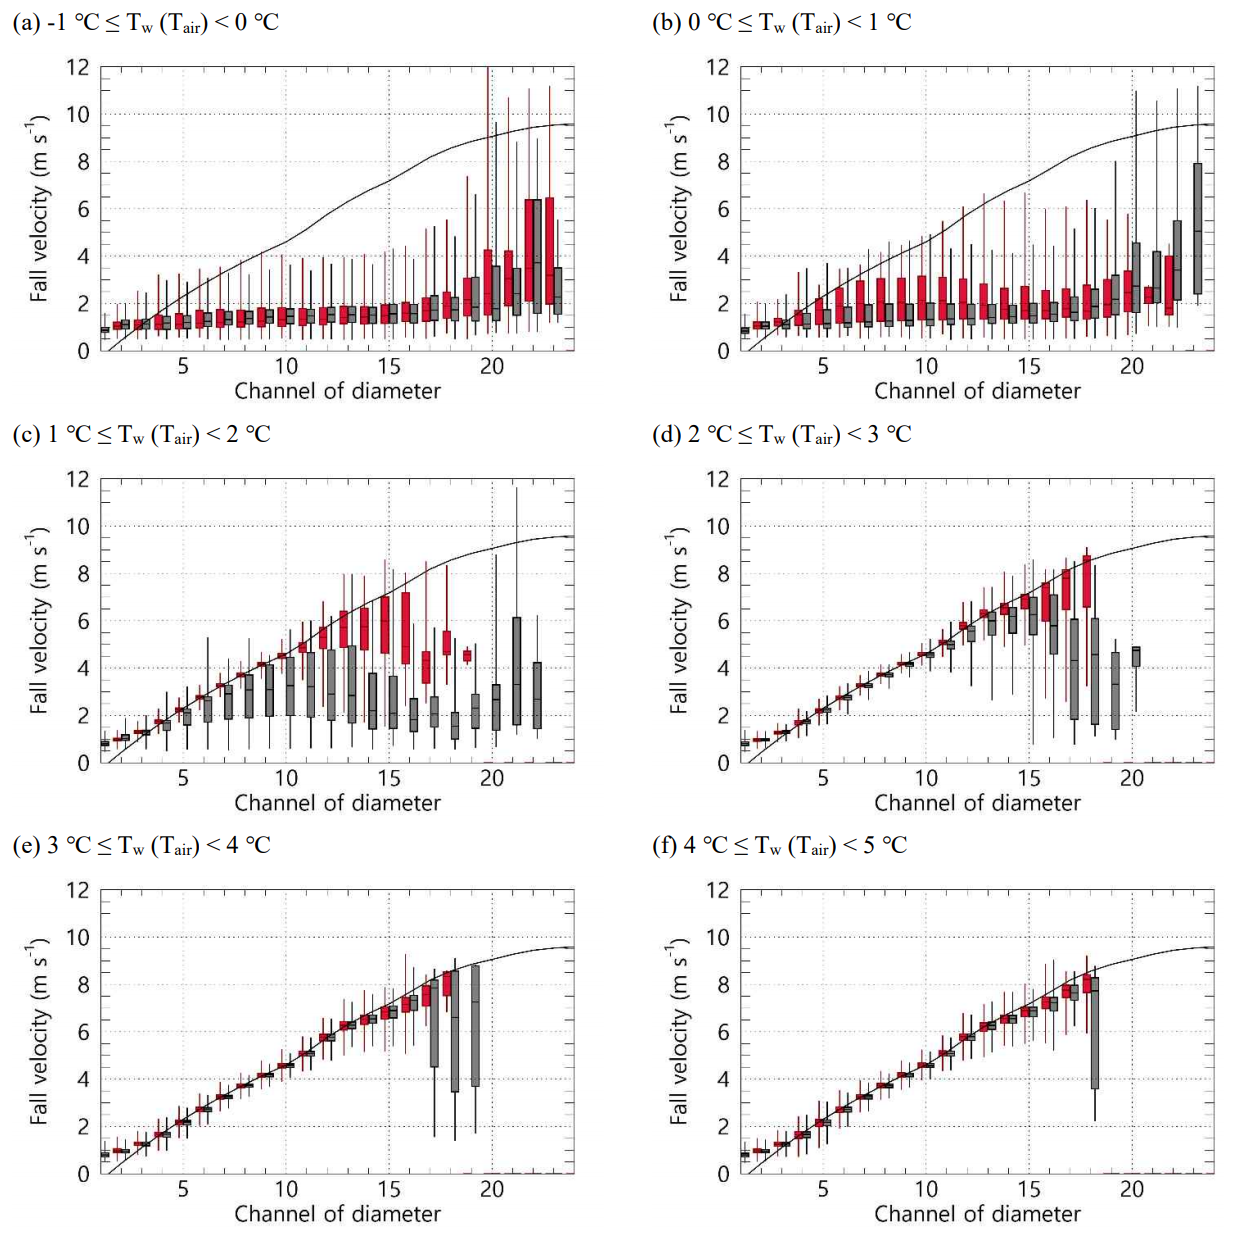
Figure 7Distribution of fall velocity by diameter channel based on Tw (red) and Tair (gray). The black solid line represents the terminal velocity of rain drops proposed by Atlas et al. (1973).
4.2 Fall velocity of particle by temperature and wet-bulb temperature
4.2.1 Fall velocity distribution at Tair and Tw
Figure 7 shows the distribution of the fall velocity with the diameter of precipitation particles (raindrops) under varying conditions of Tw and Tair. When the Tw and Tair ranged from −1 to 0 °C, the fall velocity distributions were relatively comparable. However, as the temperature exceeded 0 °C, the fall velocity for CH 4 to 18 increased under Tw conditions, while under the Tair condition, it exhibited values similar to those observed at temperatures below 0 °C (Fig. 7a and b). When Tw was below 0 °C, the upper 75 % value of fall velocity was less than 2 m s−1. However, as Tw increased above 0 °C, fall velocity increased to approximately 1 m s−1 or higher in the CH4–15 diameter range. Particularly in the CH8–11 range, the upper 75 % value exceeded 3 m s−1. Specifically, up to CH13, the fall velocity gradually increased with diameter, reaching large values exceeding 6 m s−1. Conversely, under Tair conditions, the upper 75 % fall velocity values for the CH1–15 range were 2 m s−1 or less in the 0–1 °C range. Under Tair conditions, the fall velocity increased when the temperature was above 1 °C. Notably, when the temperature rose above 1 °C, there was a notable increase in fall velocity; under Tw conditions, the distribution approached the terminal velocity of raindrops. Conversely, for diameters in the CH 12 or a higher range, the fall velocity remained at approximately 5.5 m s−1 despite increases in diameter. Under Tair conditions, the fall velocity increased when temperatures were above 1 °C. However, it remained lower than that observed under Tw conditions, with a broader distribution of fall velocities across the diameter channels (Fig. 7c). At 2 °C or higher temperatures, Tw and Tair conditions yielded fall velocity distributions that were close to the terminal velocity of raindrops, with an increasing trend in distribution as temperature increased (Fig. 7d–f). However, under Tair conditions, the fall velocity was notably low, remaining below 2 m s−1 for diameters of 3 mm (CH 17) or larger.
Figure 8 shows the variability in fall velocity with respect to the changes in temperature. Notably, despite Tw and Tair exhibiting similar numerical ranges, the distribution of fall velocity was considerably broader under Tair conditions. When Tw exceeds 3 °C, the standard deviation across all diameter intervals remains low, approximately 1 m s−1 or less. In instances where Tw ranges between 2 and 3 °C, an increase in distribution is observed for diameters of 2.5 mm or greater, while the standard deviation for diameters of 1 mm or more increases when Tw is between 1 and 2 °C. As temperature decreased, the range of diameters exhibiting increased fall velocity variability progressively expanded. According to the findings under Tair conditions, the standard deviation of fall velocity for diameters exceeding 1 mm begins to rise below 4 °C, with values surpassing 1 m s−1 for diameters greater than 2 mm. The observation that when Tair is between 2 and 3 °C, the standard deviation of fall velocity for diameters ranging from 3 to 4 mm is considerably increased, exceeding 2 m s−1 and reaching up to 4.5 m s−1 is noteworthy. This broad fall velocity distribution suggests a mixture of various hydrometeors, complicating the differentiation between rain and snow based solely on fall velocity. Consequently, subsequent analyses were conducted using Tw as the criterion for distinguishing between rain and snow.
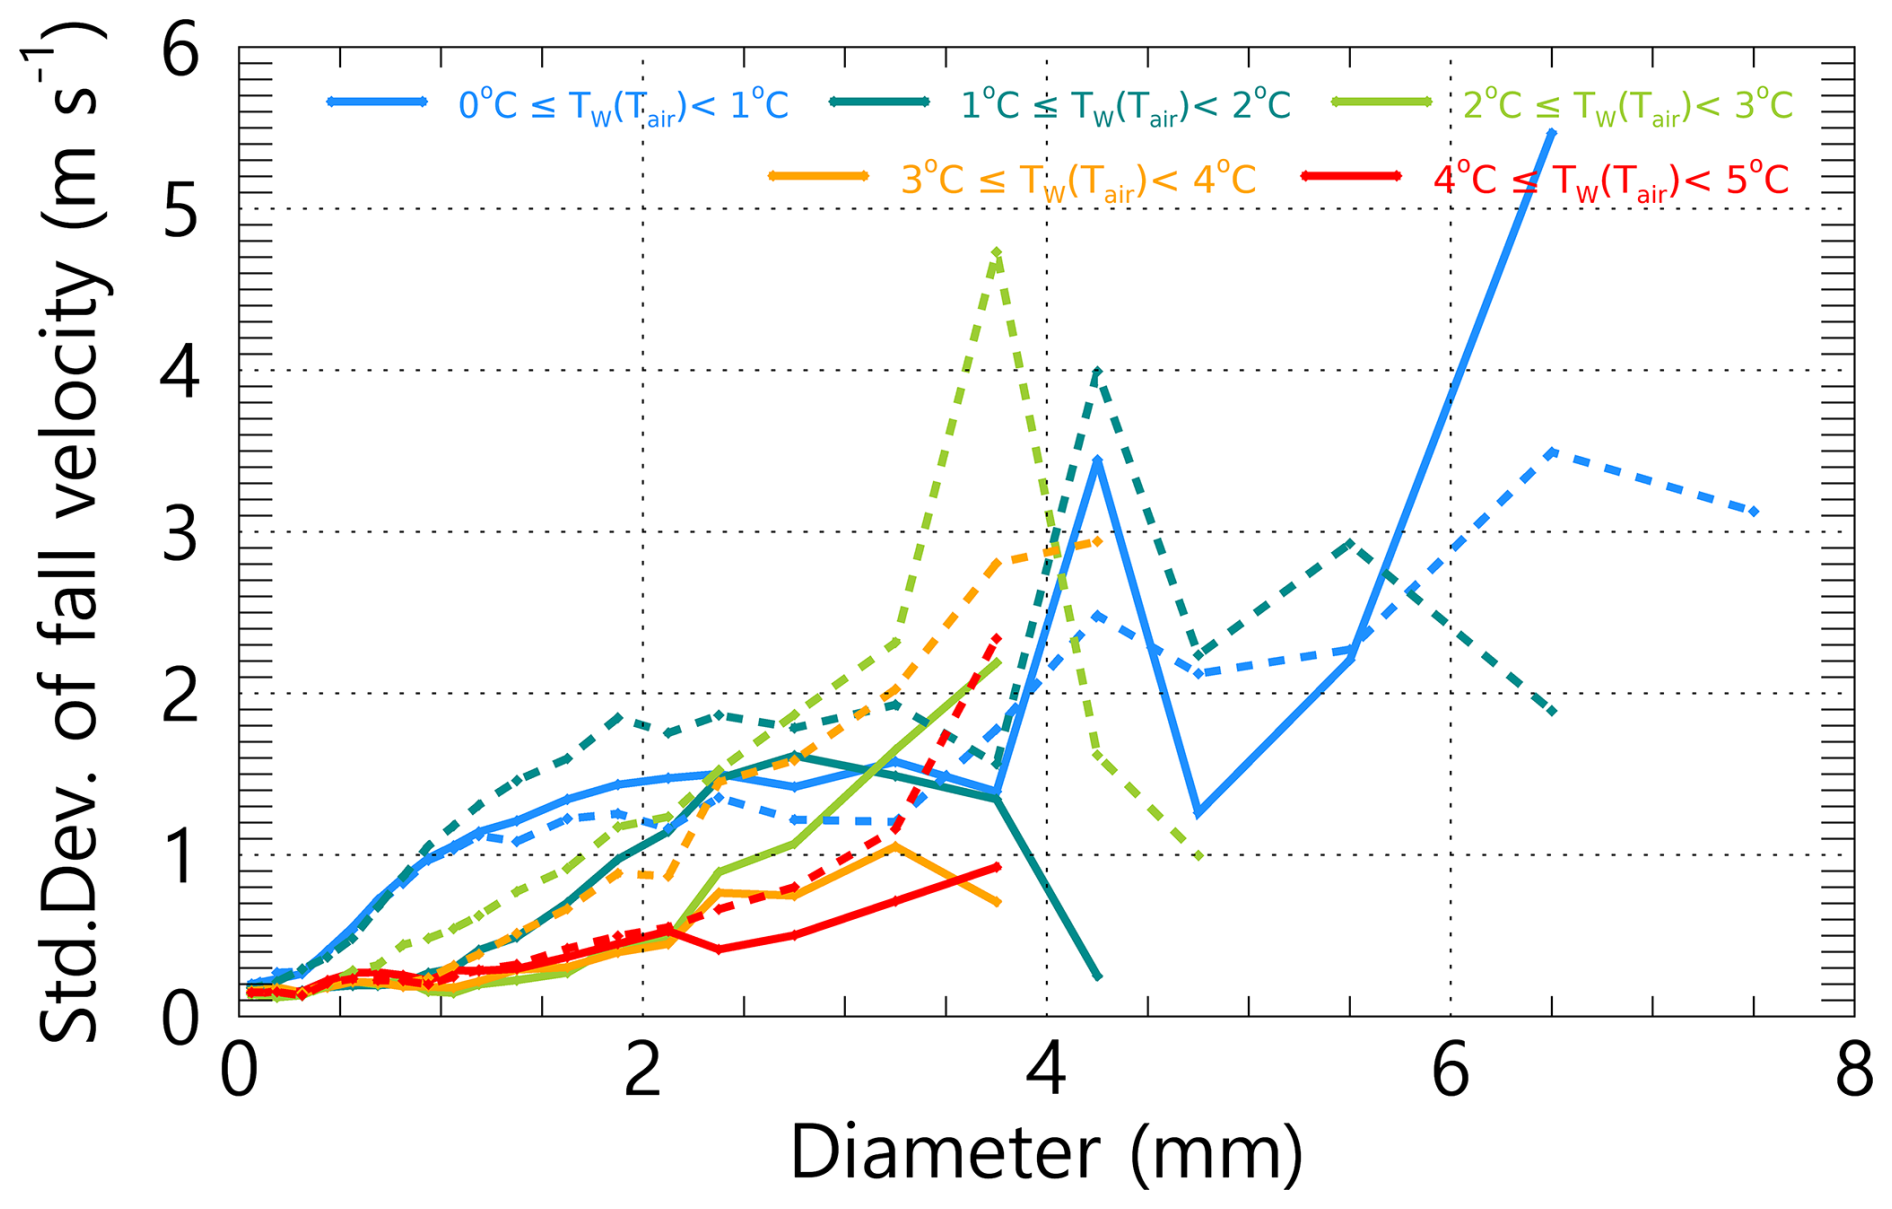
Figure 8Standard deviation of fall velocity by Tw (solid line) and Tair (dash line) range (1 °C interval).
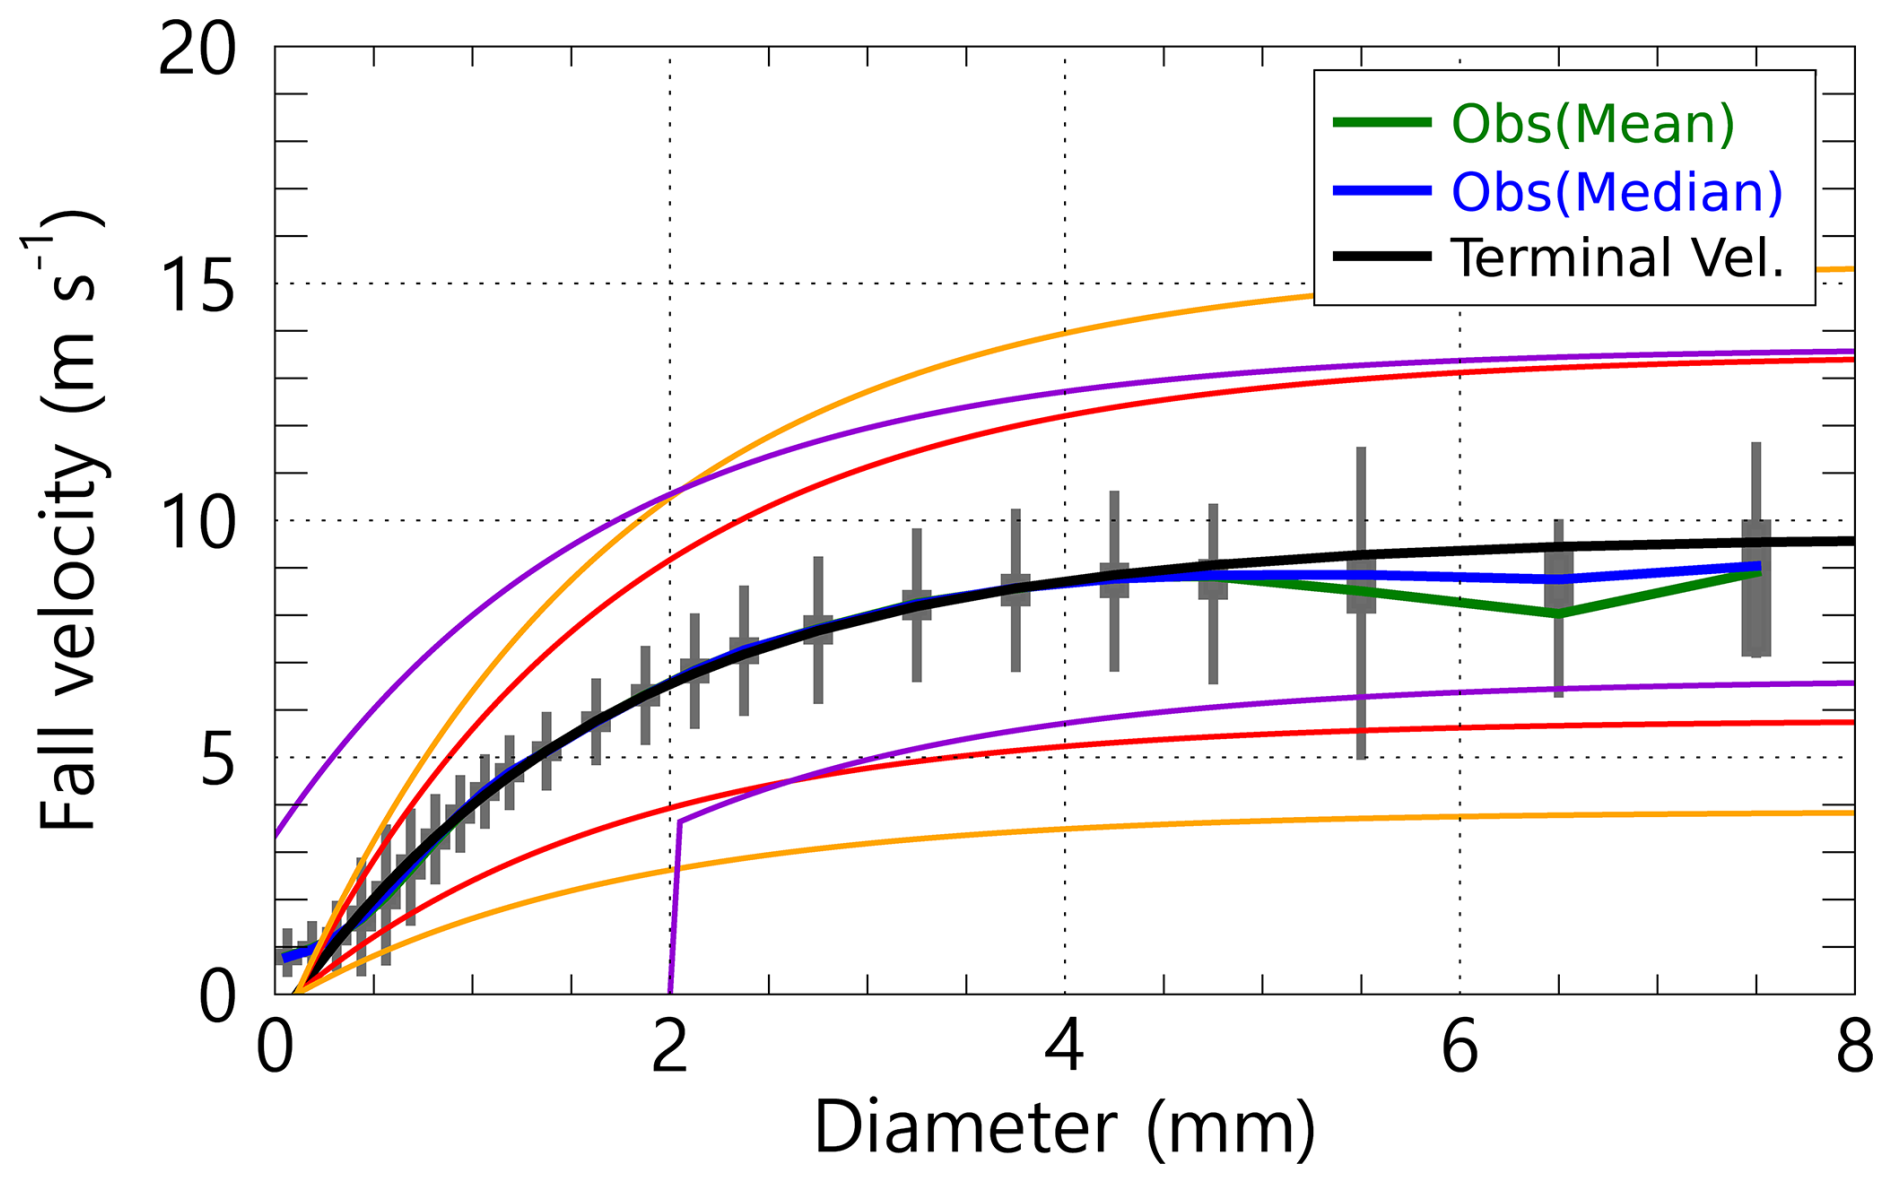
Figure 9Distribution of fall speed by diameter under conditions of Tw≥5 °C, and effective fall velocity of raindrops by pre-processing methods (The red (method 1), orange (method 2), and purple (method 3) solid lines represent the effective velocity of raindrop applied to each QC method).
4.2.2 Fall velocity distribution under rainfall condition
Figure 9 shows the distribution of fall velocities by diameter, derived from data collected when the Tw was at or above 5 °C. The central value of the fall velocity is consistent with the terminal velocity. This is within the range of fall velocities for raindrops, as established by the three different QC methods based on the fall velocity. It is important to note that precipitation particles (drops) may experience variations in their fall velocities owing to factors such as wind influence or collisions with obstacles during descent. The findings presented in Fig. 9 suggest that the observatory's measurements were not considerably affected by wind or obstacles, thereby confirming the reliability of the velocity observation data of the disdrometer.
An analysis of the fall velocity corresponding to temperature intervals (Tw) of 1 °C revealed that when Tw is at or above 2 °C, the fall velocities correspond with those typically observed for raindrops. Conversely, at Tw values between 1 and 2 °C, particles with diameters of 2 mm or less fall within the raindrop velocity range; however, as the diameter increases to 2 mm or more, the fall velocity diminishes, stabilizing at approximately 5 m s−1. Temperature conditions (Tw) may indicate a mixture of raindrops and snow particles. At temperatures below 1 °C, the fall velocity of droplets with diameters of 4 mm or less decrease to approximately 3 m s−1, exhibiting a low-velocity distribution of 5 m s−1 or less across all diameter ranges. This distribution suggests a higher proportion of solid (snow) particles when Tw is less than 1 °C.
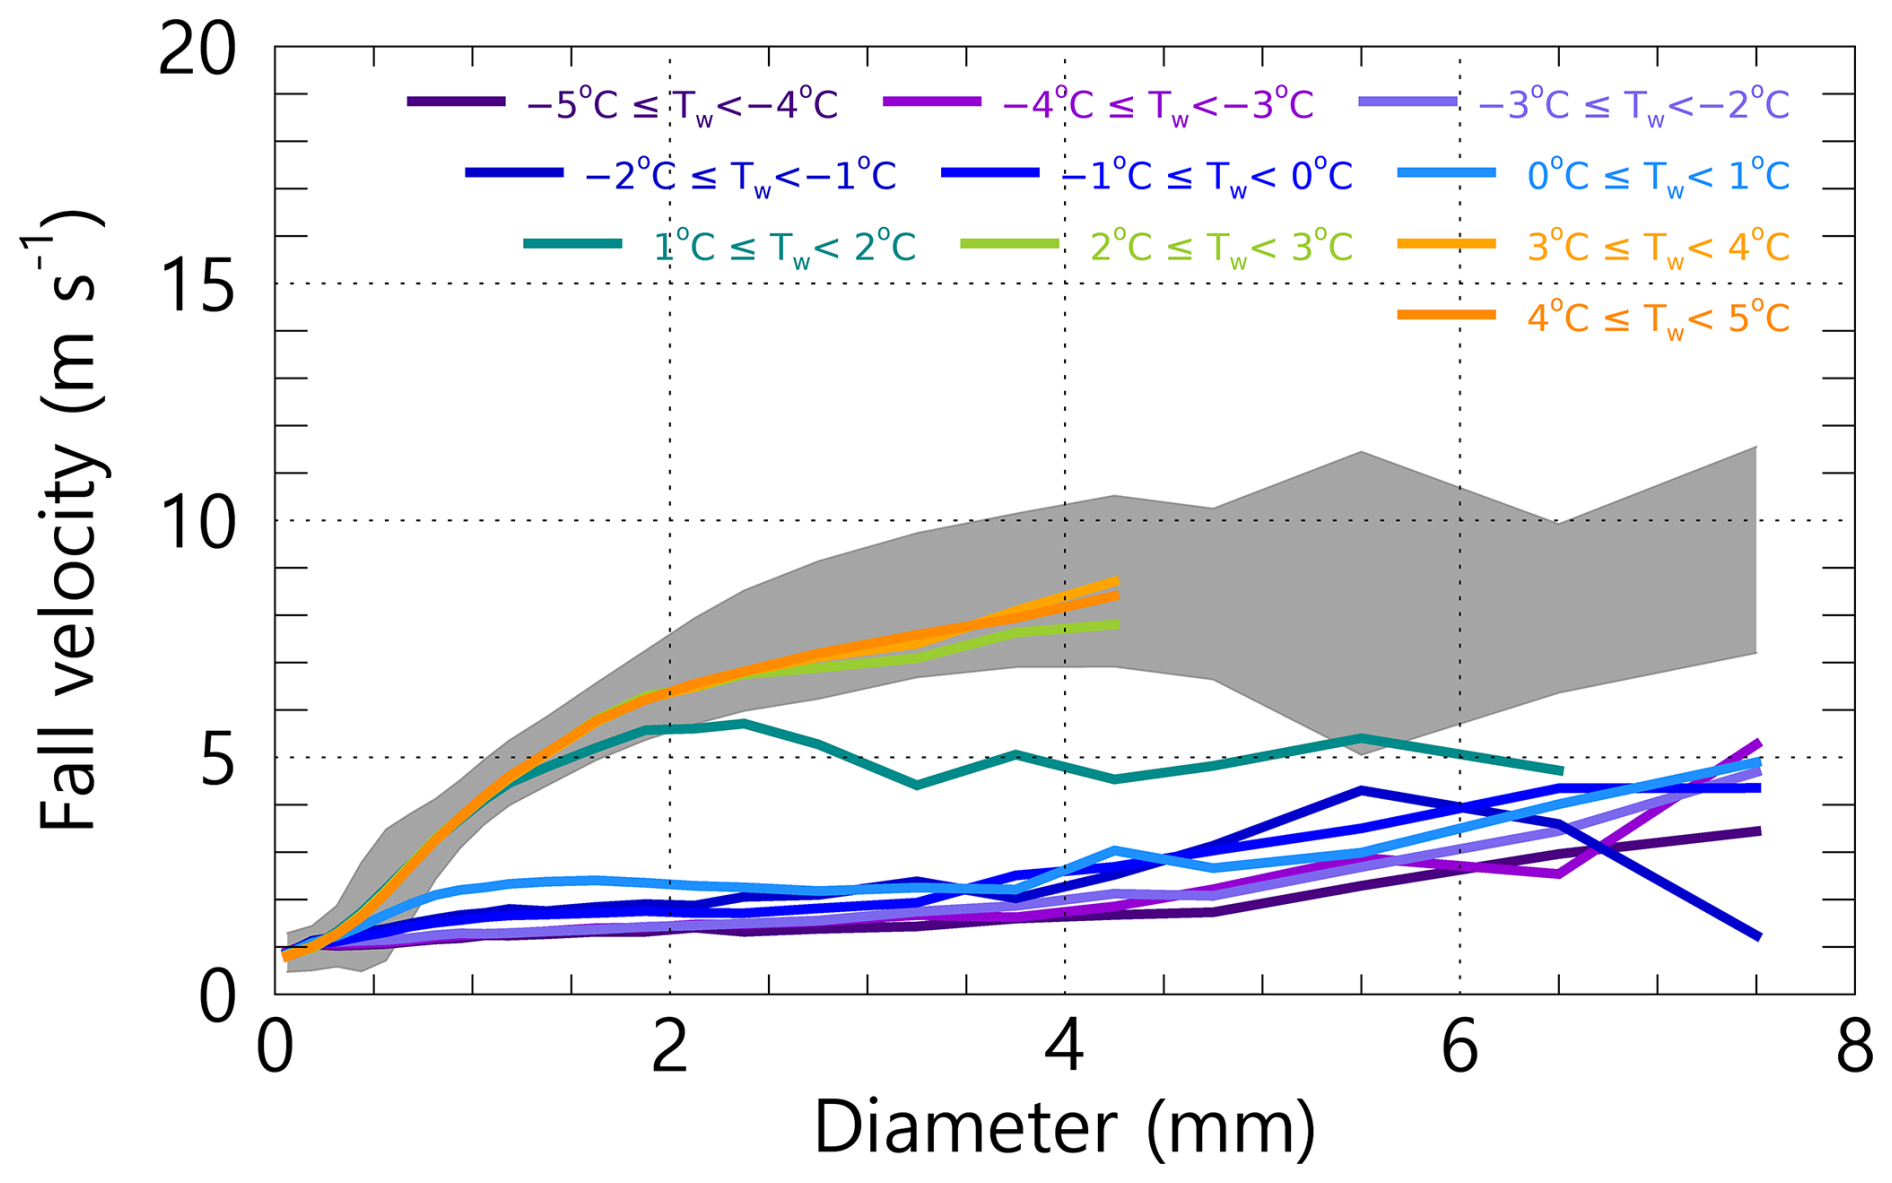
Figure 10Distribution of fall velocity by diameter in each Tw range. The grey area in the figure represents the Q1 (25 %) – Q3 (75 %) for the fall velocity by diameter when Tw≥5 °C.
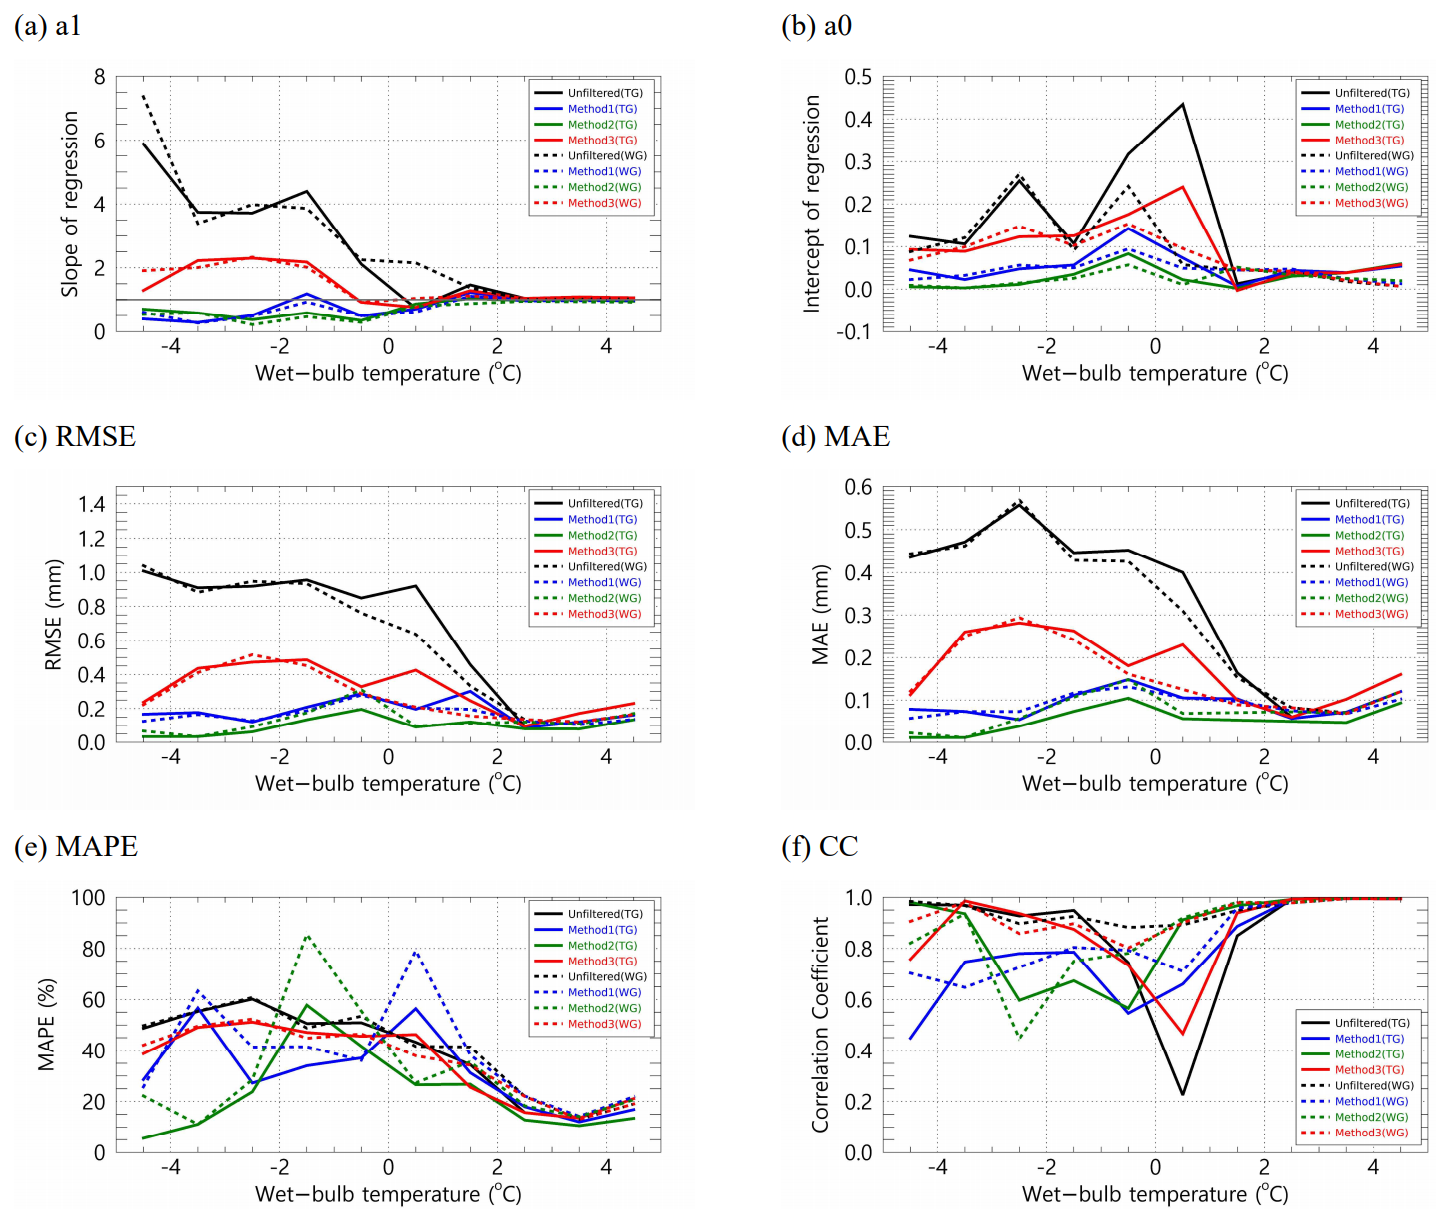
Figure 11Quantitative comparison of rainfall from a rain gauge (The solid line represents the tipping-bucket and the dash line represents the weighing rain gauge) and 2DVD by Tw (assuming that snow particles do not melt).
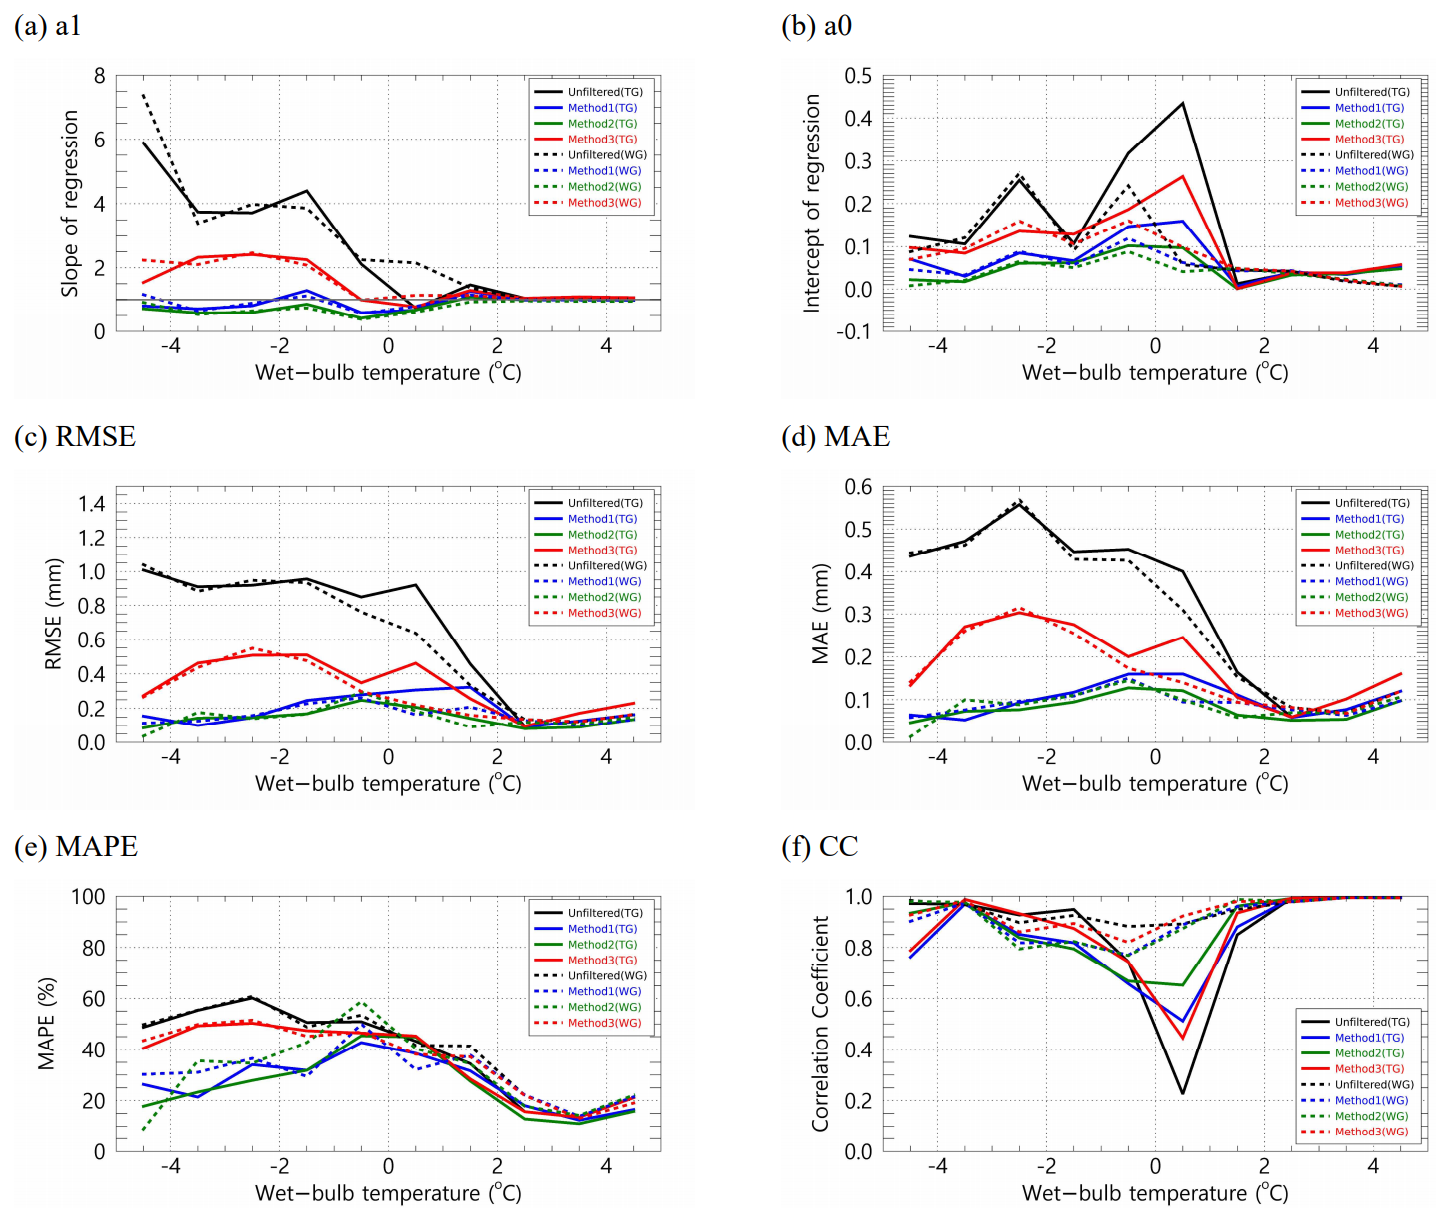
Figure 12Quantitative comparison of rainfall from a rain gauge (The solid line represents the tipping-bucket and the dash line represents the weighing rain gauge) and 2DVD by Tw (assuming that snow particles melt).
4.3 Accuracy of quantitative rainfall by wet-bulb temperature
Figures 11 and 12 show the outcomes of the comparative analysis and validation of rainfall measurements derived from the QC method applied to each Tw range, juxtaposed with the rainfall values obtained from a rain gauge. Figure 11 shows the results of applying the QC method, which effectively filtered out all particles except for raindrops. In contrast, Fig. 12 depicts the assumption that the particles exhibiting low fall velocities are snow that melts and transforms into raindrops. The verification metrics employed in this analysis included the Root Mean Square Error (RMSE), Mean Absolute Error (MAE), MAPE, Correlation Coefficient (CC), slope (a1), and intercept (a0) derived from Eq. (16), which is the first-order regression equation correlating rainfall measurements from the rain gauge and 2DVD.
The a1 of the observed relationship indicates that when the Tw exceeds 2 °C, the value remains close to one before and following the application of QC. However, as Tw drops below 2 °C, the value of a1 either increases or decreases. A value of a1 greater than one suggests that the rainfall measurements derived from the 2DVD instrument tend to overestimate the corresponding values obtained from the rain gauge observations. In contrast, a value of less than one indicates an underestimation. Notably, in the absence of QC, a1 increases to two or more at temperatures below 0 °C, with the extent of overestimation intensifying as Tw decreases. This phenomenon is particularly evident when validated against a tipping-bucket rain gauge, where values of two or greater were recorded at temperatures ranging from 0 to 1 °C. This observation may be attributed to the different operational principles of the various rain gauge types within the specified Tw range (Fig. 11a). At Tw below 0 °C, the unfiltered data and Method 3 exhibit a0 values exceeding one, while Method 2 and Method 3 present a1 values below one. This discrepancy can be interpreted as a consequence of the varying quantities of preprocessed particles. For Tw values of 1 °C or higher, a0 is observed to range between 0 and 1; however, as Tw declines below 1 °C, a0 experiences a rapid increase. Method 3, which uses a smaller filter area for unfiltered particles and those with diameters of 2 mm or less, demonstrates a0 values of 0.2 or higher, exceeding those of Methods 1 and 2 (Fig. 11b).
The CC decreases substantially in the Tw range, whereas a0 increases considerably (Fig. 11f). The RMSE and MAE were recorded at low values of less than 0.3 and 0.2 mm, respectively, when Tw was at or above 2 °C; however, these errors increased as Tw decreased to 1 °C or lower, with the magnitude of errors following the order of Unfiltered, Method 3, Method 1, and Method 2, which corresponds to the increasing trend of a1. In the range of 0 to 2 °C, the errors associated with results validated by the tipping-bucket rain gauge were greater than those from the weighing rain gauge (Fig. 11c and d). The MAPE exhibited its lowest error rate, below 20 %, at temperatures between 3 and 4 °C. It progressively increased with a decrease in Tw, ultimately reaching values of approximately 30 % or more at temperatures of 2 °C or lower.
Comparable findings were observed when it was assumed that the snow particles melted (Fig. 12), with an increase in error as the temperature (Tw) dropped below 2 °C. The distinction between melted and unmelted snow particles was demonstrated using a weighing rain gauge as a verification tool. In scenarios where the melted state was disregarded at Tw values lower than 2 °C, the variability in the MAPE and CC was substantial, which was contingent upon fluctuations in Tw. Conversely, the variability decreased when the melted state was considered, and the CC remained elevated approximately at 0.8 or above. The pronounced escalation in error within the 0–1 °C range can be attributed to precipitation detected by the 2DVD system that was not captured by the tipping-bucket rain gauge (Fig. A1f in Appendix).
Furthermore, the low volatility and high correlation observed in the verification results using the weighing rain gauge within the Tw range can be explained by incorporating raindrops and snow particles in the 0–1 °C range. By assuming melting of snow particles, both forms of precipitation can be integrated into precipitation calculations. The weighing rain gauge recorded precipitation values that accounted for the cumulative weight of all the raindrops and snow particles (Fig. A2f in the Appendix).
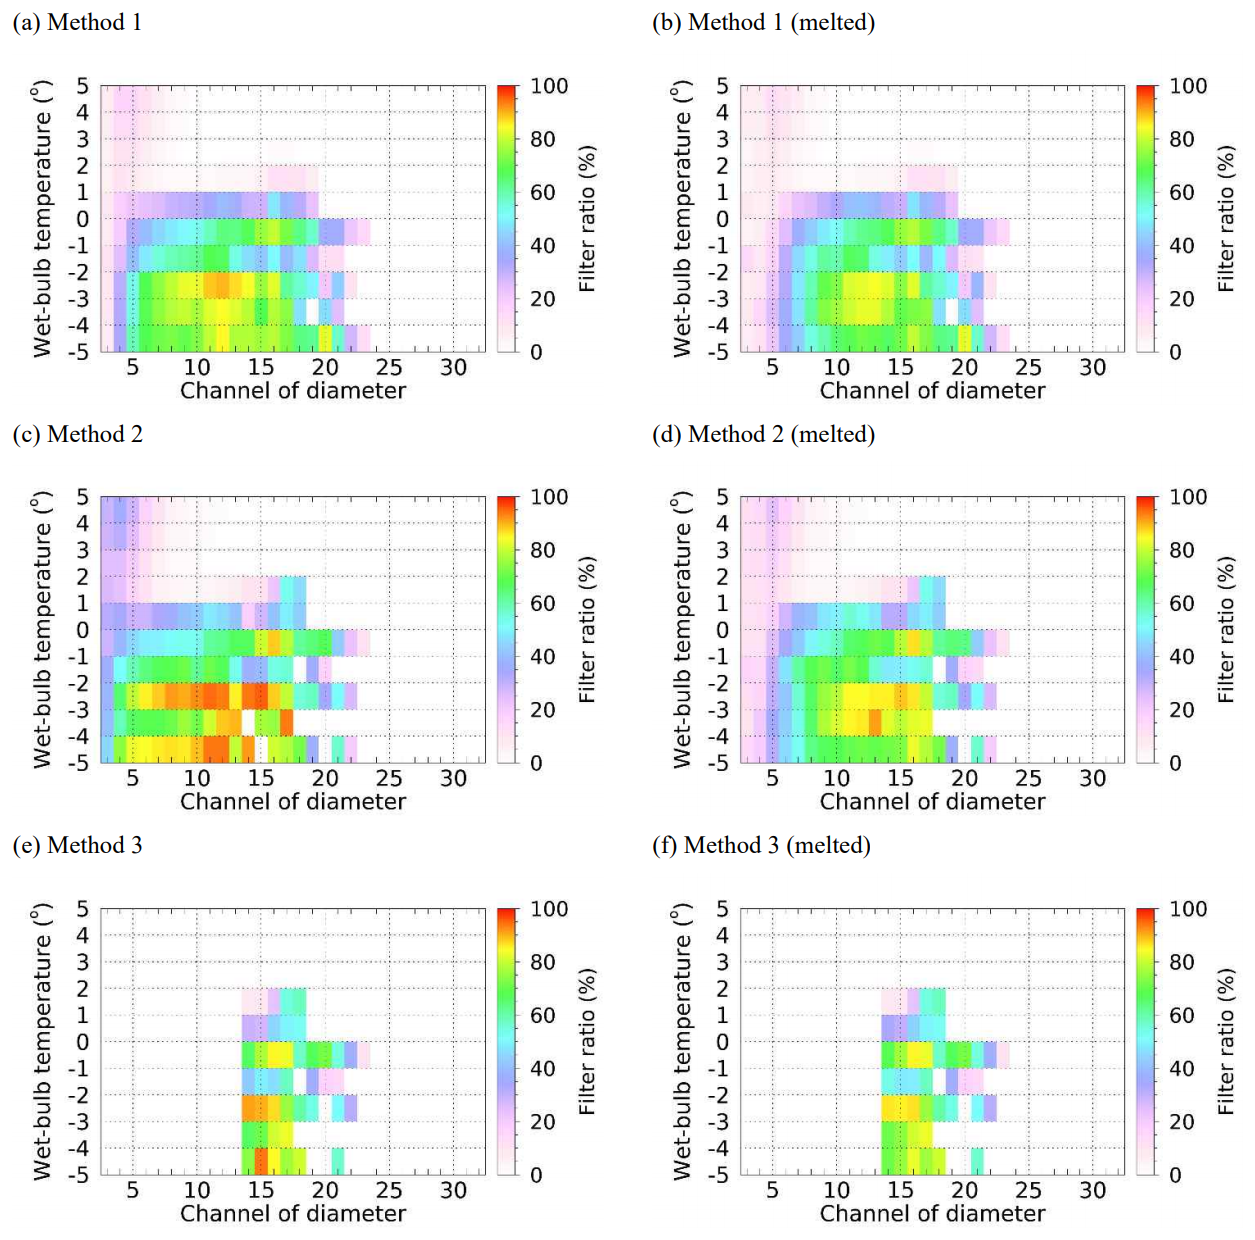
Figure 13Particle filter ratio by diameter channel for Tw according to the pre-processing method based on falling velocity.
4.4 Particle filter rate
Precipitation measurements obtained from the disdrometer were derived from raindrop (or snow particle) accumulation. The quantitative errors associated with these precipitation measurements were assessed by comparing the filter rates of raindrops (or snow particles) using the QC method. Figure 13 shows the filter ratios corresponding to the Tw range and channel diameter. The two methods, Method 1 and Method 2, exhibit differences in the range of removal velocities based on particle diameter (see Fig. 9); specifically, Method 2 encompasses a broader spectrum of raindrop sizes compared to Method 1, leading to an increased filter rate when the Tw is below 0 °C. Notably, the filter rate for Method 2 surpasses that of Method 1 at temperatures lower than −2 °C. Conversely, Method 3 did not allow the removal of particles smaller than 2 mm (as indicated in CH 14), regardless of their low fall velocity, resulting in a consistent filter rate of 0 %, irrespective of variations in Tw. This suggests that the number of particles smaller than 2 mm may be greater in Methods 1 and 2. Furthermore, the filter rate was lower when snow particles were assumed to have melted than when they had not melted. Nonetheless, for particles with a diameter of 1 mm or less, the filter rate ranged from approximately 10 % to 30 % when Tw exceeded 1 °C, which appears to be attributable to the removal of particles exhibiting a fall velocity that exceeds the raindrops.
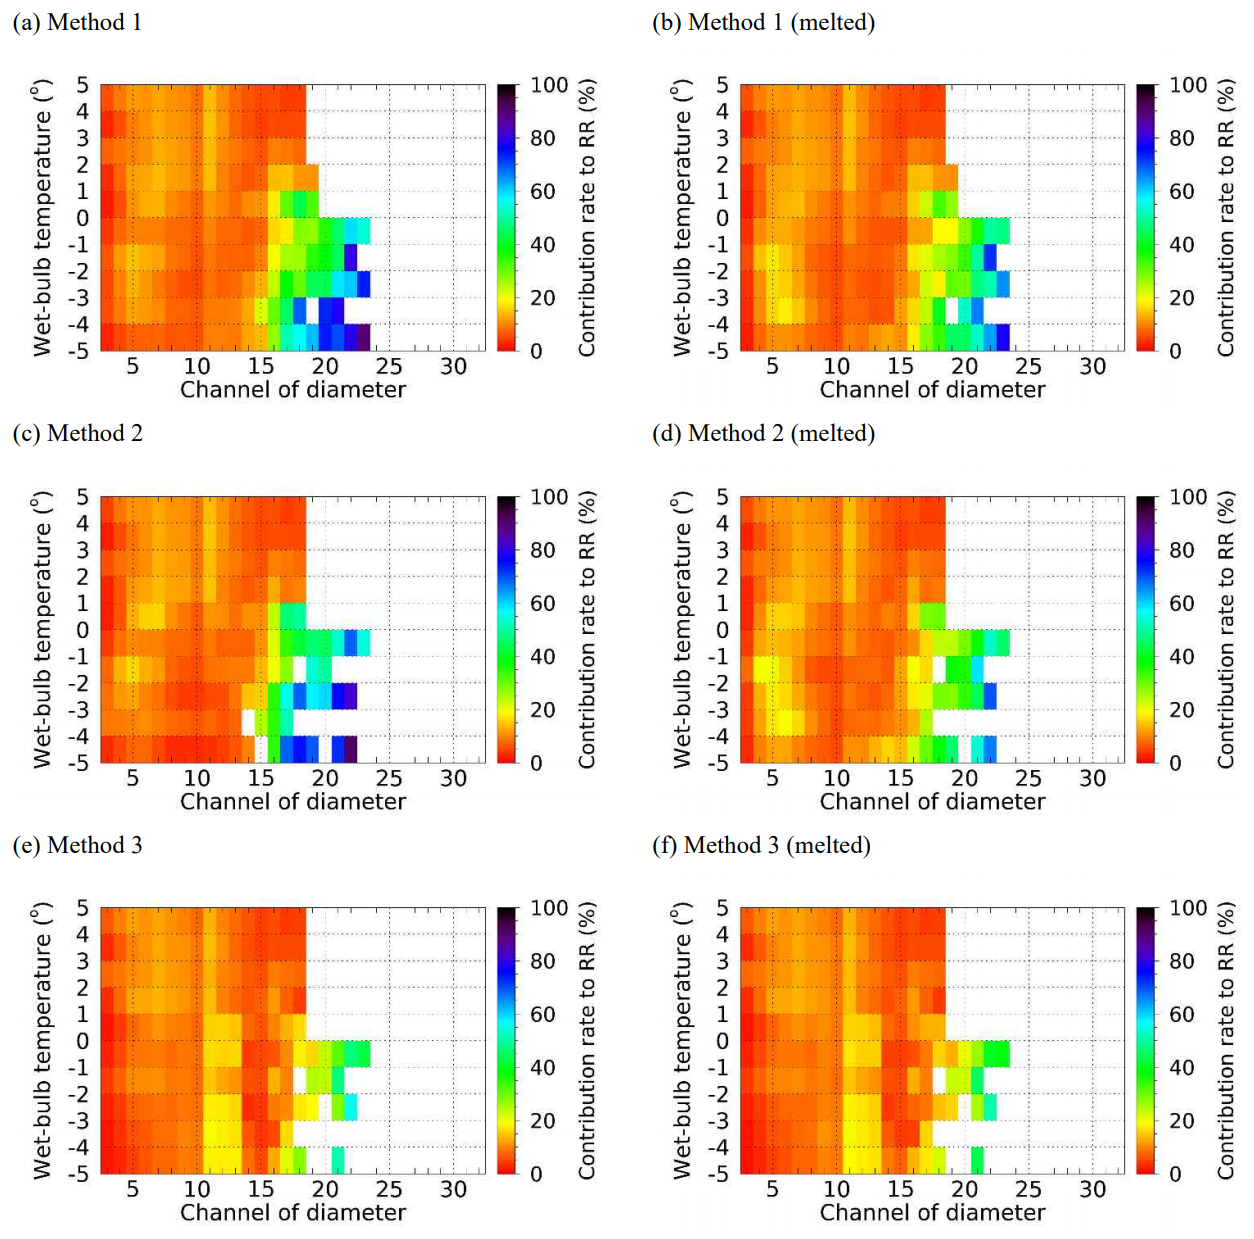
Figure 14Precipitation contribution rate by diameter channel for Tw using the pre-processing method based on falling velocity.
4.5 Contribution rate by particle diameter to precipitation intensity
Figure 14 shows the contribution rate of the number concentration by diameter to the precipitation intensity as derived from the disdrometer data. It is observed that when the Tw exceeds 1 °C, the contribution rate remains approximately 20 % or lower across all diameters. Conversely, when Tw is below 1 °C, the concentration of particles measuring 3 mm (CH 15) or larger considerably influences the calculation of precipitation intensity. The contribution rate of 1.25 to 1.75 mm diameter (CH 11 to 13) decreased when the temperature was lower than 1 °C. The decrease in the contribution rate of drops smaller than 3 mm and the increase in the contribution rate of larger drops was as a result of the decrease in the concentration of drops smaller than 3 mm through the QC process (Sect. 4.4), which increased the impact of relatively larger drops on the calculation of precipitation intensity. This phenomenon can be attributed to the direct proportionality of the precipitation intensity to N(D) and D3, indicating that an increase in the particle diameter substantially affected the results. After QC, a substantial increase in the contribution rate for a specific diameter may affect the precipitation intensity owing to a decrease in the concentration of drops in the diameter range with a lower contribution rate.
In scenarios where it is assumed that snow particles have melted, the diameter of these particles decreases, increasing the concentration of smaller particles. As a result, the contribution rate of diameter from approximately 0.5 to 1 mm (CH 5 to 10) increased. Notably, in Method 3, there was a minimal removal of particles smaller than 2 mm, which resulted in negligible differences between the scenarios that accounted for the melted state of snow particles and those that did not.
4.6 Drop size distribution
4.6.1 Number concentration calculated by applying QC methods based on Tw
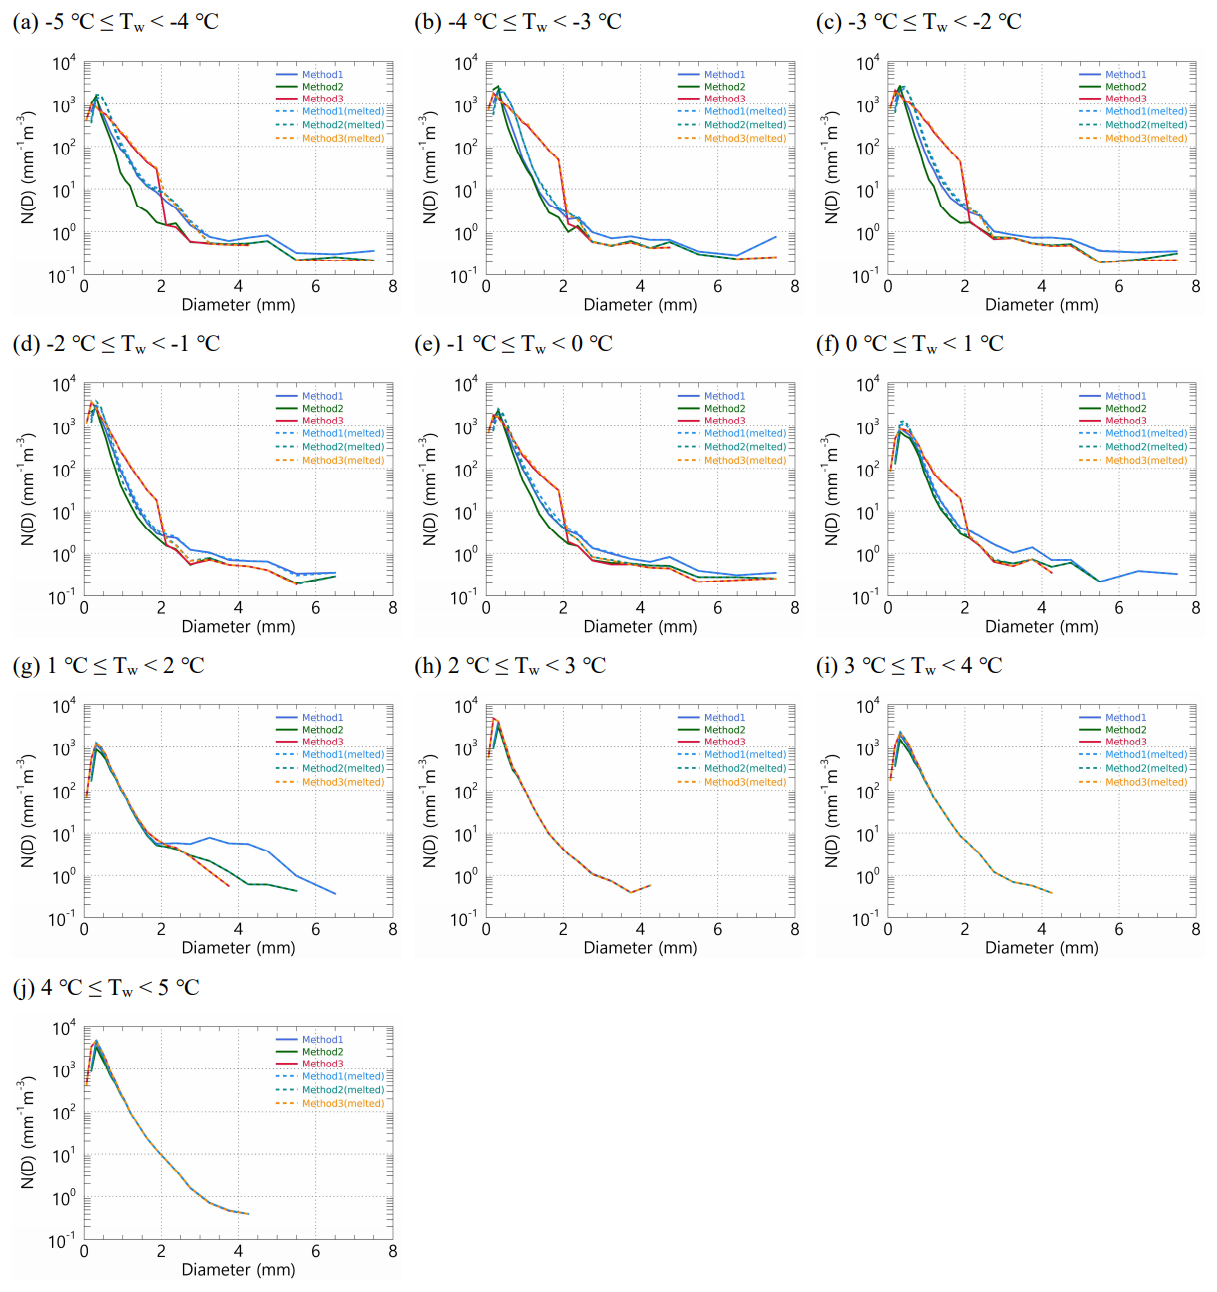
The precipitation intensity derived from disdrometer data is contingent on the number concentration; therefore, examining the distribution of the number concentration is imperative. Figure 15 shows the average distribution of the number concentration obtained by applying the QC method under varying Tw conditions. Notably, when the temperature exceeded 2 °C, the distributions yielded by all QC methods were comparable. Method 3 exhibited a relatively high concentration of small droplets measuring 1 mm or less, whereas the number of droplets measuring 1 mm or more showed minimal variation (Fig. 15h). This finding indicates that, at temperatures above 2 °C, the output values remain consistent across different QC methods.
At temperatures ranging from 1 to 2 °C, the distribution of particles exceeding 2 mm in size was distinctly differentiated according to the QC method employed. This finding suggests that the fall velocity of particles larger than 2 mm exhibits considerable variation within this temperature interval (Fig. 10). Conversely, at temperatures below 1 °C, the distribution obtained through Method 3 displayed an anomalous pattern. This irregularity can be attributed to the failure of Method 3 to exclude snow particles smaller than 2 mm, leading to a higher concentration than that of the other QC methods. When considering the scenario in which particles are assumed to have melted, an increase in the concentration of water was observed for particles with a diameter of 1 mm or less when the Tw was between 0 and 1 °C, while the concentration of particles larger than 2 mm remained relatively unchanged.
In comparing scenarios where particles are assumed to have melted versus those that are not, no notable differences were observed at temperatures exceeding 1 °C (see Fig. 15g). However, within the temperature range of 0 to 1 °C, there was an increase in the number of particles smaller than 1 mm. There was a similar distribution in the number of medium and larger particles (1 mm or more). As the Tw progressively decreased below 0 °C, the disparity in the number concentration of particles larger than 1 mm became more pronounced (Fig. 15a–e).
4.6.2 Difference in the number concentration based on the gamma model
The change in the shape of the number concentration within the observed data has implications for DSD model parameters. The notable discrepancy between the observed number concentration and that derived from the model parameters raises concerns regarding the reliability of the DSD model.
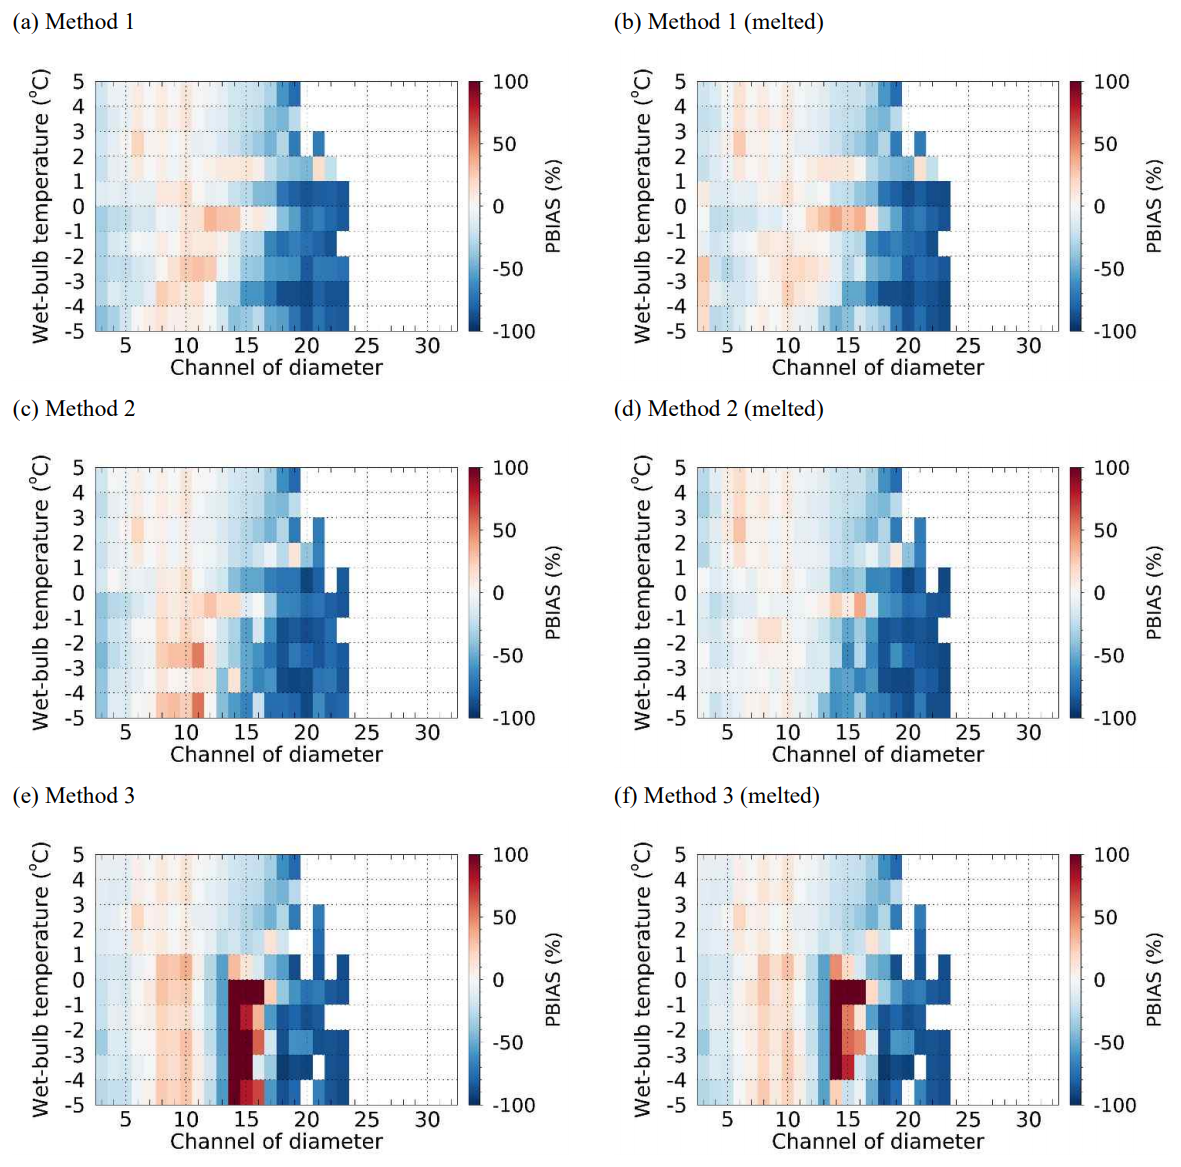
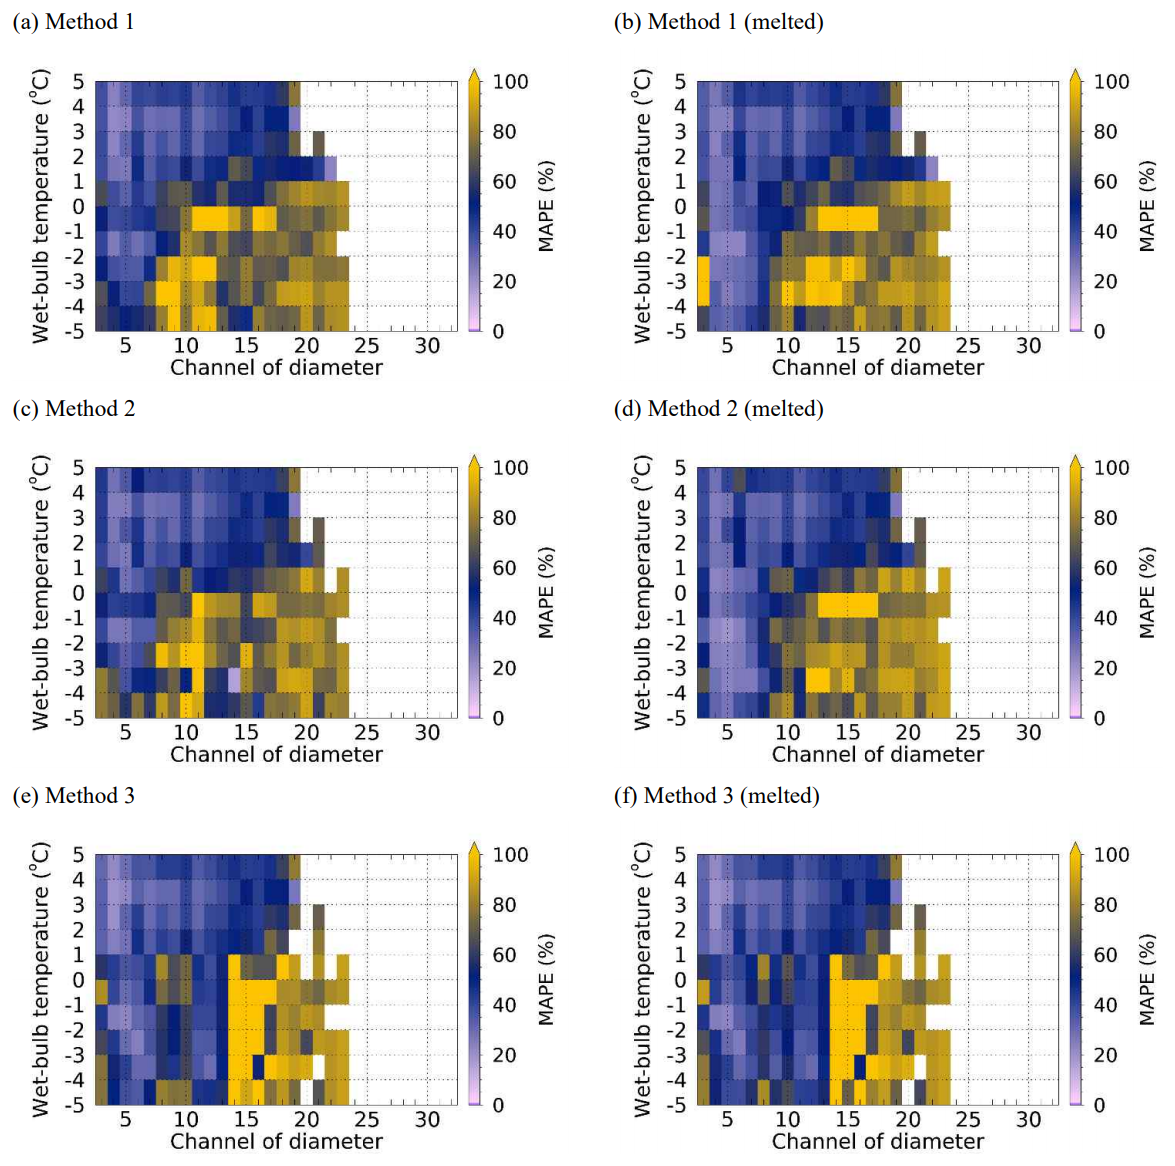
Figures 16 and 17 show the variance between the observed number concentration and that predicted using the gamma model. When all QC methods were implemented, the MAPE remained below 60 % across all diameter ranges at temperatures exceeding 2 °C. However, as the Tw fell below 1 °C, the discrepancy for diameters greater than 0.6 mm (CH 7) escalated to over 70 %. At 2 °C or higher temperatures, the gamma distribution overestimated the concentration of particles smaller than 1 mm while underestimating those larger than 1 mm. Nonetheless, the extent of under- or over-simulation by gamma distribution remained below 50 % across all diameter intervals.
When Tw was below 1 °C, assuming that the snow particles had melted, the error rate in simulating the concentration of particles smaller than 1 mm (CH 8) diminished (Fig. 16b and d). Concurrently, the percentage bias (PBAIS) for particle diameters less than 1 mm decreased, approaching a value near zero (Fig. 17b and d). This phenomenon can be attributed to the application of the QC method under subzero conditions, which led to an overestimation of the gamma distribution for diameters of 1 mm or less because of the increased influence of smaller particles resulting from the exclusion of larger particles exceeding 3 mm. Conversely, this resulted in an underestimation of the gamma distribution for diameters larger than 3 mm.
This study employed data collected from a 2DVD disdrometer in conjunction with traditional rain gauges to assess the precipitation measurements derived from the disdrometer under Tw conditions and to evaluate the reliability of the DSD model. Precipitation estimates derived from the quality control (QC) techniques implemented in this study exhibited a correlation coefficient of 0.98 or higher and an error rate of approximately 8.5 % compared to precipitation measured by rain gauges under conditions where Tw was above 5 °C. Additionally, the QC-processed precipitation data mitigated the overestimation present when QC methods were not applied to the disdrometer data. These findings indicate that QC methods demonstrated high reliability under rainfall conditions.
When both Tair and Tw were below 1 °C, the fall velocity of precipitation particles decreased significantly, with most velocities ranging from 0.5 to 3 m s−1. This reduction results from a higher proportion of snow particles, which have a lower density than raindrops. These results are consistent with Ding et al. (2014), who reported that the proportion of raindrops decreases to less than 30 % at temperatures below this threshold. When Tair ranged from 1 to 3 °C, the distribution of fall velocities was broader compared to cases where Tw was within the same interval, and deviations from the terminal velocity of raindrops were more pronounced. Therefore, hydrometeor classification during the QC process of disdrometer data should employ Tw as the primary environmental parameter for fall velocity analysis. This approach reduces errors in particle removal related to fall velocity distribution and improves the reliability of long-term rainfall measurements. As Tw decreased below 2 °C, quantitative precipitation errors increased because the filter ratio for particles of 3 mm or less rose to 30 % or higher. In this temperature range, the likely coexistence of raindrops and solid particles reduces the reliability of conventional rainfall quality control methods. When snow particles are assumed to have melted, the correlation coefficient approached 0.9 even within the 0 to 1 °C range, and error variability decreased. These findings indicate that precipitation calculation reliability can be maintained under mixed-phase conditions (0 to 2 °C) if an appropriate snow particle density is applied. Verification of precipitation using a weighing rain gauge is recommended when Tw falls below 2 °C.
For DSD characteristics, the DSD shape remained consistent across different quality control methods at Tw above 2 °C. Below 2 °C, Method 1 (±40 % terminal velocity criterion) resulted in a higher number concentration of drops larger than 2 mm. In contrast, below 1 °C, Method 3 (Raupach et al., 2015) produced a pronounced, irregular distribution of number concentrations for diameters of 1 to 2 mm. These distortions in DSD shape, which depend on the quality control method, raise concerns regarding the reliability of derived DSD parameters. Consequently, only disdrometer data collected at Tw above 2 °C should be used to calculate DSD parameters and DSD-based rain rates.
Ensuring the reliability of dual-polarimetric radar-based quantitative precipitation estimation (QPE) parameterized by DSD characteristics is essential, given that DSD characteristics derived from disdrometer data vary with temperature. These temperature-dependent variations in DSD directly influence dual-polarimetric parameters and are likely to affect the QPE relationships used in radar-based precipitation estimation. Therefore, further research is required to investigate the impact of disdrometer data quality on QPE accuracy under different temperature conditions.
Figures A1 and A2 present the findings from a comparative analysis of hourly accumulated precipitation intensity, derived from observations using the 2DVD and two types of rain gauges (Tables A1–A6 represent the tipping-bucket type and Tables A7–A12 represents the weighing type) under the specified Tw interval conditions at 1 °C intervals. In each figure, the solid line denotes the regression line correlating the precipitation intensities derived by applying each quality control (QC) method. The constants and validation indices associated with the regression lines are listed in Tables A1–A12, respectively. Tables A13 and A14 provide details regarding the diameter and velocity channels used to calculate the number concentration based on 2DVD data. The channel information corresponded to the values employed in the PARSIVEL disdrometer data.
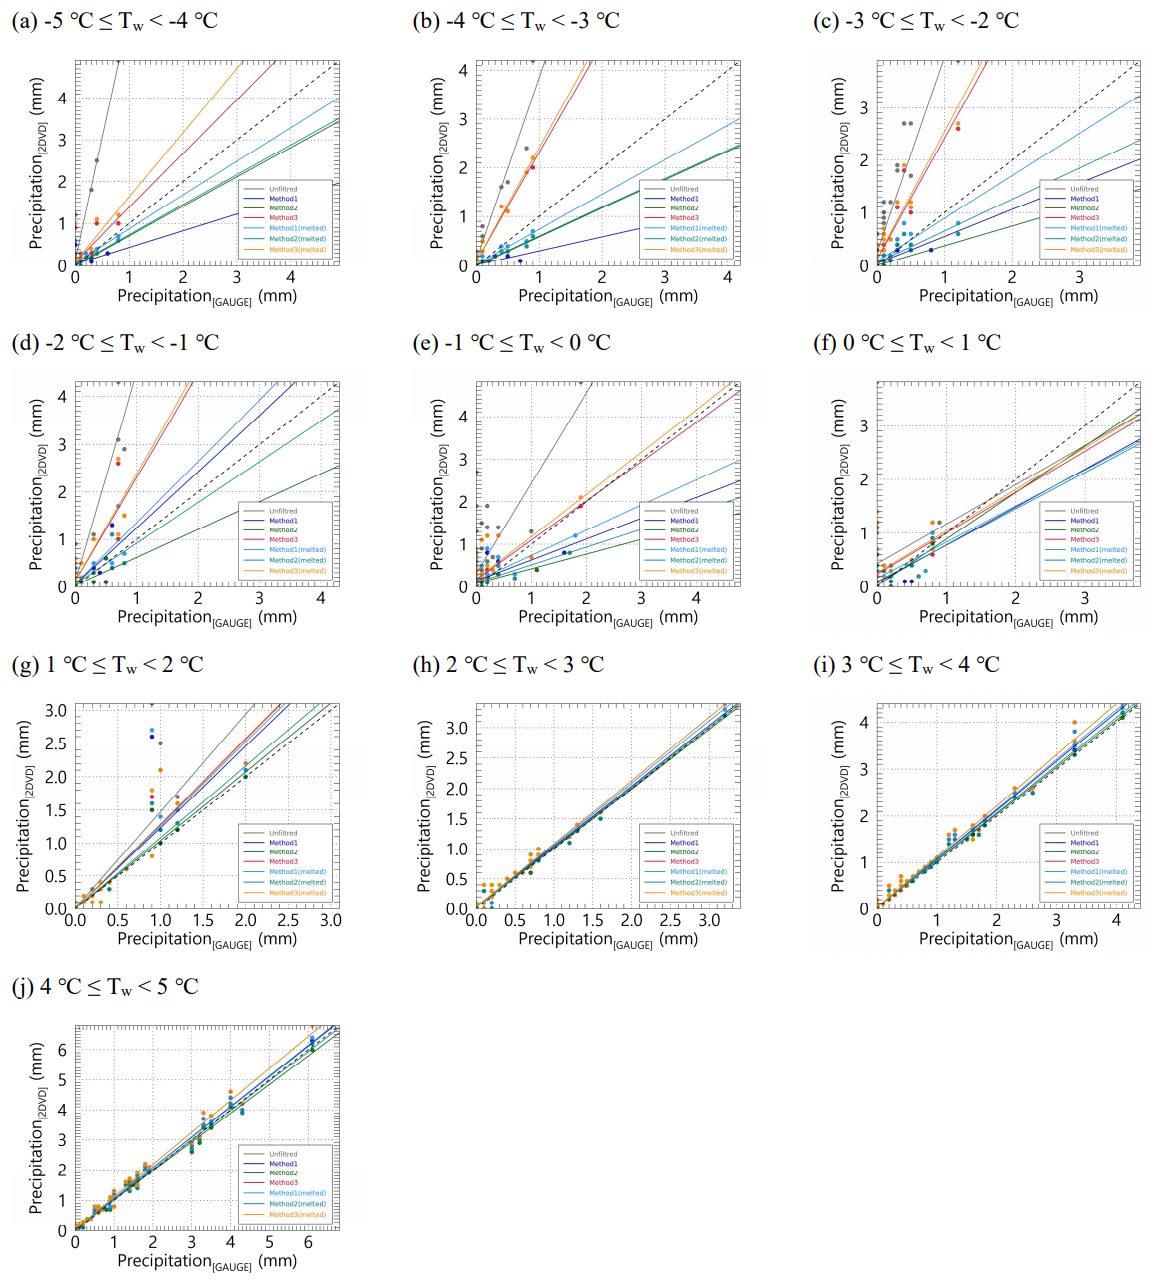
Figure A1Precipitation intensity scatter plot based on tipping-bucket rain gauge and 2DVD observation data for each Tw range. Each color in the scatter plot represents a filtering method.
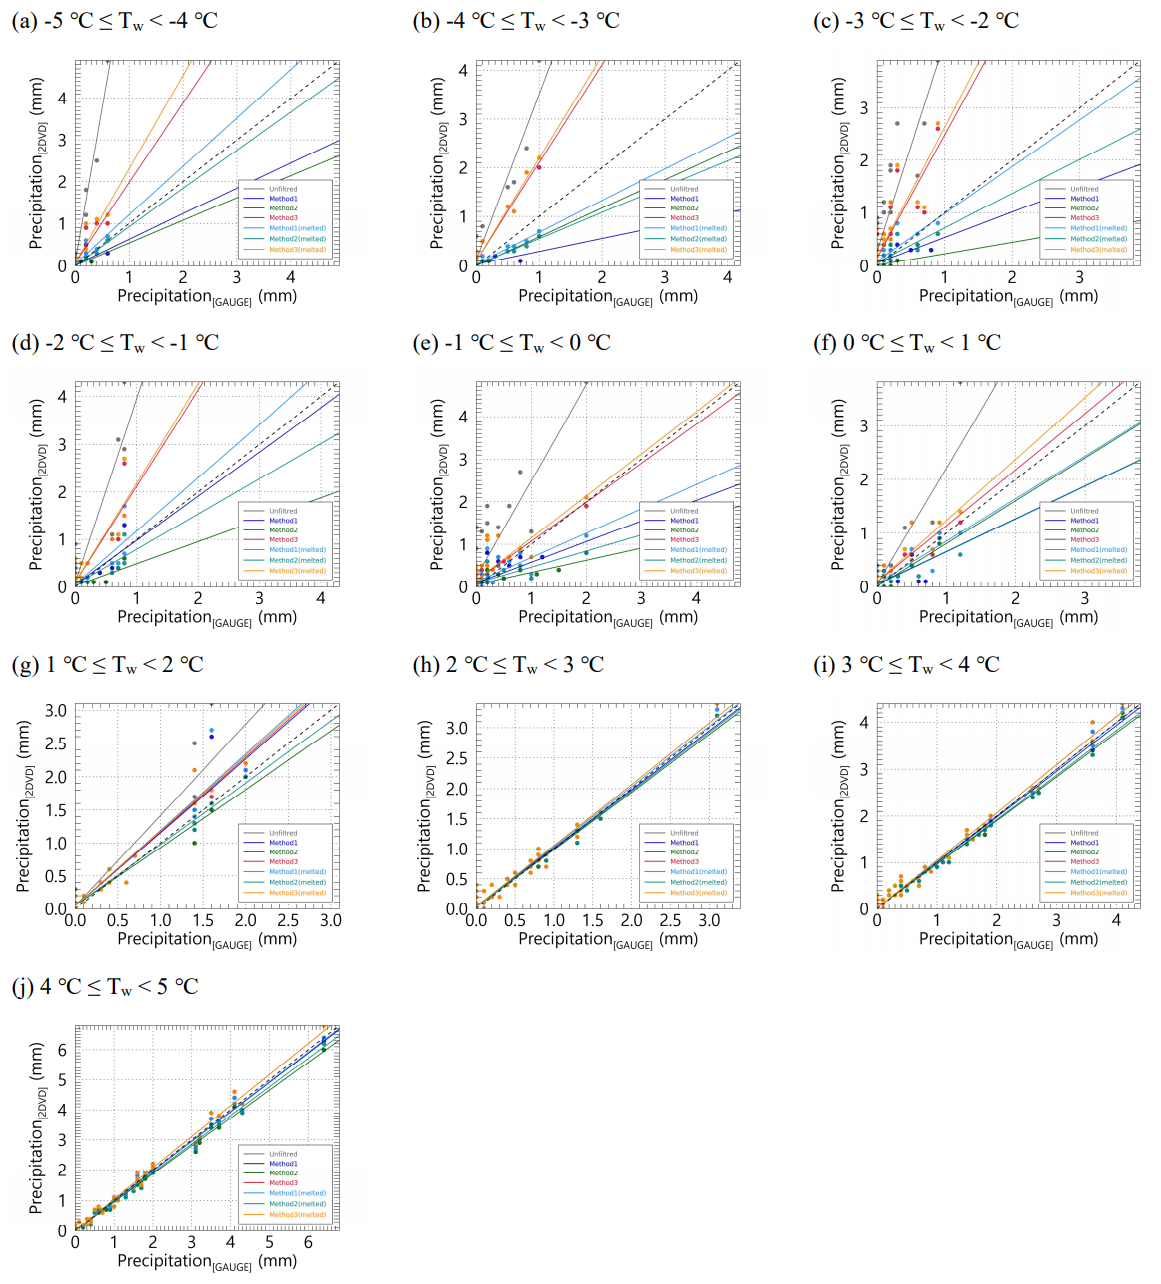
Figure A2Precipitation intensity scatter plot based on weighing rain gauge and 2DVD observation data for each Tw range. Each color in the scatter plot represents a filtering method.
Table A1a1 of precipitation intensity derived from tipping-bucket rain gauge and 2DVD observations for each Tw range.
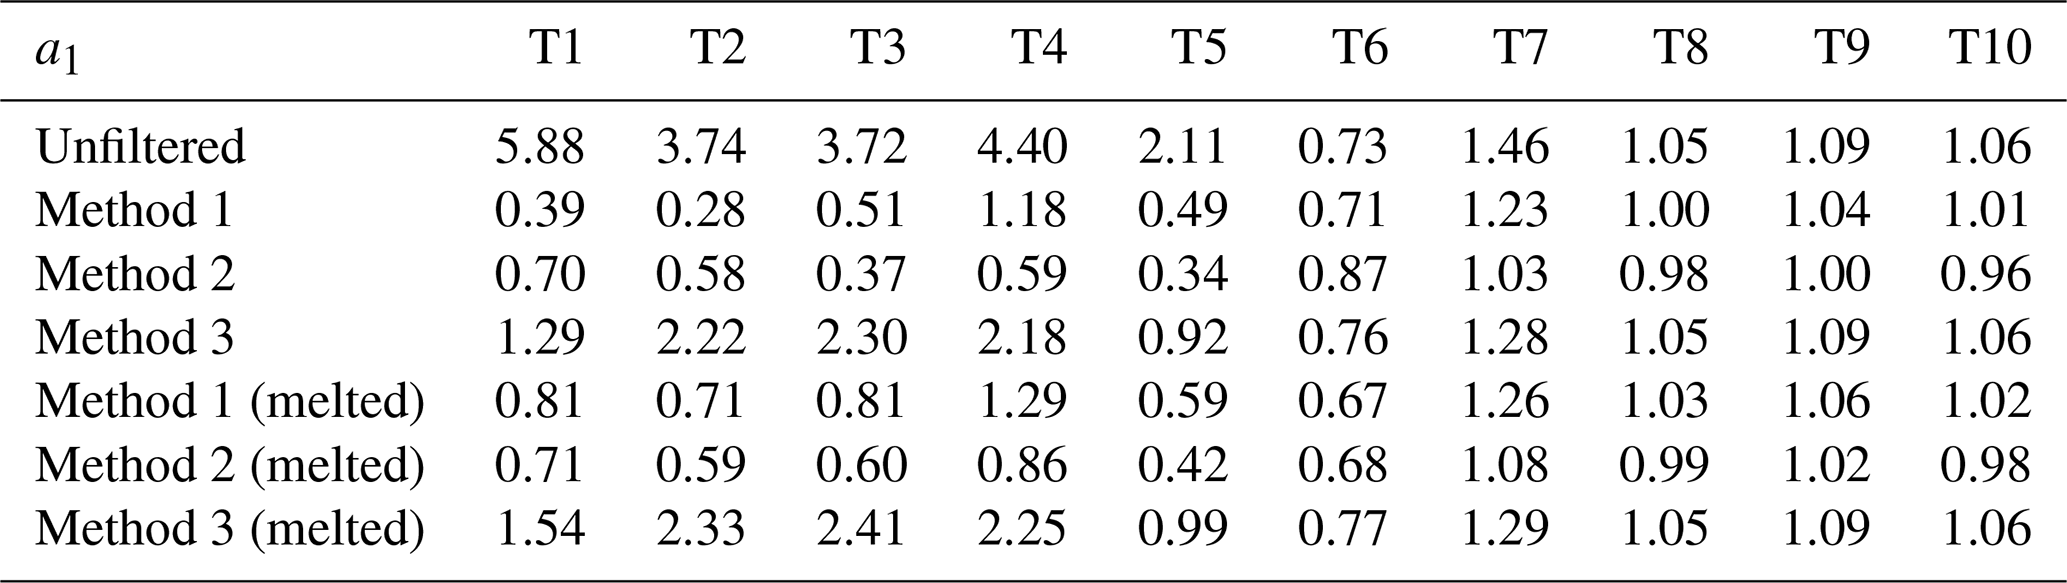
Table A2a0 of precipitation intensity derived from tipping-bucket rain gauge and 2DVD observations for each Tw range.
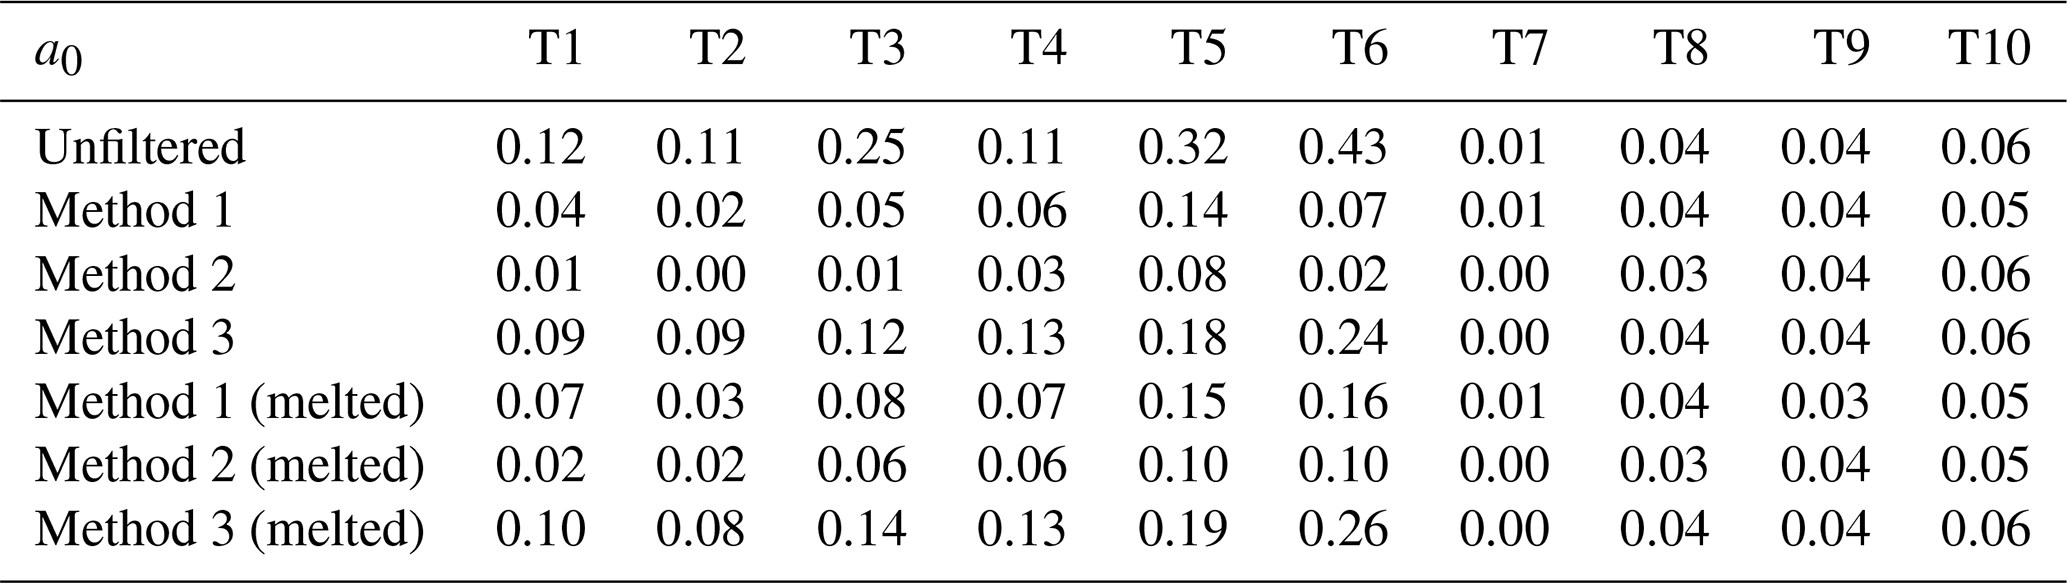
Table A3RMSE of precipitation intensity derived from tipping-bucket rain gauge and 2DVD observations for each Tw range.
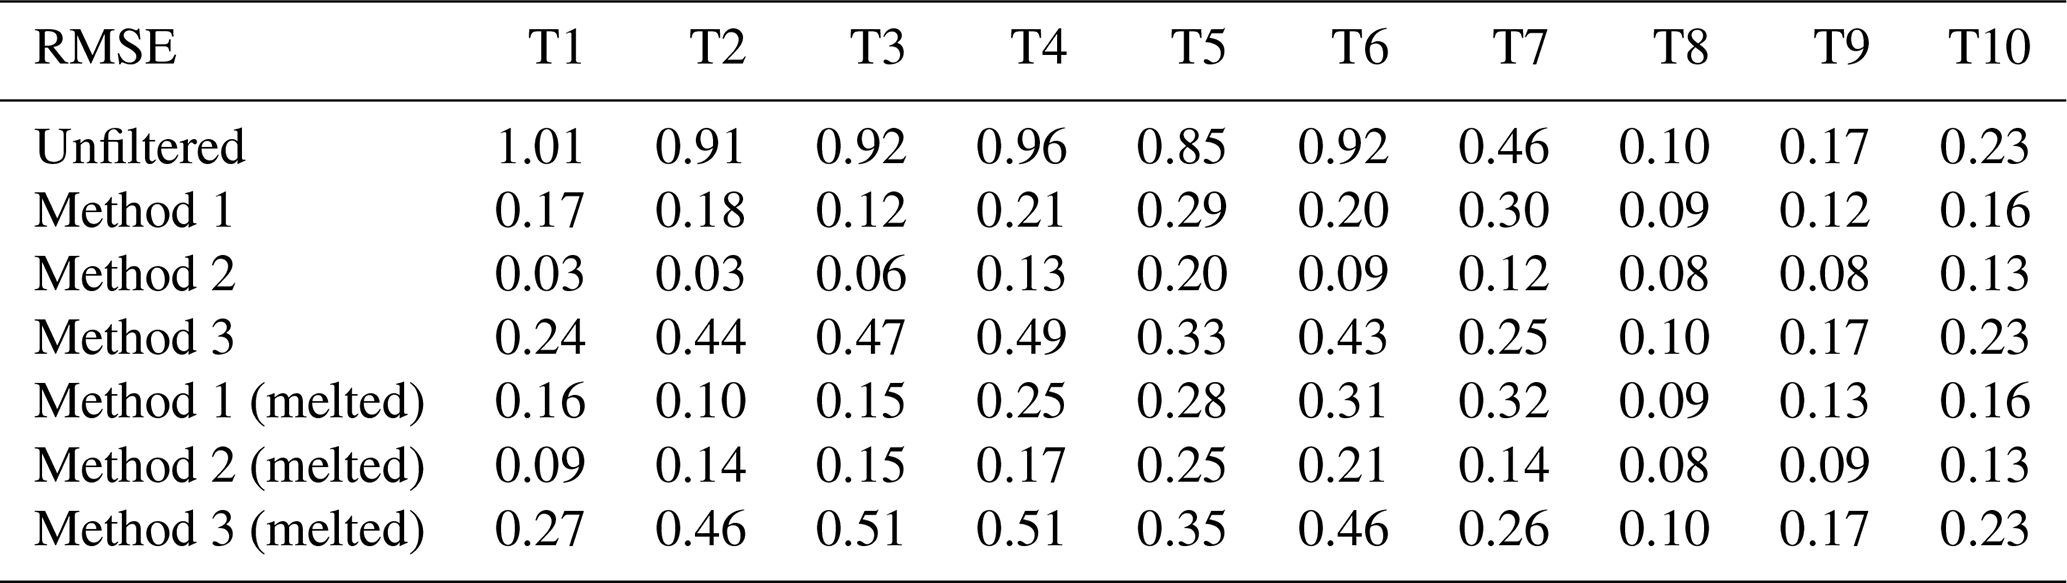
Table A4MAE of precipitation intensity derived from tipping-bucket rain gauge and 2DVD observations for each Tw range.
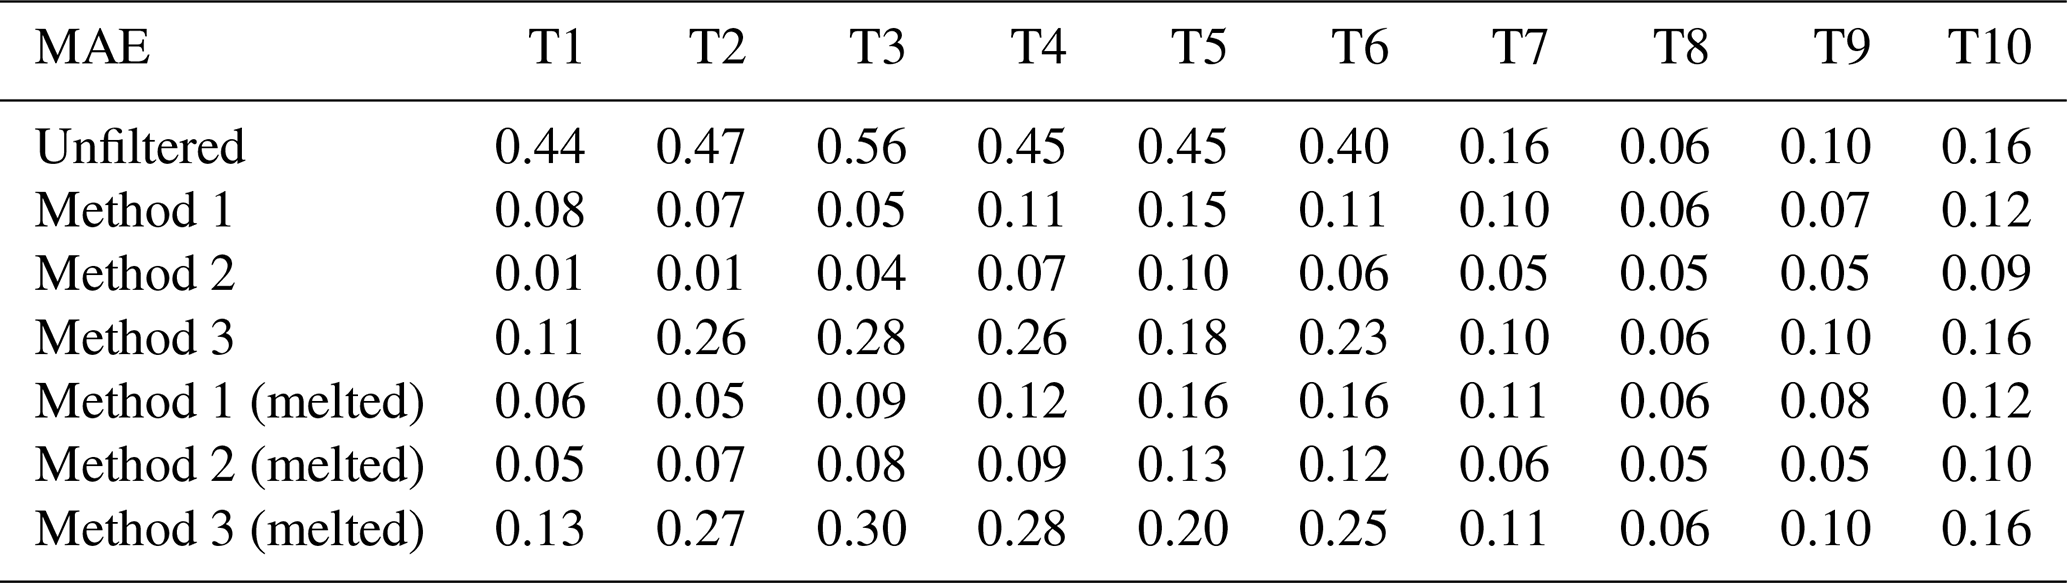
Table A5MAPE of precipitation intensity derived from tipping-bucket rain gauge and 2DVD observations for each Tw range.
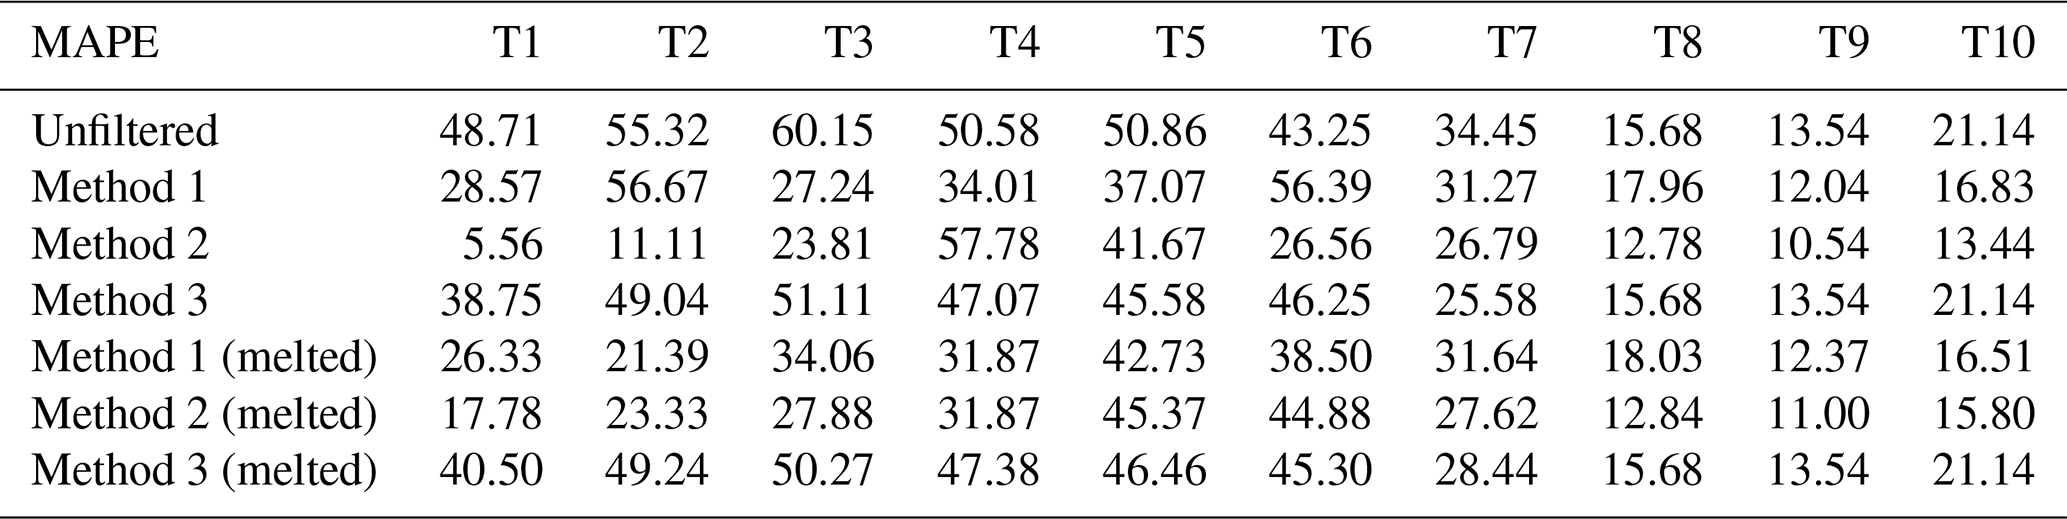
Table A6CC of precipitation intensity derived from tipping-bucket rain gauge and 2DVD observations for each Tw range.
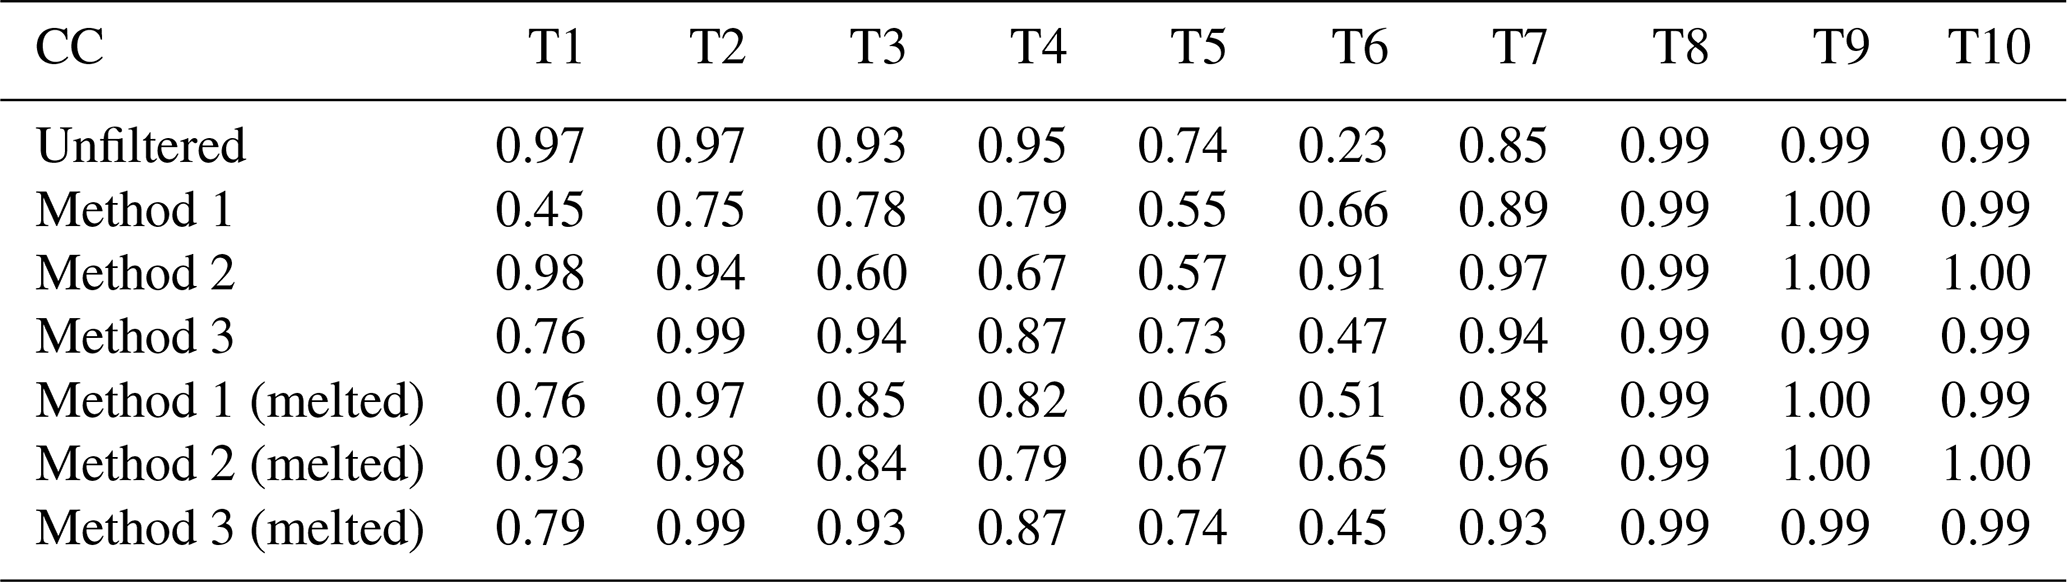
Table A7a1 of precipitation intensity derived from weighing rain gauge and 2DVD observations for each Tw range.
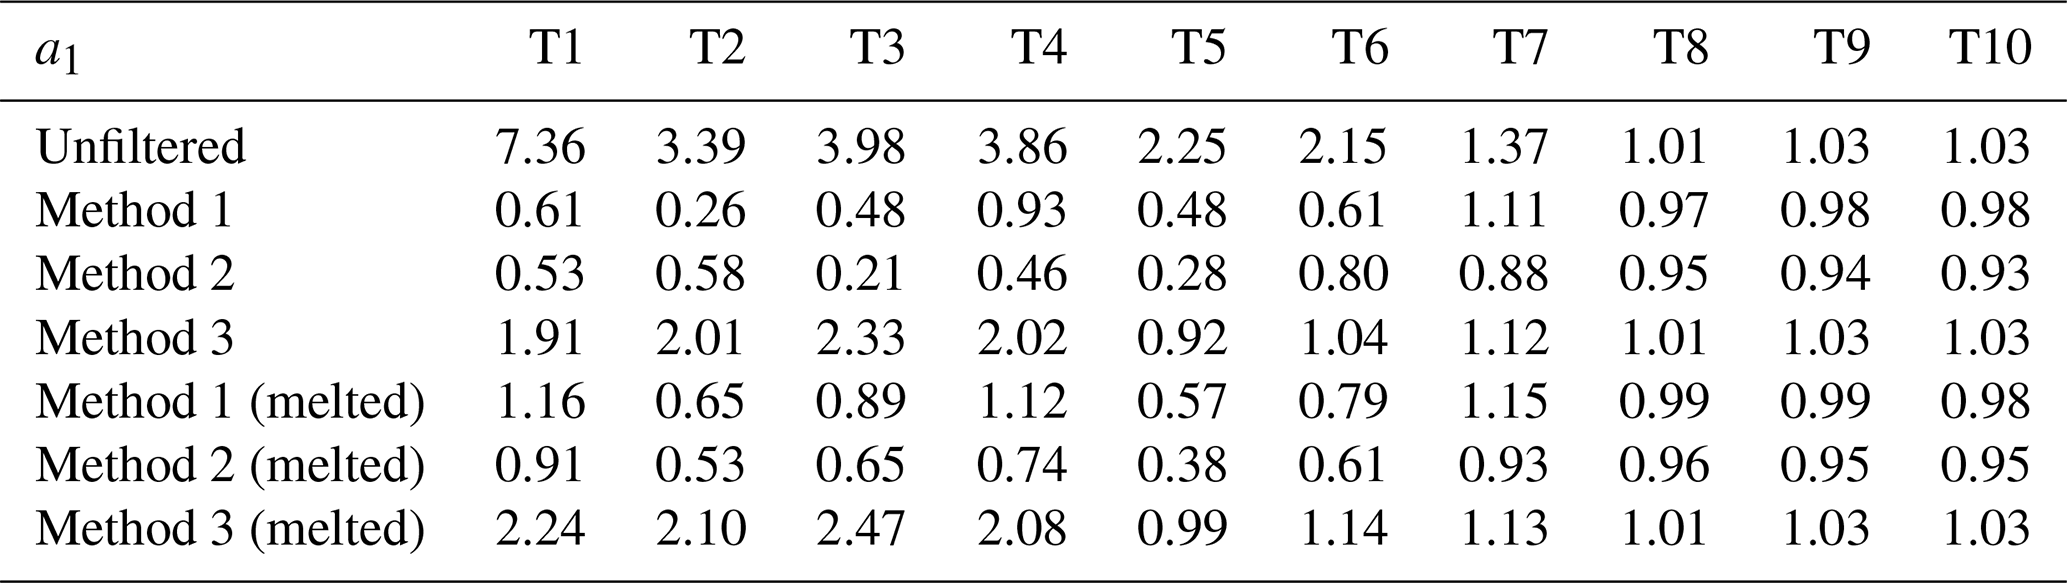
Table A8a0 of precipitation intensity derived from weighing rain gauge and 2DVD observations for each Tw range.
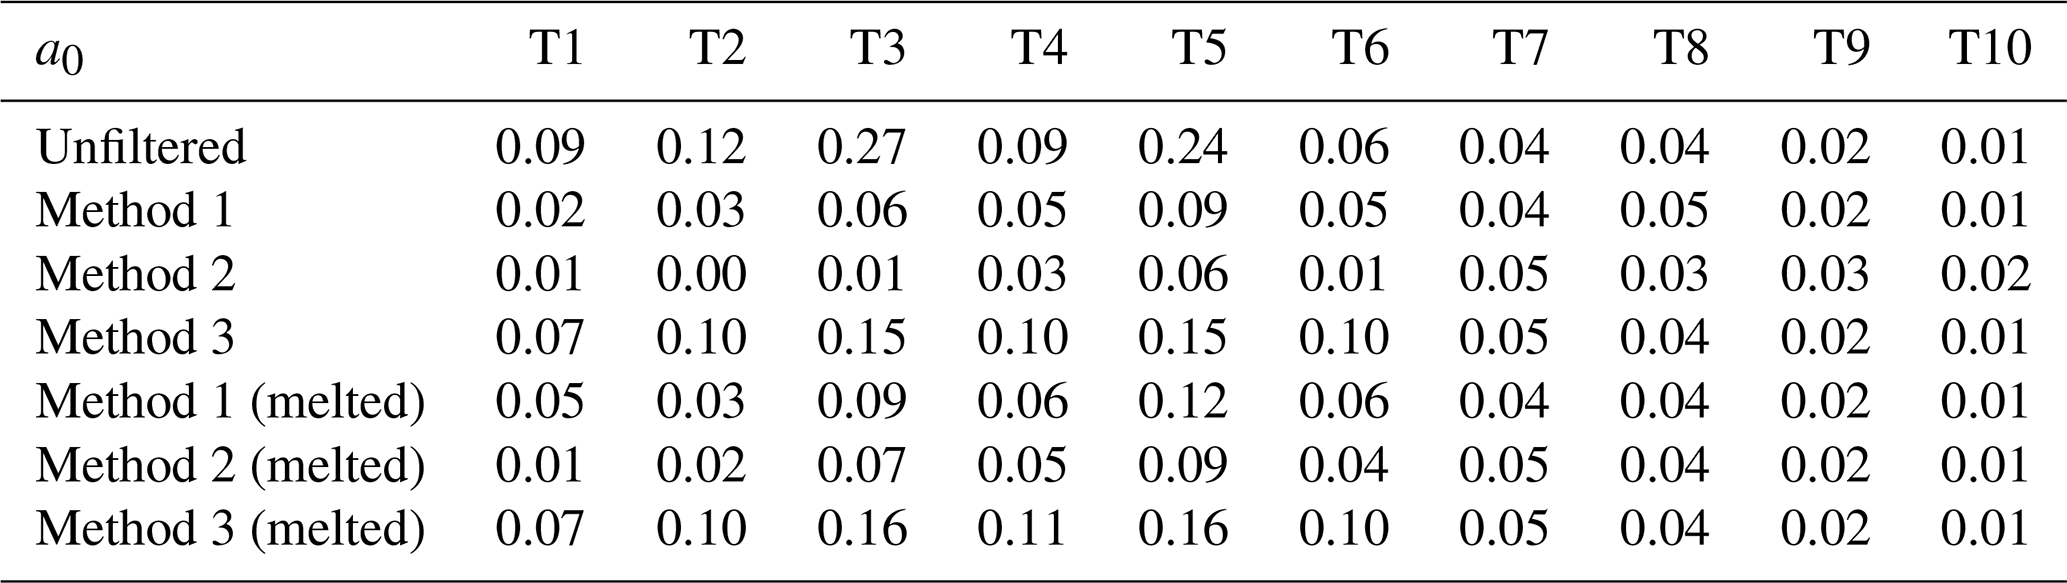
Table A9RMSE of precipitation intensity derived from weighing rain gauge and 2DVD observations for each Tw range.
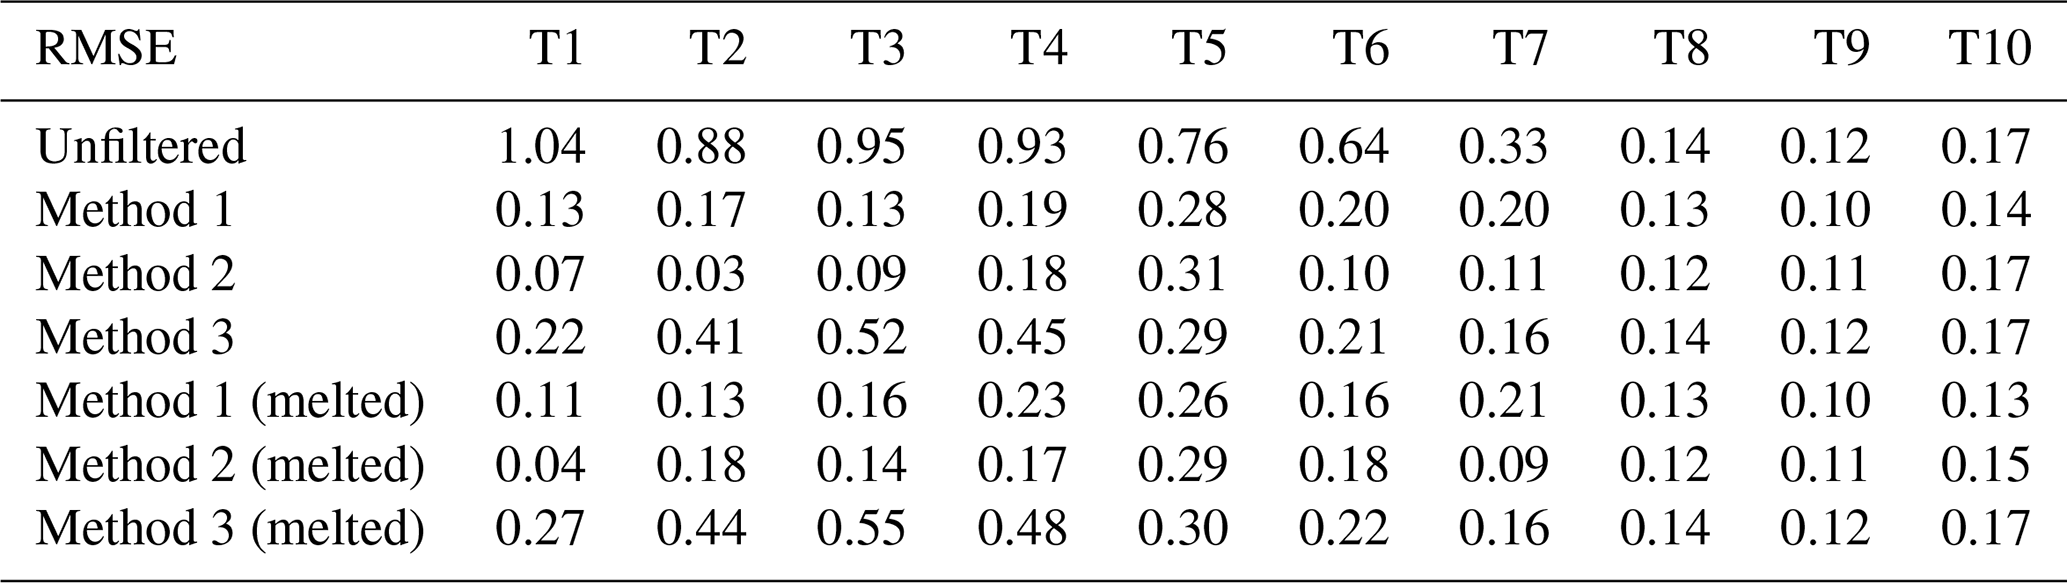
Table A10MAE of precipitation intensity derived from weighing rain gauge and 2DVD observations for each Tw range.
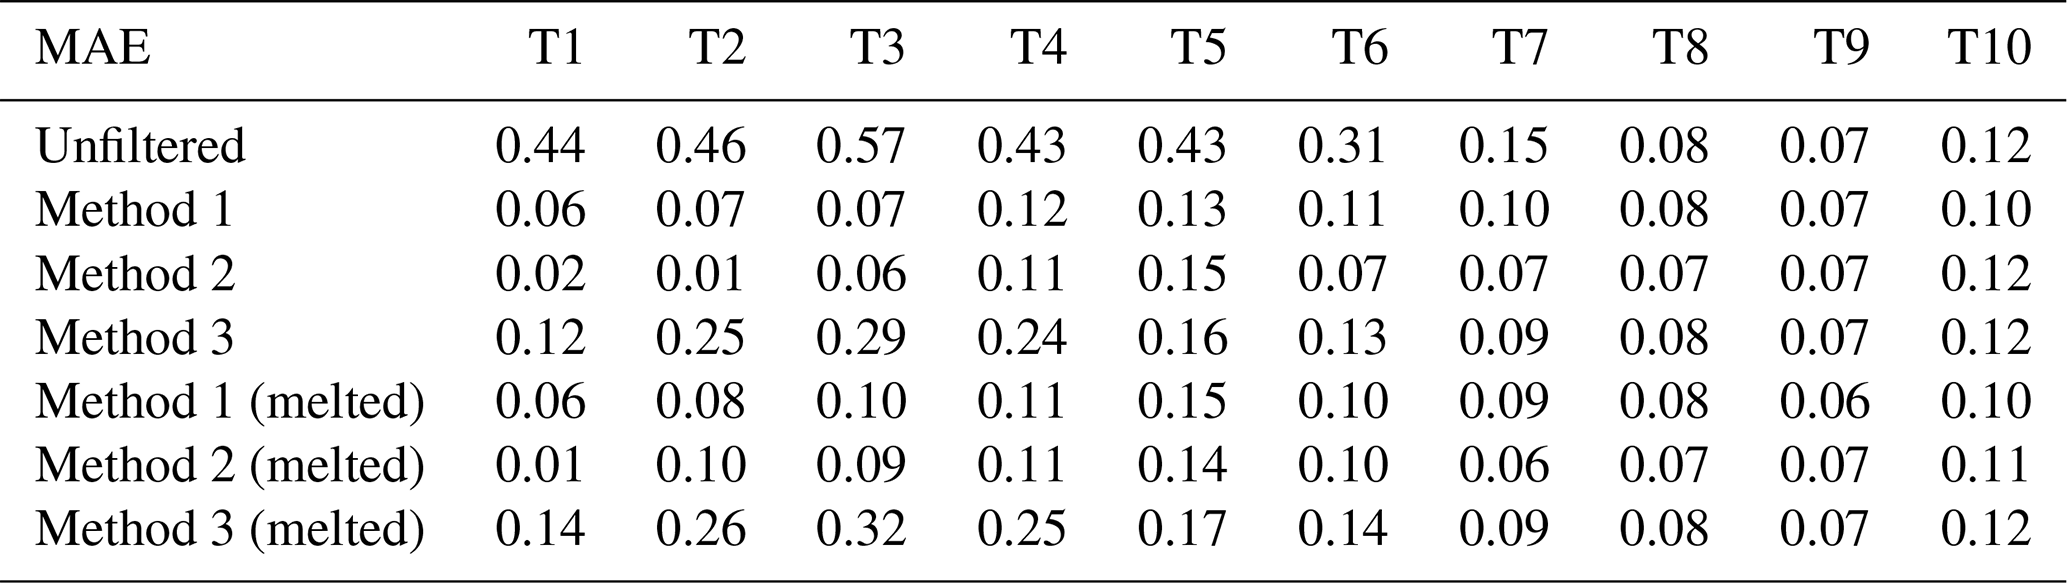
Table A11MAPE of precipitation intensity derived from weighing rain gauge and 2DVD observations for each Tw range.
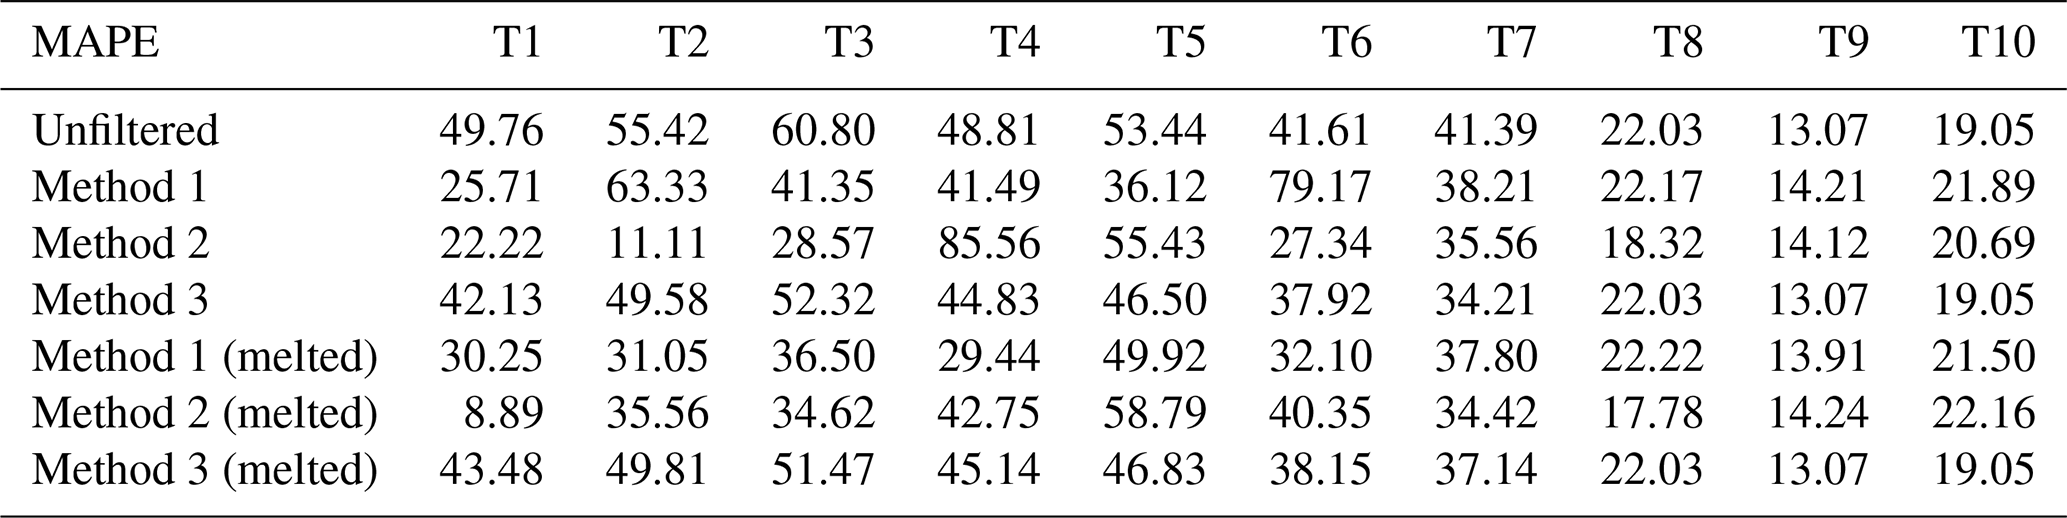
Table A12CC of precipitation intensity derived from weighing rain gauge and 2DVD observations for each Tw range.
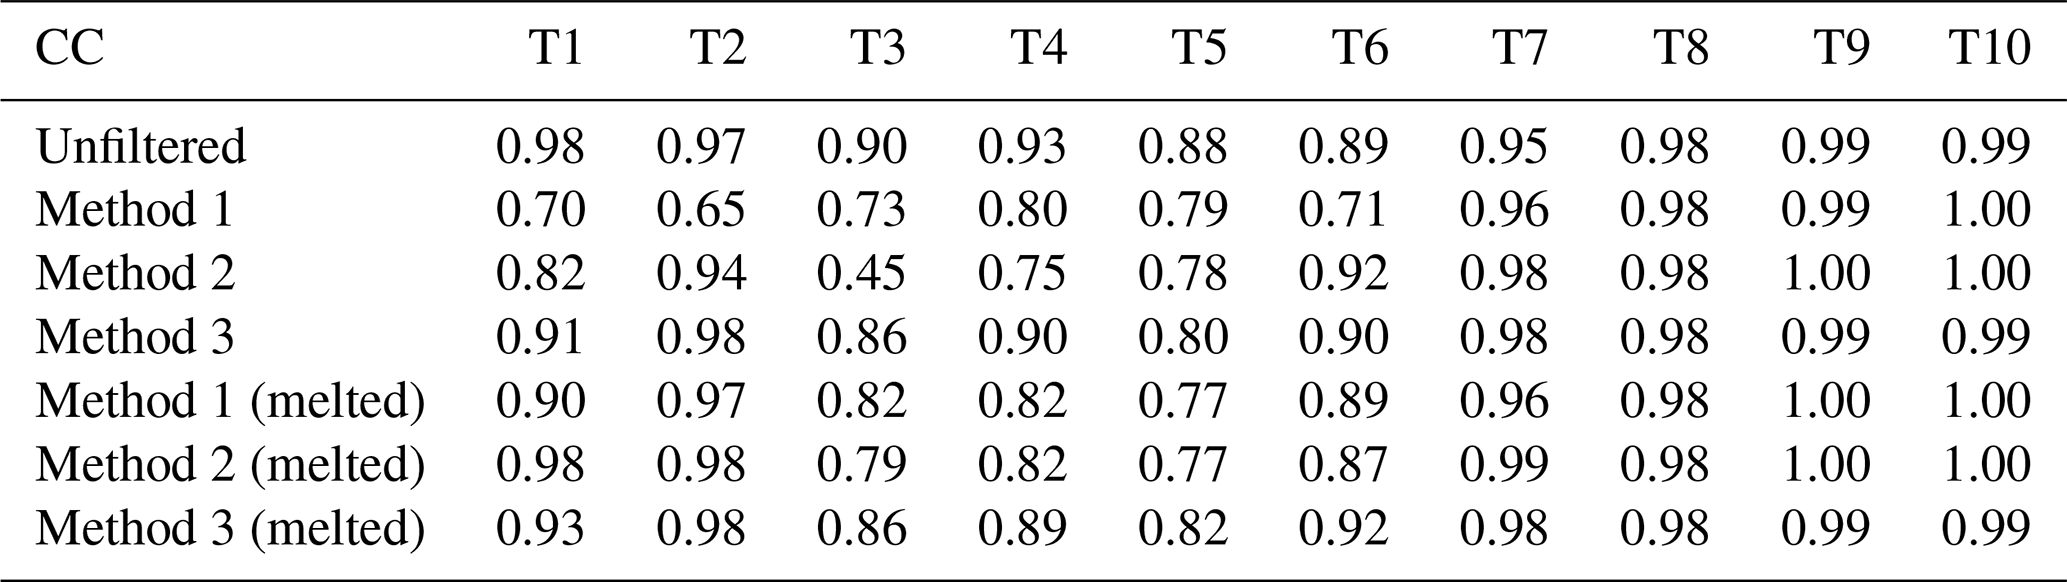
Table A13Diameter channel information of the PARSIVEL disdrometer.
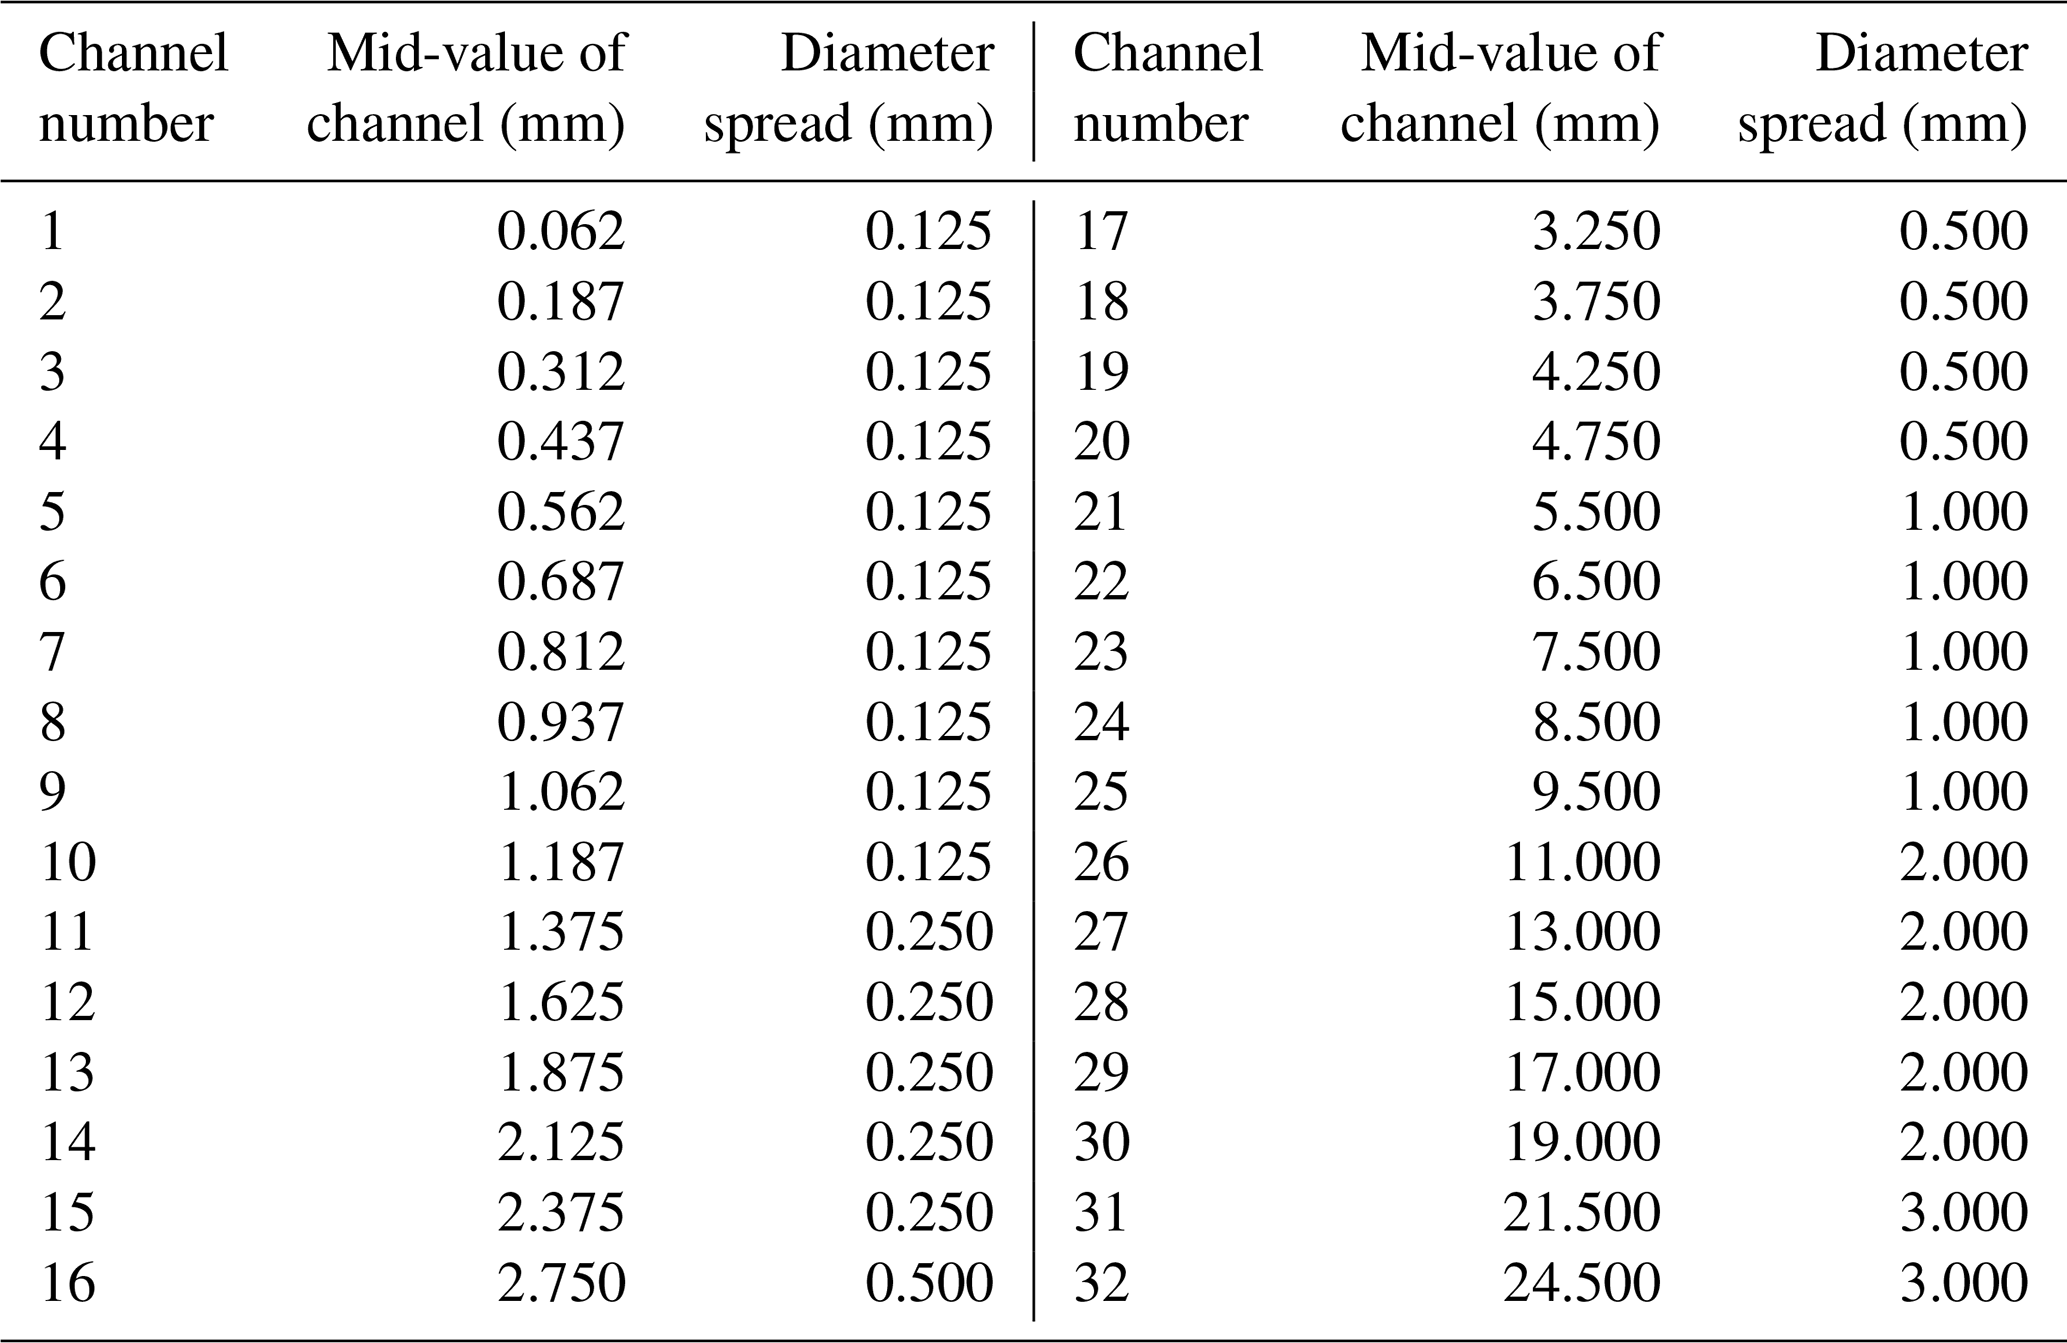
Table A14Velocity channel information of the PARSIVEL disdrometer.
The data used in this study are available from the corresponding author upon reasonable request.
HJK and CJ, conceptualized the project. JB did the data curation and formal analysis. HJK and SHS did the analysis and interpretation. HJK and JB led the investigation. HJK prepared the original draft, and SHS and CJ reviewed and edited the paper. All authors have read and agreed to the published version of the paper.
The contact author has declared that none of the authors has any competing interests.
Publisher's note: Copernicus Publications remains neutral with regard to jurisdictional claims made in the text, published maps, institutional affiliations, or any other geographical representation in this paper. The authors bear the ultimate responsibility for providing appropriate place names. Views expressed in the text are those of the authors and do not necessarily reflect the views of the publisher.
This study was supported by the Basic Science Research Program through the National Research Foundation of Korea (NRF), funded by the Ministry of Education (RS-2022-NR071182).
This study was supported by the Basic Science Research Program through the National Research Foundation of Korea (NRF), funded by the Ministry of Education (RS-2022-NR071182).
This paper was edited by Chunlüe Zhou and reviewed by three anonymous referees.
Atlas, D., Srivastava, R. C., and Sekhon, R. S.: Doppler radar characteristics of precipitation at vertical incidence, Rev. Geophys., 11, 1–35, https://doi.org/10.1029/RG011i001p00001, 1973.
Barthazy, E. and Schefold, R.: Fall velocity of snowflakes of different riming degree and crystal types, Atmos. Res., 82, 391–398, https://doi.org/10.1016/j.atmosres.2005.12.009, 2006.
Beard, K. V.: Terminal velocity adjustment for cloud and precipitation drops aloft, J. Atmos. Sci., 34, 1293–1298, https://doi.org/10.1175/1520-0469(1977)034<1293:TVAFCA>2.0.CO;2, 1977.
Brandes, E. A., Zhang, G., and Vivekanandan, J.: Experiments in rainfall estimation with a polarimetric radar in a subtropical environment, J. Appl. Meteorol., 41, 674–685, https://doi.org/10.1175/1520-0450(2002)041<0674:EIREWA>2.0.CO;2, 2002.
Chang, W. Y., Wang, T. C. C., and Lin, P. L.: Characteristics of the raindrop size distribution and drop shape relation in typhoon systems in the western Pacific from the 2D video disdrometer and NCU C-band polarimetric radar, J. Atmos. Ocean. Tech., 26, 1973–1993, https://doi.org/10.1175/2009JTECHA1236.1, 2009.
Dahlström, B.: Cloud physical and climatological factors for the determination of rain intensity, Water-Sui, 13, 2292, https://doi.org/10.3390/w13162292, 2021.
Delanoë, J., Protat, A., Testud, J., Bouniol, D., Heymsfield, A. J., Bansemer, A., Brown, P. R. A., and Forbes, R. M.: Statistical properties of the normalized ice particle size distribution, J. Geophys. Res.-Atmos., 110, https://doi.org/10.1029/2004JD005405, 2005.
Deo, A. and Walsh, K. J. E.: Contrasting tropical cyclone and non-tropical cyclone related rainfall drop size distribution at Darwin, Australia, Atmos. Res., 181, 81–94, https://doi.org/10.1016/j.atmosres.2016.06.015, 2016.
Ding, B., Yang, K., Qin, J., Wang, L., Chen, Y., and He, X.: The dependence of precipitation types on surface elevation and meteorological conditions and its parameterization, J. Hydrol., 513, 154–163, https://doi.org/10.1016/j.jhydrol.2014.03.038, 2014.
Du, Y. and Chen, G.: Heavy rainfall associated with double low-level jets over southern China. Part II: Convection initiation, Mon. Weather Rev., 147, 543–565, https://doi.org/10.1175/MWR-D-18-0102.1, 2019.
Friedrich, K., Kalina, E. A., Masters, F. J., and Lopez, C. R.: Drop-size distributions in thunderstorms measured by optical disdrometers during VORTEX2, Mon. Weather Rev., 141, 1182–1203, https://doi.org/10.1175/MWR-D-12-00116.1, 2013.
Grazioli, J., Tuia, D., Monhart, S., Schneebeli, M., Raupach, T., and Berne, A.: Hydrometeor classification from two-dimensional video disdrometer data, Atmos. Meas. Tech., 7, 2869–2882, https://doi.org/10.5194/amt-7-2869-2014, 2014.
Hu, A. Z. and Igel, A. L.: A bin and a bulk microphysics scheme can be more alike than two bin schemes, J. Adv. Model. Earth Sy., 15, e2022MS003303, https://doi.org/10.1029/2022MS003303, 2023.
Insel, N., Poulsen, C. J., and Ehlers, T. A.: Influence of the Andes Mountains on South American moisture transport, convection, and precipitation, Clim. Dynam., 35, 1477–1492, https://doi.org/10.1007/s00382-009-0637-1, 2010.
Iversen, E. C., Thompson, G., and Nygaard, B. E.: Improvements to melting snow behavior in a bulk microphysics scheme, Atmos. Res., 253, 105471, https://doi.org/10.1016/j.atmosres.2021.105471, 2021.
Jaffrain, J. and Berne, A.: Experimental quantification of the sampling uncertainty associated with measurements from PARSIVEL disdrometers, J. Hydrol. Meteorol., 12, 352–370, https://doi.org/10.1175/2010JHM1244.1, 2011.
Ji, L., Chen, H., Li, L., Chen, B., Xiao, X., Chen, M., and Zhang, G.: Raindrop size distributions and rain characteristics observed by a PARSIVEL disdrometer in Beijing, Northern China, Remote Sens.-Basel, 11, 1479, https://doi.org/10.3390/rs11121479, 2019.
Kim, H. J., Lee, K. O., You, C. H., Uyeda, H., and Lee, D. I.: Microphysical characteristics of a convective precipitation system observed on July 04, 2012, over Mt. Halla in South Korea, Atmos. Res., 222, 74–87, https://doi.org/10.1016/j.atmosres.2019.02.011, 2019.
Kim, H. J., Jung, W., Suh, S. H., Lee, D. I., and You, C. H.: The characteristics of raindrop size distribution at windward and leeward side over mountain area, Remote Sens.-Basel, 14, 2419, https://doi.org/10.3390/rs14102419, 2022.
Kochendorfer, J., Earle, M. E., Hodyss, D., Reverdin, A., Roulet, Y. A., Nitu, R., Rasmussen, R., Landolt, S., Buisán, S., and Laine, T.: Undercatch adjustments for tipping-bucket gauge measurements of solid precipitation, J. Hydrol. Meteorol., 21, 1193–1205, https://doi.org/10.1175/JHM-D-19-0256.1, 2020.
Kruger, A. and Krajewski, W. F.: Two-dimensional video disdrometer: A description, J. Atmos. Ocean. Tech., 19, 602–617, https://doi.org/10.1175/1520-0426(2002)019<0602:TDVDAD>2.0.CO;2, 2002.
Lee, K. O., Uyeda, H., and Lee, D. I.: Microphysical structures associated with enhancement of convective cells over Mt. Halla, Jeju Island, Korea on 6 July 2007, Atmos. Res., 135–136, 76–90, https://doi.org/10.1016/j.atmosres.2013.08.012, 2014.
Lintner, B. R., Adams, D. K., Schiro, K. A., Stansfield, A. M., Amorim Rocha, A. A., and Neelin, J. D.: Relationships among climatological vertical moisture structure, column water vapor, and precipitation over the central Amazon in observations and CMIP5 models, Geophys. Res. Lett., 44, 1981–1989, https://doi.org/10.1002/2016GL071923, 2017.
Liu, X., Li, H., Hu, S., Wan, Q., Xiao, H., Zheng, T., Li, M., Ye, L., Guo, Z., Wang, Y., and Yan, Z.: A high-precision and fast solution method of gamma raindrop size distribution based on 0-moment and 3-moment in South China, J. Appl. Meteorol. Clim., 60, 1407–1421, https://doi.org/10.1175/JAMC-D-21-0043.1, 2021.
Lu, Y., Yu, Z., Albertson, J. D., Chen, H., Hu, L., Pendergrass, A., Chen, X., and Li, Q.: Understanding the influence of urban form on the spatial pattern of precipitation, Earths Future, 12, e2023EF003846, https://doi.org/10.1029/2023EF003846, 2024.
Maheskumar, R. S., Padmakumari, B., Konwar, M., Morwal, S. B., and Deshpande, C. G.: Characterization of hydrometeors and precipitation over the Indian monsoon region using aircraft measurements, Atmos. Res., 205, 147–154, https://doi.org/10.1016/j.atmosres.2018.02.012, 2018.
Marshall, J. S. and Palmer, W. M. K.: The distribution of raindrops with size, J. Atmos. Sci., 5, 165–166, https://doi.org/10.1175/1520-0469(1948)005<0165:TDORWS>2.0.CO;2, 1948.
Marzuki, M., Randeu, W. L., Schönhuber, M., Bringi, V. N., Kozu, T., and Shimomai, T.: Raindrop size distribution parameters of distrometer data with different bin sizes, IEEE T. Geosci. Remote, 48, 3075–3080, https://doi.org/10.1109/TGRS.2010.2043955, 2010.
Ong, C. R., Miura, H., and Koike, M.: The terminal velocity of axisymmetric cloud drops and raindrops evaluated by the immersed boundary method, J. Atmos. Sci., 78, 1129–1146, https://doi.org/10.1175/JAS-D-20-0161.1, 2021.
Padullés, R., Kuo, Y. H., Neelin, J. D., Turk, F. J., Ao, C. O., and De la Torre Juárez, M.: Global tropical precipitation relationships to free-tropospheric water vapor using radio occultations, J. Atmos. Sci., 79, 1585–1600, https://doi.org/10.1175/JAS-D-21-0052.1, 2022.
Raupach, T. H. and Berne, A.: Correction of raindrop size distributions measured by Parsivel disdrometers, using a two-dimensional video disdrometer as a reference, Atmos. Meas. Tech., 8, 343–365, https://doi.org/10.5194/amt-8-343-2015, 2015.
Savina, M., Schäppi, B., Molnar, P., Burlando, P., and Sevruk, B.: Comparison of a tipping-bucket and electronic weighing precipitation gage for snowfall, Atmos. Res., 103, 45–51, https://doi.org/10.1016/j.atmosres.2011.06.010, 2012.
Segovia-Cardozo, D. A., Rodríguez-Sinobas, L., Díez-Herrero, A., Zubelzu, S., and Canales-Ide, F.: Understanding the mechanical biases of tipping-bucket rain gauges: A semi-analytical calibration approach, Water-Sui, 13, 2285, https://doi.org/10.3390/w13162285, 2021.
Serio, M. A., Carollo, F. G., and Ferro, V.: Raindrop size distribution and terminal velocity for rainfall erosivity studies. A review, J. Hydrol., 576, 210–228, https://doi.org/10.1016/j.jhydrol.2019.06.040, 2019.
Smith, P. L.: Raindrop size distributions: Exponential or gamma – Does the difference matter?, J. Appl. Meteorol., 42, 1031–1034, https://doi.org/10.1175/1520-0450(2003)042<1031:RSDEOG>2.0.CO;2, 2003.
Steenburgh, W. J.: Sea-effect precipitation: A Look at Japan's “Gosetsu Chitai”, B. Am. Meteorol. Soc., 101, 129–136, https://doi.org/10.1175/BAMS-D-18-0335.A, 2020.
Stull, R.: Wet-bulb temperature from relative humidity and air temperature, J. Appl. Meteorol. Clim., 50, 2267–2269, https://doi.org/10.1175/JAMC-D-11-0143.1, 2011.
Sypka, P.: Dynamic real-time volumetric correction for tipping-bucket rain gauges, Agr. Forest Meteorol., 271, 158–167, https://doi.org/10.1016/j.agrformet.2019.02.044, 2019.
Tang, Y. S., Chang, P. L., Chang, W. Y., Zhang, J., Tang, L., Lin, P. F., and Chen, C. R.: A localized quantitative precipitation estimation for S-band polarimetric radar in Taiwan, J. Hydrol. Meteorol., 25, 1697–1712, https://doi.org/10.1175/JHM-D-23-0205.1, 2024.
Thomas, A., Kanawade, V. P., Chakravarty, K., and Srivastava, A. K.: Characterization of raindrop size distributions and its response to cloud microphysical properties, Atmos. Res., 249, 105292, https://doi.org/10.1016/j.atmosres.2020.105292, 2021.
Thurai, M. and Bringi, V. N.: Drop axis ratios from a 2D video disdrometer, J. Atmos. Ocean. Tech., 22, 966–978, https://doi.org/10.1175/JTECH1767.1, 2005.
Tiira, J., Moisseev, D. N., von Lerber, A., Ori, D., Tokay, A., Bliven, L. F., and Petersen, W.: Ensemble mean density and its connection to other microphysical properties of falling snow as observed in Southern Finland, Atmos. Meas. Tech., 9, 4825–4841, https://doi.org/10.5194/amt-9-4825-2016, 2016.
Ulbrich, C. W.: Natural variations in the analytical form of the raindrop size distribution, J. Appl. Meteorol. Clim., 22, 1764–1775, https://doi.org/10.1175/1520-0450(1983)022<1764:NVITAF>2.0.CO;2, 1983.
Vázquez-Martín, S., Kuhn, T., and Eliasson, S.: Mass of different snow crystal shapes derived from fall speed measurements, Atmos. Chem. Phys., 21, 18669–18688, https://doi.org/10.5194/acp-21-18669-2021, 2021.
Wang, P. K. and Pruppacher, H. R.: Acceleration to terminal velocity of cloud and raindrops, J. Appl. Meteorol. Clim., 16, 275–280, https://doi.org/10.1175/1520-0450(1977)016<0275:ATTVOC>2.0.CO;2, 1977.
Wen, L., Zhao, K., Chen, G., Wang, M., Zhou, B., Huang, H., Hu, D., Lee, W. C., and Hu, H.: Drop size distribution characteristics of seven typhoons in China, J. Geophys. Res.-Atmos., 123, 6529–6548, https://doi.org/10.1029/2017JD027950, 2018.
Yang, Q., Dai, Q., Han, D., Chen, Y., and Zhang, S.: Sensitivity analysis of raindrop size distribution parameterizations in WRF rainfall simulation, Atmos. Res., 228, 1–13, https://doi.org/10.1016/j.atmosres.2019.05.019, 2019.
Yao, X., Yang, K., Zhou, X., Wang, Y., Lazhu, C., Chen, Y., and Lu, H.: Surface friction contrast between water body and land enhances precipitation downwind of a large lake in Tibet, Clim. Dynam., 56, 2113–2126, https://doi.org/10.1007/s00382-020-05575-x, 2021.
Yi, Y., Yi, F., Liu, F., Zhang, Y., Yu, C., and He, Y.: Microphysical process of precipitating hydrometeors from warm-front mid-level stratiform clouds revealed by ground-based lidar observations, Atmos. Chem. Phys., 21, 17649–17664, https://doi.org/10.5194/acp-21-17649-2021, 2021.