the Creative Commons Attribution 4.0 License.
the Creative Commons Attribution 4.0 License.
 | 28 Apr 2026
Assessing Earth's sphericity effects in the specific case of geostationary satellite observations: focus on operational land/aerosol applications from Meteosat Third Generation-Imager
Gloria Klein
Jérôme Vidot
Didier Ramon
Mustapha Moulana
Geostationary satellites allow continuous sub-hourly monitoring of the Earth including land surfaces and aerosols, which can now benefit from the advanced measuring performance of the new Meteosat Third Generation-Imager and its Flexible Combined Imager on board (FCI). In this study, we aim to improve our understanding of the impact of the Earth's sphericity on geostationary observations. Although sphericity effects in satellite data have been studied for many years, the curvature of our planet is still not accounted for in many operational radiative transfer-based retrieval algorithms due to the required increase in processing time, and therefore a plane-parallel atmosphere-surface system is assumed instead. While the limitations of this approximation have been widely assessed in the case of low Earth orbit satellites, they must be reevaluated with regard to geostationary satellites, which have a broader range of observing and illumination geometries. Furthermore, we currently lack precise benchmarking of the errors caused by neglecting the Earth's sphericity in the case of land surface and aerosol applications, which show significant differences with respect to the commonly considered ocean color applications. For example, surface/aerosol algorithms use instrument channels in the red and near-infrared spectral ranges where there is a growing impact of molecular absorption compared to the ocean color-sensitive blue channels where Rayleigh scattering predominates. In this context, we perform quantitative analyses of the impact of ignoring the Earth's curvature on FCI-like top-of-atmosphere reflectance calculations using the accurate Monte Carlo radiative transfer code SMART-G. Results enable quantification of important biases introduced by the plane-parallel assumption, with a strong dependency on the sun-satellite acquisition geometry and, to a lesser extent, the measurement wavelength. Significant dependencies on surface and aerosol properties are also identified, but only under extreme solar and viewing conditions. We also find that 36 % of FCI observations are significantly affected by sphericity effects, in particular in the channels centered at short visible wavelengths (i.e., 444 and 510 nm for FCI). Based on these results, this study makes recommendations, that can be found in the Discussion section of this paper, on the development of methods to account for sphericity effects in the inversion of geostationary data so that one can correct the outcome of plane-parallel radiative transfer codes for near-real-time operational applications.
- Article
(5787 KB) - Full-text XML
- BibTeX
- EndNote


Satellites in geostationary orbit are widely used for various meteorological and climate applications (e.g. Boukabara et al., 2021; Levizzani et al., 2001; Stöckli et al., 2019), in particular because they enable high-temporal-frequency monitoring of the Earth. Their distinctive orbit with an altitude of 35 785 km above the equator makes their orbital period equal to the Earth's rotation period. This particularity allows geostationary satellites to constantly monitor the same observed field-of-view roughly corresponding to one third of the planet. This specificity of geostationary weather satellites allows them to obtain several images of the observed field-of-view per hour. This configuration results in satellite observations encompassing a very broad range of both solar angles (varying during the day due to the motion of the Sun with respect to the satellite-Earth system) and view angles (constant with time but varying across the geostationary field-of-view due to the fixed position of the satellite).
Meteosat Second Generation is the operational geostationary mission from the European Organization for the Exploitation of Meteorological Satellites (EUMETSAT) since 2002, carrying on board the multispectral imager Spinning Enhanced Visible and InfraRed Imager (SEVIRI) (Schmetz et al., 2002). The first Meteosat Third Generation-Imager (MTG-I) satellite, equipped with the multispectral Flexible Combined Imager (FCI), was launched in December 2022 and became operational in December 2024 under the name of Meteosat-12. This new generation of Geostationary Earth Orbit (GEO) instrument comes with major upgrades. Five new spectral channels have been added, providing measurements in visible and near-infrared wavelengths not available on SEVIRI. In the shortwave range, FCI has a spatial resolution from 0.5 to 1 km, compared to 3 km for SEVIRI. Multispectral images of the entire field-of-view are now available every 10 min from FCI, instead of the previous 15 min temporal frequency (Holmlund et al., 2021). These new characteristics bring many opportunities to improve the characterization and monitoring of the Earth's atmosphere and surface, for example in the context of the near real time clear-sky retrieval of shortwave surface albedo retrieval as it is operationally conducted in the EUMETSAT Land Surface Analysis Satellite Application Facility (LSA-SAF) project (Juncu et al., 2022).
The third generation of Meteosat satellites upgrades also come with their share of challenges, notably an increased amount of data that may require optimization of operational algorithms to meet near real time constraints. This is the case of surface albedo retrieval, which can benefit from processing an increased number of diurnal observations allowed by GEO instruments, as this improves the estimation of surface Bidirectional Reflectance Distribution Function (BRDF). However, the quality of the atmospheric correction (i.e the compensation for atmospherics effects in the radiation measured by the satellite) required to estimate surface reflectance from each geostationary observation strongly depends on aerosol characterization. Although diurnal aerosol estimation from geostationary observations is possible (Ceamanos et al., 2023) and can strongly benefit from the new FCI channels centered at 444, 510 and 2250 nm (Georgeot et al., 2024), it requires to accurately account for the large variations in solar and satellite geometry. For example, the regions near the edge of the geostationary field-of-view, such as high latitudes, are constantly observed under high view zenith angle (VZA), whereas the entire field-of-view is observed under high solar zenith angle (SZA) close to sunrise and sunset every day. The observations under such extreme geometries are generally dismissed in retrieval algorithms for they have been reported to limit the accuracy in atmospheric correction schemes (Ruddick et al., 2014) mainly because radiative transfer calculations are much more complex (and therefore CPU costly) due to the Earth's curvature for example. Despite being known for many years (Adams and Kattawar, 1978; Ding and Gordon, 1994), sphericity effects are still not taken into account in many operational retrieval algorithms (Zawadzka and Markowicz, 2014; EUMETSAT, 2021; Juncu et al., 2022; EUMETSAT, 2022; Ceamanos et al., 2023), which use the well-known and much faster plane-parallel approximation instead.
This is the case of the LSA-SAF albedo algorithm, in which the Earth's sphericity has not been taken into account to simplify the atmospheric correction calculations in front of the high computational requirements imposed by the near-real-time processing of geostationary Meteosat observations. Given that using spherical or pseudo-spherical algorithms is currently not possible due to these operational constraints, we intend to assess the validity of the plane-parallel approximation, especially in the context of a future simultaneous albedo and aerosol estimation from FCI. In this study, we therefore intend to explore the impact of the Earth's sphericity on geostationary top-of-atmosphere (TOA) cloud-free multispectral observations based on accurate full spherical radiative transfer simulations. The main novelty of our work with respect to earlier studies on sphericity effects lies in the specificity of geostationary sensors, which for example provide a much wider range of solar and view geometries in comparison to the well studied polar orbiting satellites (Ding and Gordon, 1994; He et al., 2018). Furthermore, we set our work in the context of the retrieval of land surfaces and aerosols, which shows significant differences with the commonly considered ocean color applications (Ding and Gordon, 1994; He et al., 2018; Xu et al., 2023). Hence, our research focuses on the FCI spectral channels that are of interest for the estimation of aerosol and land surface properties, which cover the entire visible and near-infrared spectrum and therefore do not correspond to the short visible wavelengths sensitive to ocean color that are generally assessed in previous studies on sphericity effects. Hence, the impact on the Earth's sphericity of not only Rayleigh scattering but also gaseous absorption effects is examined. Furthermore, we identify and characterize the dependencies of sphericity effects on radiative transfer parameters that are relevant in our application context such as surface albedo and aerosol properties. Ultimately, we aim to adjudicate on the validity of the plane-parallel approximation particularly in the processing of FCI observations and establish under which circumstances appropriate corrections to partially account for sphericity effects at the radiative transfer level should be implemented.
This study is organized as follows. In Sect. 2, the Earth's sphericity effects are described by defining the geometry and physics of the problem, and documenting their impact in radiative transfer calculations. Section 3 focuses on presenting the methodology and the purpose of our study. Section 4 presents the obtained results. Section 5 connects our results with those found in the literature and discusses their implications on the processing of geostationary observations. Finally, Sect. 6 summarizes our findings and presents our conclusions.
The Earth consists of a near-spherical 3-D system, and must be well represented in atmospheric radiative transfer calculations for the retrieval of geophysical properties using satellite data. The general equation of radiative transfer can be expressed as
with I being the intensity, κext the extinction coefficient, ρ the medium density, ds an infinitesimal length and S the source function. When studying the Earth's atmosphere in visible and short infrared wavelengths, thermal emission can be neglected. The source function then represents scattering and absorbing processes, and can be expressed as:
with κsca being the scattering coefficient and P the phase function defining the probability of a scattered radiation being scattered inside the differential solid angle dΩ.
The general equation of radiative transfer (Eq. 1) and its source function (Eq. 2) depend on the geometry of the considered scene (Chandrasekhar, 1960). In particular, identifying the invariances of the considered scene and making reasonable assumptions is crucial to allow simplifications, and hence analytical solutions, to the radiative transfer equation. We will focus on the two most common geometrical assumptions made in atmospheric radiative transfer calculations: the plane-parallel approximation (PPA) and the spherical shell approximation (SSA).
2.1 The Plane-Parallel Assumption
The PPA neglects the Earth's curvature by defining the surface and all the atmospheric layer boundaries as infinite parallel horizontal planes. This approximation allows to simplify the equation of radiative transfer (Eq. 1) by making it depend on three variables only, which are the altitude z, the zenith angle θ and the azimuth angle φ. Equation (1) can then be expressed as (Chandrasekhar, 1960; Lenoble, 1993):
and can be written as follows by merging it with Eq. (2):
The plane-parallel assumption enables the use of simple analytical resolutions of the radiative transfer equation, which drastically lower the computation time. PPA is therefore frequently made in radiative transfer solvers such as the discrete ordinate radiative transfer (DISORT) solver (Stamnes and Conklin, 1984), included in the libRadtran software (Emde et al., 2016), the Doubling-Adding (DOAD) method (Hansen, 1971), available in the ARTDECO software (https://www.icare.univ-lille.fr/artdeco/, last access: 27 April 2026) and the modified Sobolev approximation analytical solver (Katsev et al., 2010), used for aerosol properties retrieval from Meteosat satellite data (Ceamanos et al., 2023).
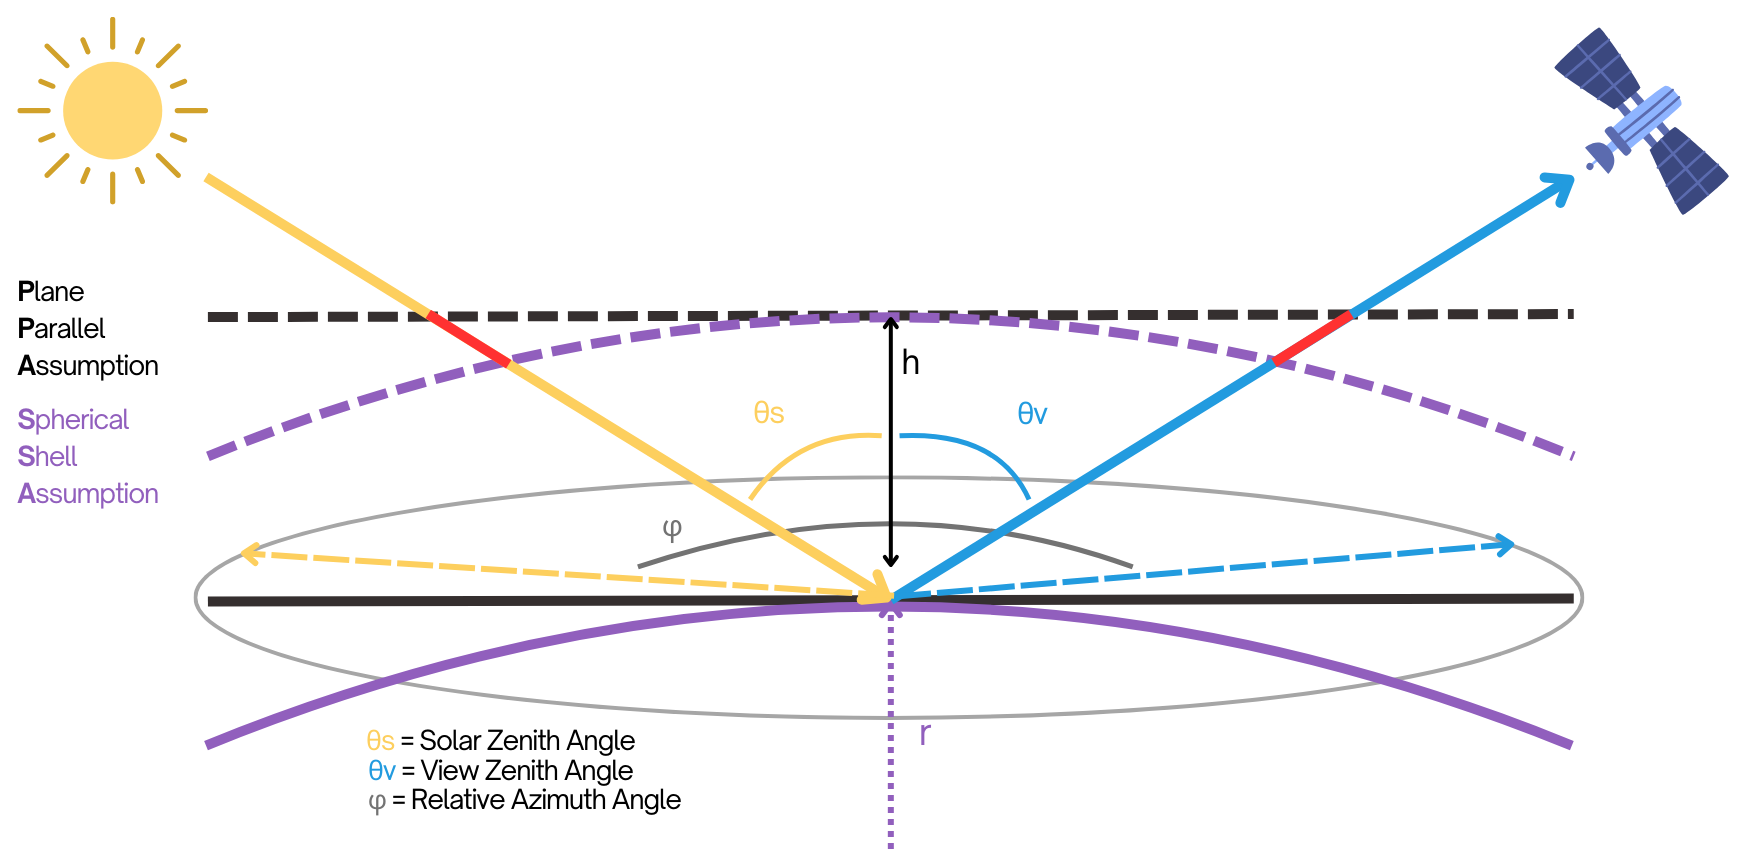
Figure 1Schematic diagram of the PPA and SSA geometries, highlighting the optical path error (in red color). h is the altitude of the atmosphere, r is the Earth radius, θs is the solar zenith angle, θv is the view zenith angle and φ is the relative azimuth angle.
In Sect. 2.3, we show how PPA is found to be accurate in several studies for angular geometries close to the zenith/nadir configurations, but limited for high zenith angles. Figure 1 illustrates the geometric differences between the plane-parallel assumption and the true Earth's sphericity (represented by the spherical-shell assumption described in Sect. 2.2). One can see that neglecting the Earth's sphericity leads to an overestimation of the thickness of the atmosphere, and therefore of the optical path (colored in red on the figure). This miscalculation can induce important inaccuracies in the simulated TOA reflectances, which in turn can negatively impact the estimation of surface and aerosol properties. It is worth noting that these errors may grow with view and solar zenith angles (due to the increase in the optical path error when using PPA), which may become especially important in the case of geostationary satellites allowing observations in a broad angular range.
2.2 The Spherical-Shell Assumption
The SSA assumes a spherical Earth's surface, surrounded by a multi-layer spherical atmosphere defined by their corresponding radii as shown in Fig. 1. This assumption is closer to reality than the PPA, and can be implemented in various ways depending on the level of precision required.
First, radiative transfer codes referred to as pseudo-spherical methods integrate SSA corrections in otherwise PPA-based solvers. Following the statement by Sekera and Dave (1961) that most of the multiple scattering occurs in a narrow cone around the zenith, many pseudo-spherical methods consist in computing single scattering in SSA for both incident and reflected beams, while calculating the contribution of multiple scattering in PPA. This approach was already applied by Deluisi and Mateer (1971) for ozone vertical distribution estimation purposes. More recently, a similar logic is found in the enhanced pseudo-spherical method (Spurr et al., 2022) implemented in LIDORT and VLIDORT, respectively the linearized and vector upgrades of the discrete-ordinates RT code DISORT (Spurr and Christi, 2019), and in the radiative transfer solver RTSOS (radiative transfer model based on the successive order of scattering; Zhai and Hu, 2022). Another well-known pseudo-spherical approach was developed by Ding and Gordon (1994) in the atmospheric-correction scheme developed for the SeaWiFS (Sea-Viewing Wide-Field-of-View Sensor) satellite mission. There, the contribution of Rayleigh scattering to the total radiance is calculated using a SSA geometry, while the remaining pieces of the radiative transfer algorithm are calculated in PPA.
Second, radiative transfer algorithms based on Monte Carlo methods allow simulations in true spherical geometry by modeling particle-based light propagation. These statistical approaches relying on random sampling of backward-scattered photons were first used for radiative transfer purposes by Marchuk and Mikhailov (1967). More recently, one can cite the well-known Monte Carlo based MYSTIC (Monte Carlo code for the physically correct tracing of photons in cloudy atmospheres) solver from the libRadtran package (Mayer and Kylling, 2005; Emde et al., 2016) and the radiative transfer code running on graphics processing units (GPU) named Speed-Up Monte Carlo Advanced Radiative Transfer code with GPU (SMART-G; Ramon et al., 2019), which is described in Sect. 3. These full-spherical RT codes have proven their accuracy even for high zenith angles configurations (Mayer et al., 2010; Ramon et al., 2019). However, their main limitation is the computation requirements that are significantly heavier than for PPA-based algorithms.
It is worth noting that the spatio-temporal resolution of FCI full-disk images (available every 10 min at 1 km resolution) makes full-spherical and pseudo-spherical radiative transfer codes unsuitable if near real-time data processing constraints must be met. Hence, this study will focus on assessing the errors caused by the use of the PPA in the context of geostationary satellites, in order to help develop approximate but fast corrections methods suited for operational applications.
2.3 Impact of Earth's sphericity on radiative transfer calculations
Rayleigh scattering is the main radiance-inducing atmospheric process in the short visible spectrum, corresponding to the first measuring channels of most geostationary satellite imagers. Since the main difference between the PPA and SSA geometries lies in the difference in the optical path traveled by the radiation, it will greatly affect Rayleigh scattering. First, we describe the distinct effects of Earth's sphericity in the occurrence of high SZA or high VZA, which results in different impacts on TOA radiances. While both geometries involve long optical path, they affect TOA radiance differently due to the fundamental differences between PPA and SSA (Adams and Kattawar, 1978).
At high SZA, the primary effect is due to the attenuation of the incoming solar beam. In PPA, the optical path of the direct solar beam scales as and tends toward infinity as SZA approaches 90°, leading in excessive extinction of the incident light. In contrast, the SSA geometry allows the solar beam to cross a finite atmosphere or illuminate layers tangentially (also known as the twilight effect), allowing more photons to interact and scatter. Consequently, PPA tends to underestimate the scattered radiance compared to SSA, inducing a negative bias in PPA-computed TOA radiances at the beginning and end of the day (i.e., when SZA is high). Although high VZA causes an analogue overestimation of the optical path, the difference is due to the integration path along the line of sight. In PPA, a high VZA implies an optical path through an infinite slab, artificially increasing the scattering optical depth and thus the Rayleigh signal. In SSA, in the contrary, a line of sight near the limb crosses a finite path before exiting. This finite path limits the amount of scattering contributing to the radiance compared to the infinite PPA path. As a result, PPA overestimates the observed radiance at high VZA, inducing a positive bias in PPA-computed TOA radiances near the edge of the geostationary field of view (i.e., where VZA is high) (Lenoble, 1993; Chowdhary et al., 2019; Frouin et al., 2019).
However at larger wavelengths, in the red and near-infrared spectrum, Rayleigh scattering becomes weak while molecular absorption grows important, becoming the main process to affect radiation propagation in the atmosphere. Although many earlier studies have studied the Earth's sphericity effects, and specifically the impacts of using PPA over SSA on TOA radiance simulations, depending on the scene's geometry (Adams and Kattawar, 1978; He et al., 2018; Xu et al., 2023), we find a lack of studies on sphericity effects in the red and near infrared, and on the assessment of such effects in weak Rayleigh diffusion and therefore more gas-absorbing dominated wavelengths. Furthermore, discrepancies exist in the literature regarding the angular thresholds beyond which the PPA should not be used, which can be explained by the differences in the requirements of each study. Indeed, the simulations configurations vary depending on the research application, and therefore the quantification of the PPA impact is given for application-specific parameters including the scene's geometry, the atmosphere description, the wavelength of observation, the consideration or neglect of polarization, etc. The following literature review aims to give an order of magnitude of the sphericity effects and the validity of PPA depending on the sun-sensor geometry.
Regarding view zenith angle, Adams and Kattawar (1978) found that using PPA geometry instead of SSA with VZAs > 60° could cause errors up to 20 % in simulated TOA radiances in a Rayleigh scattering atmosphere of optical thickness 0.25 over a black surface. Xu et al. (2023) confirmed that VZAs > 60° can lead to important relative errors between PPA and SSA simulations in their case study, up to to 12 % on TOA Rayleigh scattering radiances at 412 nm over a flat sea surface depending on the value of SZA (both zenith angles are limited to a maximum value of 85° in this study). It is worth noting a general lack of VZA-dependent studies, which makes difficult to reach a consensus on the validity of PPA according to view geometry. As for solar zenith angle, several works tried to identify the SZA value above which SSA should be preferred over PPA. For example, Adams and Kattawar (1978) found that SZA = 72° caused a relative error of 4 % between the radiance computed with PPA and SSA geometries. Ding and Gordon (1994) showed that the absolute relative error on TOA Rayleigh radiances exceeds 2 % for SZAs > 80° for all VZA values at 412 nm over a smooth ocean surface in the cross azimuthal plane and concluded their study on the comparison between PPA and SSA performances for ocean color purposes by stating that “the effects of the curvature are negligible for SZA values below 70°”. He et al. (2018) showed that SZA = 75° at 412 nm over a flat sea surface caused a 1 % relative error between PPA and SSA computed Rayleigh radiances, while SZA = 80° and SZA = 85° resulted in a 3 % and 12 % relative error, respectively. Korkin et al. (2020) relies on Lenoble (1993) and McCartney (1976) to state that SSA should be preferred for SZAs > 75°. Ramon et al. (2019) features examples of comparisons between PPA and SSA in a pure Rayleigh atmosphere of optical thickness 0.3262 at 412 nm over a black surface, showing the relative error exceeds 1 % from SZA values around 80°.
As expected due to the variability of radiative configurations and applications, our literature overview shows no evidence of a consensus on angular thresholds above which the Earth's curvature should be accounted for. One can also notice the predominance of ocean-color remote sensing-oriented studies assessing the effects of the Earth's curvature, due to the high precision requirements of such inversion purposes, in therefore short visible wavelengths where Rayleigh scattering predominates. Most importantly, there appears to be a lack of studies on the assessment of the sensitivity of common radiative parameters to the Earth's curvature, especially for the estimation of land surface parameters in the full shortwave range where Rayleigh scattering can be surpassed by molecular absorption in some instrumental channels. For example, the spectral dependency of sphericity effects are poorly documented, as well as the impact of the atmospheric profile and surface properties. In conclusion, we believe that there is a need for comparative studies establishing the specific configurations where PPA should not be applied, specifically in the scope of geostationary observations.
3.1 Overview
The experiments conducted in our study aim to assess the impact of sphericity effects on FCI shortwave observations, while also determining the key parameters on which these effects depend. The rationale of this work consists in comparing simulations in which only the geometry assumption (PPA or SSA) varies. An accurate Monte Carlo code is chosen for this purpose, as explained in Sect. 3.2. We consider various simulation cases, which allow us to assess the sensitivity of different radiative transfer parameters to the plane-parallel approximation. We aim to consider the broad angular ranges allowed by geostationary imagers by investigating the impact of the sun-sensor geometry, through the variation of VZA, SZA and the relative azimuth angle (RAA) (Sect. 4.1). We also carry out TOA reflectance simulations for several wavelengths corresponding to the selected shortwave FCI channels (i.e., important for aerosol and surface albedo retrieval) to find out if the effects of the Earth's sphericity vary spectrally or not (Sect. 4.2). For this purpose, we use the REPTRAN (representative wavelengths absorption parameterization applied to satellite channels and spectral bands) parametrization (Gasteiger et al., 2014) which enables realistic modeling of the gas absorption happening in FCI spectral channels. REPTRAN allow us to make fast satellite simulations with less than 1 % error with respect to accurate but expensive line-by-line simulations. This is achieved by running a few monochromatic simulations at “representative” wavelengths, which are then linearly recombined with appropriate weights. Both the wavelengths and the weights are determined by REPTRAN for each channel. Such parametrization is essential in our study to ensure proper simulations of molecular absorption processes. It is worth noting that although earlier works could assume pure Rayleigh scattering atmospheres by focusing on wavelengths with very low molecular absorption (see Sect. 2.3), we consider both Rayleigh scattering and molecular absorption in all our simulations since absorption cannot be neglected in the considered long visible and near-infrared channels. Realistic surface albedo values are tested to examine a possible dependency of the Earth's curvature effects on surface brightness (Sect. 4.3). Several standard atmospheric profiles are also investigated, in order to find out if changes in atmospheric composition and vertical distribution modulate sphericity effects (Sect. 4.4). Finally, we assess the impact of adding an aerosol layer (Sect. 4.5), with varying particle type, vertical distribution and optical thickness. All these parameters intervening in the radiative transfer simulation of TOA radiance were chosen to account for the typical variability observed in geostationary observations.
3.2 Radiative transfer solver: SMART-G
The Speed-Up Monte Carlo Advanced Radiative Transfer code with GPU is a statistical radiative transfer solver based on Monte Carlo processes that simulates light propagation in the surface-atmosphere coupled system (Ramon et al., 2019). It accounts for absorption and scattering by molecules and aerosols as well as light polarization and is valid over the entire solar spectrum. SMART-G enables top of atmosphere radiance simulations to run in either PPA or SSA configurations, which is a key feature to study the impacts of neglecting the Earth's curvature. A local estimate variance reduction feature allows radiance evaluation for each altitude and direction by considering the propagation of photons as a Markov Chain (Marchuk et al., 1980). The statistical error introduced by this process allows the solver to estimate the standard deviation of the radiance, which is provided as a simulation output, thereby enabling the calculation of an uncertainty.
SMART-G presents great consistency with well-validated Monte Carlo solvers such as MYSTIC and SASKTRAN-MC (Zawada et al., 2015), while being approximately 30 times faster (Zawada et al., 2021). Zawada et al. (2021) also showed the intensities simulated by these three radiative transfer solvers differed by less than 0.2 % for single scattering only, and by less than 1 % when accounting for multiple scattering.
One should note the word “photons” is used in this study for “virtual particles of light” that spread backwards in the computation, i.e. from the sensor to the sun, according to Monte Carlo related constraints. We acknowledge this is a misuse of language that does not cover its full definition given by quantum physics.
3.3 Experimental setup
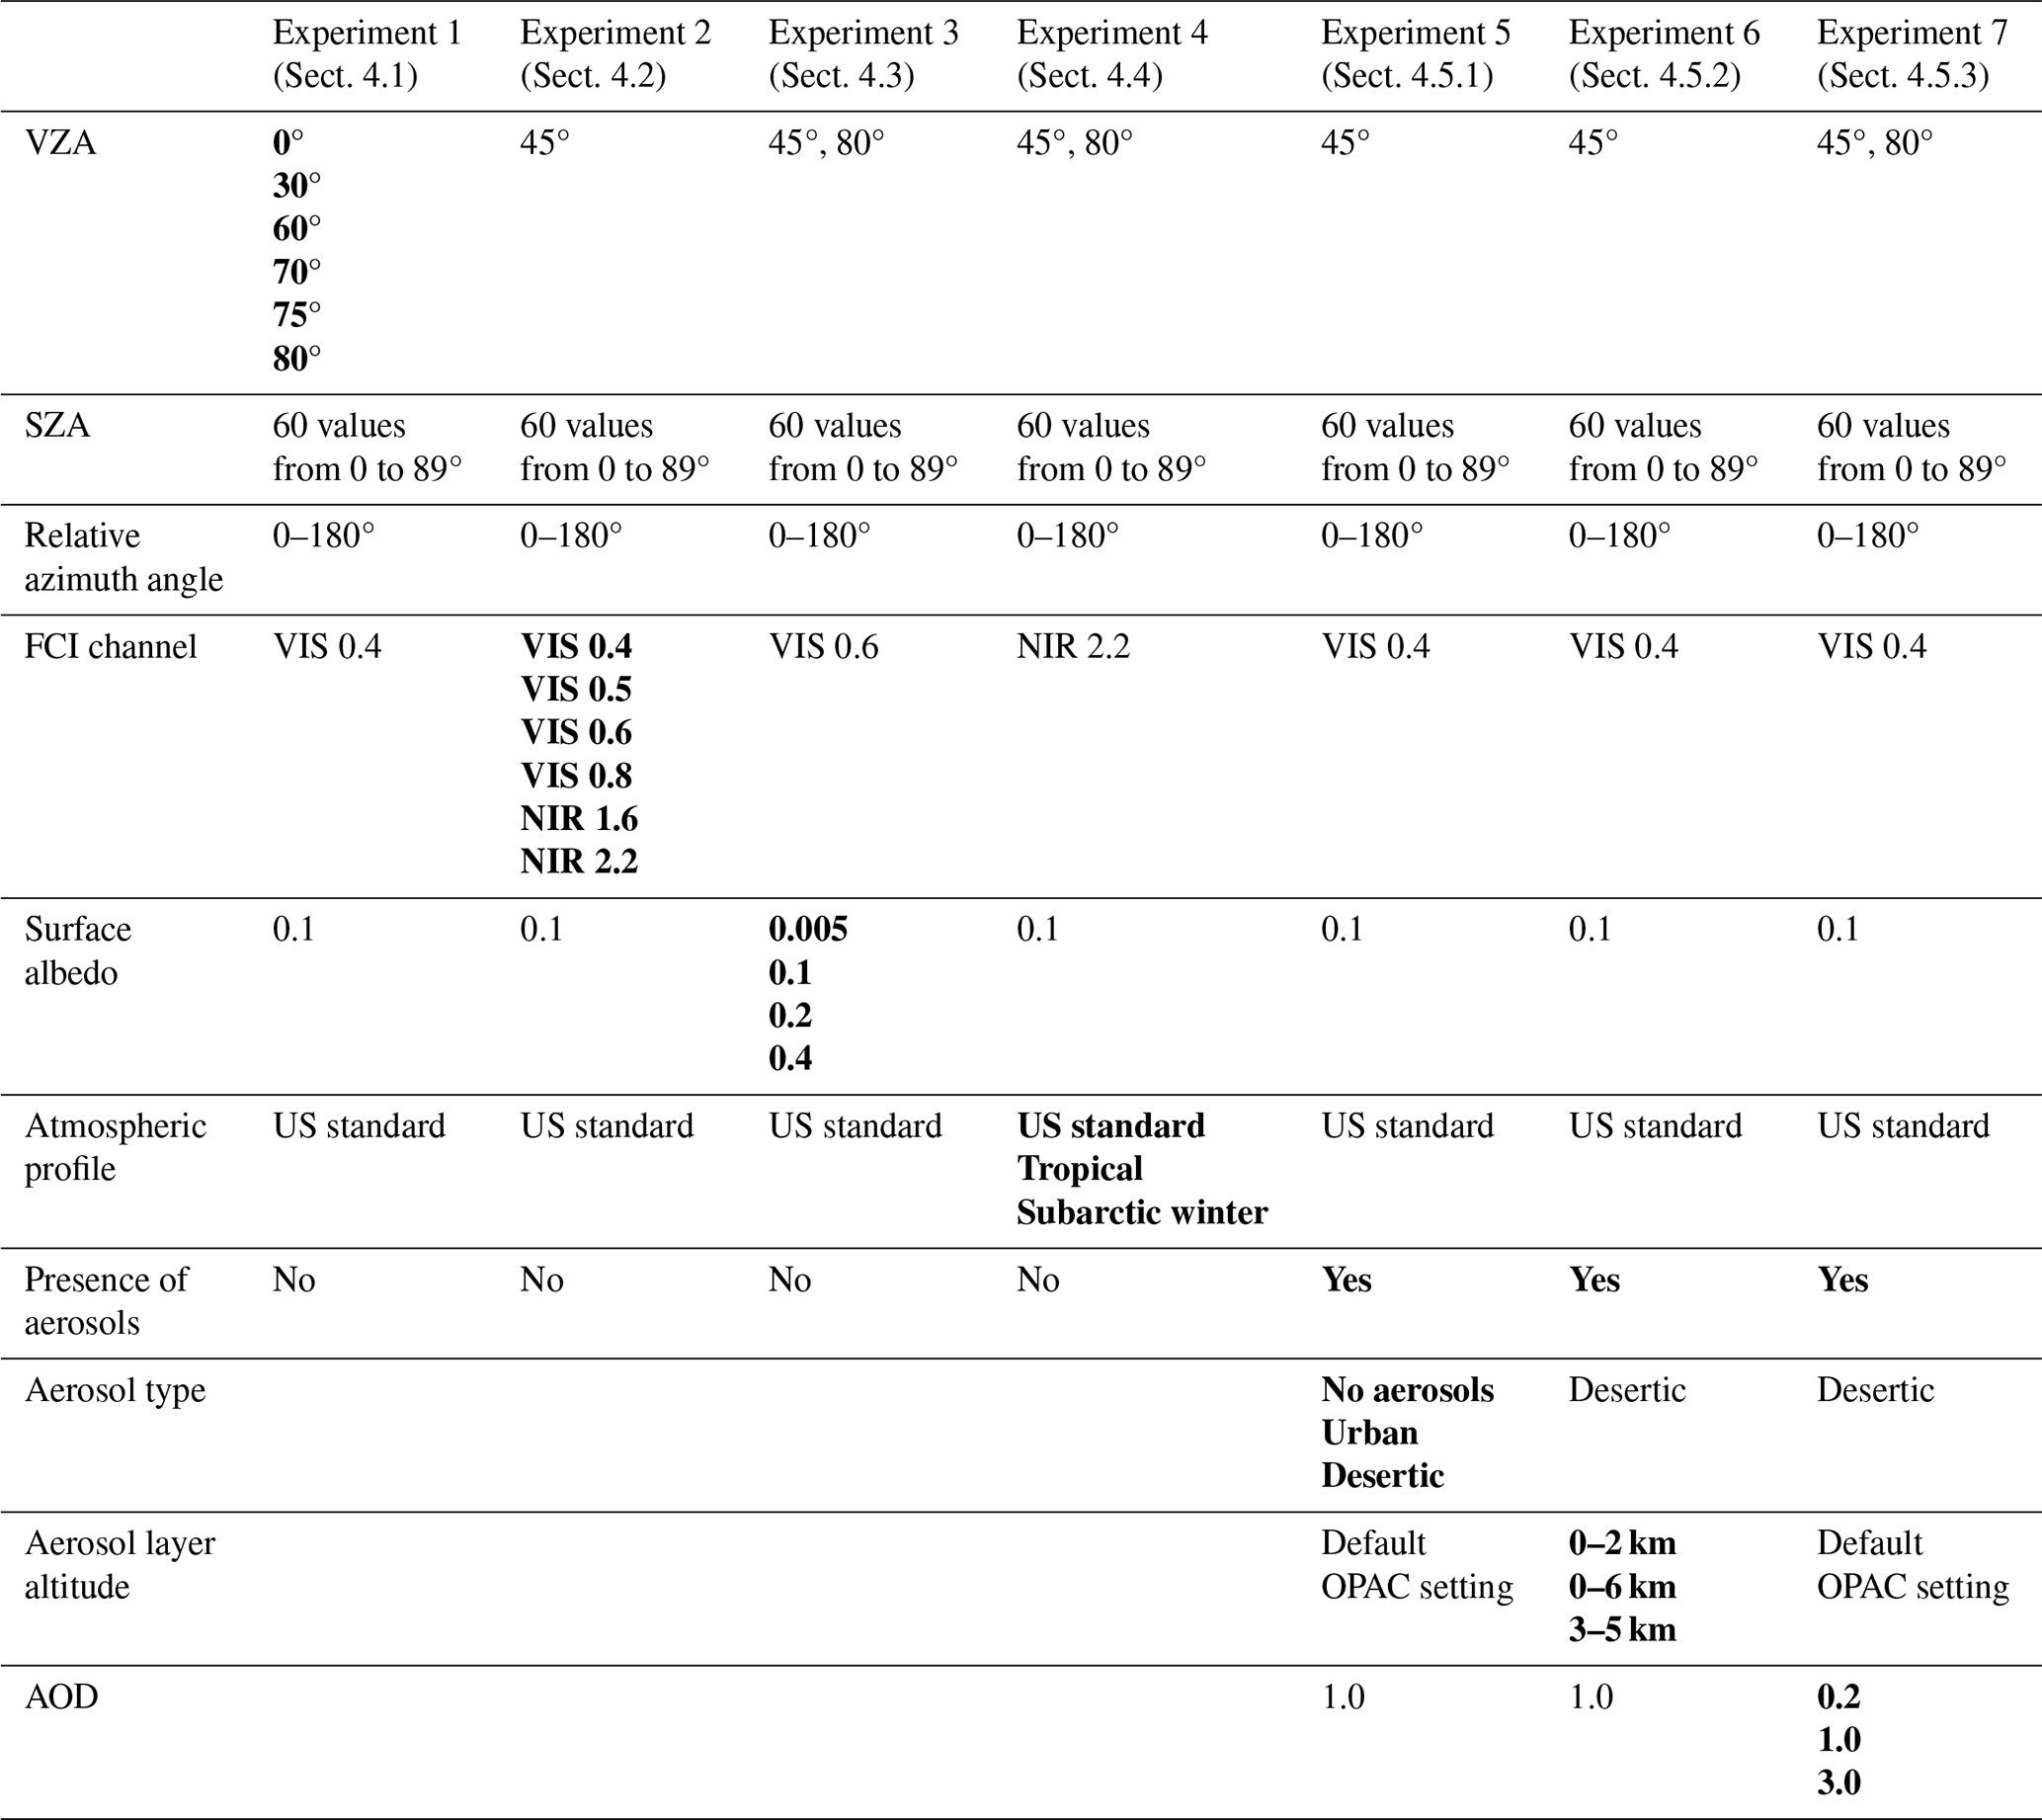
Our default setup consists of strictly similar simulations of TOA reflectance run twice, in PPA and SSA configurations. The simulations consist of sending photons in the visible (VIS) and near-infrared (NIR) wavelengths corresponding to FCI spectral channels of interest (using the REPTRAN parametrization in SMART-G) for joint aerosol and surface properties estimation: VIS 0.4 , VIS 0.5, VIS 0.6, VIS 0.8, NIR 1.6 and NIR 2.2, whose spectral characteristics can be found in Table 1. These photons propagate in a cloud-free gaseous atmosphere accounting for both Rayleigh scattering and molecular absorption for O3, H2O, NO2 and O2, with or without aerosol particles. The atmospheric profiles are selected among the Air Force Geophysical Laboratory (AFGL) atmospheric constituent profiles (defined in the altitude range of 0–120 km) (Anderson et al., 1986), while the aerosol properties are set using fine particle-dominated and coarse particle-dominated models defined in the Optical Properties of Aerosols and Clouds (OPAC) database (Hess et al., 1998). We also set a Lambertian surface, determined by an albedo value changing depending on the experiment. Simulations are computed for numerous solar zenith angle values to mimic a full day of geostationary observations and for several moderate and extreme sensor zenithal geometries, in the principal plane of relative azimuth (i.e., RAA = 0, 180°), which is convenient for examining the effects of aerosols. The configurations used to compute the results presented in Sect. 4 are summarized in Table 2. One should mention these same experiments were also conducted in the cross-principal plane of relative azimuth (i.e., RAA = 90, 270°). The results corresponding to the experiment exploring several spectral channels (see Sect. 4.2) can be found in Appendix B, but results from other experiments for the cross-principal plane are not presented here for the sake of brevity, and since they do not lead to different conclusions compared to the principal plane experiments.
Table 1Table listing the main spectral characteristics of the selected FCI channels (Holmlund et al., 2021), as well as the corresponding major absorbing gases in the atmosphere (Gasteiger et al., 2014).
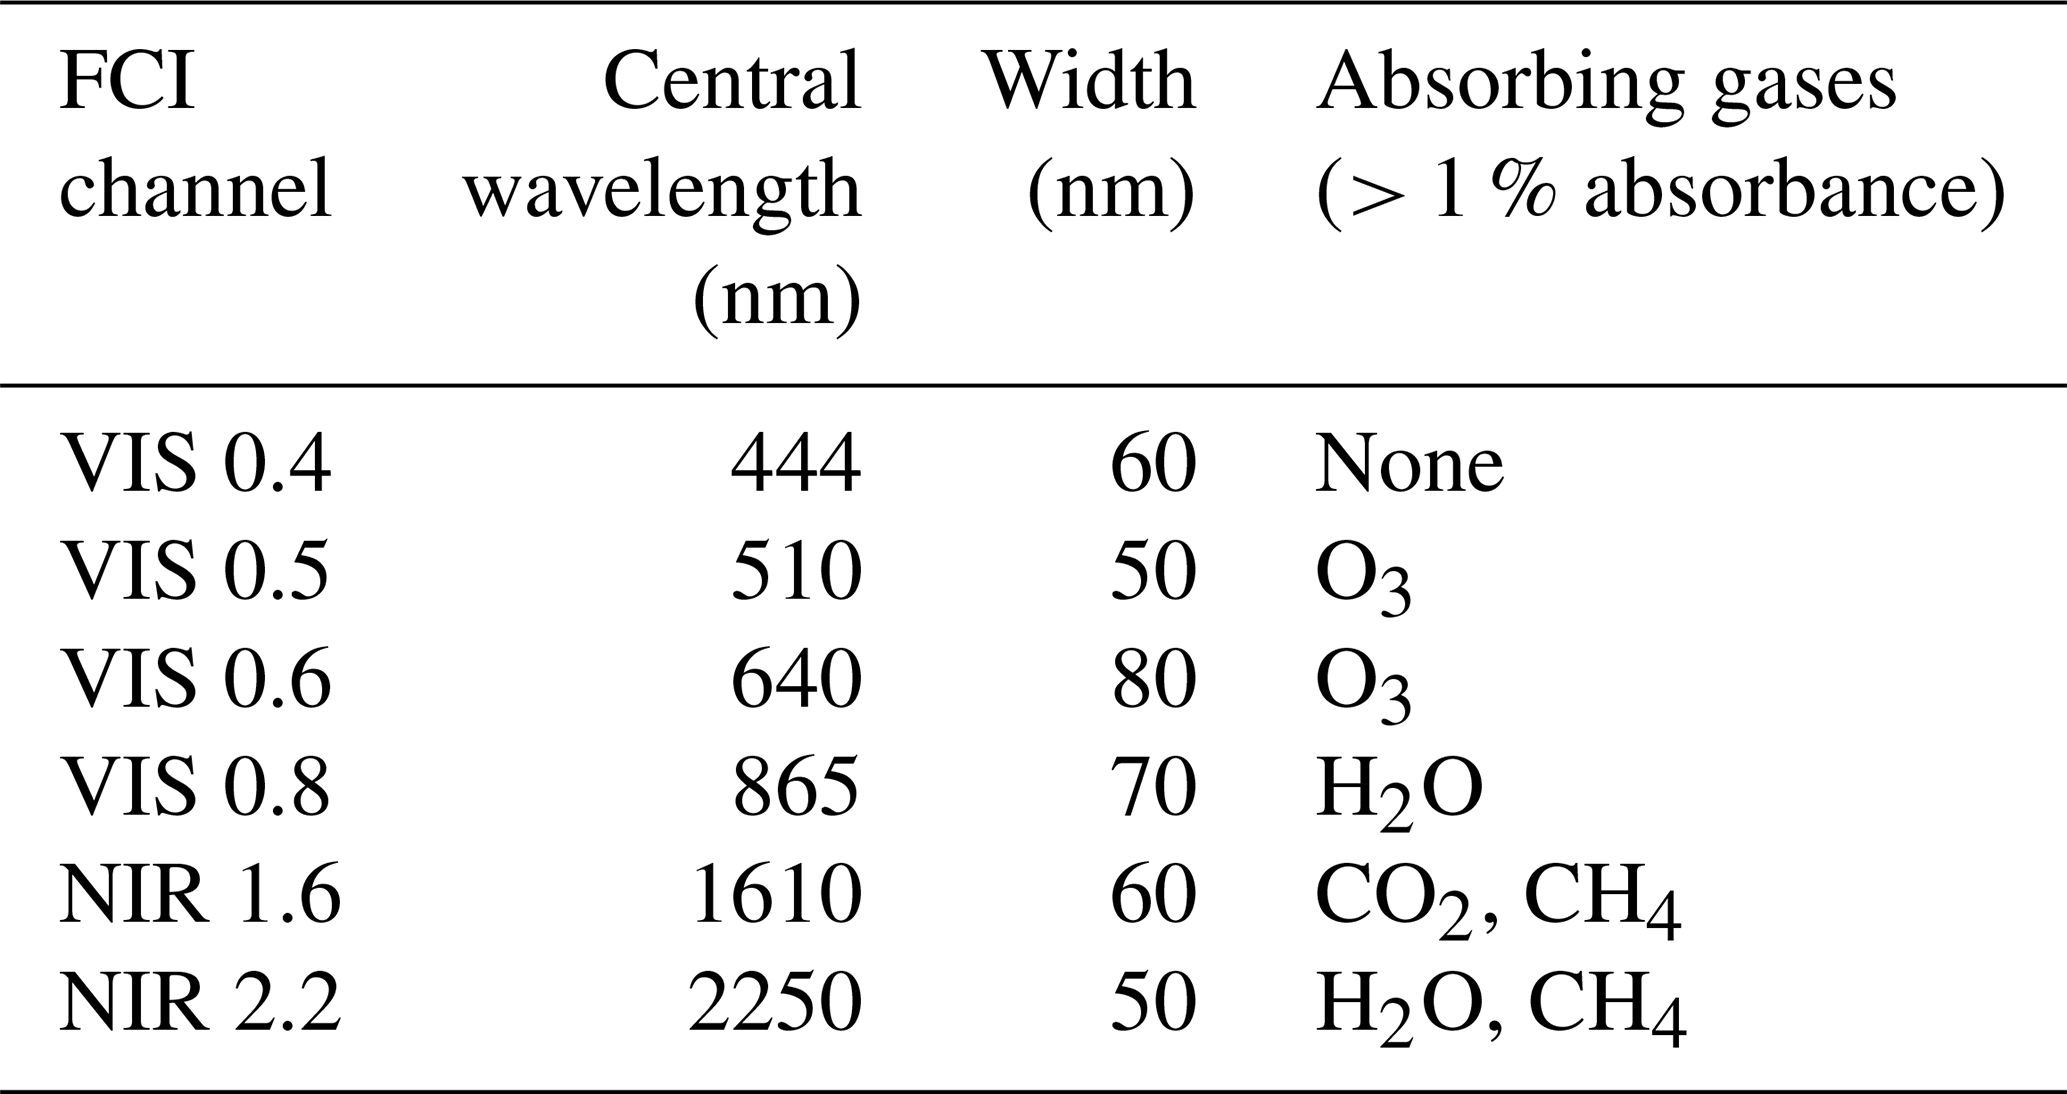
Table 2Summary table of the experimental setup corresponding to the results presented in Sect. 4. The parameter studied in each experiment is highlighted in bold letters.
3.4 Definition of PPA-induced bias
In order to analyze and compare our simulation results, we calculate the relative error as well as mean percentage error (MPE) and mean absolute percentage error (MAPE) scores between PPA and SSA simulated TOA reflectances. To clarify the statistical significance of each result, the plots of reflectance and relative error in reflectance consistently feature error bars corresponding to the calculated uncertainty, which corresponds to a 95 % trust interval (see Appendix A).
We define two criteria to conclude that the bias induced by the use of PPA is “significant”. The first criterion is an abrupt rise of the relative error value. This is intuitive, as we consider that the bias induced by the use of PPA becomes of importance as soon as the relative error between PPA and SSA TOA reflectances increases sharply. This means that a future compensation for the sphericity effects should start from the identified cut-off value. The second criterion, meant to be more quantitative than the first, is a threshold on the relative error between PPA and SSA TOA simulated reflectances. The acceptable error in aerosol optical depth remote sensing (an essential first step before surface properties retrieval) cannot however be determined straightforwardly, as it depends on many parameters including geometry, wavelength and aerosol-surface properties themselves (Ceamanos et al., 2023). However, in unfavorable conditions when aerosol sensitivity is low (e.g., in the occurrence of bright surfaces, or low aerosol scattering due to high scattering angles; Seidel and Popp, 2012; Georgeot et al., 2024), small errors on TOA reflectance can result in significant AOD biases, which in turn can result in biased surface reflectance. Therefore in this study we have decided to consider a 1 % error as the threshold above which the Earth's sphericity effects should be corrected.
4.1 Angular configuration
Figure 2a presents the simulated TOA reflectances both in PPA and SSA for VZA values of 0, 60, 70, 75 and 80°, as a function of SZA across the principal plane, i.e. mimicking the full diurnal cycle of an imaginary location observed from the geostationary orbit. We consider FCI channel VIS 0.4 centered at 444 nm, in a aerosol-free US standard AFGL atmosphere, with a Lambertian surface of albedo 0.1, in the principal azimuthal plane. For VZA = 0°, the reflectance appears constant for SZA values below 60° in both PPA and SSA. The other curves suggest that the reflectance increases with the VZA. Indeed, when VZA increases, the illuminated volume observed by the satellite sensor grows, and thus the TOA reflectance increases too, as explained in Sect. 2.3. We also notice an asymmetry in the reflectance values around noon (SZA = 0°) for VZA values different than 0°. Indeed, when VZA is non-zero, the intensity received by the satellite varies depending on whether it is in backscattering mode (RAA = 0°) or forward scattering mode (RAA = 180°). For all VZA values, the PPA and SSA reflectance curves split above SZA = 80°. The SSA reflectances continue increasing since fewer solar beams reflect on the surface before reaching the sensor. Meanwhile, the PPA reflectances start dropping since considering an infinite plane surface does not account for this reduction of the amount of reflections. Moreover, as explained in Sect. 2.3, PPA leads to an overestimation of the solar beam attenuation in Rayleigh-dominated wavelengths.
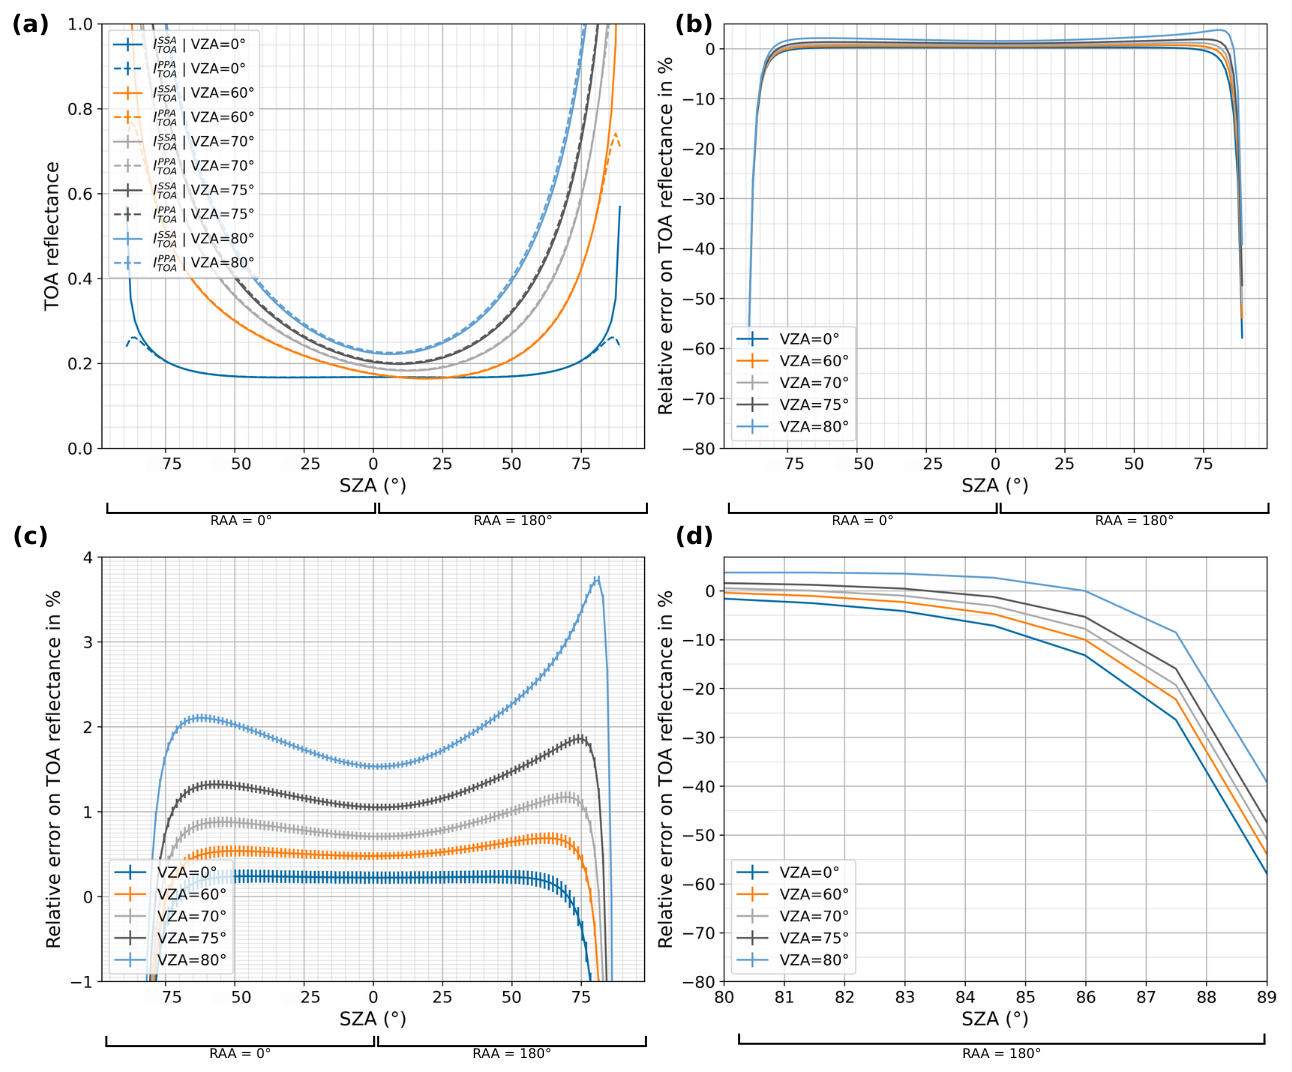
Figure 2Comparison of PPA and SSA simulations for several VZA values as a function of SZA, for channel VIS 0.4 in a US standard aerosol-free atmosphere with a Lambertian surface of albedo = 0.1, in the principal relative azimuthal plane, with 1 × 10⁷ photons. (a) Simulated TOA reflectances. (b) Calculated relative error between PPA and SSA simulated TOA reflectances. (c) Same plot zoomed-in between −1 % and 4 %. (d) Same plot zoomed-in for SZA over 80°.
Table 3Mean relative errors between PPA and SSA simulated TOA reflectances for several VZA values and ranges of SZA, for channel VIS 0.4 in a aerosol-free US standard atmosphere with a Lambertian surface of albedo 0.1 in the principal relative azimuthal plane, with 1 × 10⁷ photons.
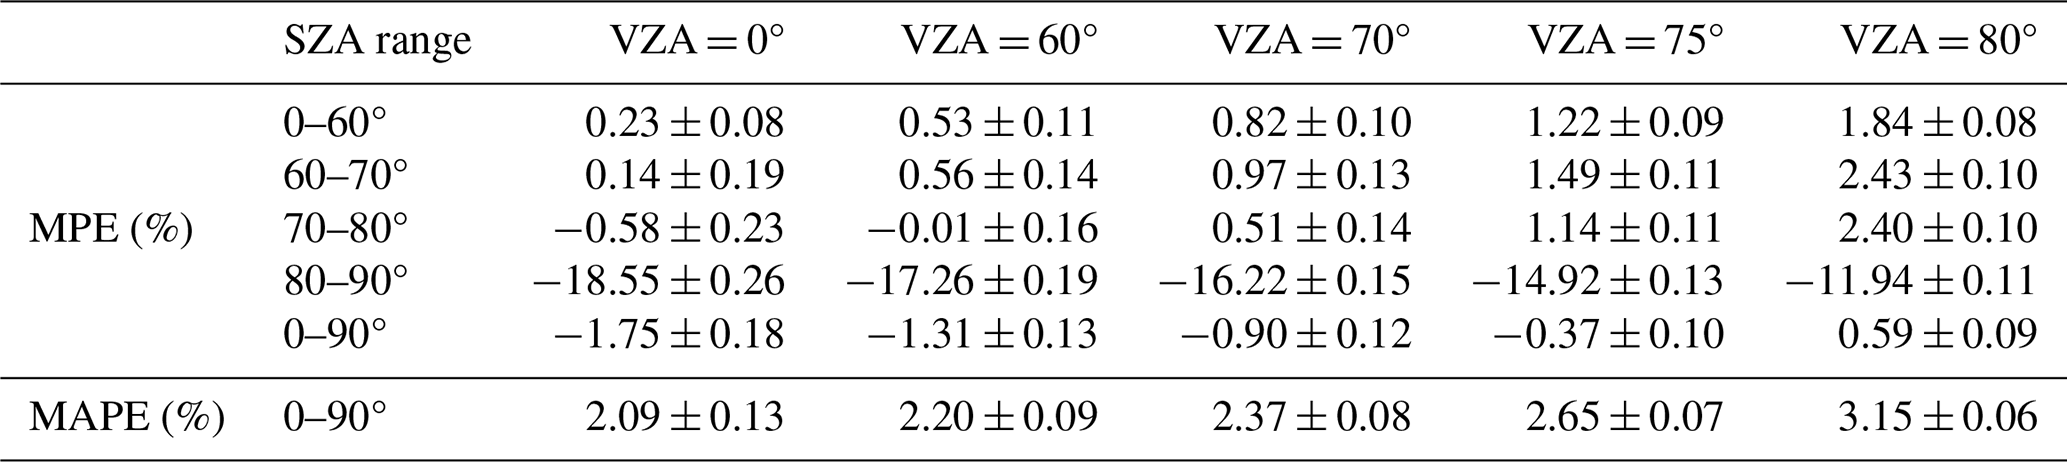
Figure 2b features the relative error computed between PPA and SSA simulated TOA reflectances for each angular configuration shown in Fig. 2a. Figure 2c and d are the same plot zoomed respectively on the plateau and on the drop of the relative error curves. In these plots, we can see how the absolute relative error generally increases with VZA and exceeds 1 % at all times for VZA ≥ 75°, as one can also see in Table 3 summarizing all the obtained statistics. To fully understand these results, we need to keep in mind the opposite effects high VZA and high SZA have on simulated intensities in Rayleigh-dominated wavelengths. As explained in Sect. 2.2, high SZA values result in an underestimation of TOA intensity by the PPA compared to SSA, causing a negative bias in the resulting relative error according to Eq. (A1). This explains the sudden drop in the relative error curves, which for example starts around SZA = 60° for the VZA = 0° curve and causes the relative error to reach a MPE of −18.55 ± 0.26 % for SZA ∈ [80°;90°]. In contrast, high VZA values result in an overestimation of TOA intensity by the PPA compared to SSA, resulting in a positive bias in the relative error according to Eq. (A1). This can be observed when VZA = 80° and SZA ∈ [0°;60°], where the MPE is 1.84 ± 0.08 %. The combination of these two phenomena explains the increase preceding the drop of the relative error curves, causing this drop to occur at higher SZA values for high VZA values. This also explains why the MPE between the PPA and SSA simulations in the [80°;90°] range reaches only −11.94 ± 0.11 % for VZA = 80° against −18.55 ± 0.26 % for VZA = 0°. It also enables the understanding of the near-zero MPE values in the [70°;80°] SZA range for moderate VZA values. Indeed, the underestimation induced by high SZA values starts prevailing, causing the relative error to drop and eventually become negative, creating a transition region where the error appears to be extremely small despite the multiple biases arising.
These results demonstrate that the impact of the PPA highly depends on both SZA and VZA. According to the first criterion on the sharp increase of the PPA-induced relative error (defined in Sect. 3.4), we can affirm that not taking into account the Earth's curvature by using a PPA instead of a SSA geometry when simulating TOA intensities has a major impact for SZA values exceeding 70°. The errors induced by high VZA values are lower, but according to the second criterion (defined in Sect. 3.4), we still consider their impact to be significant beyond 70° as the relative error exceeds 1 % in such configurations.
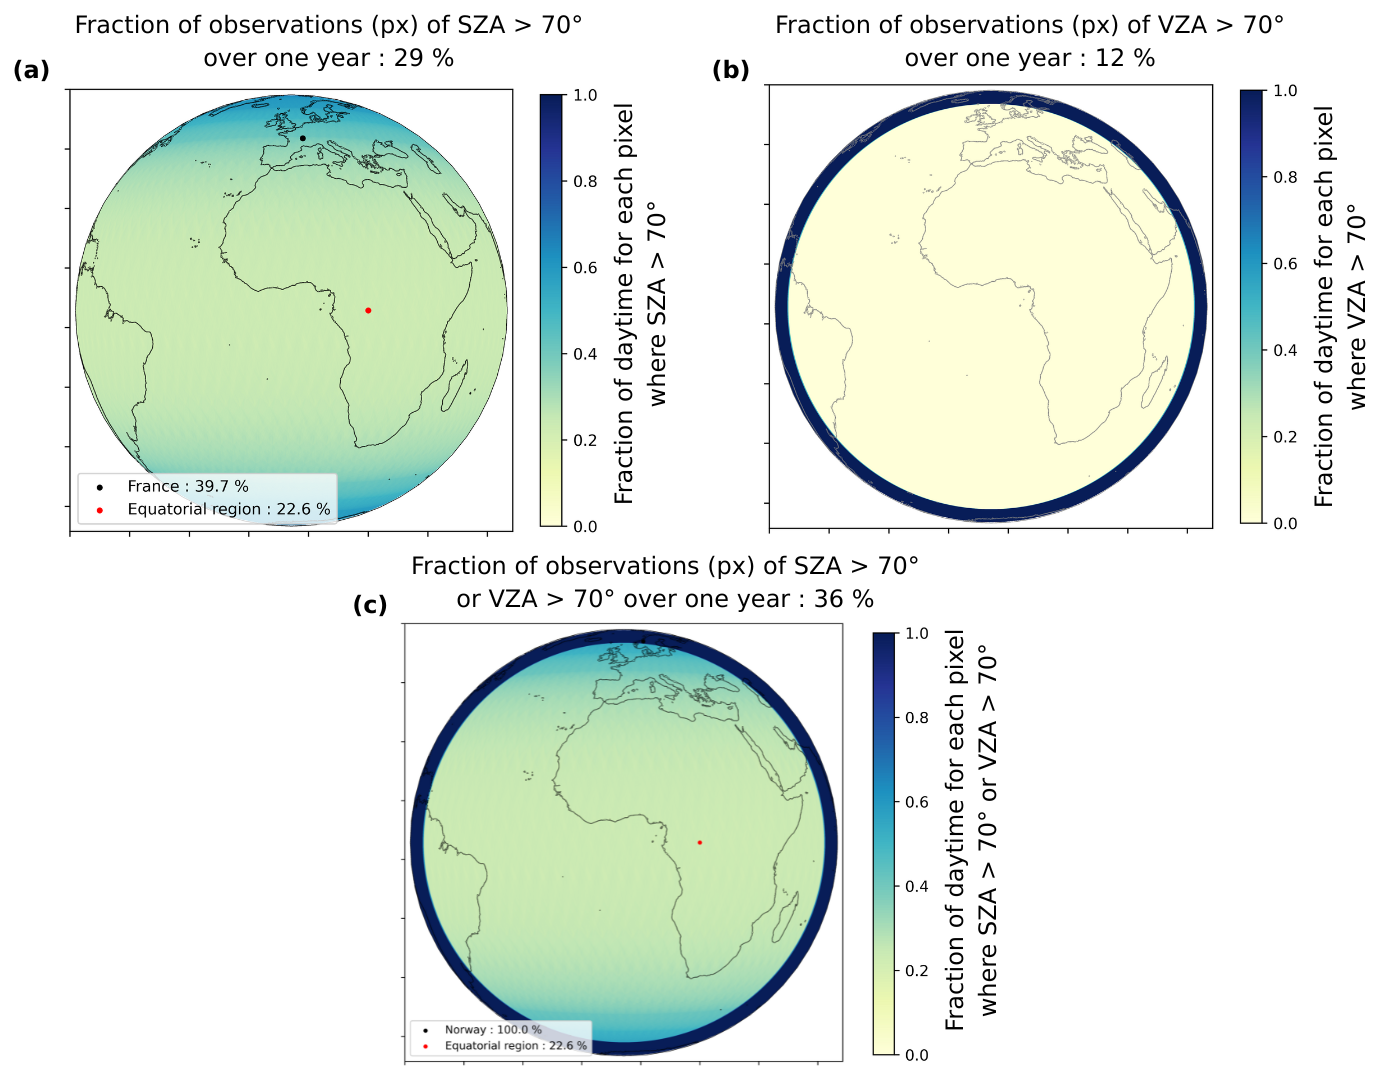
Figure 3Maps of the FCI field-of-view featuring the fraction of daytime each pixel is affected by high SZA (a), high VZA (b) and either high SZA or VZA (c).
4.1.1 Implications for FCI
In order to quantify the impact of such angular thresholds on geostationary data processing, we compute the fraction of pixels affected by high zenith angles on the FCI field-of-view over one year. Figure 3a and b feature the fraction of daytime each pixel is observed with an angle value exceeding the 70° thresholds previously identified, respectively for SZA and VZA, over one year. As expected, the entire field-of-view is affected by high SZAs at some point during the day, with a minimum of 23 % of daytime at the equator and increasing up to more than 50 % of daytime for high latitudes such as Northern Europe. When averaged over the full disk, 29 % of data corresponds to SZA > 70°, and 12 % of data corresponding to the edges of the field of view is related to VZA > 70°. Figure 3c features the fraction of daytime each FCI pixel is seen under either high SZA or VZA. When averaged over the entire field of view, we find that 36 % of all observations over one year correspond to the zenithal configuration in which PPA-induced errors are considered significant.
4.2 Wavelength
Figure 4a presents the simulated TOA reflectances both in PPA and SSA for the VIS 0.4, VIS 0.5, VIS 0.6, VIS 0.8, NIR 1.6 and NIR 2.2 FCI visible and near-infrared channels interesting for albedo and aerosol retrieval, as a function of SZA. We consider an aerosol-free US standard AFGL atmosphere using REPTRAN to account for molecular absorption, for a VZA of 45°, with a Lambertian surface of albedo 0.1, in the principal azimuthal plane. The simulated TOA reflectance is visibly higher in the blue than in the green and even higher than in the red and infrared channels, which can easily be explained by the contribution of the Rayleigh scattering in the simulated standard atmosphere that is added to the surface albedo of 0.1. The PPA and SSA curves start diverging for SZAs around 80° for the three channels in the visible spectrum, with the SSA reflectances still increasing and the PPA reflectances starting to diminish. This divergence is more difficult to discern for the three near-infrared curves.
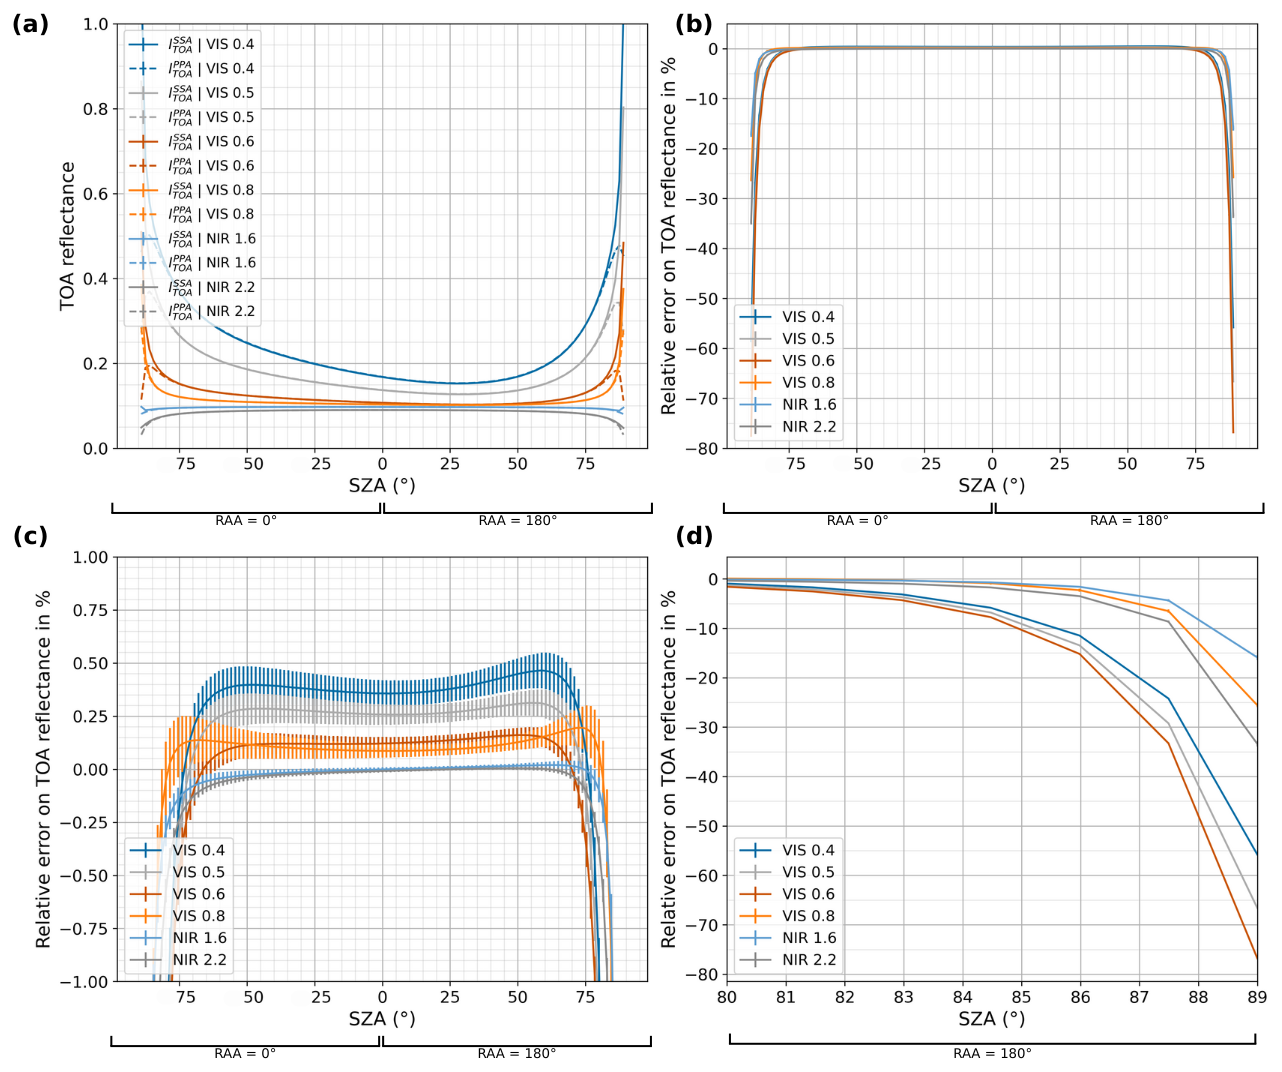
Figure 4Comparison of PPA and SSA simulations for several FCI VIS and NIR spectral channels as a function of SZA, with VZA = 45° in a US standard aerosol-free atmosphere with a Lambertian surface of albedo 0.1, in the principal relative azimuthal plane, with 1 × 10⁷ photons. (a) Simulated TOA reflectances. (b) Calculated relative error between PPA and SSA simulated TOA reflectances. (c) Same plot zoomed-in between −1 % and 1 %. (d) Same plot zoomed-in for SZA over 80°.
Table 4MPE and MAPE between PPA and SSA simulated TOA reflectances for several FCI spectral channels as a function of SZA ranges, in a aerosol-free US standard atmosphere with a Lambertian surface of albedo 0.1, with VZA = 45° in the principal relative azimuthal plane, with 1 × 10⁷ photons.

Figure 4b features the relative error computed between PPA and SSA simulated TOA reflectances for all channels as a function of SZA. Figure 4c and d show the same plot focused respectively on the plateau and on the drop of the relative error curves. For moderate SZAs, the relative errors are very close between the simulations in VIS 0.5 and VIS 0.6, and between the simulations in VIS 0.6 and VIS 0.8, as shown by the merging error bars. The NIR 1.6 and NIR 2.2 simulations stand out with relative errors respectively below 1 % and 2 % for SZA values below 85°. One can notice in Table 4 that for SZA < 60°, the relative error between PPA and SSA simulated TOA decreases when the wavelength increases (MPE = 0.39 ± 0.14 % for VIS 0.4, MPE = −0.01 ± 0.01 % for NIR 2.2). However for extreme SZA values over 80°, the relative error is larger in the red (MPE = −23.64 ± 0.23 % for VIS 0.6) than in the blue (MPE = −17.88 ± 0.23 % for VIS 0.4). This suggests that shorter visible channels present a stronger Rayleigh scattering-induced overestimation impact in PPA than longer visible channels, noticeable for moderate zenithal geometries. However, one can notice this effect does not persist for near-infrared channels for SZA values over 80° (MPE = −6.09 ± 0.58 % for VIS 0.8; MPE = −8.43 ± 0.47 % for NIR 2.2), since absorption is predominant in such wavelengths (see Appendix C for evidence).
These results highlight a dependency of the magnitude of PPA's impact on the wavelength for all zenith angles. We start to observe overall significant biases around SZA = 70° for all FCI channels, although near-infrared channels VIS 0.8, NIR 1.6 and NIR 2.2 appear less affected by the use of PPA. This implies that the FCI images used for aerosol and surface properties retrieval will undergo different sphericity effects depending on the spectral channel considered.
4.3 Surface albedo
Figure 5a presents the simulated TOA reflectances both in PPA and SSA for Lambertian surfaces of varying albedo and as a function of SZA. We consider FCI channel VIS 0.6 centered at 640 nm in a aerosol-free US standard AFGL atmosphere, for a VZA of 45°, in the principal azimuthal plane. The “red” FCI channel VIS 0.6 was chosen this time for assessing the dependency of the sphericity effects on surface albedo, since land surfaces show a greater albedo variability at 640 nm compared to 444 nm, where they are darker overall (Zoogman et al., 2016). Albedo values were set to 0.005, 0.1, 0.2 and 0.4, which in red wavelengths correspond to the following cover types: ocean, dense forest, grassland and sand desert.
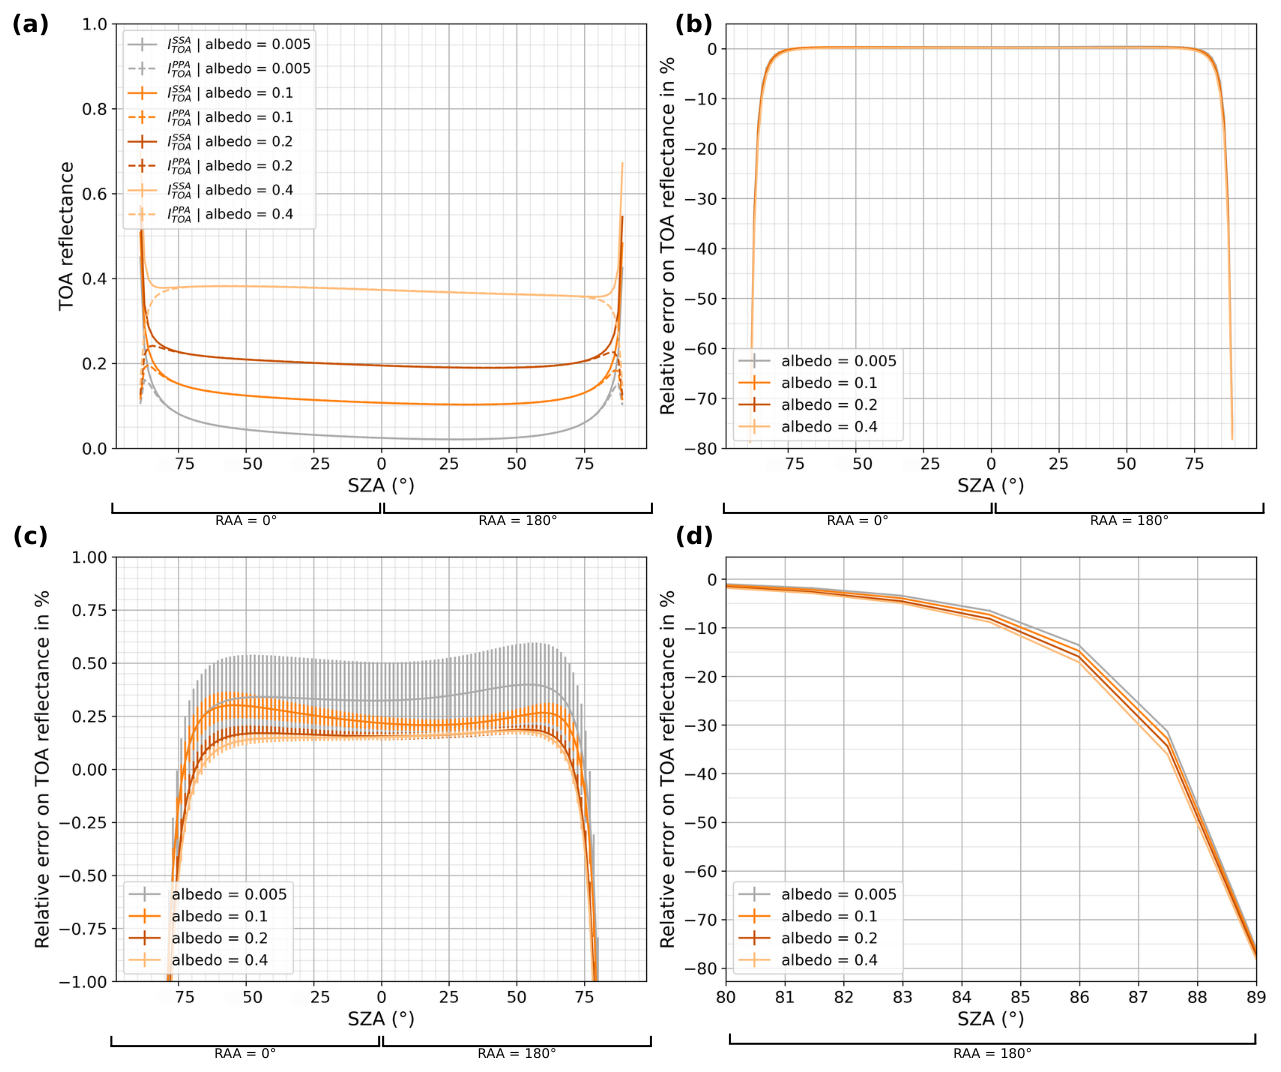
Figure 5Comparison of PPA and SSA simulations for several realistic continental surface albedo values for channel VIS 0.6 as a function of SZA, in a US standard aerosol-free atmosphere, with VZA = 45° and in the 0–180° relative azimuthal plane, with 1 × 10⁷ photons. (a) Simulated TOA reflectances. (b) Calculated relative error between PPA and SSA simulated TOA reflectances. (c) Same plot zoomed-in between −1 % and 1 %. (d) Same plot zoomed-in for SZA over 80°.
Figure 5a shows that simulated TOA reflectances are very low for a surface of near-zero albedo since the only radiance contribution comes from Rayleigh scattering in the atmosphere, which is rather weak around in VIS 0.6. As expected, reflectances are greater for surfaces of albedo 0.1, 0.2 and 0.4. We notice a splitting of the PPA and SSA curves which occurs around SZA = 75° for the 0.4 albedo reflectances, against SZA = 80° for the 0.005 albedo reflectances.
Table 5MPE and MAPE between PPA and SSA simulated TOA reflectances for several realistic continental values of surface albedo for channel VIS 0.6 as a function of SZA ranges, in a aerosol-free US standard atmosphere, with VZA = 45° in the 0–180° relative azimuthal plane, with 1 × 10⁷ photons.
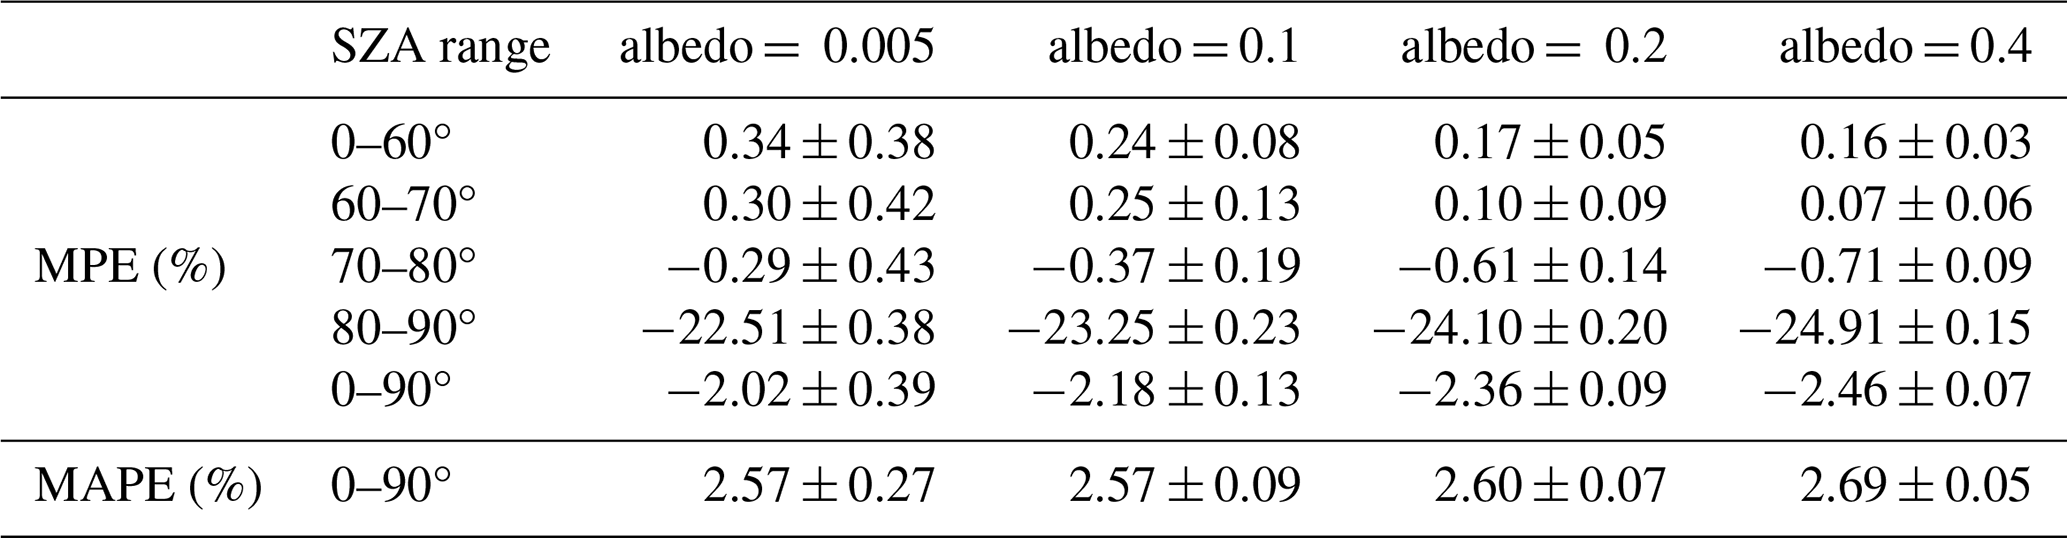
Figure 5b features the relative error between PPA and SSA simulations for each surface setting. Figure 5c and d show the same plot focused respectively on the plateau and on the drop. The relative errors for surface of albedo 0.1, 0.2 and 0.4 are extremely close, with MPE values of respectively 0.24 ± 0.08 %, 0.17 ± 0.05 % and 0.16 ± 0.03 % for SZAs < 60° as one can see in Table 5. For a surface of near-zero albedo and in the same angular configurations, the relative error between SSA and PPA simulations is more important (MPE = 0.34 ± 0.38 %), because molecular scattering and absorption are the only contributions in the computed reflectances, making the optical path differences more significant. One can notice the error bars are very large for this dark surface, which can be explained by the very small TOA reflectance values. However, for SZAs > 80°, the MPE is larger for an albedo of 0.4 (−24.91 ± 0.15 %) than for a surface of near-zero albedo (−22.51 ± 0.38 %), suggesting that the Earth's sphericity effects slightly depend on surface albedo.
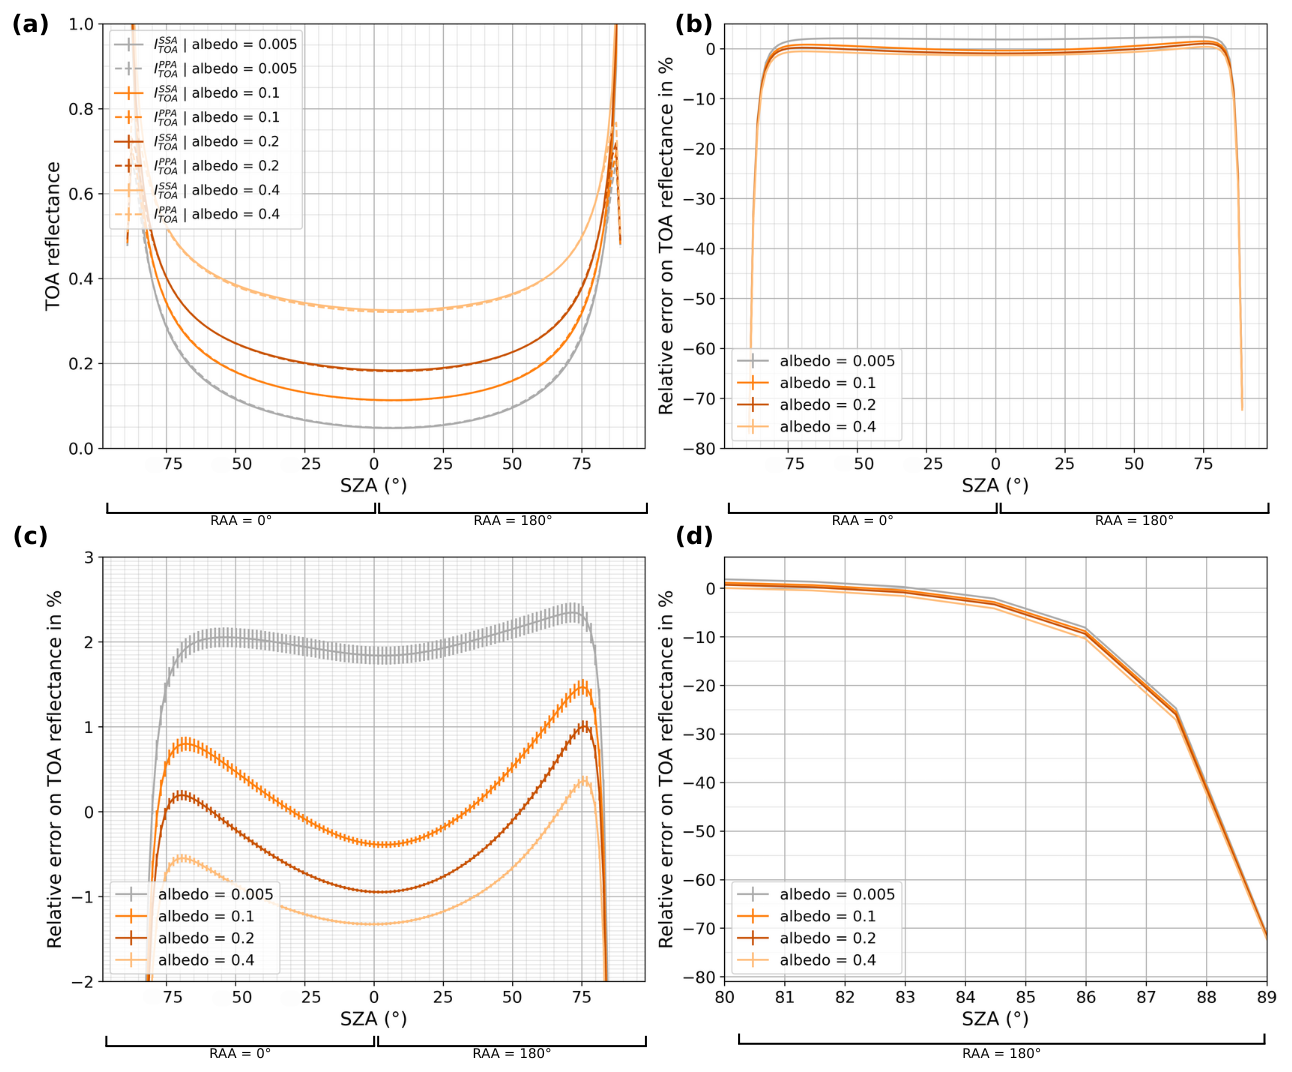
Figure 6Comparison of PPA and SSA simulations for several realistic continental surface albedo values for channel VIS 0.6 as a function of SZA, in a US standard aerosol-free atmosphere, with VZA = 80° and in the 0–180° relative azimuthal plane, with 1 × 10⁷ photons. (a) Simulated TOA reflectances. (b) Calculated relative error between PPA and SSA simulated TOA reflectances. (c) Same plot zoomed-in between −2 % and 3 %. (d) Same plot zoomed-in for SZA over 80°.
Figure 6 is the same as Fig. 5, but at VZA = 80° in order to explore more extreme geometries found in geostationary observations. This time, the curves are clearly separated from each other, even for moderate SZA values. One should note this experiment was also conducted for VZA = 70° (not shown), and a dependence of the relative error on surface albedo was also observed for all SZA values. This suggests that for high VZA (i.e., 70° and beyond), the value of surface albedo impacts the error caused by the use of the PPA.
Overall, we start to observe significant biases around SZA = 70°, and absolute relative errors reach more than 10 % for SZAs above 85° and more than 50 % for SZAs above 88°, regardless of the surface albedo. This leads to the conclusion that the Earth's curvature should be taken into account at least above SZA = 70°, regardless of the surface reflectivity. One should also note that the effects induced by the use of the PPA on simulated TOA intensities slightly vary depending on surface albedo, especially for SZA > 80° and VZA > 70°.
4.4 Atmospheric profile
Figure 7a presents the simulated TOA reflectances both in PPA and SSA for some selected AFGL atmospheric profiles (Anderson et al., 1986) as a function of SZA. We consider FCI channel NIR 2.2, for a 45° VZA, with a Lambertian surface of albedo 0.1, in the principal azimuthal plane, without aerosols. The investigated profiles are “US standard”, “tropical” and “subarctic winter” are chosen for their different temperature and molecular concentration profiles, making them appropriate to account for the diversity of atmospheric characteristics on Earth. The near-infrared FCI NIR 2.2 channel was chosen this time to investigate the impact of gas absorption on the Earth's sphericity effects. Indeed, Rayleigh scattering is the main radiance-inducing atmospheric process in short visible low-absorbing wavelengths, while fluctuations in Rayleigh optical depth between atmospheric profiles are below 1 % (Teillet, 1990), suggesting there will be no evidence of a possible dependency on the atmospheric profile in short wavelengths. However, the difference in water vapor concentration between the three selected profiles (see figures in Appendix 1 of Phulpin et al., 2023 for details) could have an impact on the sphericity effects in NIR 2.2, which is a channel specifically affected by water vapor absorption (see Table 1).
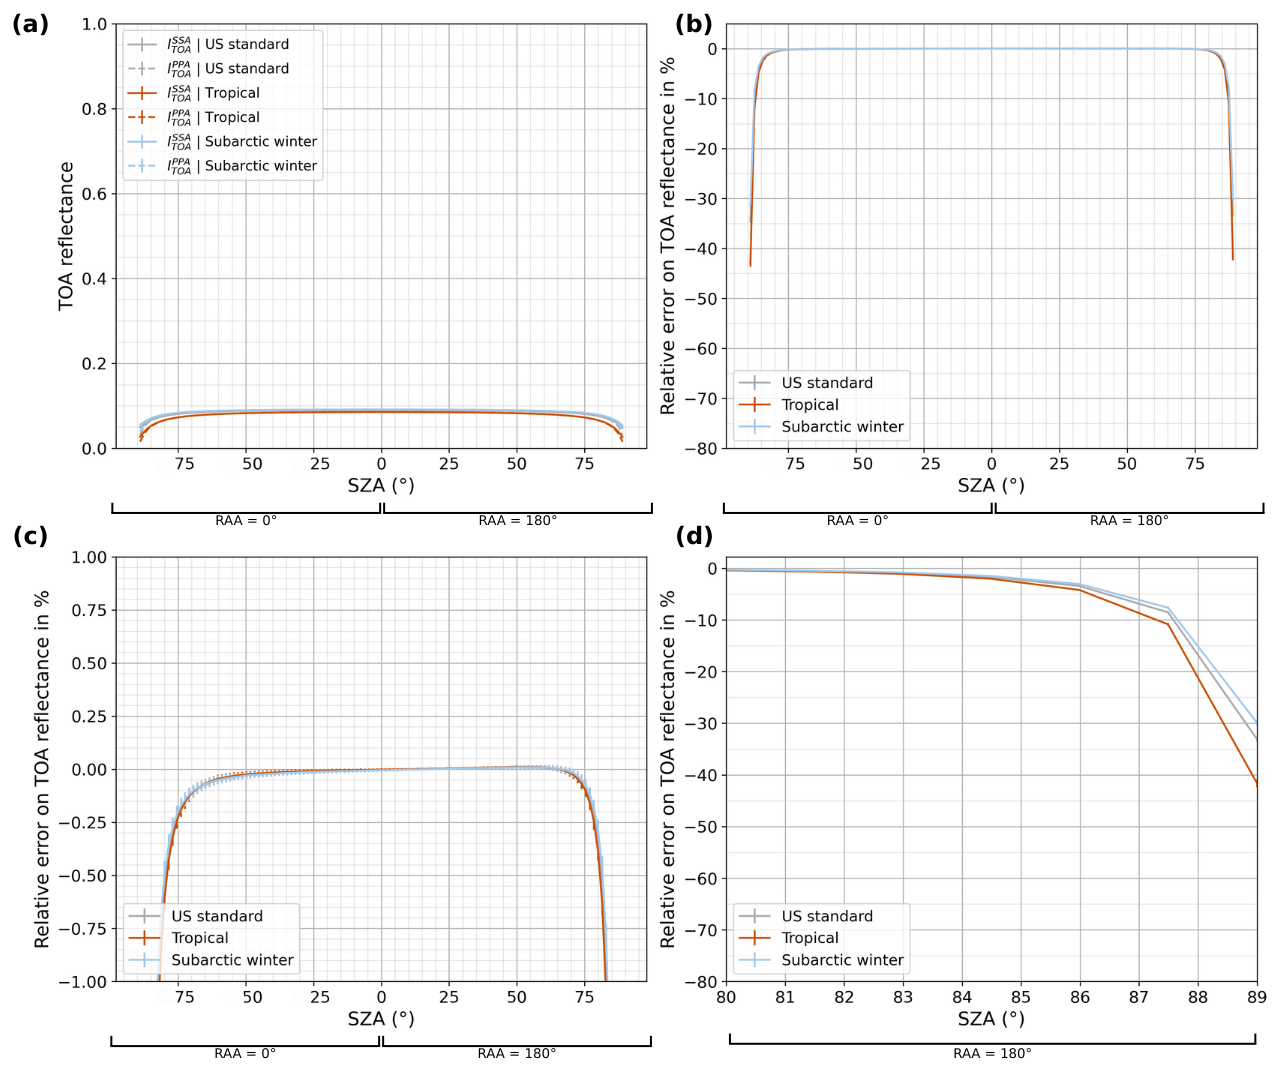
Figure 7Comparison of PPA and SSA simulations for several atmospheric profiles as a function of SZA, for channel NIR 2.2 in a aerosol-free atmosphere with a Lambertian surface of albedo 0.1, with VZA = 45° in the principal relative azimuthal plane, with 1 × 10⁷ photons. (a) Simulated TOA reflectances. (b) Calculated relative error between PPA and SSA simulated TOA reflectances. (c) Same plot zoomed-in between −1 % and 1 %. (d) Same plot zoomed-in for SZA over 80°.
Table 6MPE and MAPE between PPA and SSA simulated TOA reflectances for several atmospheric profiles as a function of SZA ranges, for channel NIR 2.2 in a aerosol-free atmosphere with a Lambertian surface of albedo 0.1, with VZA = 45° in the principal relative azimuthal plane, with 1 × 10⁷ photons.
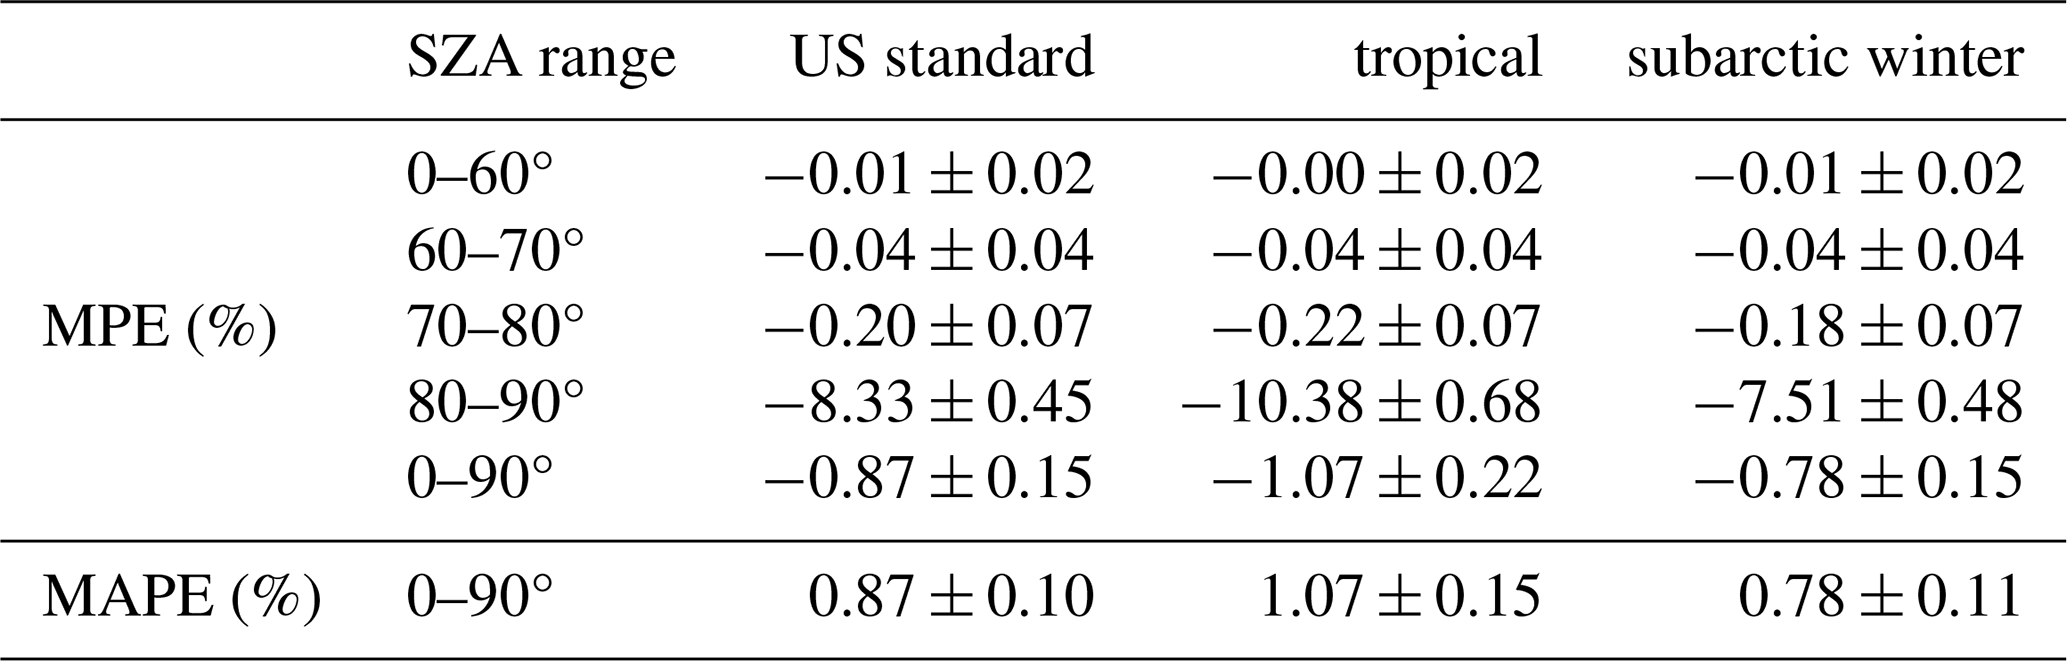
The first thing one can see in Fig. 7a is PPA simulated reflectances are very similar between the different atmospheric profiles to the point where it is difficult to differentiate the US standard and subarctic winter curves. The same observation applies to the simulated SSA reflectances. Figure 7b features the relative error between PPA and SSA simulations for each atmospheric profile. Figure 7c and d show the same plot focused respectively on the plateau and on the drop of the curves. The relative errors are very similar between the three atmospheric profiles for all SZA values, to the point where the error bars of the curves merge. As one can observe in Table 6, there are no deviations that are beyond the uncertainties between the MPE values obtained with the different profiles for SZA values < 80°. Only for SZAs > 80°, one can notice discrepancies in MPE values between the atmospheric profiles, that seem to occur mostly beyond SZA = 85° according to Fig. 7d.
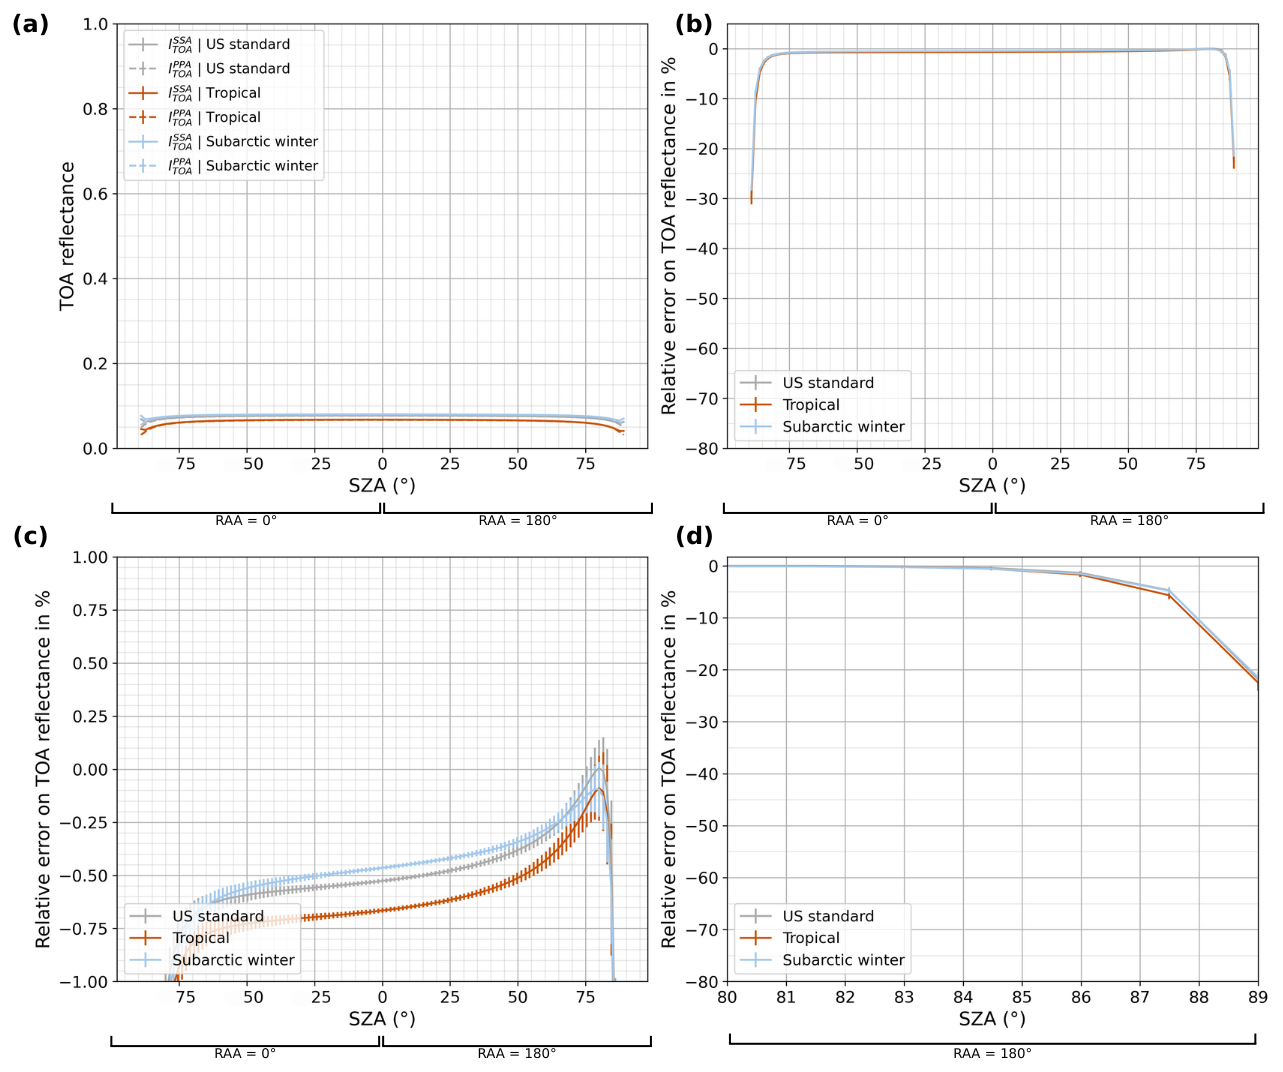
Figure 8Comparison of PPA and SSA simulations for several atmospheric profiles as a function of SZA, for channel NIR 2.2 in a aerosol-free atmosphere with a Lambertian surface of albedo 0.1, with VZA = 80° in the principal relative azimuthal plane, with 1 × 10⁷ photons. (a) Simulated TOA reflectances. (b) Calculated relative error between PPA and SSA simulated TOA reflectances. (c) Same plot zoomed-in between −1 % and 1 %. (d) Same plot zoomed-in for SZA over 80°.
Figure 8 is the same as Fig. 7, but at VZA = 80° to explore more grazing geometries. This time, the curves are slightly separated from each other, even for moderate SZA values. This suggests that for VZA values exceeding 80°, the choice of the atmospheric profile impacts the error caused by the use of the PPA.
The error induced by the use of the PPA on simulated TOA reflectances seem to depend on the atmospheric profile only for very extreme SZA (over 85°) or VZA (over 80°) and in absorbing channels. This leads to the conclusion that the composition of the atmosphere has an existing but limited impact on the Earth's sphericity effects.
4.5 Aerosol properties
4.5.1 Aerosol presence and type
Figure 9a presents the simulated TOA reflectances both in PPA and SSA for a US standard aerosol-free atmosphere, then for the same atmospheric settings with an aerosol layer of selected type, as a function of SZA. We consider FCI channel VIS 0.4, for a 45° VZA, with a Lambertian surface of albedo 0.1, in the principal azimuthal plane. We chose to investigate the impact of urban and desert type aerosols from the OPAC database (Hess et al., 1998), which provides the optical properties and vertical profile for each type. Here, AOD is set to 1.0. Indeed, these widespread types present quite opposite physical properties, with urban aerosols being made of high-absorbing spherical fine particles, while desert aerosols are predominated by lower-absorbing non-spherical coarse particles. One can notice a small reflectance peak around SZA = 30° in the 0° azimuthal plane for the curves corresponding to both urban and desert type aerosol, which corresponds to the back scattering peak in the aerosol phase functions (Kokhanovsky, 1998).
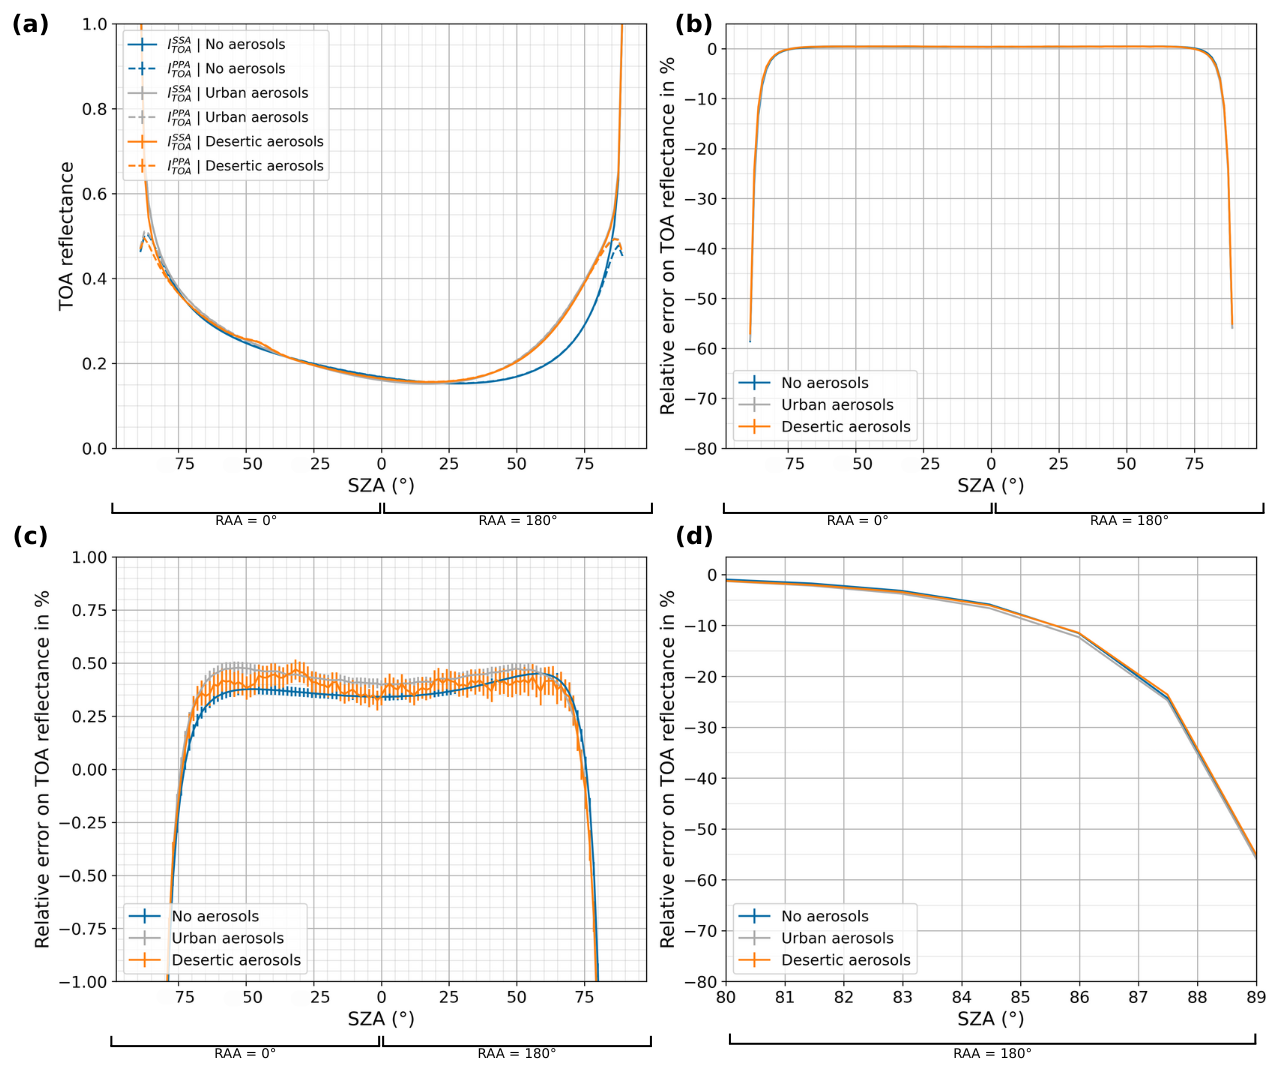
Figure 9Comparison of PPA and SSA simulations for several aerosol types as a function of SZA, for channel VIS 0.4 in a US standard atmosphere with a Lambertian surface of albedo 0.1, with VZA = 45° in the principal relative azimuthal plane, with 1 × 10⁸ photons. (a) Simulated TOA reflectances. (b) Calculated relative error between PPA and SSA simulated TOA reflectances. (c) Same plot zoomed-in between −1 % and 1 %. (d) Same plot zoomed-in for SZA over 80°.
Table 7MPE and MAPE between PPA and SSA simulated TOA reflectances for several aerosol types as a function of SZA, for channel VIS 0.4 in a US standard atmosphere with a Lambertian surface of albedo 0.1, with VZA = 45° in the principal relative azimuthal plane, with 1 × 10⁸ photons.
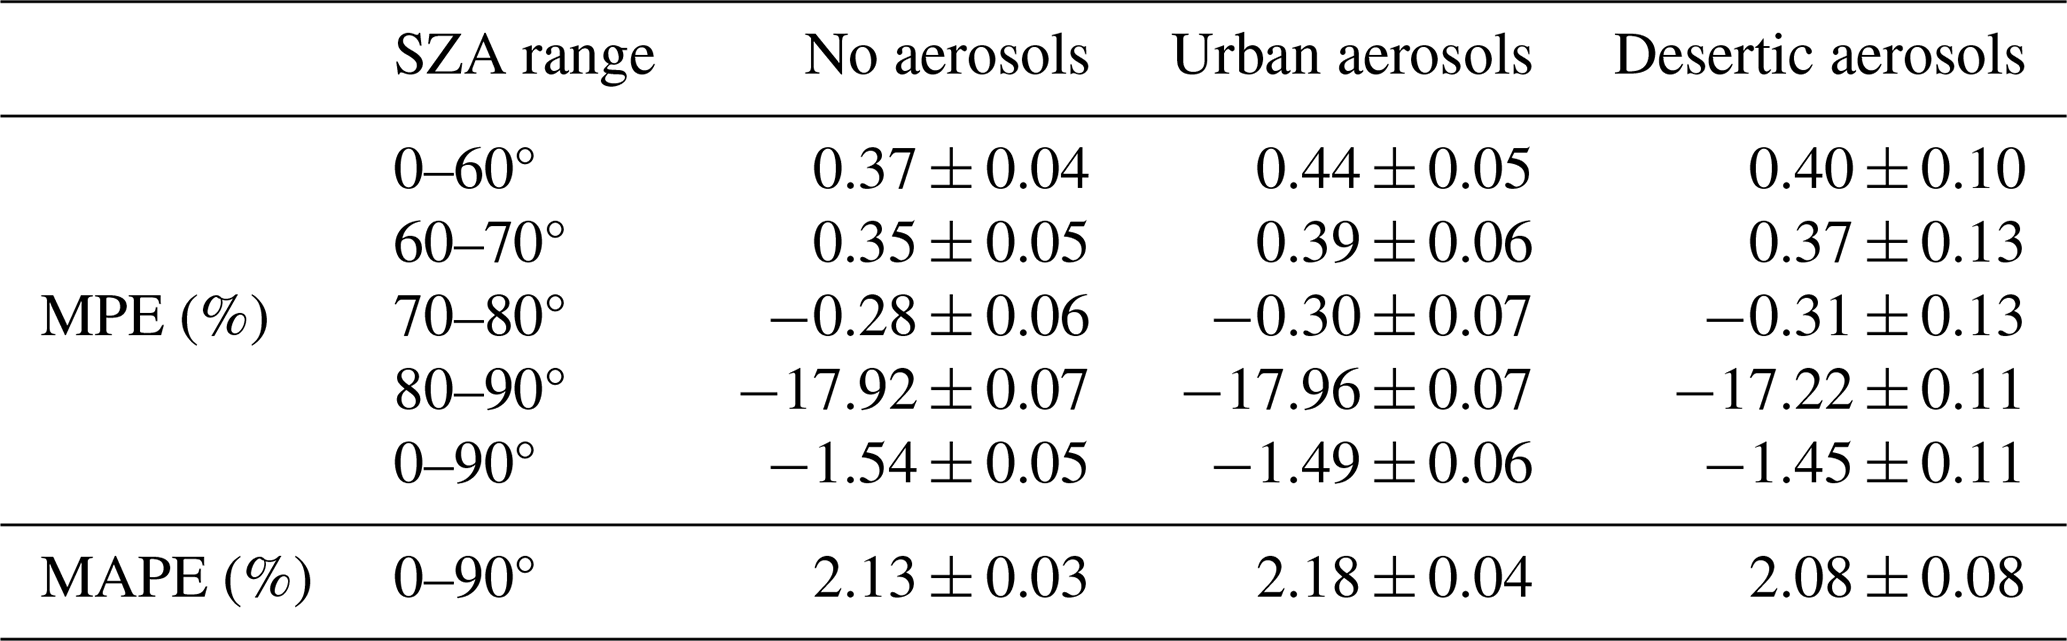
Figure 9b features the relative error between PPA and SSA simulations for each aerosol configuration. Figure 9c and d show the same plot focused respectively on the plateau and on the drop of the curves. The relative error curve for the desert aerosol type shows some noise, which has to do with the peaked phase function of such coarse particles that cause convergence issues when using the local estimate technique (Buras and Mayer, 2011). This effect is purely computational and does not affect the estimation of the error induced by the use of PPA. One can notice the relative errors are close between the three configurations, as we can assess both visually based on the plots and quantitatively with the MPE and MAPE values featured in Table 7.
Firstly, one could notice the MPE values are very close between the two types in each SZA range below 80°. Moreover, the associated uncertainties consistently cover the gaps between the MPE values. However, for SZA values over 80° (even 85° according to Fig. 9d), we notice small differences between the errors calculated for each configuration. Indeed, in the [80–90°] SZA range, the MPE value of −17.92 ± 0.07 % for an aerosol-free atmosphere corresponds to the value obtained when adding the urban aerosol layer (−17.96 ± 0.07 %), but it slightly differs when adding a desert aerosol layer (−17.22 ± 0.11 %). Nonetheless, both the MPE and MAPE calculated over all SZA values present similar results between the aerosol-free and both urban and desert type aerosol layer simulations, with merging trust intervals. Overall, this suggests the impact of PPA on simulated TOA reflectances only shows a slight dependence on the presence and type of aerosols, of limited magnitude compared to the results presented in Sect. 4.1 and 4.2 when varying the observation geometry or wavelength.
4.5.2 Altitude of the aerosol layer
Figure 10a presents the simulated TOA reflectances both in PPA and SSA for a US standard atmosphere with a desert type aerosol layer from the OPAC database as a function of SZA. We consider FCI channel VIS 0.4, for a 45° VZA, with a Lambertian surface of albedo 0.1, in the principal azimuthal plane. In order to investigate the impact of the altitude of the aerosol layer, we compare simulations with aerosols distributed from the surface to a 2 km height (corresponding to background conditions), from the surface to a 6 km height (Saharan air layer) and from 3 to 5 km (dust transport).
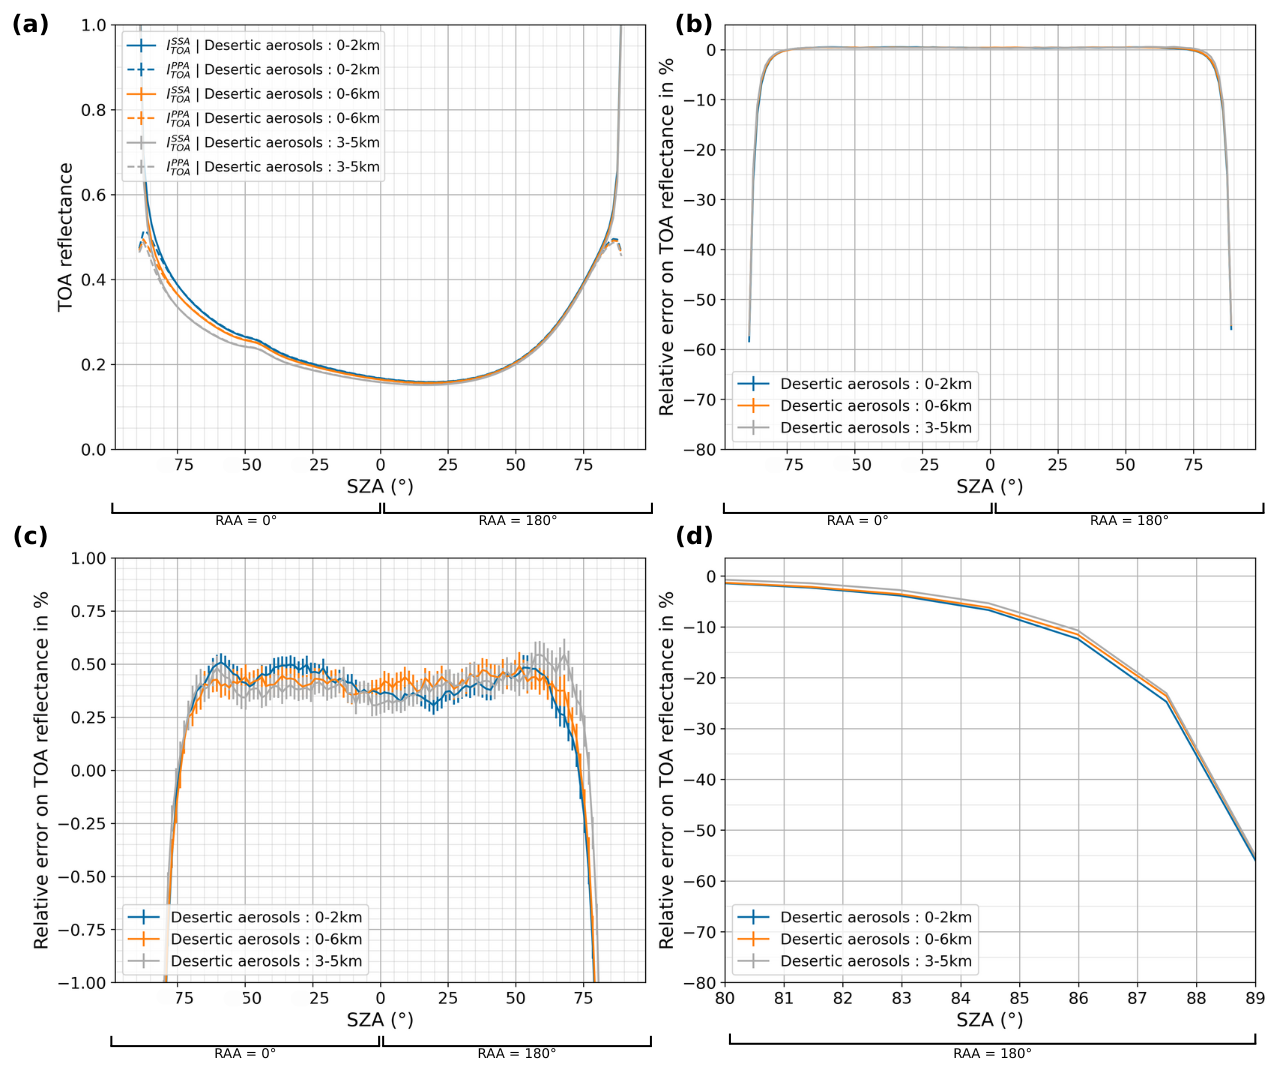
Figure 10Comparison of PPA and SSA simulations for aerosol layers of different altitudes as a function of SZA, for channel VIS 0.4 in a US standard atmosphere with a Lambertian surface of albedo 0.1, in the principal relative azimuthal plane, with 1 × 10⁸ photons. (a) Simulated TOA reflectances. (b) Calculated relative error between PPA and SSA simulated TOA reflectances. (c) Same plot between −1 % and 1 %. (d) Same plot but for SZA over 80°.
Table 8MPE and MAPE between PPA and SSA simulated TOA reflectances for desertic aerosol layers of different altitudes as a function of SZA ranges, for channel VIS 0.4 in a US standard atmosphere with a Lambertian surface of albedo 0.1, with VZA = 45° in the principal relative azimuthal plane, with 1 × 10⁸ photons.
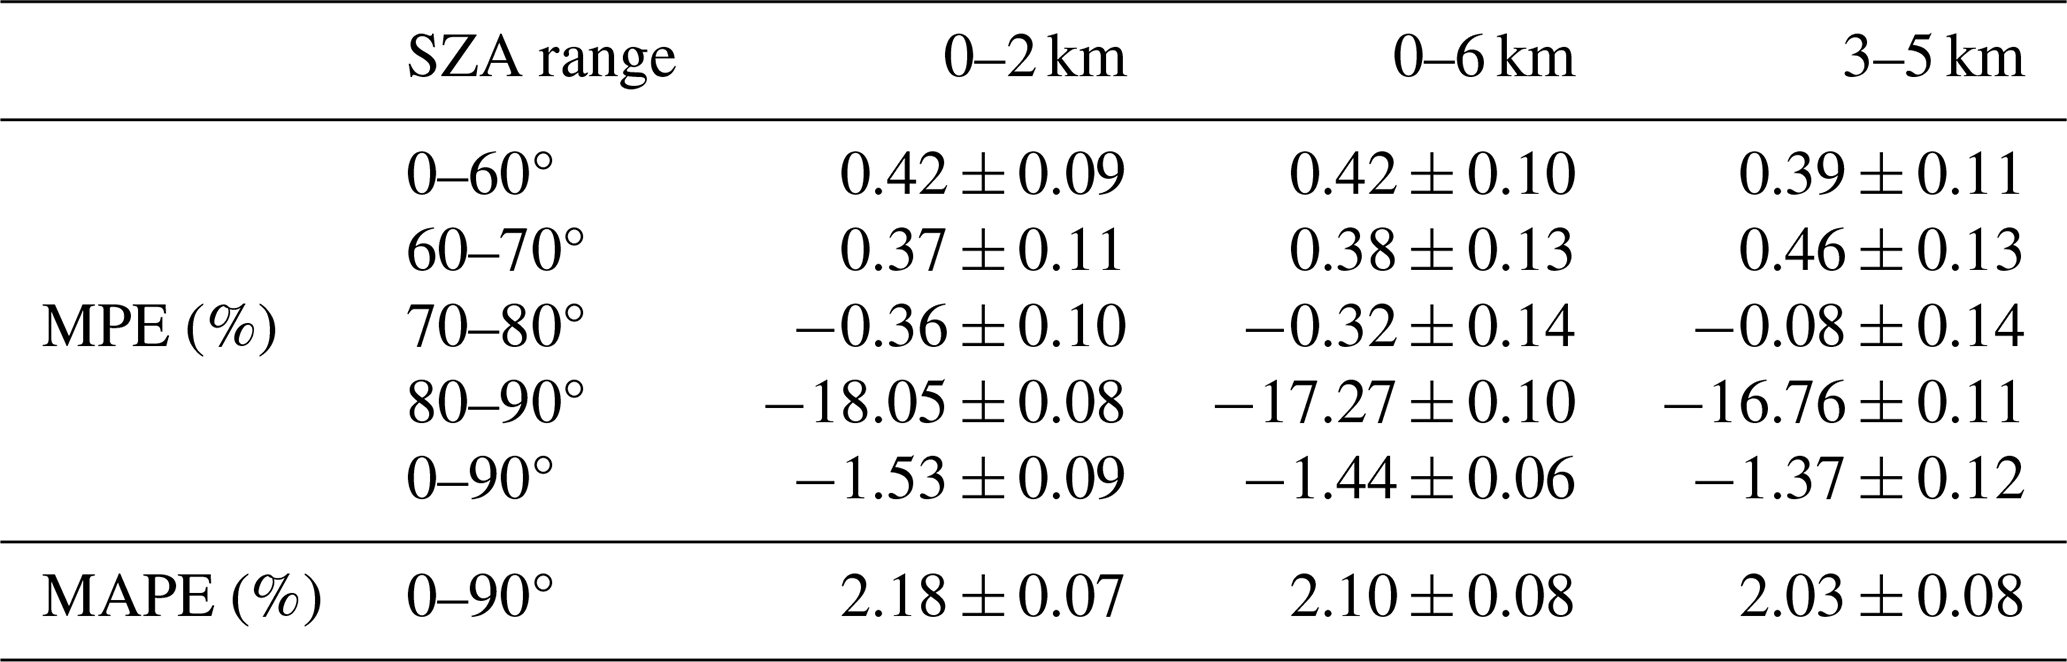
Figure 10b features the relative error between PPA and SSA simulations for each aerosol layer altitude. Figure 10c and d show the same plot focused respectively on the plateau and on the drop of the curves. The noise appearing on all the curves comes from the handling of the peaked phase function by the local estimate technique, as explained previously for Fig. 9. The relative errors are very close between the three configurations for SZA values below 80°, as shown by the MPE and MAPE values featured in Table 8. For higher SZA values, one can start to notice small deviations between the MPE values depending on the altitude of the desert type aerosol layer. Indeed, in the [80–90°] SZA range, the MPE values of respectively −18.05 ± 0.08 %, −17.27 ± 0.10 % and −16.76 ± 0.11 % do not correspond. However, when looking at the MPE and MAPE values calculated over all SZA values, one can notice these differences barely go beyond associated error bars. Overall, the observed discrepancies between the MPE and MAPE scores in several SZA ranges barely exceed the 95 % trust interval, suggesting the impact of the PPA on simulated TOA reflectances slightly depends on the altitude of the aerosol layer. However, one should mention the impact on MPE and MAPE scores is quite small compared to the results presented in Sect. 4.1 and 4.2 when varying the observation geometry or wavelength.
4.5.3 Aerosol Optical Depth
Figure 11a presents the simulated TOA reflectances both in PPA and SSA for a US standard atmosphere with a desert type aerosol layer from the OPAC database as a function of SZA. We consider FCI channel VIS 0.4, for a 45° VZA, with a Lambertian surface of albedo 0.1, in the principal azimuthal plane. In order to investigate the impact of the Aerosol Optical Depth (AOD), we compare simulations with AOD values of τaer = 0.2 (background aerosols), τaer = 1.0 (moderate aerosol event) and τaer = 3.0 (intense dust storm).
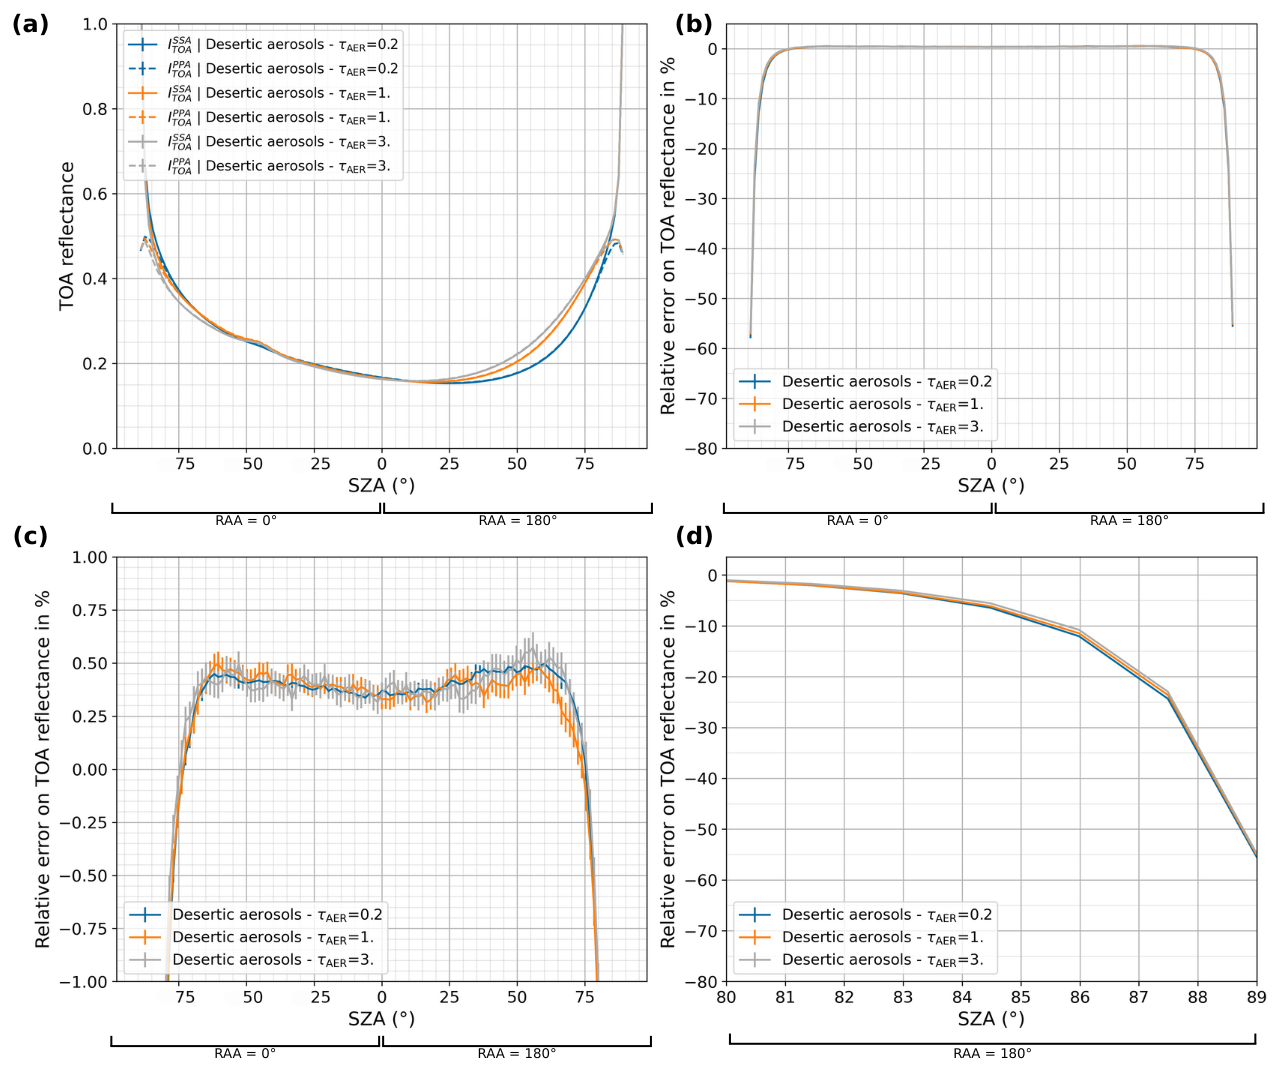
Figure 11Comparison of PPA and SSA simulations for several AOD values as a function of SZA, for channel VIS 0.4 in a US standard atmosphere with a Lambertian surface of albedo 0.1, with VZA = 45° in the principal relative azimuthal plane, with 1 × 10⁸ photons. (a) Simulated TOA reflectances. (b) Calculated relative error between PPA and SSA simulated TOA reflectances. (c) Same plot zoomed-in between −1 % and 1 %. (d) Same plot zoomed-in for SZA over 80°.
Table 9MPE and MAPE between PPA and SSA simulated TOA reflectances for desertic aerosols of various AOD values as a function of SZA ranges, for channel VIS 0.4 in a US standard atmosphere with a Lambertian surface of albedo 0.1, with VZA = 45° in the principal relative azimuthal plane, with 1 × 10⁸ photons.
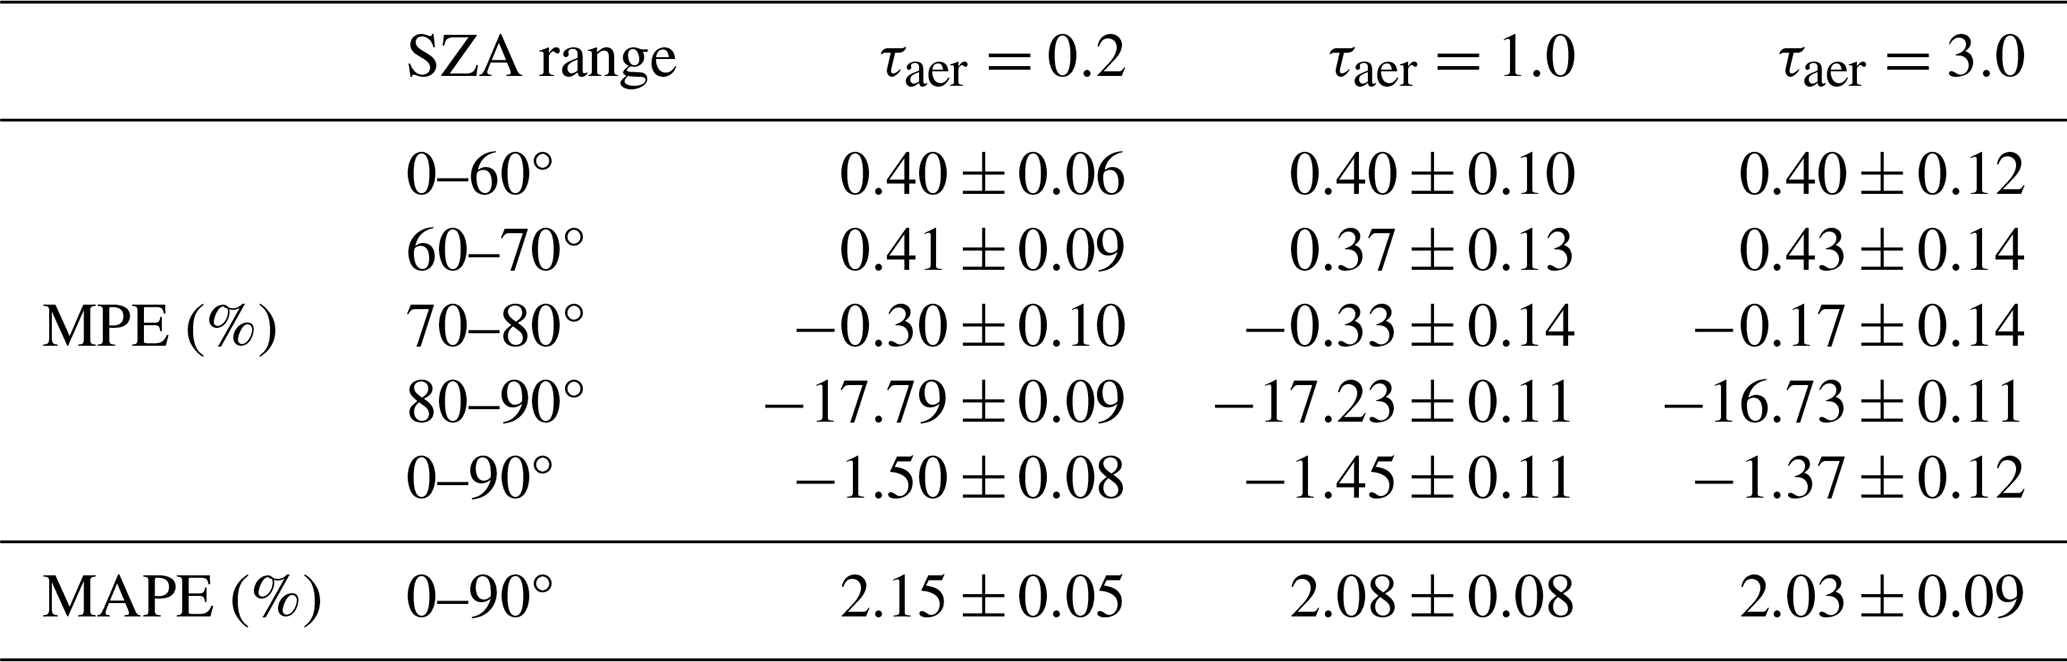
Figure 11b features the relative error between PPA and SSA simulations for each AOD value. Figure 11c and d show the same plot focused respectively on the plateau and on the drop of the curves. The noise appearing on all the curves comes from the handling of the peaked phase function by the local estimate technique, as explained previously for Fig. 9. The relative errors are very close between the three configurations for SZA values below 80°, as shown by the MPE and MAPE values featured in Table 9. For higher SZA values, one can start to notice small deviations between the MPE values depending on the AOD. Indeed, in the [80–90°] SZA range, the MPE values of respectively −17.79 ± 0.09 %, −17.23 ± 0.11 % and −16.73 ± 0.11 % do not match within the 95 % trust interval. However, when looking at the MPE and MAPE values calculated over all SZA values, there are no differences beyond associated error bars. Overall, the observed discrepancies between the MPE and MAPE scores in several SZA ranges barely exceed the 95 % trust interval, suggesting the impact of PPA on simulated TOA reflectances depends slightly on the AOD. However, one should mention the impact on MPE and MAPE scores is quite small compared to the results presented in Sect. 4.1 and 4.2 when varying the observation geometry or wavelength.
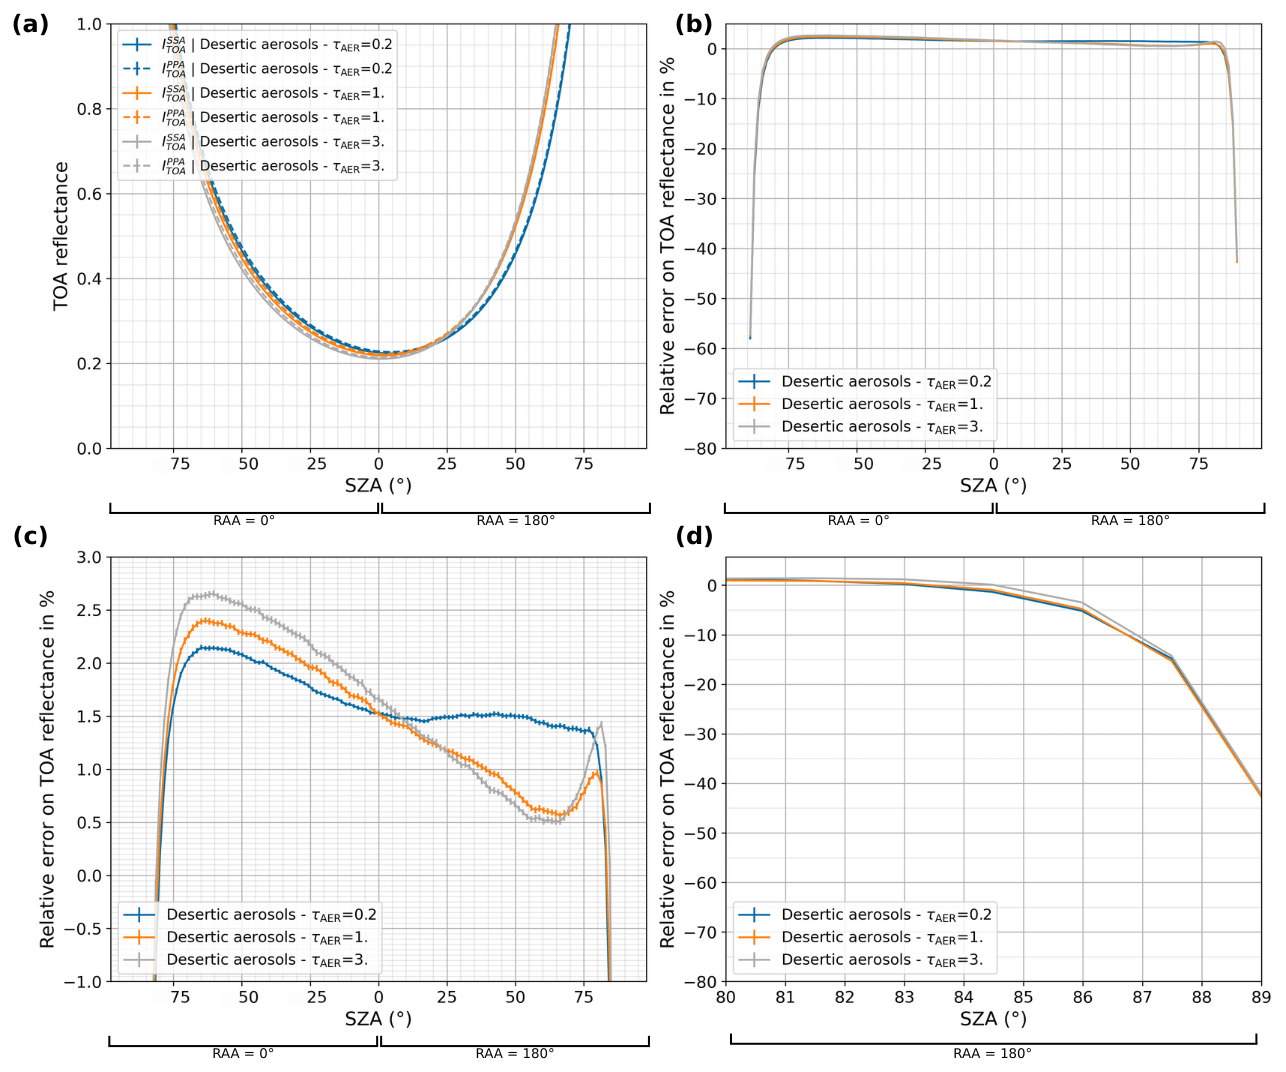
Figure 12Comparison of PPA and SSA simulations for several AOD values as a function of SZA, for channel VIS 0.4 in a US standard atmosphere with a Lambertian surface of albedo 0.1, with VZA = 80° in the principal relative azimuthal plane, with 1 × 10⁸ photons. (a) Simulated TOA reflectances. (b) Calculated relative error between PPA and SSA simulated TOA reflectances. (c) Same plot zoomed-in between −1 % and 3 %. (d) Same plot zoomed-in for SZA over 80°.
Figure 12 is the same as Fig. 11, but for VZA = 80°. This time, the curves are clearly separated from each other, even for moderate SZA values. This suggests that for VZA values exceeding 80°, the AOD value impacts the error caused by the use of the PPA.
The results obtained in this work are generally consistent with those found in the literature. For example, He et al. (2018) investigated the effects of the Earth's curvature in ocean color applications using the PPA and a pseudo-spherical vector radiative transfer model, considering a Rayleigh scattering 100 km high atmosphere at 443 nm. In their work, He et al. (2018) found absolute relative error values for SZA = 85° ranging from 4.8 % to 11.7 % depending on VZA, which are consistent with our results for the same SZA value displaying absolute relative errors slightly below 10 % for VZA = 0° and around 4 % for VZA = 80° (Fig. 2). Another example is found in Ramon et al. (2019), who observed a 0.3 % reduction of simulated TOA intensity at 412 nm caused by the use of PPA for SZA values below 50° and a moderate VZA of 45° when considering a mid-latitude atmospheric profile and a black surface. This error is consistent with our results presented in Fig. 2 and Table 3 for VIS 0.4, showing an average error of 0.23 % for a VZA of 0° and 0.53 % for a VZA of 60° for SZA values below 60°. It must be noted that a full coherence of our results with past studies is difficult to demonstrate since the experiment configurations (e.g., selected wavelengths) are often not identical to ours.
In this work, we have assessed the validity of the plane-parallel assumption in the particular case of the remote sensing of land surfaces and aerosols using geostationary satellite shortwave observations such as those made available by FCI. For example, view zenith angles have been considered up to values of 80°, which are frequent from the geostationary orbit only. In the same manner, instrumental spectral channels have been considered from the short visible to the long near-infrared wavelengths, which are usually used to characterize land surface albedo. Hence, the following discussion and conclusions on the necessity to account for the Earth's sphericity effects are valid in this context, and may vary from those from other studies.
Looking at the results described in Sect. 4, it appears obvious that the error caused by the PPA depends on acquisition geometry and wavelength. This result is consistent since (i) sphericity effects are mainly driven by zenith angles (Fig. 1) and (ii) the Rayleigh-induced radiance is much more significant in shorter wavelengths, which makes the inaccurately estimated optical path to result in a stronger bias. Moreover, surface albedo was found to impact the PPA-induced error for high zenith angles only (SZA > 80° and VZA > 70°). Regarding the impact of the gaseous composition, we found the sphericity effects to depend on the atmospheric profile only in moderately absorbing instrument channels (such as those centered at near-infrared wavelengths) and for extreme SZA (over 85°) and VZA (over 80°). As for aerosols, our analyses revealed weak and context-sensitive dependencies of the impact on sphericity effects of aerosol presence and of all considered aerosol parameters. Indeed, the relative errors induced by PPA have been observed to slightly vary depending on the presence or not of aerosols, their type, the layer altitude and the total AOD for high SZA and VZA values only (beyond 80°). Due to the limited angular and/or spectral domain of the gas composition and aerosol-related dependencies as well as the weak magnitude of aerosol-related dependencies, we judge their impact to be of less significance compared to those found for geometry and wavelength variations. All parameter dependencies are summarized in Table 10.
Table 10Summary of the dependencies of the Earth's sphericity effects on radiative transfer parameters according to the results of the sensitivity study presented in Sect. 4.
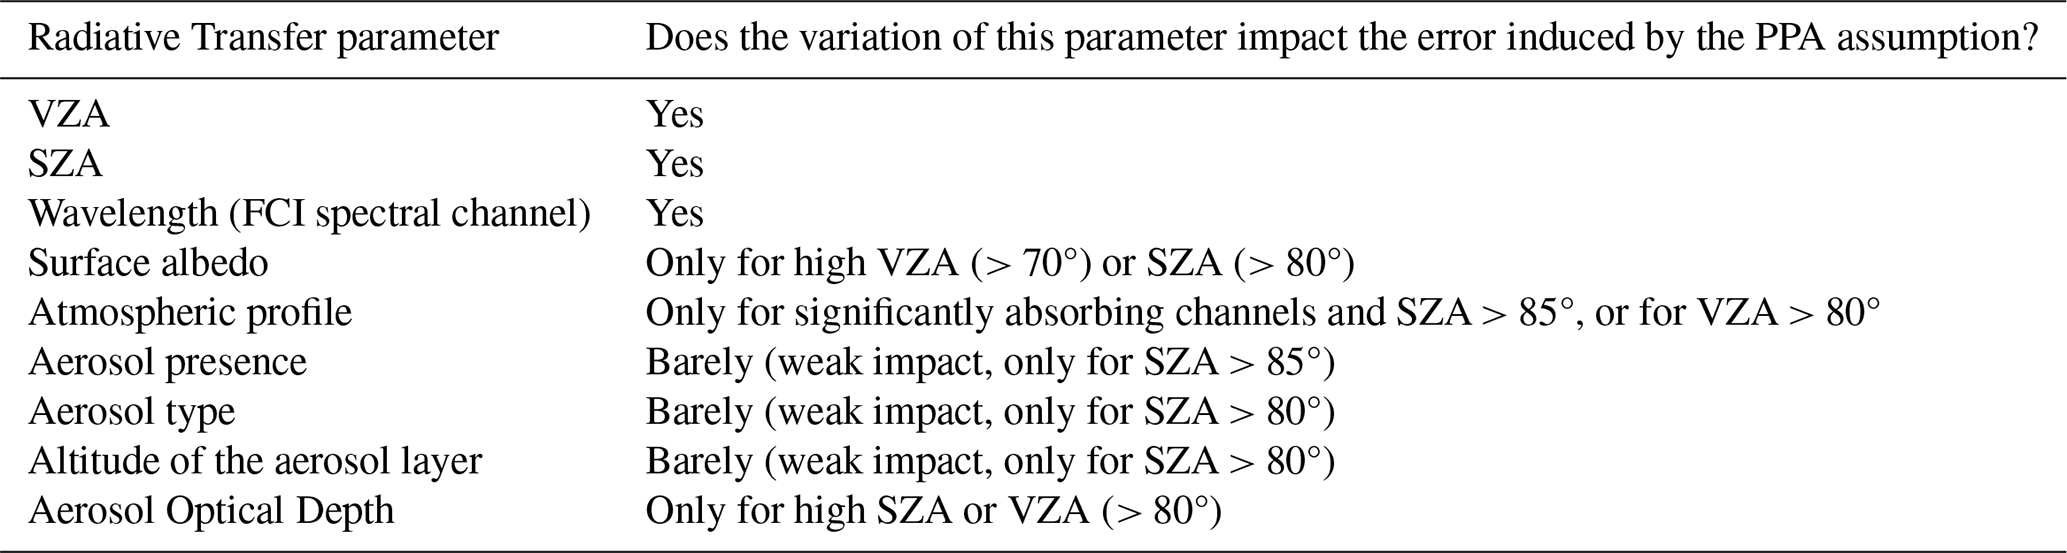
These findings can be useful in the development of methods to compensate the Earth's sphericity effects in the inversion of geostationary observations using fast PPA based radiative transfer codes. Indeed, according to results in Table 10, geometry and wavelength must be taken into account in any correction approach. By contrast, depending on the target accuracy and complexity of the envisaged compensation method, other parameters could be excluded because their impact is only observed in very specific configurations (e.g., atmospheric profile, showing dependence at high zenith angles > 80° only). These results make possible the development of simple correction methods to be applied prior to the retrieval of aerosol and surface properties. In the case of FCI, this would result in a channel-dependent correction, with the strongest correction being applied to the visible channels (i.e., VIS 0.4, VIS 0.5 and VIS 0.6, in decreasing order of correction strength). A similar dependence should be applied to geometry, with high zenith angles corresponding to the strongest correction. According to the two criteria on the error significance previously defined in Sect. 3.4, and looking back to the results of our study in Sect. 4, we conclude that significant biases related to sphericity effects are expected to occur in most situations from SZA = 70° on, when the absolute relative error starts increasing considerably. As seen in Sect. 4.1.1, this means that PPA is not valid due to extreme solar zenith angle for approximately 29 % of geostationary observations, specifically those corresponding to the beginning and the end of each day. Similarly, the absolute relative error exceeds 1 % for VZA values greater than 70° approximately, causing 12 % of the FCI field-of-view (corresponding to the edge of the geostationary disk) to be unsuited for the use of PPA-based algorithms. Considering these two distinct effects, a total of 36 % of all FCI observations are expected to be affected by either high SZA or high VZA (Fig. 3). Again, the non-consideration of the Earth's sphericity in these regions results in incorrect interpretation of geostationary observations. As for wavelength, the error induced by the sphericity effects on TOA reflectance clearly depends on the selected visible or near-infrared FCI channel (i.e., VIS 0.4, VIS 0.5, VIS 0.6, VIS 0.8, NIR 1.6 or NIR 2.2), in addition to the sharp increase of the relative error at the beginning and end of each day. Hence, all channels interesting for aerosol and surface properties retrieval should be processed with a compensation for sphericity effects, at least for some observations.
In conclusion, to carry out an accurate retrieval of aerosol and surface properties from all the geostationary observations identified above, the radiative transfer scheme must be corrected to account for the sphericity effects. However, it should be noted that applying such correction in the inversion of all observations (instead of only part of them) could help avoiding any form of discontinuity in the final products. The comprehensive characterization of the sphericity effects that we have made in the present study can be of use to perform such a general correction when processing FCI observations.
One should note this study applies to PPA-based retrieval algorithms that are generally used for near-real-time estimation of aerosol and surface properties using geostationary observations. Although pseudo-spherical codes currently exceed the speed requirements of such applications, future optimized versions of this type of codes could become a feasible option in the upcoming years, as Momoi et al. (2024) recently managed for polar orbiting applications.
In this study, we assessed the Earth's sphericity effects in various radiative configurations selected to represent the variability of observations from geostationary weather satellites, and in particular from the Flexible Combined Imager (FCI) on board Meteosat Third Generation-Imager. A comparison of top-of-atmosphere shortwave reflectances simulations, simulated by the SMART-G code in both spherical-shell and plane-parallel approximations, enabled us to quantify the error caused by the use of the plane-parallel assumption in the specific case of geostationary near real time retrieval of aerosols and land surfaces from visible and near-infrared FCI channels. We found that the geometry and wavelength of observation have a significant impact on the sphericity effects at all times, whereas the other investigated parameters (e.g., aerosol properties) showed weak to no dependency for moderate solar and view zenith angles. Errors induced by the use of PPA when simulating TOA reflectances in common geostationary remote sensing configurations were found to exceed 1 % for either solar or view zenith angles beyond 70° (and can easily go beyond 10 % for zenith angles above 80°, for example), and they were found to be higher in the shortest wavelength FCI channel VIS 0.4 than in longer visible and near-infrared FCI channels (up to 2.2 µm) for moderate zenith angles. Due to the broad range of solar and view geometries made possible by geostationary satellites, 36 % of the FCI observations over one year are expected to be significantly affected by sphericity effects, which should therefore be accounted for if an accurate joint aerosol-surface retrieval is to be carried out. The results from our study apply to other geostationary visible and near-infrared instruments and can be useful to develop future operational-friendly plane-parallel atmospheric correction methods incorporating a fast compensation for sphericity effects.
In order to analyze and compare our simulations results, we calculate the relative error between PPA and SSA simulated TOA reflectances. This indicator is defined as
where RPPA and RSSA are the TOA reflectances computed respectively with PPA and SSA.
The associated standard deviation can be calculated as
where and are the Monte Carlo standard deviations of the simulated reflectances provided by SMART-G.
We also choose to compute the mean percentage error (MPE), in specific angular ranges or across the entire angular coverage. MPE can be positive or negative, and the sign gives information on whether PPA presents a higher or lower reflectance than SSA. We define MPE and its standard deviation as
where N is the number of points used to calculate the mean.
Another score is the mean absolute percentage error (MAPE), which is close to the definition of MPE but computes the mean using the absolute error between the PPA and SSA simulations. MAPE is always positive and is therefore robust against compensation of positive and negative individual errors. We express MAPE and its standard deviation as
where the factor in Eq. (A6) reflects the reduction of the standard deviation of the uncertainty distribution induced by the absolute value.
In the results section of our study, the relative error plots as well as the MPE and MAPE values are presented alongside their 95 % confidence level uncertainties, which are equal to ±2σ.
Figure B1a presents the simulated TOA reflectances both in PPA and SSA for the VIS 0.4, VIS 0.5, VIS 0.6, VIS 0.8, NIR 1.6 and NIR 2.2 FCI visible and near-infrared channels interesting for albedo and aerosol retrieval, as a function of SZA. We consider an aerosol-free US standard AFGL atmosphere using REPTRAN to account for molecular absorption, for a VZA of 45°, with a Lambertian surface of albedo 0.1, in the cross-principal azimuthal plane. One can notice the curves are very similar to the ones shown in Fig. 4a, except for the slight asymmetry noticeable for VZA values different from 0°, that does not exist in the cross-principal plane.
Figure B1b features the relative error computed between PPA and SSA simulated TOA reflectances for all channels as a function of SZA. Figure B1c and d show the same plot focused respectively on the plateau and on the drop of the relative error curves. One should note the negative sign before SZA values in all following figures identifies the SZA values corresponding to RAA = 90°, whereas the positive SZA values correspond to a RAA = 270°. One can notice the relative error curves are very close to the ones seen in Fig. 4b, to the point that the MPE and MAPE values shown in Table B1 are almost identical to the ones previously presented in Table 4. Overall, these results do not lead to any additional conclusions compared to the ones presented in Sect. 4.2.
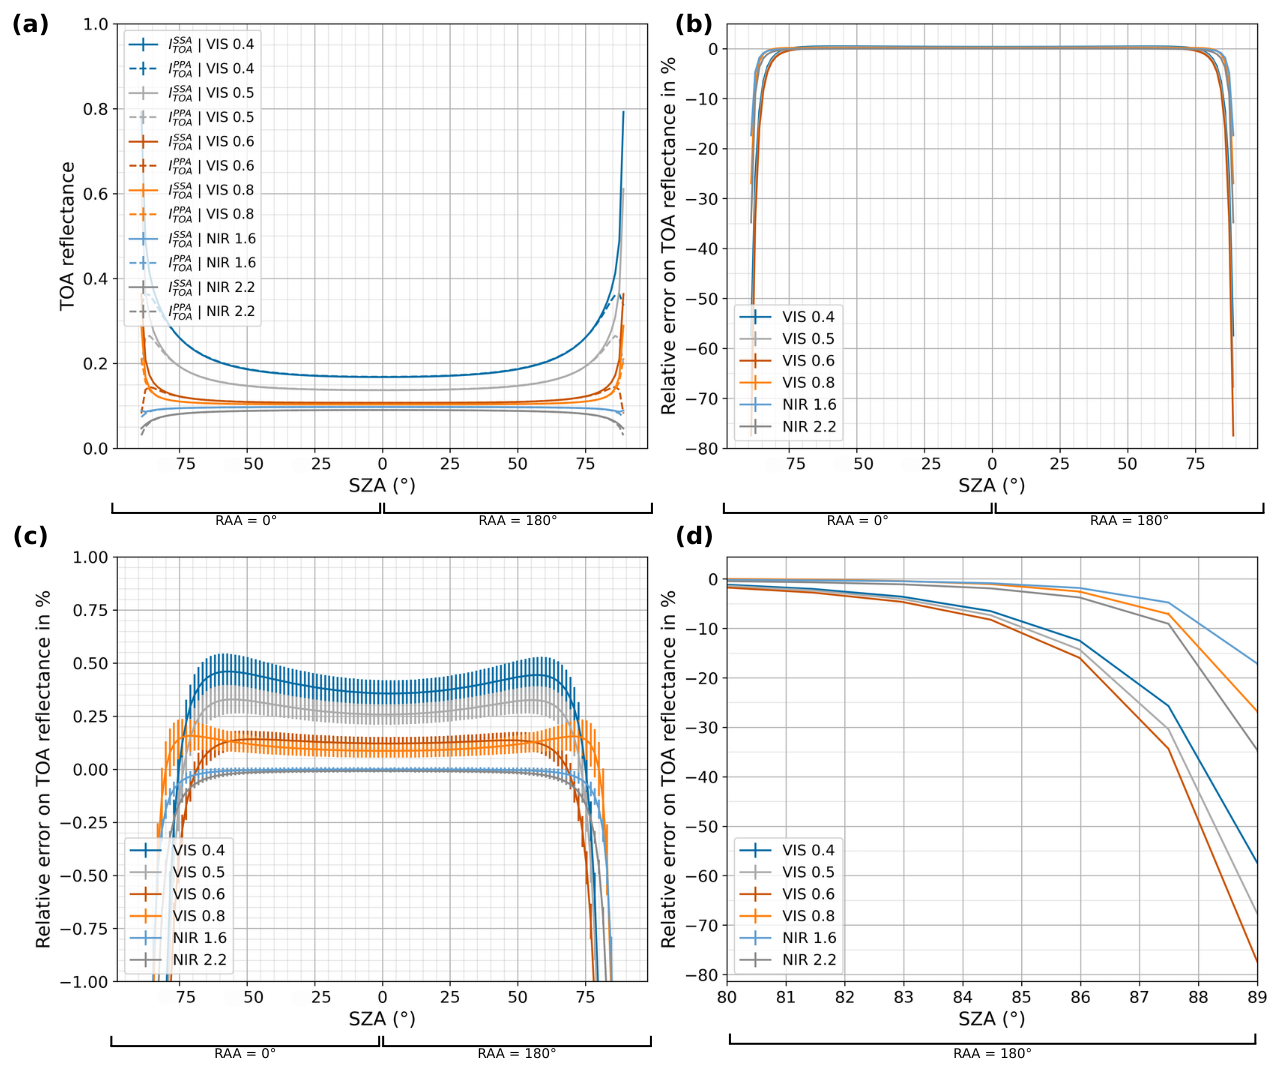
Figure B1Comparison of PPA and SSA simulations for several FCI VIS and NIR spectral channels as a function of SZA, with VZA = 45° in a US standard aerosol-free atmosphere with a Lambertian surface of albedo 0.1, in the cross-principal relative azimuthal plane, with 1 × 10⁷ photons. (a) Simulated TOA reflectances. (b) Calculated relative error between PPA and SSA simulated TOA reflectances. (c) Same plot zoomed-in between −1 % and 1 %. (d) Same plot zoomed-in for SZA over 80°.
Table B1MPE and MAPE between PPA and SSA simulated TOA reflectances for several FCI spectral channels as a function of SZA ranges, in a aerosol-free US standard atmosphere with a Lambertian surface of albedo 0.1, with VZA = 45° in the cross-principal relative azimuthal plane, with 1 × 10⁷ photons.
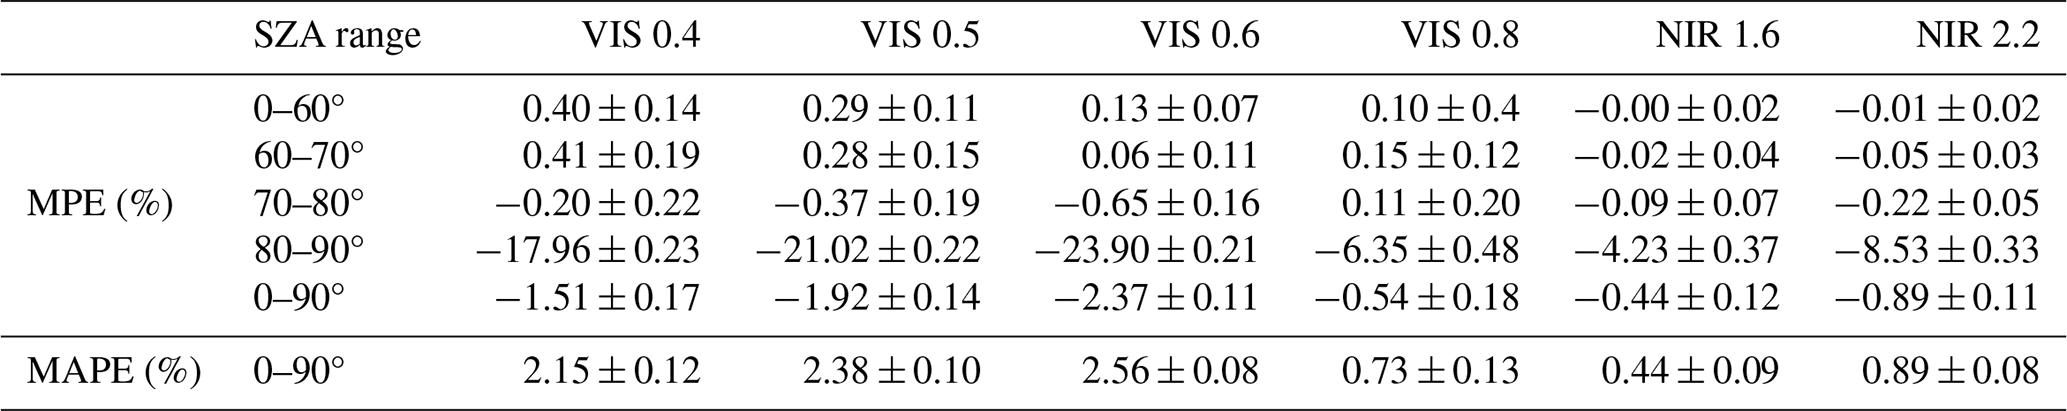
Figure C1a presents the simulated TOA reflectances both in PPA and SSA for the VIS 0.4, VIS 0.5, VIS 0.6, VIS 0.8, NIR 1.6 and NIR 2.2 FCI visible and near-infrared channels interesting for albedo and aerosol retrieval, as a function of SZA. We consider an aerosol-free US standard AFGL atmosphere with no molecular absorption, for a VZA of 45°, with a Lambertian surface of albedo 0.1, in the principal azimuthal plane. Figure B1b features the relative error computed between PPA and SSA simulated TOA reflectances for all channels as a function of SZA. Figure B1c and d show the same plot focused respectively on the plateau and on the drop of the relative error curves.
The results were obtained using the same configurations as Fig. 4, only without gas absorption processes. When comparing both figures, one can see that removing gas absorption diminishes the relative error induced by the sphericity effects in all channels. However, this reduction is particularly important in channels NIR 2.2 and NIR 1.6, where the relative error stays very close to zero for all SZA values. This brings evidence that the relatively large errors in these channels observed in Sect. 4.2 are indeed caused by gas absorption.
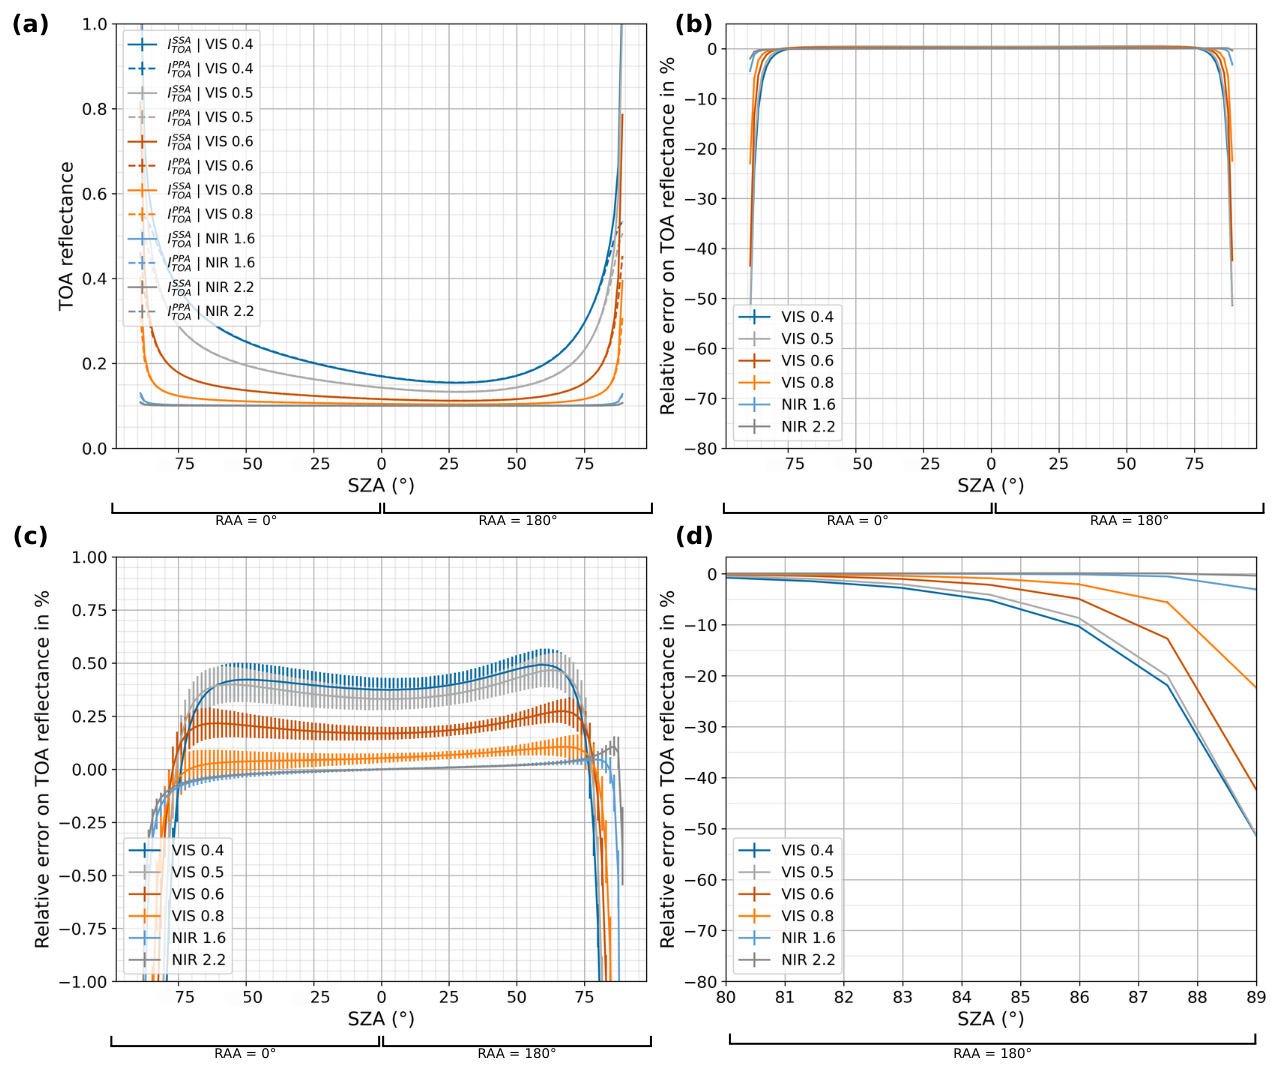
Figure C1Comparison of PPA and SSA simulations for several FCI VIS and NIR spectral channels as a function of SZA, with VZA = 45° in a US standard aerosol-free non-absorbing atmosphere with a Lambertian surface of albedo 0.1, in the principal relative azimuthal plane, with 1 × 10⁷ photons. (a) Simulated TOA reflectances. (b) Calculated relative error between PPA and SSA simulated TOA reflectances. (c) Same plot zoomed-in between −1 % and 1 %. (d) Same plot zoomed-in for SZA over 80°.
The radiative transfer code SMART-G developed by Hygeos was used to provide the results presented in this paper. This code is available in open access (https://github.com/hygeos/smartg, last access: 27 April 2026; Ramon et al., 2019). The other analysis tools used for this work are available upon request from the corresponding author.
The data used in the article are available upon request from the corresponding author.
GK and XC designed the main ideas behind this article and the experiments presented. GK carried out the experiments and their formal analysis, with contributions from XC, JV, DR and MM. GK wrote the manuscript, with contributions from XC and JV. DR and MM developed the SMART-G code used in the experiments.
The contact author has declared that none of the authors has any competing interests.
Publisher's note: Copernicus Publications remains neutral with regard to jurisdictional claims made in the text, published maps, institutional affiliations, or any other geographical representation in this paper. The authors bear the ultimate responsibility for providing appropriate place names. Views expressed in the text are those of the authors and do not necessarily reflect the views of the publisher.
We thank the CNRM and the EUMETSAT LSA-SAF project for funding Gloria Klein's PhD. Josef Gasteiger is acknowledged for providing the REPTRAN parametrization corresponding to the FCI instrument. We thank Maël Es-Sayeh for his assistance regarding radiative transfer theory.
Part of this research has been supported by EUMETSAT (LSA-SAF CDOP4 project).
This paper was edited by Piet Stammes and reviewed by two anonymous referees.
Adams, C. N. and Kattawar, G. W.: Radiative transfer in spherical shell atmospheres: I. Rayleigh scattering, Icarus, 35, 139–151, https://doi.org/10.1016/0019-1035(78)90067-2, 1978. a, b, c, d, e
Anderson, G., Clough, S., Kneizys, F., Chetwynd, J., and Shettle, E.: AFGL Atmospheric Constituent Profiles (0.120 km), Air Force Geophysics Laboratory, Hanscom AFB, MA 01731, Tech. Rep., 46, https://apps.dtic.mil/sti/tr/pdf/ADA175173.pdf (last access: 27 April 2026), 1986. a, b
Boukabara, S.-A., Eyre, J., Anthes, R. A., Holmlund, K., St. Germain, K. M., and Hoffman, R. N.: The Earth-Observing Satellite Constellation: A review from a meteorological perspective of a complex, interconnected global system with extensive applications, IEEE Geosci. Remote Sens. Mag., 9, 26–42, https://doi.org/10.1109/MGRS.2021.3070248, 2021. a
Buras, R. and Mayer, B.: Efficient unbiased variance reduction techniques for Monte Carlo simulations of radiative transfer in cloudy atmospheres: The solution, J. Quant. Spectrosc. Radiat. Transf., 112, 434–447, https://doi.org/10.1016/j.jqsrt.2010.10.005, 2011. a
Ceamanos, X., Six, B., Moparthy, S., Carrer, D., Georgeot, A., Gasteiger, J., Riedi, J., Attié, J.-L., Lyapustin, A., and Katsev, I.: Instantaneous aerosol and surface retrieval using satellites in geostationary orbit (iAERUS-GEO) – estimation of 15 min aerosol optical depth from MSG/SEVIRI and evaluation with reference data, Atmos. Meas. Tech., 16, 2575–2599, https://doi.org/10.5194/amt-16-2575-2023, 2023. a, b, c, d
Chandrasekhar, S.: Radiative transfer, Dover Publications, ISBN 9780486605906, 1960. a, b
Chowdhary, J., Zhai, P.-W., Boss, E., Dierssen, H., Frouin, R., Ibrahim, A., Lee, Z., Remer, L. A., Twardowski, M., Xu, F., Zhang, X., Ottaviani, M., Espinosa, W. R., and Ramon, D.: Modeling Atmosphere-Ocean Radiative Transfer: A PACE Mission Perspective, Front. Earth Sci., 7, https://doi.org/10.3389/feart.2019.00100, 2019. a
Deluisi, J. J. and Mateer, C. L.: On the Application of the Optimum Statistical Inversion Technique to the Evaluation of Umkehr Observations, J. Appl. Meteorol. Climatol., 10, 328–334, https://doi.org/10.1175/1520-0450(1971)010<0328:OTAOTO>2.0.CO;2, 1971. a
Ding, K. and Gordon, H. R.: Atmospheric correction of ocean-color sensors: effects of the Earth's curvature, Appl. Opt., 33, 7096–7106, https://doi.org/10.1364/AO.33.007096, 1994. a, b, c, d, e
Emde, C., Buras-Schnell, R., Kylling, A., Mayer, B., Gasteiger, J., Hamann, U., Kylling, J., Richter, B., Pause, C., Dowling, T., and Bugliaro, L.: The libRadtran software package for radiative transfer calculations (version 2.0.1), Geosci. Model Dev., 9, 1647–1672, https://doi.org/10.5194/gmd-9-1647-2016, 2016. a, b
EUMETSAT: NWC SAF Cloud Product Processors ATBD 2021: Algorithm Theoretical Basis Document for the Cloud Product Processors of the NWC/GEO, https://www.nwcsaf.org/Downloads/GEO/2021/Documents/Scientific_Docs/NWC-CDOP3-GEO-MFL-SCI-ATBD-Cloud_v1.0.1.pdf (last access: 27 April 2026), 2021. a
EUMETSAT: CM SAF Cloud Physical Products ATBD 2022: Algorithm Theoretical Basis Document, Cloud Physical Products, SEVIRI, https://www.cmsaf.eu/SharedDocs/Literatur/document/2022/saf_cm_knmi_atbd_sev_cpp_3_3_pdf.pdf?__blob=publicationFile (last access: 27 April 2026), 2022. a
Frouin, R. J., Franz, B. A., Ibrahim, A., Knobelspiesse, K., Ahmad, Z., Cairns, B., Chowdhary, J., Dierssen, H. M., Tan, J., Dubovik, O., Huang, X., Davis, A. B., Kalashnikova, O., Thompson, D. R., Remer, L. A., Boss, E., Coddington, O., Deschamps, P.-Y., Gao, B.-C., Gross, L., Hasekamp, O., Omar, A., Pelletier, B., Ramon, D., Steinmetz, F., and Zhai, P.-W.: Atmospheric Correction of Satellite Ocean-Color Imagery During the PACE Era, Front. Earth Sci., 7, https://doi.org/10.3389/feart.2019.00145, 2019. a
Gasteiger, J., Emde, C., Mayer, B., Buras, R., Buehler, S., and Lemke, O.: Representative wavelengths absorption parameterization applied to satellite channels and spectral bands, J. Quant. Spectrosc. Radiat. Transf., 148, 99–115, https://doi.org/10.1016/j.jqsrt.2014.06.024, 2014. a, b
Georgeot, A., Ceamanos, X., and Attié, J.-L.: Quantitative assessment of the potential of optimal estimation for aerosol retrieval from geostationary weather satellites in the frame of the iAERUS-GEO algorithm, Atmos. Sci. Lett., 25, e1199, https://doi.org/10.1002/asl.1199, 2024. a, b
Hansen, J. E.: Multiple Scattering of Polarized Light in Planetary Atmospheres. Part I. The Doubling Method, J. Atmos. Sci., 28, 120–125, https://doi.org/10.1175/1520-0469(1971)028<0120:MSOPLI>2.0.CO;2, 1971. a
He, X., Stamnes, K., Bai, Y., Li, W., and Wang, D.: Effects of Earth curvature on atmospheric correction for ocean color remote sensing, Remote Sens. Environ., 209, 118–133, https://doi.org/10.1016/j.rse.2018.02.042, 2018. a, b, c, d, e, f
Hess, M., Koepke, P., and Schult, I.: Optical Properties of Aerosols and Clouds: The Software Package OPAC, Bull. Am. Meteorol. Soc., 79, 831–844, https://doi.org/10.1175/1520-0477(1998)079<0831:OPOAAC>2.0.CO;2, 1998. a, b
Holmlund, K., Grandell, J., Schmetz, J., Stuhlmann, R., Bojkov, B., Munro, R., Lekouara, M., Coppens, D., Viticchie, B., August, T., Theodore, B., Watts, P., Dobber, M., Fowler, G., Bojinski, S., Schmid, A., Salonen, K., Tjemkes, S., Aminou, D., and Blythe, P.: Meteosat Third Generation (MTG): Continuation and Innovation of Observations from Geostationary Orbit, Bull. Am. Meteorol. Soc., 102, E990–E1015, https://doi.org/10.1175/BAMS-D-19-0304.1, 2021. a, b
Juncu, D., Ceamanos, X., Trigo, I. F., Gomes, S., and Freitas, S. C.: Upgrade of LSA-SAF Meteosat Second Generation daily surface albedo (MDAL) retrieval algorithm incorporating aerosol correction and other improvements, Geosci. Instrum. Method. Data Syst., 11, 389–412, https://doi.org/10.5194/gi-11-389-2022, 2022. a, b
Katsev, I. L., Prikhach, A. S., Zege, E. P., Grudo, J. O., and Kokhanovsky, A. A.: Speeding up the aerosol optical thickness retrieval using analytical solutions of radiative transfer theory, Atmos. Meas. Tech., 3, 1403–1422, https://doi.org/10.5194/amt-3-1403-2010, 2010. a
Kokhanovsky, A. A.: Variability of the Phase Function of Atmospheric Aerosols at Large Scattering Angles, J. Atmos. Sci., 55, 314–320, https://doi.org/10.1175/1520-0469(1998)055<0314:VOTPFO>2.0.CO;2, 1998. a
Korkin, S., Yang, E.-S., Spurr, R., Emde, C., Krotkov, N., Vasilkov, A., Haffner, D., Mok, J., and Lyapustin, A.: Revised and extended benchmark results for Rayleigh scattering of sunlight in spherical atmospheres, J. Quant. Spectrosc. Radiat. Transf., 254, 107181, https://doi.org/10.1016/j.jqsrt.2020.107181, 2020. a
Lenoble, J.: Atmospheric radiative transfer, A. Deepak Pub., ISBN 9780937194218, 1993. a, b, c
Levizzani, V., Schmetz, J., Lutz, H. J., Kerkmann, J., Alberoni, P. P., and Cervino, M.: Precipitation estimations from geostationary orbit and prospects for METEOSAT Second Generation, Meteorol. Appl., 8, 23–41, https://doi.org/10.1017/S1350482701001037, 2001. a
Marchuk, G. and Mikhailov, G.: The first all-union conference on monte carlo methods: Novosibirsk, 17–21 November 1966, USSR Comput. Math. & Math. Phys., 7, 348–351, https://doi.org/10.1016/0041-5553(67)90056-0, 1967. a
Marchuk, G. I., Mikhailov, G. A., Nazaraliev, M. A., Darbinjan, R. A., Kargin, B. A., and Elepov, B. S.: The Monte Carlo Methods in Atmospheric Optics, vol. 12 of Springer Series in Optical Sciences, Springer, ISBN 978-3-662-13503-7, https://doi.org/10.1007/978-3-540-35237-2, 1980. a
Mayer, B. and Kylling, A.: Technical note: The libRadtran software package for radiative transfer calculations – description and examples of use, Atmos. Chem. Phys., 5, 1855–1877, https://doi.org/10.5194/acp-5-1855-2005, 2005. a
Mayer, B., Hoch, S. W., and Whiteman, C. D.: Validating the MYSTIC three-dimensional radiative transfer model with observations from the complex topography of Arizona's Meteor Crater, Atmos. Chem. Phys., 10, 8685–8696, https://doi.org/10.5194/acp-10-8685-2010, 2010. a
McCartney, E. J.: Optics of the atmosphere: Scattering by molecules and particles, Wiley, ISBN 9780471015260, 1976. a
Momoi, M., Herreras-Giraldaa, M., Lapyonokb, T., Lopatina, A., Litvinova, P., Zhaia, S., Fuertesa, D., and Dubovik, O.: New GRASP core program version 2 with exposed flexibility allowing “In principle, yes!”, Apolo 2024, https://www.loa.univ-lille.fr/workshops/APOLO-2024/wp-content/uploads/2024/10/Momoi-Masahiro-New-GRASP-core-program-version-2-with-exposed-flexibility-allowing-_In-principle-yes_.pdf (last access: 27 April 2026), 2024. a
Phulpin, T., Renaut, D., Roquet, H., and Camy‐Peyret, C.: Satellites for Atmospheric Sciences 2: Meteorology, Climate and Atmospheric Composition, Wiley, https://doi.org/10.1002/9781394264780, 2023. a
Ramon, D., Steinmetz, F., Jolivet, D., Compiègne, M., and Frouin, R.: Modeling polarized radiative transfer in the ocean-atmosphere system with the GPU-accelerated SMART-G Monte Carlo code, J. Quant. Spectrosc. Radiat. Transf., 222-223, 89–107, https://doi.org/10.1016/j.jqsrt.2018.10.017, 2019. a, b, c, d, e, f
Ruddick, K., Neukermans, G., Vanhellemont, Q., and Jolivet, D.: Challenges and opportunities for geostationary ocean colour remote sensing of regional seas: A review of recent results, Remote Sens. Environ., 146, 63–76, https://doi.org/10.1016/j.rse.2013.07.039, 2014. a
Schmetz, J., Pili, P., Tjemkes, S., Just, D., Kerkmann, J., Rota, S., and Ratier, A.: An Introduction to Meteosat Second Generation (MSG), Bull. Am. Meteorol. Soc., 83, 977–992, https://doi.org/10.1175/1520-0477(2002)083<0977:AITMSG>2.3.CO;2, 2002. a
Seidel, F. C. and Popp, C.: Critical surface albedo and its implications to aerosol remote sensing, Atmos. Meas. Tech., 5, 1653–1665, https://doi.org/10.5194/amt-5-1653-2012, 2012. a
Sekera, Z. and Dave, J. V.: Determination of the vertical distribution of ozone from the measurement of diffusely reflected ultra-violet solar-radiation, Planet. Space Sci., 5, 122–136, https://doi.org/10.1016/0032-0633(61)90087-3, 1961. a
Spurr, R. and Christi, M.: The LIDORT and VLIDORT Linearized Scalar and Vector Discrete Ordinate Radiative Transfer Models: Updates in the Last 10 Years: Volume 3: Radiative Transfer and Light Scattering, Springer, 1–62, ISBN 978-3-030-03444-3, https://doi.org/10.1007/978-3-030-03445-0_1, 2019. a
Spurr, R., Natraj, V., Colosimo, S. F., Stutz, J., Christi, M., and Korkin, S.: VLIDORT-QS: A quasi-spherical vector radiative transfer model, J. Quant. Spectrosc. Radiat. Transf., 291, 108341, https://doi.org/10.1016/j.jqsrt.2022.108341, 2022. a
Stamnes, K. and Conklin, P.: A new multi-layer discrete ordinate approach to radiative transfer in vertically inhomogeneous atmospheres, J. Quant. Spectrosc. Radiat. Transf., 31, 273–282, https://doi.org/10.1016/0022-4073(84)90031-1, 1984. a
Stöckli, R., Bojanowski, J. S., John, V. O., Duguay-Tetzlaff, A., Bourgeois, Q., Schulz, J., and Hollmann, R.: Cloud Detection with Historical Geostationary Satellite Sensors for Climate Applications, Remote Sens., 11, 1052, https://doi.org/10.3390/rs11091052, 2019. a
Teillet, P. M.: Rayleigh optical depth comparisons from various sources, Appl. Opt., 29, 1897, https://doi.org/10.1364/AO.29.001897, 1990. a
Xu, F., He, X., Jin, X., Cai, W., Bai, Y., Wang, D., Gong, F., and Zhu, Q.: Spherical vector radiative transfer model for satellite ocean color remote sensing, Opt. Express, 31, 11192–11212, https://doi.org/10.1364/OE.483221, 2023. a, b, c
Zawada, D., Franssens, G., Loughman, R., Mikkonen, A., Rozanov, A., Emde, C., Bourassa, A., Dueck, S., Lindqvist, H., Ramon, D., Rozanov, V., Dekemper, E., Kyrölä, E., Burrows, J. P., Fussen, D., and Degenstein, D.: Systematic comparison of vectorial spherical radiative transfer models in limb scattering geometry, Atmos. Meas. Tech., 14, 3953–3972, https://doi.org/10.5194/amt-14-3953-2021, 2021. a, b
Zawada, D. J., Dueck, S. R., Rieger, L. A., Bourassa, A. E., Lloyd, N. D., and Degenstein, D. A.: High-resolution and Monte Carlo additions to the SASKTRAN radiative transfer model, Atmos. Meas. Tech., 8, 2609–2623, https://doi.org/10.5194/amt-8-2609-2015, 2015. a
Zawadzka, O. and Markowicz, K.: Retrieval of Aerosol Optical Depth from Optimal Interpolation Approach Applied to SEVIRI Data, Remote Sens., 6, 7182–7211, https://doi.org/10.3390/rs6087182, 2014. a
Zhai, P.-W. and Hu, Y.: An improved pseudo spherical shell algorithm for vector radiative transfer, J. Quant. Spectrosc. Radiat. Transf., 282, 108132, https://doi.org/10.1016/j.jqsrt.2022.108132, 2022. a
Zoogman, P., Liu, X., Chance, K., Sun, Q., Schaaf, C., Mahr, T., and Wagner, T.: A climatology of visible surface reflectance spectra, J. Quant. Spectrosc. Radiat. Transf., 180, 39–46, https://doi.org/10.1016/j.jqsrt.2016.04.003, 2016. a
- Abstract
- Introduction
- Earth's sphericity effects
- Scientific protocol
- Results
- Discussion
- Conclusions
- Appendix A: Statistical scores
- Appendix B: Results in the cross-principal relative azimuthal plane
- Appendix C: Simulation results without gas absorption
- Code availability
- Data availability
- Author contributions
- Competing interests
- Disclaimer
- Acknowledgements
- Financial support
- Review statement
- References