the Creative Commons Attribution 4.0 License.
the Creative Commons Attribution 4.0 License.
 | 05 May 2026
Trace Organic Gas Analyzer Time-of-Flight mass spectrometer (TOGA-TOF) system for airborne observations of formaldehyde
Daun Jeong
Alan J. Hills
Glenn Diskin
Hannah S. Halliday
Joshua P. DiGangi
Alan Fried
Dirk Richter
James Walega
Petter Weibring
Thomas F. Hanisco
Glenn M. Wolfe
Jason St. Clair
Jeff Peischl
Armin Wisthaler
Tomas Mikoviny
John B. Nowak
Felix Piel
Laura Tomsche
Christopher D. Holmes
Amber Soja
Emily Gargulinski
James H. Crawford
Jack Dibb
Carsten Warneke
Joshua Schwarz
Formaldehyde (HCHO) is a ubiquitous atmospheric constituent, originating from primary emissions (natural and anthropogenic) and secondary production via the oxidation of volatile organic compounds (VOCs). In addition to being a regulated pollutant, HCHO is a key species used as a tracer of recent photochemical activity due to its short atmospheric lifetime and its role as a source of HOx radicals. Given its diverse sources and high spatial variability, HCHO is challenging to represent accurately in chemical transport models, often resulting in significant discrepancies with observations. Airborne in situ measurements of HCHO, especially when combined with VOC precursor data, offer valuable insights into its atmospheric distributions for evaluating models. Here, we present HCHO observations from the NSF NCAR Trace Organic Gas Analyzer with Time-of-Flight mass spectrometer (TOGA-TOF), deployed during the 2019 Fire Influence on Regional to Global Environments and Air Quality (FIREX-AQ) campaign. While most HCHO instruments target at most a few selected species for measurement, the TOGA-TOF employs a rapid gas chromatography-mass spectrometry (GC/MS) technique and provides discrete VOC measurements – including >100 C1–C10 species – at a time resolution of less than 2 min. We compare TOGA-TOF HCHO data to measurements from three 1 Hz instruments aboard the NASA DC-8: the Compact Atmospheric Multi-species Spectrometer (CAMS), the In Situ Airborne Formaldehyde (ISAF) instrument, and a proton-transfer-reaction time-of-flight mass spectrometer (PTR-ToF-MS). The wide dynamic range of observed HCHO concentrations (from <100 ppt to ∼ 100 ppb) during FIREX-AQ enabled a robust intercomparison. TOGA-TOF HCHO agreed well with CAMS (slope = 1.1), with similar agreement with the PTR-ToF-MS, while larger discrepancies were observed with ISAF (slope = 1.5), likely due to differences in calibrations. Normalized excess mixing ratios (NEMRs) of HCHO relative to CO in wildfire plumes exhibited consistent trends with plume age across instruments. These findings highlight the TOGA-TOF's capability for highly sensitive and accurate airborne HCHO measurements.
- Article
(8033 KB) - Full-text XML
-
Supplement
(11120 KB) - BibTeX
- EndNote


Formaldehyde (HCHO) is one of the most ubiquitous non-methane volatile organic compounds (VOCs) in the atmosphere. In addition to being an EPA regulated pollutant (National Research Council (US) Committee on Toxicology, 1980), HCHO is a key reactive compound in understanding recent photochemistry in the atmosphere. HCHO is an oxidation product of a wide range of VOCs, has a relatively short lifetime, and is an important source of HOx (OH + HO2), therefore affecting NOx-VOC-O3 chemistry (Seinfeld and Pandis, 2006). Globally, the dominant source of HCHO is secondary production from VOC oxidation (Luecken et al., 2012; Stavrakou et al., 2009). Tropospheric background levels of HCHO are maintained through methane (CH4) (Stavrakou et al., 2009) and isoprene (C5H8) (Curci et al., 2010; Luecken et al., 2018; Palmer et al., 2003; Wolfe et al., 2016) oxidation. Direct emissions of HCHO can also be important locally; sources include vehicle emissions (Possanzini et al., 2002; Sagebiel et al., 1996; Viskari et al., 2000), biomass burning (Lee et al., 1997; Zhang et al., 2013), and fossil fuel industries (Fried et al., 2020; Green et al., 2021; Pfister et al., 2019). In the atmosphere, HCHO is mainly lost through photolysis, reaction with OH, and deposition, resulting in daytime atmospheric lifetimes of 1 to 9 h (1–3 h midday).
As an important proxy for understanding recent photochemistry, HCHO observations have been used to indicate ozone sensitivity regimes (VOC- or NOx-limited) (Duncan et al., 2010; Martin et al., 2004; Nussbaumer et al., 2021; Schroeder et al., 2017; Souri et al., 2020, 2023) as well as top-down estimations of isoprene (Cao et al., 2018; Kaiser et al., 2018; Palmer et al., 2003; Wolfe et al., 2016; Zhu et al., 2016) and anthropogenic VOC (Cao et al., 2018; Kwon et al., 2021) emissions. While satellite retrievals of HCHO column densities have been widely used in these methods, challenges remain in capturing the spatial (vertical and horizontal) representation of HCHO over the wide mixing ratio (MR) range observed in the troposphere; HCHO MRs can vary from less than 20 parts per trillion (ppt) in remote regions, 1–20 parts per billion (ppb) in urban environments, and >100 ppb in fire plumes as observed from aircraft. These challenges in HCHO satellite observations have been driven by uncertainties in retrieval methods (Anderson et al., 2017; Liao et al., 2025; Souri et al., 2023; Stavrakou et al., 2009; Zhu et al., 2016), instrument sensitivity (Souri et al., 2023), and coarse pixel sizes (Kwon et al., 2021; Souri et al., 2023). Uncertainties in satellite observations increase in environments with low HCHO, such as regions with weak biogenic or anthropogenic sources (Souri et al., 2023). Three-dimensional chemical transport models may also fail to reproduce observed HCHO levels due to inaccurate emission inventories of direct HCHO emissions or its VOC precursors (Green et al., 2021; Jaeglé et al., 2018; Luecken et al., 2012, 2018; Warneke et al., 2007), uncertainties in chemical mechanisms (Luecken et al., 2012), and coarse grid size. High quality in situ HCHO observations during airborne field campaigns can provide useful information to validate satellite observations and evaluate chemical transport models (Anderson et al., 2017; Chan Miller et al., 2017; Schroeder et al., 2017; Souri et al., 2023; Zhu et al., 2016). For example, recent studies on HCHO intercomparisons between satellite and in situ airborne observations showed that satellite HCHO retrievals can have a systematic low bias of −20 % to −51 % (Anderson et al., 2017; Zhu et al., 2016), which can lead to underestimation of VOC emissions. These systematic biases in satellite observations can be corrected using high-quality airborne in situ observations of HCHO (Chan Miller et al., 2017; Zhu et al., 2016, 2017).
Biomass burning produces large amounts of HCHO both from primary emissions and secondary production. During a biomass burning event, a highly complex mixture of VOCs (Akagi et al., 2011; Gilman et al., 2015; Gkatzelis et al., 2024; Koss et al., 2018; Travis et al., 2023; Yokelson et al., 2013a, b) is produced from the fire source, which subsequently undergoes complex chemical (i.e., reaction with oxidants and photolysis) and physical (i.e., dilution and cooling) transformations downwind of the source (Decker et al., 2021; Hornbrook et al., 2011; Robinson et al., 2021; Wang et al., 2021). For the recent joint NOAA/NASA Fire Influence on Regional to Global Environments and Air Quality (FIREX-AQ) mission, Wang et al. (2021) used a high-resolution large eddy simulation (LES) to show the chemical complexity of a fresh wildfire plume. The levels and types of predominant oxidants, which are dependent on the historic exposure to light, varies with the evolution of a plume, affecting the chemistry and fate of trace gases and aerosols (Decker et al., 2021; Robinson et al., 2021; Wang et al., 2021). Liao et al. (2021) showed that primary emissions of HCHO dominate near the fire source but secondary production from VOC oxidation becomes important (up to ∼ 60 % after a few hours of physical age) as the fire ages. As reported by Travis et al. (2023), the MRs of different types of VOCs emitted in crop and prescribed fire plumes during FIREX-AQ depends on fuel types and fire states. The physical and chemical complexities in fire plumes ensure that HCHO MRs are highly dynamic presenting challenges for satellite retrievals (Stavrakou et al., 2009) and models to accurately represent local and regional distributions of HCHO.
In this study, we present the NSF NCAR Trace Organic Gas Analyzer Time-of-Flight mass spectrometer (TOGA-TOF) as a fast online GC/MS (gas chromatography-mass spectrometry) technique for airborne observations of HCHO. Studies on improved techniques to detect HCHO have been ongoing, attesting to its analytical challenges (Gilpin et al., 1997; Hopkins et al., 2003; Hunter et al., 1999; Rice and Quay, 2006). While most currently available instrumental techniques are specialized in detecting HCHO, the TOGA-TOF routinely measures over a hundred VOCs using a non-reactive concentration technique, with the capability to analyze untargeted compounds. Thus, TOGA-TOF is a unique airborne standalone instrument for the identification and quantification of a wide range of C1–C10 VOCs, including formaldehyde, in complex ambient air samples. The NOAA/NASA FIREX-AQ campaign (July to September 2019) was the first campaign in which the TOGA-TOF was deployed for airborne measurements. During FIREX-AQ, we had the opportunity to measure alongside two state-of-the-art HCHO measurement systems aboard the NASA DC-8 during the entire FIREX-AQ campaign: the NASA In Situ Airborne Formaldehyde (ISAF) instrument (Cazorla et al., 2015) and the University of Colorado Compact Atmospheric Multi-species Spectrometer (CAMS) (Richter et al., 2015). The University of Oslo Proton-Transfer Reaction Time-of-Flight Mass Spectrometer (UiO PTR-ToF-MS) (Müller et al., 2014) measured HCHO for select time periods as well. For this study, we present the TOGA-TOF HCHO data and focus on intercomparisons with CAMS and ISAF but also include comparisons with the UiO PTR-ToF-MS. The FIREX-AQ dataset is an excellent testbed to compare a wide range of HCHO mixing ratios (below 100 ppt to ∼ 100 ppb) in a spatially variable ambient atmosphere. The technique used in the TOGA-TOF could, in principle, be implemented in many existing online GC/MS systems for semi-routine measurements of HCHO.
The sample preconcentration system in the TOGA-TOF is similar to the earlier generation TOGA instrument with a quadrupole mass analyzer, which has been described in the literature (Apel et al., 2015). The TOGA-TOF has been extensively characterized in the lab prior to and post FIREX-AQ. Here, we describe the basic operation techniques of the TOGA-TOF system (Sect. 2.1), summarize the HCHO measurements during FIREX-AQ (Sect. 2.2), calculate the weighted averages for direct comparisons between instruments with different sampling time resolution (Sect. 2.3), and derive normalized excess mixing ratios (NEMR) of HCHO from selected plume transects (Sect. 2.4).
2.1 Description of the NSF NCAR Trace Organic Gas Analyzer with Time-of-Flight Mass Spectrometer (TOGA-TOF)
The TOGA-TOF hardware consists of a cryogenic preconcentration system, gas chromatograph (GC), time-of-flight (TOF) mass analyzer (TOFWERK, Switzerland), electronics box, clean air generator and on-board calibration system (CAG), and pump box. All major components except the TOF mass analyzer are custom built. Typical preconcentration and GC analysis sequences for the system are shown in Fig. 1 and the flows for each sequence are shown in Fig. 2. The GC analysis, including temperature ramp and cool and sample preconcentration steps, occur simultaneously, with the full cycle duration of both processes time synced (Fig. 1) to less than 2 min. During FIREX-AQ, the runtime for one full cycle was 105 s including 33 s of sample collection (i.e., “sampling”). The preconcentration system consists of three cryogenically-cooled traps as described by Apel et al. (2015): (1) a water trap for removal of water in ambient sampled air, (2) a sample trap for enrichment of targeted VOCs in ambient air, and (3) a cryofocusing trap to refocus the analytes prior to injection into the GC. Corresponding to each temperature setpoint described in Fig. 1, the cooling of each trap is achieved by metering the flow of gas-phase N2 generated from the headspace of the TOGA-TOF Dewar through coils at the bottom of the dewar that were immersed in liquid N2 (Apel et al., 2015). To heat the traps, the cold N2 gas flow was first shut off and followed by PID controlled flow of electricity, via a WATLOW™ (Anafaze MLS300) temperature controller, through resistive wires wrapped around the traps. The sample trap is packed with glass wool to allow greater surface area for the enrichment of VOCs when cooling the trap to −140 °C (Fig. 1), while allowing bulk gases such as oxygen and nitrogen to pass through unretained. Both the water trap (inner diameter (I.D.) = 0.04 in. (1.016 mm)) and cryofocusing trap (I.D. = 0.021 in. (0.5334 mm)) are open tubes.
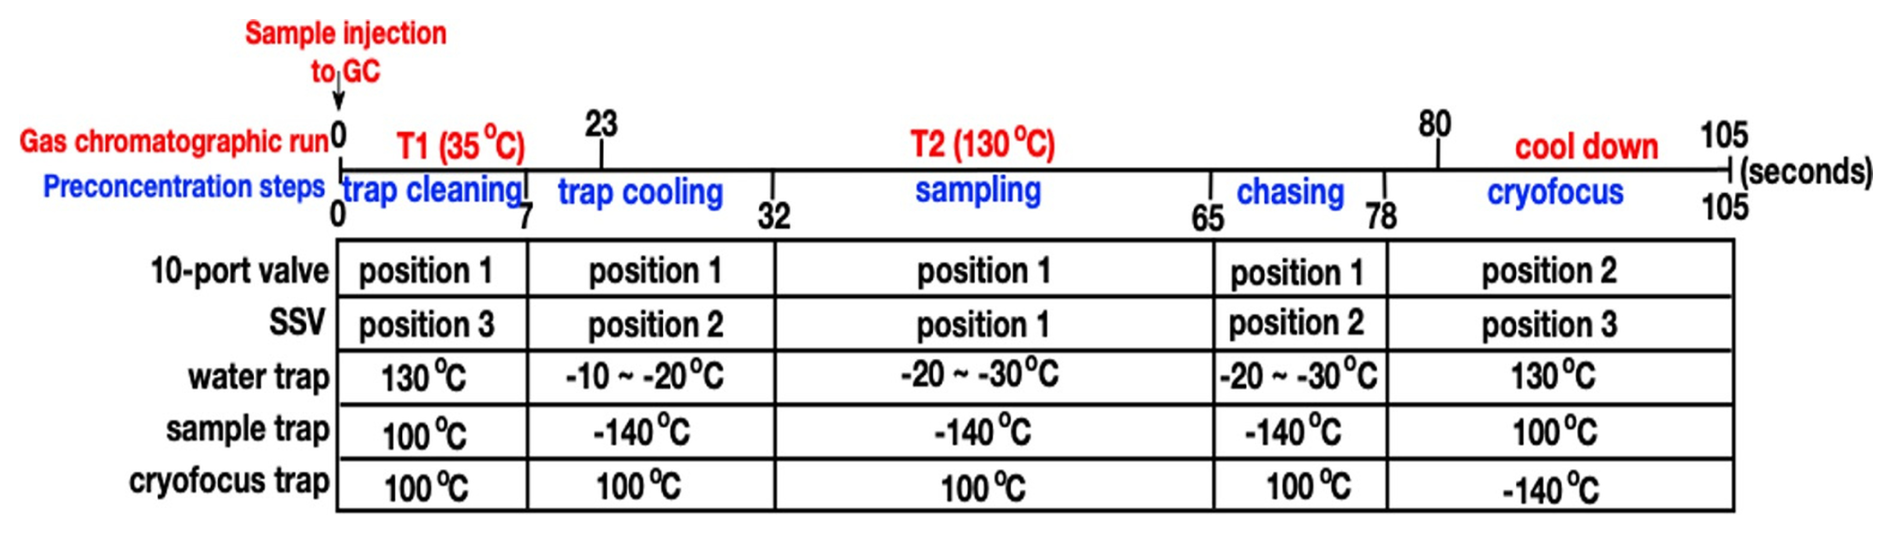
Figure 1TOGA-TOF operational sequences for the gas chromatograph temperature program (red) and the preconcentration steps (blue). The position of the valves (10-port valve and stream selector valve; SSV) and temperatures of each trap are shown for each step. The duration of each sequence corresponds to the normal sampling mode timing during FIREX-AQ.
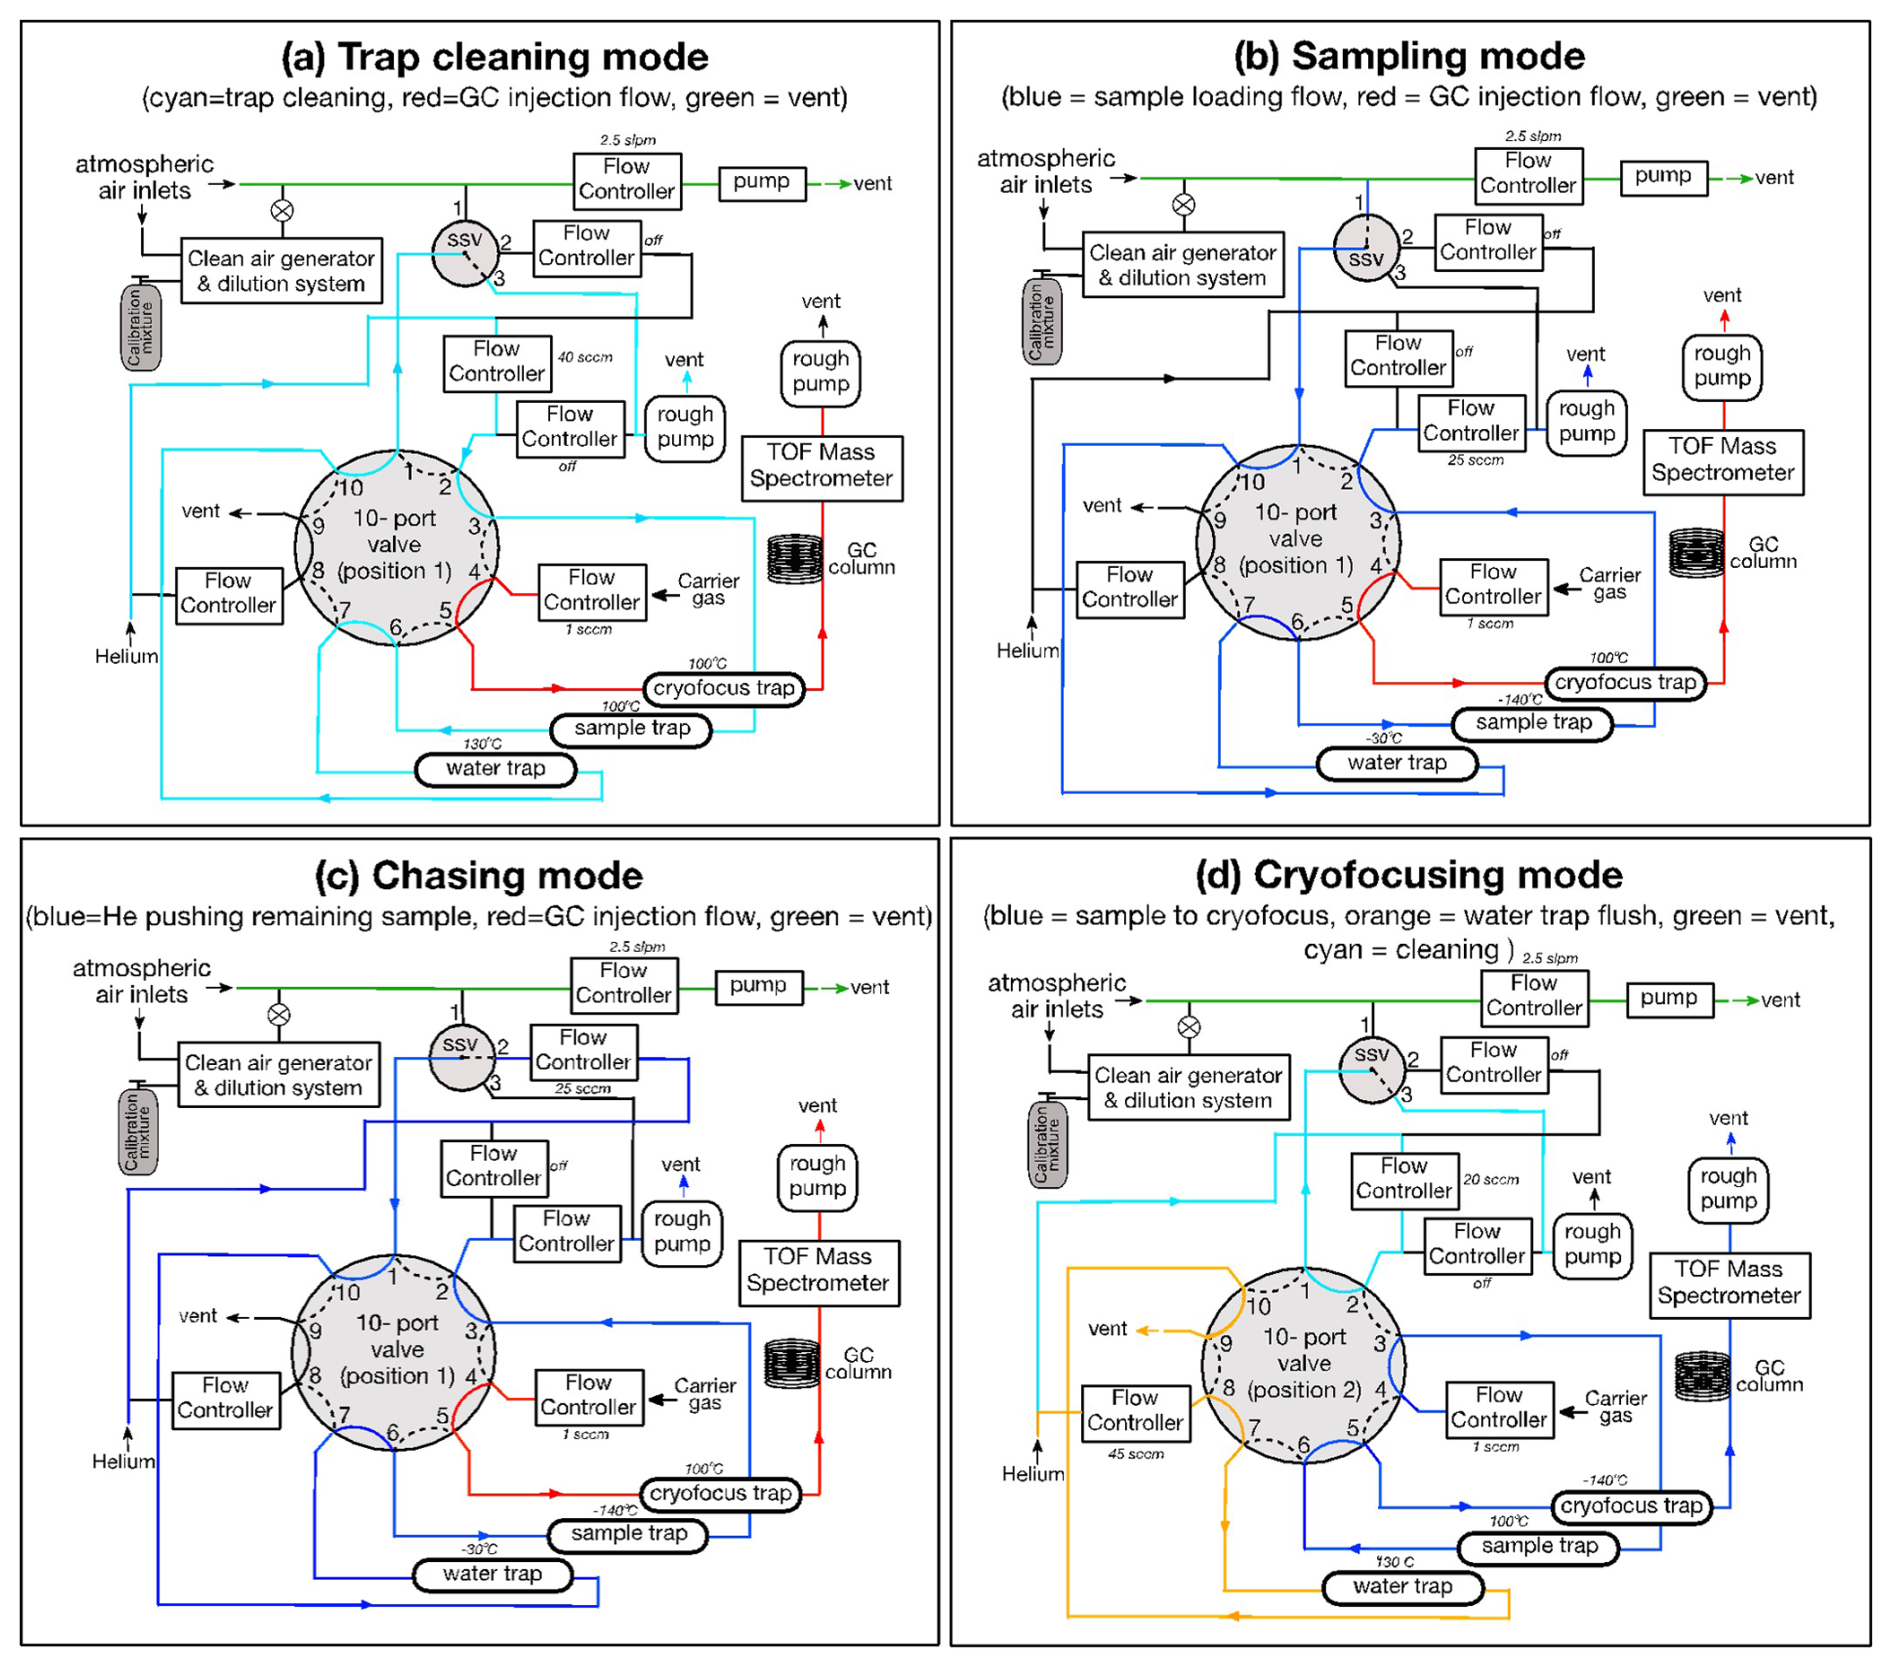
Figure 2Simplified flow diagram of TOGA-TOF showing flows and temperatures of each trap during (a) trap cleaning mode, (b) sampling mode, (c) chasing mode, and (d) cryofocusing mode, corresponding to the sequence in Fig. 1.
For chromatography, a Restek MXT-624 column (I.D. = 0.18 mm, length = 8 m) is used with helium as the carrier gas. The GC column has two temperature set points with temperatures ranging between 35 and 130 °C (Fig. 1), also controlled by the Watlow, allowing gas-phase C1 to C10 VOCs to sequentially elute from the column. This allows the separation of VOCs, including many structural isomers with the same chemical formula, based on their differences in interaction with the stationary phase of the column. For detection of VOCs, the GC is coupled to a high-resolution electron ionization time-of-flight mass spectrometer (HR EI-TOF-MS; TOFWERK), using 70 eV ionization resulting in classical electron ionization (EI) spectra of the compounds. This methodology allows routine quantification of well over 100 VOCs with the ability to further analyze additional C1 to C10 compounds within the detectable range. Fluctuations in sensitivity are corrected by normalizing with ambient levels of tetrachloromethane (CCl4) based on the recommendations in Karbiwnyk et al. (2003). Background corrections are made by system generated ultra-pure helium (“He mode”) and zero-air blanks and then subtracting average blank peak areas from ambient samples. For all surfaces that the sample contacts, Restek Sulfinert® steel tubing is used to minimize interactions. Data processing is performed using Tofware (Aerodyne Research, Inc., Billerica, MA) for high resolution peak fitting and TERN-in-IGOR (Claflin et al., 2021; Isaacman-VanWertz et al., 2017; Lerner et al., 2017) (Aerodyne Research, Inc.) for chromatographic peak analysis.
2.2 Description of HCHO and CO measurements during FIREX-AQ
In this section, we describe the TOGA-TOF HCHO measurements during FIREX-AQ (July–September 2019). FIREX-AQ (Warneke et al., 2023; https://asdc.larc.nasa.gov/project/FIREX-AQ, last access: February 2023) focused on the emissions of trace gases and particles from wildland, prescribed, and agricultural fires in the United States. The NASA DC-8 flights during FIREX-AQ were based out of Boise, ID, mainly focusing on Western U.S. fires, and Salina, KS, focusing on southeastern U.S. agricultural fires (flight tracks shown in Fig. S1). Details on the field campaign may be found in Warneke et al. (2023).
As described in Sect. 2.1, the TOGA-TOF uses electron ionization for the detection of VOCs. The EI of HCHO results in a spectrum of its parent ion ( 30) and major fragments ( 28 and 29) (Fig. S2a). Figure S2b shows the chromatographic signals of CH2O+ ( 30; exact mass 30.010016 amu) and CHO+ ( 29; exact mass 29.002191 amu) eluting at ∼ 20 s. The high resolution (HR)-TOF allows detection of highly resolved ions and the Tofware peak fitting analysis shows separate parent and dominant fragments from other adjacent peaks (Fig. S2c). HCHO calibration was carried out using a HCHO in N2 gas-phase mixture contained in a treated aluminum cylinder (Apel-Riemer Environmental, Inc.), diluted with ultra-high purity N2. The stated HCHO concentration of the calibration mixture cylinder from the company was 1.69 ppmv. The concentration was checked using three independent methods within a two-month period using: (1) Fourier transform infrared spectroscopy (FTIR – NSF NCAR ACOM direct absorption using the Beer-Lambert law, 1.55 ppmv), (2) Mid-IR – University of Colorado – also direct absorption employing the CAMS instrument (1.65 ppm), and (3) an EPA 2,4-dinitrophenylhydrazine (DNPH) cartridge method (1.64 ppmv). For methods (1) and (2), quantification of HCHO relies on the absolute IR cross section and thus does not require an external standard. Therefore, these can be regarded as fully independent reference methods. For the calibration of TOGA-TOF we used the averaged value of 1.61 ppmv from the three quantification methods, and the resulting calibration curve is shown in Fig. S3. The TOGA-TOF HCHO lower limit of detection (LLOD) during FIREX-AQ was 20 ppt, and the HCHO measurement had an uncertainty of 35 % based on the variability of repeat calibrations using a 1.6 ppm (parts per million) HCHO in N2 standard mixture and a 90 ppb HCHO in N2 standard mixture (both Apel-Reimer, Inc.), dynamically diluted to MRs ranging between 0.15 and 100 ppb using (1) the CAG (i.e., catalytically-scrubbed ambient air), (2) dry N2, and (3) humidified N2. No humidity dependence was observed.
HCHO mixing ratios from the TOGA-TOF were compared to 1 Hz HCHO measurements from the ISAF, CAMS, and UiO PTR-ToF-MS instruments onboard the DC-8. The ISAF instrument was operated by NASA and the details on the instrumental technique are described in Cazorla et al. (2015). Briefly, the ISAF instrument uses a laser-induced fluorescence technique to quantify HCHO using the fluorescence resulting from excitation of HCHO at 353 nm with a tunable UV laser. Backgrounds were determined from the offline position 0.005 nm away from the peak. Calibrations were made using a compressed HCHO gas cylinder (Air Liquide, 584 ppbv) quantified by FTIR (Liao et al., 2021). ISAF was operated at a native sampling rate of 10 Hz and archived at 10 Hz and 1 Hz. We used the 1 Hz data for analysis. The reported LLOD of HCHO measured by ISAF is 30 ppt for the 1 Hz data at a signal/noise = 1 and the accuracy (systematic uncertainty) of the ISAF measurements is estimated to be 10 % + 10 ppt. More details on the ISAF HCHO measurement during FIREX-AQ can be found in Liao et al. (2021).
The CAMS was operated by the University of Colorado and a detailed description of the system can be found in the work of Richter et al. (2015). The CAMS uses a tunable IR laser source for generation of mid-IR light for the detection of HCHO based on absorption. Background spectra were collected during flights using zero air from a scrubber and were subtracted from the ambient spectra. Calibrations were carried out by using a 4.9 ppm HCHO standard in N2, quantified by direct absorption using the Beer-Lambert law. The reported uncertainty of the FIREX-AQ HCHO CAMS measurements is 6 % and the campaign-averaged LLOD is 110 ppt for 1 Hz measurements at a signal/noise = 1 during FIREX-AQ. However, during previous airborne missions (e.g., KORUS-AQ; Fried et al., 2020), LLODs ranging from 28 to 80 ppt have been reported. The degraded performance during FIREX-AQ resulted from dirty multipass cell mirrors.
The UiO PTR-ToF-MS (Müller et al., 2014) was operated by the University of Oslo with a focus on measuring NH3 during FIREX-AQ, although HCHO and a number of additional VOCs were reported for select flights (i.e., 25 July and 3 August). The PTR-ToF-MS uses hydronium ions (H3O+) generated from water vapor in a glow discharge-drift-tube to detect VOCs through nondissociative proton transfer reactions. HCHO calibrations were carried out using a gas-phase HCHO in N2 cylinder (Apel-Riemer Environmental, Inc., 9.6 ppm HCHO; ±5 %). This calibration was checked post-mission by generating test atmospheres with five different HCHO mixing ratios (145–1035 ppb) in a 250 L laboratory chamber. The chamber was equipped with a White cell type multiple reflection mirror system with a 120 m optical path length for online detection with a Bruker IFS 66v/S FTIR instrument. The two methods were in excellent agreement, with the PTR-ToF-MS reporting a volume mixing ratios less than 3 % higher than the FTIR. During the two flight days (25 July and 3 August) the UiO PTR-ToF-MS measured HCHO; the slope of the retrieved ambient HCHO relative to that from CAMS was 1.03.
Normalized excess mixing ratios (NEMRs) of HCHO to CO are calculated as described in Sect. 2.4. CO measurements were made onboard the DC-8 using the NOAA Los Gatos Research (LGR) CO instrument and the NASA Differential Absorption Carbon monOxide Measurement (DACOM) instruments. The LGR instrument (Bourgeois et al., 2022) uses an infrared laser off-axis integrated-cavity-output spectroscopy technique with a time response of 1 Hz. The DACOM instrument uses a differential absorption technique with an infrared tunable diode laser detecting CO at the 4.7 µm wavelength, giving a data frequency of 5 Hz and measurement uncertainty of 2 % (Sachse et al., 1987). The two CO instruments were in excellent agreement with the coefficient of determination r2=0.97, and a slope of 0.97 during the entirety of the campaign (Fig. S4), with the reported LGR CO consistently 2.2 % below that of DACOM.
2.3 Averaging methods for comparison of HCHO between different instruments
Data averaging across various sampling time periods is often carried out for direct comparison between instrumental techniques with different sample integration times. Figure 3 shows HCHO measured by TOGA-TOF and CAMS with LGR CO measurements during plume transects from the Castle Fire (Fig. 3a) and the Williams Flats Fire (Fig. 3b). As described in Sect. 2.1, during FIREX-AQ, the TOGA-TOF took discrete samples for 33 s in a 105 s cycle period; therefore, subsections of each plume transect were sampled for analysis (Fig. 3). To directly compare the discrete TOGA-TOF HCHO sampling data, CAMS, ISAF, and UiO PTR-ToF-MS 1 Hz HCHO data are averaged over the time during which the TOGA-TOF sampling occurred. Here we use two averaging methods for HCHO comparison: (1) normal averaging and (2) volume-weighted averaging. The normal averaging is performed by taking the arithmetic mean of the 1 Hz source data measured between the start and stop times of TOGA-TOF sampling. Below LLOD values of the source data are included in the averaging. A minimum of at least one valid (i.e., measured value or below LLOD) 1 Hz source data point during the TOGA-TOF sampling period is allowed for the analysis to produce a non-missing merged value. This algorithm is how the NASA online merging tool generates the TOGA.DC8_MRG and is publicly available on the NASA Langley Research Center (LaRC) Airborne Science Data repository at https://www-air.larc.nasa.gov/cgi-bin/ArcView/firexaq?MERGE=1#TOGA.DC8_MRG/ (last access: February 2023). More details on the NASA online merging tool can be found in https://www-air.larc.nasa.gov/missions/etc/onlinemergedoc.pdf (last access: February 2023).
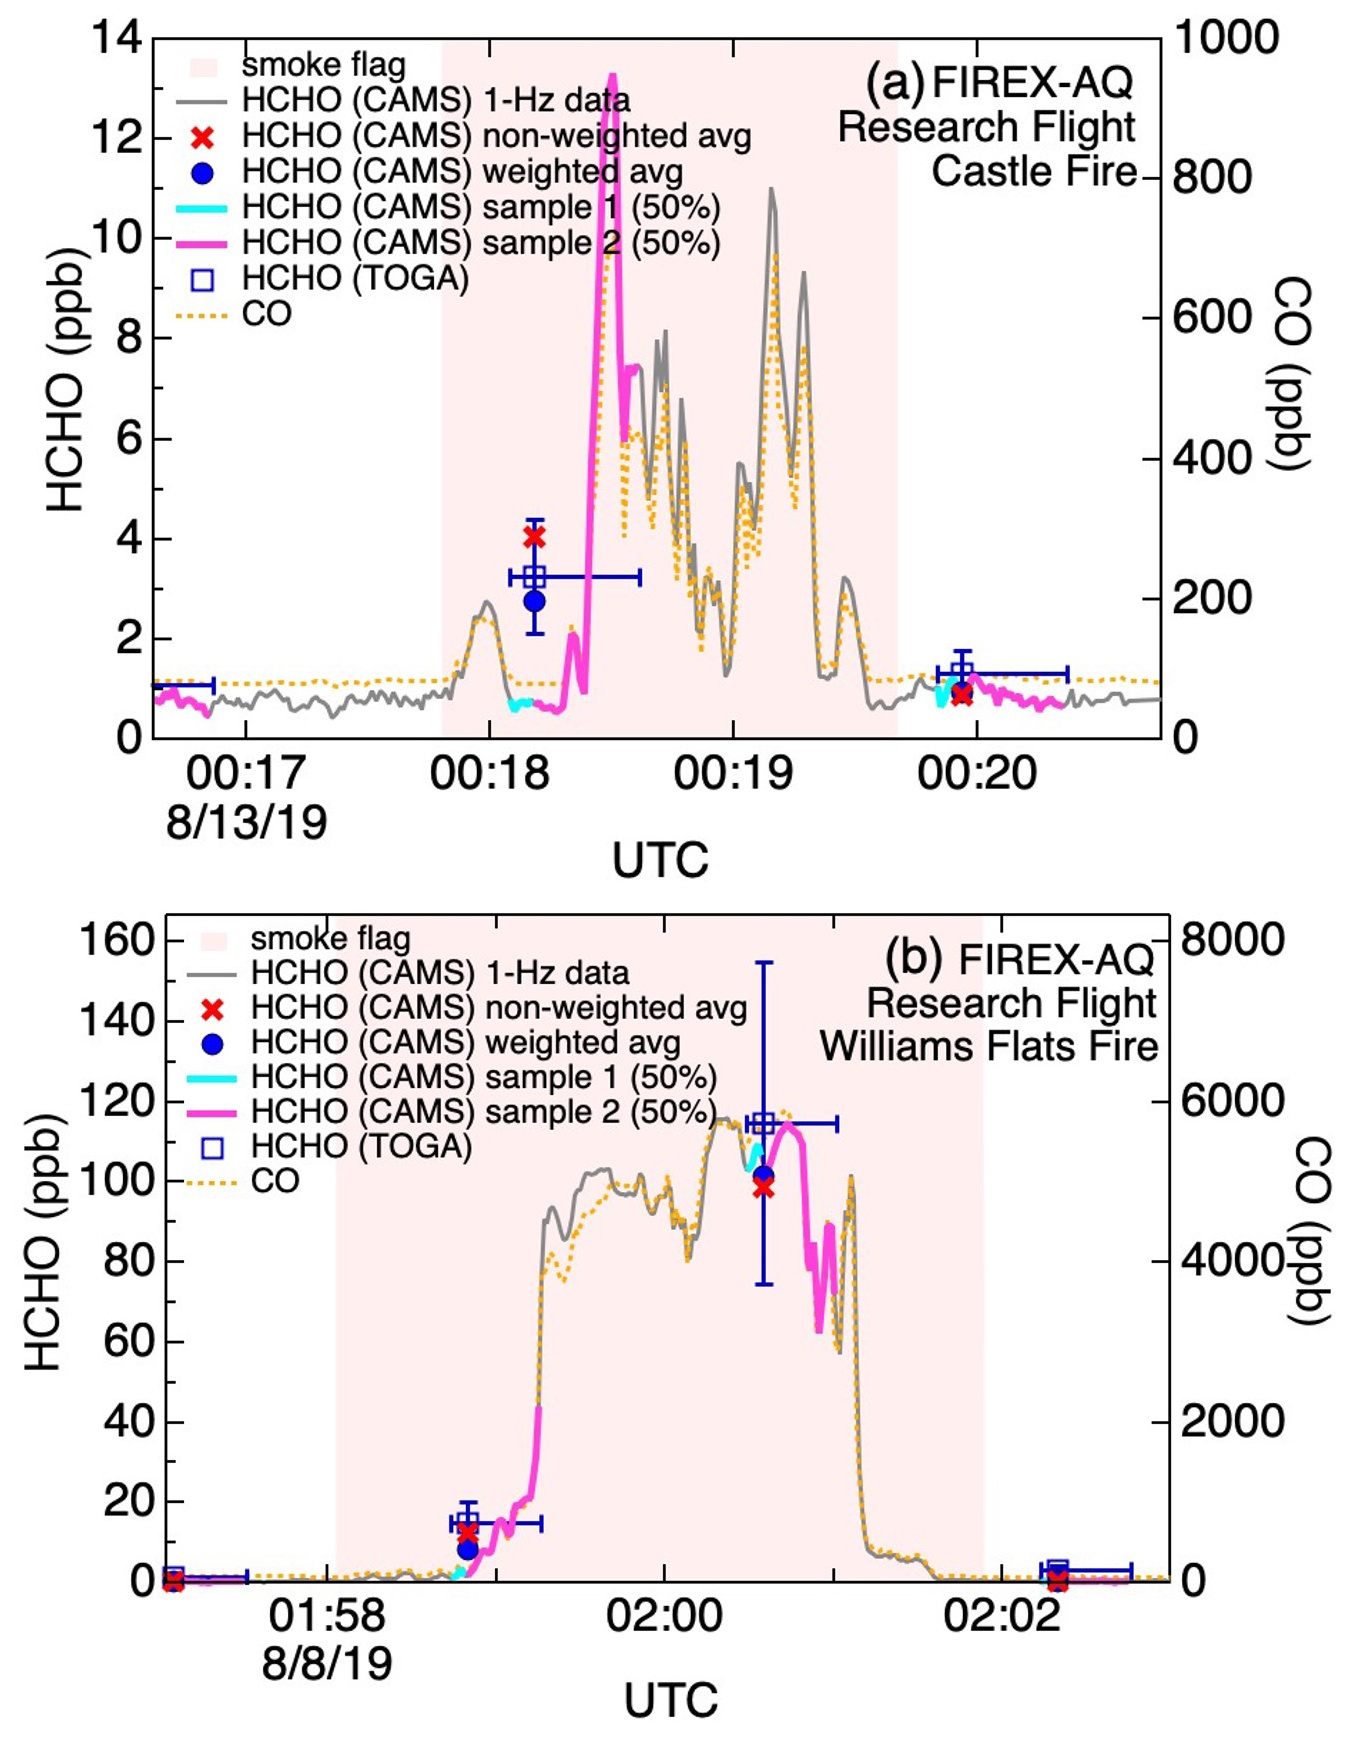
Figure 3Example time series of CAMS and TOGA-TOF HCHO and LGR CO observations during FIREX-AQ transverse (i.e., perpendicular to the transport of the fire plume) plume transects with relatively (a) high and (b) low variability in the observed 1 Hz HCHO. The pink shading shows when the DC-8 was inside the smoke plume based on the relative changes in CO. Vertical error bars on the TOGA-TOF HCHO data points show the measurement uncertainty (±35 %), centered on the TOGA-TOF sampling time midpoint, and the horizontal error bars span the start to stop times of each TOGA-TOF sample. For each of the start-to-midpoint and midpoint-to-stop times of the TOGA-TOF sampling periods, 50 % of the total sample volume occurred. These times (start/midpoint/stop) were used for deriving weighted averages of the 1 Hz HCHO and CO data.
The second averaging method is the volume-weighted averaging method based on the volume of air sampled. A post-mission laboratory analysis of the normalized volume vs. sample collection duration demonstrated that the flow rate through the sample trap was not constant during the sampling time period, despite the mass flow controller (MFC) being set to a fixed value. Specifically, relative flow rates were higher during the initial seconds of sampling before decreasing to the MFC setpoint. Through a series of experiments, we quantified the total sample volume as a function of collection time and derived an empirical relationship to determine the sample-volume midpoint, defined as the time at which 50 % of the total collected volume had been accumulated during the sampling cycle (Fig. 3). Midpoints were calculated for each sample using this method. The midpoints determined through this method are reported in the TOGA-TOF FIREX-AQ data files archived at the NASA Atmospheric Science Data Center (ASDC) (https://doi.org/10.5067/ASDC/FIREXAQ_TraceGas_AircraftInSitu_DC8_Data_1, NASA/LARC/SD/ASDC, 2020). The arithmetic mean of the 1 Hz data is thus calculated for the time periods between the start to midpoint (T1) and midpoint to stop times (T2), and these two means are averaged to weight the merge value on the sampled volume.
When sampling near strong VOC sources (e.g., wildfires or urban emissions), air masses often have significant heterogeneity of HCHO levels from varying direct emissions and photochemical production from rapidly changing VOC precursors. In those cases, using the non-weighted averages of 1 Hz measurements can lead to significant biases when they are directly compared to the TOGA-TOF data. Therefore, using volume-weighted averages of higher-frequency data that factor in the true sample volume midpoints for comparisons with TOGA-TOF data allows a more accurate comparison of the sampled air masses.
Using the above methodology, volume-weighted averages of LGR and DACOM 1 Hz CO data are carried out, during the times when TOGA was sampling. In our study, we use the volume-weighted averaged LGR CO data when it is available, and for times when it is not available, we use the volume-weighted averaged DACOM CO data multiplied by 0.978 to account for the relative differences in the two CO datasets. We normalized to the LGR CO data as it is a little lower to be conservative in our analyses, although the two CO datasets are in excellent agreement (Fig. S4) and within the combined measurement uncertainties (LGR = 2 ppb + 2 % and DACOM = ±2 %).
2.4 Formaldehyde Normalized Excess Mixing Ratios
We compare HCHO normalized excess mixing ratios (NEMRs) for Western U.S. wildland fires calculated using HCHO reported by TOGA-TOF, ISAF, and CAMS. There are several ways to derive NEMRs (Yokelson et al., 2013a) and here we used the slope method, which involves determining the slope of HCHO in ppt against CO in ppb for a single plume transect and the background air outside the plume. CO was used as the reference species to normalize for dilution as it is a conserved biomass burning tracer in wildfire plumes (Müller et al., 2016; Selimovic et al., 2019; Yokelson et al., 2013a). For the NEMRs from CAMS and ISAF, we use the 1 Hz HCHO and CO data for the entire plume transect. For the TOGA-TOF NEMRs, we use the discrete HCHO sampling points, which range between two and ten samples for each plume transect – including a background sample and plotted these against the volume-weighted average (described in Sect. 2.3) TOGA merged CO for corresponding sampling periods.
The NEMR analysis was carried out for the plumes selected based on the following criteria: (a) plume transects perpendicular to the fire source, (b) availability of at least one full TOGA-TOF sampling cycle within the plume, (c) stable background HCHO prior to and after the plume transect, and (d) availability of both CAMS and ISAF 1 Hz HCHO data sets and CO for both background and in-plume sampling. Fire plumes were identified via plume flags using above background CO in addition to visual inspection of the data (FIRE_FLAG_TABULAR_DATA.dat, https://www-air.larc.nasa.gov/cgi-bin/ArcView/firexaq#SCHWARZ.JOSHUA/, last access: February 2023). Based on these criteria, NEMRs were calculated for a total of 86 plume transects from 7 fire sources in the Western U.S. and these are summarized in the supporting information (Table S1).
3.1 Comparison of HCHO between different instrumental techniques
Direct intercomparisons of measured HCHO between TOGA-TOF and the 1 Hz instruments were carried out for data collected during all flights with available HCHO observations onboard the DC-8. This included 13 flights sampling Western U.S. fires, 7 flights in the Southeastern U.S., and 2 transit flights (Fig. S1). The dataset allowed comparisons of the widest possible range of HCHO observed in the troposphere (below 100 ppt to ∼ 100 ppb). Figure 4 shows correlations between TOGA-TOF, CAMS, and ISAF HCHO, averaged during the corresponding TOGA-TOF sampling periods. Comparisons with normal averaged 1 Hz HCHO (Fig. 4a and b) and volumed-weighted averaged 1 Hz HCHO (Fig. 4c and d), described in Sect. 2.3, are both shown. The data points are colored according to the relative standard deviation of HCHO, calculated as the standard deviation of 1 Hz HCHO data during the TOGA-TOF sampling period divided by the HCHO measured by TOGA-TOF. This relative standard deviation represents the variability of the 1 Hz HCHO data during the TOGA-TOF sampling period.
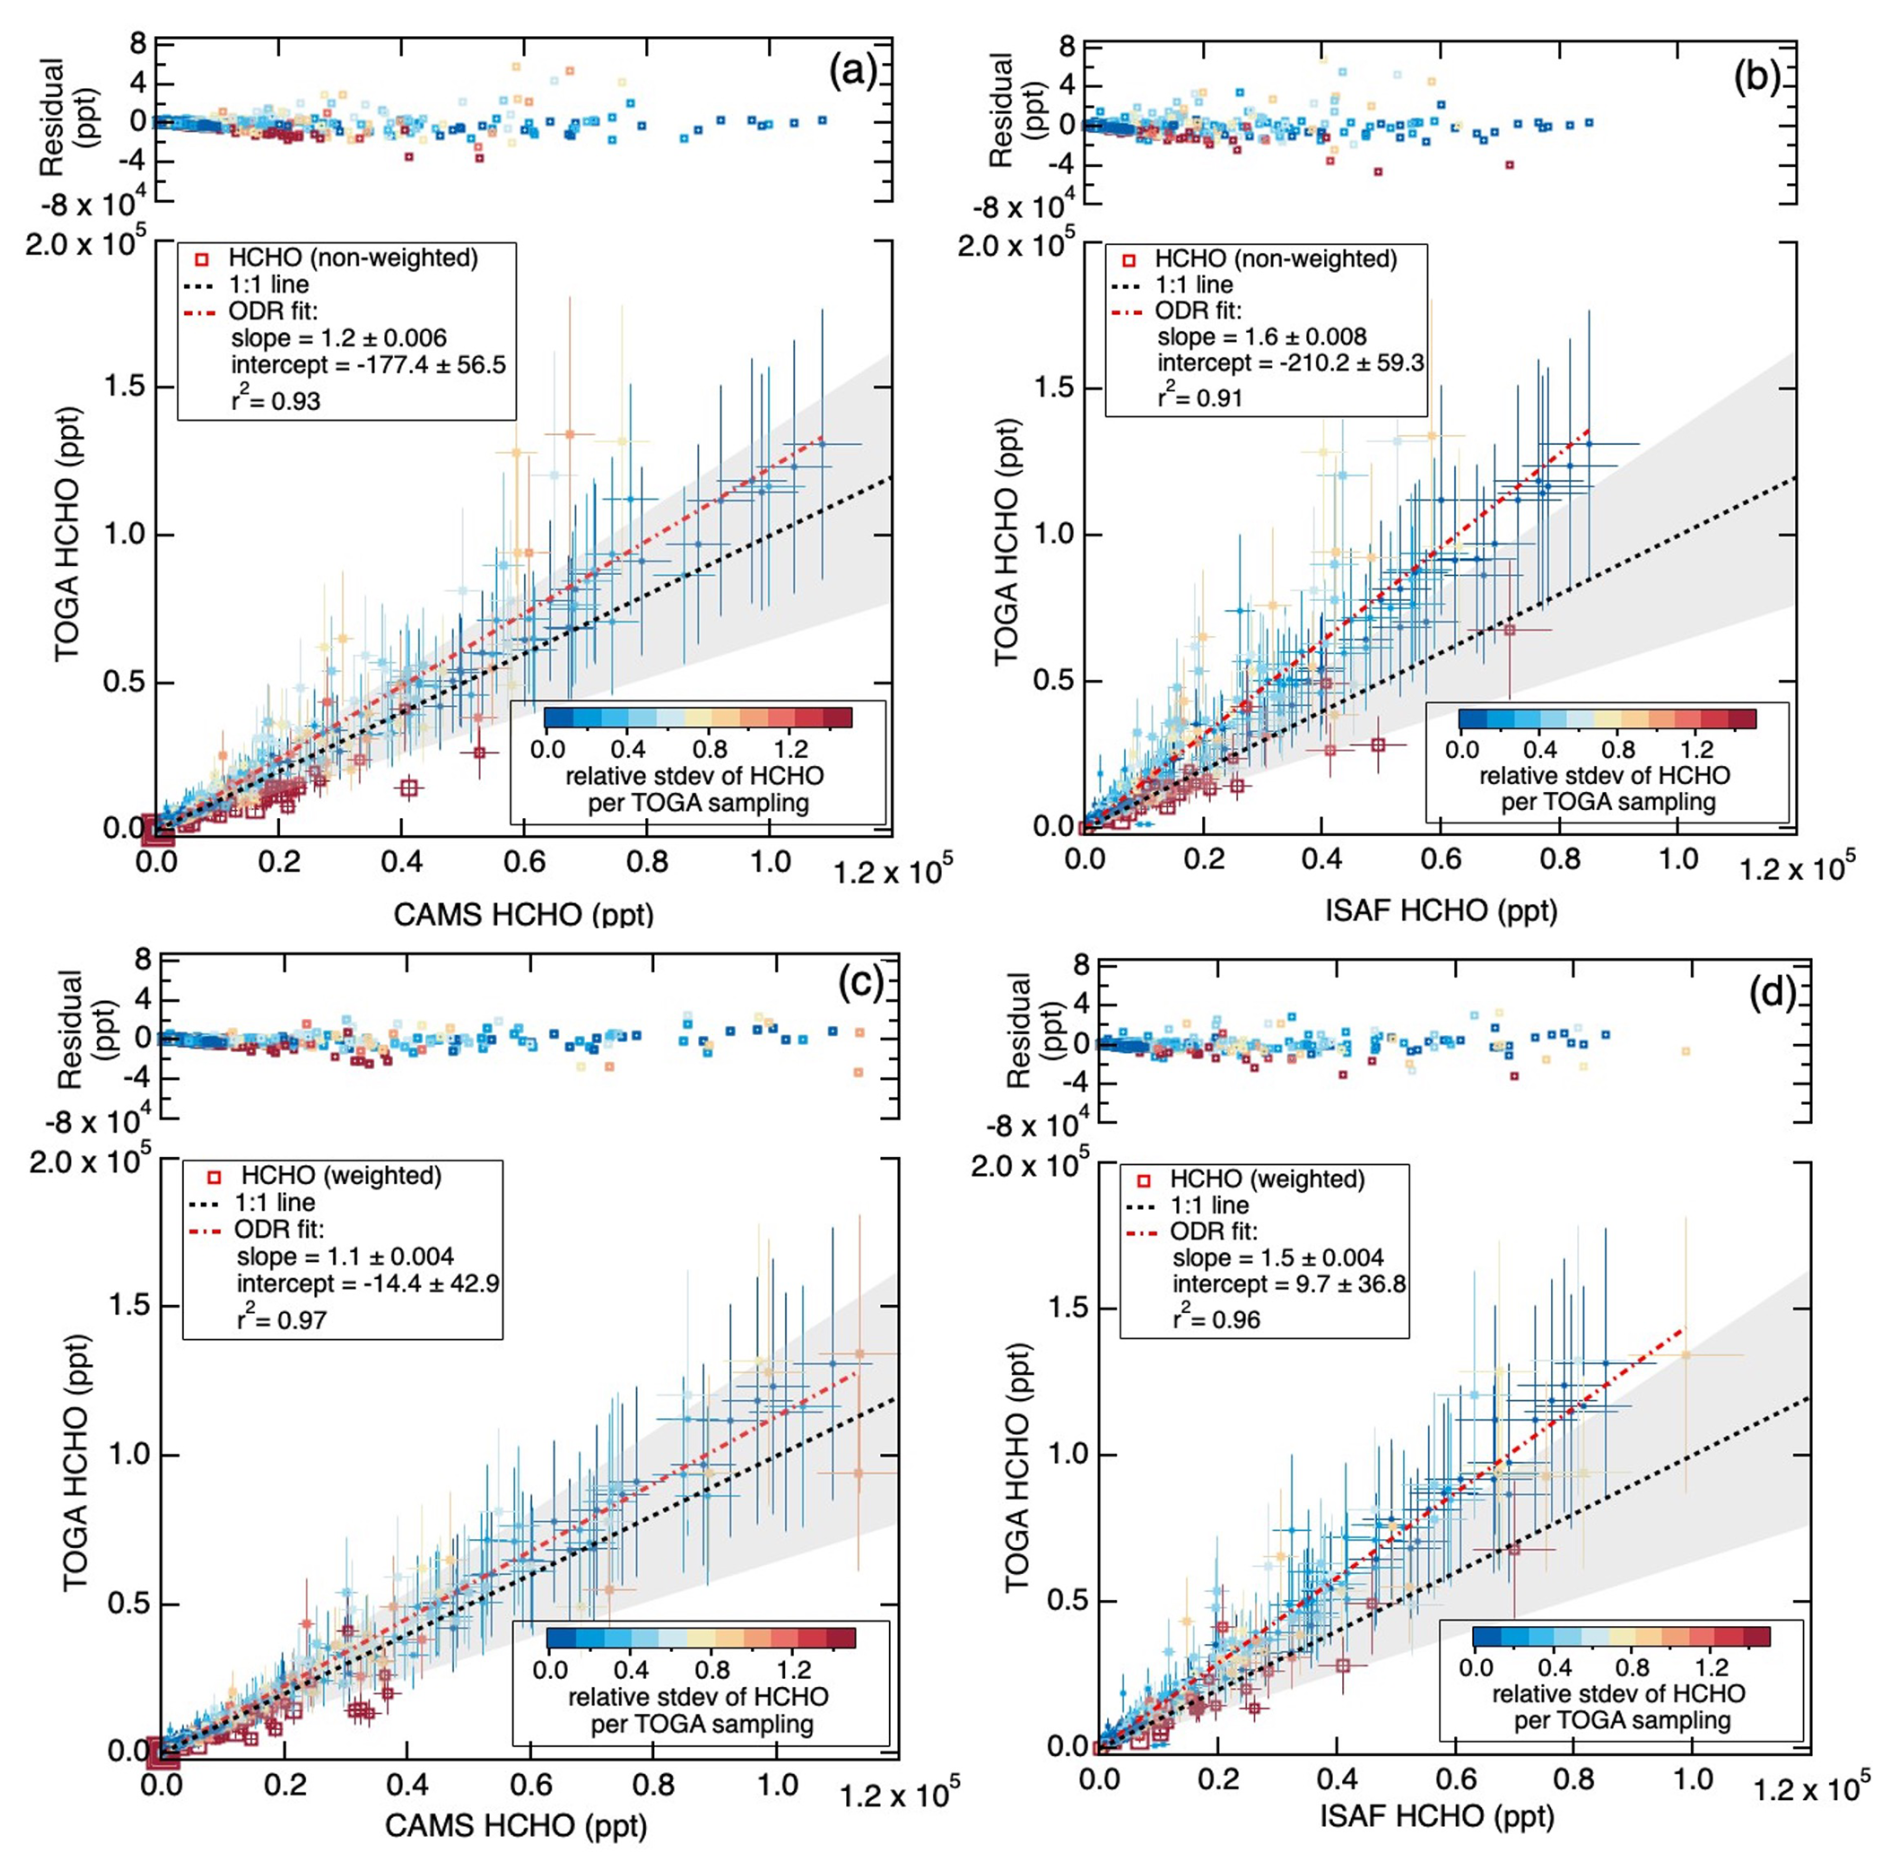
Figure 4Correlation of measured HCHO (a, c) between TOGA-TOF and CAMS and (b, d) between TOGA-TOF and ISAF. CAMS and ISAF 1 Hz HCHO data were averaged over the TOGA-TOF sampling start and stop times using the (a, b) non-weighted and (c, d) volume-weighted averaging methods. Measurement uncertainties of each measurement technique are shown as error bars. The grey shading around the 1:1 line is the HCHO measurement uncertainties of the two corresponding instruments added in quadrature. Each data point is colored by the relative standard deviation of the 1 Hz HCHO data (standard deviation of 1 Hz averaged HCHO divided by TOGA-TOF HCHO) during the TOGA-TOF sampling period.
Both non-weighted (Fig. 4a) and volume-weighted (Fig. 4c) averages showed that HCHO measured by CAMS was within the 35 % measurement uncertainty of the TOGA-TOF while the comparisons with ISAF (Fig. 4b and d) were outside of the range of measurement uncertainties. When using the non-weighted averaging method (Fig. 4a and b), the bivariate fitting (orthogonal distance regression, ODR) of the TOGA-TOF and the 1 Hz HCHO gave a slope of 1.2 for CAMS (y-intercept −177.4 ppt, Fig. 4a) and 1.6 for ISAF (y-intercept −210.2 ppt, Fig. 4b). The y-axis residuals from the ODR fit were largest for data points with higher relative standard deviations (i.e., >0.7) of HCHO. For the non-weighted averages, the absolute values of the y-axis residuals ranged from 0.6 ppt to 59.0 ppb for CAMS (mean ± standard deviation = 1.0 ± 3.0 ppb) and 0.1 ppt to 68.1 ppb for ISAF (0.9 ± 3.2 ppb). To differentiate the dependence on HCHO variations during each TOGA-TOF sampling, a relative standard deviation of 0.7 was used as a cut-off threshold. For data points with relative standard deviations >0.7, residuals ranged from 2.6 ppt to 59.0 ppb (2.7 ± 6.8 ppb) for CAMS and 52.1 ppt to 46.8 ppb (3.7 ± 7.8 ppb) for ISAF. In comparison, for less heterogeneous air masses (i.e., TOGA-merge 1 Hz HCHO with relative standard deviations <0.7), residuals ranged from 0.6 ppt to 44.1 ppb (0.7 ± 1.8 ppb) for CAMS and from 0.1 ppt to 68.1 ppb (0.6 ± 2.5 ppb) for ISAF. Therefore, the data points with less variable HCHO (i.e., HCHO relative standard deviation <0.7) showed on average a factor of 4–6 lower residual values, showing that the increased heterogeneity of HCHO in the sampled air masses lead to poorer correlations between TOGA-TOF and the 1 Hz HCHO instruments.
For more accurate comparisons, the CAMS and ISAF HCHO data averages were weighted by the TOGA-TOF sampling volume, factoring in the 50 % volume sampling midpoint. Weighted averages of the CAMS and ISAF measured HCHO improved the correlations with TOGA-TOF to give an r2 of 0.97 (compared to 0.93 for non-weighted averages) for CAMS and 0.96 (compared to 0.91 for non-weighted averages) for ISAF (Fig. 4c and d). The residuals of the volume-weighted averages were 30 % lower for CAMS (range 0.2 ppt to 32.2 ppb and average 0.7 ± 2.0 ppb) and 33 % lower for ISAF (range 0.03 ppt to 32 ppb and average 0.6 ± 2.0 ppb). Biases at low mixing ratios significantly improved when using volume-weighted averages with absolute values of the y-intercepts much closer to 0 than the non-weighted averages, at −14.4 ± 42.9 ppt for CAMS (versus −177.4 ± 56.4 ppt) and 9.7 ± 36.8 ppt for ISAF (versus −210.2 ± 59.3 ppt). Comparisons between TOGA-TOF and the UiO PTR-ToF-MS (Fig. S5), showed similar results with better agreement when using volume-weighted averages.
The discrepancies of HCHO between different measurement techniques during FIREX-AQ are similar to those shown by Liao et al. (2021), in which a comparison of CAMS vs. ISAF HCHO data had a slope of 1.27. In our study, a comparison of the volume-weighted TOGA-merge CAMS vs. ISAF HCHO from FIREX-AQ has a slope of 1.28, similar to Liao et al. (2021). The minor difference in the slopes is most likely due to the different periods of data selected for analysis as we only included CAMS and ISAF data during TOGA sampling in our analysis. Liao et al. (2021) suggested that the main discrepancies between CAMS and ISAF were driven by the uncertainties in the absolute calibration of the HCHO standards. As mentioned in Sect. 2.2, each HCHO measurement technique has been carefully calibrated with HCHO standards. The HCHO calibration standards used by each group were gravimetrically prepared and the absolute concentrations were quantified using optical absorption techniques. As the main purpose of this paper is to validate the TOGA-TOF as a unique technique for measuring HCHO, we will not further explore the reasons for the discrepancies between the instruments.
3.2 Comparison of HCHO NEMR between different instrumental techniques
Normalized excess mixing ratios (NEMR) are used to derive the enhancement of a trace gas within a smoke plume (Yokelson et al., 2013a). Figure 5 shows HCHO NEMRs derived from Western U.S. fires using the TOGA-TOF, CAMS, and ISAF instrumental techniques with respect to smoke plume physical age (https://www-air.larc.nasa.gov/cgi-bin/ArcView/firexaq#SCHWARZ.JOSHUA/). Based on the instrument uncertainties of both CO and the individual HCHO measurements, the uncertainties of the NEMRs are 35 %, 6 %, and 10 % for TOGA-TOF, CAMS, and ISAF, respectively. The HCHO NEMRs observed during FIREX-AQ from TOGA-TOF were in the range of 12 to 30 ppt ppb−1 CO. These NEMRs were within the wide range observed from previous wildfire biomass burning studies from 2.2 to 46 ppt ppb−1 CO (e.g., Hornbrook et al., 2011 and references therein) and during prescribed burning events in the Southeastern U.S. during FIREX-AQ that ranged from 16 to 29 ppt ppb−1 CO (Travis et al., 2023). The quadratic polynomial fitting of HCHO NEMRs from all three instruments showed that the NEMRs increased up to ∼ 5 h of plume physical age then declined. The age at which the HCHO NEMRs from each instrument begin to decrease (i.e., the change in the NEMRs with respect to plume age = 0) are all within 20 min of 5 h. This trend with respect to plume physical age agrees with what Liao et al. (2021) reported for HCHO NEMRs measured by ISAF from individual fire sources and is driven by the balance of production of HCHO, mainly from VOC oxidation by OH, and loss of HCHO, mainly from photolysis, throughout the aging of plume (Liao et al., 2021).
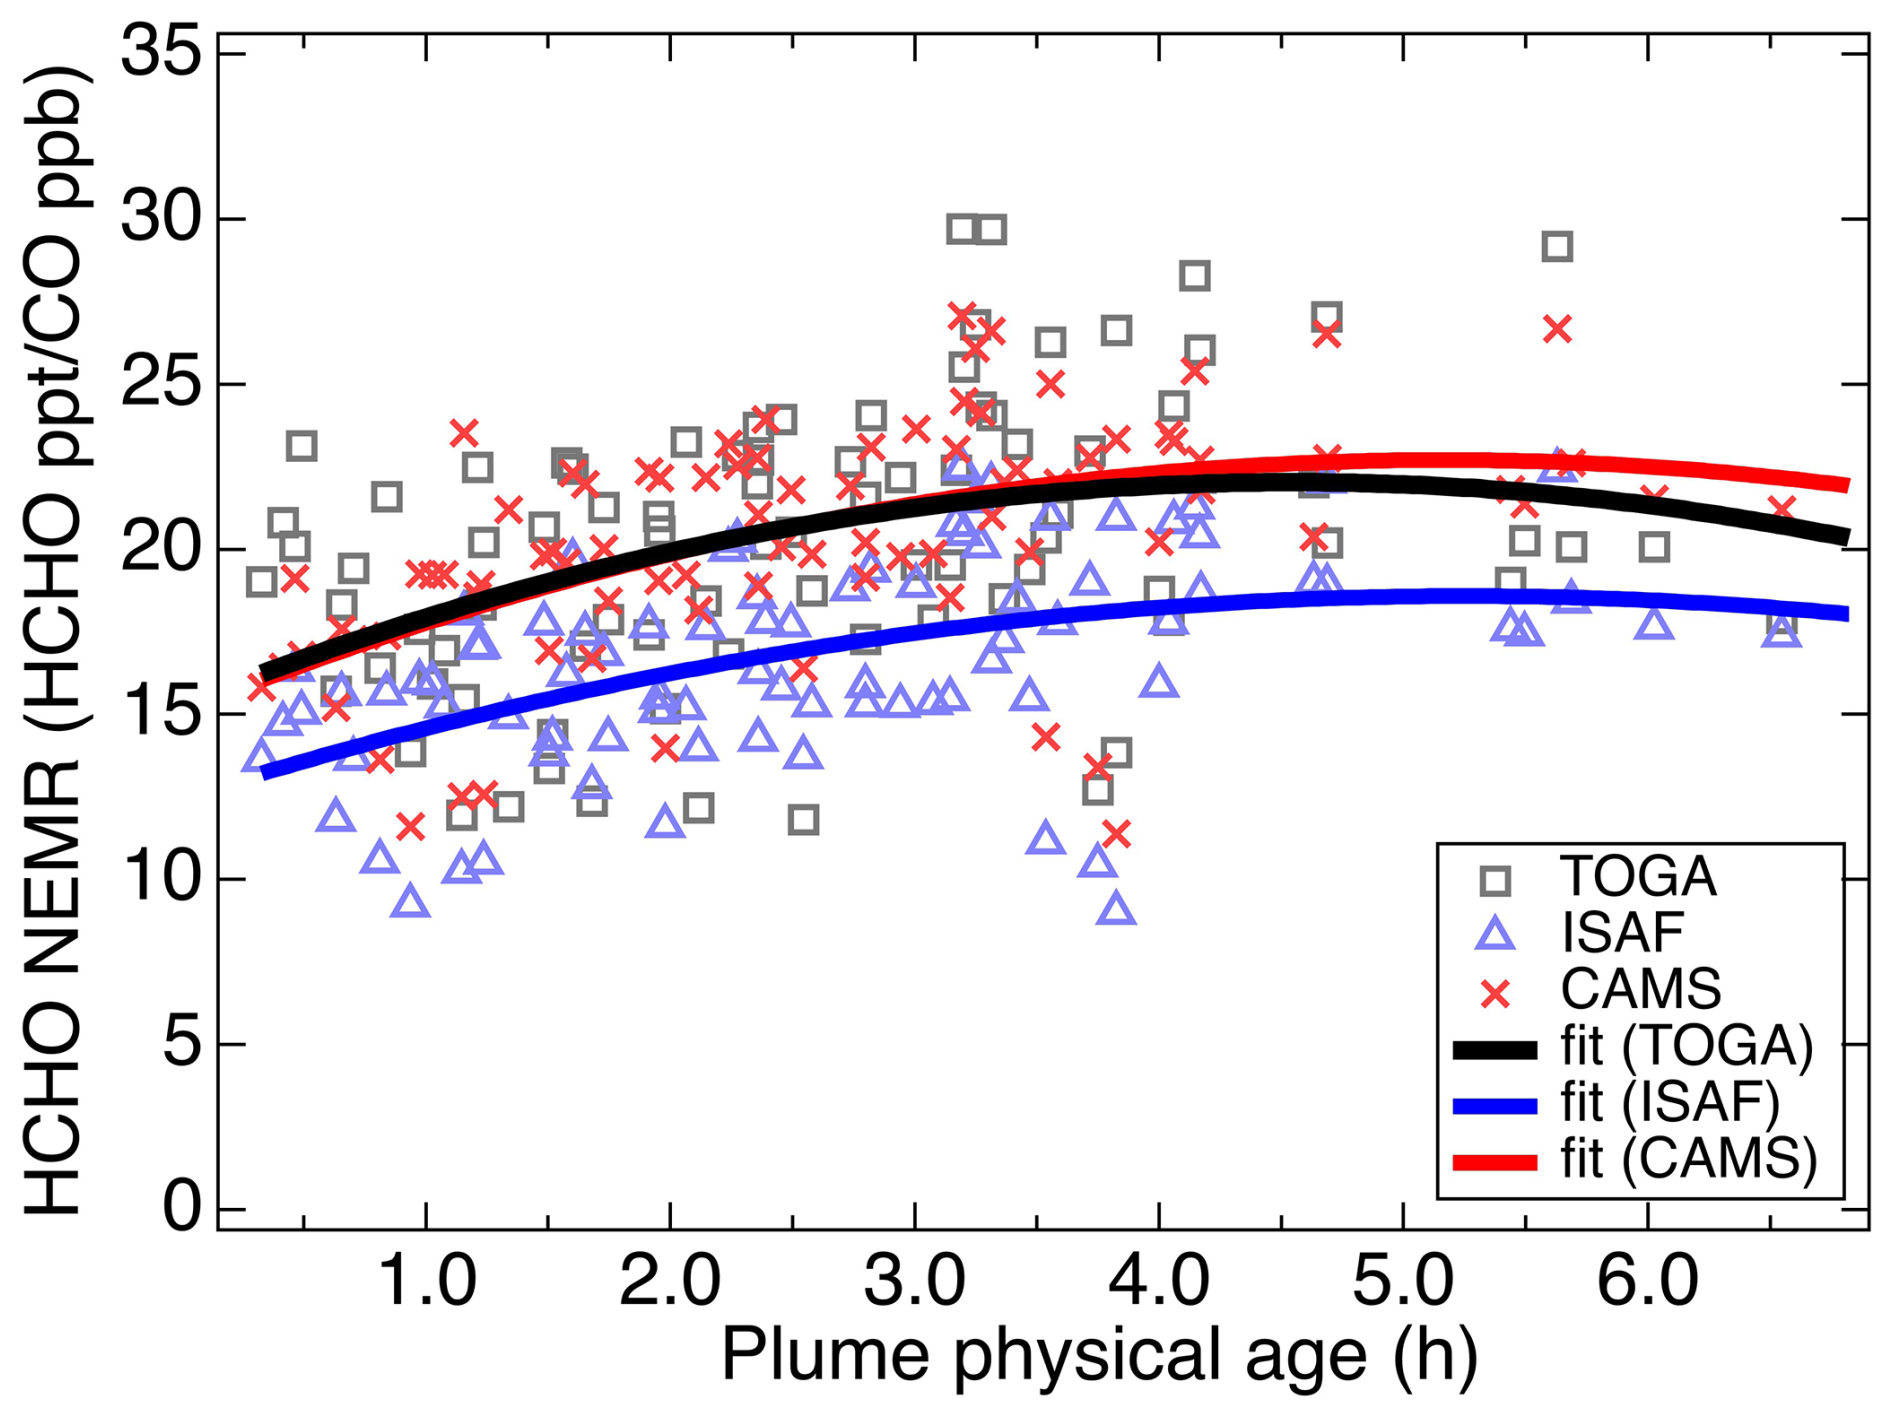
Figure 5HCHO NEMRs of Western U.S. fires with respect to plume physical age during FIREX-AQ. Quadratic polynomial fittings of NEMRs derived using TOGA-TOF, CAMS, and ISAF HCHO data are shown.
While the trend with respect to plume physical age was similar using HCHO from the different instruments, systematic differences were observed. To further investigate the possibility of systematic differences of the NEMRs derived from the three HCHO instruments, paired t-tests were used as a statistical method to compare two different analytical methods (Yen et al., 2020). Here we carried out a paired t-test on the HCHO NEMRs calculated from the HCHO measurements from the TOGA-TOF against CAMS and ISAF data. The sample number of the analysis was equivalent to the number of selected transects for NEMR analysis (86 pairs). The null hypothesis was whether the HCHO NEMRs from a pair of instruments are the same (H0: μ1=μ2), where the absolute value of the t-value (t) higher than the critical t (Tc) rejects the hypothesis. Between the TOGA-TOF and CAMS NEMRs, the analysis yielded , Tc=1.99, and p-value = 0.68, retaining the hypothesis (at the p=0.05 (5 %) level). Between the TOGA-TOF and ISAF NEMRs, the analysis yielded t=11.53, Tc=1.99, and p-value = 4.68 × 10⁻¹⁹, rejecting the hypothesis. Between the CAMS and ISAF NEMRs, the analysis yielded t=29.84, Tc=1.99, and p-value = 8.21 × 10−47, again rejecting the hypothesis. Therefore, both TOGA-TOF and CAMS derived NEMRs had a systematic difference from the ISAF derived NEMRs with a significance at the p=0.05 (5 %) level.
As mentioned in Sect. 3.1, systematic biases exist between the HCHO measurement techniques which are likely due to calibration standard differences. As illustrated in Fig. 5, these biases are similarly present in the derived HCHO NEMRs. Nonetheless, comparisons between the HCHO NEMRs derived from TOGA-TOF and CAMS (Fig. 6a) and TOGA-TOF and ISAF (Fig. 6b) indicate that the correlations are within the uncertainty bounds of the NEMR.
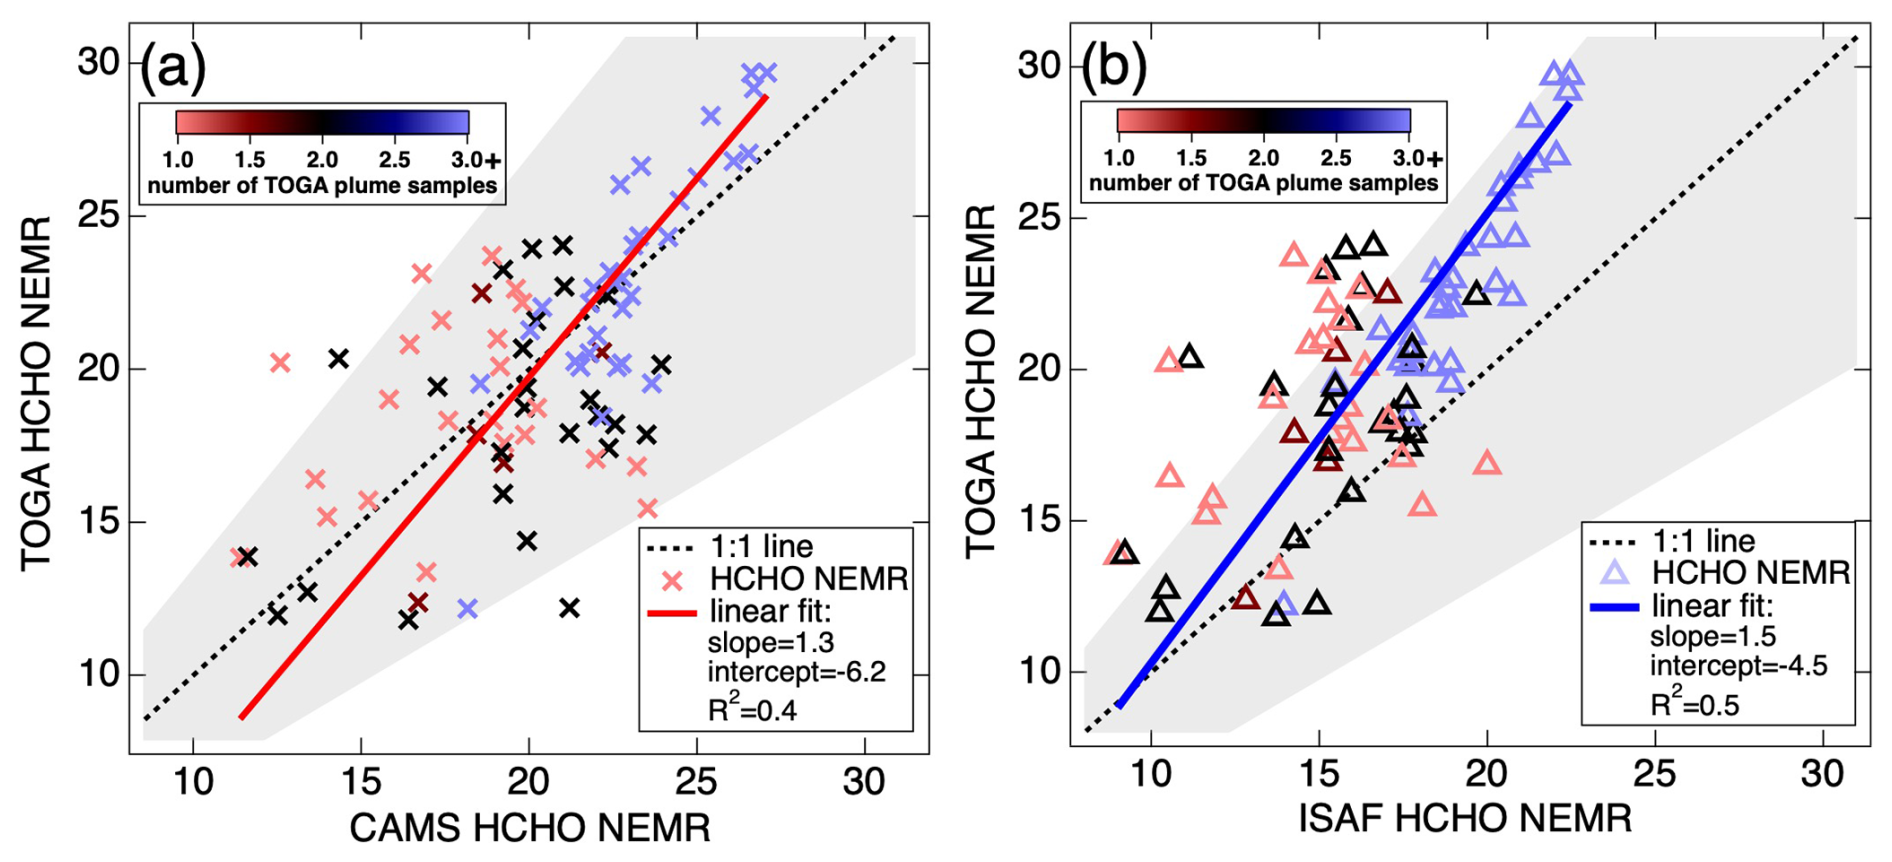
Figure 6Correlation plots between (a) TOGA-TOF and CAMS and (b) TOGA-TOF and ISAF derived HCHO NEMRs. Orthogonal distance regression fittings of the correlations are shown. The grey shading around the dashed 1:1 line shows the measurement uncertainty (35 %) of TOGA-TOF HCHO.
3.3 Discussion on TOGA-TOF HCHO NEMRs and their applicability
The applicability of TOGA-TOF-derived HCHO NEMRs is further explored for different smoke plume conditions. Figure 7 shows the difference of HCHO NEMRs between TOGA-TOF and CAMS with respect to the averages from the two methods. Similar to Fig. 5, Fig. 7b shows that the averaged HCHO NEMRs increase with plume physical age. With greater plume physical age, the bias between TOGA-TOF driven HCHO NEMRs to CAMS becomes lower (Fig. 7b) and this lower bias corresponds to more TOGA-TOF samples at each plume transect (Fig. 7a). With increasing physical age, the smoke plumes studied were generally more dispersed and spatially wider, therefore allowing more TOGA-TOF samples per transect.
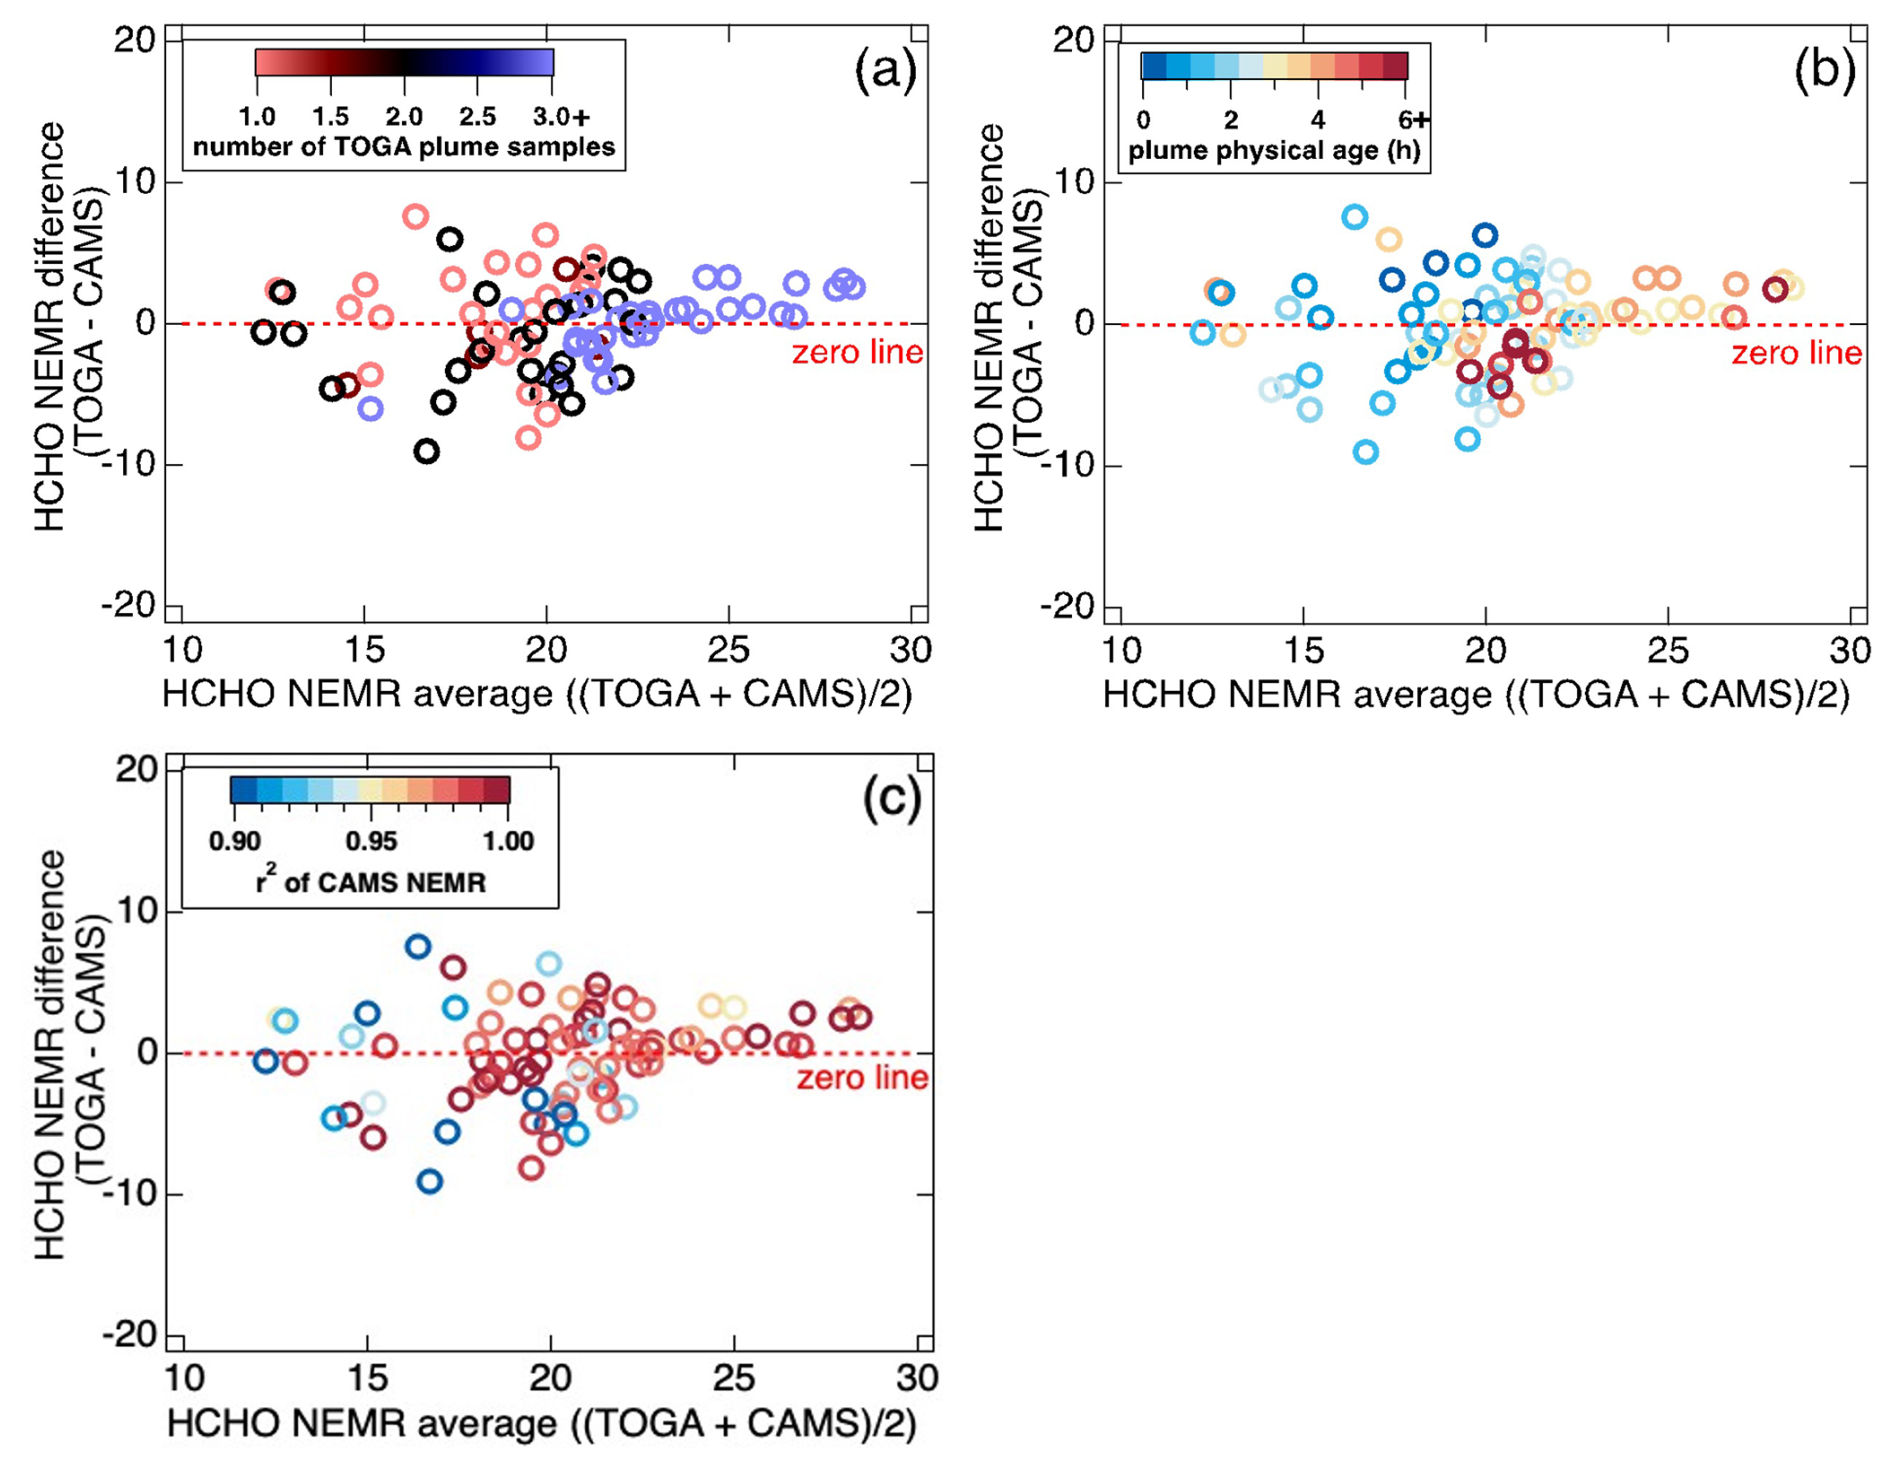
Figure 7Plots of HCHO NEMR bias between TOGA-TOF and CAMS measurements with respect to the magnitude of the mean values from both instruments. Each data point is color coded with (a) number of TOGA-TOF sampling in each plume transect, (b) plume physical age, and (c) r2 of the CAMS measured HCHO NEMR to CO.
The reduced bias between the two instrumental techniques with plume physical age can be explained from the reduced plume heterogeneity with aging, as indicated by the improved r2 of each plume sampling with plume physical age (Fig. 7c). Modeling studies of fire plumes (Trentmann et al., 2003a, b; Wang et al., 2021) have shown significant spatial heterogeneity, both vertically and horizontally, of fire plumes with different levels of oxidants (i.e., OH, O3, NO3). This plume heterogeneity has also been observed in power plant plumes (Brock et al., 2002). As discussed in Wang et al. (2021), at the early stage of a fire plume, OH levels are severely dampened at the core of the plume, mainly due to attenuation of solar radiation from aerosols, but enhanced at the edges. With aging of the plume, OH levels become more homogeneous (Wang et al., 2021). Liao et al. (2021) showed that HCHO levels observed in fire plumes as they age during FIREX-AQ were primary emissions coupled with subsequent photolytic loss and secondary production, primarily from the oxidation of VOCs with OH. Therefore, with plume physical age, as oxidant levels and photochemistry become more homogeneous, we can expect HCHO NEMRs to be more constant throughout a transect perpendicular to the direction of the smoke transport. As such, the r2 value of the slope of CAMS HCHO and CO, from which the NEMRs were calculated, is closer to 1 for larger NEMRs (and larger plume physical ages) (Fig. 7c). These results demonstrate that the TOGA-TOF data are sufficient for assessing HCHO NEMRs in plumes with physical ages >2–3 h and may result in a small bias in calculated NEMRs for younger, narrower plumes in comparison to those derived using fast HCHO measurement techniques.
In this study, we demonstrated the TOGA-TOF as a fast response (<2 min) GC/MS instrument that can measure HCHO along with >100 additional C1 to C10 VOCs. During FIREX-AQ, the TOGA-TOF measured a wide range of HCHO mixing ratios with an LLOD of 20 ppt aboard the NASA DC-8. To our knowledge, this technique has not been previously reported for any ambient measurements. The discrete TOGA-TOF HCHO measurements during FIREX-AQ are comparable to the averaged non-discrete 1 Hz HCHO data measured by the CAMS and UiO PTR-ToF-MS instruments while the discrepancies are beyond the combined instrumental uncertainties for the TOGA-TOF and ISAF instruments. The discrepancies between HCHO instrumental techniques during FIREX-AQ are currently believed to be due to differences in calibration standards as quantified by different optical techniques. Using volume-weighted TOGA merge averages of HCHO measured by CAMS, ISAF, and UiO PTR-ToF-MS improved the comparison agreement with TOGA-TOF HCHO observations. Therefore, we strongly encourage the community to use the reported Time_Start, Time_Mid, and Time_Stop values in the TOGA-TOF archived data files to determine volume-weighted averages of concurrent measurements.
TOGA-TOF derived NEMRs showed similar trends with plume physical age to what has been reported from ISAF (Liao et al., 2021), with NEMRs increasing with plume ages up to ∼ 5 h. Due to its nature of taking discrete subsamples of air masses, as shown in Fig. 3a, highly heterogeneous features may not be captured by the TOGA-TOF system in comparison to fast HCHO measurement techniques, especially in chemically dynamic environments near strong sources with highly heterogeneous emissions and rapidly varying HCHO production and loss often detected during airborne measurements. Nevertheless, the technique used in the TOGA-TOF offers a powerful HCHO-measuring method to the scientific community, with the capability to simultaneously measure >100 other C1-C10 VOC species. The wide range of gas-phase VOCs measured with the TOGA-TOF can be used to provide significant insights into understanding the photochemical state of air masses in rural to polluted environments. In addition, the time resolution and inherent averaging is well-suited for verifying satellite observations, three-dimensional modeling, and to compare with other instrumental techniques.
All data used in this paper are available at https://www-air.larc.nasa.gov/missions/firex-aq/index.html (last access: February 2023).
The supplement related to this article is available online at https://doi.org/10.5194/amt-19-2985-2026-supplement.
ECA conceptualized the project. DJ performed the data analyses and wrote the manuscript with input from ECA and RSH, RSH, AJH, GD, HSH, JPD, AF, DR, JW, PW, TFH, GMW, JSC, JP, AW, TM, JBN, FP, LT, JD, CW, JS, ECA performed the measurements, CDH analyzed the fire smoke ages, AS and EG contributed to the smoke and fuel identification data product, JHC was the project PI and provided guidance on the analyses.
At least one of the (co-)authors is a member of the editorial board of Atmospheric Measurement Techniques. The peer-review process was guided by an independent editor, and the authors also have no other competing interests to declare.
Publisher's note: Copernicus Publications remains neutral with regard to jurisdictional claims made in the text, published maps, institutional affiliations, or any other geographical representation in this paper. The authors bear the ultimate responsibility for providing appropriate place names. Views expressed in the text are those of the authors and do not necessarily reflect the views of the publisher.
The authors thank the entire FIREX-AQ Science Team and the NASA DC-8 crew. The authors would also like to thank Hyeong-Ahn Kwon at the University of Suwon for discussions on HCHO satellite observations.
Primary support for DJ for this project was provided by the NSF National Center for Atmospheric Research (NCAR) Advanced Study Program Postdoctoral Fellowship. This material is based upon work supported by the NSF National Center for Atmospheric Research, which is a major facility sponsored by the U.S. National Science Foundation under Cooperative Agreement No. 1852977. This research was also funded in part by NASA award No. 80NSSC18K0633. Additional support was provided by NOAA's Cooperative Agreements with CIRES NA17OAR4320101 and NA22OAR4320151.
This paper was edited by Anna Novelli and reviewed by two anonymous referees.
Akagi, S. K., Yokelson, R. J., Wiedinmyer, C., Alvarado, M. J., Reid, J. S., Karl, T., Crounse, J. D., and Wennberg, P. O.: Emission factors for open and domestic biomass burning for use in atmospheric models, Atmos. Chem. Phys., 11, 4039–4072, https://doi.org/10.5194/acp-11-4039-2011, 2011.
Anderson, D. C., Nicely, J. M., Wolfe, G. M., Hanisco, T. F., Salawitch, R. J., Canty, T. P., Dickerson, R. R., Apel, E. C., Baidar, S., Bannan, T. J., Blake, N. J., Chen, D., Dix, B., Fernandez, R. P., Hall, S. R., Hornbrook, R. S., Gregory Huey, L., Josse, B., Jöckel, P., Kinnison, D. E., Koenig, T. K., Le Breton, M., Marécal, V., Morgenstern, O., Oman, L. D., Pan, L. L., Percival, C., Plummer, D., Revell, L. E., Rozanov, E., Saiz-Lopez, A., Stenke, A., Sudo, K., Tilmes, S., Ullmann, K., Volkamer, R., Weinheimer, A. J., and Zeng, G.: Formaldehyde in the Tropical Western Pacific: Chemical Sources and Sinks, Convective Transport, and Representation in CAM-Chem and the CCMI Models, J. Geophys. Res.-Atmos., 122, 11201–11226, https://doi.org/10.1002/2016JD026121, 2017.
Apel, E. C., Hornbrook, R. S., Hills, A. J., Blake, N. J., Barth, M. C., Weinheimer, A., Cantrell, C., Rutledge, S. A., Basarab, B., Crawford, J., Diskin, G., Homeyer, C. R., Campos, T., Flocke, F., Fried, A., Blake, D. R., Brune, W., Pollack, I., Peischl, J., Ryerson, T., Wennberg, P. O., Crounse, J. D., Wisthaler, A., Mikoviny, T., Huey, G., Heikes, B., O'Sullivan, D., and Riemer, D. D.: Upper tropospheric ozone production from lightning NOx-impacted convection: Smoke ingestion case study from the DC3 campaign, J. Geophys. Res.-Atmos., 120, 2505–2523, https://doi.org/10.1002/2014JD022121, 2015.
Bourgeois, I., Peischl, J., Neuman, J. A., Brown, S. S., Allen, H. M., Campuzano-Jost, P., Coggon, M. M., DiGangi, J. P., Diskin, G. S., Gilman, J. B., Gkatzelis, G. I., Guo, H., Halliday, H. A., Hanisco, T. F., Holmes, C. D., Huey, L. G., Jimenez, J. L., Lamplugh, A. D., Lee, Y. R., Lindaas, J., Moore, R. H., Nault, B. A., Nowak, J. B., Pagonis, D., Rickly, P. S., Robinson, M. A., Rollins, A. W., Selimovic, V., St. Clair, J. M., Tanner, D., Vasquez, K. T., Veres, P. R., Warneke, C., Wennberg, P. O., Washenfelder, R. A., Wiggins, E. B., Womack, C. C., Xu, L., Zarzana, K. J., and Ryerson, T. B.: Comparison of airborne measurements of NO, NO2, HONO, NOy, and CO during FIREX-AQ, Atmos. Meas. Tech., 15, 4901–4930, https://doi.org/10.5194/amt-15-4901-2022, 2022.
Brock, C. A., Washenfelder, R. A., Trainer, M., Ryerson, T. B., Wilson, J. C., Reeves, J. M., Huey, L. G., Holloway, J. S., Parrish, D. D., Hübler, G., and Fehsenfeld, F. C.: Particle growth in the plumes of coal-fired power plants, J. Geophys. Res.-Atmos., 107, https://doi.org/10.1029/2001jd001062, 2002.
Cao, H., Fu, T.-M., Zhang, L., Henze, D. K., Miller, C. C., Lerot, C., Abad, G. G., De Smedt, I., Zhang, Q., van Roozendael, M., Hendrick, F., Chance, K., Li, J., Zheng, J., and Zhao, Y.: Adjoint inversion of Chinese non-methane volatile organic compound emissions using space-based observations of formaldehyde and glyoxal, Atmos. Chem. Phys., 18, 15017–15046, https://doi.org/10.5194/acp-18-15017-2018, 2018.
Cazorla, M., Wolfe, G. M., Bailey, S. A., Swanson, A. K., Arkinson, H. L., and Hanisco, T. F.: A new airborne laser-induced fluorescence instrument for in situ detection of formaldehyde throughout the troposphere and lower stratosphere, Atmos. Meas. Tech., 8, 541–552, https://doi.org/10.5194/amt-8-541-2015, 2015.
Chan Miller, C., Jacob, D. J., Marais, E. A., Yu, K., Travis, K. R., Kim, P. S., Fisher, J. A., Zhu, L., Wolfe, G. M., Hanisco, T. F., Keutsch, F. N., Kaiser, J., Min, K.-E., Brown, S. S., Washenfelder, R. A., González Abad, G., and Chance, K.: Glyoxal yield from isoprene oxidation and relation to formaldehyde: chemical mechanism, constraints from SENEX aircraft observations, and interpretation of OMI satellite data, Atmos. Chem. Phys., 17, 8725–8738, https://doi.org/10.5194/acp-17-8725-2017, 2017.
Claflin, M. S., Pagonis, D., Finewax, Z., Handschy, A. V., Day, D. A., Brown, W. L., Jayne, J. T., Worsnop, D. R., Jimenez, J. L., Ziemann, P. J., de Gouw, J., and Lerner, B. M.: An in situ gas chromatograph with automatic detector switching between PTR- and EI-TOF-MS: isomer-resolved measurements of indoor air, Atmos. Meas. Tech., 14, 133–152, https://doi.org/10.5194/amt-14-133-2021, 2021.
Curci, G., Palmer, P. I., Kurosu, T. P., Chance, K., and Visconti, G.: Estimating European volatile organic compound emissions using satellite observations of formaldehyde from the Ozone Monitoring Instrument, Atmos. Chem. Phys., 10, 11501–11517, https://doi.org/10.5194/acp-10-11501-2010, 2010.
Decker, Z. C. J., Robinson, M. A., Barsanti, K. C., Bourgeois, I., Coggon, M. M., DiGangi, J. P., Diskin, G. S., Flocke, F. M., Franchin, A., Fredrickson, C. D., Gkatzelis, G. I., Hall, S. R., Halliday, H., Holmes, C. D., Huey, L. G., Lee, Y. R., Lindaas, J., Middlebrook, A. M., Montzka, D. D., Moore, R., Neuman, J. A., Nowak, J. B., Palm, B. B., Peischl, J., Piel, F., Rickly, P. S., Rollins, A. W., Ryerson, T. B., Schwantes, R. H., Sekimoto, K., Thornhill, L., Thornton, J. A., Tyndall, G. S., Ullmann, K., Van Rooy, P., Veres, P. R., Warneke, C., Washenfelder, R. A., Weinheimer, A. J., Wiggins, E., Winstead, E., Wisthaler, A., Womack, C., and Brown, S. S.: Nighttime and daytime dark oxidation chemistry in wildfire plumes: an observation and model analysis of FIREX-AQ aircraft data, Atmos. Chem. Phys., 21, 16293–16317, https://doi.org/10.5194/acp-21-16293-2021, 2021.
Duncan, B. N., Yoshida, Y., Olson, J. R., Sillman, S., Martin, R. V., Lamsal, L., Hu, Y., Pickering, K. E., Retscher, C., Allen, D. J., and Crawford, J. H.: Application of OMI observations to a space-based indicator of NOx and VOC controls on surface ozone formation, Atmos. Environ., 44, 2213–2223, https://doi.org/10.1016/j.atmosenv.2010.03.010, 2010.
Fried, A., Walega, J., Weibring, P., Richter, D., Simpson, I. J., Blake, D. R., Blake, N. J., Meinardi, S., Barletta, B., Hughes, S. C., Crawford, J. H., Diskin, G., Barrick, J., Hair, J., Fenn, M., Wisthaler, A., Mikoviny, T., Woo, J.-H., Park, M., Kim, J., Min, K.-E., Jeong, S., Wennberg, P. O., Kim, M. J., Crounse, J. D., Teng, A. P., Bennett, R., Yang-Martin, M., Shook, M. A., Huey, G., Tanner, D., Knote, C., Kim, J., Park, R., and Brune, W.: Airborne formaldehyde and volatile organic compound measurements over the Daesan petrochemical complex on Korea's northwest coast during the Korea-United States Air Quality study, Elem. Sci. Anth., 8, 121, https://doi.org/10.1525/elementa.2020.121, 2020.
Gilman, J. B., Lerner, B. M., Kuster, W. C., Goldan, P. D., Warneke, C., Veres, P. R., Roberts, J. M., de Gouw, J. A., Burling, I. R., and Yokelson, R. J.: Biomass burning emissions and potential air quality impacts of volatile organic compounds and other trace gases from fuels common in the US, Atmos. Chem. Phys., 15, 13915–13938, https://doi.org/10.5194/acp-15-13915-2015, 2015.
Gilpin, T., Apel, E., Fried, A., Wert, B., Calvert, J., Genfa, Z., Dasgupta, P., Harder, J. W., Heikes, B., Hopkins, B., Westberg, H., Kleindienst, T., Lee, Y. N., Zhou, X., Lonneman, W., and Sewell, S.: Intercomparison of six ambient [CH2O] measurement techniques, J. Geophys. Res.-Atmos., 102, 21161–21188, https://doi.org/10.1029/97jd01314, 1997.
Gkatzelis, G. I., Coggon, M. M., Stockwell, C. E., Hornbrook, R. S., Allen, H., Apel, E. C., Bela, M. M., Blake, D. R., Bourgeois, I., Brown, S. S., Campuzano-Jost, P., St. Clair, J. M., Crawford, J. H., Crounse, J. D., Day, D. A., DiGangi, J. P., Diskin, G. S., Fried, A., Gilman, J. B., Guo, H., Hair, J. W., Halliday, H. S., Hanisco, T. F., Hannun, R., Hills, A., Huey, L. G., Jimenez, J. L., Katich, J. M., Lamplugh, A., Lee, Y. R., Liao, J., Lindaas, J., McKeen, S. A., Mikoviny, T., Nault, B. A., Neuman, J. A., Nowak, J. B., Pagonis, D., Peischl, J., Perring, A. E., Piel, F., Rickly, P. S., Robinson, M. A., Rollins, A. W., Ryerson, T. B., Schueneman, M. K., Schwantes, R. H., Schwarz, J. P., Sekimoto, K., Selimovic, V., Shingler, T., Tanner, D. J., Tomsche, L., Vasquez, K. T., Veres, P. R., Washenfelder, R., Weibring, P., Wennberg, P. O., Wisthaler, A., Wolfe, G. M., Womack, C. C., Xu, L., Ball, K., Yokelson, R. J., and Warneke, C.: Parameterizations of US wildfire and prescribed fire emission ratios and emission factors based on FIREX-AQ aircraft measurements, Atmos. Chem. Phys., 24, 929–956, https://doi.org/10.5194/acp-24-929-2024, 2024.
Green, J. R., Fiddler, M. N., Fibiger, D. L., McDuffie, E. E., Aquino, J., Campos, T., Shah, V., Jaeglé, L., Thornton, J. A., DiGangi, J. P., Wolfe, G. M., Bililign, S., and Brown, S. S.: Wintertime Formaldehyde: Airborne Observations and Source Apportionment Over the Eastern United States, J. Geophys. Res.-Atmos., 126, e2020JD033518, https://doi.org/10.1029/2020JD033518, 2021.
Hopkins, J. R., Still, T., Al-Haider, S., Fisher, I. R., Lewis, A. C., and Seakins, P. W.: A simplified apparatus for ambient formaldehyde detection via GC-pHID, Atmos. Environ., 37, 2557–2565, https://doi.org/10.1016/S1352-2310(03)00178-X, 2003.
Hornbrook, R. S., Blake, D. R., Diskin, G. S., Fried, A., Fuelberg, H. E., Meinardi, S., Mikoviny, T., Richter, D., Sachse, G. W., Vay, S. A., Walega, J., Weibring, P., Weinheimer, A. J., Wiedinmyer, C., Wisthaler, A., Hills, A., Riemer, D. D., and Apel, E. C.: Observations of nonmethane organic compounds during ARCTAS −- Part 1: Biomass burning emissions and plume enhancements, Atmos. Chem. Phys., 11, 11103–11130, https://doi.org/10.5194/acp-11-11103-2011, 2011.
Hunter, M. C., Bartle, K. D., Seakins, P. W., and Lewis, A. C.: Direct measurement of atmospheric formaldehyde using gas chromatography-pulsed discharge ionisation detection, Anal. Commun., 36, 101–104, https://doi.org/10.1039/A809762C, 1999.
Isaacman-VanWertz, G., Sueper, D. T., Aikin, K. C., Lerner, B. M., Gilman, J. B., de Gouw, J. A., Worsnop, D. R., and Goldstein, A. H.: Automated single-ion peak fitting as an efficient approach for analyzing complex chromatographic data, J. Chromatogr. A, 1529, 81–92, https://doi.org/10.1016/j.chroma.2017.11.005, 2017.
Jaeglé, L., Shah, V., Thornton, J. A., Lopez-Hilfiker, F. D., Lee, B. H., McDuffie, E. E., Fibiger, D., Brown, S. S., Veres, P., Sparks, T. L., Ebben, C. J., Wooldridge, P. J., Kenagy, H. S., Cohen, R. C., Weinheimer, A. J., Campos, T. L., Montzka, D. D., Digangi, J. P., Wolfe, G. M., Hanisco, T., Schroder, J. C., Campuzano-Jost, P., Day, D. A., Jimenez, J. L., Sullivan, A. P., Guo, H., and Weber, R. J.: Nitrogen Oxides Emissions, Chemistry, Deposition, and Export Over the Northeast United States During the WINTER Aircraft Campaign, J. Geophys. Res.-Atmos., 123, 12368–12393, https://doi.org/10.1029/2018JD029133, 2018.
Kaiser, J., Jacob, D. J., Zhu, L., Travis, K. R., Fisher, J. A., González Abad, G., Zhang, L., Zhang, X., Fried, A., Crounse, J. D., St. Clair, J. M., and Wisthaler, A.: High-resolution inversion of OMI formaldehyde columns to quantify isoprene emission on ecosystem-relevant scales: application to the southeast US, Atmos. Chem. Phys., 18, 5483–5497, https://doi.org/10.5194/acp-18-5483-2018, 2018.
Karbiwnyk, C. M., Mills, C. S., Helmig, D., and Birks, J. W.: Use of Chlorofluorocarbons as Internal Standards for the Measurement of Atmospheric Non-Methane Volatile Organic Compounds Sampled onto Solid Adsorbent Cartridges, Environ. Sci. Technol., 37, 1002–1007, https://doi.org/10.1021/es025910q, 2003.
Koss, A. R., Sekimoto, K., Gilman, J. B., Selimovic, V., Coggon, M. M., Zarzana, K. J., Yuan, B., Lerner, B. M., Brown, S. S., Jimenez, J. L., Krechmer, J., Roberts, J. M., Warneke, C., Yokelson, R. J., and de Gouw, J.: Non-methane organic gas emissions from biomass burning: identification, quantification, and emission factors from PTR-ToF during the FIREX 2016 laboratory experiment, Atmos. Chem. Phys., 18, 3299–3319, https://doi.org/10.5194/acp-18-3299-2018, 2018.
Kwon, H. A., Park, R. J., Oak, Y. J., Nowlan, C. R., Janz, S. J., Kowalewski, M. G., Fried, A., Walega, J., Bates, K. H., Choi, J., Blake, D. R., Wisthaler, A., and Woo, J. H.: Top-down estimates of anthropogenic VOC emissions in South Korea using formaldehyde vertical column densities from aircraft during the KORUS-AQ campaign, Elem. Sci. Anth., 9, 00109, https://doi.org/10.1525/elementa.2021.00109, 2021.
Lee, M., Heikes, B. G., Jacob, D. J., Sachse, G., and Anderson, B.: Hydrogen peroxide, organic hydroperoxide, and formaldehyde as primary pollutants from biomass burning, J. Geophys. Res.-Atmos., 102, 1301–1309, https://doi.org/10.1029/96JD01709, 1997.
Lerner, B. M., Gilman, J. B., Aikin, K. C., Atlas, E. L., Goldan, P. D., Graus, M., Hendershot, R., Isaacman-VanWertz, G. A., Koss, A., Kuster, W. C., Lueb, R. A., McLaughlin, R. J., Peischl, J., Sueper, D., Ryerson, T. B., Tokarek, T. W., Warneke, C., Yuan, B., and de Gouw, J. A.: An improved, automated whole air sampler and gas chromatography mass spectrometry analysis system for volatile organic compounds in the atmosphere, Atmos. Meas. Tech., 10, 291–313, https://doi.org/10.5194/amt-10-291-2017, 2017.
Liao, J., Wolfe, G. M., Hannun, R. A., St. Clair, J. M., Hanisco, T. F., Gilman, J. B., Lamplugh, A., Selimovic, V., Diskin, G. S., Nowak, J. B., Halliday, H. S., DiGangi, J. P., Hall, S. R., Ullmann, K., Holmes, C. D., Fite, C. H., Agastra, A., Ryerson, T. B., Peischl, J., Bourgeois, I., Warneke, C., Coggon, M. M., Gkatzelis, G. I., Sekimoto, K., Fried, A., Richter, D., Weibring, P., Apel, E. C., Hornbrook, R. S., Brown, S. S., Womack, C. C., Robinson, M. A., Washenfelder, R. A., Veres, P. R., and Neuman, J. A.: Formaldehyde evolution in US wildfire plumes during the Fire Influence on Regional to Global Environments and Air Quality experiment (FIREX-AQ), Atmos. Chem. Phys., 21, 18319–18331, https://doi.org/10.5194/acp-21-18319-2021, 2021.
Liao, J., Wolfe, G. M., Kotsakis, A. E., Nicely, J. M., St. Clair, J. M., Hanisco, T. F., González Abad, G., Nowlan, C. R., Ayazpour, Z., De Smedt, I., Apel, E. C., and Hornbrook, R. S.: Validation of formaldehyde products from three satellite retrievals (OMI SAO, OMPS-NPP SAO, and OMI BIRA) in the marine atmosphere with four seasons of Atmospheric Tomography Mission (ATom) aircraft observations, Atmos. Meas. Tech., 18, 1–16, https://doi.org/10.5194/amt-18-1-2025, 2025.
Luecken, D. J., Hutzell, W. T., Strum, M. L., and Pouliot, G. A.: Regional sources of atmospheric formaldehyde and acetaldehyde, and implications for atmospheric modeling, Atmos. Environ., 47, 477–490, https://doi.org/10.1016/j.atmosenv.2011.10.005, 2012.
Luecken, D. J., Napelenok, S. L., Strum, M., Scheffe, R., and Phillips, S.: Sensitivity of Ambient Atmospheric Formaldehyde and Ozone to Precursor Species and Source Types Across the United States, Environ. Sci. Technol., 52, 4668–4675, https://doi.org/10.1021/acs.est.7b05509, 2018.
Martin, R. V., Fiore, A. M., and Van Donkelaar, A.: Space-based diagnosis of surface ozone sensitivity to anthropogenic emissions, Geophys. Res. Lett., 31, L06120, https://doi.org/10.1029/2004GL019416, 2004.
Müller, M., Mikoviny, T., Feil, S., Haidacher, S., Hanel, G., Hartungen, E., Jordan, A., Märk, L., Mutschlechner, P., Schottkowsky, R., Sulzer, P., Crawford, J. H., and Wisthaler, A.: A compact PTR-ToF-MS instrument for airborne measurements of volatile organic compounds at high spatiotemporal resolution, Atmos. Meas. Tech., 7, 3763–3772, https://doi.org/10.5194/amt-7-3763-2014, 2014.
Müller, M., Anderson, B. E., Beyersdorf, A. J., Crawford, J. H., Diskin, G. S., Eichler, P., Fried, A., Keutsch, F. N., Mikoviny, T., Thornhill, K. L., Walega, J. G., Weinheimer, A. J., Yang, M., Yokelson, R. J., and Wisthaler, A.: In situ measurements and modeling of reactive trace gases in a small biomass burning plume, Atmos. Chem. Phys., 16, 3813–3824, https://doi.org/10.5194/acp-16-3813-2016, 2016.
NASA/LARC/SD/ASDC: FIREX-AQ DC-8 In-Situ Trace Gas Data, NASA/LARC/SD/ASDC [data set], https://doi.org/10.5067/ASDC/FIREXAQ_TraceGas_AircraftInSitu _DC8_Data_1 (last access: February 2023), 2020.
National Research Council (US) Committee on Toxicology: Formaldehyde – An Assessment of Its Health Effects, Washington (DC), https://doi.org/10.17226/705 (last access: February 2023), 1980.
Nussbaumer, C. M., Crowley, J. N., Schuladen, J., Williams, J., Hafermann, S., Reiffs, A., Axinte, R., Harder, H., Ernest, C., Novelli, A., Sala, K., Martinez, M., Mallik, C., Tomsche, L., Plass-Dülmer, C., Bohn, B., Lelieveld, J., and Fischer, H.: Measurement report: Photochemical production and loss rates of formaldehyde and ozone across Europe, Atmos. Chem. Phys., 21, 18413–18432, https://doi.org/10.5194/acp-21-18413-2021, 2021.
Palmer, P. I., Jacob, D. J., Fiore, A. M., Martin, R. V., Chance, K., and Kurosu, T. P.: Mapping isoprene emissions over North America using formaldehyde column observations from space, J. Geophys. Res.-Atmos., 108, 4180, https://doi.org/10.1029/2002jd002153, 2003.
Pfister, G., Wang, C. T., Barth, M., Flocke, F., Vizuete, W., and Walters, S.: Chemical Characteristics and Ozone Production in the Northern Colorado Front Range, J. Geophys. Res.-Atmos., 124, 13397–13419, https://doi.org/10.1029/2019JD030544, 2019.
Possanzini, M., Palo, V. di, and Cecinato, A.: Sources and photodecomposition of formaldehyde and acetaldehyde in Rome ambient air, Atmos. Environ., 36, 3195–3201, https://doi.org/10.1016/S1352-2310(02)00192-9, 2002.
Rice, A. L. and Quay, P. D.: Isotopic analysis of atmospheric formaldehyde by gas chromatography isotope ratio mass spectrometry, Anal. Chem., 78, 6320–6326, https://doi.org/10.1021/ac0602367, 2006.
Richter, D., Weibring, P., Walega, J. G., Fried, A., Spuler, S. M., and Taubman, M. S.: Compact highly sensitive multi-species airborne mid-IR spectrometer, Appl. Phys. B, 119, 119–131, https://doi.org/10.1007/s00340-015-6038-8, 2015.
Robinson, M. A., Decker, Z. C. J., Barsanti, K. C., Coggon, M. M., Flocke, F. M., Franchin, A., Fredrickson, C. D., Gilman, J. B., Gkatzelis, G. I., Holmes, C. D., Lamplugh, A., Lavi, A., Middlebrook, A. M., Montzka, D. M., Palm, B. B., Peischl, J., Pierce, B., Schwantes, R. H., Sekimoto, K., Selimovic, V., Tyndall, G. S., Thornton, J. A., Van Rooy, P., Warneke, C., Weinheimer, A. J., and Brown, S. S.: Variability and Time of Day Dependence of Ozone Photochemistry in Western Wildfire Plumes, Environ. Sci. Technol., 55, 10280–10290, https://doi.org/10.1021/acs.est.1c01963, 2021.
Sachse, G. W., Hill, G. F., Wade, L. O., and Perry, M. G.: Fast-response, high-precision carbon monoxide sensor using a tunable diode laser absorption technique, J. Geophys. Res.-Atmos., 92, 2071–2081, https://doi.org/10.1029/JD092iD02p02071, 1987.
Sagebiel, J. C., Zielinska, B., Pierson, W. R., and Gertler, A. W.: Real-world emissions and calculated reactivities of organic species from motor vehicles, Atmos. Environ., 30, 2287–2296, https://doi.org/10.1016/1352-2310(95)00117-4, 1996.
Schroeder, J. R., Crawford, J. H., Fried, A., Walega, J., Weinheimer, A., Wisthaler, A., Müller, M., Mikoviny, T., Chen, G., Shook, M., Blake, D. R., and Tonnesen, G. S.: New insights into the column CH2ONO2 ratio as an indicator of near-surface ozone sensitivity, J. Geophys. Res.-Atmos., 122, 8885–8907, https://doi.org/10.1002/2017JD026781, 2017.
Seinfeld, J. H. and Pandis, S. N.: Atmospheric Chemistry and Physics: From Air Pollution to Climate Change, 2nd edn., Wiley-Interscience, Hoboken, NJ, ISBN 9780471720188, 2006.
Selimovic, V., Yokelson, R. J., McMeeking, G. R., and Coefield, S.: In situ measurements of trace gases, PM, and aerosol optical properties during the 2017 NW US wildfire smoke event, Atmos. Chem. Phys., 19, 3905–3926, https://doi.org/10.5194/acp-19-3905-2019, 2019.
Souri, A. H., Nowlan, C. R., Wolfe, G. M., Lamsal, L. N., Miller, C., González Abad, G., Janz, S. J., Fried, A., Blake, D. R., Weinheimer, A. J., Diskin, G. S., Liu, X., and Chance, K.: Revisiting the effectiveness of HCHONO2 ratios for inferring ozone sensitivity to its precursors using high resolution airborne remote sensing observations in a high ozone episode during the KORUS-AQ campaign, Atmos. Environ., 224, 117341, https://doi.org/10.1016/j.atmosenv.2020.117341, 2020.
Souri, A. H., Johnson, M. S., Wolfe, G. M., Crawford, J. H., Fried, A., Wisthaler, A., Brune, W. H., Blake, D. R., Weinheimer, A. J., Verhoelst, T., Compernolle, S., Pinardi, G., Vigouroux, C., Langerock, B., Choi, S., Lamsal, L., Zhu, L., Sun, S., Cohen, R. C., Min, K.-E., Cho, C., Philip, S., Liu, X., and Chance, K.: Characterization of errors in satellite-based HCHONO2 tropospheric column ratios with respect to chemistry, column-to-PBL translation, spatial representation, and retrieval uncertainties, Atmos. Chem. Phys., 23, 1963–1986, https://doi.org/10.5194/acp-23-1963-2023, 2023.
Stavrakou, T., Müller, J.-F., De Smedt, I., Van Roozendael, M., van der Werf, G. R., Giglio, L., and Guenther, A.: Evaluating the performance of pyrogenic and biogenic emission inventories against one decade of space-based formaldehyde columns, Atmos. Chem. Phys., 9, 1037–1060, https://doi.org/10.5194/acp-9-1037-2009, 2009.
Travis, K. R., Crawford, James. H., Soja, A. J., Gargulinski, E. M., Moore, R. H., Wiggins, E. B., Diskin, G. S., DiGangi, J. P., Nowak, J. B., Halliday, H., Yokelson, R. J., McCarty, J. L., Simpson, I. J., Blake, D. R., Neinardi, S., Hornbrook, R. S., Apel, E. C., Hills, A. J., Warneke, C., Coggon, M. M., Rollins, A. W., Gilman, J. B., Womack, C. C., Robinson, M. A., Katich, J. M., Peischl, J., Gkatzelis, G. I., Bourgeois, I., Rickly, P. S., Lamplugh, A., Dibb, J. E., Jimenez, J. L., Campuzano-Jost, P., Day, D. A., Guo, H., Pagonis, D., Wennberg, P. O., Crounse, J. D., Xu, L., Hanisco, T. F., Wolfe, G. M., Liao, J., St. Clair, J. M., Nault, B. A., Fried, A., and Perring, A. E.: Emission Factors for Crop Residue and Prescribed Fires in the Eastern US during FIREX-AQ, J. Geophys. Res.-Atmos., 128, e2023JD039309, https://doi.org/10.1029/2023JD039309, 2023.
Trentmann, J., Andreae, M. O., and Graf, H. F.: Chemical processes in a young biomass-burning plume, J. Geophys. Res.-Atmos., 108, 4705, https://doi.org/10.1029/2003jd003732, 2003a.
Trentmann, J., Früh, B., Boucher, O., Trautmann, T., and Andreae, M. O.: Three-dimensional solar radiation effects on the actinic flux field in a biomass-burning plume, J. Geophys. Res.-Atmos., 108, 4558, https://doi.org/10.1029/2003jd003422, 2003b.
Viskari, E.-L., Vartiainen, M., and Pasanen, P.: Seasonal and diurnal variation in formaldehyde and acetaldehyde concentrations along a highway in Eastern Finland, Atmos. Environ., 34, 917–923, https://doi.org/10.1016/S1352-2310(99)00307-6, 2000.
Wang, S., Coggon, M. M., Gkatzelis, G. I., Warneke, C., Bourgeois, I., Ryerson, T., Peischl, J., Veres, P. R., Neuman, J. A., Hair, J., Shingler, T., Fenn, M., Diskin, G., Huey, L. G., Lee, Y. R., Apel, E. C., Hornbrook, R. S., Hills, A. J., Hall, S. R., Ullmann, K., Bela, M. M., Trainer, M. K., Kumar, R., Orlando, J. J., Flocke, F. M., and Emmons, L. K.: Chemical Tomography in a Fresh Wildland Fire Plume: A Large Eddy Simulation (LES) Study, J. Geophys. Res.-Atmos., 126, e2021JD035203, https://doi.org/10.1029/2021JD035203, 2021.
Warneke, C., McKeen, S. A., de Gouw, J. A., Goldan, P. D., Kuster, W. C., Holloway, J. S., Williams, E. J., Lerner, B. M., Parrish, D. D., Trainer, M., Fehsenfeld, F. C., Kato, S., Atlas, E. L., Baker, A., and Blake, D. R.: Determination of urban volatile organic compound emission ratios and comparison with an emissions database, J. Geophys. Res.-Atmos., 112, D10S47, https://doi.org/10.1029/2006JD007930, 2007.
Warneke, C., Schwarz, J. P., Dibb, J., Kalashnikova, O., Frost, G., Al-Saad, J., Brown, S. S., Brewer, Wm. A., Soja, A., Seidel, F. C., Washenfelder, R. A., Wiggins, E. B., Moore, R. H., Anderson, B. E., Jordan, C., Yacovitch, T. I., Herndon, S. C., Liu, S., Kuwayama, T., Jaffe, D., Johnston, N., Selimovic, V., Yokelson, R., Giles, D. M., Holben, B. N., Goloub, P., Popovici, I., Trainer, M., Kumar, A., Pierce, R. B., Fahey, D., Roberts, J., Gargulinski, E. M., Peterson, D. A., Ye, X., Thapa, L. H., Saide, P. E., Fite, C. H., Holmes, C. D., Wang, S., Coggon, M. M., Decker, Z. C. J., Stockwell, C. E., Xu, L., Gkatzelis, G., Aikin, K., Lefer, B., Kaspari, J., Griffin, D., Zeng, L., Weber, R., Hastings, M., Chai, J., Wolfe, G. M., Hanisco, T. F., Liao, J., Campuzano Jost, P., Guo, H., Jimenez, J. L., Crawford, J., and Team, T. F.-A. S.: Fire Influence on Regional to Global Environments and Air Quality (FIREX-AQ), J. Geophys. Res.-Atmos., 128, e2022JD037758, https://doi.org/10.1029/2022JD037758, 2023.
Wolfe, G. M., Kaiser, J., Hanisco, T. F., Keutsch, F. N., de Gouw, J. A., Gilman, J. B., Graus, M., Hatch, C. D., Holloway, J., Horowitz, L. W., Lee, B. H., Lerner, B. M., Lopez-Hilifiker, F., Mao, J., Marvin, M. R., Peischl, J., Pollack, I. B., Roberts, J. M., Ryerson, T. B., Thornton, J. A., Veres, P. R., and Warneke, C.: Formaldehyde production from isoprene oxidation across NOx regimes, Atmos. Chem. Phys., 16, 2597–2610, https://doi.org/10.5194/acp-16-2597-2016, 2016.
Yen, J., Leber, D., and Pibida, L.: Comparing Instruments, Gaithersburg, MD, https://doi.org/10.6028/NIST.TN.2106, 2020.
Yokelson, R. J., Andreae, M. O., and Akagi, S. K.: Pitfalls with the use of enhancement ratios or normalized excess mixing ratios measured in plumes to characterize pollution sources and aging, Atmos. Meas. Tech., 6, 2155–2158, https://doi.org/10.5194/amt-6-2155-2013, 2013a.
Yokelson, R. J., Burling, I. R., Gilman, J. B., Warneke, C., Stockwell, C. E., de Gouw, J., Akagi, S. K., Urbanski, S. P., Veres, P., Roberts, J. M., Kuster, W. C., Reardon, J., Griffith, D. W. T., Johnson, T. J., Hosseini, S., Miller, J. W., Cocker III, D. R., Jung, H., and Weise, D. R.: Coupling field and laboratory measurements to estimate the emission factors of identified and unidentified trace gases for prescribed fires, Atmos. Chem. Phys., 13, 89–116, https://doi.org/10.5194/acp-13-89-2013, 2013b.
Zhang, H., Li, J., Ying, Q., Guven, B. B., and Olaguer, E. P.: Source apportionment of formaldehyde during TexAQS 2006 using a source-oriented chemical transport model, J. Geophys. Res.-Atmos., 118, 1525–1535, https://doi.org/10.1002/jgrd.50197, 2013.
Zhu, L., Jacob, D. J., Kim, P. S., Fisher, J. A., Yu, K., Travis, K. R., Mickley, L. J., Yantosca, R. M., Sulprizio, M. P., De Smedt, I., González Abad, G., Chance, K., Li, C., Ferrare, R., Fried, A., Hair, J. W., Hanisco, T. F., Richter, D., Jo Scarino, A., Walega, J., Weibring, P., and Wolfe, G. M.: Observing atmospheric formaldehyde (HCHO) from space: validation and intercomparison of six retrievals from four satellites (OMI, GOME2A, GOME2B, OMPS) with SEAC4RS aircraft observations over the southeast US, Atmos. Chem. Phys., 16, 13477–13490, https://doi.org/10.5194/acp-16-13477-2016, 2016.
Zhu, L., Jacob, D. J., Keutsch, F. N., Mickley, L. J., Scheffe, R., Strum, M., González Abad, G., Chance, K., Yang, K., Rappenglück, B., Millet, D. B., Baasandorj, M., Jaeglé, L., and Shah, V.: Formaldehyde (HCHO) As a Hazardous Air Pollutant: Mapping Surface Air Concentrations from Satellite and Inferring Cancer Risks in the United States, Environ. Sci. Technol., 51, 5650–5657, https://doi.org/10.1021/acs.est.7b01356, 2017.