the Creative Commons Attribution 4.0 License.
the Creative Commons Attribution 4.0 License.
 | 15 Jan 2026
Findings of the African Combustion Aerosol Collaborative Intercomparison Analysis (ACACIA) Pilot Project to Understand the Optical Properties of Biomass Burning Smoke
Marc N. Fiddler
Vaios Moschos
Megan M. McRee
Abu Sayeed Md Shawon
Kyle Gorkowski
James E. Lee
Nevil A. Franco
Katherine B. Benedict
Samir Kattel
Chelia Thompson
Africa is a critical source of biomass burning (BB) aerosols, and its importance is increasing. The African Combustion Aerosol Collaborative Intercomparison Analysis (ACACIA) Pilot Project set to optically characterize BB aerosol generated from sub-Saharan African fuels. We used a photoacoustic spectrometer as a reference instrument to determine the multiple-scattering correction factor Cλ for an AE33 aethalometer at three wavelengths, which produced weighted mean values of C370=3.69, C470=5.65, and C520=6.39. Cλ increased with wavelength and C370 was statistically independent of the others, suggesting a single Cλ is insufficient, especially in BB scenarios. While a dependence of Cλ on burning state was not found, Cλ was shown to strongly relate to particle single scattering albedo (SSA, ω). When Cλ was plotted against SSA, values slowly rose at low SSA values, followed by a sharp rise around an SSA of ∼ 0.9; indicating a larger correction needed for less absorbing aerosol. A number of functions operating on either SSA or Cλ were explored and the best function was . This is an important parametrization of Cλ specifically geared towards BB aerosol from African fuels under different aging states, and is of particular importance for future field work in that continent. An Ångström matrix plot shows that African BB aerosol can have values more akin to dust, which demonstrates that these fuels are distinct in their wavelength dependence from more typical BB aerosol. Lastly, we examined the mass extinction and absorbance cross sections for BB aerosol generated for the same fuels with two different tube furnace setups. Not only is this combustion method flexible, it was found to be reproducible between labs.
- Article
(801 KB) - Full-text XML
-
Supplement
(1278 KB) - BibTeX
- EndNote


The widespread nature of African biomass burning (BB), as well as the tremendous amounts of primary fine particulate matter (PM2.5) and gas-phase emissions that fires produce, have been shown to significantly affect a variety of processes that ultimately impact the Earth's atmospheric composition and chemistry, air quality, water cycle, and climate (Shuman et al., 2022). In Africa, BB is the largest source of aerosols after Saharan dust (Dajuma et al., 2021). Globally, BB-derived aerosols make up most of the primary combustion aerosol emissions, with ∼ 52 % from Africa (Ichoku, 2020; Ichoku et al., 2016). Africa accounts for about 72 % of the total global burned area (van der Werf et al., 2010; Ramo et al., 2021).
Future aerosol emissions in Africa are expected to increase due to rapid economic growth, industrialization, and population growth, as the African population is expected to triple by 2100 (Lamarque et al., 2010; Liousse et al., 2014; Vollset et al., 2020). Recent estimates show that Africa's fire emissions are 31 %–101 % higher than previous assessments (Ramo et al., 2021). These environmental threats will not only impact Africa's population but will also have a global environmental impact (Ramo et al., 2021). Because the sub-Saharan region of Africa is tropical, BB emissions from this area have a direct and profound influence on the global troposphere. This is due to the presence of a very efficient and deep convective belt that lifts air upwards and leads to transportation of aged, chemically-processed air in the northern and southern subtropics and midlatitudes (Crutzen and Andreae, 1990; Santos et al., 2018; Randel and Jensen, 2013). These factors suggest that Africa may contribute a significant portion of future emissions affecting global atmospheric composition. The influence of Africa's emissions on the Earth's radiative forcing and global air quality are increasingly important, making the need to understand these emissions urgent. These are formative years for African countries, as the development choices they make now will significantly shape their future emissions and long-term environmental impact.
Optical methods for measuring light absorption in the ultraviolet (UV) and visible (vis) regions of the spectrum are crucial for understanding the optical properties of BB aerosols (Bond and Bergstrom, 2006; Lack and Cappa, 2010; Moschos et al., 2021). These methods quantify the interaction between light and particles, providing insights into their composition, sources, radiative effects, and atmospheric processes. Intercomparison studies are essential to ensure consistency across various optical instruments and methods, facilitating reliable quantification of aerosol optical properties (Collaud Coen et al., 2004; Müller et al., 2011; Bond et al., 1999; Moosmüller et al., 2009). Such studies might compare in situ methods like photoacoustic spectrometers (PASS), cavity-attenuated phase shift (CAPS) spectrometers, nephelometer, and filter-based techniques. The latter are widely used for a variety of reasons, however, they are susceptible to scattering artifacts and loading effects (Moschos et al., 2021; Collaud Coen et al., 2010; Ferrero et al., 2024; Kim et al., 2019; Bernardoni et al., 2021; Drinovec et al., 2015; Weingartner et al., 2003). Intercomparisons may help refine correction factors to ensure accurate absorption coefficients, which is especially needed for BB-derived organic aerosols that exhibit complex optical behaviors across wavelengths (Baumgardner et al., 2012; Bond et al., 1999; Cuesta-Mosquera et al., 2021; Müller et al., 2011).
The dual-spot AE33 model aethalometer is a common filter-based instrument that can be used to measure aerosol absorption properties (Hansen et al., 1984). The AE33 measures light attenuation through aerosol-laden filter spots at multiple wavelengths (370–950 nm), offering insights into wavelength-dependent absorption behaviors. Its figures of merit include mid-cost, ease of operation, broad spectral coverage, automatic loading correction, and ability to take continuous, unsupervised, real-time measurements. This has led to its extensive use in field and laboratory studies to quantify the light-absorbing characteristics of black carbon (BC) and brown carbon (BrC) aerosols from diverse sources. It is part of the standard instrumentation package used in the DoE ARM Aerosol Observing System (Uin et al., 2019) and us widely used in international monitoring networks, such as the World Meteorological Organization's Global Atmosphere Watch.
However, the method's limitations include potential biases from scattering within the filter material, multiple scattering effects of the particles, filter loading (i.e. particle shadowing), and the need for wavelength-specific correction factors (Cλ), which depend on accurate intercomparison with other in situ techniques (Bond et al., 1999; Collaud Coen et al., 2010). The absorption characteristics of combustion particles, especially those containing organic carbon (OC), is influenced by how they get collected on filters – often as liquid coatings rather than solid particles, which can lead to overestimated absorption and biased elemental carbon (EC) readings during thermal-optical analysis (Subramanian et al., 2007). Weakly-absorbing coatings containing BrC can distort filter-based measurements like the Particle Soot Absorption Photometer (PSAP) and aethalometer, which have been corrected using side-by-side measurements with photoacoustic devices (Kumar et al., 2022). Measurement uncertainty is also influenced by collection time, spot area, flow rate, and attenuation change (Backman et al., 2017). Using a single wavelength and time independent correction factor (C) for aethalometers can yield consistent aerosol heating rate data, but cause biases in the source and speciation apportionments. Applying wavelength-dependent Cλ results in more precise and consistent outcomes, while a time-dependent correction (Ct), using a separate measurement such as a multi-wavelength absorption analyzer (MWAA), has minimal effect on heating rates (Ferrero et al., 2021; Yus-Díez et al., 2021). Filter loading can cause errors of up to ±50 %, depending on aerosol properties (Drinovec et al., 2017). A number of other factors can significantly affect aethalometer measurements, including filter equilibration, particle penetration depth, and aerosol type, especially for complex aerosols (Arnott et al., 2005; Drinovec et al., 2017). Despite these limitations, the aethalometer remains a valuable tool for aerosol optical characterization, particularly when combined with complementary methods to account for biases and improve data reliability (Drinovec et al., 2015; Moschos et al., 2024, 2021; Cuesta-Mosquera et al., 2021; Saturno et al., 2017; Yus-Díez et al., 2021; Ferrero et al., 2024; Weingartner et al., 2003; Arnott et al., 2005). However, there have only been a few instances where the AE33 has been applied exclusively to ambient BB aerosol (Schmid et al., 2006).
Such aethalometer absorption measurements have been applied to BB aerosols generated in a laboratory environment, which enables the control of fuel type, exposure to volatile organic compounds (VOCs) and oxidants, and combustion state (McRee et al., 2024; Moschos et al., 2024). Previous work in our laboratory has used a tube furnace for generating BB aerosol, which has allowed a high degree of flexibility in accessing different combustion states of a fuel (Pokhrel et al., 2021a). Owing to its flexibility and commercial availability, the use of this combustion setup has been growing (Benedict et al., 2024; Hoffer et al., 2017).
The African Combustion Aerosol Collaborative Intercomparison Analysis (ACACIA) Pilot Project's aim was to optically characterize BB aerosol generated from African fuels, correct the AE33 aethalometer at multiple wavelengths, and parametrize the correction factors in well-controlled and characterized conditions. The AE33 is likely to see use in long-term monitoring in future field campaigns in Africa, which makes determining Cλ for these BB aerosol essential. This was accomplished by conducting laboratory studies at Los Alamos National Laboratory (LANL) and North Carolina A&T State University (NCAT), where aethalometer measurements were compared to in situ optical measurements. Mass cross sections of BB aerosol from these under-studied fuels will be determined along with their wavelength dependence. Additionally, we will examine the wavelength dependence of scattering and absorption and place it in the context of other BB aerosol measurements. Lastly, results from combusting the same fuels with two different tube furnace systems will be compared to assess the general applicability of this flexible means of producing BB aerosol.
2.1 Fuels
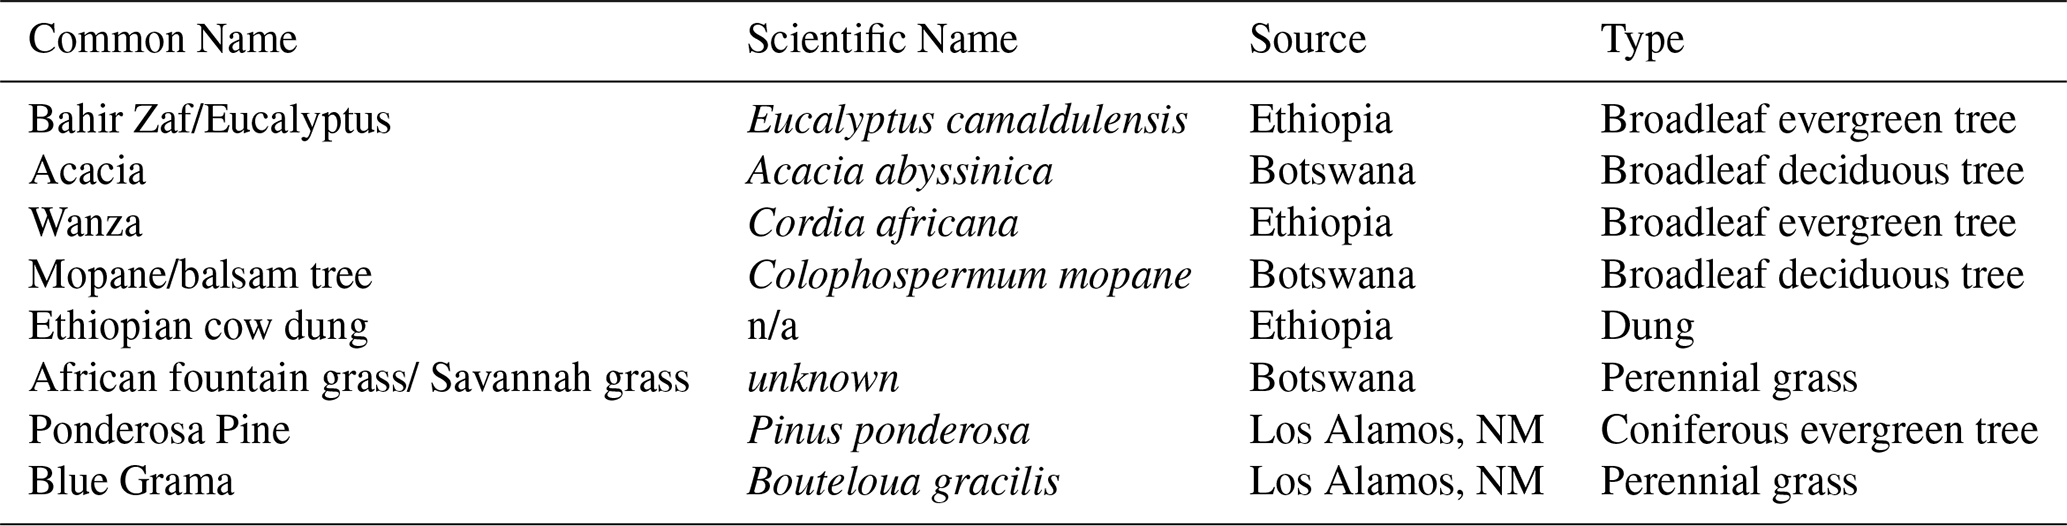
African biomass fuels obtained directly from Ethiopia, Botswana, and a few additional fuels that were collected near LANL. These fuels were selected to be representative of those burned for domestic use in Africa and wildland fires in New Mexico (NM). A thorough description of each fuel is given in Sect. S1 in the Supplement. Fuel samples were stored in a fume hood to dry and their moisture content was measured (PCE-MA 50x, PCE Instruments). All fuels were found to have a moisture content of <10 %, and were considered dry (McRee et al., 2024). The spatial extent and use of each fuel are described in SI and they are listed in Table 1. Botswana samples were collected in Palapye.
Table 1Fuels used for these experiments. n/a – not applicable.
2.2 LANL Combustion and Measurement System
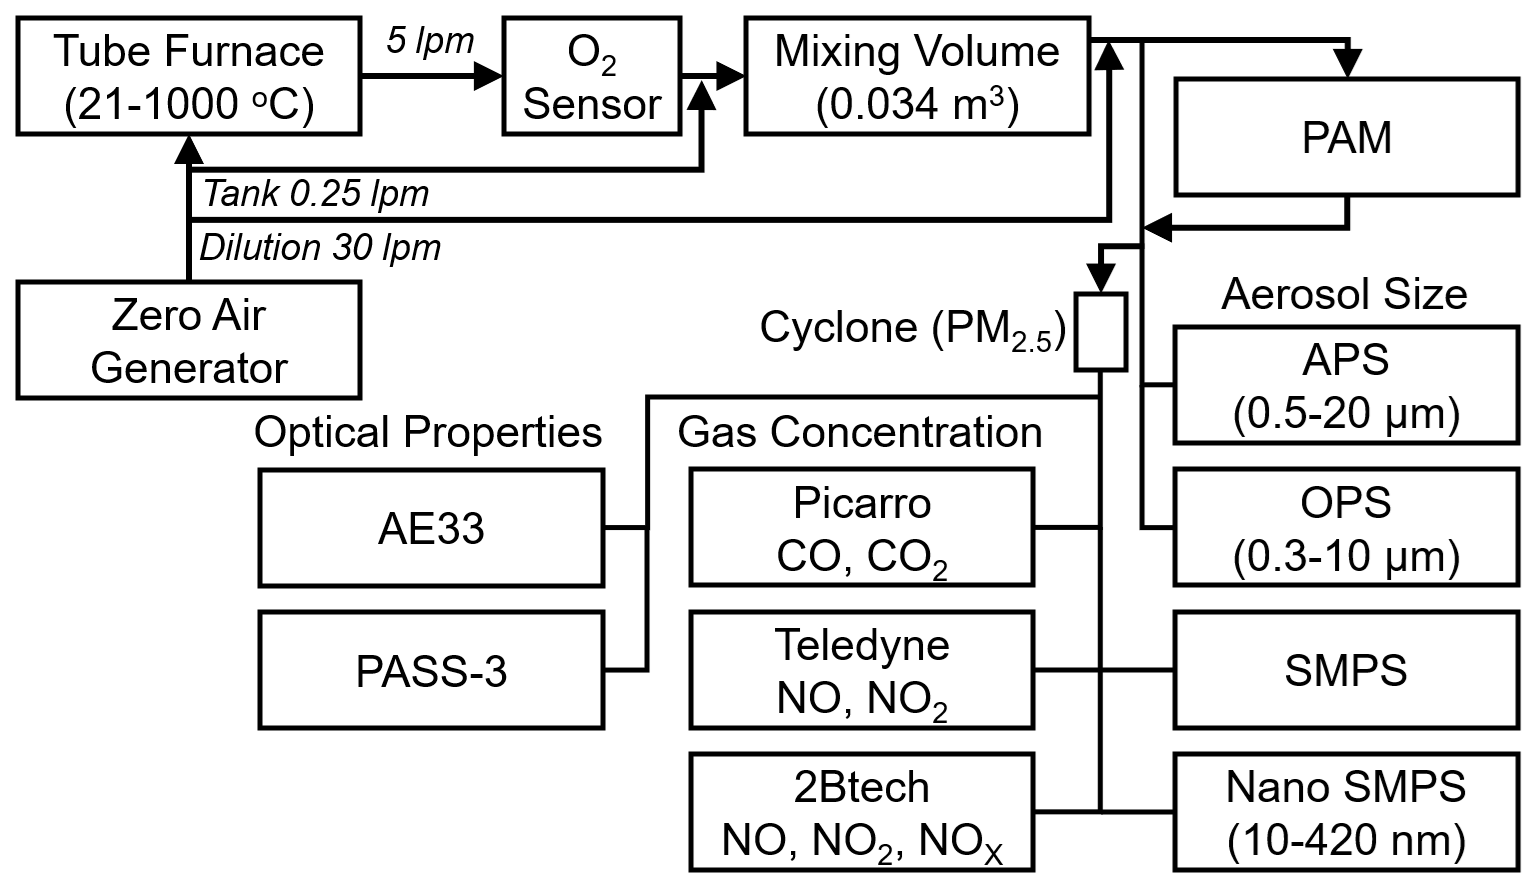
A total of 42 burns were conducted during April 2023 at LANL in the Center for Aerosol and trace-gas Forensic Experiments (CAFE; Los Alamos, NM, elevation ∼ 1900 m). The system is described extensively elsewhere (Benedict et al., 2024), and the specific configuration used in this work is shown in Fig. 1. Briefly, preweighed samples of fuel (0.47–2.16 g) were placed in a quartz boat and inserted into the capped quartz tube of the tube furnace (TS1 12/60/150-120SN, Carbolite Gero), where combustion took place. Several furnace temperatures were tested (see Table S1 in the Supplement) to simulate a variety of burning conditions. A zero-air generator (T701, Teledyne) produced a flow of dry particle free air through the system. Flow from the furnace passed by an oxygen sensor (Oxy-Flex-1-H) and was sent to a custom 34 L stainless steel mixing tank to allow for cooling, dilution, and extended sampling (15–20 min). The fire-integrated modified combustion efficiency (MCE) was derived from cavity ring-down measurements of CO and CO2 measurements (G2401, Picarro). Several instruments were used to measure speciated NO and NO2 by UV absorption (405, 2B Tech) and chemiluminescence (T200, Teledyne). Several experiments used a potential aerosol mass (PAM) flow reactor, which was operated with two lamps. BB aerosol experienced 2.2 equivalent days of OH oxidation in burn 35O, 1.9 d in 36O and 42O, and most of burn 39O had the equivalent of 2.2 d except for the first 9 min where there were 5.0 equivalent days of oxidation. Except burn 39O, the equivalent OH oxidation time had a standard deviation of less than 40 min.
Multiple methods were used to measure the wavelength-dependent light absorption properties of aerosol produced from combusting biomass fuels. A three-wavelength photoacoustic soot spectrometer (PASS-3, Droplet Measurement Technologies) was used to measure absorption and scattering coefficients at 405 and 532 nm (Arnott et al., 1999); the 781 nm channel was degraded and not used here. This instrument has been applied to absorbing aerosol (McMeeking et al., 2014; Lewis et al., 2008; Flowers et al., 2010) and its performance has been previously characterized (Nakayama et al., 2015). The scattering and absorption coefficients have an estimated uncertainty of 40 % (Benedict et al., 2024; Virkkula et al., 2005). The aethalometer is described in Sect. 2.4. The aerosol size distribution was measured using a combination of scanning mobility particle sizer (SMPS, models 3082 and 3750), nano-SMPS (model 3910), aerodynamic particle sizer (APS, model 3320), and optical particle sizer (OPS, model 3330); all from TSI, Inc. Size distributions were corrected for multiple charging and diffusion using in-software calculations (Drinovec et al., 2015). This resulted in a combined size distribution between 10 nm and 10 µm, which was used to determine the particle at mass 2 min intervals (see Sect. 2.4).
2.3 NCAT Combustion and Measurement System
The combustion system, smog chamber, and particle and gas measurement systems at NCAT have been previously characterized (Smith et al., 2019), which includes lamp spectral characteristics and particle and gas lifetimes. The current configuration is shown in Fig. 1 of McRee et al. (2024), where it is also described extensively. Briefly, fuels were burned in a tube furnace (Carbolite Gero, HST120300-120SN) and the smoke was introduced through a 2.5 µm cut point cyclone into a 9 m3 Teflon smog chamber at NCAT. Particle distributions were measured by an SMPS (3080 and 3787, TSI, Inc.). O3 (211, 2B Technologies), NOx, CO, and CO2 (42iQ, 48iQ, and 410iQ, respectively, from Thermo Scientific) were also measured for all burns. The last two were used to derive MCE from the change in CO and CO2 from before the experiment and the peak value. By setting the tube furnace to temperature of 450 °C, the resulting MCE values from all experiments were <0.9, which is indicative of smoldering-dominated conditions that produce spherical particles that are predominantly OA (Pokhrel et al., 2021b). While oxidants and water can be added to the chamber (McRee et al., 2024; Mouton et al., 2023), only fresh emissions without the addition of more oxidant were studied in this work. The chamber was kept dry for these experiments, where the RH was 0 %–10 %.
Light extinction was measured at 550 nm using a home-built cavity ring-down spectrometer (CRDS), which has been described previously (McRee et al., 2024; Smith et al., 2019). This instrument was operated with a 10:1 dilution ratio using a mixing jar. While a Nephelometer was also used, aethalometer-based absorption values were found to be more reliable for determining cross sections (including scattering, by subtraction) and SSA.
2.4 Aethalometry
A dual-spot aethalometer (AE33, Magee Scientific) was used to quantify aerosol light absorption. The AE33 system measures the light transmission through aerosol-loaded spots on a filter tape (I), compared to the transmission through a filter tape spot that has clean air passed through it as a reference (I0). It simultaneously measures the light attenuation at seven wavelengths (λ) from the near-infrared (950 nm) to near-UV (370 nm). The optical attenuation (ATNλ) was found at 370, 470, and 520 nm, which was defined as ATN. For NCAT burns, the AE33 measurements and data analysis were described in detail in Moschos et al. (2024). For LANL burns, we determined the attenuation coefficient, αatn,λ (Mm−1) for optically-absorbing aerosols by evaluating the rate of change of light attenuation passing through the particle-laden filter, using the formula:
where S represents the spot area, Fin is the aerosol flow rate (6 L min−1), and Δt is the time (1 min resolution). Particle-free chamber air, made by placing a HEPA filter at the inlet, had no contribution to αatn,λ (Moschos et al., 2024). High aerosol mass concentrations required dilution with zero air using a dilution jar during experiments in both laboratories, where the dilution ratio (D) was 5, and a lower flow rate of ∼ 1.44 L min−1 was used to produce a relatively small ΔATN/Δt. Only ATN values <40 were included, where the dual-spot automatic loading-correction was reliable (based on our test measurements and previous work (Drinovec et al., 2015)), which is why a loading term is not included in Eq. (1) (Ferrero et al., 2024). For each burn, we allowed time for the signal to stabilize (i.e. produce relatively constant ΔATN/Δt) and recorded data at 1 min averages. A slight cross-sensitivity between scattering and absorption has been observed in the AE33. Ammonium sulfate particles exhibit an apparent absorption of 1 %–2.3 % of scattering, depending on ATN, wavelength, and average particle size (Drinovec et al., 2015). A correction for this effect was not incorporated into this work, since it would not be a significant source of systematic error.
The AE33 correction factor Cλ was calculated by comparing the αatn,λ from the aethalometer and absorption coefficient αabs,λ (Mm−1) measured or derived from a multi-wavelength PASS (Moschos et al., 2024, 2021; Collaud Coen et al., 2010; Müller et al., 2011; Weingartner et al., 2003). Cλ is calculated using Eq. (2). Since the PASS operates at other wavelengths (405 and 532 nm), αabs,λ at AE33 wavelengths of 370, 470, and 520 nm were extrapolated by assuming a power-law relationship (i.e. deriving an Ångström absorption exponent (AAE)). This power-law relationship has been used in absorption measurements to account for spectral differences between different instruments (Arnott et al., 2005; Collaud Coen et al., 2010). This extrapolation/interpolation is shown in Fig. S1 in the Supplement for burn 17. Extrapolated values of αabs,λ were derived from a log10-log10 graph of measured αabs,λ values. Using the power-law equation , αabs,λ was calculated, where m is 10intercept and b is the slope of the log10-log10 graph. The extinction coefficients αext,λ (Mm−1), and scattering coefficients αscat,λ (Mm−1) are similarly extrapolated from their Ångström extinction exponent (AEE) and Ångström scattering exponent (ASE), respectively. The Model 8060 filter tape was used in this work, which is important to note, since Cλ is influenced by filter type.
Cross sections were calculated using the particle mass loading M (µg m−3). This was derived from the size distribution, which was measured with either an SMPS (NCAT) or combination of OPS/nano-SMPS (LANL), and used a previously measured particle density ρ of 1.2 g cm−3 (Pokhrel et al., 2021b). Since this was only applied to burns that were dominated by smoldering combustion (i.e. MCE ≤0.91), particles could be regarded as spherical (Pokhrel et al., 2021b). The mass absorption cross-section (MAC, m2 g−1) is calculated using Eq. (3), with mass scattering and extinction cross-sections (MSC and MEC, respectively) being calculated similarly. LANL experiments had relatively short particle lifetimes in their mixing volume, and size distributions were measured every two minutes. To match the one-minute averages of optical measurements and account for changes over time, the mass loading was extrapolated between measured values. The AE33 does not exhibit a significant dependence of Cλ on particle size (Drinovec et al., 2015).
The SSA is calculated according to Eq. (4), depending on the setup. At LANL, SSA values were based on extrapolated scattering and absorption from the PASS, while NCAT values used direct extinction (CRDS) and absorption (aethalometer) measurements.
Aethalometer measurements have a time resolution of 1 min. Since PASS measurements were recorded every two seconds, these measurements were averaged for one minute before being used to compare the aethalometer. Depending on the experiment, this resulted in 4 to 22 aethalometer measurements (an average of 9 measurements) per burn. Between 1 and 6 burns were performed for each African fuel and 2 for each North American fuel. Extrapolated values for αabs and Cλ were determined for each minute and presented values were averaged over the course of each burn. Errors are the standard deviation of 1 min values within each experiment. A few burns had absorption measurements that varied too much over the course of the experiment. Burns that had an average relative standard deviation (RSD) that exceed 10 % for Cλ and 5 % for SSA were rejected for further analysis. This resulted in the rejection of burn #21 (savanna grass), #23 (wanza), and #34 (eucalyptus). The remaining 31 burns had an average RSD of 6.1 % for Cλ and 0.4 % for SSA over all wavelengths. This is smaller than the 25 % RSD found previously (Moschos et al., 2024). Previous αatn,λ measurements with the AE33 showed a repeatability uncertainty of 15 %–30 %, while the resulting AAE uncertainty was <5 % (Moschos et al., 2024). That is, the ratio of αatn,λ between different wavelengths is very consistent between burns. When propagating the AE33 (15 %–30 %) and PASS uncertainty (40 % and assuming the RSD of extrapolated/interpolated points are the same) in quadrature, a calculated RSD of 43 %–50 % is expected for Cλ.
Characterizing the wavelength-dependent properties of PM is important for understanding their role in radiative forcing and subsequent climate effects at the regional and global scale (Bond et al., 2013; Kirchstetter et al., 2004). When using a filter-based instrument, there are three main factors that should be addressed (Bond et al., 1999; Liousse et al., 1993; Petzold et al., 1997): (1) filter fibers increase attenuation by multiple scattering (which increases optical path), (2) aerosols embedded in the filter increase light attenuation because of scattering, and (3) as light absorbing particles collect in the filter, the attenuation gradually increases (reduces optical path for loaded filter). The correction factor Cλ accounts for multiple scattering of light within the filter and the resulting enhancement of the optical path of aerosol particles that load up the filter (Ferrero et al., 2021). Previous studies suggest that a single correction factor at each aethalometer wavelength may not be sufficient, because it has been shown to vary based on type of aethalometer, material of the filter, seasonal or diurnal patterns that are produced by PM compositional changes, and wavelength (Bernardoni et al., 2021; Yus-Díez et al., 2021). To investigate dependencies of the correction factor in this study we analyzed its relationship with burning state and SSA.
3.1 Average Cλ and wavelength dependence
Measurements for each burn are presented in Table S1 with burn experiment number, fuel, temperature of the tube furnace, MCE, AAE, ASE and AEE from 405 to 532 nm using PASS measurements, average Cλ at three wavelengths, and extrapolated SSA values at these wavelengths. Median and weighted mean values of Cλ of all fuels in this work are presented in Table 2, along with previous measurements of Cλ that used an AE33 with model 8060 filter tapes. An outlier of C470 of 0.93 was excluded from this analysis to be consistent with later sections (3.3). Regardless if it is represented as a median or weighted mean, values of Cλ increase with increasing wavelength in this work. A two-tailed, unpaired statistical analysis of Cλ with unequal variance showed that C370–C470 had a P-value of , C470–C520 had a P-value of 0.10, and C370–C520 had a P-value of . While C470 could not be distinguished from C520 at 95 % confidence, C370 was distinct from the other two. Even at a relatively small wavelength range, a wavelength dependence of Cλ is observed in this work.
Table 2Mean Cλ for this work and previous works that used an AE33 with model 8060 filter tapes. Errors are 1 standard deviation that represent run-to-run variability, which was greater than the propagated weighted mean standard deviation, or are defined in their respective works. Yus-Díez et al. (2021) report median values.
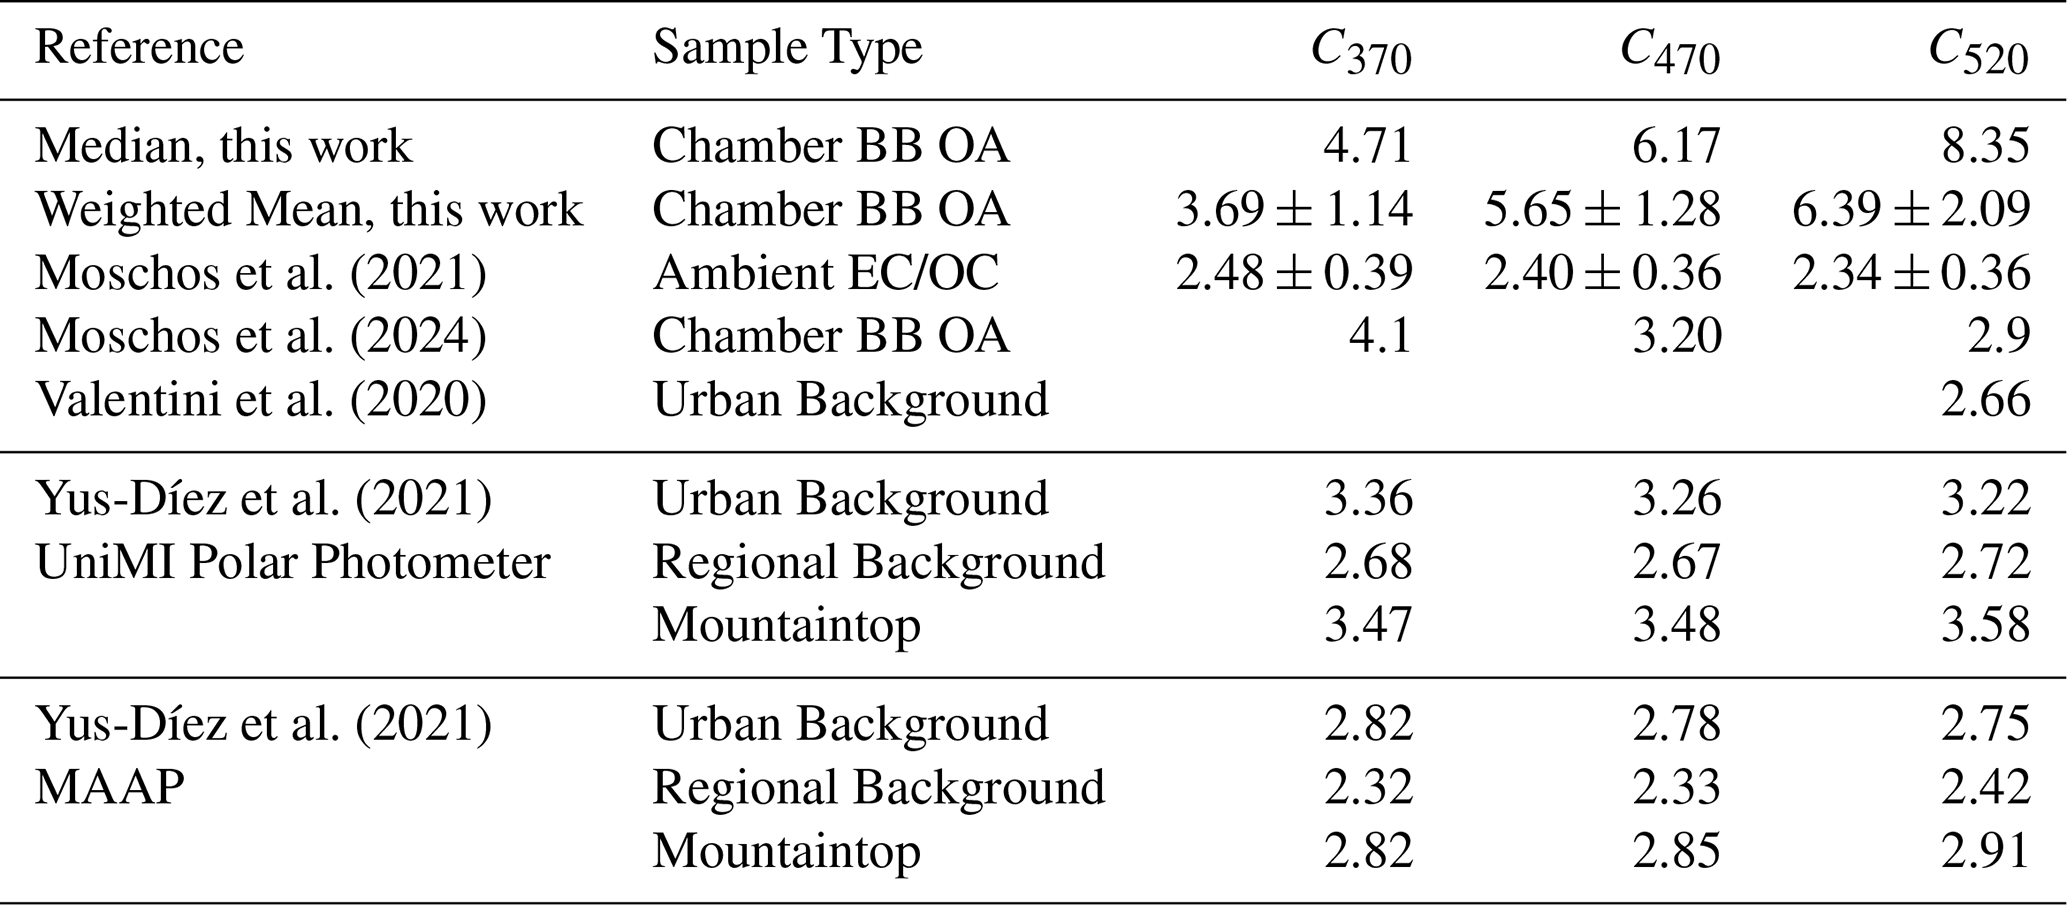
The wavelength dependence of Cλ has not generally been previously observed or pursued. The values found in this work are somewhat larger than those determined in an urban setting (Valentini et al., 2020). In Moschos et al. (2021), an AE33/MWAA comparison was carried out on ambient quartz filter samples from a year-long sampling campaign in Switzerland, where the aerosols consisted of both elemental and organic carbon. All aethalometer wavelengths were examined in that work, which resulted in a largely wavelength-independent Cλ of ∼ 2.3, as shown in Table 2. Previous work with the AE31 found either no wavelength dependence (a constant Cλ value of 2.14) (Segura et al., 2014), a slight decrease with wavelength that was not statistically significant (Bernardoni et al., 2021), or a strong indication of wavelength independence (Weingartner et al., 2003). Cλ can also strongly depend on the filter material used, with values for the M8020 filter tapes used in current AE33 instruments ranging from 2.57 to 4.24 (Drinovec et al., 2015; Yus-Díez et al., 2021). For NCAT-chamber African BB-OAs (smoldering burns; no elemental carbon present), Moschos et al. (2024) found the Cλ values to be wavelength-dependent: C370=4.1, C470=3.2, C520=2.9, and C590=2.0; exhibiting a decreasing correction factor with increasing wavelength, but no systematic variation between fuels or aging conditions. Focusing on mountaintop measurements that were influenced by BB, Yus-Díez et al. (2021) showed a statistically significant increase between C470 and C520, but no signifiant difference betweenC370 and C470. While our values were slightly higher, our trends are in agreement.
3.2 Cλ Parametrization for burning state
Long- and short-term field campaigns frequently measure CO and CO2, owing to the stability, accuracy, and utility of these monitors. Multiple simultaneous optical measurements are more demanding and less common, so a method to determine Cλ that is not optically-based would be attractive. Since CO and CO2 can be used to calculate the fire-integrated MCE, and MCE is linked to the burning state, we examined the dependence of Cλ on the burning state. The MCE has been used to establish whether the combustion is in a smoldering-dominated, flaming-dominated, or mixed combustion regime (Pokhrel et al., 2021b; Yokelson et al., 1997). A plot of Cλ against MCE at 370, 470, and 520 nm is presented in Fig. 2. An unweighted least squares linear fit was also done for each wavelength. The resulting R2 values vary between 0.01 and 0.12, which is to say that less than 12 % of variations in Cλ can be attributed to differences in MCE. An analysis of the fitted slope and its error produced was compared to zero, which resulted in p-values of 0.62, 0.48, and 0.12 for 370, 470, and 520 nm measurements, respectively. That is, none of the slopes were statistically different from zero at 95 % confidence. While a correction factor that does not rely on some other optical measurements would be desirable, it does not appear that Cλ exhibits an MCE dependence.
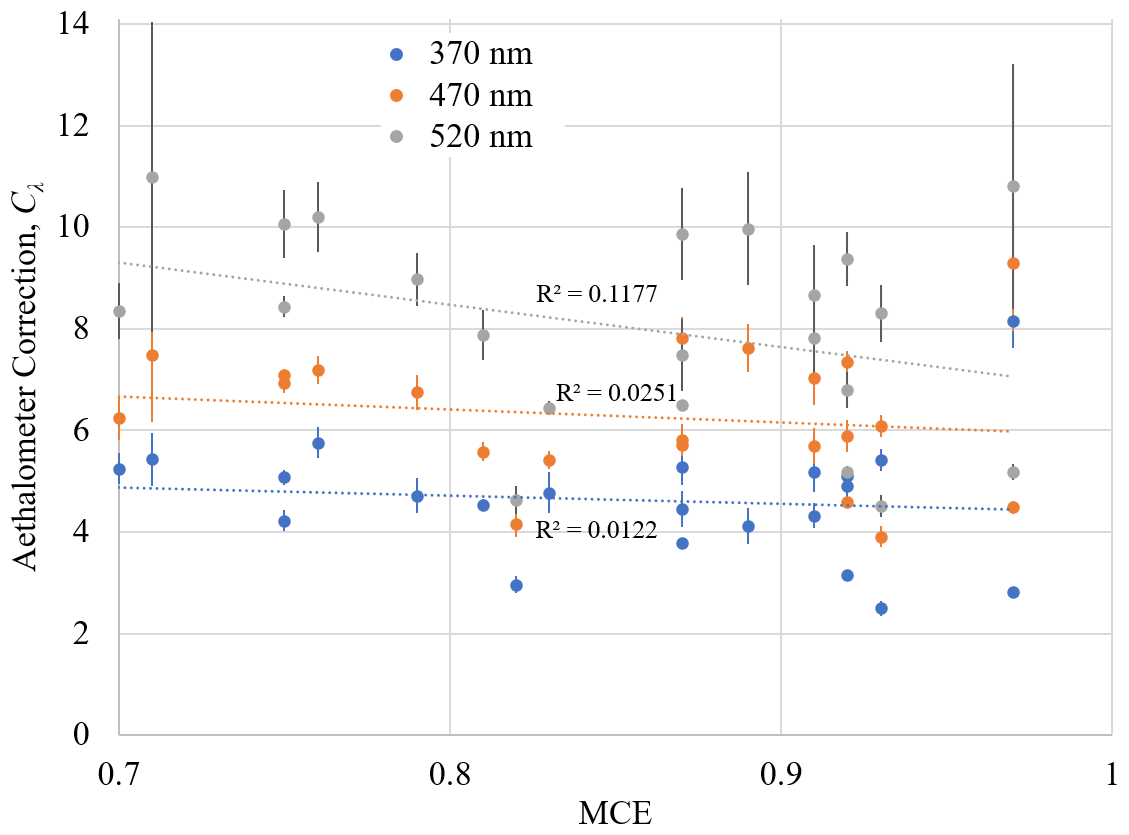
Figure 2The aethalometer correction factor Cλ at three wavelengths plotted against MCE. Experiments where there was not sufficient data to calculate MCE, as well as PAM oxidation experiments, were not included.
3.3 Cλ Parametrization Based on SSA
Compositional differences in the particle phase have led to complex and non-linear relationships between αatn,λ and αabs,λ for aethalometer measurements. These differences have been previously attributed to filter loading effects, where the loading varies with seasonality due to compositional changes (Virkkula et al., 2007). Fresh aerosols, typically rich in BC from biomass burning or traffic emissions, tend to produce stronger loading effects compared to aged aerosols that have undergone chemical processing (Weingartner et al., 2003). Beyond loading effects, several studies have explored a more intrinsic link between Cλ and SSA. Notably, Schmid et al. (2006) and Collaud Coen et al. (2010) first proposed this relationship, which was later expanded upon by Ferrero et al. (2024), who demonstrated that SSA could serve as an indicator of aerosol loading effects and internal mixing state.
In our study, we observed that Cλ consistently exhibited lower values at lower SSA across all three aethalometer wavelengths, as demonstrated in Fig. 3, in agreement with previous findings. This relationship was also evident in experiments using artificially aged BB aerosol oxidized in a PAM reactor, indicating the relevance of the parameterization for aged aerosol.
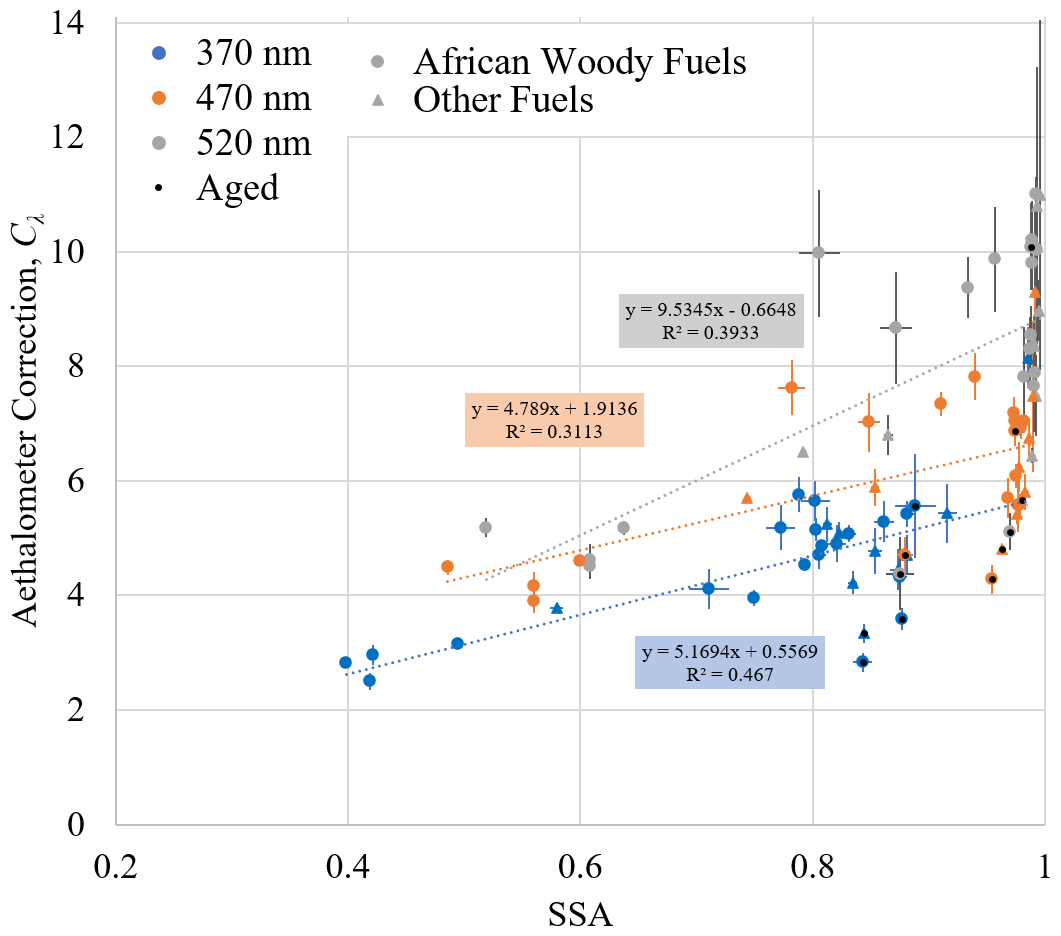
Figure 3The aethalometer correction factor Cλ plotted against SSA at three wavelengths. PAM oxidation experiments were included and are marked with black dots. Results of a linear fit are shown.
Several functions were fit to the resulting plots using unweighted least squares fitting. These functions are shown in Table 3 along with the resulting R2 for each fit. An outlier of C470 of 0.93 was excluded from this analysis, since some fit functions are incompatible with values below 1 (see Fig. S1). While measurement variability limited the performance of fit functions, meaningful relationships with SSA were observed. C370 showed the strongest dependence, where SSA determined 43 % to 57 % of C370 variability, depending on the fit. C470 showed the weakest dependence, with only 28 % to 43 % attributed to SSA, while C520 exhibited about 38 % to 40 % variability dependence. We also tested the functional form proposed by .Schmid et al. (2006) and later used by Yus-Díez et al. (2021), which is , where ω is the SSA. Urban, rural, and mountaintop observations in Northeastern Spain showed a relatively stable C637 of ∼ 2.4 followed by a sharp rise at high SSA values, where in C637 was ∼ 7.5 at an SSA of ∼ 1 (Yus-Díez et al., 2021). Their median C637 was 2.23 to 2.51 depending on the site. At lower SSA values, our C370 had similar values and peaked similarly at high SSA values. At 470 and 520 nm, our Cλ values were 4–5 at lower SSA values, and peaked higher at high SSA values, with Cλ being 9–11. A fit of the above function to C637 led to values of A=1.96 and B=3.0 for their regional background site and A=1.82 and B=4.9 for their mountaintop observations. They did not perform such a fit at shorter wavelengths. Our data was fit to this function and produced a relatively good fit for 470 nm values, but owing to the degree of scatter in our observations, this function did not behave particularly well at other wavelengths (see Table 3).
Table 3Fit functions applied to the plot of Cλ against SSA for all fuels, shown in Fig. 3, and the resulting R2 and the Chi squared (X2) values at each wavelength.
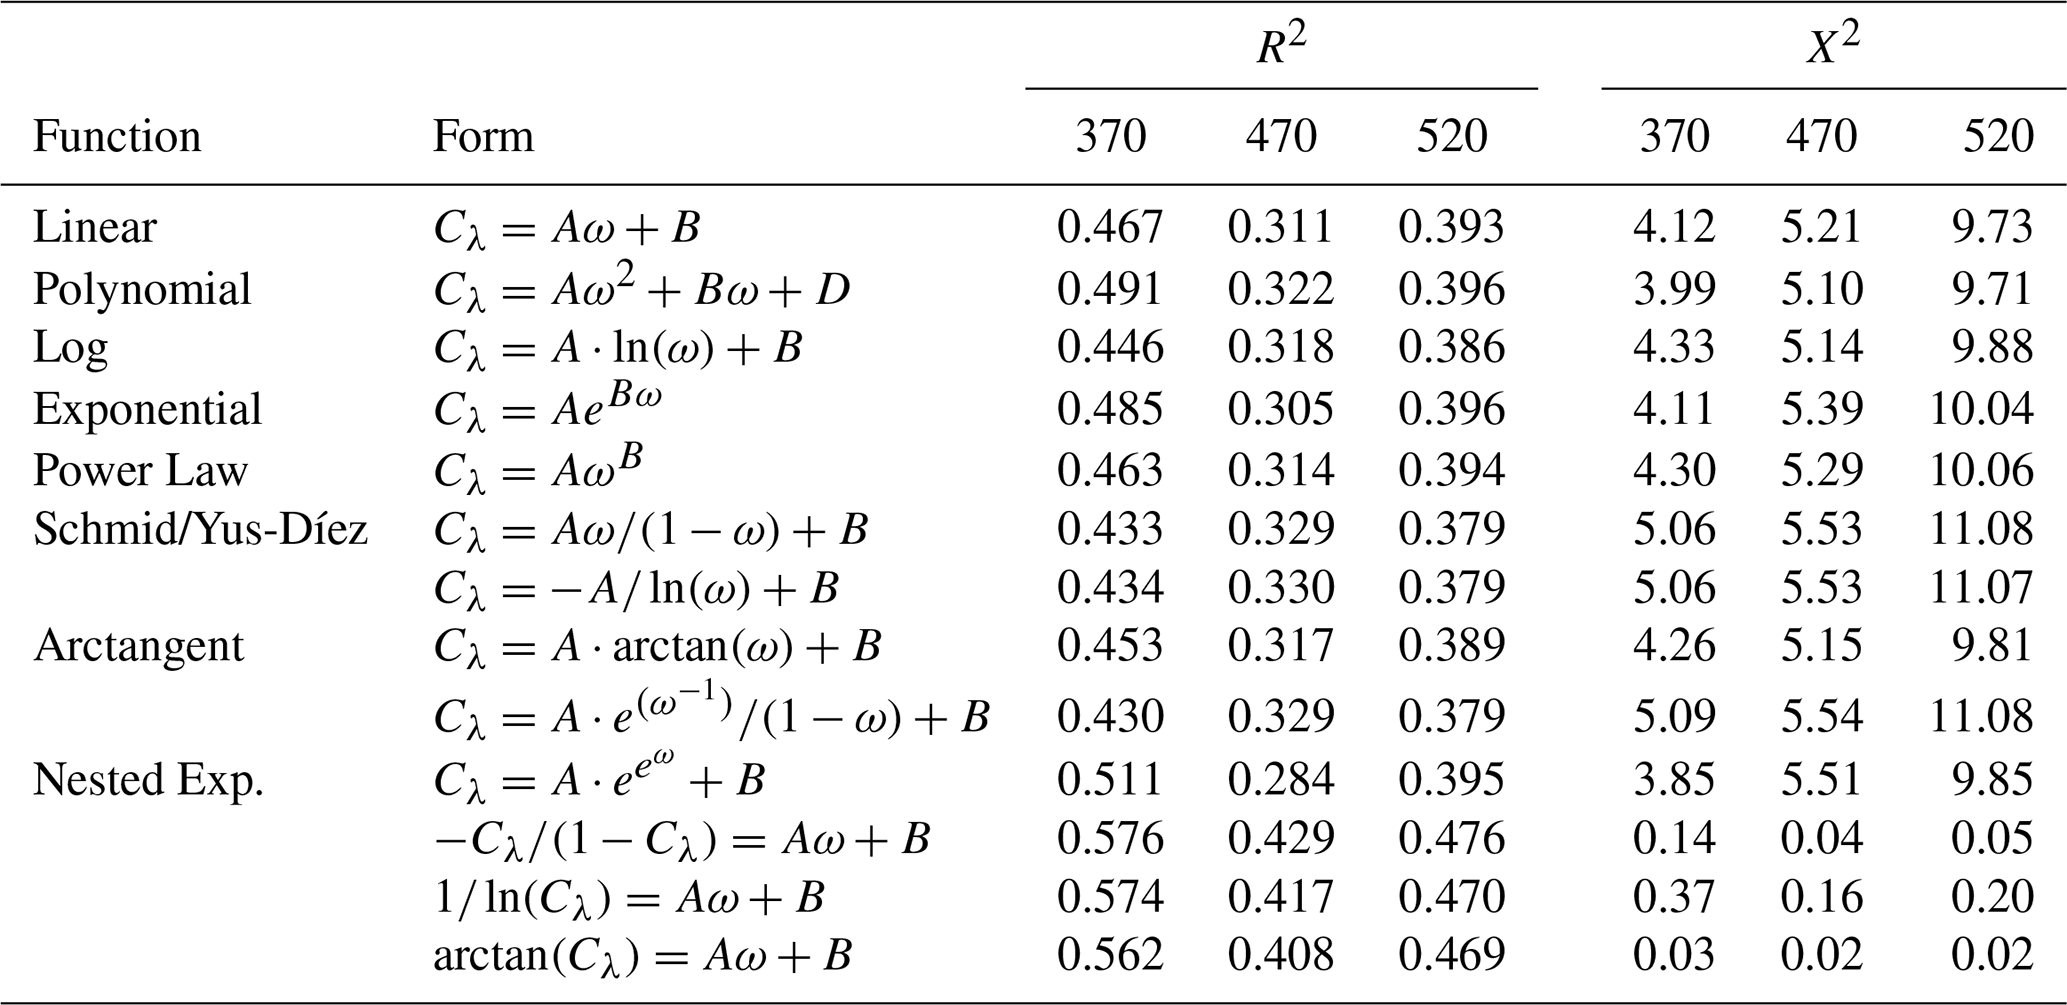
A number of other functions that exhibit sharp rises at higher values were also examined in Table 3. Of those functions examined that fit a function of SSA, the second order polynomial performed the best, though this is to be expected with more fit parameters. The nested exponential function performed had the second highest average R2, though it had the worst R2 for C470 of those tested. This was followed by the exponential function, and then linear and power law fits performing comparably. Other functions, including several sigmoid functions, did not perform as well, on average. A linear fit to several functions that manipulate Cλ were also examined, which performed better than those that only adjust SSA. Along with R2, Table 3 shows how well each function fit the data by calculating the goodness of fit, i.e. Chi squared (X2). Of those, performed the best, where 49 % of the variability of the Y-term is dependent on SSA and this equation had had the second lowest X2. Solving for Cλ, this would have the form , which has a strong potential for future use in SSA-based correction schemes, particularly where filter loading effects are minimized and optical properties dominate the measurement bias. While arctan(Cλ) had slightly lower X2 values, the R2 was also lower, so it exhibited a weaker Cλ dependence. The better X2 for arctan(Cλ) vs. SSA is mainly an artifact of all arctan(Cλ) flattening out.
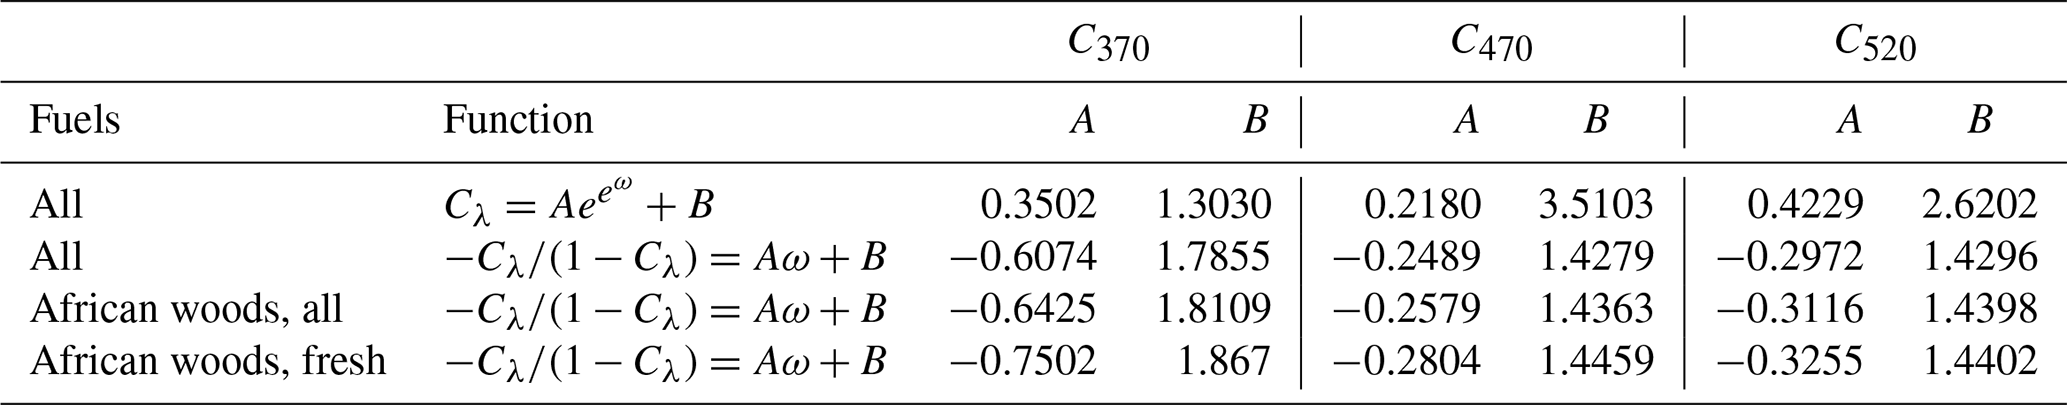
Given the figures of merit for the AE33, mentioned in the introduction, it is likely to see use in long-term monitoring in future field campaigns in Africa. Supporting this, we have examined the above fit functions for woody African fuels (i.e. the first four fuels listed in Table 1), which was a subset of 20–21 data points for each wavelength. The results of this examination are in Table S2, and show general improvement in fit characteristics, with all X2 decreasing and all R2 increasing except the lowest three. The best fit function is still , for the same reasons stated for the full data set. A fit of this function was also done for fresh, woody African fuels. The fit parameters of the best-performing fit equations that manipulate SSA (the nested exponential) and Cλ () are shown in Table 4 and are plotted in Fig. S2 for all fuels, along with fit parameters for African woody fuels.
Table 4The resulting fit parameters of functions applied to Cλ and SSA for the best overall fits. Parameters A and B are in the function and values are given at each wavelength in this study. Fit parameters are also given for just African woody fuels (fresh and aged) and only fresh African woods.
Characterizing the wavelength dependent properties of PM is important for understanding their role in radiative forcing and subsequent climate effects at the regional and global scale (Bond et al., 2013; Kirchstetter et al., 2004). AAE describes the wavelength dependence of aerosol absorption, which assumes a power-law relationship (Moosmüller et al., 2011). Plots of ASE vs AAE have been used to differentiate different particle types and the source of those particles. Measurements in this work are presented on this so-called Ångström matrix plot in Fig. 4 with source labels are derived from Cazorla et al. (2013). Also included are previous observations of African fuels for fresh and photo-aged emissions (McRee et al., 2024).
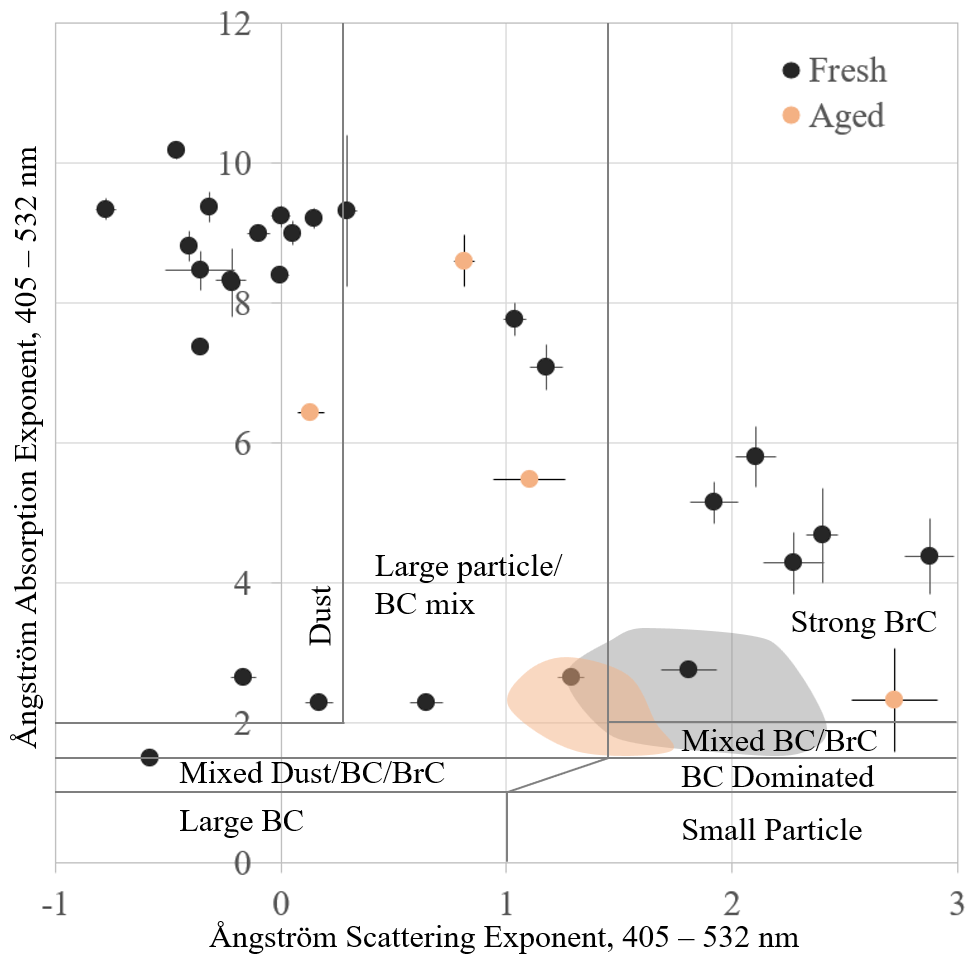
Figure 4The Ångström matrix plot (ASE vs AAE) for fresh (black dot) and PAM-aged (tan dot) observations in this work. Previous measurements on similar fuels are shown in shaded areas for fresh and photo-aged BB aerosol (McRee et al., 2024).
Values observed in this work were wide ranging. ASE ranged from −0.78 to 2.88 with an average of 0.61, where negative values result in an MSC that is greater at longer wavelengths. These negative ASE values may result from the presence of super-micron particles that have higher scattering efficiencies at longer wavelengths. This can be seen in the oscillating portion of Fig. 11.5b in Bohren and Huffman (1998). Such large particles are present in some burns, as shown in Fig. S3. AAE ranged from 1.50 to 10.18, with an average of 6.47. AAE values of ∼ 1.0 have been observed for submicron refractory BC-rich aerosol produced from fossil fuel combustion, while larger AAE values up to 9.5 have been observed and attributed to larger BrC particles from BB or absorbing dust (Liu et al., 2018; Kirchstetter et al., 2004; Lack and Langridge, 2013). Cazorla et al. (2013) showed that organic-dominated PM had AAE and ASE values both ranging from 1.5 to 3. BB observations during a wildfire season by Ponczek et al. (2022) found maximum values of 3.58 for AAE and 2.31 for ASE. Likewise, laboratory studies by Zhang et al. (2020) found AAE values from 1.17 to 2.92, while BrC-laden BB particles by Martinsson et al. (2015) found AAE values of 2.5–2.7. Ambient measurements in NE Spain found average AAE values between 1.12 and 1.35 depending on the site (Yus-Díez et al., 2021). While these literature values were close to the range observed for similar African fuels and previous studies (McRee et al., 2024), as indicated in Fig. 4, the range of values in this work is clearly much greater and even slightly exceeding previously observed values of AAE, being more akin to dust observations. This clearly shows that BB aerosol from African fuel sources are distinct in their optical properties. Such large Ångström exponent values may result from the high fraction of smoldering organic carbon (leading to very strong wavelength-dependent absorption), which distinguishes African BB aerosol from typical forest-fire smoke. Clearly, characterizing the chemical composition of these BB aerosol is also important for explaining these observations. The presence of coarse ash particles (leading to anomalous scattering spectra) could also produce these extreme AAE, though this is unlikely in this system, since such ash would be removed by a cyclone with a cut point of 2.5 µm placed after the mixing tank (see Fig. 1).
Differences between observations in this work and studies McRee et al. (2024) are likely due to a number of factors, including differences in wavelength range and instrumentation; 405 and 532 nm scattering and absorption measurements using a PASS in this work vs. previous absorption measurements at 520 and 590 nm using an AE33 and scattering measurements at 453 and 554 nm with a nephelometer. The correction for the AE33 used a different correction method (Moschos et al., 2024) and a single power-law relationship may not hold so close to the UV. It is also very likely that there are differences in photo-aging between the PAM and smog chamber. The largest difference between studies is that McRee et al. (2024) focused only on smoldering-dominated combustion, which would have a relatively high BrC content, while a variety of combustion states were explored in this work. Regardless, in both studies, the range of values for both AAE and ASE decreased upon photoaging, as well as with dark aging and dark aging with additional nitrate radical (McRee et al., 2024). This demonstrated that both processes reduced the wavelength dependence of scattering and absorption.
The flexibility of the tube furnace over other combustion systems has been demonstrated (Pokhrel et al., 2021b). If we hope for more wide-spread use, however, its reproducibility has to also be examined. To this end, we have compared the results of smoldering-dominated combustion of similar fuels using both systems. Cross sections were calculated using Eq. (2), had units of m2 g−1, and were measured under dry conditions; <10 % at both NCAT and LANL. Both SSA values are derived from (MEC-MAC)/MEC. NCAT measurements are from McRee et al. (2024) and use a MWAA instrument for correcting the aethalometer measurements. Results from fresh emissions are presented in Table 5. Like in McRee et al. (2024), averages and standard deviations in this table were between repeated experiments (i.e., the run-to-run variability) and did not propagate the standard deviation of individual experiments. Values for individual experiments are in Table S1. Burn 18 for wanza was not included because of its unusually large MEC.
Table 5Comparison of optical properties for fresh and photo-aged emissions from various fuels, carried out at LANL and NCAT (McRee et al., 2024). All cross sections are in m2 g−1. MCEs with a * had one or more values were not recorded because of a lack of CO and CO2 measurements during those experiments, but should be smoldering-dominated, since the furnace temperature was 450 °C at both LANL and NCAT.
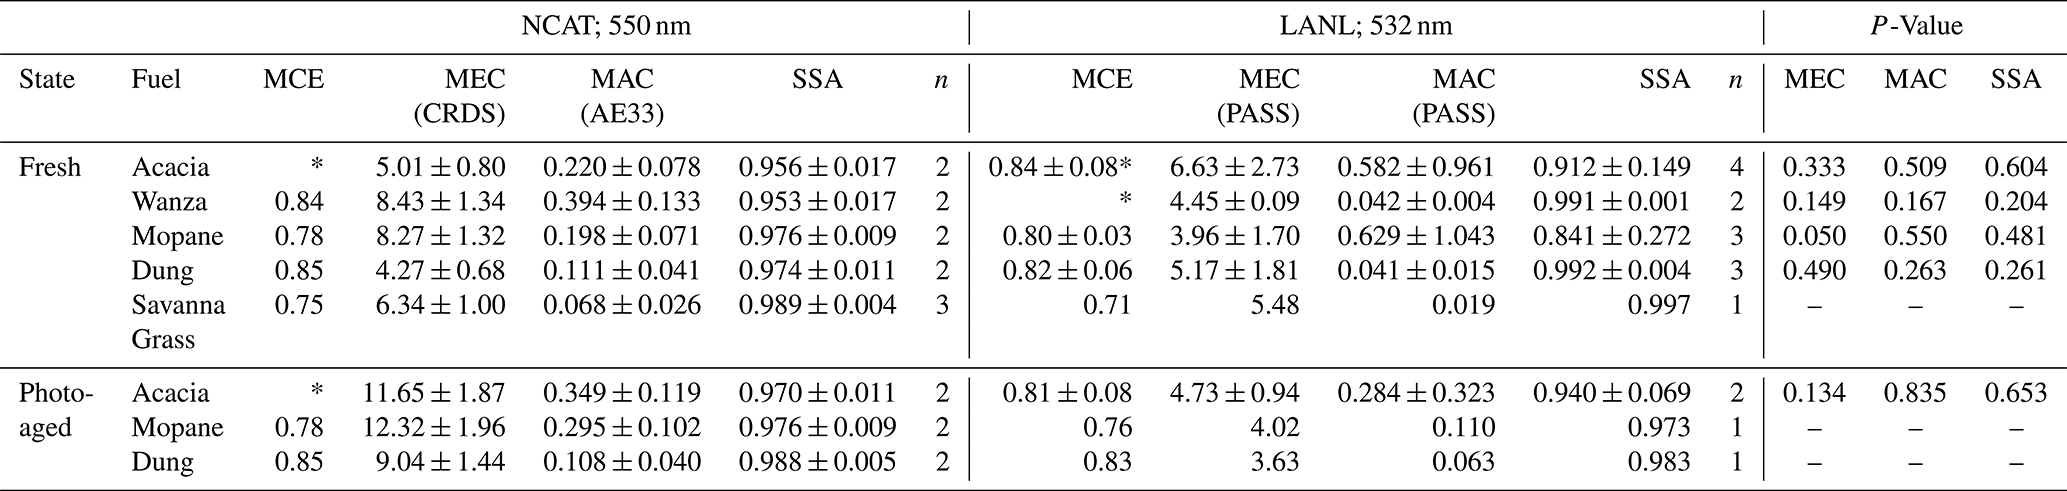
In cases where a direct comparison could be made (wanza, mopane, dung, and savanna grass), MCE values were commensurate, so the combustion state was smoldering-dominated for both. A statistical analysis of MEC, MAC, and SSA values were performed using a two-tailed t-test with unequal variance; the results of which are in Table 5. Nearly all values could not be distinguished at a 95 % confidence interval – only the MEC of mopane had a P-value just under 0.05. The largest difference between MAC values was for wanza, which was larger in NCAT measurements by a factor of 9.3. Aside from this, MAC values were similar and agreed within a factor of 3.6. MAC values were generally larger for all NCAT experiments by a factor of 2.7 on average, with fresh measurements being larger by a factor of 3.3 and aged by a factor of 1.9. While these differences are not statistically significant, this could be due to a relatively small number of experiments. MEC values exhibited a better agreement, being within a factor of 3.1 at most and higher for NCAT measurements by a factor of 1.8 on average. Unlike MAC, MEC values of aged aerosols showed greater differences than fresh ones. Upon aging, MEC values doubled, while MAC values increased by a factor of 1.3. While cross sections were generally higher for NCAT measurements, the resulting SSA values were nearly identical, for both fresh and aged aerosol. A potential explanation of this could lie, not in the optical measurement, but the mass measurement. The SMPS used at NCAT was limited to a maximum particle size of 710 nm, while LANL measurements had a wider range of instruments that could count particles between 10 nm and 10 µm. While there may only be a small number of particles not included above the upper limit, they can contribute significantly to the total aerosol mass. This would produce an undercounting of particle mass, which would inflate the cross sections when they are calculated using Eq. (3).
To corroborate this explanation, we examined the normalized size distributions of wanza and mopane, which are shown in Fig. S3. These were selected because the largest differences in optical properties were observed between laboratories for these fuels. For both fuels, mass distrubtions in NCAT experiments appear to be truncated at 710 nm. Particles larger than the 710 nm accounted for ∼ 0.1% of particle mass for wanza in LANL experiments. For mopane, 19 % by mass for burn #14, 24 % for burn #28, and 2 % for burn #36P were attributed to particles larger than 710 nm. In addition, two lognormal distributions were fit to NCAT experiments, where the total mass agreed withing 1.1 % for mopane and 0.3 % for wanza. From this analysis, 4.9 % of particle mass exceeded 710 nm for wanza, and 17.3 % for mopane. While differences in the measured mass could not account for cross section differences for wanza, it could be a contributing effect for mopane and others. Additionally, the AE33-based MAC has a propagated uncertainty of 18 %–32 % based on a particle counting uncertainty of 10 %, a CRDS-based MEC has an 11 % uncertainty (Singh et al., 2014), while the PASS-based MAC and MSC would be 41 %. As such, random errors could contribute to these observed differences. Differences could also be the result of mixing state of the aerosol, as there are differences in dilution, cooling, preferential wall losses, and residence time between the 9 m3 chamber and the 34 L mixing tank. Differences in the size distribution are apparent (Fig. S3), which is likely a result of these factors. Given that the SSA results for LANL and NCAT are nearly the same, the balance between scattering and absorption is very robust, despite differences in observed cross sections.
We have measured the wavelength-dependent optical properties of BB aerosol from North American and sub-Saharan African fuels. We used a PASS as a reference instrument to calculate the multiple-scattering correction factor Cλ of AE33 absorption measurements at 370, 470, and 520 nm. We found that there was no real dependence of Cλ on MCE. When Cλ was plotted against SSA, values slowly rose at low SSA values, followed by a sharp rise around an SSA of ∼ 0.9. The trend of our Cλ observations closely follow those of Yus-Díez et al. (2021) for C637. Cλ at other wavelengths were generally higher at all SSA values and did not fit the functional form of particularly well, despite its previous use (Schmid et al., 2006; Yus-Díez et al., 2021). This is likely due to, at least in part, the to the scatter in the data and number of observations. Yus-Díez et al. (2021) had a large number of ambient observations that they binned and averaged as a function of SSA before fitting those averages, whereas we have 31 burns with a total of 282 data points. A number of functions operating on either SSA or Cλ were explored and the best functions of each are found in Table 4, along with the fit parameters at 370, 470, and 520 nm. In terms of R2 and X2, showed the best performance. This will provide an important parametrization of Cλ specifically geared towards BB aerosol from African fuels under different aging states, and is of particular importance for future field work on the continent. Weighted mean values of Cλ in this work were C370=3.69, C470=5.65, and C520=6.39, which was somewhat higher than several mean values proposed in previous works, though the same trend is observed for works where a trend is evident. This indicates that the multiple-scattering correction factor Cλ in aethalometer measurements depends strongly on SSA and wavelength-dependent corrections are essential, particularly for C370 that was different than C470 and C520. Since this dependence varies with aerosol composition, a fixed correction value is inadequate, especially in biomass burning scenarios.
An Ångström matrix plot of our observations produced ASE values ranging from −0.78 to 2.88 (mean of 0.61), while AAE ranged from 1.50 to 10.18 (mean of 6.47). AAE values were not unrealistically low, but the largest value observed here, for the smoldering combustion of Eucalyptus, has exceeded previous observations (Liu et al., 2018; Kirchstetter et al., 2004; Lack and Langridge, 2013). The Ångström matrix shows that African BB aerosol can have optical Ångström values more akin to dust. This shows that these fuels are distinct in their wavelength dependence from more typical BB aerosol.
We have previously demonstrated the flexibility of the tube furnace for generating BB aerosol under a variety of combustion conditions (Pokhrel et al., 2021b). To assess reproducibility between laboratories, a comparison was made between the MEC, MAC, and SSA of the same fuels combusted under smoldering-dominated conditions. Nearly all values could not be distinguished at a 95 % confidence interval. NCAT experiments were higher by a factor of 2.7 for MAC, on average, and 1.8 for MEC. There is evidance that these differences can be partially due to the more limited range of particle sizes measured at NCAT. Future work in cross section measurements should include fitting size distribution data with one or more log-normal distributions to account for missing high mass particles.
Data set is available at https://doi.org/10.6084/m9.figshare.31038175.v1 (Fiddler, 2026).
The supplement related to this article is available online at https://doi.org/10.5194/amt-19-307-2026-supplement.
Marc N. Fiddler was involved in conceptualization, formal analysis, funding acquisition, supervision, visualization, draft writing, and editing. Vaios Moschos was involved in conceptualization, formal analysis, investigation, methodology, supervision, draft writing, and editing. Megan M. McRee was involved in formal analysis, investigation, methodology, validation, and editing. Abu Sayeed Md Shawon was involved in data curation, investigation, methodology, supervision, and editing. Kyle Gorkowski was involved in data curation, investigation, methodology, and supervision. James E. Lee was involved in data curation, methodology, and editing. Nevil A. Franco was involved in supervision and investigation. Katherine B. Benedict was involved in supervision, investigation, draft writing, and editing. Samir Kattel was involved in draft writing, formal analysis, and editing. Chelia Thompson was involved in formal analysis. Manvendra K. Dubey and Solomon Bililign were involved in conceptualization, funding acquisition, project administration, resources, supervision, draft writing, and editing.
The contact author has declared that none of the authors has any competing interests.
Publisher's note: Copernicus Publications remains neutral with regard to jurisdictional claims made in the text, published maps, institutional affiliations, or any other geographical representation in this paper. The authors bear the ultimate responsibility for providing appropriate place names. Views expressed in the text are those of the authors and do not necessarily reflect the views of the publisher.
Fuels from Botswana were provided in collaboration with Gizaw Mengistu Tsidu at Botswana International University of Science and Technology (BIUST). The fuels from Ethiopia were provided by Prof. Bekele at Addis Ababa University. Dr. Kip Carrico's laboratory at New Mexico Tech performed measurements of fuel moisture content.
The project was supported by funds from the Department of Energy under grant DE-FOA-0002688: Research Development and Partnership Pilot (RDPP) program. The collaborative at Los Alamos was supported by the U.S. Department of Energy's Atmospheric System Research, an Office of Science Biological and Environmental Research program; Los Alamos National Laboratory is operated for the DOE by Triad National Security, LLC under contract F265. VM acknowledges support by the Swiss National Science Foundation (SNSF) under the Postdoc Mobility Fellowship grant P500PN_210745.
This paper was edited by Jianhuai Ye and reviewed by two anonymous referees.
Arnott, W. P., Hamasha, K., Moosmüller, H., Sheridan, P. J., and Ogren, J. A.: Towards Aerosol Light-Absorption Measurements with a 7-Wavelength Aethalometer: Evaluation with a Photoacoustic Instrument and 3-Wavelength Nephelometer, Aerosol Science and Technology, 39, 17–29, https://doi.org/10.1080/027868290901972, 2005.
Arnott, W. P., Moosmüller, H., Rogers, C. F., Jin, T., and Bruch, R.: Photoacoustic spectrometer for measuring light absorption by aerosol: instrument description, Atmospheric Environment, 33, 2845–2852, https://doi.org/10.1016/S1352-2310(98)00361-6, 1999.
Backman, J., Schmeisser, L., Virkkula, A., Ogren, J. A., Asmi, E., Starkweather, S., Sharma, S., Eleftheriadis, K., Uttal, T., Jefferson, A., Bergin, M., Makshtas, A., Tunved, P., and Fiebig, M.: On Aethalometer measurement uncertainties and an instrument correction factor for the Arctic, Atmos. Meas. Tech., 10, 5039–5062, https://doi.org/10.5194/amt-10-5039-2017, 2017.
Baumgardner, D., Popovicheva, O., Allan, J., Bernardoni, V., Cao, J., Cavalli, F., Cozic, J., Diapouli, E., Eleftheriadis, K., Genberg, P. J., Gonzalez, C., Gysel, M., John, A., Kirchstetter, T. W., Kuhlbusch, T. A. J., Laborde, M., Lack, D., Müller, T., Niessner, R., Petzold, A., Piazzalunga, A., Putaud, J. P., Schwarz, J., Sheridan, P., Subramanian, R., Swietlicki, E., Valli, G., Vecchi, R., and Viana, M.: Soot reference materials for instrument calibration and intercomparisons: a workshop summary with recommendations, Atmos. Meas. Tech., 5, 1869–1887, https://doi.org/10.5194/amt-5-1869-2012, 2012.
Benedict, K. B., Lee, J. E., Kumar, N., Badal, P. S., Barbato, M., Dubey, M. K., and Aiken, A. C.: Wildland Urban Interface (WUI) Emissions: Laboratory Measurement of Aerosol and Trace Gas from Combustion of Manufactured Building Materials, ACS ES&T Air, 1, 1673–1686, https://doi.org/10.1021/acsestair.4c00217, 2024.
Bernardoni, V., Ferrero, L., Bolzacchini, E., Forello, A. C., Gregorič, A., Massabò, D., Močnik, G., Prati, P., Rigler, M., Santagostini, L., Soldan, F., Valentini, S., Valli, G., and Vecchi, R.: Determination of Aethalometer multiple-scattering enhancement parameters and impact on source apportionment during the winter 2017/18 EMEP/ACTRIS/COLOSSAL campaign in Milan, Atmos. Meas. Tech., 14, 2919–2940, https://doi.org/10.5194/amt-14-2919-2021, 2021.
Bohren, C. F. and Huffman, D. R.: Absorption and Scattering of Light by Small Particles, Wiley-VCH, New York, NY, https://doi.org/10.1002/9783527618156, 1998.
Bond, T. C. and Bergstrom, R. W.: Light Absorption by Carbonaceous Particles: An Investigative Review, Aerosol Science and Technology, 40, 27–67, https://doi.org/10.1080/02786820500421521, 2006.
Bond, T. C., Anderson, T. L., and Campbell, D.: Calibration and Intercomparison of Filter-Based Measurements of Visible Light Absorption by Aerosols, Aerosol Science and Technology, 30, 582–600, https://doi.org/10.1080/027868299304435, 1999.
Bond, T. C., Doherty, S. J., Fahey, D. W., Forster, P. M., Berntsen, T., DeAngelo, B. J., Flanner, M. G., Ghan, S., Kärcher, B., Koch, D., Kinne, S., Kondo, Y., Quinn, P. K., Sarofim, M. C., Schultz, M. G., Schulz, M., Venkataraman, C., Zhang, H., Zhang, S., Bellouin, N., Guttikunda, S. K., Hopke, P. K., Jacobson, M. Z., Kaiser, J. W., Klimont, Z., Lohmann, U., Schwarz, J. P., Shindell, D., Storelvmo, T., Warren, S. G., and Zender, C. S.: Bounding the Role of Black Carbon in the Climate System: A Scientific Assessment, J. Geophys. Res. Atmospheres, 118, 5380, https://doi.org/10.1002/jgrd.50171, 2013.
Cazorla, A., Bahadur, R., Suski, K. J., Cahill, J. F., Chand, D., Schmid, B., Ramanathan, V., and Prather, K. A.: Relating aerosol absorption due to soot, organic carbon, and dust to emission sources determined from in-situ chemical measurements, Atmos. Chem. Phys., 13, 9337–9350, https://doi.org/10.5194/acp-13-9337-2013, 2013.
Collaud Coen, M., Weingartner, E., Schaub, D., Hueglin, C., Corrigan, C., Henning, S., Schwikowski, M., and Baltensperger, U.: Saharan dust events at the Jungfraujoch: detection by wavelength dependence of the single scattering albedo and first climatology analysis, Atmos. Chem. Phys., 4, 2465–2480, https://doi.org/10.5194/acp-4-2465-2004, 2004.
Collaud Coen, M., Weingartner, E., Apituley, A., Ceburnis, D., Fierz-Schmidhauser, R., Flentje, H., Henzing, J. S., Jennings, S. G., Moerman, M., Petzold, A., Schmid, O., and Baltensperger, U.: Minimizing light absorption measurement artifacts of the Aethalometer: evaluation of five correction algorithms, Atmos. Meas. Tech., 3, 457–474, https://doi.org/10.5194/amt-3-457-2010, 2010.
Crutzen, P. J. and Andreae, M. O.: Biomass Burning in the Tropics: Impact on Atmospheric Chemistry and Biogeochemical Cycles, Science, 250, 1669–1678, https://doi.org/10.1126/science.250.4988.1669, 1990.
Cuesta-Mosquera, A., Močnik, G., Drinovec, L., Müller, T., Pfeifer, S., Minguillón, M. C., Briel, B., Buckley, P., Dudoitis, V., Fernández-García, J., Fernández-Amado, M., Ferreira De Brito, J., Riffault, V., Flentje, H., Heffernan, E., Kalivitis, N., Kalogridis, A.-C., Keernik, H., Marmureanu, L., Luoma, K., Marinoni, A., Pikridas, M., Schauer, G., Serfozo, N., Servomaa, H., Titos, G., Yus-Díez, J., Zioła, N., and Wiedensohler, A.: Intercomparison and characterization of 23 Aethalometers under laboratory and ambient air conditions: procedures and unit-to-unit variabilities, Atmos. Meas. Tech., 14, 3195–3216, https://doi.org/10.5194/amt-14-3195-2021, 2021.
Dajuma, A., Silué, S., Ogunjobi, K. O., Vogel, H., N'Datchoh, E. T., Yoboué, V., Diedhiou, A., and Vogel, B.: Biomass Burning Effects on the Climate over Southern West Africa During the Summer Monsoon, in: African Handbook of Climate Change Adaptation, edited by: Oguge, N., Ayal, D., Adeleke, L., and da Silva, I., Springer International Publishing, Cham, 1515–1532, https://doi.org/10.1007/978-3-030-45106-6_86, 2021.
Drinovec, L., Močnik, G., Zotter, P., Prévôt, A. S. H., Ruckstuhl, C., Coz, E., Rupakheti, M., Sciare, J., Müller, T., Wiedensohler, A., and Hansen, A. D. A.: The ”dual-spot” Aethalometer: an improved measurement of aerosol black carbon with real-time loading compensation, Atmos. Meas. Tech., 8, 1965–1979, https://doi.org/10.5194/amt-8-1965-2015, 2015.
Drinovec, L., Gregorič, A., Zotter, P., Wolf, R., Bruns, E. A., Prévôt, A. S. H., Petit, J.-E., Favez, O., Sciare, J., Arnold, I. J., Chakrabarty, R. K., Moosmüller, H., Filep, A., and Močnik, G.: The filter-loading effect by ambient aerosols in filter absorption photometers depends on the coating of the sampled particles, Atmos. Meas. Tech., 10, 1043–1059, https://doi.org/10.5194/amt-10-1043-2017, 2017.
Ferrero, L., Losi, N., Rigler, M., Gregorič, A., Colombi, C., D'Angelo, L., Cuccia, E., Cefalì, A. M., Gini, I., Doldi, A., Cerri, S., Maroni, P., Cipriano, D., Markuszewski, P., and Bolzacchini, E.: Determining the Aethalometer multiple scattering enhancement factor C from the filter loading parameter, Science of The Total Environment, 917, 170221, https://doi.org/10.1016/j.scitotenv.2024.170221, 2024.
Ferrero, L., Bernardoni, V., Santagostini, L., Cogliati, S., Soldan, F., Valentini, S., Massabò, D., Močnik, G., Gregorič, A., Rigler, M., Prati, P., Bigogno, A., Losi, N., Valli, G., Vecchi, R., and Bolzacchini, E.: Consistent determination of the heating rate of light-absorbing aerosol using wavelength- and time-dependent Aethalometer multiple-scattering correction, Science of The Total Environment, 791, 148277, https://doi.org/10.1016/j.scitotenv.2021.148277, 2021.
Fiddler, M.: Raw Data for Findings of the African Combustion Aerosol Collaborative Intercomparison Analysis (ACACIA) Pilot Project to Understand the Optical Properties of Biomass Burning Smoke, figshare [data set], https://doi.org/10.6084/m9.figshare.31038175.v1, 2026.
Flowers, B. A., Dubey, M. K., Mazzoleni, C., Stone, E. A., Schauer, J. J., Kim, S.-W., and Yoon, S. C.: Optical-chemical-microphysical relationships and closure studies for mixed carbonaceous aerosols observed at Jeju Island; 3-laser photoacoustic spectrometer, particle sizing, and filter analysis, Atmos. Chem. Phys., 10, 10387–10398, https://doi.org/10.5194/acp-10-10387-2010, 2010.
Hansen, A. D. A., Rosen, H., and Novakov, T.: The aethalometer – An instrument for the real-time measurement of optical absorption by aerosol particles, Science of The Total Environment, 36, 191–196, https://doi.org/10.1016/0048-9697(84)90265-1, 1984.
Hoffer, A., Tóth, Á., Pósfai, M., Chung, C. E., and Gelencsér, A.: Brown carbon absorption in the red and near-infrared spectral region, Atmos. Meas. Tech., 10, 2353–2359, https://doi.org/10.5194/amt-10-2353-2017, 2017.
Ichoku, C.: African Biomass Burning and Its Atmospheric Impacts, Oxford University Press, Oxford, England, https://doi.org/10.1093/acrefore/9780190228620.013.523, 2020.
Ichoku, C., Ellison, L. T., Willmot, K. E., Matsui, T., Dezfuli, A. K., Gatebe, C. K., Wang, J., Wilcox, E. M., Lee, J., Adegoke, J., Okonkwo, C., Bolten, J., Policelli, F. S., and Habib, S.: Biomass burning, land-cover change, and the hydrological cycle in Northern sub-Saharan Africa, Environmental Research Letters, 11, 095005, https://doi.org/10.1088/1748-9326/11/9/095005, 2016.
Kim, J.-H., Kim, S.-W., Ogren, J. A., Sheridan, P. J., Yoon, S.-C., Sharma, S., and Lin, N.-H.: Multiple scattering correction factor estimation for aethalometer aerosol absorption coefficient measurement, Aerosol Science and Technology, 53, 160–171, https://doi.org/10.1080/02786826.2018.1555368, 2019.
Kirchstetter, T. W., Novakov, T., and Hobbs, P. V.: Evidence that the spectral dependence of light absorption by aerosols is affected by organic carbon, Journal of Geophysical Research: Atmospheres, 109, https://doi.org/10.1029/2004JD004999, 2004.
Kumar, J., Paik, T., Shetty, N. J., Sheridan, P., Aiken, A. C., Dubey, M. K., and Chakrabarty, R. K.: Correcting for filter-based aerosol light absorption biases at the Atmospheric Radiation Measurement program's Southern Great Plains site using photoacoustic measurements and machine learning, Atmos. Meas. Tech., 15, 4569–4583, https://doi.org/10.5194/amt-15-4569-2022, 2022.
Lack, D. A. and Cappa, C. D.: Impact of brown and clear carbon on light absorption enhancement, single scatter albedo and absorption wavelength dependence of black carbon, Atmos. Chem. Phys., 10, 4207–4220, https://doi.org/10.5194/acp-10-4207-2010, 2010.
Lack, D. A. and Langridge, J. M.: On the attribution of black and brown carbon light absorption using the Ångström exponent, Atmos. Chem. Phys., 13, 10535–10543, https://doi.org/10.5194/acp-13-10535-2013, 2013.
Lamarque, J.-F., Bond, T. C., Eyring, V., Granier, C., Heil, A., Klimont, Z., Lee, D., Liousse, C., Mieville, A., Owen, B., Schultz, M. G., Shindell, D., Smith, S. J., Stehfest, E., Van Aardenne, J., Cooper, O. R., Kainuma, M., Mahowald, N., McConnell, J. R., Naik, V., Riahi, K., and van Vuuren, D. P.: Historical (1850–2000) gridded anthropogenic and biomass burning emissions of reactive gases and aerosols: methodology and application, Atmos. Chem. Phys., 10, 7017–7039, https://doi.org/10.5194/acp-10-7017-2010, 2010.
Lewis, K., Arnott, W. P., Moosmüller, H., and Wold, C. E.: Strong spectral variation of biomass smoke light absorption and single scattering albedo observed with a novel dual-wavelength photoacoustic instrument, Journal of Geophysical Research: Atmospheres, 113, https://doi.org/10.1029/2007JD009699, 2008.
Liousse, C., Cachier, H., and Jennings, S. G.: Optical and thermal measurements of black carbon aerosol content in different environments: Variation of the specific attenuation cross-section, sigma (σ), Atmospheric Environment. Part A. General Topics, 27, 1203–1211, https://doi.org/10.1016/0960-1686(93)90246-U, 1993.
Liousse, C., Assamoi, E., Criqui, P., Granier, C., and Rosset, R.: Explosive growth in African combustion emissions from 2005 to 2030, Environmental Research Letters, 9, 035003, https://doi.org/10.1088/1748-9326/9/3/035003, 2014.
Liu, C., Chung, C. E., Yin, Y., and Schnaiter, M.: The absorption Ångström exponent of black carbon: from numerical aspects, Atmos. Chem. Phys., 18, 6259–6273, https://doi.org/10.5194/acp-18-6259-2018, 2018.
Martinsson, J., Eriksson, A. C., Nielsen, I. E., Malmborg, V. B., Ahlberg, E., Andersen, C., Lindgren, R., Nyström, R., Nordin, E. Z., Brune, W. H., Svenningsson, B., Swietlicki, E., Boman, C., and Pagels, J. H.: Impacts of Combustion Conditions and Photochemical Processing on the Light Absorption of Biomass Combustion Aerosol, Environmental Science & Technology, 49, 14663–14671, https://doi.org/10.1021/acs.est.5b03205, 2015.
McMeeking, G. R., Fortner, E., Onasch, T. B., Taylor, J. W., Flynn, M., Coe, H., and Kreidenweis, S. M.: Impacts of nonrefractory material on light absorption by aerosols emitted from biomass burning, Journal of Geophysical Research: Atmospheres, 119, 12272–212286, https://doi.org/10.1002/2014JD021750, 2014.
McRee, M. M., Moschos, V., Fiddler, M. N., Massabò, D., Surratt, J. D., and Bililign, S.: Influence of relative humidity and aging on the optical properties of organic aerosols from burning African biomass fuels, Aerosol Science and Technology, 1–23, https://doi.org/10.1080/02786826.2024.2412652, 2024.
Moosmüller, H., Chakrabarty, R. K., and Arnott, W. P.: Aerosol light absorption and its measurement: A review, Journal of Quantitative Spectroscopy and Radiative Transfer, 110, 844–878, https://doi.org/10.1016/j.jqsrt.2009.02.035, 2009.
Moosmüller, H., Chakrabarty, R. K., Ehlers, K. M., and Arnott, W. P.: Absorption Ångström coefficient, brown carbon, and aerosols: basic concepts, bulk matter, and spherical particles, Atmos. Chem. Phys., 11, 1217–1225, https://doi.org/10.5194/acp-11-1217-2011, 2011.
Moschos, V., Christensen, C., Mouton, M., Fiddler, M. N., Isolabella, T., Mazzei, F., Massabò, D., Turpin, B. J., Bililign, S., and Surratt, J. D.: Quantifying the Light-Absorption Properties and Molecular Composition of Brown Carbon Aerosol from Sub-Saharan African Biomass Combustion, Environmental Science & Technology, 58, 4268–4280, https://doi.org/10.1021/acs.est.3c09378, 2024.
Moschos, V., Gysel-Beer, M., Modini, R. L., Corbin, J. C., Massabò, D., Costa, C., Danelli, S. G., Vlachou, A., Daellenbach, K. R., Szidat, S., Prati, P., Prévôt, A. S. H., Baltensperger, U., and El Haddad, I.: Source-specific light absorption by carbonaceous components in the complex aerosol matrix from yearly filter-based measurements, Atmos. Chem. Phys., 21, 12809–12833, https://doi.org/10.5194/acp-21-12809-2021, 2021.
Mouton, M., Malek, K. A., James, M. S. H., Pokhrel, R. P., Fiddler, M. N., Asa-Awuku, A. A., and Bililign, S.: The hygroscopic properties of biomass burning aerosol from Eucalyptus and cow dung under different combustion conditions, Aerosol Science and Technology, 57, 665–677, https://doi.org/10.1080/02786826.2023.2198587, 2023.
Müller, T., Henzing, J. S., de Leeuw, G., Wiedensohler, A., Alastuey, A., Angelov, H., Bizjak, M., Collaud Coen, M., Engström, J. E., Gruening, C., Hillamo, R., Hoffer, A., Imre, K., Ivanow, P., Jennings, G., Sun, J. Y., Kalivitis, N., Karlsson, H., Komppula, M., Laj, P., Li, S.-M., Lunder, C., Marinoni, A., Martins dos Santos, S., Moerman, M., Nowak, A., Ogren, J. A., Petzold, A., Pichon, J. M., Rodriquez, S., Sharma, S., Sheridan, P. J., Teinilä, K., Tuch, T., Viana, M., Virkkula, A., Weingartner, E., Wilhelm, R., and Wang, Y. Q.: Characterization and intercomparison of aerosol absorption photometers: result of two intercomparison workshops, Atmos. Meas. Tech., 4, 245–268, https://doi.org/10.5194/amt-4-245-2011, 2011.
Nakayama, T., Suzuki, H., Kagamitani, S., Ikeda, Y., Uchiyama, A., and Matsumi, Y.: Characterization of a Three Wavelength Photoacoustic Soot Spectrometer (PASS-3) and a Photoacoustic Extinctiometer (PAX), Journal of the Meteorological Society of Japan. Ser. II, 93, 285–308, https://doi.org/10.2151/jmsj.2015-016, 2015.
Petzold, A., Kopp, C., and Niessner, R.: The dependence of the specific attenuation cross-section on black carbon mass fraction and particle size, Atmospheric Environment, 31, 661–672, https://doi.org/10.1016/S1352-2310(96)00245-2, 1997.
Pokhrel, R. P., Gordon, J., Fiddler, M. N., and Bililign, S.: Determination of Emission Factors of Pollutants From Biomass Burning of African Fuels in Laboratory Measurements, Journal of Geophysical Research: Atmospheres, 126, e2021JD034731, https://doi.org/10.1029/2021JD034731, 2021a.
Pokhrel, R. P., Gordon, J., Fiddler, M. N., and Bililign, S.: Impact of combustion conditions on physical and morphological properties of biomass burning aerosol, Aerosol Science and Technology, 55, 80–91, https://doi.org/10.1080/02786826.2020.1822512, 2021b.
Ponczek, M., Franco, M. A., Carbone, S., Rizzo, L. V., Monteiro dos Santos, D., Morais, F. G., Duarte, A., Barbosa, H. M. J., and Artaxo, P.: Linking the chemical composition and optical properties of biomass burning aerosols in Amazonia, Environmental Science: Atmospheres, 2, 252–269, https://doi.org/10.1039/D1EA00055A, 2022.
Ramo, R., Roteta, E., Bistinas, I., van Wees, D., Bastarrika, A., Chuvieco, E., and van der Werf, G. R.: African burned area and fire carbon emissions are strongly impacted by small fires undetected by coarse resolution satellite data, Proceedings of the National Academy of Sciences, 118, e2011160118, https://doi.org/10.1073/pnas.2011160118, 2021.
Randel, W. J. and Jensen, E. J.: Physical processes in the tropical tropopause layer and their roles in a changing climate, Nature Geoscience, 6, 169–176, https://doi.org/10.1038/ngeo1733, 2013.
Santos, F., Longo, K., Guenther, A., Kim, S., Gu, D., Oram, D., Forster, G., Lee, J., Hopkins, J., Brito, J., and Freitas, S.: Biomass burning emission disturbances of isoprene oxidation in a tropical forest, Atmos. Chem. Phys., 18, 12715–12734, https://doi.org/10.5194/acp-18-12715-2018, 2018.
Saturno, J., Pöhlker, C., Massabò, D., Brito, J., Carbone, S., Cheng, Y., Chi, X., Ditas, F., Hrabě de Angelis, I., Morán-Zuloaga, D., Pöhlker, M. L., Rizzo, L. V., Walter, D., Wang, Q., Artaxo, P., Prati, P., and Andreae, M. O.: Comparison of different Aethalometer correction schemes and a reference multi-wavelength absorption technique for ambient aerosol data, Atmos. Meas. Tech., 10, 2837–2850, https://doi.org/10.5194/amt-10-2837-2017, 2017.
Schmid, O., Artaxo, P., Arnott, W. P., Chand, D., Gatti, L. V., Frank, G. P., Hoffer, A., Schnaiter, M., and Andreae, M. O.: Spectral light absorption by ambient aerosols influenced by biomass burning in the Amazon Basin. I: Comparison and field calibration of absorption measurement techniques, Atmos. Chem. Phys., 6, 3443–3462, https://doi.org/10.5194/acp-6-3443-2006, 2006.
Segura, S., Estellés, V., Titos, G., Lyamani, H., Utrillas, M. P., Zotter, P., Prévôt, A. S. H., Močnik, G., Alados-Arboledas, L., and Martínez-Lozano, J. A.: Determination and analysis of in situ spectral aerosol optical properties by a multi-instrumental approach, Atmos. Meas. Tech., 7, 2373–2387, https://doi.org/10.5194/amt-7-2373-2014, 2014.
Shuman, J. K., Balch, J. K., Barnes, R. T., Higuera, P. E., Roos, C. I., Schwilk, D. W., Stavros, E. N., Banerjee, T., Bela, M. M., Bendix, J., Bertolino, S., Bililign, S., Bladon, K. D., Brando, P., Breidenthal, R. E., Buma, B., Calhoun, D., Carvalho, L. M. V., Cattau, M. E., Cawley, K. M., Chandra, S., Chipman, M. L., Cobian-Iñiguez, J., Conlisk, E., Coop, J. D., Cullen, A., Davis, K. T., Dayalu, A., De Sales, F., Dolman, M., Ellsworth, L. M., Franklin, S., Guiterman, C. H., Hamilton, M., Hanan, E. J., Hansen, W. D., Hantson, S., Harvey, B. J., Holz, A., Huang, T., Hurteau, M. D., Ilangakoon, N. T., Jennings, M., Jones, C., Klimaszewski-Patterson, A., Kobziar, L. N., Kominoski, J., Kosovic, B., Krawchuk, M. A., Laris, P., Leonard, J., Loria-Salazar, S. M., Lucash, M., Mahmoud, H., Margolis, E., Maxwell, T., McCarty, J. L., McWethy, D. B., Meyer, R. S., Miesel, J. R., Moser, W. K., Nagy, R. C., Niyogi, D., Palmer, H. M., Pellegrini, A., Poulter, B., Robertson, K., Rocha, A. V., Sadegh, M., Santos, F., Scordo, F., Sexton, J. O., Sharma, A. S., Smith, A. M. S., Soja, A. J., Still, C., Swetnam, T., Syphard, A. D., Tingley, M. W., Tohidi, A., Trugman, A. T., Turetsky, M., Varner, J. M., Wang, Y., Whitman, T., Yelenik, S., and Zhang, X.: Reimagine fire science for the anthropocene, PNAS Nexus, 1, https://doi.org/10.1093/pnasnexus/pgac115, 2022.
Singh, S., Fiddler, M. N., Smith, D., and Bililign, S.: Error Analysis and Uncertainty in the Determination of Aerosol Optical Properties Using Cavity Ring-Down Spectroscopy, Integrating Nephelometry, and the Extinction-Minus-Scattering Method, Aerosol Sci. Technol., 48, 1345–1359, https://doi.org/10.1080/02786826.2014.984062, 2014.
Smith, D. M., Fiddler, M. N., Sexton, K. G., and Bililign, S.: Construction and Characterization of an Indoor Smog Chamber for Measuring the Optical and Physicochemical Properties of Aging Biomass Burning Aerosols, Aerosol and Air Quality Research, 19, 467–483, https://doi.org/10.4209/aaqr.2018.06.0243, 2019.
Subramanian, R., Roden, C. A., Poonam, B., and Bond, T. C.: Yellow Beads and Missing Particles: Trouble Ahead for Filter-Based Absorption Measurements, Aerosol Science and Technology, 41, 630–637, https://doi.org/10.1080/02786820701344589, 2007.
Uin, J., Aiken, A. C., Dubey, M. K., Kuang, C., Pekour, M., Salwen, C., Sedlacek, A. J., Senum, G., Smith, S., Wang, J., Watson, T. B., and Springston, S. R.: Atmospheric Radiation Measurement (ARM) Aerosol Observing Systems (AOS) for Surface-Based In Situ Atmospheric Aerosol and Trace Gas Measurements, Journal of Atmospheric and Oceanic Technology, 36, 2429–2447, https://doi.org/10.1175/JTECH-D-19-0077.1, 2019.
Valentini, S., Barnaba, F., Bernardoni, V., Calzolai, G., Costabile, F., Di Liberto, L., Forello, A. C., Gobbi, G. P., Gualtieri, M., Lucarelli, F., Nava, S., Petralia, E., Valli, G., Wiedensohler, A., and Vecchi, R.: Classifying aerosol particles through the combination of optical and physical-chemical properties: Results from a wintertime campaign in Rome (Italy), Atmospheric Research, 235, 104799, https://doi.org/10.1016/j.atmosres.2019.104799, 2020.
van der Werf, G. R., Randerson, J. T., Giglio, L., Collatz, G. J., Mu, M., Kasibhatla, P. S., Morton, D. C., DeFries, R. S., Jin, Y., and van Leeuwen, T. T.: Global fire emissions and the contribution of deforestation, savanna, forest, agricultural, and peat fires (1997–2009), Atmos. Chem. Phys., 10, 11707–11735, https://doi.org/10.5194/acp-10-11707-2010, 2010.
Virkkula, A., Ahlquist, N. C., Covert, D. S., Sheridan, P. J., Arnott, W. P., and Ogren, J. A.: A Three-Wavelength Optical Extinction Cell for Measuring Aerosol Light Extinction and Its Application to Determining Light Absorption Coefficient, Aerosol Science and Technology, 39, 52–67, https://doi.org/10.1080/027868290901918, 2005.
Virkkula, A., Mäkelä, T., Hillamo, R., Yli-Tuomi, T., Hirsikko, A., Hämeri, K., and Koponen, I. K.: A Simple Procedure for Correcting Loading Effects of Aethalometer Data, Journal of the Air & Waste Management Association, 57, 1214–1222, https://doi.org/10.3155/1047-3289.57.10.1214, 2007.
Vollset, S. E., Goren, E., Yuan, C.-W., Cao, J., Smith, A. E., Hsiao, T., Bisignano, C., Azhar, G. S., Castro, E., Chalek, J., Dolgert, A. J., Frank, T., Fukutaki, K., Hay, S. I., Lozano, R., Mokdad, A. H., Nandakumar, V., Pierce, M., Pletcher, M., Robalik, T., Steuben, K. M., Wunrow, H. Y., Zlavog, B. S., and Murray, C. J. L.: Fertility, mortality, migration, and population scenarios for 195 countries and territories from 2017 to 2100: a forecasting analysis for the Global Burden of Disease Study, The Lancet, 396, 1285–1306, https://doi.org/10.1016/S0140-6736(20)30677-2, 2020.
Weingartner, E., Saathoff, H., Schnaiter, M., Streit, N., Bitnar, B., and Baltensperger, U.: Absorption of light by soot particles: determination of the absorption coefficient by means of aethalometers, Journal of Aerosol Science, 34, 1445–1463, https://doi.org/10.1016/S0021-8502(03)00359-8, 2003.
Yokelson, R. J., Susott, R., Ward, D. E., Reardon, J., and Griffith, D. W. T.: Emissions from smoldering combustion of biomass measured by open-path Fourier transform infrared spectroscopy, Journal of Geophysical Research: Atmospheres, 102, 18865–18877, https://doi.org/10.1029/97JD00852, 1997.
Yus-Díez, J., Bernardoni, V., Močnik, G., Alastuey, A., Ciniglia, D., Ivančič, M., Querol, X., Perez, N., Reche, C., Rigler, M., Vecchi, R., Valentini, S., and Pandolfi, M.: Determination of the multiple-scattering correction factor and its cross-sensitivity to scattering and wavelength dependence for different AE33 Aethalometer filter tapes: a multi-instrumental approach, Atmos. Meas. Tech., 14, 6335–6355, https://doi.org/10.5194/amt-14-6335-2021, 2021.
Zhang, L., Luo, Z., Du, W., Li, G., Shen, G., Cheng, H., and Tao, S.: Light absorption properties and absorption emission factors for indoor biomass burning, Environmental Pollution, 267, 115652, https://doi.org/10.1016/j.envpol.2020.115652, 2020.
- Abstract
- Introduction
- Methods
- Cλ determination and parametrization
- Wavelength Dependence of sub-Saharan BB Aerosol
- Comparison of Combustion Systems
- Conclusions
- Data availability
- Author contributions
- Competing interests
- Disclaimer
- Acknowledgements
- Financial support
- Review statement
- References
- Supplement