the Creative Commons Attribution 4.0 License.
the Creative Commons Attribution 4.0 License.
 | 12 May 2026
A low-maintenance optoacoustic sensor for black carbon monitoring
Linda Haedrich
Nikolaos Kousias
Ioannis Raptis
Uli Stahl
Leonidas Ntziachristos
Vasilis Ntziachristos
Regulation of black carbon (BC) emissions is necessary due to their negative impact to climate and human health. We present a low-cost optoacoustic sensor for Black Carbon (BC) emissions, which can provide continuous measurements that are suitable for long-term BC monitoring in highly contaminative environments with low need for frequent maintenance. Insensitivity to contamination is based on a sensor design that integrates protective flows of clean air around the sample measured, which minimizes BC deposition on the detector and optical windows of the sensor. A quantitative analysis shows that the negative effect of BC contamination on sensor performance is reduced by a factor of greater than 300 000 in comparison to an unprotected control sensor. We discuss how the reduced maintenance requirements make the design presented a promising candidate for continuous and long-term BC monitoring of high emitters, enabling disseminated monitoring necessary for regulatory and mitigation measures of BC emissions in the future.
- Article
(1724 KB) - Full-text XML
-
Supplement
(514 KB) - BibTeX
- EndNote


Black carbon (BC) particles are generated by pyrolysis of carbon-containing fuels, especially during incomplete combustion, and can have a significant impact on the climate and human health (Chowdhury et al., 2022). Two thirds of all BC emissions originate from anthropogenic activities (Bond et al., 2013; Timonen et al., 2019), while the rest are emitted by wildfires. The main anthropogenic emission sources of BC include residential wood burning, transportation and industry (Xu et al., 2021). In winter, BC emissions from wood burning can be up to 30 % of all BC emissions for urban areas in Europe (Kalogridis et al., 2018). In regions of Asia and Africa where wood burning is used for cooking, the effect can be even higher. The concentration of BC at the exhaust of stoves was measured in rural China and reached concentrations of 50–80 mg m−3 (Shen et al., 2020).
Road transport pollutant emissions, including BC, have been reduced effectively by the Euro standards (European Union, 2009), but remain the main BC source in Europe. Shipping emissions are relatively low in terms of their total emissions ∼ 1.7 % of all BC emissions (Lack et al., 2008) or ∼ 2.9 % of total emissions (IMO, 2021), but they have a significant climate warming effect when emitted within the Arctic Circle (Kang et al., 2020). Shipping also majorly affects air quality in cities, due to high local emissions at ports. Regarding industry emissions, coke ovens and brick kilns are the largest emitter sectors (Xu et al., 2021). Coke ovens are mostly located in China. Recent efforts are aimed toward the use of cleaner fuel and the establishment of control technologies to limit BC emissions. Brick kilns remain a significant emitter of BC particles in Asia. For example, Bangladesh has ∼ 5000 brick kiln facilities. The BC concentration at the exhaust of a brick kiln can reach concentrations of 10–15 mg m−3, and they operate for 5–6 months depending on monsoon season (Haque et al., 2018). It is important to note that Bangladesh is very close to the Himalayas, a region that is affected disproportionally by BC emissions due to excessive snow coverage, similar to the Arctic.
BC yields two main negative outcomes: climate warming and negative health effects. The global climate warming effect of BC is calculated to be between +0.15 W m−2 (Arias et al., 2019) to +1.1 W m−2 (Bond et al., 2013). The lower estimates do not include the warming potential of organic aerosols, which has been shown to be on the order of +0.22 to +0.57 W m−2 (Lin et al., 2014). The climatic effects of BC are much larger in snow-covered regions, due to accelerated snow melting and positive albedo feedback. Estimates of an additional warming effect of +0.17, +1.5 W m−2 and up to more than 100 W m−2 (Kang et al., 2020) have been reported for the Arctic, the Alps and the Tibetan Plateau, respectively. With regards to health effects, BC emissions relate to cardiovascular mortality and morbidity, particularly with very small particles (< 300 nm) reaching the bloodstream through breathing and the lungs, due to toxic substances that are co-emitted with BC and then absorbed by the carbon particles (Janssen et al., 2012). Additionally, BC can cause respiratory effects (Lepisto et al., 2022), and has recently been associated with brain tumours (Poulsen et al., 2020).
The reduction of the negative impact of BC requires legislation for BC emissions control, expected to positively impact climate warming mitigation while providing health benefits for the general population (Brewer, 2019). BC has been included in the latest Air Quality Directive by the European Commission (European Community, 2024), which includes mandatory ambient BC measurements where concentrations are expected to be large, e.g., in street canyons. Source specific legislation that includes direct exhaust measurements for selected sources and at selected locations where BC has increased warming potential (e.g. Arctic, Himalayas) would be most beneficial. The International Maritime Organization (IMO) has further made an effort to establish protocols for on-board monitoring of BC from ships with a focus on emissions in the Arctic. The IMO has also suggested suitable measurement techniques, all of which rely on the optical absorption properties of BC (IMO, 2011, 2015, 2018). Still, the potential of current sensors is limited by either sensor cost or maintenance requirements, as there are no low-cost systems that can withstand the demanding environment of vessel funnels without frequent maintenance. The same limitations apply for other direct exhaust measurement applications, such as in industry. Such a low-cost sensor could accelerate the introduction of legislation for direct BC monitoring from individual relevant sources, e.g., ships, brick kilns, cooking stoves, fireplaces, etc.
The main technologies that are used to quantify the concentration of BC particles are filter smoke numbers (FSN), aethalometers for ambient measurements, laser-induced incandescence (LII) and optoacoustic spectroscopy (OptAS), also often referred to as photoacoustic spectroscopy (PAS) (IMO, 2018; Aakko-Saksa et al., 2022). They all rely on the optical properties of BC to quantify its concentration. Smoke meters (SM), which determine the FSN, and their ambient-concentration counterparts known as aethalometers, detect BC particles that are deposited on a filter tape. SMs rely on the reflectance of the filter (Giechaskiel et al., 2014) while aethalometers rely on the attenuation of light (absorption plus scattering) through the filter (Hansen et al., 1984). Both technologies suffer from some key limitations. The most important one is scattering artefacts which are shown to reduce the sensor's accuracy (Kim et al., 2019), especially in the presence of particles with high scattering albedo. There is currently no correction for this artefact. Additionally, filter-based instruments suffer from the filter loading artefact, which can be compensated by using the dual spot method (Drinovec et al., 2015). However, this correction method is only implemented by lab-grade instruments. Lower cost systems rely on less accurate correction algorithms (Collaud Coen et al., 2010). For raw exhaust applications, condensation of water on the filter tape can be a significant issue and often a heated sample inlet is used to reduce humidity (Backman et al., 2017). Filter-based instruments operate optimally for ambient applications where the concentration of BC particles is small. Thus, using filter-based instruments for exhaust applications will lead to increased maintenance requirements, especially for miniaturized versions of the technology. For aethalometers, daily maintenance with a high cost of replacement filters and additional manpower adds to the retail prices of the instruments. FSN measurements are mainly used during engine certification and inspection and cannot be carried out in real-time, as time is needed for BC to accumulate on the filter paper (Aakko-Saksa et al., 2022).
Laser Induced Incandescence (LII) sensors use very high energy lasers to heat BC particles up to 4000 K so that they radiate in the visible spectrum, which is then measured by optical detectors (Michelsen et al., 2015). Due to the required high power, LII sensor systems are very expensive and have small potential for cost reduction and technology miniaturization. Thus, despite their favourable measurement characteristics, such devices are not suitable for widespread implementation.
OptAS sensors rely on light pulses to induce periodic energy absorption by BC particles which leads to the emission of pressure waves from the particles to the surrounding media. The generated acoustic signal is directly proportional to BC concentration and is detected by a sound transducer. It is common to use acoustic resonators to enhance the sound intensity and improve sensitivity (Ma, 2018). The most widely used commercial OptAS instruments are the AVL Micro Soot Sensor (MSS; AVL, Graz, Austria) (Schindler et al., 2004) and the Photoacoustic Extinctiometer (PAX; Droplet Measurement Technologies, CO, USA). The cost of these instruments is very high, making their widespread application challenging, similar to LII sensors. In addition, they employ resonators which make the system very sensitive to changes in environmental conditions and require detailed sample conditioning. Low-cost OptAS sensors for gas sensing have been developed by implementing a relatively new technique named Quartz Enhanced Optoacoustic Spectroscopy (QEPAS) (Patimisco et al., 2014). This technique relies on a quartz tuning fork (QTF), an ultrasound transducer with a very high Q factor, which is simultaneously very sensitive and of minimal cost. Despite the success of QEPAS sensors for gas sensing, there is still a lack of particle sensors that rely on this technology. The limiting factor for the application of QEPAS for particle sensing is the deposition of particles on the QTF, which can potentially lead to its degradation and loss of sensitivity.
In summary, there is currently a lack of affordable sensors with low maintenance requirements, suitable for use in highly contaminative environments, such as the direct exhaust monitoring of high emitters of BC particles. In this work, we present the performance of a new sensor design, termed illumination-detection separating sensor (IDSS) (Stylogiannis et al., 2021; Ntziachristos et al., 2021), that enables direct exhaust measurements of high emitters such as ships, brick kilns and more without requiring maintenance for long periods of time. The design of the IDSS separates the sensitive element, a quartz tuning fork (QTF), from the sample flow containing BC particles and therefore direct contamination of the QTF is avoided, preventing sensitivity loss. To avoid diffusion of particles out of the sample flow, the sensor design integrates protective flows of clean air. The flows eliminate BC deposition on inward-facing optical windows for the excitation laser, which could otherwise result in the generation of an ever-increasing acoustic background signal.
The IDSS was already successfully implemented on-board the Stena Germanica, a RoPax ferry (roll-on-roll-off ferry transporting passengers and cargo) for continuous measurements of BC particles (Haedrich et al., 2025). Herein, we show tests from laboratory measurements with the IDSS at higher BC concentrations and for a longer duration than the previous field tests on-board the Stena Germanica. We show that the protective flows eliminate particle deposition onto the optical windows even at higher emission concentrations, resulting in a stable sensor performance. We further estimate that an optimized sensor could operate for at least 1.5 years on board a ship before maintenance is required.
2.1 Design and production of the IDSS and the control sensor
We previously describe the development, construction and design of the OptA IDSS in Ntziachristos et al. (2021), Stylogiannis et al. (2021), and Haedrich et al. (2025). To summarize, the IDSS consists of a 3D-printed ellipsoidal cavity with two focal points (FP1 and FP2) separated by a distance of ∼ 50 mm. The sensing element, a quartz tuning fork (QTF; 100 kHz, Type TC-26, Conrad, Hirschau, Germany) is installed at one of the focal points. At the other focal point, the BC sample flow is irradiated by a laser excitation, generating the acoustic signal. By design, the ellipsoidal cavity focuses the propagating acoustic signal onto the QTF.
We incorporated particle-free airflow around the sample flow to prevent the diffusion of particles into the ellipsoid chamber containing the QTF and onto the laser optical windows. Additional flows leading away from the optical windows added extra protection against particle deposition onto optical surfaces. Protective flows were integrated into the IDSS through spaces integrated into the design of the 3D-printed resin comprising the main body of the IDSS. A control sensor without contamination protection was 3D-printed without these spaces integrated into the sensor design. Both the IDSS and the control sensor were printed using a Form 2 printer (Formlabs GmbH, Berlin, Germany).
2.2 Assessment of the IDSS performance in the laboratory
We performed laboratory tests to assess the performance of the IDSS compared to (1) an unprotected control and a reference MSS (AVL, Graz, Austria) after exposure to 0.046 mg BC (Fig. 1a), and (2) an MSS after exposure to 7.8 mg BC (Fig. 1b).

Figure 1Schematic of the laboratory setups for sensor performance assessment. (a) Schematic of the setup to test the illumination-detection separating sensor (IDSS) in comparison to the unprotected control optoacoustic (OptA) sensor during exposure to the same sample in parallel. An AVL Micro Soot Sensor (MSS) is used as reference. (b) Schematic of the setup used to stress test the IDSS at high levels of black carbon (BC) exposure. An AVL MSS was used as a reference. APG: Aerosol Particle Generator.
For Test 1 (0.046 mg BC exposure), the devices tested measured the same BC sample in parallel (Fig. 4a). A propane-fuelled Argonaut burner (Miniature Inverted Soot Generator, Argonaut, Edmonton, Canada) was used to generate BC particles. To control the BC concentration, the sample was diluted with a Dekati Fine Particle Sampler (FPS, Dekati, Kangasala, Finland) and the sample was provided to both OptA sensors with a flowrate of 1.5 L min−1 each and to the MSS with a flowrate of 2 L min−1. The final sample flow rate for the IDSS was 2.2 L min−1, as it included clean air of 0.7 L min−1 total protective flows. The noise, and especially the baseline offset, depends on the total flowrate through the sensor rather than by each individual flow stream. With the current version of the sensor, a whistle-like noise is introduced when total flowrate increases above 3.5 L min−1, that could be improved by better aerodynamic design, if so needed. The MSS operated with additional internal dilution (DR = 1 : 5), which reduced the exposure of the MSS to BC compared to the IDSS and its control. The sensors were operated at room temperature around 21 °C and a slightly warmer sample temperature around 25 °C.
In general, the rise time is dependent on the flow rate, the dilution and the length of the sample lines. The sample lines and flow rate are the same for the unprotected control and the IDSS. A dilution from the protective flows has been excluded. Therefore, the rise time for both sensors is the same. However, different dilution and sample lines are present for the reference instrument MSS resulting in a delayed response in comparison to the IDSS.
For Test 2 (7.8 mg BC exposure), the IDSS was stress tested to evaluate its performance compared to the MSS over extended periods of high BC mass exposure (Fig. 1b). Two burners were used during the stress test to produce BC emissions. BC particles for the first half of the test were generated using a propane-fuelled APG burner (Aerosol Particle Generator, AVL, Graz, Austria). The APG (Fig. 1) has internal dilution, so no external diluter was necessary. The second half of the stress test was performed with the Argonaut burner as described in Test 1. The same flow configuration was maintained for the IDSS in this experiment (i.e., 1.5 L min−1 sample flow, 0.7 L min−1 protective flow). An MSS was again used as a reference instrument for measuring BC concentration. The MSS operated with an additional DR equal to 1 : 20 during this test, which reduced its exposure to BC particles. This means that the MSS was subjected to a lower BC mass concentration than the OptA IDSS.
2.3 Baseline correction
Baseline correction was necessary for data collected by the unprotected control sensor to separate actual BC measurements from contamination-induced background signals. By fitting a line through the flushing periods, we can estimate the baseline increase caused by contamination during the exposure periods. During the exposure periods it is not possible to fit through the data as we cannot distinguish between signal from contamination and signal from the sample. The baseline was calculated in two steps. First, we calculated linear fits for each individual flushing period. Second, linear fits during the exposure cycles were applied such that the baseline before each exposure cycle was connected to the baseline after the exposure cycle. The baseline correction is a simple subtraction of the mean offset determined during BC-free sampling. In case of a baseline increase, a linear increase of the offset was assumed during BC sampling and considered during subtraction. The signal was determined via a digital IQ-demodulation; however, phase differences could not be resolved. Faster signal acquisition would allow for more in-depth analysis of the phase difference between noise and OptA signal. Considering phase could make the baseline correction more precise if necessary.
2.4 OptA signal conversion to BC concentration
For the unprotected control sensor, we first subtracted the fitted baseline from the raw data as described above. Next, we plotted baseline-subtracted OptA data from the control sensor and the raw data of the IDSS against measured BC concentrations from the MSS, and found a linear relationship between each prototype sensor and the MSS (Fig. S1a, b in the Supplement). We used this linear relationship to convert OptA data points to BC concentrations.
The calculated BC concentrations for the IDSS and the control were then compared to the BC concentrations measured by the MSS to quantify deviations from the reference instrument. We calculated the absolute relative difference (ARD) and the mean absolute relative difference (MARD) of the exposure periods using Eq. (1), where cOptA is the calculated BC concentration from the OptA sensor and cref is the BC concentration measured by the reference instrument.
To check if the IDSS (raw) performs differently than the unprotected control (after baseline subtraction), a two-sample Kolmogorov-Smirnov test was performed. With this test we checked whether the ARD of the IDSS follows the same continuous ARD distribution as the control sensor. The tests were performed in Matlab R2022b (MathWorks, MA, USA).
2.5 Calculation of maintenance periods
We can calculate the time between maintenance periods (t) in days using Eq. (2) below,
where thours refers to the ship's operational hours per day, mBC refers to the maximum BC mass in mg the sensor should be exposed to between maintenance periods, DR refers to the sample dilution ratio, cBC refers to the undiluted BC concentration emitted by the vessel in mg m−3, FR refers to the flow rate through the sensor in L min−1 and Cf is a unit conversion factor equal to 0.06.
In the ellipsoidal cavity of the IDSS, the QTF is separated from the BC sample flow by a distance of ∼ 50 mm. This separation has been observed to practically eliminate particle deposition onto the QTF itself (Haedrich et al., 2025). A protective sheath flow of clean air has been integrated into the sensor (Fig. 2a), to avoid the contamination of the sensor volume because of BC particles diffusing out of the sample flow. A second sensor with the sheath flow switched off was used as a control in order to examine the effectiveness of the sheath flow. The OptA signal recorded by the control sensor is depicted in Fig. 2b, where it is evident that the baseline signal increases with measurement time as the sensor is exposed to BC particles.
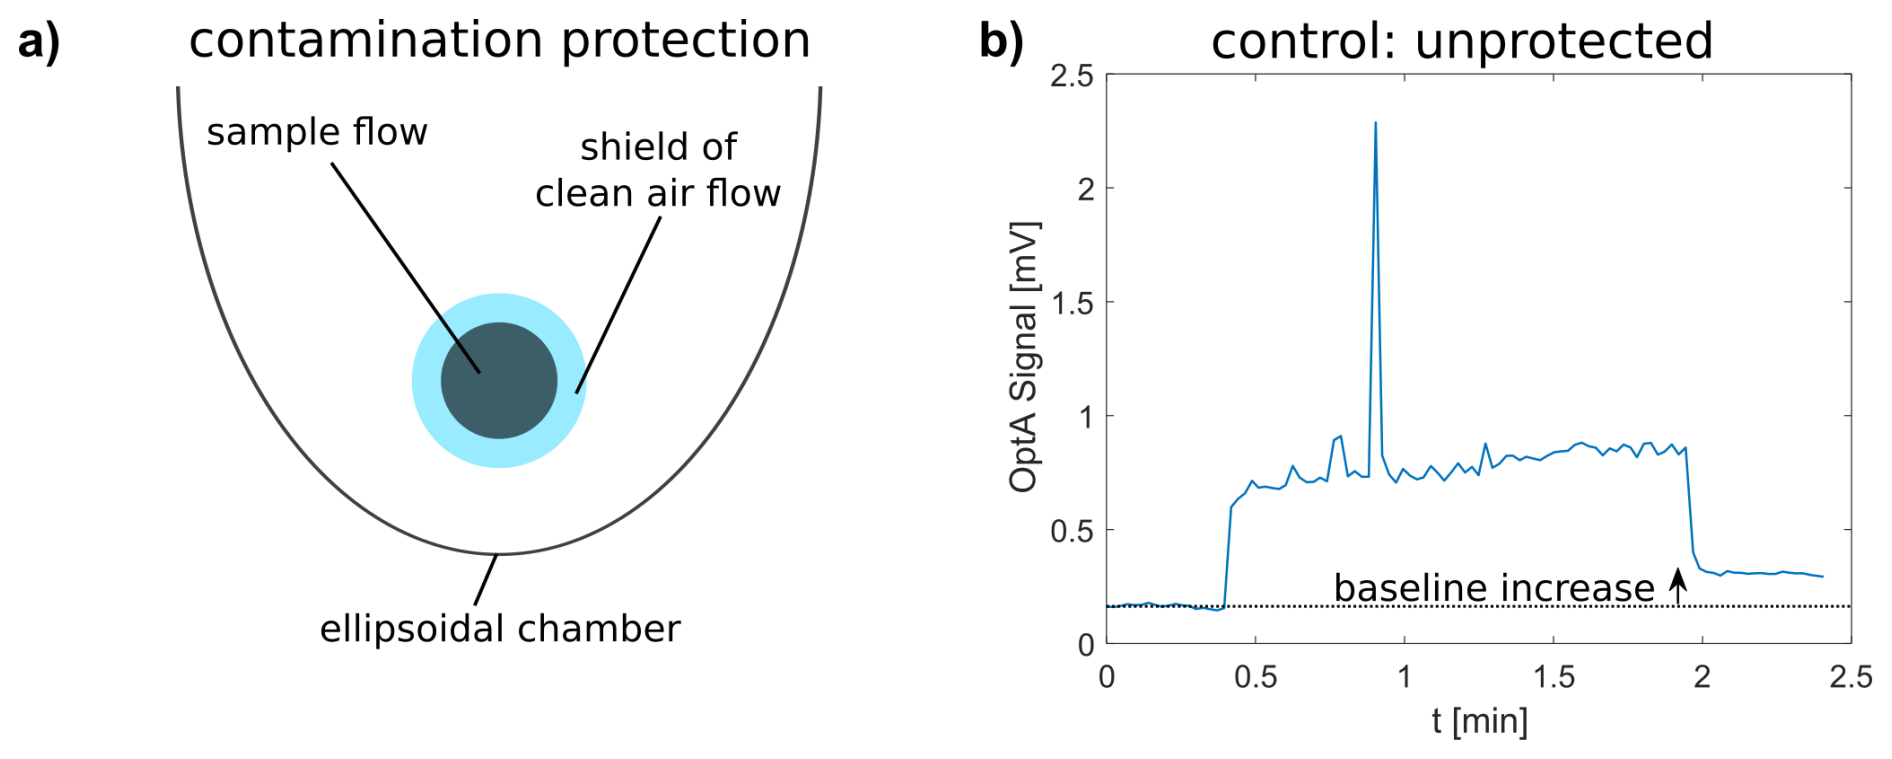
Figure 2Sketch of the sheath flow integrated into the illumination-detection separating sensor (IDSS) that prevents a baseline increase in optoacoustic (OptA) signal. (a) Cross-section of the ellipsoid cavity of the IDSS sketched to depict the sheath flow of clean air surrounding the sample flow containing black carbon (BC) particles. (b) Representative sample of the OptA signal recorded over 2 min by a control sensor with the sheath flows turned off. The graph shows a clear baseline increase, caused by contamination of the sensor.
The impact of the sheath flow on OptA signals was quantified through an experiment wherein the IDSS, operating normally, and the control sensor were exposed to BC over a long interval, with intermediate flushing periods to monitor the baseline. During this experiment, each sensor was exposed to a total BC mass of 45.7 µg. This mass corresponds to an exposure time of 38 h at a flowrate of 2 L min−1 and a BC concentration of 10 µg m−3. A reference OptAS instrument, an AVL MSS, was in operation at the same time, but this instrument was exposed to fewer BC particles as it had an additional 5-fold internal dilution system and a different sample flowrate, resulting in a final exposure of 12.7 µg BC. Figure 3a depicts the results of this experiment for all three instruments. The exposure periods and intermediate flushing periods are clearly visible. Raw, unprocessed data from the IDSS and the control sensor are presented in mV to showcase the baseline increase for the control sensor and the lack of baseline increase for the IDSS. The baseline OptA signal obtained from the control sensor increases with each exposure step, while the IDSS's baseline remains stable. Due to the baseline increase, it was not possible to convert the raw data of the control sensor to BC concentration.
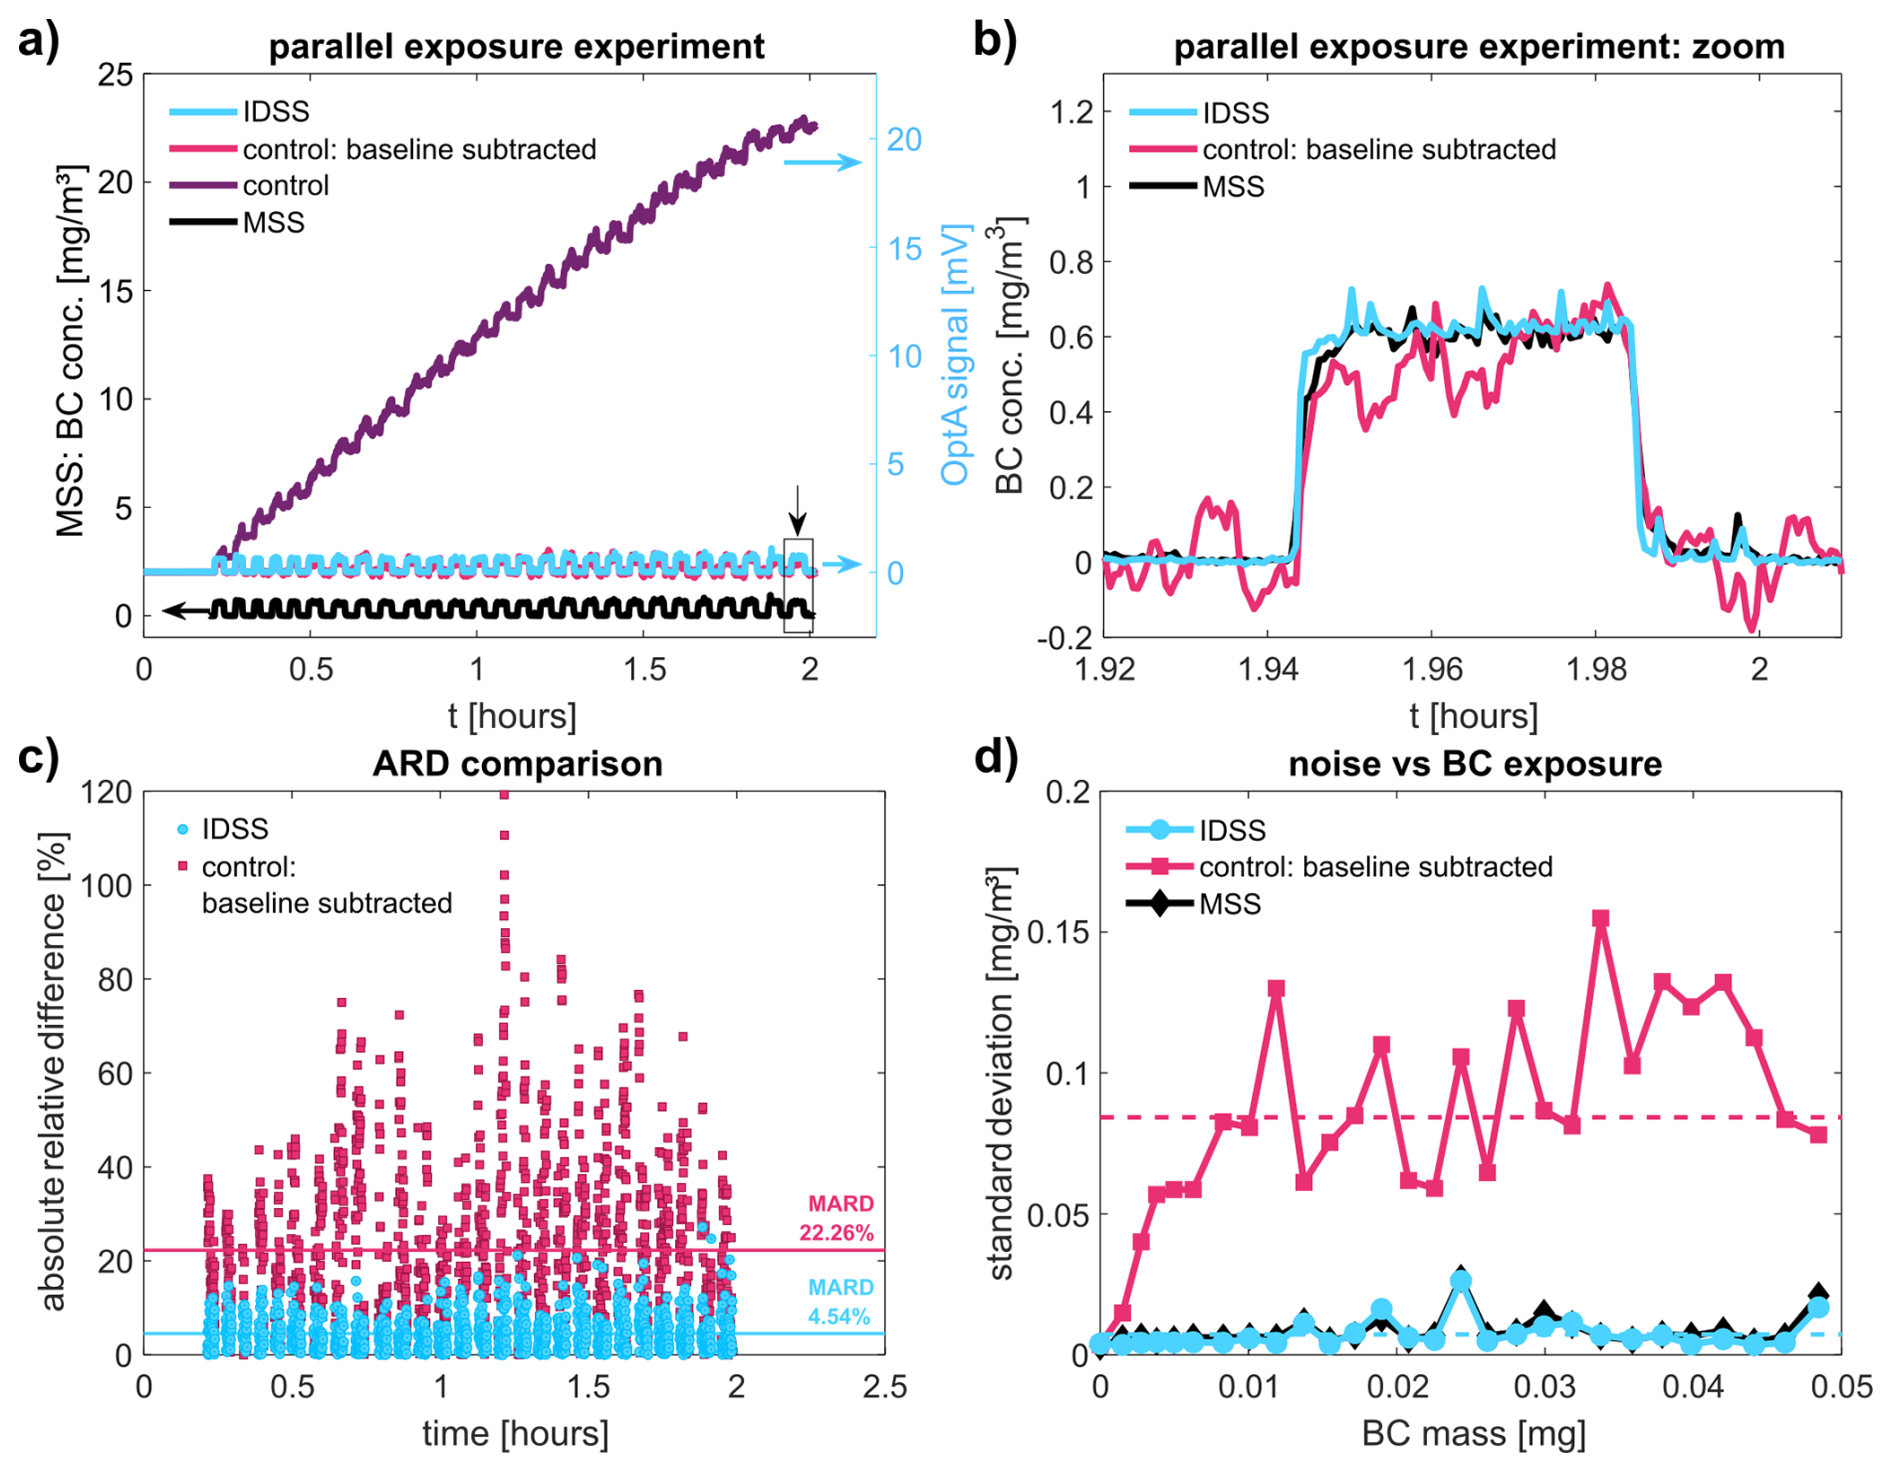
Figure 3Performance comparison of the illumination-detection separating sensor (IDSS) to a control sensor under prolonged exposure to black carbon (BC). (a) The signal of the IDSS (raw) and the control (raw and baseline-subtracted) during exposure to 46 µg BC. An AVL Micro Soot Sensor (MSS) was used as a reference instrument (exposed to 12.7 µg BC). (b) A detailed view of the last measurement cycle, indicated by the black box and arrow in panel (a). (c) The absolute relative difference (ARD) and the mean absolute relative difference (MARD) of the IDSS (raw) and the control (baseline-subtracted) in relation to the MSS. (d) The standard deviation (SD) of the background noise for each exposure period plotted versus the respective cumulative BC mass exposure of each sensor.
We investigated whether the contamination effect of the control sensor could be corrected during post-processing using baseline subtraction. This correction method accounts for the baseline increase during the exposure periods by subtracting a linear fit, which connects the baseline before and after each exposure interval (see Methods). The corrected data from the control sensor is plotted alongside data from the other sensors in Fig. 3a, overlapping with the uncorrected data from the IDSS. For better visibility, a zoomed-in view of the last exposure cycle is plotted in Fig. 3b.
The zoomed-in view (Fig. 3b) shows that the data collected by the IDSS are more stable compared to the corrected data from the control sensor. Here, the OptA data obtained from both sensors were converted to BC mass concentrations using a linear relationship derived from the OptA sensor data and the BC concentrations obtained by the MSS (Fig. S1a, b). The conversion factors used to convert the OptA signal in mV to BC concentration in mg m−3 were 0.842 ± 0.007 mg m−3 mV−1 for the baseline-subtracted data from the control and 1.043 ± 0.002 mg m−3 mV−1 for the raw data of the IDSS. Importantly, the signal measured by the IDSS exhibited a similar trend as the expensive AVL MSS. Spikes are visible in the data of the IDSS, which are similarly present in the MSS data. Thus, the spikes are originating from the sample itself.
To investigate deviations in the signal between the OptA sensor and the MSS, we calculated the mean absolute relative difference (MARD) of both the IDSS and control sensors, using the AVL MSS as a benchmark. Figure 3c shows both the MARD and the absolute relative difference (ARD) of each prototype sensor calculated from the data plotted in Fig. 3a. For the control sensor, we calculated a MARD of 22.26 ± 27.17 %, compared to a MARD of 4.54 ± 5.76 % for the IDSS. This confirms the superior performance of the IDSS compared to the unprotected control sensor. A two-sample Kolmogorov-Smirnov test shows that the ARD of the IDSS has a significantly different distribution to that of the control (p = 0.001).
We further investigated the background noise for both the IDSS and the control sensor, which we defined as the standard deviation (SD) of the OptA signal recorded during the flushing periods. Figure 3d shows that the background noise of the unprotected control sensor increased with BC exposure, while the IDSS's background noise stayed low throughout the measurement period. After only 6 exposure cycles, the mean SD of the control sensor was around 12 times larger than that of the IDSS. The IDSS's background noise levels followed a similar trend as the AVL MSS, suggesting that the high SD of the control sensor was caused by the presence of small amounts of BC particles during the clean air periods. The increase in the background noise (compared to a baseline increase only) makes it ineffective to correct the OptA signal with a simple background subtraction. Overall, Fig. 3d shows that the sheath flow greatly improves the performance of the sensor.
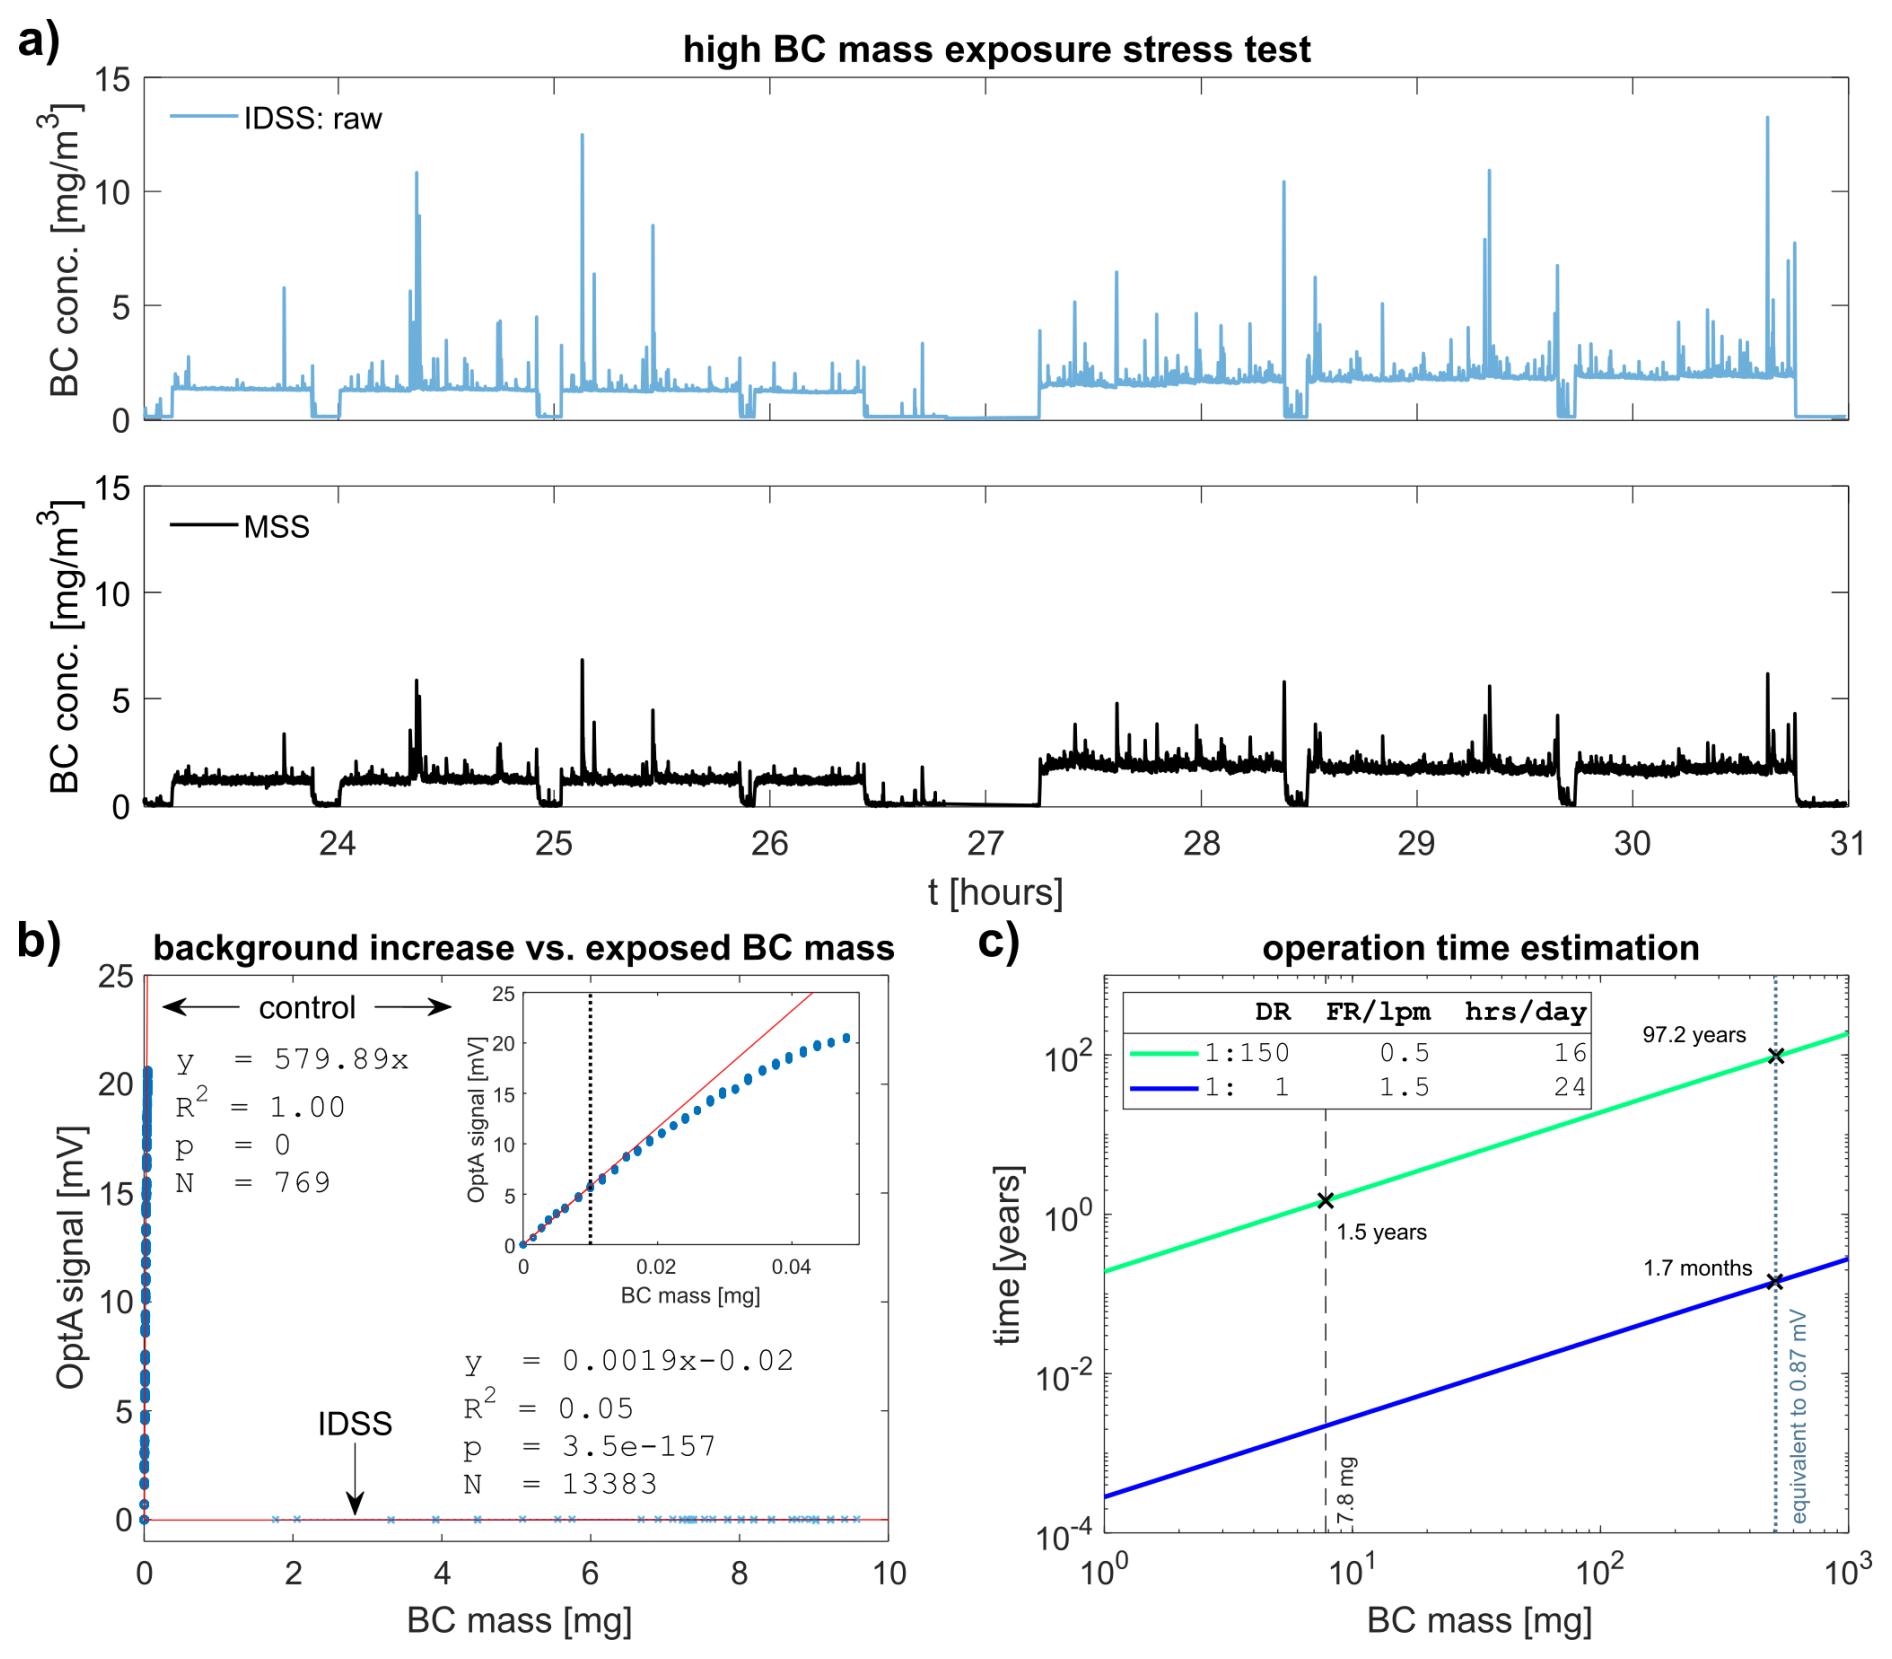
Figure 4Stress testing the illumination-detection separating sensor (IDSS) under high black carbon (BC) mass exposure. (a) The data captured during the last hours of a BC exposure stress test of the IDSS (blue). The AVL Micro Soot Sensor (MSS, red) measured the same sample in parallel and was used as a reference instrument. (b) Background signal values (blue) of the unprotected control from the dataset depicted in Fig. 3a and from the IDSS (a) plotted versus the total BC mass measured by the sensors. Linear fits (red) were applied to quantify the rate [mV mg−1] at which the optoacoustic (OptA) signal increases with BC exposure. (c) Projection of BC mass sampled by the IDSS over time for two use cases using the calculated slope from panel (b), which is 0.0017 mV mg−1. DR: dilution ratio, FR/lpm: flowrate in litres per minute, hrs/day: ship operation hours per day, e.g., the Stena Germanica operates around 16 h d−1.
We conducted a stress test of the IDSS to examine its performance when sampling high quantities of BC over a measurement period. Briefly, we exposed the IDSS to a total of 7.8 mg BC, ∼ 171-times more BC than in the previous experiment. The MSS measured the same BC sample in parallel but was exposed to only 0.52 mg BC due to the 20-fold additional dilution done by the MSS itself. Figure 4a shows raw data from the IDSS converted to BC concentration via the linear relationship presented in Fig. S1b and the BC concentration measured by the MSS in the last few hours of the experiment. The two sensors exhibited similar trends; however, the MSS did not capture the magnitude of the rapidly changing spikes (fast changes in BC concentration) to the same extent as the IDSS. This discrepancy was likely due to the MSS's additional internal dilution system and higher sample volume, which resulted in concentration averaging over time within the MSS measuring cell. After the high BC exposure experiment, we opened the IDSS to visually examine the ellipsoidal cavity, flow inlet and outlet (Fig. S2 in the Supplement). We only observed visible particle deposition on the sample inlet. The rest of the cavity appeared clean, suggesting that the sheath flow successfully encapsulates the sample flow and prevents particle diffusion out of the sample flow.
Figure 4b shows that there is no visible increase in the background signal of the IDSS, even after high BC mass exposure to 7.8 mg BC, whereas the background signal of the control reached 21 mV by the time measurements were terminated, after sampling only 45.7 µg BC. A closer examination of the dataset from the control sensor reveals that the curve starts flattening from 0.01 mg (Fig. 4b inset). This is due to a saturation effect, likely caused either by fewer and fewer BC particles being able to attach as the optical surfaces get covered with previously deposited BC particles or by BC particles attaching in the “shadow” of already deposited particles, i.e., these particles are not excited as the laser excitation is blocked by the previously attached particles. We applied linear fits (red lines) to the data points from the control sensor (up to 0.01 mg BC) and the IDSS (Fig. 4b). We found that the IDSS's trend line had a slope 3 × 10⁵-fold lower than the control's trend line, meaning that the sheath flow increases the lifespan of the IDSS (without cleaning) by a factor of 3 × 10⁵ compared to the control sensor.
To put it into perspective, if we continued with the stress test as shown in Fig. 4a, the IDSS would be able to sample 511 mg of BC over a period of ∼ 2000 h before having the same amount of background signal as the control sensor after the first measurement cycle, i.e., 0.87 mV after 2 min (Fig. 3b inset). We want to note that the R2 value of the fit for the IDSS is relatively low (R2 = 0.05). This indicates that there is no strong linear relationship between the background signals of the IDSS and the increasing amount of BC sampled. Thus, drifts in the instrumental noise over time might have caused a change in the baseline with the actual rate of contamination being even lower. However, we will use the slope of 0.0017 mV mg−1 baseline increase for the operation time estimations of the IDSS in real-world implementation scenarios.
From Fig. 3d, we can estimate that the noise, i.e., the SD, would increase by a factor of ∼ 2 for this baseline increase of 0.87 mV resulting in a 2-fold decrease in sensitivity. For the following operation time estimations, we used the stringent value of 0.87 mV as the limit in background increase before cleaning the sensor is recommended. We will use the background signal increase of 0.87 mV (which corresponds to 511 mg of BC exposure) and the contamination rate of 0.0017 mV mg−1 to extrapolate the maintenance-free operation times to a few use cases to demonstrate the IDSS's capabilities. The mean BC concentration measured on-board the Stena Germanica was 4.5 mg m−3 without dilution (see introduction). Continuous sampling at 2 L min−1 for 24 h d−1 without dilution means that 511 mg of BC will be sampled in 1.7 months (blue line in Fig. 4c). It is important to note that this use case depicts an extreme scenario for long continuous shipping routes. Furthermore, direct exhaust measurement is unlikely to occur without dilution. The time to cleaning or maintaining the sensor can be further prolonged by increasing the dilution ratio (DR) and decreasing the flowrate through the sensor (see methods), while also considering that ships do not necessarily operate 24 h d−1.
With a DR of 1 : 150, a flowrate of 0.5 L min−1 and the same 16 h d−1 operation as the Stena Germanica (green line in Fig. 4c), 511 mg of BC sampled will theoretically be reached in 97.2 years. This means that maintenance and checking of the device can be safely done every 1.5 years (corresponding to the tested 7.8 mg BC exposure) without worrying about decreased performance due to BC contamination, making this sensor a forerunner in low maintenance sensors. We believe this is a manageable cleaning schedule that results in negligible contamination of the optical windows, eliminating the need for baseline corrections.
In this paper, we demonstrate that the IDSS operates with high stability even under extremely high BC particle mass exposure. The high stability of the sensor is achieved by encapsulating the sample flow with a sheath flow, eliminating the diffusion of BC particles out of the sample flow. This makes the sensor a promising candidate for low-maintenance BC monitoring in high emission conditions, particularly shipboard environments.
Particle contamination is a challenge for ambient or exhaust measurements across all BC sensors, not only low-cost sensors. The development of low-maintenance sensors is critical in order to enable the enforcement of BC emission-limiting regulations and to reduce the environmental and health impacts of BC. Particle deposition and contamination, especially on the optical windows, has been reported to increase background noise in OptA gas sensing applications (Miklós et al., 2001) and in the MSS (Schindler et al., 2004). The MSS has successfully reduced the signal increase caused by contamination by integrating a counter flow into the system, directing BC particles away from both optical windows (Schindler et al., 2004). Similarly, we found that preventing BC deposition on the IDSS's optical surfaces almost eliminated the increase in background signal and noise observed in a control sensor with the sheath flow switched off.
The incorporation of sheath flows essentially minimizes our sensor's maintenance requirements, avoiding the need for frequent cleaning or replacement of the optical windows. As a result, our sensor can easily be used without cleaning maintenance for 1.5 years in various applications, such as on-board ships with the appropriate sample flow and DR. The extended maintenance cycle makes the integration of the IDSS in highly contaminative environments suitable and cost effective.
In comparison, currently available sensor systems have much shorter maintenance cycles. For example, aethalometers require frequent filter replacements. During the campaign on-board the Stena Germanica (Haedrich et al., 2025) the filters of the ObservAir had to be replaced daily as indicated by the instrument. Filters for this type of sensors can be expensive, resulting in high maintenance costs for long-term applications in highly contaminative environments. The need to involve trained personnel to perform daily maintenance on the sensor significantly increases these maintenance costs. However, even lab-grade aethalometers used to measure low BC concentrations require relatively frequent maintenance. In a recent study, the filter rolls of aethalometers used to measure only ambient BC concentrations had to be exchanged 2–3 times per year (Mendoza et al., 2024), meaning that they would need to be exchanged even more often when measuring high BC concentrations. Even without filters, current OptAS instruments also have high maintenance requirements. For example, monthly cleaning of the MSS is recommended, even with its integrated counter flow (Schindler et al., 2004). Thus, compared to currently available sensor systems, our sensor has the lowest maintenance requirements. These low maintenance requirements would enable our sensor to be integrated economically in environments with high BC concentrations, for example, on-board a ship without disrupting regular shipboard operations.
In laboratory tests, the burner exhaust sample retained some 40 % relative humidity. Humidity should be controlled at a level that does not risk condensation inside the chamber, as in any optical system. Controlling the sheath flow humidity levels offers additional protection, even when the sample itself is at high humidity.
The noise behaviour as well as the signal for the IDSS and the unprotected control is similar. Therefore, the LOD is expected to be the same for the IDSS with protective flows. For the same reasons a similar linearity is expected. In-depth analysis for small concentrations is planned to investigate whether dilution effects by the protective flows are indeed unsignificant. This would be interesting for applications with small concentrations such as ambient implementations. However, this work presents the performance of the IDSS for high concentrations under contaminative conditions. For the unprotected sensor the performance decreases with increasing exposure while the IDSS demonstrates stable performance meaning a high stability in the NEC is expected.
An Allan deviation analysis has not been performed but is planned for future experiments. Since the oscillation behaviour of the QTF is not impacted by the sample and the protective flows due to the large spatial separation, we do not expect different behaviour for the IDSS in comparison to the unprotected control.
The sensor was calibrated via a linear fit of the signal in mV versus the mass concentration of BC measured by the MSS. For field deployment a standardized calibration protocol is necessary, which needs to be developed in the future. A possible protocol can be realized by measuring nebulized Nigrosin provided by a portable aerosol generator (Drinovec et al., 2022). Another possible solution which also might be more accurate would be a calibration via gas absorption measurements instead of particles (Corbin et al., 2025; Nakayama et al., 2015; Vasilatou et al., 2025).
In this paper, we conservatively predicted that our sensor would be able to operate without maintenance for 1.5 years on ships similar to the Stena Germanica, which operates up to 16 h d−1. Even the longest global shipping routes rarely require more than ∼ 45 d of consecutive travel at a time (Kuroda and Sugimoto, 2022; Notteboom et al., 2020–2024), well within our recommended 1.5-year interval between maintenance periods. Therefore, we expect that our sensor can be applied to all types of ships with no maintenance needs while ships are underway. Also, it is worth noting that the proposed 1.5-year maintenance interval is a conservative recommendation based on a slight increase in OptA background signal. At this level of background signal increase, our sensor still operates well with baseline correction. In fact, our stress test failed to find the upper limit of mass exposure at which baseline correction would no longer be sufficient, suggesting that the sensor could be operated with longer maintenance cycles or on ships with higher BC emissions at lower DRs.
As mentioned before, a significant amount of BC emissions come from brick kilns that have BC concentrations of 10–15 mg m−3 (Haque et al., 2018), around 3 times higher than the average concentration assumed in our estimations for the Stena Germanica. In such environments, our sensor could conservatively operate for at least 0.5 years without maintenance, assuming the same DR and operating hours. Since monsoon season limits the operation period of these brick kilns to half a year, this is an acceptable timeframe for maintenance cycles. Biofuel kitchen stoves in rural China reach BC emission concentrations of 50–80 mg m−3 (Shen et al., 2020), the highest reported BC concentrations emitted globally. However, these stoves operate 2–4 times per day for 10–30 min, with peak BC emissions occurring for only 5–10 min during fuel ignition stages (Shen et al., 2010). Assuming mean concentrations of 30 mg m−3 for 1–2 h d−1, we estimate that our IDSS sensor could be implemented in such environments with a maintenance cycle of 0.8–1.5 years.
For optimal signal capture during field deployment, the resonance frequency of the QTF can be tracked by implementing regular frequency sweeps of the laser modulation. However, a contamination effect of the QTF has not been observed so far. The contamination effect described in this work is caused by BC particles deposited on the optical windows creating an additional signal. To monitor contamination the baseline signal needs to be captured regularly. Therefore, BC-free sampling periods must be enabled in regular intervals e.g. once per day during field deployment.
In summary, we present a novel OptA sensor capable of continuously measuring BC long-term in highly contaminative environments with minimal maintenance requirements. This capability is directly related to the sensor's design, which enables BC measurement without directly exposing the sensitive elements to the sample flow. The acoustic signal is transmitted through an ellipsoidal cavity allowing spatial separation of BC particles and the QTF. Furthermore, integrated protective air flows prevent particle deposition on the laser optical windows. Our sensor's low maintenance requirements make it a promising candidate for widespread implementation on-board ships and in other high-emission locations, where it could be used to monitor BC and facilitate establishment and enforcement of regulations.
The sensor data used for creating the figures can be downloaded from Zenodo (https://doi.org/10.5281/zenodo.17190856, Haedrich and Kousias, 2025).
The supplement related to this article is available online at https://doi.org/10.5194/amt-19-3111-2026-supplement.
All authors contributed to designing the IDSS and devising the study. NK and IR performed the measurements. LH analyzed the data. LH and NK prepared the first version of the manuscript. All edited the manuscript into its final submitted form.
Vasilis Ntziachristos is a founder and equity owner of Maurus OY, sThesis GmbH, Biosense Innovations P.C., Spear UG, and I3 Inc. Leonidas Ntziachristos, Nikolaos Kousias and Ioannis Raptis are founders and equity owners of Maurus OY. Leonidas Ntziachristos, Vasilis Ntziachristos, Uli Stahl, Linda Haedrich, Nikolaos Kousias and Ioannis Raptis are inventors on a pending patent application (Application No. GR2025000576) related to the sensor described in this work.
Publisher's note: Copernicus Publications remains neutral with regard to jurisdictional claims made in the text, published maps, institutional affiliations, or any other geographical representation in this paper. The authors bear the ultimate responsibility for providing appropriate place names. Views expressed in the text are those of the authors and do not necessarily reflect the views of the publisher.
We thank Dr. Serene Lee and Dr. Elisa Bonnin for their attentive reading and improvements of the manuscript.
This project has received funding from the European Union’s Horizon 2020 research and innovation programme under grant agreement No 862811 (RSENSE) and No 814893 (SCIPPER).
This paper was edited by Johannes Schneider and reviewed by two anonymous referees.
Aakko-Saksa, P., Kuittinen, N., Murtonen, T., Koponen, P., Aurela, M., Jarvinen, A., Teinila, K., Saarikoski, S., Barreira, L. M. F., Salo, L., Karjalainen, P., Ortega, I. K., Delhaye, D., Lehtoranta, K., Vesala, H., Jalava, P., Ronkko, T., and Timonen, H.: Suitability of Different Methods for Measuring Black Carbon Emissions from Marine Engines, Atmos.-Basel, 13, 31, https://doi.org/10.3390/atmos13010031, 2022.
Arias, P., Bellouin, N., Coppola, E., Jones, R., Krinner, G., Marotzke, J., Naik, V., Palmer, M., Plattner, G., and Rogelj, J.: Foreword Technical and Preface, Climate Change and Land: an IPCC special report on climate change, desertification, land degradation, sustainable land management, food security, and greenhouse gas fluxes in terrestrial ecosystems, https://www.ipcc.ch/report/ar6/wg2/downloads/report/IPCC_AR6_WGII_TechnicalSummary.pdf (last access: 5 August 2024), 2019.
Backman, J., Schmeisser, L., Virkkula, A., Ogren, J. A., Asmi, E., Starkweather, S., Sharma, S., Eleftheriadis, K., Uttal, T., Jefferson, A., Bergin, M., Makshtas, A., Tunved, P., and Fiebig, M.: On Aethalometer measurement uncertainties and an instrument correction factor for the Arctic, Atmos. Meas. Tech., 10, 5039–5062, https://doi.org/10.5194/amt-10-5039-2017, 2017.
Bond, T. C., Doherty, S. J., Fahey, D. W., Forster, P. M., Berntsen, T., DeAngelo, B. J., Flanner, M. G., Ghan, S., Karcher, B., Koch, D., Kinne, S., Kondo, Y., Quinn, P. K., Sarofim, M. C., Schultz, M. G., Schulz, M., Venkataraman, C., Zhang, H., Zhang, S., Bellouin, N., Guttikunda, S. K., Hopke, P. K., Jacobson, M. Z., Kaiser, J. W., Klimont, Z., Lohmann, U., Schwarz, J. P., Shindell, D., Storelvmo, T., Warren, S. G., and Zender, C. S.: Bounding the role of black carbon in the climate system: A scientific assessment, J. Geophys. Res.-Atmos., 118, 5380–5552, https://doi.org/10.1002/jgrd.50171, 2013.
Brewer, T. L.: Black carbon emissions and regulatory policies in transportation, Energ. Policy, 129, 1047–1055, https://doi.org/10.1016/j.enpol.2019.02.073, 2019.
Chowdhury, S., Pozzer, A., Haines, A., Klingmüller, K., Münzel, T., Paasonen, P., Sharma, A., Venkataraman, C., and Lelieveld, J.: Global health burden of ambient PM and the contribution of anthropogenic black carbon and organic aerosols, Environ. Int., 159, 107020, https://doi.org/10.1016/j.envint.2021.107020, 2022.
Collaud Coen, M., Weingartner, E., Apituley, A., Ceburnis, D., Fierz-Schmidhauser, R., Flentje, H., Henzing, J. S., Jennings, S. G., Moerman, M., Petzold, A., Schmid, O., and Baltensperger, U.: Minimizing light absorption measurement artifacts of the Aethalometer: evaluation of five correction algorithms, Atmos. Meas. Tech., 3, 457–474, https://doi.org/10.5194/amt-3-457-2010, 2010.
Corbin, J. C., Moallemi, A., Poitras, D., Sipkens, T. A., and Norooz Oliaee, J.: Self-calibrating aerosol absorption measurements using co-located TDLAS and tunable-wavelength photothermal interferometry, Aerosol Sci. Tech., 59, 877–891, https://doi.org/10.1080/02786826.2025.2469780, 2025.
Drinovec, L., Močnik, G., Zotter, P., Prévôt, A. S. H., Ruckstuhl, C., Coz, E., Rupakheti, M., Sciare, J., Müller, T., Wiedensohler, A., and Hansen, A. D. A.: The “dual-spot” Aethalometer: an improved measurement of aerosol black carbon with real-time loading compensation, Atmos. Meas. Tech., 8, 1965–1979, https://doi.org/10.5194/amt-8-1965-2015, 2015.
Drinovec, L., Jagodič, U., Pirker, L., Škarabot, M., Kurtjak, M., Vidović, K., Ferrero, L., Visser, B., Röhrbein, J., Weingartner, E., Kalbermatter, D. M., Vasilatou, K., Bühlmann, T., Pascale, C., Müller, T., Wiedensohler, A., and Močnik, G.: A dual-wavelength photothermal aerosol absorption monitor: design, calibration and performance, Atmos. Meas. Tech., 15, 3805–3825, https://doi.org/10.5194/amt-15-3805-2022, 2022.
European Community: Directive 2024/2881 of the European Parliament and of the Council of 23 October 2024 on Ambient Air Quality and Cleaner Air for Europe, OJ L, 2024/2881, 2024.
European Union: Directive 2009/28/EC of the European Parliament and of the Council of 23 April 2009 on the promotion of the use of energy from renewable sources and amending and subsequently repealing Directives 2001/77/EC and 2003/30/EC, Official Journal of the European Union, 5, 2009, 2009.
Giechaskiel, B., Maricq, M., Ntziachristos, L., Dardiotis, C., Wang, X., Axmann, H., Bergmann, A., and Schindler, W.: Review of motor vehicle particulate emissions sampling and measurement: From smoke and filter mass to particle number, J. Aerosol Sci., 67, 48–86, 2014.
Haedrich, L. and Kousias, N.: A low-maintenance optoacoustic sensor for black carbon monitoring, Zenodo [data set], https://doi.org/10.5281/zenodo.17190856, 2025.
Haedrich, L., Kousias, N., Raptis, I., Li, D., Stahl, U., Ntziachristos, L., and Ntziachristos, V.: An optoacoustic black carbon sensor for ship emission monitoring, Aerosol Sci. Tech., 1–13, https://doi.org/10.1080/02786826.2025.2490642, 2025.
Hansen, A. D., Rosen, H., and Novakov, T.: The aethalometer – an instrument for the real-time measurement of optical absorption by aerosol particles, Sci. Total Environ., 36, 191–196, 1984.
Haque, M. I., Nahar, K., Kabir, M. H., and Salam, A.: Particulate black carbon and gaseous emission from brick kilns in Greater Dhaka region, Bangladesh, Air Qual. Atmos. Hlth., 11, 925–935, https://doi.org/10.1007/s11869-018-0596-y, 2018.
International Maritime Organization (IMO): Marine Environment Protection Committee – 62nd session, Agenda Item 4 (MEPC 62/4/3), Prevention of air pollution from ships: Reduction of emissions of Black Carbon from shipping in the Arctic, MEPC 62/4/3, 2011.
International Maritime Organization (IMO): Marine Environment Protection Committee – 68th session, Agenda Item 21 (MEPC 68/21), Report of the Marine Environment Protection Committee on its sixty-eighth session, 2015.
International Maritime Organization (IMO): Sub-committee on pollution prevention and response – 5th session, Agenda Item 24 (PPR5/24), Report to the Marine Environment Protection Committee, 2018.
International Maritime Organization (IMO): Fourth Greenhouse Gas (GHG) Study 2020, 2021.
Janssen, N. A., Gerlofs-Nijland, M. E., Lanki, T., Salonen, R. O., Cassee, F., Hoek, G., Fischer, P., Brunekreef, B., and Krzyzanowski, M.: Health effects of Black Carbon, World Health Organization, Regional Office for Europe, ISBN 9789289002653, 2012.
Kalogridis, A.-C., Vratolis, S., Liakakou, E., Gerasopoulos, E., Mihalopoulos, N., and Eleftheriadis, K.: Assessment of wood burning versus fossil fuel contribution to wintertime black carbon and carbon monoxide concentrations in Athens, Greece, Atmos. Chem. Phys., 18, 10219–10236, https://doi.org/10.5194/acp-18-10219-2018, 2018.
Kang, S. C., Zhang, Y. L., Qian, Y., and Wang, H. L.: A review of black carbon in snow and ice and its impact on the cryosphere, Earth-Sci. Rev., 210, 103346, https://doi.org/10.1016/j.earscirev.2020.103346, 2020.
Kim, J.-H., Kim, S.-W., Ogren, J. A., Sheridan, P. J., Yoon, S.-C., Sharma, S., and Lin, N.-H.: Multiple scattering correction factor estimation for aethalometer aerosol absorption coefficient measurement, Aerosol Sci. Tech., 53, 160–171, 2019.
Kuroda, M. and Sugimoto, Y.: Evaluation of ship performance in terms of shipping route and weather condition, Ocean Eng., 254, 111335, https://doi.org/10.1016/j.oceaneng.2022.111335, 2022.
Lack, D., Lerner, B., Granier, C., Baynard, T., Lovejoy, E., Massoli, P., Ravishankara, A. R., and Williams, E.: Light absorbing carbon emissions from commercial shipping, Geophys. Res. Lett., 35, L13815, https://doi.org/10.1029/2008gl033906, 2008.
Lepisto, T., Kuuluvainen, H., Lintusaari, H., Kuittinen, N., Salo, L., Helin, A., Manninen, H. E., Timonen, H., Jalava, P., Saarikoski, S., Ronkko, T., and Niemi, J. V.: Connection between lung deposited surface area (LDSA) and black carbon (BC) concentrations in road traffic and harbour environments, Atmos. Environ., 272, 118931, https://doi.org/10.1016/j.atmosenv.2021.118931, 2022.
Lin, G. X., Penner, J. E., Flanner, M. G., Sillman, S., Xu, L., and Zhou, C.: Radiative forcing of organic aerosol in the atmosphere and on snow: Effects of SOA and brown carbon, J. Geophys. Res.-Atmos., 119, 7453–7476, https://doi.org/10.1002/2013jd021186, 2014.
Ma, Y. F.: Review of Recent Advances in QEPAS-Based Trace Gas Sensing, Appl. Sci.-Basel, 8, 1822, https://doi.org/10.3390/app8101822, 2018.
Mendoza, D. L., Hill, L. D., Blair, J., and Crosman, E. T.: A Long-Term Comparison between the AethLabs MA350 and Aerosol Magee Scientific AE33 Black Carbon Monitors in the Greater Salt Lake City Metropolitan Area, Sensors-Basel, 24, 965, https://doi.org/10.3390/s24030965, 2024.
Michelsen, H. A., Schulz, C., Smallwood, G. J., and Will, S.: Laser-induced incandescence: Particulate diagnostics for combustion, atmospheric, and industrial applications, Prog. Energ. Combust., 51, 2–48, https://doi.org/10.1016/j.pecs.2015.07.001, 2015.
Miklós, A., Hess, P., and Bozóki, Z.: Application of acoustic resonators in photoacoustic trace gas analysis and metrology, Rev. Sci. Instrum., 72, 1937–1955, https://doi.org/10.1063/1.1353198, 2001.
Nakayama, T., Suzuki, H., Kagamitani, S., Ikeda, Y., Uchiyama, A., and Matsumi, Y.: Characterization of a three wavelength photoacoustic soot spectrometer (PASS-3) and a photoacoustic extinctiometer (PAX), J. Meteorol. Soc. Jpn. Ser. II, 93, 285–308, https://doi.org/10.2151/jmsj.2015-016, 2015.
Notteboom, T., Pallis, A., and Rodrigue, J.-P.: Routing Options between Shanghai, Rotterdam and New York, https://porteconomicsmanagement.org/pemp/contents/part1/interoceanic-passages/routing-options-shanghai-rotterdam/ (last access: 5 August 2024), 2020–2024.
Ntziachristos, L., Kousias, N., Ntziachristos, V., Kontses, A., and Stylogiannis, A.: Optoacoustic Fluid Sensing Apparatus, US Patent App. 18/251,275, 2021.
Patimisco, P., Scamarcio, G., Tittel, F. K., and Spagnolo, V.: Quartz-Enhanced Photoacoustic Spectroscopy: A Review, Sensors-Basel, 14, 6165–6206, https://doi.org/10.3390/s140406165, 2014.
Poulsen, A. H., Hvidtfeldt, U. A., Sorensen, M., Puett, R., Ketzel, M., Brandt, J., Christensen, J. H., Geels, C., and Raaschou-Nielsen, O.: Components of particulate matter air-pollution and brain tumors, Environ. Int., 144, 106046, https://doi.org/10.1016/j.envint.2020.106046, 2020.
Schindler, W., Haisch, C., Beck, H. A., Niessner, R., Jacob, E., and Rothe, D.: A photoacoustic sensor system for time resolved quantification of diesel soot emissions, SAE Transactions, 483–490, https://doi.org/10.4271/2004-01-0968, 2004.
Shen, G., Yang, Y., Wang, W., Tao, S., Zhu, C., Min, Y., Xue, M., Ding, J., Wang, B., and Wang, R.: Emission factors of particulate matter and elemental carbon for crop residues and coals burned in typical household stoves in China, Environ. Sci. Technol., 44, 7157–7162, 2010.
Shen, X., Wang, P., Zhang, X., Cao, X., Shi, Y., Li, X., Yao, X., and Yao, Z.: Real-time measurements of black carbon and other pollutant emissions from residential biofuel stoves in rural China, Sci. Total Environ., 727, 138649, https://doi.org/10.1016/j.scitotenv.2020.138649, 2020.
Stylogiannis, A., Kousias, N., Kontses, A., Ntziachristos, L., and Ntziachristos, V.: A Low-Cost Optoacoustic Sensor for Environmental Monitoring, Sensors-Basel, 21, 1379, https://doi.org/10.3390/s21041379, 2021.
Timonen, H., Karjalainen, P., Aalto, P., Saarikoski, S., Mylläri, F., Karvosenoja, N., Jalava, P., Asmi, E., Aakko-Saksa, P., Saukkonen, N., Laine, T., Saarnio, K., Niemelä, N., Enroth, J., Väkevä, M., Oyola, P., Pagels, J., Ntziachristos, L., Cordero, R., Kuittinen, N., Niemi, J. V., and Rönkkö, T.: Adaptation of Black Carbon Footprint Concept Would Accelerate Mitigation of Global Warming, Environ. Sci. Technol., 53, 12153–12155, https://doi.org/10.1021/acs.est.9b05586, 2019.
Vasilatou, K., Iida, K., Kazemimanesh, M., Olfert, J., Sakurai, H., Sipkens, T. A., and Smallwood, G. J.: Aerosol physical characterization: A review on the current state of aerosol documentary standards and calibration strategies, J. Aerosol Sci., 183, 106483, https://doi.org/10.1016/j.jaerosci.2024.106483, 2025.
Xu, H. R., Ren, Y. A., Zhang, W. X., Meng, W. J., Yun, X., Yu, X. Y., Li, J., Zhang, Y. Z., Shen, G. F., Ma, J. M., Li, B. G., Cheng, H. F., Wang, X. L., Wan, Y., and Tao, S.: Updated Global Black Carbon Emissions from 1960 to 2017: Improvements, Trends, and Drivers, Environ. Sci. Technol., 55, 7869–7879, https://doi.org/10.1021/acs.est.1c03117, 2021.