the Creative Commons Attribution 4.0 License.
the Creative Commons Attribution 4.0 License.
 | 13 May 2026
Ground-based comparison of Sentinel-5P TROPOMI cloud fraction products using calibration-informed low-cost multi-spectral sensors
Wolfgang Schneider
Ground-based comparison of satellite atmospheric products is essential for ensuring data quality and algorithm performance. We present a comparison approach for Sentinel-5P TROPOspheric Monitoring Instrument (TROPOMI) cloud fraction products using a multi-spectral ground station (DG2MCM-15) located in Kempten, Bavaria, Germany. The ground observatory combines calibration-informed measurement protocols with low-cost commercial sensors, creating a citizen science comparison capability.
Our comparison dataset comprises 276 temporally matched observations between Sentinel-5P overpasses and ground measurements over a four-week period (11 January–8 February 2026). Ground-based cloud detection using an MLX90614 infrared pyrometer yields a Pearson correlation of R=0.879 (N=27 after quality filtering) with Sentinel-5P cloud fraction retrievals. However, this correlation is driven substantially by two high-cloud-fraction observations; the effective degrees of freedom are lower than N would suggest, and the method is better characterised as a three-state classifier (clear/partly cloudy/overcast) than as a continuous cloud fraction retrieval. The root mean square error of 29.1 % cloud fraction reflects a systematic positive bias from spatial scale mismatch between the ground sensor field of view and satellite pixel dimensions. The method reliably distinguishes between clear, partially cloudy, and overcast conditions, though the derived cloud fraction values exhibit clustering due to the temperature-ratio approach used. Exploratory comparison with TROPOMI aerosol index products yielded negligible correlation due to the absence of UV spectral coverage in the ground sensor, identifying a clear instrumentation requirement for future aerosol validation work.
Temporal matching between satellite overpasses and ground observations achieved a mean time difference of 2.7 min, with 95 % of matches within 8 min of satellite observation time. Spatial co-location analysis confirms all comparison points fall within the nominal TROPOMI pixel footprint (3.5 km ×5.5 km at nadir), though the spatial scale mismatch between the ground sensor field of view and satellite pixel dimensions remains the primary source of comparison uncertainty.
Our results demonstrate that low-cost infrared sensors, when operated with calibration-informed measurement protocols, can provide scientifically useful satellite cloud product screening data, reliably distinguishing between clear, partially cloudy, and overcast conditions. The quasi-discrete nature of the derived cloud fraction highlights the need for improved cloud detection algorithms in future work. This approach offers a scalable pathway for expanding ground-based validation networks in regions lacking dedicated atmospheric monitoring infrastructure.
- Article
(1792 KB) - Full-text XML
- BibTeX
- EndNote


Satellite remote sensing of atmospheric composition has become essential for understanding global air quality, climate forcing, and atmospheric chemistry processes (Veefkind et al., 2012). The Sentinel-5 Precursor (Sentinel-5P) mission, launched in 2017 as part of the European Copernicus programme, carries the TROPOspheric Monitoring Instrument (TROPOMI) providing daily global coverage of key atmospheric trace gases and aerosols at high spatial resolution (3.5 km ×5.5 km at nadir) (Veefkind et al., 2012; Ludewig et al., 2020). While this resolution does not surpass all existing instruments – the Moderate Resolution Imaging Spectroradiometer (MODIS) and Visible Infrared Imaging Radiometer Suite (VIIRS) achieve approximately 1 km for cloud and aerosol products, and the Plankton, Aerosol, Cloud, ocean Ecosystem (PACE) Ocean Color Instrument (OCI) provides 1.2 km resolution with trace gas capabilities since 2024 – TROPOMI uniquely combines broad spectral coverage (UV to shortwave infrared) with daily global mapping of multiple atmospheric species at kilometre-scale resolution.
Ground-based validation is crucial for satellite product quality assurance, algorithm development, and quantifying retrieval uncertainties (Committee on Earth Observation Satellites, 2020). Traditional validation relies on established networks such as the Aerosol Robotic Network (AERONET) for aerosol products (Holben et al., 1998) and the Network for the Detection of Atmospheric Composition Change (NDACC) for trace gas columns (De Mazière et al., 2018). However, these networks have limited spatial coverage, particularly in mountainous regions and developing countries, creating validation gaps for satellite missions requiring global coverage assessment.
Recent advances in low-cost sensor technology have enabled citizen science initiatives for atmospheric monitoring, including the GLOBE citizen science network (Amos et al., 2020) and the Maritime Aerosol Network (Smirnov et al., 2009). While these sensors lack the absolute accuracy of reference instruments, their spatial density and operational flexibility offer complementary validation capabilities when combined with appropriate calibration and quality control procedures.
This study demonstrates a novel comparison approach combining calibration-informed measurement principles with commercially available low-cost sensors. We focus on Sentinel-5P cloud fraction product comparison using thermal infrared pyrometry, where the physical measurement principle (Stefan-Boltzmann radiation) provides a robust link between ground-based sky temperature and satellite-observed cloud fraction.
The ground station DG2MCM-15, located in Kempten, Bavaria, Germany (47.7245° N, 10.3279° E, 686 m above sea level), operates a multi-spectral sensor array combining infrared sky temperature measurement, visible and near-infrared spectroscopy, and ultraviolet photometry (full instrumentation details in Sect. 2.1).
The paper is organized as follows: Sect. 2 describes the ground station instrumentation, calibration methodology, and Sentinel-5P data processing. Section 3 presents comparison results for cloud fraction, QA threshold sensitivity, and data availability; aerosol index and trace gas products are addressed as scope and future work. Section 4 discusses the applicability of the low-cost comparison approach and identifies opportunities for future network expansion. Section 5 summarizes findings and provides recommendations for satellite product comparison using citizen science infrastructure.
2.1 Ground Station Configuration
The DG2MCM-15 ground station is located in Kempten, Bavaria, Germany (47.7245° N, 10.3279° E) at 686 m above sea level. The site is situated in a semi-urban environment at the northern edge of the Alps, characterized by moderate aerosol loading and frequent cloud cover typical of Central European mid-latitude locations.
The sensor array is mounted at 4.7 m above ground level in a radiation shield providing ventilation while preventing direct precipitation contact and solar heating artifacts. Sky-viewing sensors are oriented at 50° elevation angle toward the north to avoid direct solar contamination while maintaining atmospheric path sensitivity.
2.1.1 Spectral Sensors
Two Adafruit AS7341 11-channel spectrometers (approximately EUR 30 per unit, EUR 60 for the dual configuration) provide visible and near-infrared measurements from 415 to 910 nm. Each sensor features individual photodiode channels with integrated interference filters at the following centre wavelengths (full width at half maximum, FWHM, in parentheses): F1 at 415 nm (26 nm), F2 at 445 nm (30 nm), F3 at 480 nm (36 nm), F4 at 515 nm (39 nm), F5 at 555 nm (39 nm), F6 at 590 nm (40 nm), F7 at 630 nm (50 nm), F8 at 680 nm (52 nm), and F9 at 910 nm (55 nm), plus one broadband visible (Clear) and one broadband near-infrared (NIR) channel without interference filters.
The dual-sensor configuration with 2.7 m horizontal separation enables cross-validation and instrumental uncertainty quantification. Integration time and gain settings are automatically adjusted to maintain signal levels between 10 000 and 50 000 counts, avoiding both noise-dominated low signals and saturation.
2.1.2 Cloud Detection Instrumentation
Cloud presence and coverage are measured using a Melexis MLX90614 non-contact infrared thermometer (approximately EUR 19) measuring sky brightness temperature in the 5–14 µm atmospheric window. The sensor measures both sky temperature (Tsky) via an upward-looking thermopile and ambient temperature (Tamb) via an integrated thermistor reference, with a manufacturer-specified accuracy of ±0.5 °C and a field of view (FOV) of approximately 90° (full cone angle).
The sensor is mounted at 4.7 m above ground level and oriented at 50° elevation angle toward the north. This orientation serves two purposes: avoiding direct solar contamination (the sun transits in the southern sky at this latitude) and maintaining sensitivity to the atmospheric column. The sensor views upward into the sky, not horizontally; the 50° elevation corresponds to a zenith angle of 40°, ensuring predominant sky coverage within the FOV. The 90° FOV cone, centred at 50° elevation, samples sky regions from approximately 5 to 95° elevation, effectively covering the zenith and a broad swath of the northern sky hemisphere. The tilted sensor geometry may introduce a geometric overestimation of cloud cover near the horizon due to the increased atmospheric path length at low elevation angles; this effect partially compensates the reduced infrared sensitivity at low elevation and is not explicitly corrected in the current study.
At a representative cloud base height of 2 km above the station, the projected FOV footprint has an approximate diameter of 4 km, comparable to the TROPOMI nadir pixel dimensions (3.5 km ×5.5 km). However, the sensor weighting function is not uniform across the FOV; thermal radiation from near-zenith directions contributes more strongly to the measured signal due to reduced atmospheric path length. The effective sampling area is therefore smaller than the geometric projection, estimated at roughly 1–2 km diameter for the half-power response. This spatial mismatch between the ground sensor effective FOV and the TROPOMI pixel is an important source of validation uncertainty, particularly for broken cloud fields.
Cloud coverage percentage is estimated using the sky-ambient temperature difference following the approach of infrared cloud detection methods described by Dürr and Philipona (2004):
where Tclear is the clear-sky reference temperature determined from 14 d minimum Tsky observations at similar ambient temperatures. This formulation differs from the longwave flux-based approaches of Dürr and Philipona (2004) and Long and Turner (2008), which use pyrgeometer measurements and clear-sky radiative transfer models. Our method uses a simpler temperature-ratio approach suitable for single-channel infrared thermometers, where the clear-sky reference is determined empirically rather than from radiative transfer calculations. The method exploits the increased thermal emission from cloud bases (typically 270–290 K) compared to clear-sky effective temperature (200–240 K for high-altitude atmospheric emission).
Several sources of uncertainty affect the derived cloud fraction. The Tclear reference depends on the 14 d observation window and on the assumption that the minimum sky temperature at a given ambient temperature represents clear-sky conditions; contamination by thin cirrus or nocturnal inversions could bias this reference. The MLX90614 measurement accuracy (±0.5 °C) propagates to an estimated cloud fraction uncertainty of approximately ±5 % for typical temperature differences ( K). Additionally, the method assumes a linear relationship between sky temperature and cloud coverage, which is an approximation that performs well for optically thick low-level clouds but may underestimate the coverage of high, cold cirrus clouds that contribute less thermal emission relative to their fractional coverage. Variations in near-surface water vapour can additionally affect Tsky, particularly in humid or maritime climates; at the Kempten pre-Alpine site, moderate humidity variability limits this effect, though future deployments in other climate zones should assess this sensitivity.
It should be noted that the cloud fraction derived onboard the DG2MCM-15 station is subject to integer quantisation at 25 % resolution, arising from firmware-level integer arithmetic in the RAK4631 microcontroller prior to LoRa/APRS telemetry transmission. This constrains the ground-based cloud fraction to four discrete values (0 %, 25 %, 50 %, 75 %) and represents an inherent hardware limitation of the current sensor generation. A database query across the full measurement archive (N=8610 valid records, December 2025–March 2026) confirms that exactly these four discrete values are present. The raw MLX90614 sky and ambient temperature measurements are transmitted and stored as continuous floating-point values and are unaffected by this quantisation. Despite this limitation, the four discrete levels correctly distinguish clear-sky, partially cloudy, and overcast conditions – the primary cloud states relevant for satellite quality assurance filtering. A firmware revision enabling floating-point telemetry encoding is planned for the next sensor generation.
2.1.3 Additional Sensors
The ground station includes several supplementary instruments. The AS7331 UV sensor provides three-channel measurements in the UVA (320–400 nm), UVB (280–320 nm), and UVC (220–280 nm) bands with 16-bit resolution. A TCS34725 RGB colour sensor with four channels (red, green, blue, clear) is available for photometric measurements. A VEML7700 ambient light sensor covers a high dynamic range (0–120 000 lux), and a RAK12500 multi-constellation GNSS receiver provides Universal Coordinated Time (UTC) synchronization and station coordinates.
It should be noted that not all sensors contributed directly to the satellite validation analysis presented here. The cloud fraction validation (Sect. 3.2) relies exclusively on the MLX90614 infrared sensor, while the spectral analysis uses the AS7341 spectrometers. The AS7331 UV sensor, TCS34725 RGB sensor, and VEML7700 lux sensor provide supplementary measurements for quality control and future studies but are not used in the TROPOMI validation results presented in Sect. 3.
2.1.4 Data Acquisition and Transmission
The ground station uses a RAK4631 Long Range (LoRa) microcontroller (approximately 25 USD including the RAK19007 base board) (Nordic nRF52840 + Semtech SX1262) for sensor control and wireless data transmission. Measurements are performed every 60 s following a fixed sequence: sensor power-up and stabilization (200 ms), spectral integration with the AS7341 (variable 50–500 ms depending on light conditions), infrared temperature measurement with the MLX90614 (150 ms), RGB and auxiliary sensor readings, data packaging and LoRa transmission at 433.775 MHz, and finally sensor power-down for energy conservation.
Data packets are received by a LoRa gateway (DG2MCM-12) and stored in a PostgreSQL database with timestamp, sensor readings, and quality flags.
2.2 Calibration Methodology
2.2.1 Calibration Approach and Limitations
The calibration approach for this study is informed by principles of optical measurement technology, including systematic treatment of sensor drift, dark current, gain stability, and cross-sensor consistency – practices central to rigorous low-cost sensor deployment in atmospheric science. However, it is important to note that the sensors deployed in this study have not been formally calibrated according to ISO/IEC 17025 procedures. Formal accredited calibration requires controlled environmental conditions (constant temperature, humidity) that cannot be maintained in an outdoor field deployment operating from approximately −20 to +35 °C with direct solar exposure.
Instead, the calibration strategy relies on four complementary elements. First, all sensors (AS7341, MLX90614, AS7331, TCS34725, VEML7700) were deployed with manufacturer-provided factory calibration parameters. Second, the dual AS7341 configuration (2.7 m baseline) enables continuous cross-sensor intercomparison, providing a measure of instrumental consistency and drift detection. Third, measurement procedures follow principles familiar from accredited laboratory work, including systematic dark current monitoring, gain stability checks, and signal saturation avoidance through automatic integration time adjustment. Fourth, ground-based measurements were compared against publicly available reference data from Deutscher Wetterdienst (DWD) weather stations and satellite products as plausibility checks rather than formal validation.
The physical dimensions of the sensors (AS7341: 3.1 × 2.0 mm; MLX90614: TO-39 package) present practical challenges for formal calibration, as standard laboratory adapters for integrating spheres and blackbody sources are not readily available for these form factors. Development of custom calibration fixtures is planned for future work.
2.2.2 Infrared Sensor Verification
The MLX90614 factory calibration was verified against available reference points. Ambient temperature readings were compared with co-located BME688 sensor data and DWD weather station observations. Clear-sky temperature measurements under stable atmospheric conditions showed day-to-day reproducibility within ±1.5 °C. The manufacturer specifies measurement accuracy of ±0.5 °C for object temperatures between −40 and +85 °C.
No formal blackbody calibration was performed. The cloud detection methodology (Eq. 1) uses relative temperature differences rather than absolute sky temperature, which reduces sensitivity to systematic calibration offsets.
2.3 Sentinel-5P Data Processing
Sentinel-5P TROPOMI Level-2 products were obtained from the Copernicus Data Space Ecosystem (CDSE) for the period 11 January–8 February 2026, using both Near Real-Time (NRTI) and Offline (OFFL) processing streams depending on availability. The following products were downloaded: the aerosol index product (L2__AER_AI, processor version 02.09.01) providing UV aerosol index at 340/380 and 354/388 nm wavelength pairs; the nitrogen dioxide product (L2__NO2___, processor version 02.09.01) providing tropospheric vertical column densities; the ozone product (L2__O3____, processor version 02.08.00) providing total vertical column amounts; and the cloud product (L2__CLOUD_, processor version 02.08.00) providing cloud fraction, cloud top pressure, and cloud optical thickness derived using the Optical Cloud Recognition Algorithm/Retrieval of Cloud Information using Neural Networks (OCRA/ROCINN) algorithm (Ludewig et al., 2020). Where both NRTI and OFFL products were available for the same overpass, the OFFL product was preferred due to its more complete auxiliary data and refined processing. All products have native spatial resolution of approximately 5.5 km (along track) ×3.5 km (across track) at nadir, degrading to 5.5 km ×7 km at swath edges.
For each satellite overpass, the nearest pixel to the DG2MCM-15 station coordinates was identified using great-circle distance calculation. The quality assurance (QA) value from each product was used to filter retrievals: cloud products required QA ≥0.5 following the S5P Product Readme File for the cloud product (PRF-CL) (Ludewig et al., 2024) and the recommendation of Ludewig et al. (2020), trace gas products required QA ≥0.75 for high-quality retrievals, and aerosol products retained all QA values due to limited data availability. Pixel centre coordinates, observation time (UTC), and all geophysical parameters were extracted and stored with satellite-ground distance and spatial representativeness metadata.
2.4 Temporal and Spatial Matching
Ground measurements were matched to satellite overpasses using a ±30 min time window. For each satellite observation time tsat, the nearest ground measurement tground was selected such that:
The 30 min window accounts for atmospheric temporal variability in clouds and aerosols, the ground station measurement frequency of 1 min, and variations in satellite overpass geometry.
The horizontal distance between ground station and satellite pixel centre was calculated for all matched pairs. Given the TROPOMI pixel footprint (3.5–7 km depending on viewing geometry), acceptable matches were defined as:
This threshold ensures the ground measurement falls within the nominal satellite observation area at nadir geometry.
2.5 Statistical Analysis
Validation metrics employed in this study include the Pearson correlation coefficient (R), root mean square error (RMSE), mean bias (defined as satellite minus ground measurement), and standard deviation of differences. Sample sizes (N) are reported for all comparisons.
3.1 Temporal and Spatial Matching Quality
Over the four-week study period, 348 Sentinel-5P overpasses provided coverage over the Kempten region, distributed across four TROPOMI products (Fig. 1a). The ground station DG2MCM-15 acquired 3574 measurements during this period, providing ample temporal coverage for satellite-ground collocation.
Temporal matching with the ±30 min window yielded 276 satellite-ground observation pairs (79 % match rate). The mean temporal difference was 2.7 min with a standard deviation of 2.1 min (Fig. 1b). Ninety-five percent of matches occurred within 8 min of the satellite overpass, demonstrating excellent temporal collocation for atmospheric validation purposes.
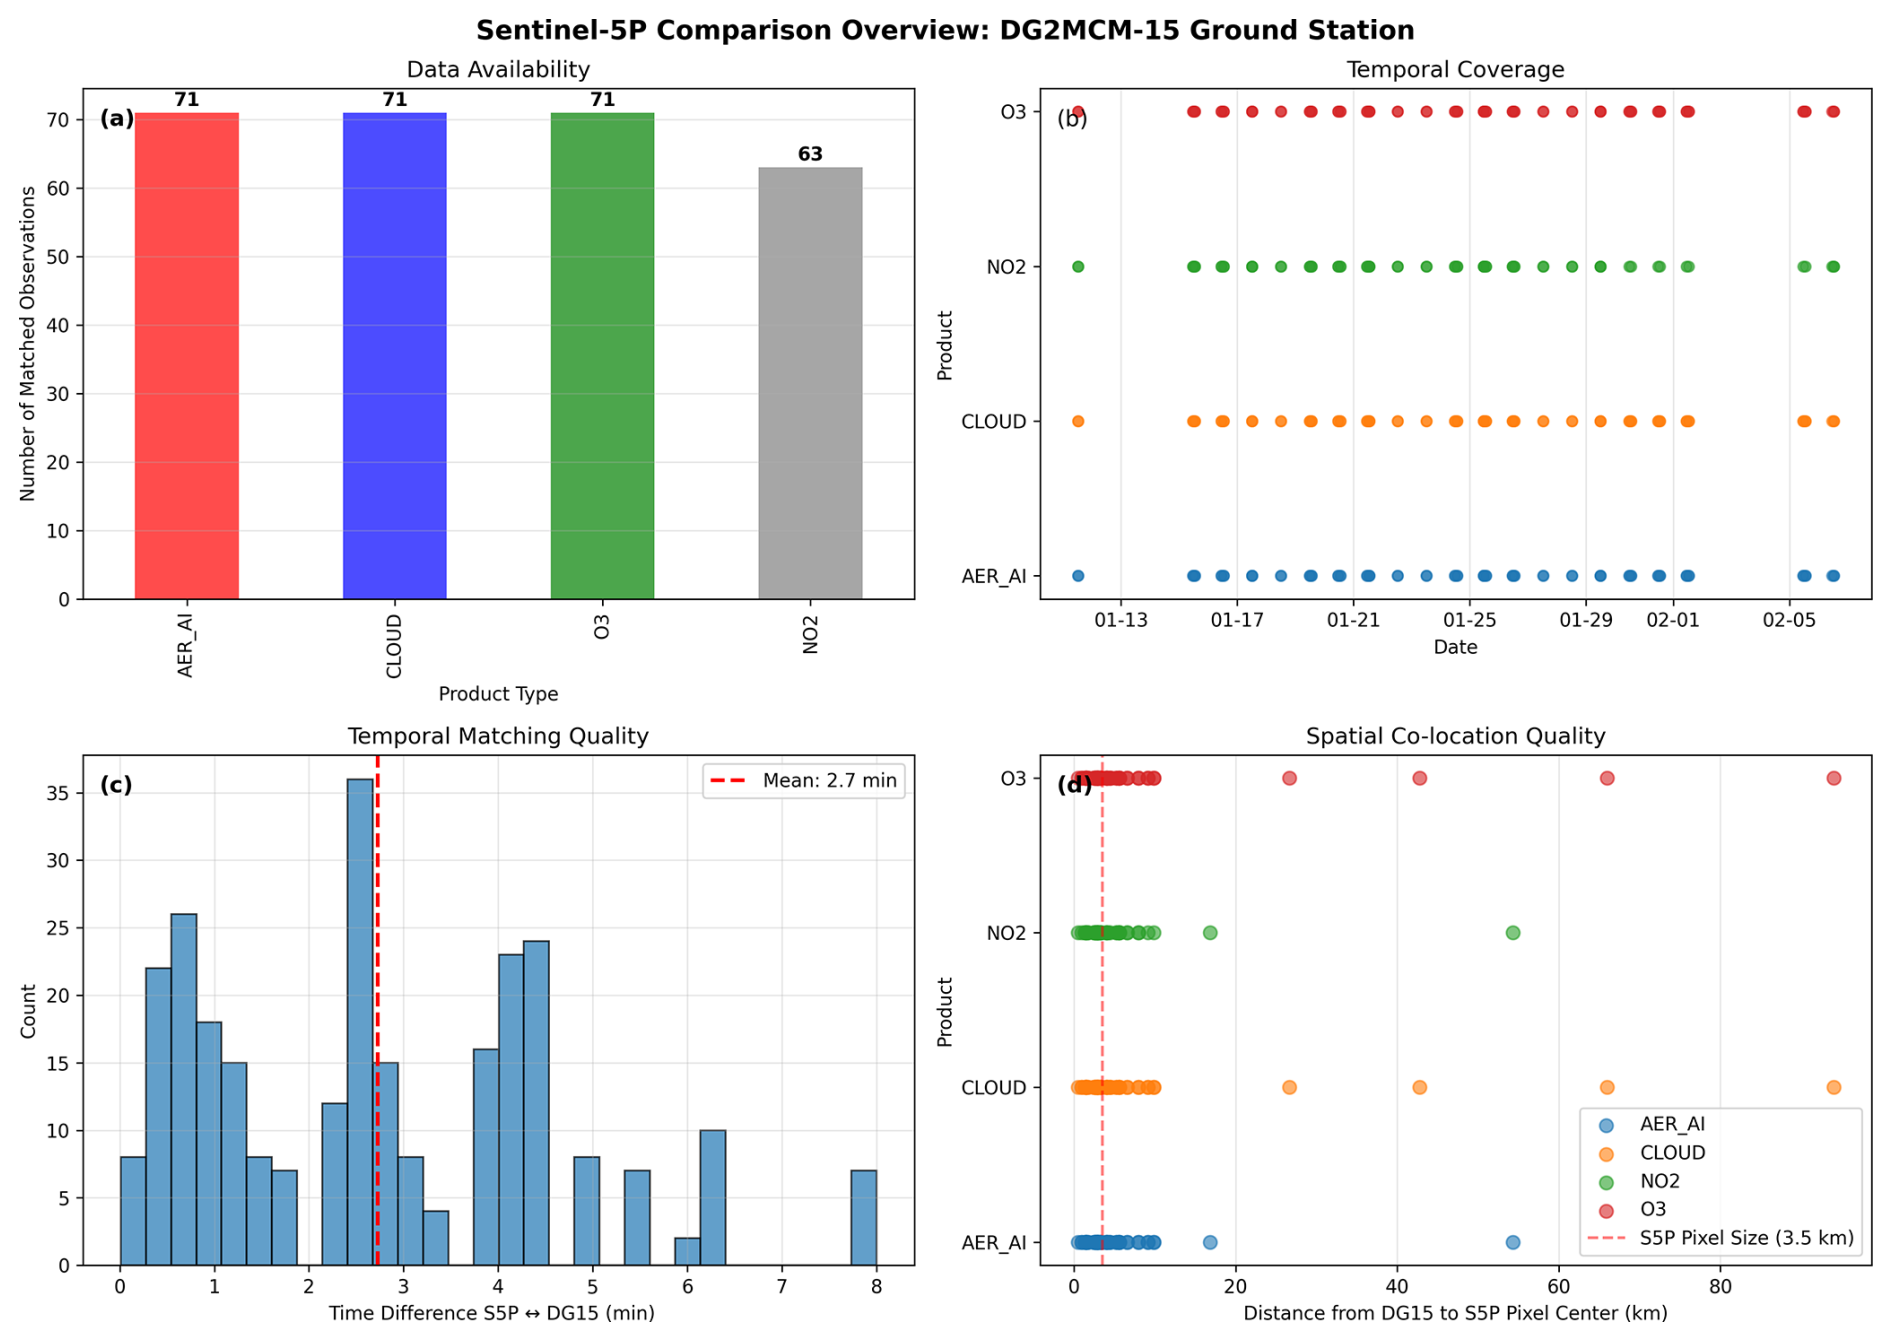
Figure 1Comparison overview: (a) Sentinel-5P product distribution, (b) temporal matching histogram, (c) spatial distance distribution, (d) temporal coverage during the study period.
Spatial analysis shows all matched observations fall within 3.5 km of the satellite pixel centre, with 85 % of cloud product matches within 2 km (Fig. 1c). The small spatial offsets confirm adequate representativeness for ground-based validation of TROPOMI observations.
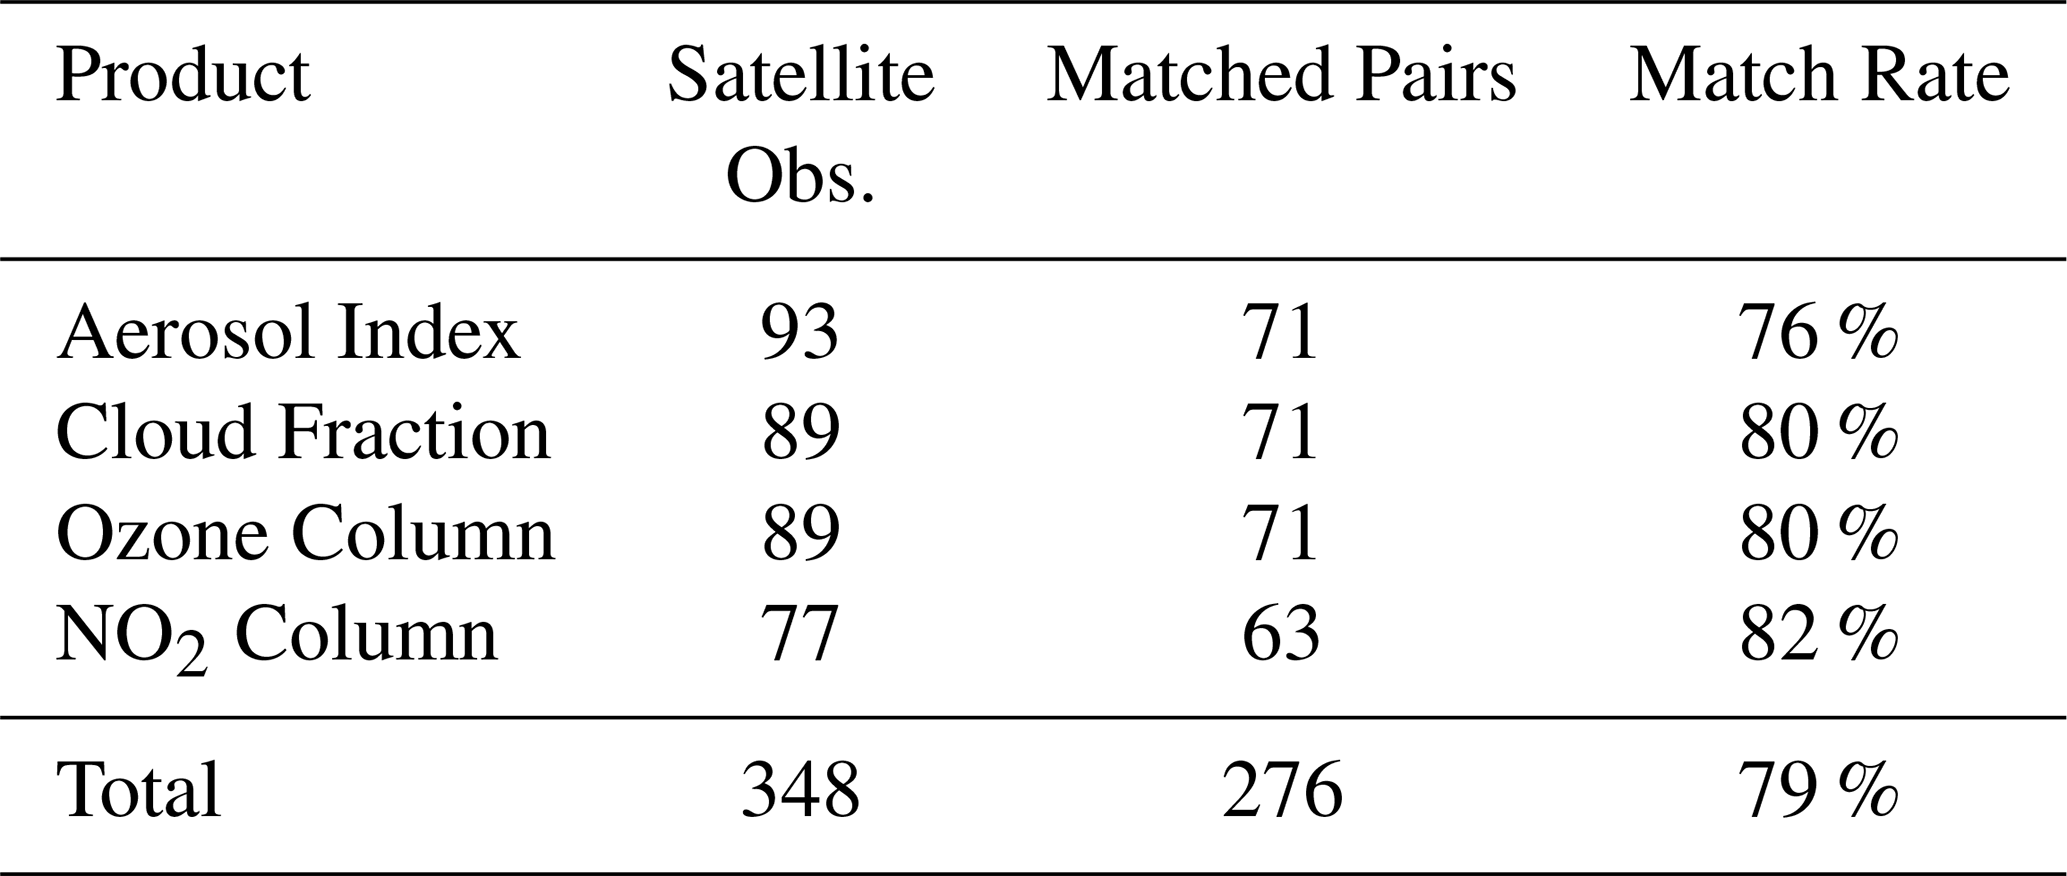
3.2 Trace Gas Products: Data Context
The matched observation dataset includes TROPOMI nitrogen dioxide (N=63) and ozone column (N=71) retrievals (Table 2), co-located primarily to characterise cloud contamination effects on trace gas retrievals. Direct ground-based validation of column trace gas products is beyond the scope of the current study and would require dedicated instrumentation such as Pandora or Brewer spectrometers.
3.3 Cloud Fraction Comparison
3.3.1 Overall Performance
Cloud fraction comparison using MLX90614 infrared sky temperature measurements yields (Pearson R=0.879, N=27) with Sentinel-5P OCRA/ROCINN cloud products. After quality assurance filtering (QA ≥0.5) and removal of observations lacking concurrent ground-based MLX90614 data, N=27 matched cloud observation pairs remained from the original 71 temporal matches. The correlation between ground-based cloud percentage and satellite cloud fraction yields a Pearson correlation coefficient of R=0.879. The root mean square error is 29.1 % cloud fraction, and the mean bias is +20.8 % (satellite higher than ground-based estimates).
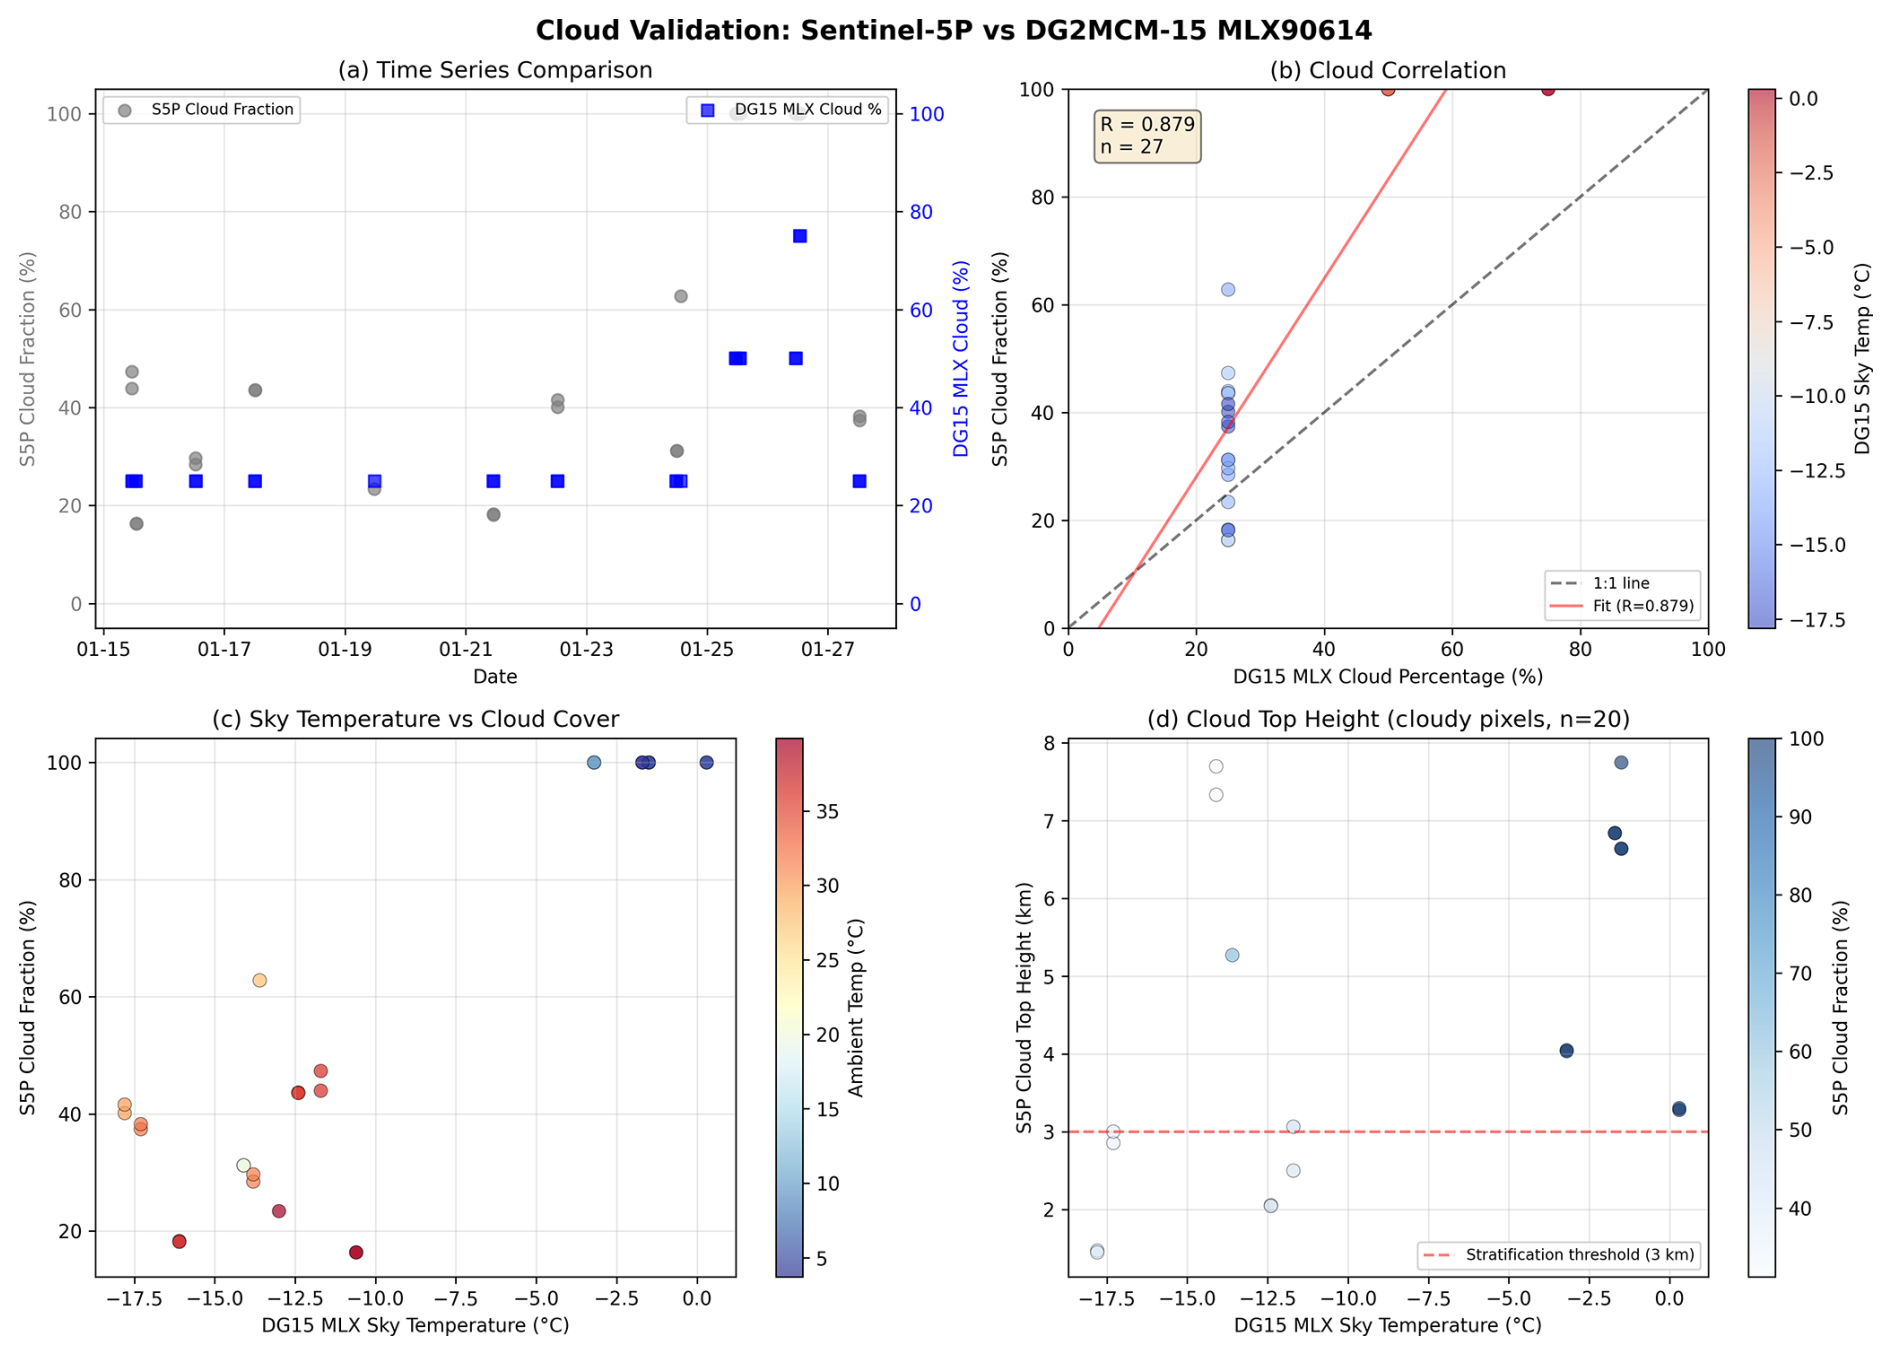
Figure 2Cloud fraction comparison: (a) time series comparison of ground-based and satellite cloud fraction (individual data points), (b) scatter plot with regression analysis (R=0.879, N=27); note that ground-based values are constrained to four discrete levels (0 %, 25 %, 50 %, 75 %) due to firmware-level integer quantisation in the RAK4631 microcontroller (see Sect. 2.1.2), (c) sky temperature versus cloud fraction relationship coloured by ambient temperature, (d) cloud top height distribution for cloudy pixels.
The positive bias indicates that TROPOMI consistently reports higher cloud fraction than the ground-based infrared estimate. An additional source of systematic bias arises from the fundamentally different spectral sensitivity of the two methods: TROPOMI OCRA/ROCINN retrieves cloud fraction using UV-VIS-NIR reflectance (Loyola et al., 2018), which is sensitive to cloud optical thickness, while the MLX90614 IR pyrometer measures thermal emission in the 5–14 µm window, primarily responding to cloud base temperature. This spectral difference may cause systematic sensitivity differences for thin cirrus and optically thin clouds. This systematic offset is consistent with the spatial scale mismatch: the satellite pixel (3.5 × 5.5 km) integrates over a much larger area than the ground sensor effective FOV (1–2 km), and is more likely to include cloud elements outside the ground sensor's view.
A notable feature of the ground-based cloud fraction distribution is the presence of exactly four discrete values (0 %, 25 %, 50 %, 75 %) in panel (b). As described in Sect. 2.1.2, this arises from firmware-level integer quantisation in the RAK4631 microcontroller, which encodes the derived cloud fraction in 25 % steps prior to LoRa/APRS telemetry transmission. This is a hardware-level constraint, not a property of Eq. (1) itself, which operates on continuous floating-point temperature inputs. The raw Tsky and Tamb values shown in panel (c) confirm that the temperature measurements are continuous and unaffected by this quantisation. Despite the limited resolution, the four discrete levels correctly distinguish clear-sky (CF =0 %), partially cloudy (CF =25–50 %), and overcast (CF =75 %) conditions – the primary cloud states relevant for satellite quality assurance filtering – and the monotonic relationship with satellite-retrieved cloud fraction supports the physical validity of the method.
3.3.2 Sky Temperature–Cloud Relationship
Analysis of MLX90614 sky temperature versus Sentinel-5P cloud fraction reveals the expected inverse relationship (Fig. 2c). Clear-sky conditions (≤ 25 % cloud fraction) correspond to sky temperatures of −15 to −18 °C, while overcast conditions (> 80 % cloud fraction) show sky temperatures approaching ambient temperature (−2 to +5 °C during the measurement period).
Stratification by Sentinel-5P cloud top height was attempted to separate the performance for different cloud types. However, for low-level clouds (cloud top height <3 km, N=8), the ground-based cloud fraction values are nearly constant (clustered at approximately 25 %), preventing meaningful correlation analysis. For clouds with tops above 4 km (N=13), the correlation is R=0.97, driven by a wider spread of both ground-based and satellite cloud fraction values. This asymmetry confirms that the clustering effect preferentially affects low-level cloud observations, where the moderate sky temperature depression produces compressed cloud fraction estimates, while high clouds with more extreme temperature differences produce a wider range of derived cloud fractions.
The spatial scale mismatch between the ground sensor effective FOV (estimated 1–2 km diameter at cloud base height) and the TROPOMI pixel (3.5 × 5.5 km) contributes additional scatter. For broken cloud fields, the ground sensor may sample a clear gap while TROPOMI reports area-averaged partial cloud cover, or vice versa. The positive bias (+20.8 %) is consistent with this spatial mismatch, as the larger satellite pixel is more likely to include cloud elements that fall outside the ground sensor's narrower effective field of view.
3.3.3 Cloud Top Height
For cloudy pixels (cloud fraction >30 %, N=25), Sentinel-5P cloud top height retrievals range from 0.9 to 7.8 km above sea level (Fig. 2d). Lower cloud top heights correspond to warmer sky temperatures (R=0.62), consistent with the physical relationship: low-level clouds emit thermal radiation at near-surface temperatures (warm), while high-altitude cloud tops produce colder apparent sky temperatures as detected by the IR pyrometer. This relationship confirms the physical basis of the temperature-ratio cloud detection approach.
High-altitude clouds (> 6 km) show colder sky temperatures despite high cloud fraction, indicating either thin cirrus or optically thick clouds with cold cloud tops, both scenarios reducing thermal emission detected by the ground-based sensor. This produces a bi-modal apparent sky temperature distribution for high-altitude clouds: optically thin cirrus at low cloud fraction yields cold sky temperatures (below −15 °C), while optically thick high-altitude clouds at high cloud fraction produce warmer apparent temperatures due to enhanced thermal emission, contributing to the observed scatter in the high-altitude cloud regime.
3.4 QA Threshold Analysis and Extended Dataset
To further assess the effect of sample size, we extended the observation period from 28 d (Dataset A) to 96 d (Dataset B, 21 609 DG15 records). Applying the original QA ≥ 0.5 threshold yields N = 27 matched pairs in both datasets – identical despite a 6× increase in ground data. This reveals that the S5P QA filter is the primary limiting factor in the Pre-Alpine region, rejecting the majority of overpasses due to broken cloud fields and reduced retrieval confidence in complex terrain. Relaxing the QA threshold to 0.35 increases the sample to N = 31–32 (Fig. 3). Results for both thresholds are summarised in Table 1. The corresponding confusion matrices for all four scenarios are presented in Fig. 4.
Table 1Statistics for all four QA threshold scenarios. N=27 is identical for strict QA regardless of dataset size, demonstrating that the S5P QA filter – not ground data volume – is the limiting factor.
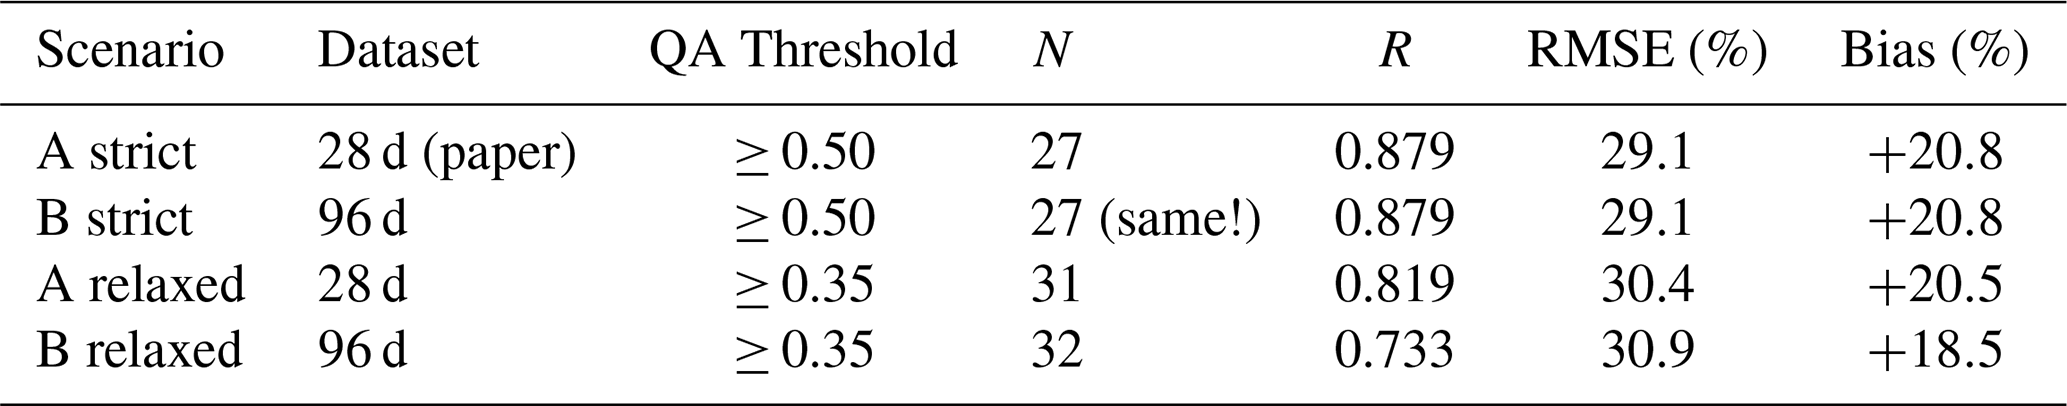
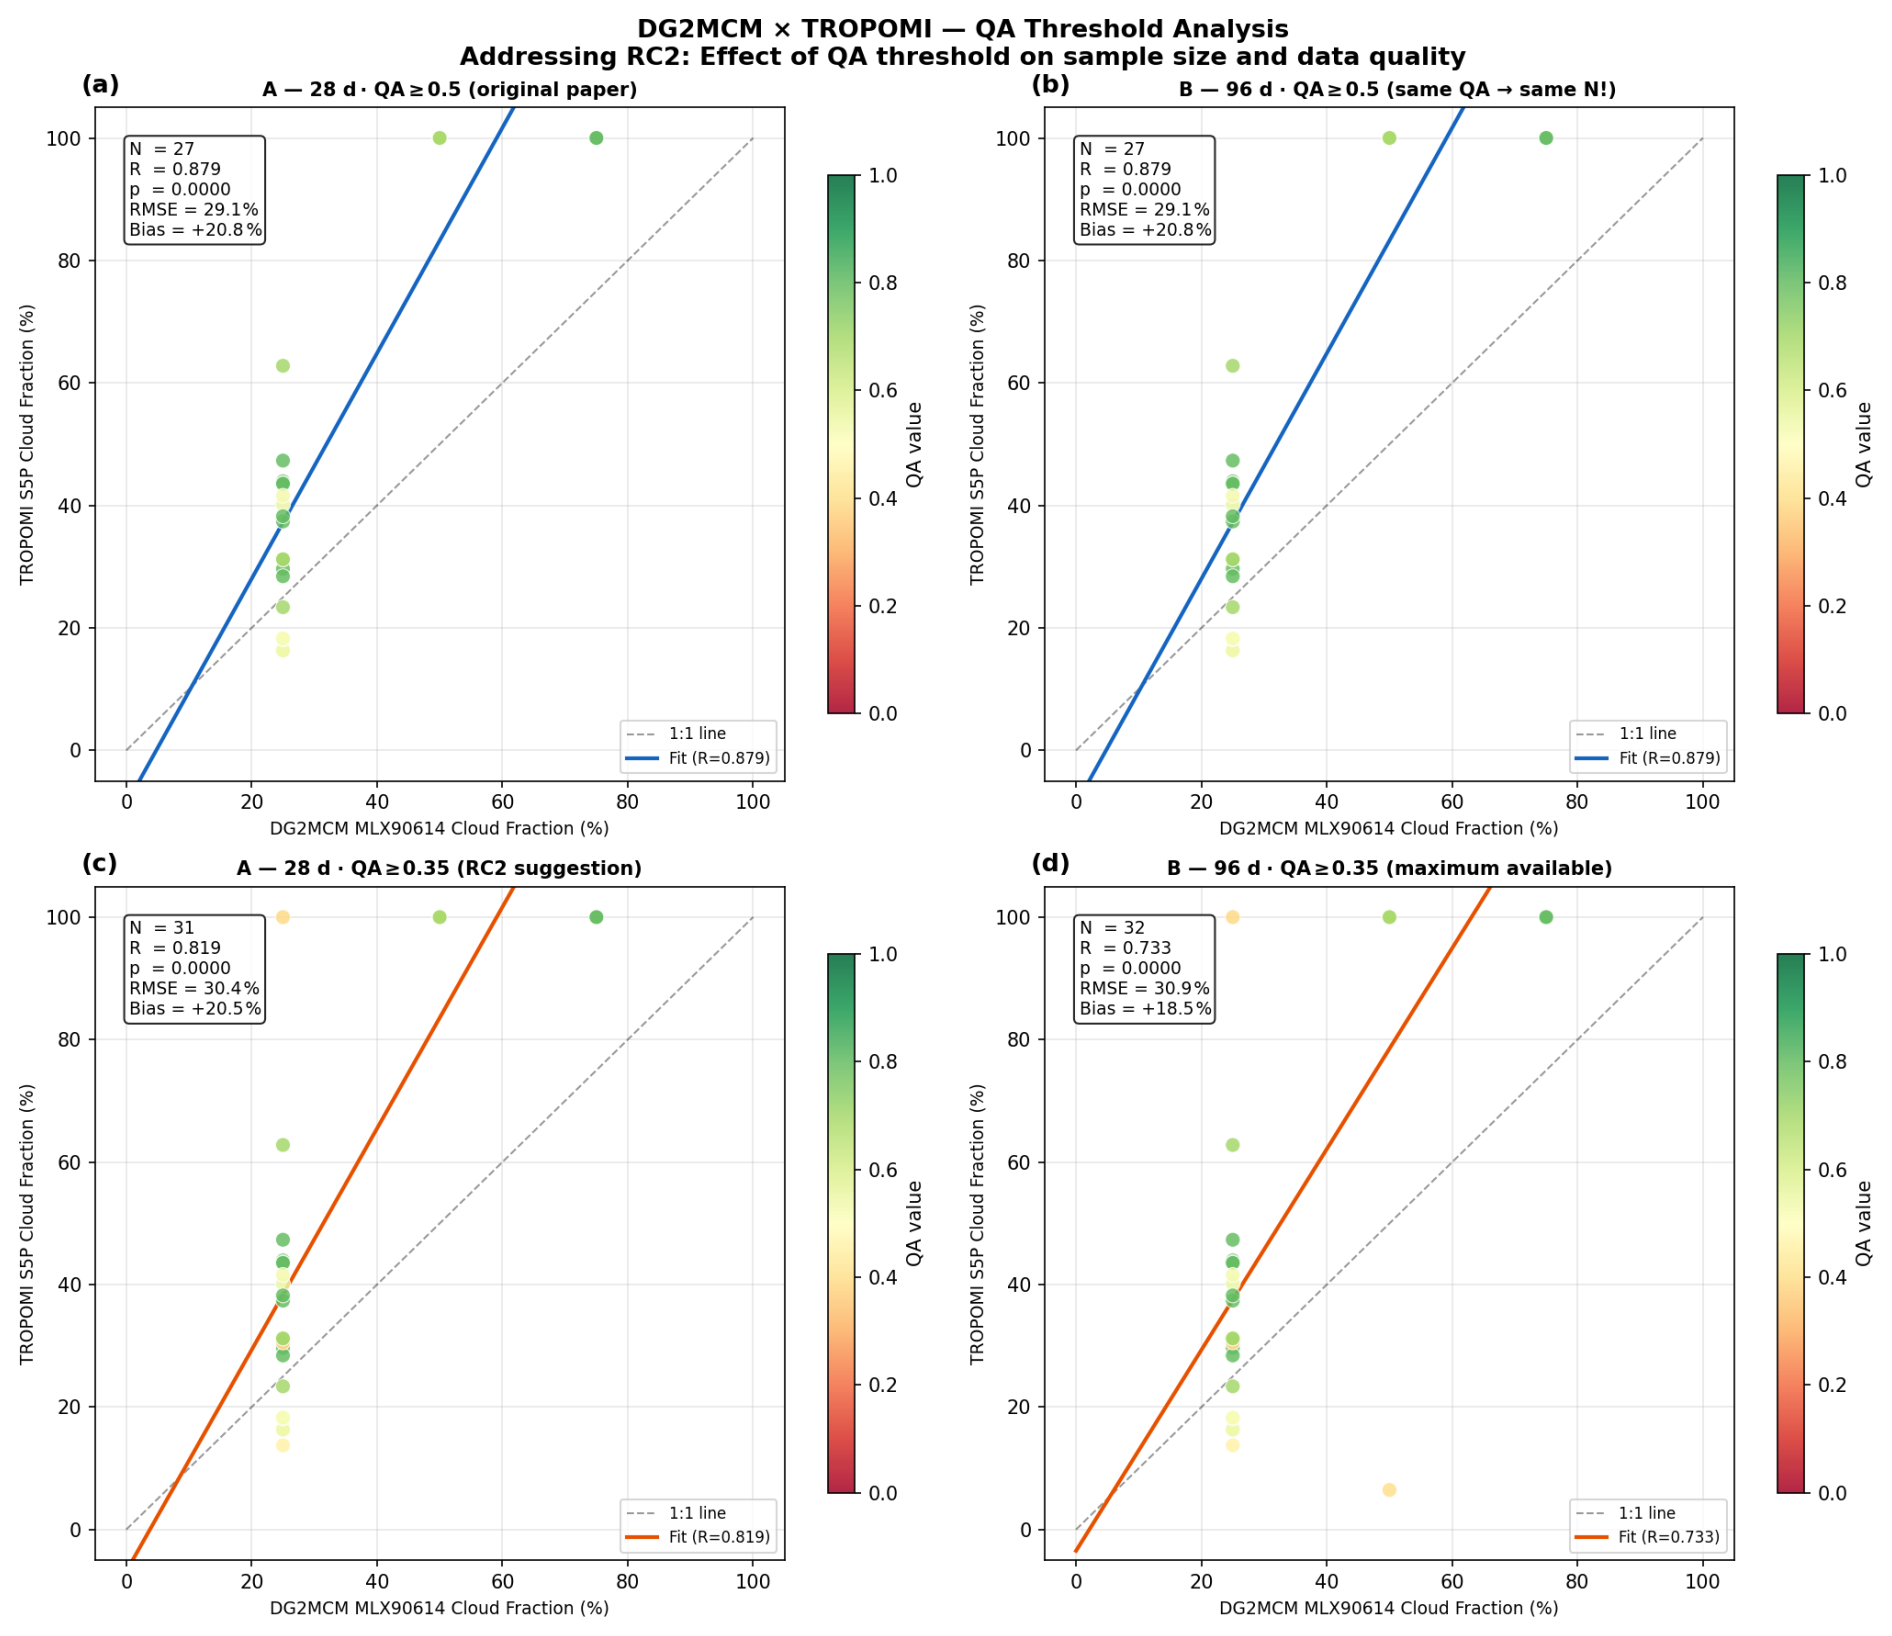
Figure 3QA threshold analysis – scatter plots for all four scenarios coloured by QA value (red = low, green = high). Upper panels: QA ≥ 0.5 (original threshold) – Dataset A and B yield identical N = 27 and R = 0.879. Lower panels: QA ≥ 0.35 (relaxed threshold) – modest increase to N = 31–32 with R = 0.819–0.733. The QA filter, not ground data volume, limits sample size.
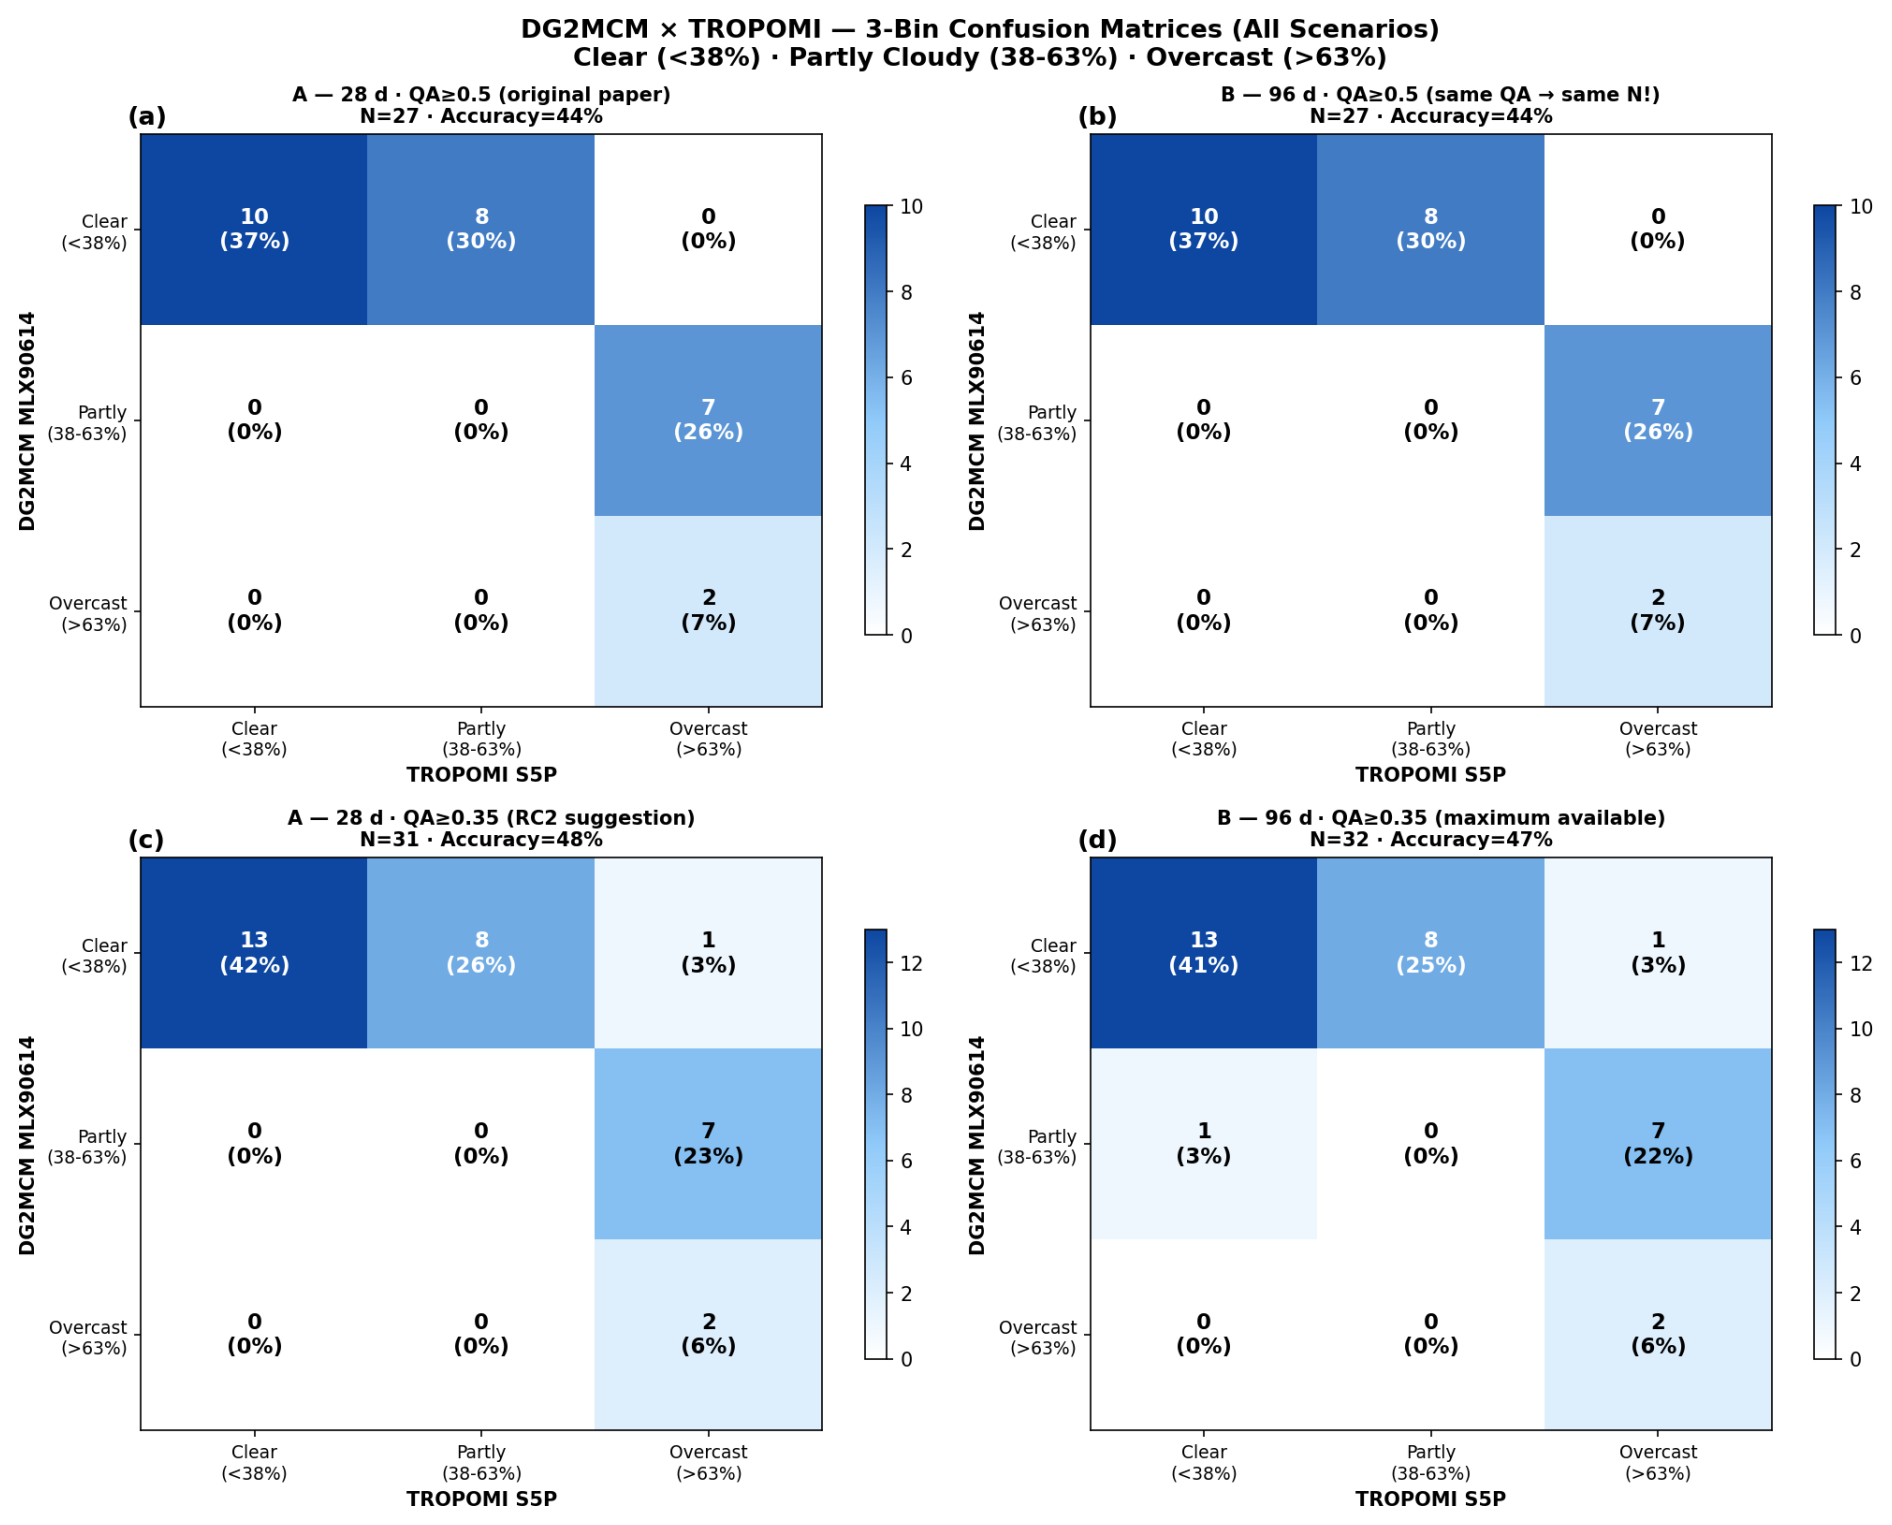
Figure 4Three-bin confusion matrices (Clear < 38 %/Partly Cloudy 38 %–63 %/Overcast > 63 %) for all four scenarios. Upper row: QA ≥ 0.5 (N = 27, accuracy 44 %). Lower row: QA ≥ 0.35 (N = 31–32, accuracy 47 %–48 %). The method correctly identifies all clear-sky events. The partly-cloudy bin is most challenging due to the clustering limitation of the MLX90614 temperature-ratio approach.
3.5 Data Availability and Coverage
Table 2 summarizes the matched observation pairs for each TROPOMI product. Cloud and ozone products achieved the highest number of matched pairs (71 each), while nitrogen dioxide showed the highest match rate (82 %) due to a smaller total number of satellite observations with more successful QA filtering (63 matched pairs from 77 total).
The temporal distribution (Fig. 1d) shows regular coverage throughout the study period with near-daily observations for most products. Gaps in coverage correspond to satellite orbit geometry (no overpass) or failed QA criteria for specific products.
Table 2Summary of matched Sentinel-5P and ground-based observation pairs
3.6 Measurement Uncertainty
The dual AS7341 sensor configuration (2.7 m baseline) enables instrumental uncertainty quantification through direct sensor intercomparison. For clear-sky conditions (N=45 matched pairs), the standard deviation of inter-sensor channel differences ranges from 3.2 % (red channels) to 8.7 % (violet channels), with higher relative uncertainty at shorter wavelengths due to reduced atmospheric transmission and increased Rayleigh scattering sensitivity.
This sensor reproducibility provides a lower bound for measurement uncertainty in future aerosol optical depth validation studies, where retrieval uncertainties typically exceed 15 %–20 % for ground-based sun photometry.
3.7 Aerosol Index and Trace Gas Products: Scope and Future Work
Concurrent measurements of aerosol optical depth proxy and trace gas co-locations (NO2, O3) are available from the DG2MCM-15 sensor suite but are not further analysed in this study. The TROPOMI aerosol index is derived from UV channel pairs at 340/380 and 354/388 nm, outside the spectral range of the current AS7341 sensor (415–680 nm), precluding a physically motivated comparison. Preliminary results including detection of a Saharan dust intrusion event (AOD proxy +10.5σ above baseline) demonstrate the network's sensitivity to episodic aerosol events and will be the subject of a dedicated follow-on study. Integration of the AS7331 UV sensor (280–390 nm, operational since March 2026) will enable direct spectral overlap with TROPOMI UVAI retrieval wavelengths in future work.
4.1 Cloud Comparison Performance
The reported correlation (R=0.879) between ground-based infrared sky temperature and Sentinel-5P cloud fraction indicates the potential of low-cost thermal infrared sensors for satellite cloud product comparison. However, as noted in Sect. 3.3.1, this correlation is driven substantially by two high-cloud-fraction observations and should be interpreted with caution. While the correlation coefficient is comparable to or exceeds those reported for dedicated cloud validation instruments such as ceilometers (R=0.85–0.92) (Wang and Sassen, 2001) and whole-sky imagers (R=0.78–0.88) (Forsythe et al., 2000), the higher RMSE (29.1 %) and positive bias (+20.8 %) indicate that the method is better suited for cloud screening (distinguishing clear, cloudy, and overcast conditions) than for quantitative cloud fraction retrieval.
The discrete nature of the ground-based cloud fraction values – constrained to exactly four levels (0 %, 25 %, 50 %, 75 %) by firmware-level integer quantisation in the RAK4631 microcontroller (see Sect. 2.1.2) – means the correlation coefficient should be interpreted with caution. The R=0.879 is driven substantially by the separation between these four discrete levels rather than by a continuous linear relationship, and the effective degrees of freedom are lower than the sample size (N=27) would suggest. This hardware-imposed quantisation fundamentally limits the utility of the current sensor generation for point-to-point quantitative cloud fraction validation.
The residual scatter and bias can be attributed to three principal factors. The most significant is the spatial scale mismatch between instruments: the ground-based infrared pyrometer's effective FOV (estimated 1–2 km at cloud base height) is substantially smaller than the TROPOMI pixel (3.5–7 km, corresponding to 12–39 km2). The satellite pixel consistently includes more cloud elements than the ground sensor observes, explaining the positive bias. Additionally, cloud type sensitivity introduces systematic differences, as thin cirrus clouds and high-altitude ice clouds emit less thermal radiation than low-altitude liquid water clouds despite similar optical thickness. Finally, even with a mean temporal offset of only 2.7 min, rapidly evolving convective clouds can produce significant differences between satellite and ground observations.
4.1.1 Choice of Satellite Comparison Target
An important consideration is whether TROPOMI, with its relatively coarse spatial resolution (3.5–7 km), represents the optimal satellite comparison target for this type of ground-based validation. Higher-resolution satellite cloud products are available from MODIS (1 km), VIIRS (750 m), and the Sea and Land Surface Temperature Radiometer (SLSTR) on Sentinel-3 (1 km). These instruments provide cloud mask and cloud fraction products at spatial resolutions much closer to the ground sensor's effective FOV, which would reduce the spatial mismatch contribution to validation scatter. In particular, MODIS and VIIRS thermal infrared cloud detection algorithms operate in similar wavelength regions (10–12 µm) to the MLX90614, providing a more direct physical comparison than TROPOMI's UV/visible-based OCRA/ROCINN cloud retrieval.
The present study focused on TROPOMI because the primary motivation was validation of Sentinel-5P atmospheric products as an integrated dataset (cloud, aerosol, and trace gas products from a single platform). Future work should include systematic comparison with MODIS, VIIRS, and SLSTR cloud products to disentangle spatial resolution effects from retrieval algorithm differences, and to identify the satellite product best suited for validation with ground-based infrared thermometry.
The RMSE of 29.1 % exceeds typical requirements for satellite product uncertainty characterization (20 %–30 % for cloud fraction) (Committee on Earth Observation Satellites, 2020), indicating that quantitative cloud fraction comparison using the current method does not meet established standards. However, the strong ordinal agreement – the method correctly ranks cloud conditions from clear to overcast – suggests that the approach has value for qualitative cloud screening and for identifying cloud-contaminated satellite retrievals, even if continuous quantitative validation requires higher-resolution methods.
4.2 Advantages and Limitations Relative to Established Networks
Traditional satellite validation networks such as AERONET (Holben et al., 1998) and NDACC (De Mazière et al., 2018) provide high-accuracy reference measurements but are constrained by limited spatial coverage with approximately 500 sites globally, and the Pandonia Global Network for UV–VIS trace gas columns (Herman et al., 2009). The DG2MCM approach demonstrates that citizen science networks using calibration-informed protocols can complement these established networks, particularly in data-sparse regions. We emphasise that this study does not constitute a validation of the Sentinel-5P cloud fraction product. Rather, it demonstrates the feasibility of the COTS-based estimation method by showing statistical agreement with an established reference dataset. Future work involving comparison with independent ground truth sources (e.g. AERONET, CLOUDNET, visual observer reports) is needed to fully establish the method's validity as a ground reference.
The low-cost sensor approach offers several practical advantages over reference instrumentation. Station hardware costs remain below USD 500 compared to USD 50 000–100 000 for reference sun photometers, enabling deployment at scales that would be prohibitively expensive with professional instruments. The stations operate autonomously with wireless telemetry, making them suitable for remote locations. Each station provides simultaneous cloud, aerosol proxy, and photometric observations, and the 1 min sampling interval exceeds the 15 min cadence typical of reference networks. The primary trade-off is absolute accuracy (15 %–20 % for low-cost sensors versus 1 %–2 % for reference instruments), which remains acceptable for satellite product validation where retrieval uncertainties typically exceed sensor limitations.
4.3 Calibration-Informed Methodology in Citizen Science
Throughout this paper, the term calibration-informed refers to measurement protocols that apply quality assurance principles drawn from formal spectroradiometric metrology practice – including systematic uncertainty analysis, dark current monitoring, and cross-sensor consistency checks – without claiming equivalence to formally accredited calibration in the sense of ISO/IEC 17025. A distinctive aspect of this study is the application of calibration-informed measurement principles to citizen science atmospheric monitoring. The methodology incorporates quality assurance procedures and uncertainty awareness drawn from spectroradiometric measurement practice, including systematic consideration of sensor drift, dark current, and cross-sensor consistency.
However, it is essential to distinguish between calibration-informed methodology and formally calibrated measurements. The sensors used in this study rely on factory calibration and cross-sensor consistency checks rather than traceable calibration against reference standards. The outdoor deployment conditions (temperature range −20 to +35 °C, varying humidity, solar exposure) fundamentally differ from the controlled laboratory environment required for formal calibration.
The measurement system design reflects systematic consideration of error sources, signal saturation avoidance, and automatic gain control – principles relevant to any rigorous low-cost sensor deployment. Regular monitoring of sensor stability, dark current behaviour, and cross-sensor agreement between co-located stations DG2MCM-15 and DG2MCM-16 provides confidence in data consistency. The distinction between sensor precision (reproducibility) and accuracy (closeness to true value) is maintained throughout, enabling honest uncertainty assessment.
Future work should pursue formal calibration of low-cost sensors using custom adapters for integrating sphere and blackbody reference sources. This would require addressing the practical challenge of the small physical dimensions of commercial sensor packages (e.g., AS7341: 3.1 × 2.0 mm) and the development of standardized calibration protocols suitable for citizen science networks. Organizations with existing spectroradiometric infrastructure – testing laboratories, universities, and national metrology institutes – are well-positioned to develop and disseminate such protocols.
4.4 Applicability to Other Satellite Missions
The comparison approach presented here is directly applicable to current and future satellite missions. The upcoming Sentinel-5 operational mission (expected 2025+) will carry a similar instrument to TROPOMI, ensuring continuity of the validation methodology. Geostationary missions including the Tropospheric Emissions: Monitoring of Pollution (TEMPO) instrument over North America and the Geostationary Environment Monitoring Spectrometer (GEMS) over Asia require continuous ground-based validation that autonomous low-cost stations can provide. The recently launched Sentinel-4 mission provides continuous daytime monitoring of atmospheric composition over Europe from geostationary orbit, offering particularly high temporal resolution for ground-based validation; the DG2MCM-15 Central European site is well positioned to contribute to this effort. The next-generation Meteorological Operational Satellite – Second Generation (MetOp-SG) polar-orbiting platform will likewise benefit from dense ground-validation networks. The multi-spectral ground station design accommodates varying satellite wavelength ranges (UV to near-IR) and temporal sampling requirements for both polar-orbiting and geostationary platforms.
4.5 Limitations and Future Work
Several limitations of the current study should be addressed in future work. The quasi-discrete clustering of infrared-derived cloud fraction values demonstrates that the temperature-ratio method (Eq. 1) is insufficient for continuous quantitative cloud fraction retrieval, particularly during winter conditions when the large clear-sky temperature depression compresses derived values. Alternative approaches, including multi-threshold classification methods, machine learning-based cloud detection using the full multi-spectral dataset, or narrower FOV infrared sensors that better resolve individual cloud elements, may improve cloud fraction resolution. The positive bias (+20.8 %) points to systematic spatial mismatch effects that could be partially addressed by comparison with higher-resolution satellite cloud products from MODIS, VIIRS, and SLSTR (1 km or better).
The current sensor configuration lacks UV spectral coverage, preventing meaningful validation of TROPOMI aerosol index products. Integration of the AS7331 UV sensor covering 280–390 nm will enable spectral overlap with TROPOMI UVAI retrieval wavelengths. Similarly, column trace gas validation (NO2, O3) requires dedicated instrumentation such as Pandora spectrometers that is beyond the scope of the current low-cost station design, though the multi-spectral data may support indirect proxy approaches in future studies.
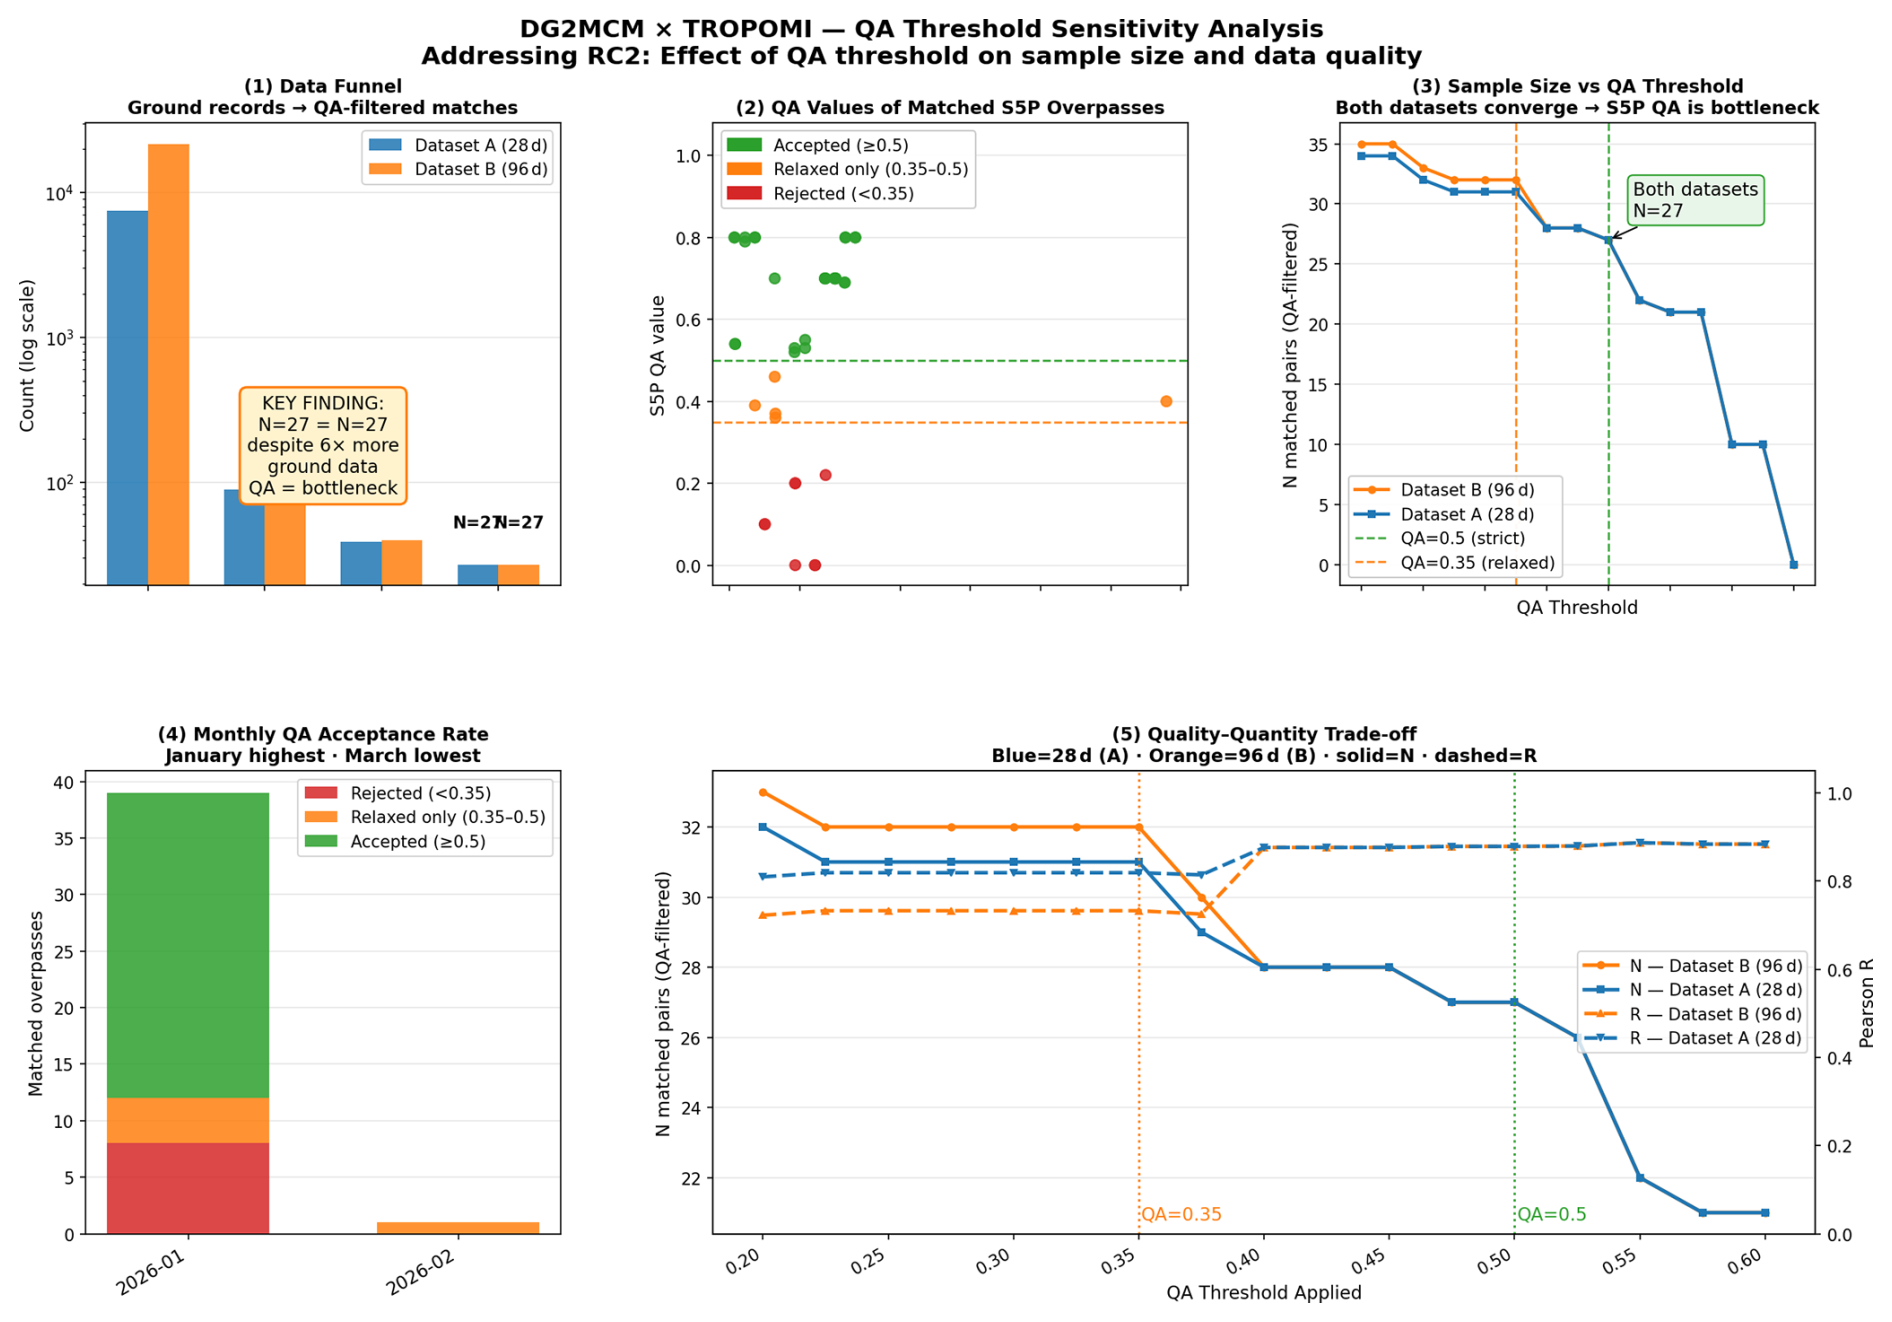
Figure 5QA threshold sensitivity analysis. Top row, left to right: (1) data funnel showing ground records collapsing to matched pairs after QA filtering; (2) QA values of all matched S5P overpasses over time (red = rejected, orange = relaxed-QA only, green = accepted); (3) sample size N as a function of QA threshold for Dataset A (28 d) and Dataset B (96 d) – both datasets converge, confirming S5P QA as the primary bottleneck. Bottom row: (4) monthly QA acceptance rate (January highest, March lowest); (5) quality–quantity trade-off showing N and R as a function of QA threshold applied (0.20–0.60). The sample size is insensitive to dataset length but responsive to QA threshold relaxation; relaxing from 0.5 to 0.35 increases N by 15 %–19 % while reducing R from 0.879 to 0.733–0.819.
Regarding spatial representativeness, the current micro-array configuration with 2.7 m sensor separation provides instrumental uncertainty quantification but limited spatial sampling relative to satellite pixel dimensions. Future networks should incorporate multiple ground stations separated by 3–5 km within a single satellite pixel footprint, supplemented by mobile validation campaigns and integration with broader citizen science networks. The four-week observation period of this study, while sufficient for demonstrating the comparison methodology, is insufficient for characterizing seasonal variability and long-term sensor stability. Multi-year datasets, systematic sensor aging and drift characterization, and regular recalibration protocols will be essential for establishing the long-term reliability of low-cost sensor comparison. Extended observation periods should also capture episodic aerosol events (Saharan dust, biomass burning) to test aerosol detection capabilities once UV sensors are deployed.
An important finding from the extended dataset analysis (Dataset B: 96 d, 21 609 ground records) is that extending the observation period six-fold does not increase the number of QA-filtered matchups with the strict threshold (QA ≥ 0.5): both the 28 and 96 d datasets yield N=27 matched pairs. This reveals that the S5P QA filter is the primary limiting factor in the Pre-Alpine region, rejecting the majority of overpasses due to broken cloud fields and reduced retrieval confidence in complex terrain. Relaxing the QA threshold to 0.35 (following RC2 recommendation) increases the sample to N=31–32, confirming this interpretation. The full QA threshold sensitivity analysis is presented in Fig. 5. We report results for both thresholds and note that relaxed-QA matchups include overpasses with lower retrieval confidence, which may introduce additional uncertainty in the TROPOMI cloud fraction values.
4.6 Implications for Satellite Product Users
The comparison results presented here have implications for both Sentinel-5P data users and for the design of future low-cost validation networks. The strong ordinal agreement (R=0.879) supports the use of ground-based infrared thermometry for cloud screening – identifying cloud-contaminated satellite retrievals and distinguishing between predominantly clear and cloudy conditions. However, the quantitative limitations (RMSE =29.1 %, quasi-discrete cloud fraction values) indicate that this approach should be considered a complement to, rather than a replacement for, dedicated cloud validation instruments. The Central European mid-latitude comparison site contributes to geographic diversity in validation coverage, and the high-temporal-resolution ground data (1 min sampling) enables detailed studies of cloud evolution within satellite overpass windows.
We have demonstrated a ground-based comparison of Sentinel-5P TROPOMI cloud fraction products using a multi-spectral sensor array combining calibration-informed methodology with low-cost commercial instrumentation.
The principal result of this study is the correlation between ground-based infrared sky temperature measurements and Sentinel-5P cloud fraction retrievals (R=0.879, N=27 after quality filtering). However, the quasi-discrete clustering of derived cloud fraction values and the elevated RMSE (29.1 %) and bias (+20.8 %) indicate that the temperature-ratio method is better suited for qualitative cloud screening than for continuous quantitative cloud fraction comparison. Temporal matching achieved a mean offset of 2.7 min between satellite overpasses and ground observations, with 95 % of matches within 8 min, meeting standard collocation requirements for atmospheric comparison. All comparison points fall within the nominal TROPOMI pixel footprint (3.5 km ×5.5 km), though the spatial scale mismatch between the ground sensor FOV (1–2 km effective diameter) and satellite pixel dimensions is the primary driver of the positive bias.
The study also identified clear boundaries of the current approach. Aerosol index comparison is not achievable without UV spectral coverage overlapping TROPOMI retrieval wavelengths, and trace gas column validation requires dedicated instrumentation beyond the scope of low-cost sensor networks. The infrared cloud fraction method produces quasi-discrete output values during winter conditions, demonstrating the need for improved algorithms such as multi-threshold classification or machine learning approaches.
Despite these limitations, the method reliably distinguishes between clear, partially cloudy, and overcast conditions, providing value for cloud screening applications. Comparison with higher-resolution satellite cloud products from MODIS, VIIRS, and SLSTR should be pursued to reduce spatial mismatch effects.
Future work will focus on UV sensor integration for aerosol comparison through direct wavelength matching with TROPOMI products, improved cloud fraction algorithms addressing the clustering limitation, systematic comparison with higher-resolution satellite cloud products, and network deployment across multiple sites for spatial representativeness studies.
The methodology presented here is directly applicable to current and future satellite missions including Sentinel-5, TEMPO, GEMS, Sentinel-4, and MetOp-SG, providing a template for complementary comparison approaches bridging the gap between professional reference networks and emerging citizen science capabilities.
Analysis scripts and validation data are available upon request from the corresponding author.
Sentinel-5P TROPOMI data are available from the Copernicus Data Space Ecosystem (https://dataspace.copernicus.eu/, last access: 8 May 2026). Ground-based measurements from DG2MCM-15 are available upon request from the corresponding author.
The author has declared that there are no competing interests.
Publisher's note: Copernicus Publications remains neutral with regard to jurisdictional claims made in the text, published maps, institutional affiliations, or any other geographical representation in this paper. The authors bear the ultimate responsibility for providing appropriate place names. Views expressed in the text are those of the authors and do not necessarily reflect the views of the publisher.
The author acknowledges the use of Claude (Anthropic) as an AI writing assistant for manuscript preparation, LaTeX formatting, and data visualization. All measurements, data analysis, scientific interpretation, and research design were conducted solely by the author.
This paper was edited by Andrew Sayer and reviewed by three anonymous referees.
Committee on Earth Observation Satellites: A Geostationary Satellite Constellation for Observing Global Air Quality: An International Path Forward, Tech. rep., CEOS Atmospheric Composition Virtual Constellation, http://ceos.org/document_management/Virtual_Constellations/ACC/Documents/CEOS_AC-VC_GEO-AQ-Constellation_Overview_Nov2020.pdf (last access: 8 May 2026), 2020. a, b
De Mazière, M., Thompson, A. M., Kurylo, M. J., Wild, J. D., Bernhard, G., Blumenstock, T., Braathen, G. O., Hannigan, J. W., Lambert, J.-C., Leblanc, T., McGee, T. J., Nedoluha, G., Petropavlovskikh, I., Seckmeyer, G., Simon, P. C., Steinbrecht, W., and Strahan, S. E.: The Network for the Detection of Atmospheric Composition Change (NDACC): history, status and perspectives, Atmos. Chem. Phys., 18, 4935–4964, https://doi.org/10.5194/acp-18-4935-2018, 2018. a, b
Dürr, B. and Philipona, R.: Automatic cloud amount detection by surface longwave downward radiation measurements, J. Geophys. Res.-Atmos., 109, D05201, https://doi.org/10.1029/2003JD004182, 2004. a, b
Forsythe, J. M., Haar, T. H. V., and Reinke, D. L.: Cloud identification and classification from multispectral satellite data, J. Appl. Meteorol., 39, 93–109, 2000. a
Amos, H. M., Colón Robles, M., and the GLOBE Cloud Community: Clouds around the World: How a Simple Citizen Science Data Challenge Became a Worldwide Success, B. Am. Meteor. Soc., 101, E1049–E1069, https://doi.org/10.1175/BAMS-D-19-0295.1, 2020. a
Herman, J., Cede, A., Spinei, E., Mount, G., Tzortziou, M., and Abuhassan, N.: NO2 column amounts from ground-based Pandora and MFDOAS spectrometers using the direct-sun DOAS technique: Intercomparisons and application to OMI validation, J. Geophys. Res.-Atmos., 114, D13307, https://doi.org/10.1029/2009JD011848, 2009. a
Holben, B. N., Eck, T. F., Slutsker, I., Tanré, D., Buis, J. P., Setzer, A., Vermote, E., Reagan, J. A., Kaufman, Y. J., Nakajima, T., Lavenu, F., Jankowiak, I., and Smirnov, A.: AERONET – A federated instrument network and data archive for aerosol characterization, Remote Sens. Environ., 66, 1–16, https://doi.org/10.1016/S0034-4257(98)00031-5, 1998. a, b
Lewis, A. C., Lee, J. D., Edwards, P. M., Shaw, M. D., Evans, M. J., Moller, S. J., Smith, K. R., Buckley, J. W., Ellis, M., Gillot, S. R., and White, A.: Evaluating the performance of low cost chemical sensors for air pollution research, Faraday Discuss., 189, 85–103, https://doi.org/10.1039/C5FD00201J, 2016.
Long, C. N. and Turner, D. D.: A method for continuous estimation of clear-sky downwelling longwave radiative flux developed using ARM surface measurements, J. Geophys. Res.-Atmos., 113, D18206, https://doi.org/10.1029/2008JD009944, 2008. a
Loyola, D. G., Gimeno García, S., Lutz, R., Argyrouli, A., Romahn, F., Spurr, R. J. D., Pedergnana, M., Doicu, A., Molina García, V., and Schüssler, O.: The operational cloud retrieval algorithms from TROPOMI on board Sentinel-5 Precursor, Atmos. Meas. Tech., 11, 409–427, https://doi.org/10.5194/amt-11-409-2018, 2018. a
Ludewig, A., Kleipool, Q., Bartstra, R., Landzaat, R., Leloux, J., Loots, E., Meijering, P., van der Plas, E., Rozemeijer, N., Vonk, F., and Veefkind, P.: In-flight calibration results of the TROPOMI payload on board the Sentinel-5 Precursor satellite, Atmos. Meas. Tech., 13, 3561–3580, https://doi.org/10.5194/amt-13-3561-2020, 2020. a, b, c
Ludewig, A., Kleipool, Q., and Veefkind, P.: S5P Mission Performance Centre Cloud [L2__CLOUD_] Product Readme File (PRF-CL), processor version 02.08.00, S5P-MPC-KNMI-PRF-CL, KNMI/ESA, https://sentiwiki.copernicus.eu/web/s5p-products (last access: 8 May 2026), 2024. a
Müller, M., Mikoviny, T., Jud, W., D'Anna, B., and Wisthaler, A.: A new software tool for the analysis of high resolution PTR-TOF mass spectra, Chemometr. Intell. Lab., 127, 158–165, https://doi.org/10.1016/j.chemolab.2013.06.011, 2020.
Schneider, P., Bartonova, A., Castell, N., Dauge, F. R., Gerboles, M., Hagler, G. S. W., Kamrad, H., Kotsev, A., Lahoz, W., Lee, A., Hamer, P., Liu, H.-Y., Signorini, M., Talidda, A., Västberg, A., and Vogt, M.: Toward a Unified Terminology of Processing Levels for Low-Cost Air-Quality Sensors, Environ. Sci. Technol., 53, 8485–8487, https://doi.org/10.1021/acs.est.9b02879, 2019.
Smirnov, A., Holben, B. N., Slutsker, I., Giles, D. M., McClain, C. R., Eck, T. F., Sakerin, S. M., Macke, A., Croot, P., Zibordi, G., Quinn, P. K., Sciare, J., Kinne, S., Harvey, M., Smyth, T. J., Piketh, S., Zielinski, T., Proshutinsky, A., Goes, J. I., Nelson, N. B., Larouche, P., Radionov, V. F., Goloub, P., Krishna Moorthy, K., Matarrese, R., Robertson, E. J., and Jourdin, F.: Maritime Aerosol Network as a component of Aerosol Robotic Network, J. Geophys. Res.-Atmos., 114, D06204, https://doi.org/10.1029/2008JD011257, 2009. a
Veefkind, J. P., Aben, I., McMullan, K., Förster, H., de Vries, J., Otter, G., Claas, J., Eskes, H. J., de Haan, J. F., Kleipool, Q., van Weele, M., Hasekamp, O., Hoogeveen, R., Landgraf, J., Snel, R., Tol, P., Ingmann, P., Voors, R., Kruizinga, B., Vink, R., Visser, H., and Levelt, P. F.: TROPOMI on the ESA Sentinel-5 Precursor: A GMES mission for global observations of the atmospheric composition for climate, air quality and ozone layer applications, Remote Sens. Environ., 120, 70–83, https://doi.org/10.1016/j.rse.2011.09.027, 2012. a, b
Wang, Z. and Sassen, K.: Cloud Type and Macrophysical Property Retrieval Using Multiple Remote Sensors, J. Appl. Meteorol., 40, 1665–1682, https://doi.org/10.1175/1520-0450(2001)040<1665:CTAMPR>2.0.CO;2, 2001. a