the Creative Commons Attribution 4.0 License.
the Creative Commons Attribution 4.0 License.
 | 19 May 2026
Comparative analysis of GOME and SCIAMACHY reflectance over Pseudo-Invariant Calibration Sites: implications for spectrometers cross-calibration
Günter Lichtenberg
Accurate radiometric cross-calibration is essential for ensuring the consistency and interoperability of multi-sensor satellite observations. Vicarious calibration, a widely adopted approach, relies on the temporal stability of desert-based Pseudo-Invariant Calibration Sites (PICS). However, these sites are limited in spatial extent and have not been systematically examined for cross-calibration with larger pixels, whose dimensions exceed those of PICS. This study established a statistical framework to advance cross-calibration of spectrometers over PICS and their surrounding areas. The framework included performance comparisons of different satellite instruments and the identification of reference and constrained sensors. The temporal stability of PICS across various spectral bands was reassessed using observations from the reference sensor. Stability scores (SS) were derived from a combination of statistical indicators designed to capture temporal variability, distribution symmetry, the occurrence of anomalies, and long-term shifts in the observations.
Decades of top-of-atmosphere (TOA) reflectance data in the ultraviolet, visible, and near-infrared (UV/VIS/NIR) ranges, collected by the Global Ozone Monitoring Experiment (GOME) and Scanning Imaging Absorption Spectrometers for Atmospheric Chartography (SCIAMACHY) spectrometers over 20 PICS sites, were analyzed. The results revealed significant degradation in GOME, particularly in the UV band, during 2001 and toward the end of its mission, as evidenced by positively skewed, heavy-tailed distributions. In contrast, SCIAMACHY observations were more uniform and stationary, indicating their greater suitability for assessing PICS stability. The investigated sites were ranked based on the average of SS across the entire investigated spectrum as well as for each spectral band. The analysis revealed a wide range of SS among PICS, including intra-site variations across spectral bands. While some sites demonstrated consistently high stability, many were found to be 2–3 times less stable than the most stable sites. Among these robust sites, some have not been recommended by the calibration communities and should be given further consideration. In addition, the stability of the sites based on TOA reflectance showed a clear spectral band dependency, with enhanced stability in the NIR relative to the UV and VIS bands. These findings underscore the importance of regularly evaluating PICS and of considering spectral-band-specific performance when selecting calibration sites and performing the cross-calibration of spectrometers over PICS.
- Article
(14314 KB) - Full-text XML
- Companion paper
-
Supplement
(5328 KB) - BibTeX
- EndNote


In recent decades, the number of satellite missions has significantly increased, leading to a paradigm shift across various applications. This expansion has resulted in an abundance of remote sensing data and a rapid growth in data archives. Long-term monitoring applications, such as those focused on atmospheric gases, require continuous time series data that often extend beyond the operational lifespan of individual satellite missions (Cabor et al., 1998). Ensuring radiometric consistency among these datasets is critical for integrating observations from different satellite missions. Furthermore, it is fundamental for developing high data quality to perform quantitative remote sensing (Helder et al., 2013).
Various calibration strategies can be used to ensure consistency across both temporal and spectral domains, ranging from pre-flight calibration (Lichtenberg et al., 2006; Coldewey-Egbers et al., 2008), in-flight calibration (Pagano et al., 2003; Ono et al., 1996), and vicarious calibration (Cabor et al., 1998; Wu et al., 2020; Helder et al., 2013; Chander et al., 2013; Ye et al., 2021). Notably, vicarious calibration is independent of the onboard calibration systems and provides an external means of validating and correcting satellite measurements.
Pseudo-invariant Calibration Sites (PICS) are among the most widely utilized targets in vicarious calibration methods (Kabir et al., 2020; Hasan et al., 2019), and absolute radiometric calibration (Helder et al., 2013). A set of 20 desert sites, each measuring 100×100 km2, was proposed across Africa and the Arabian Peninsula by Cosnefroy et al. (1996). Several of these sites have been recommended as reference calibration and validation test sites by the Committee on Earth Observation Satellites (CEOS), specifically by the Working Group on Calibration and Validation (WGCV) and the Infrared and Visible Optical Sensors (IVOS) (Thenkabail, 2015; Liang, 2017). As reported in Cosnefroy et al. (1996), the reflectance across each site was spatially uniform, with relative variations better than 3 %. In contrast, the temporal analysis based on cloud-free multitemporal imagery revealed peak-to-peak reflectance variations of approximately 8 % to 15 %.
PICS have been the subject of several recent studies (Khadka et al., 2021; Tuli et al., 2019; Fajardo Rueda et al., 2021; Hasan et al., 2019). These investigations confirmed that PICS remain relevant and reliable for radiometric calibration of optical remote sensing systems. Therefore, any radiometric deviations in the acquired scenes that exceed the expected temporal stability of PICS may suggest potential instrumental anomalies and necessitate further calibration or investigation – this principle forms the basis for employing PICS in radiometric calibration, sensor performance monitoring, and cross-calibration between different sensors.
While PICS are well-established in the radiometric and cross-calibration of imagery sensors, their applications to spectrometer calibration remain largely unexplored. Spectrometer footprints typically have a much larger spatial extent than that of PICS. Therefore, the temporal stability of areas larger than the PICS domain should be assessed before their use in cross-calibration. To address this gap, this research paper aims to establish a foundation for spectrometer cross-calibration through two key objectives. The first objective is to develop a statistical framework for the comparative analysis of spectrometers, to monitor their performance throughout the mission lifetime, and to identify both the reference and the constrained sensor. The second objective is to assess the temporal stability of PICS and surrounding areas across the full spectrum.
In this study, top-of-atmosphere (TOA) reflectance observations from the Global Ozone Monitoring Experiment (GOME) and the Scanning Imaging Absorption Spectrometer for Atmospheric Chartography (SCIAMACHY) over selected PICS were analyzed. A decade of measurements was used to construct reflectance time series in three spectral regions: ultraviolet (UV), visible (VIS), and near-infrared (NIR). These time series form the basis for evaluating both sensor performance and site stability. Although the derived comparison metrics inherently include contributions from surface properties and atmospheric effects, the analysis focuses on relative temporal variability rather than absolute reflectance levels.
Relative comparisons are particularly suitable over homogeneous desert regions, which are typically remote from coastlines and major emission sources. Under the assumption that atmospheric conditions are broadly comparable across the selected sites, variations in TOA reflectance are expected to be primarily governed by surface characteristics. Consequently, differences in temporal variability can be attributed mainly to site-specific properties or sensor behavior, enabling the identification of the most stable sites for cross-calibration.
Within this framework, the study is guided by two main hypotheses. First, atmospheric contributions over the selected desert calibration sites are assumed to be temporally and spatially comparable. Under stable sensor operation, variability metrics should therefore be similar across sites. Second, the PICS themselves are expected to exhibit consistent temporal behavior due to their comparable environmental and meteorological settings, regardless of the observing sensor. Systematic deviations from this expected consistency may indicate site-specific effects or sensor-related instabilities.
The paper is structured as follows. Section 2 describes the sensors and their data used in this investigation. Section 3 presents the geographical locations of the investigated PICS. The methods are presented in Sect. 4. Results and discussions are presented in Sects. 5 and 6. Finally, the conclusion and outlook in Sect. 7.
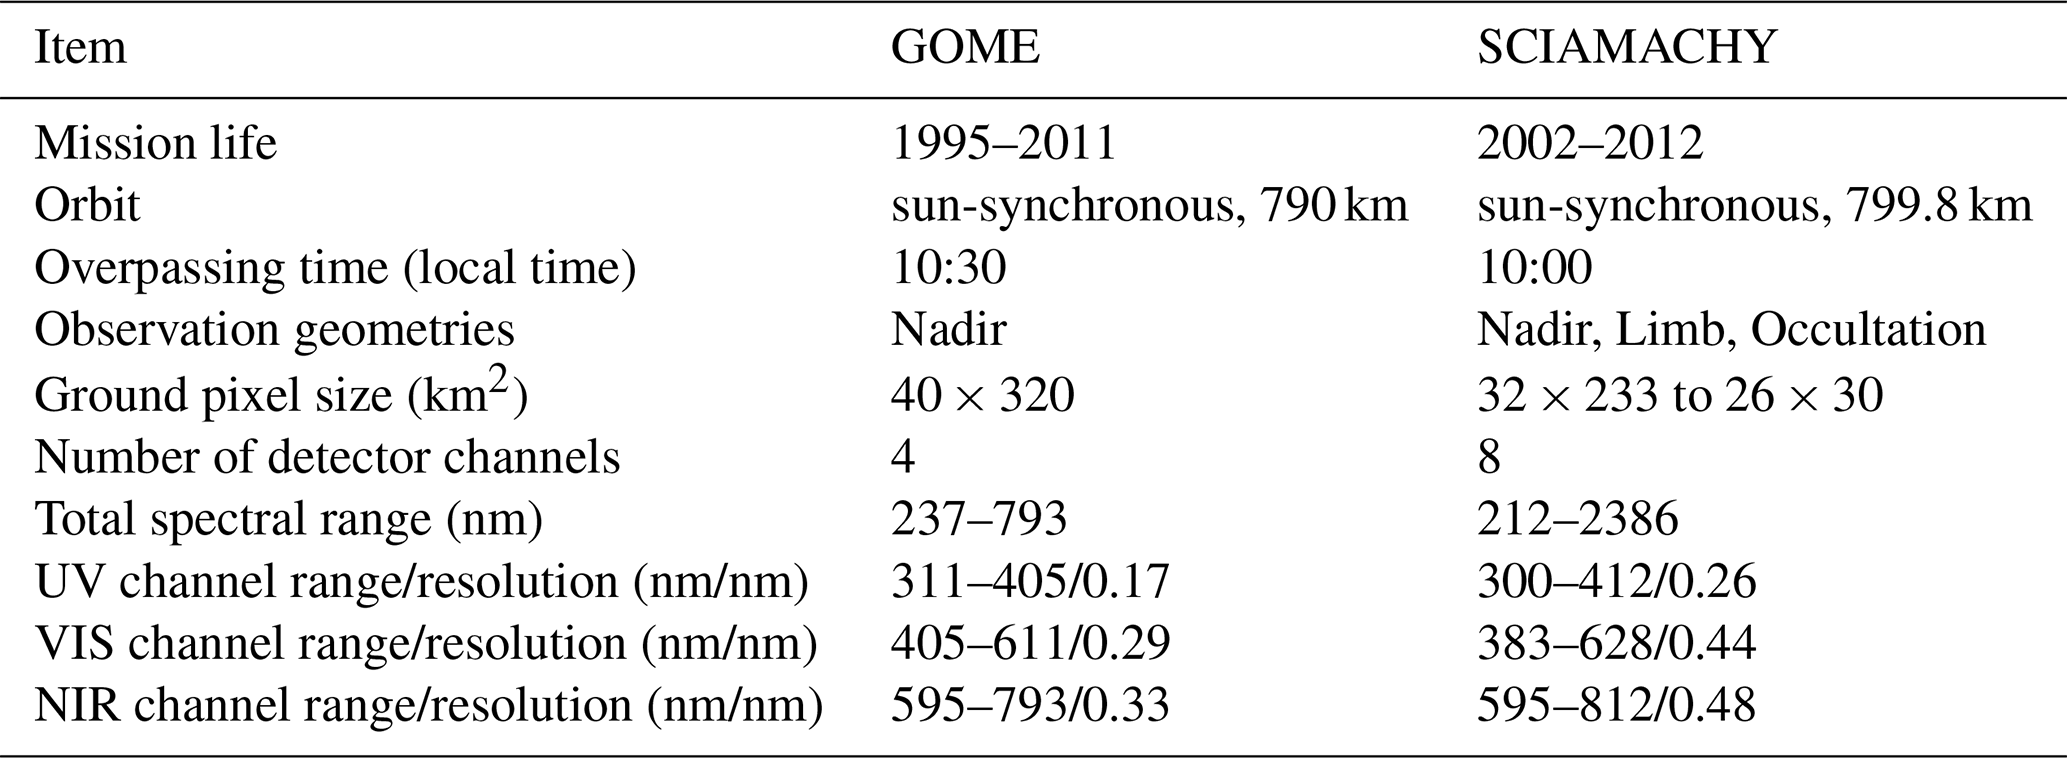
2.1 GOME
GOME was a passive nadir-scanning UV/VIS spectrometer onboard ERS-2 (ESA, 2025b). It provided observations of ozone, NO2, clouds, aerosols, and other atmospheric parameters with global coverage every 3 d. GOME had forward and backward scanning sequences with 4 pixels per scan. Forward scans included east, nadir, and west pixels (Burrows et al., 1999).
2.2 SCIAMACHY
SCIAMACHY was a passive UV/VIS/NIR imaging spectrometer on ENVISAT (ESA, 2025c). It featured nadir, limb, and sun/moon occultation viewing. Limb and occultation modes were excluded in this study. SCIAMACHY retrieved trace gases, aerosols, radiation, and cloud properties (Bovensmann et al., 1999).
Further details on the characteristics information of each sensor, including the mission life, orbit, and spatial and spectral resolution, are illustrated in Table 1.
Table 1Comparison of GOME and SCIAMACHY satellite instruments.
2.3 GOME and SCIAMACHY data
Fully calibrated Level-1 products from GOME (Level-1b version 5.2) (ESA, 2025b) and SCIAMACHY (Level-1c version 10) (ESA, 2025c) were used to derive TOA reflectance time series. Both GOME Level-1b and SCIAMACHY Level-1c datasets contained solar irradiance and radiance measurements required for reflectance computation. While cloud parameters were included in the GOME Level-1b files, they were not available in the SCIAMACHY Level-1c products. Consequently, cloud parameters for SCIAMACHY were obtained from the corresponding Level-2 products.
The following is the main data from both sensors used:
-
Reflectance: this parameter refers to the fraction of incoming radiation reflected toward the instruments. This consists of surface reflectance and atmospheric scattering. Reflectance serves as a fundamental parameter for the comparison between sensors and the study of the temporal variability of PICS. In this study, the term “reflectance” refers to TOA reflectance, unless stated otherwise.
-
Cloud fraction (CF): this parameter ranges from 0 to 1, where 0 indicates clear skies (no clouds) and 1 indicates full cloud cover. The cloud fraction is used to filter out data with a higher CF in the reflectance time series.
-
Viewing geometry of spectrometers: the solar zenith angle (SZA) and viewing zenith angle (VZA) are geometric parameters that may influence the temporal variability of reflectance. SZA is the angle between the local vertical and the sun, and VZA is the angle between the local vertical and the satellite line of sight. The effects of different SZA and VZA were investigated for SCIAMACHY reflectance before computation SS in Sect. 5.4.
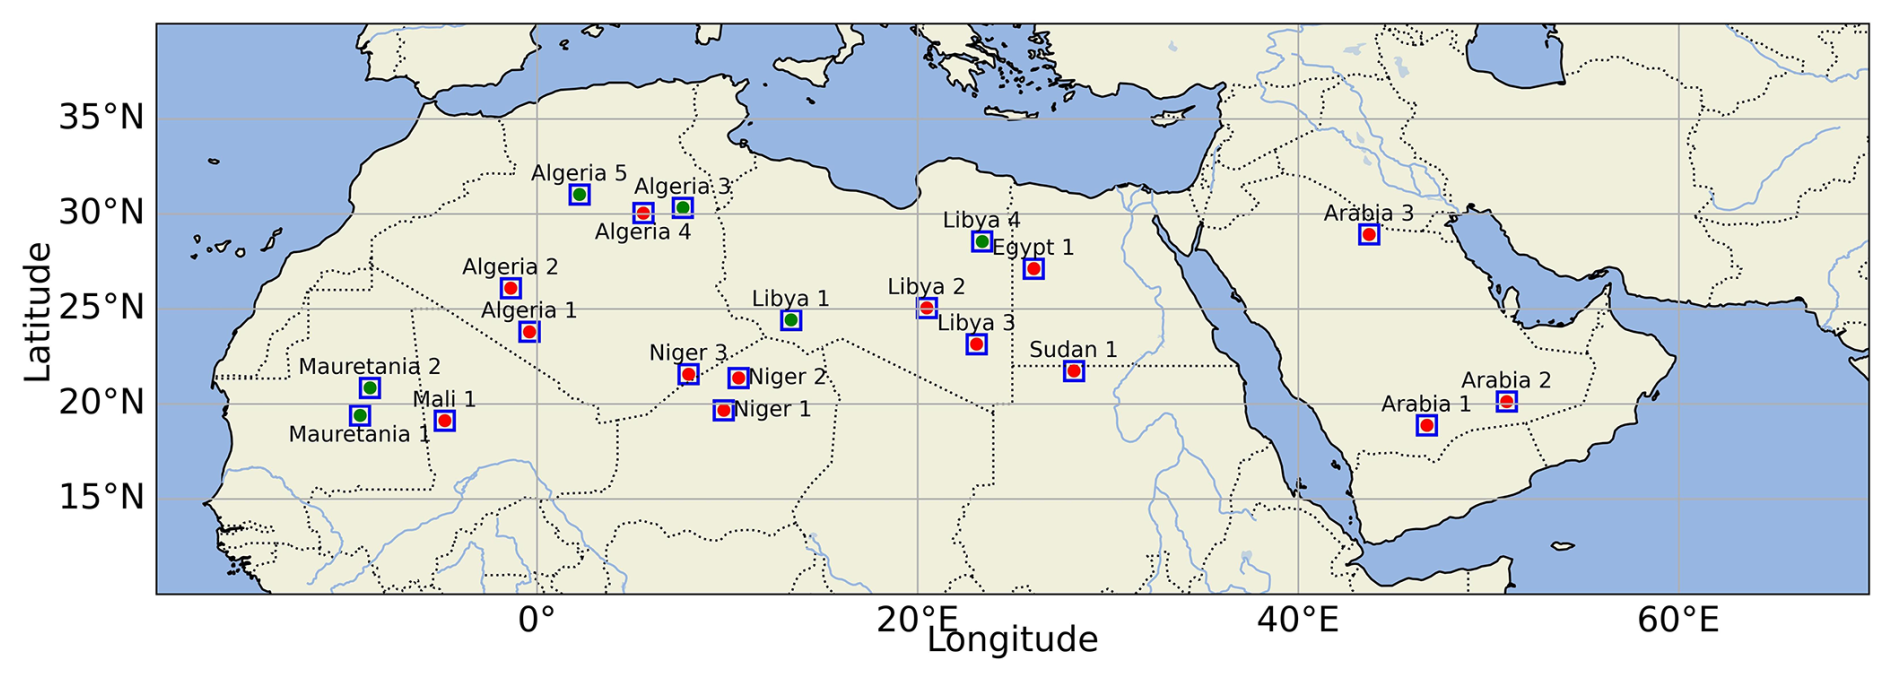
The PICS proposed by Cosnefroy et al. (1996) are shown in Fig. 1. These sites, located primarily in desert regions, were chosen due to their minimal vegetation cover and stable surface reflectance characteristics. These features made them particularly suitable for satellite sensor intercomparison and cross-calibration. Further details on the geographical locations of the PICS are provided in Table S1 in the Supplement.
This section outlines the methodological workflows, addressing the two key objectives of the study: (i) comparative assessment of GOME and SCIAMACHY across the PICS and investigated spectral ranges, and (ii) modeling stability score (SS) for each PICS based on derived metric parameters.
4.1 Comparative assessment of GOME and SCIAMACHY
4.1.1 Computation of the reflectance
The reflectance measurements from both sensors were computed with the assumption of a Lambertian surface. The reflectance from GOME (Rg) and SCIAMACHY (Rs) were computed based on Eq. (1):
where R(λ) is the reflectance as a function of wavelength, Iearth(λ) is the calibrated radiance as measured by the instrument as a function of wavelength, ϕo is the solar zenith angle, and Esun is the solar irradiance as measured by the instrument.
4.1.2 Retrieving of time series of reflectance from GOME and SCIAMACHY data
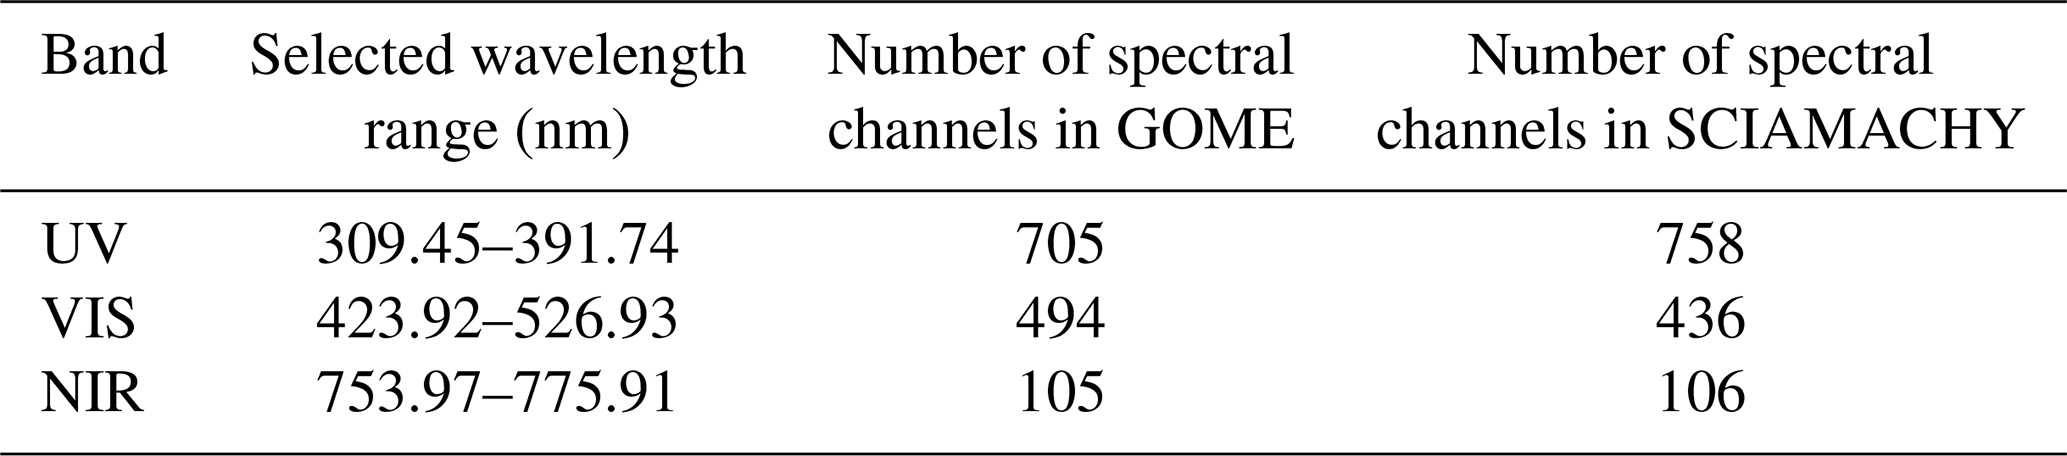
The reflectance data from the complete archival record of ESA's GOME and SCIAMACHY spectrometers over each PICS were retrieved. The retrieved reflectance data spanned spectral ranges in UV/VIS/NIR. The selected wavelength ranges and the corresponding number of spectral channels are presented in Table 2. In this paper, the term “spectral channel” referred to an individual spectral pixel of the detector, whereas “spectral band” denoted the detector channel. The selected wavelength ranges were identical to those used in the Fundamental Data Record for Atmospheric Composition (FDR4ATMOS) project for performing cross-calibration between GOME and SCIAMACHY (ESA, 2025a; Owda et al., 2026). These spectral ranges contain absorption features of numerous atmospheric gases.
Table 2Characteristics of the selected wavelength ranges for each spectral band, including the number of spectral channels corresponding to each band for the GOME and SCIAMACHY sensors.
For each satellite overpass, reflectance values were extracted within a 1.5°×1.5° bounding box centered over the PICS. This area was chosen to be larger than the actual PICS extent because the GOME pixel size exceeded the PICS dimensions, resulting in only a single reflectance value per overpass. In contrast, SCIAMACHY could provide multiple reflectance values within the PICS, and their average was used for analysis.
We applied a threshold of CF≤0.25 to filter the time series of both sensors. This threshold was chosen to minimize the influence of cloud contamination on the observed reflectance values, as high CF could significantly alter the magnitude and variability of the measurements. As a result of applying the CF filtering, the number of samples was reduced by an average of 18 % and 8 % for GOME and SCIAMACHY, respectively. The original and filtered sample counts are reported in Table S1.
4.1.3 Deriving temporal stability metrics
For each investigated PICS site (Sk) and wavelength (λ), we extracted a set of statistical and signal-based features that described the temporal variability of the reflectance time series. The extracted features offered a multidimensional representation of the reflectance dynamic for monitoring sensors' performance and identifying the stability of spectral channels and sites. The parameters were categorized into two different groups as follows:
-
Basic statistical parameters. These parameters include the mean (μ), the standard deviation (σ), the coefficient of variation (CV), and the interquartile range (IQR).
μ describes the average reflectance over time (Eq. 2), σ is used to describe the absolute temporal variability around the mean (Eq. 3), CV describes the degree of variability in the reflectance time series (Eq. 4). IQR measures the statistical dispersion in the middle range of 50 % of the dataset (Eq. 5).
For each site Sk and λ from a sensor 𝒮 at time tn, the reflectance time series was denoted as
where N is the number of observations for each reflectance time series. The number of observations for each site is tabulated in Table S1. Q3 is the 75th percentile, and Q1 is the 25th percentile.
-
Trend and shape parameters. These parameters include the slope (m), the skewness (), and the kurtosis () of the reflectance time series. The slope was estimated by fitting the reflectance to the linear regression model (Eqs. 6 and 7). It describes the long-term changes and trends in the reflectance over time. γ1 detects asymmetry in the reflectance distribution and gives insights about the anomaly (Eq. 8). γ2 measures the tailedness of the distribution (Eq. 9).
4.2 Computing stability score
4.2.1 Refinement reflectance observations
To ensure SS reliability represents the temporal variability of the sites, the following steps were applied:
-
Exclusion of the O2 absorption bands. The spectral channels of the O2 A-band (759–770 nm) are strongly influenced by atmospheric absorption; therefore, this range of spectral channels was excluded from the SS calculation.
-
Linear angular correction of reflectance. This correction aimed to normalize the solar illumination and viewing geometry of the observations across all PICS to a common reference geometry. The correction was applied independently to each spectral channel to account for the sensitivity of reflectance to variations in SZA and VZA. By doing so, the angular-induced variability in TOA reflectance was reduced according to Eq. (10).
where denotes the corrected TOA reflectance, is the original TOA reflectance prior to correction, and aλ and bλ represent the sensitivities (slopes) of TOA reflectance with respect to SZA and VZA, respectively, and SZAref and VZAref are the reference angles, set to 45 and 0°, respectively.
4.2.2 Parameterization of the stability score for each site
After retrieving the reflectance time series, heat maps were generated for the PICS. For each spectral channel, the corresponding parameters were derived and are presented in Table 3. These parameters were selected to estimate the SS of each PICS (see Fig. 2). The reasons for choosing these parameters are given in Table 3. All selected parameters shared the same stability indicator, where lower values corresponded to higher temporal stability.
Table 3Summary of statistical parameters used for temporal stability assessment of the PICS and their physical interpretation in evaluating the stability of reflectance time series.
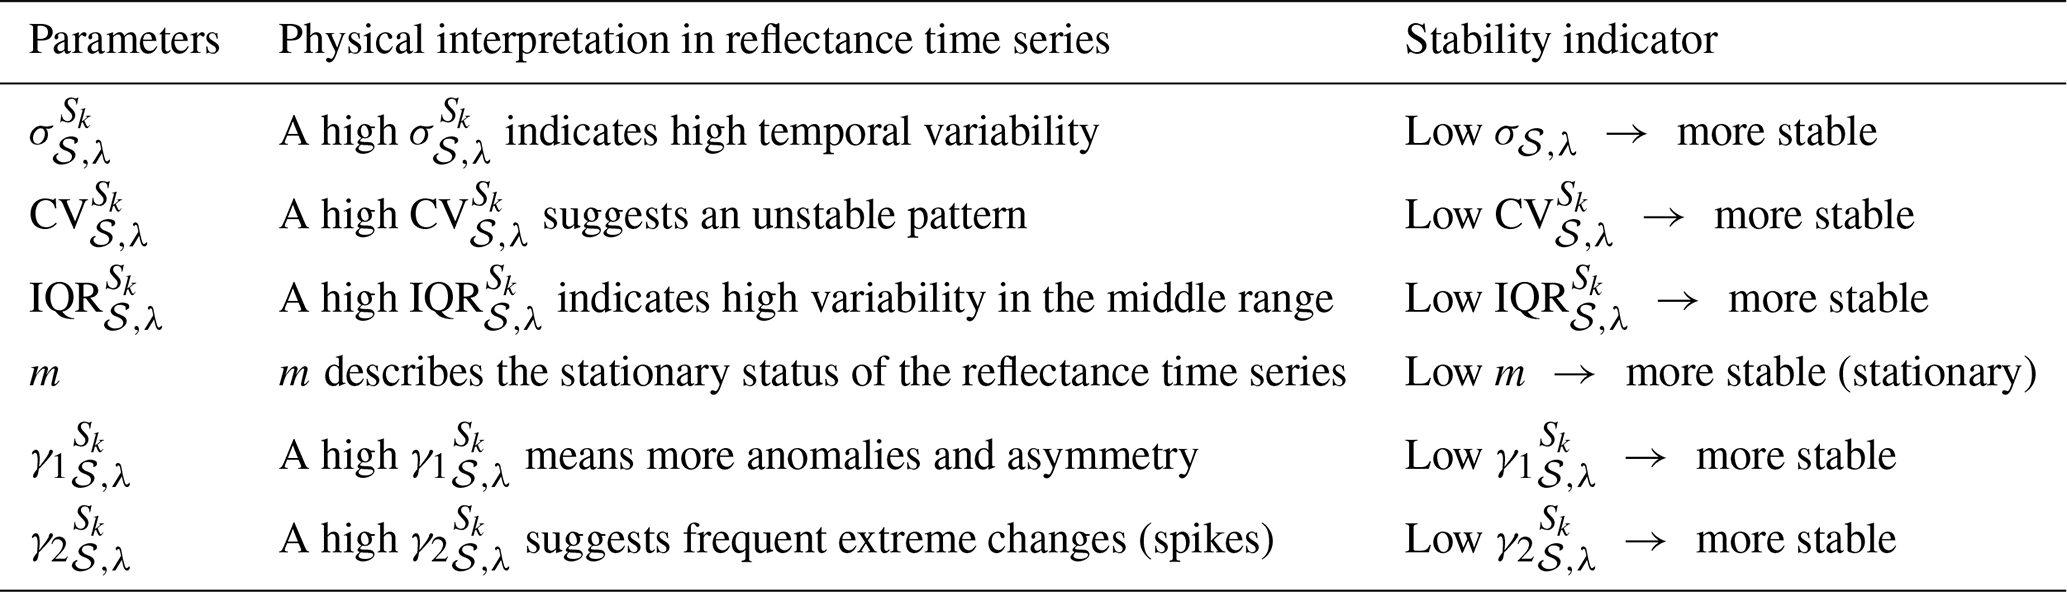
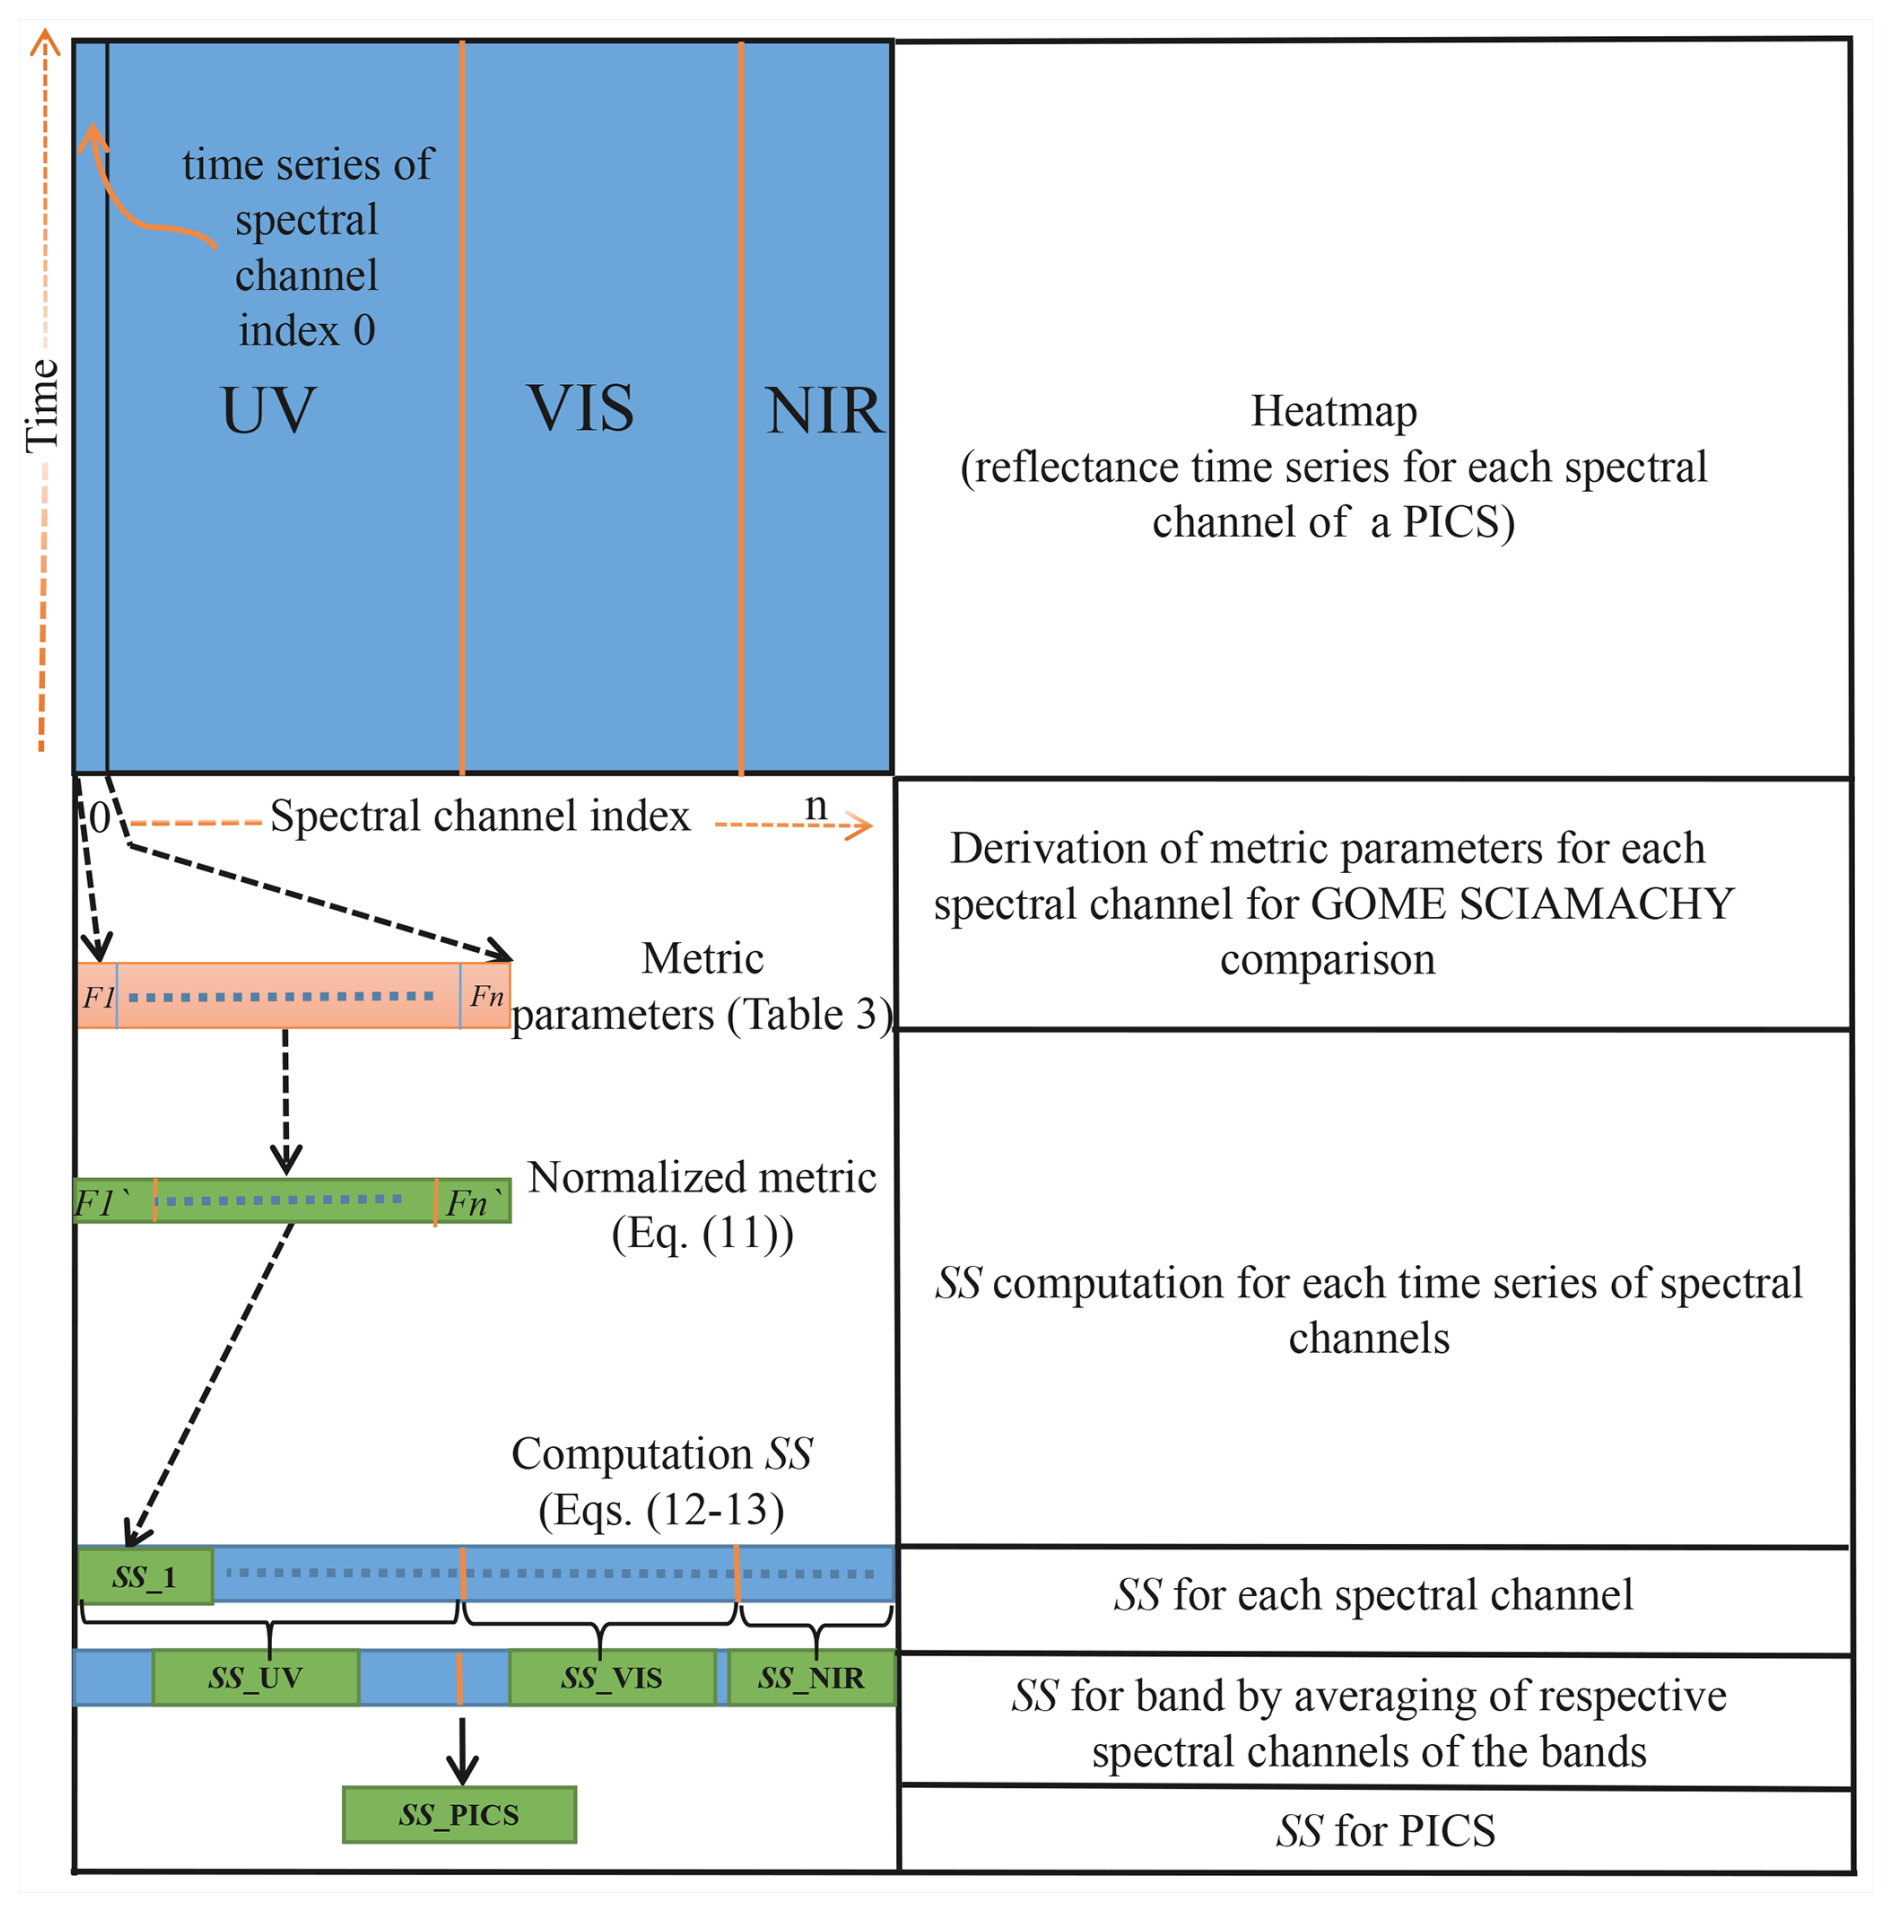
Figure 2Methodological framework outlining the key steps: retrieval of reflectance time series, derivation of temporal metric parameters for each spectral channel, computation of SS per channel, band_wise averaging of SS of spectral channels, and derivation of the final SS for each PICS site. The lower left block of the diagram shows the workflow of the SS computation for one spectral channel (spectral channel index 0). The process was iterative for all spectral channels. Later, the SS for bands and PICS were computed.
The selected parameters for each time series of a wavelength were normalized based on Min-Max scaling (Han et al., 2022), shown in Eq. (11). This normalization aims to prevent large numerical ranges from dominating the magnitude of SS. The scaled parameters were in the range of 0 to 1.
where F refers to the statistical parameters in Table 3. For each spectral channel, is the normalized parameter.
SS was computed based on Eq. (12), in which the weight of parameters was equal for all.
where K is the number of features.
The overall SS of a PICS was represented by the average of of the whole spectrum (see the illustrative diagram in Fig. 2).
where j is the number of spectral channels, is the stability score of a spectral channel of a wavelength λ.
5.1 GOME and SCIAMACHY reflectance time series of PICS
The reflectance time series of the PICS were retrieved under conditions of CF less than 0.25. Libya 4, one of the PICS endorsed by CEOS, WGCV, and IVOS, has been extensively used in previous studies for long-term stability assessments and sensor calibration (Lacherade et al., 2013; Barsi et al., 2018; Khadka et al., 2021; Helder et al., 2013). As a representative example, Libya 4 was selected for detailed visualization of the reflectance time series obtained from the GOME and SCIAMACHY sensors.
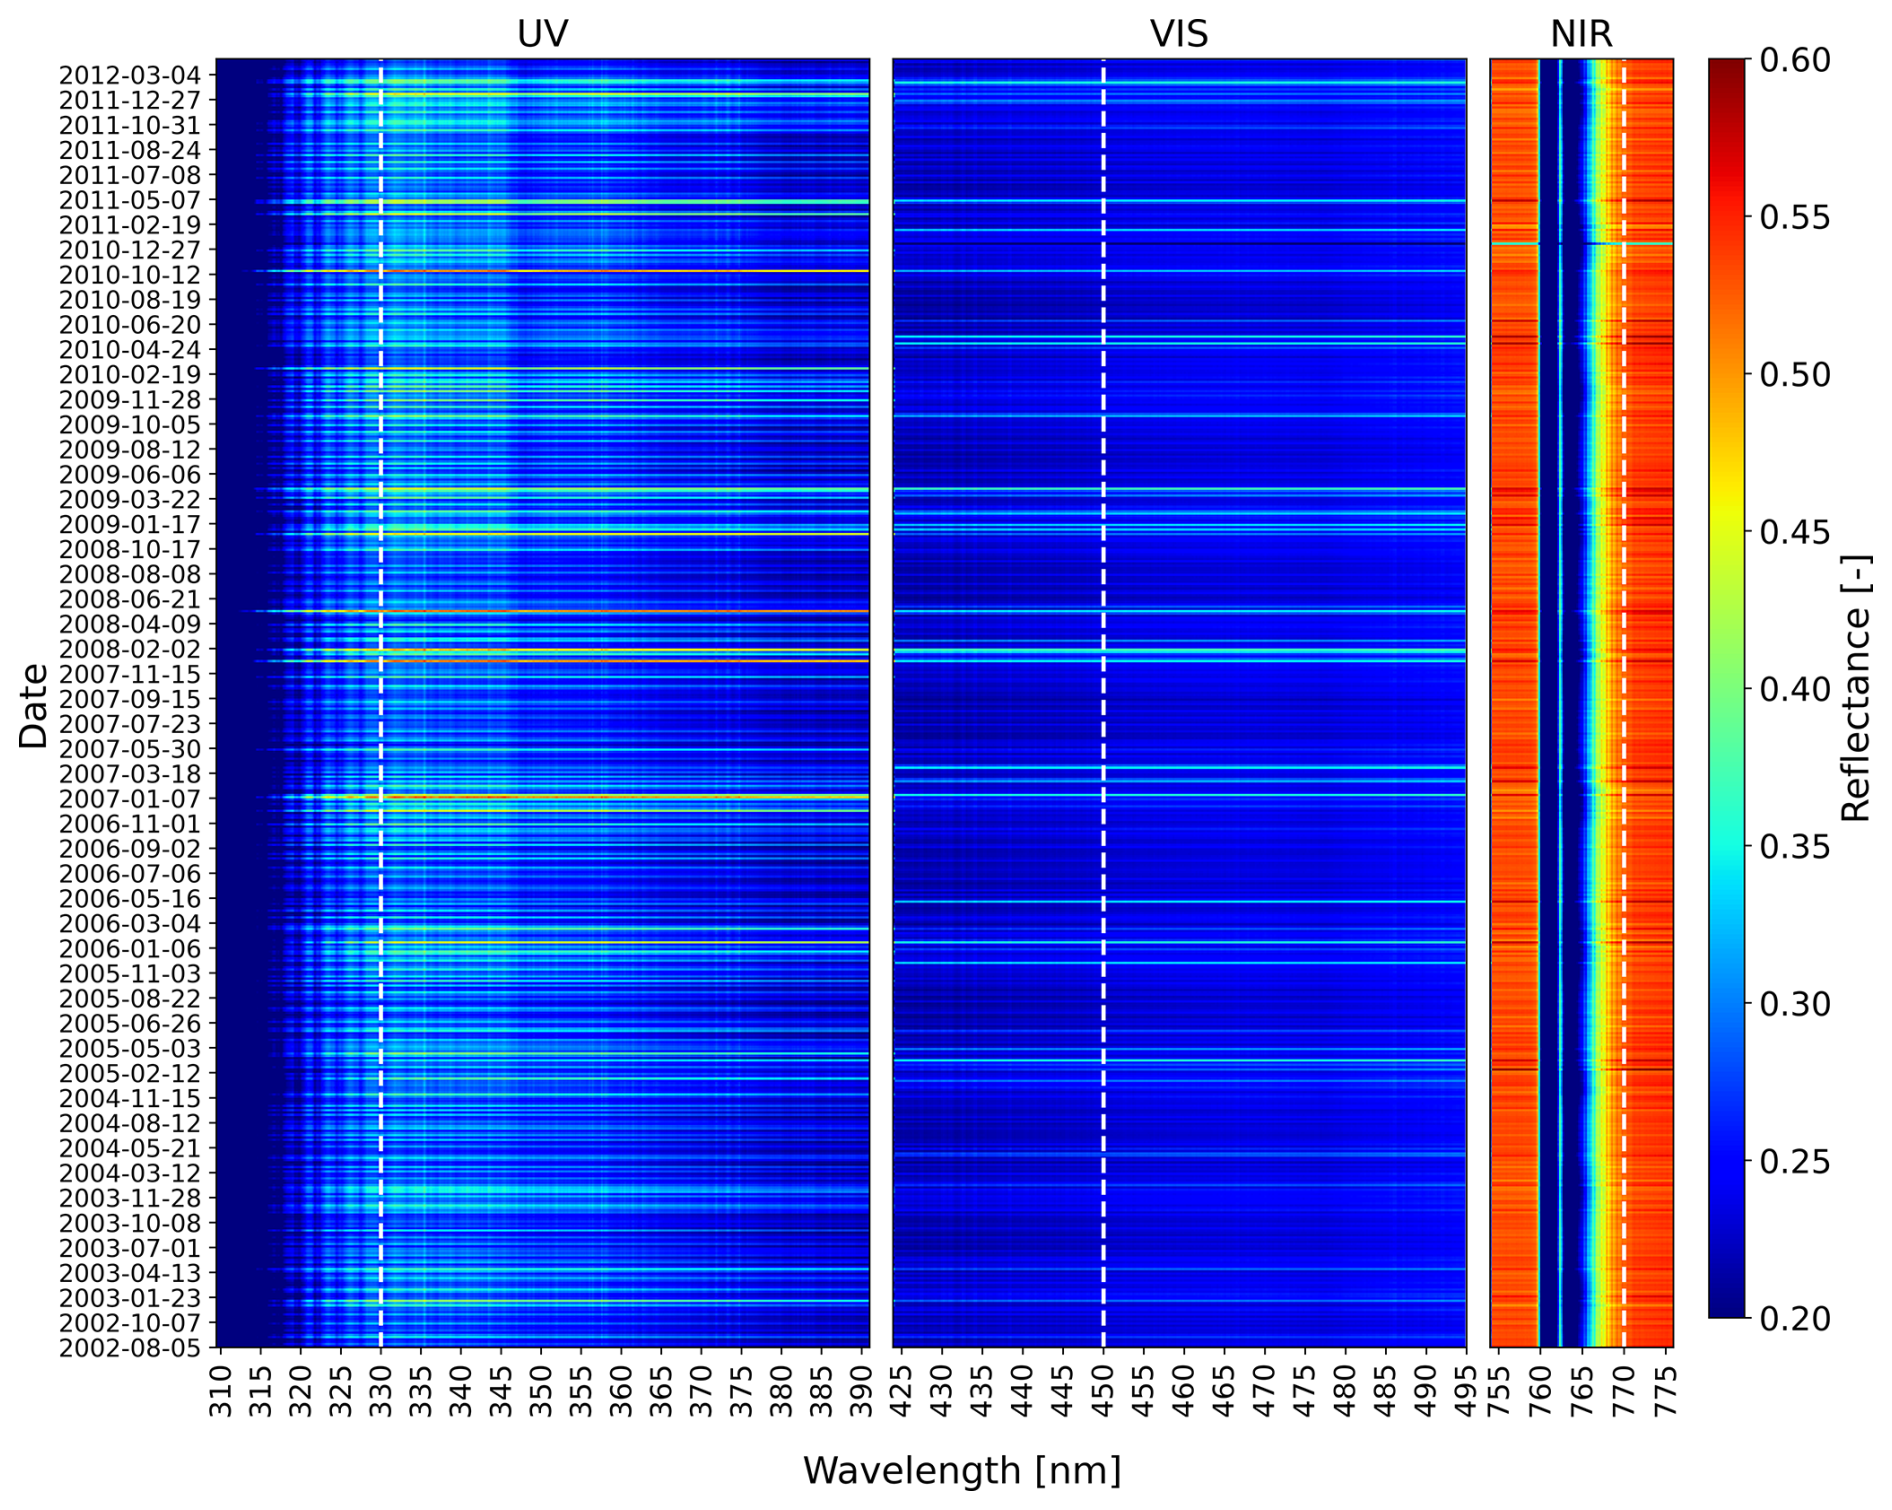
Figures 3 and 4 present the corresponding heatmaps of reflectance measurements from GOME and SCIAMACHY, respectively. At certain points in time for GOME (Fig. 3), higher values of the reflectance were observed across the whole spectrum (horizontal bright lines). In the UV, the value of the reflectance exceeded the average value due to instrument degradation, particularly towards the end of the GOME mission in 2011. The VIS and NIR spectral ranges were more uniform. In the NIR spectral range, O2 A-band was visible with low reflectances around the center of the band. Similar behavior was observed for SCIAMACHY as shown in Fig. 4. The main difference was the absence of larger variations over long periods in the UV, suggesting better degradation correction compared with GOME.
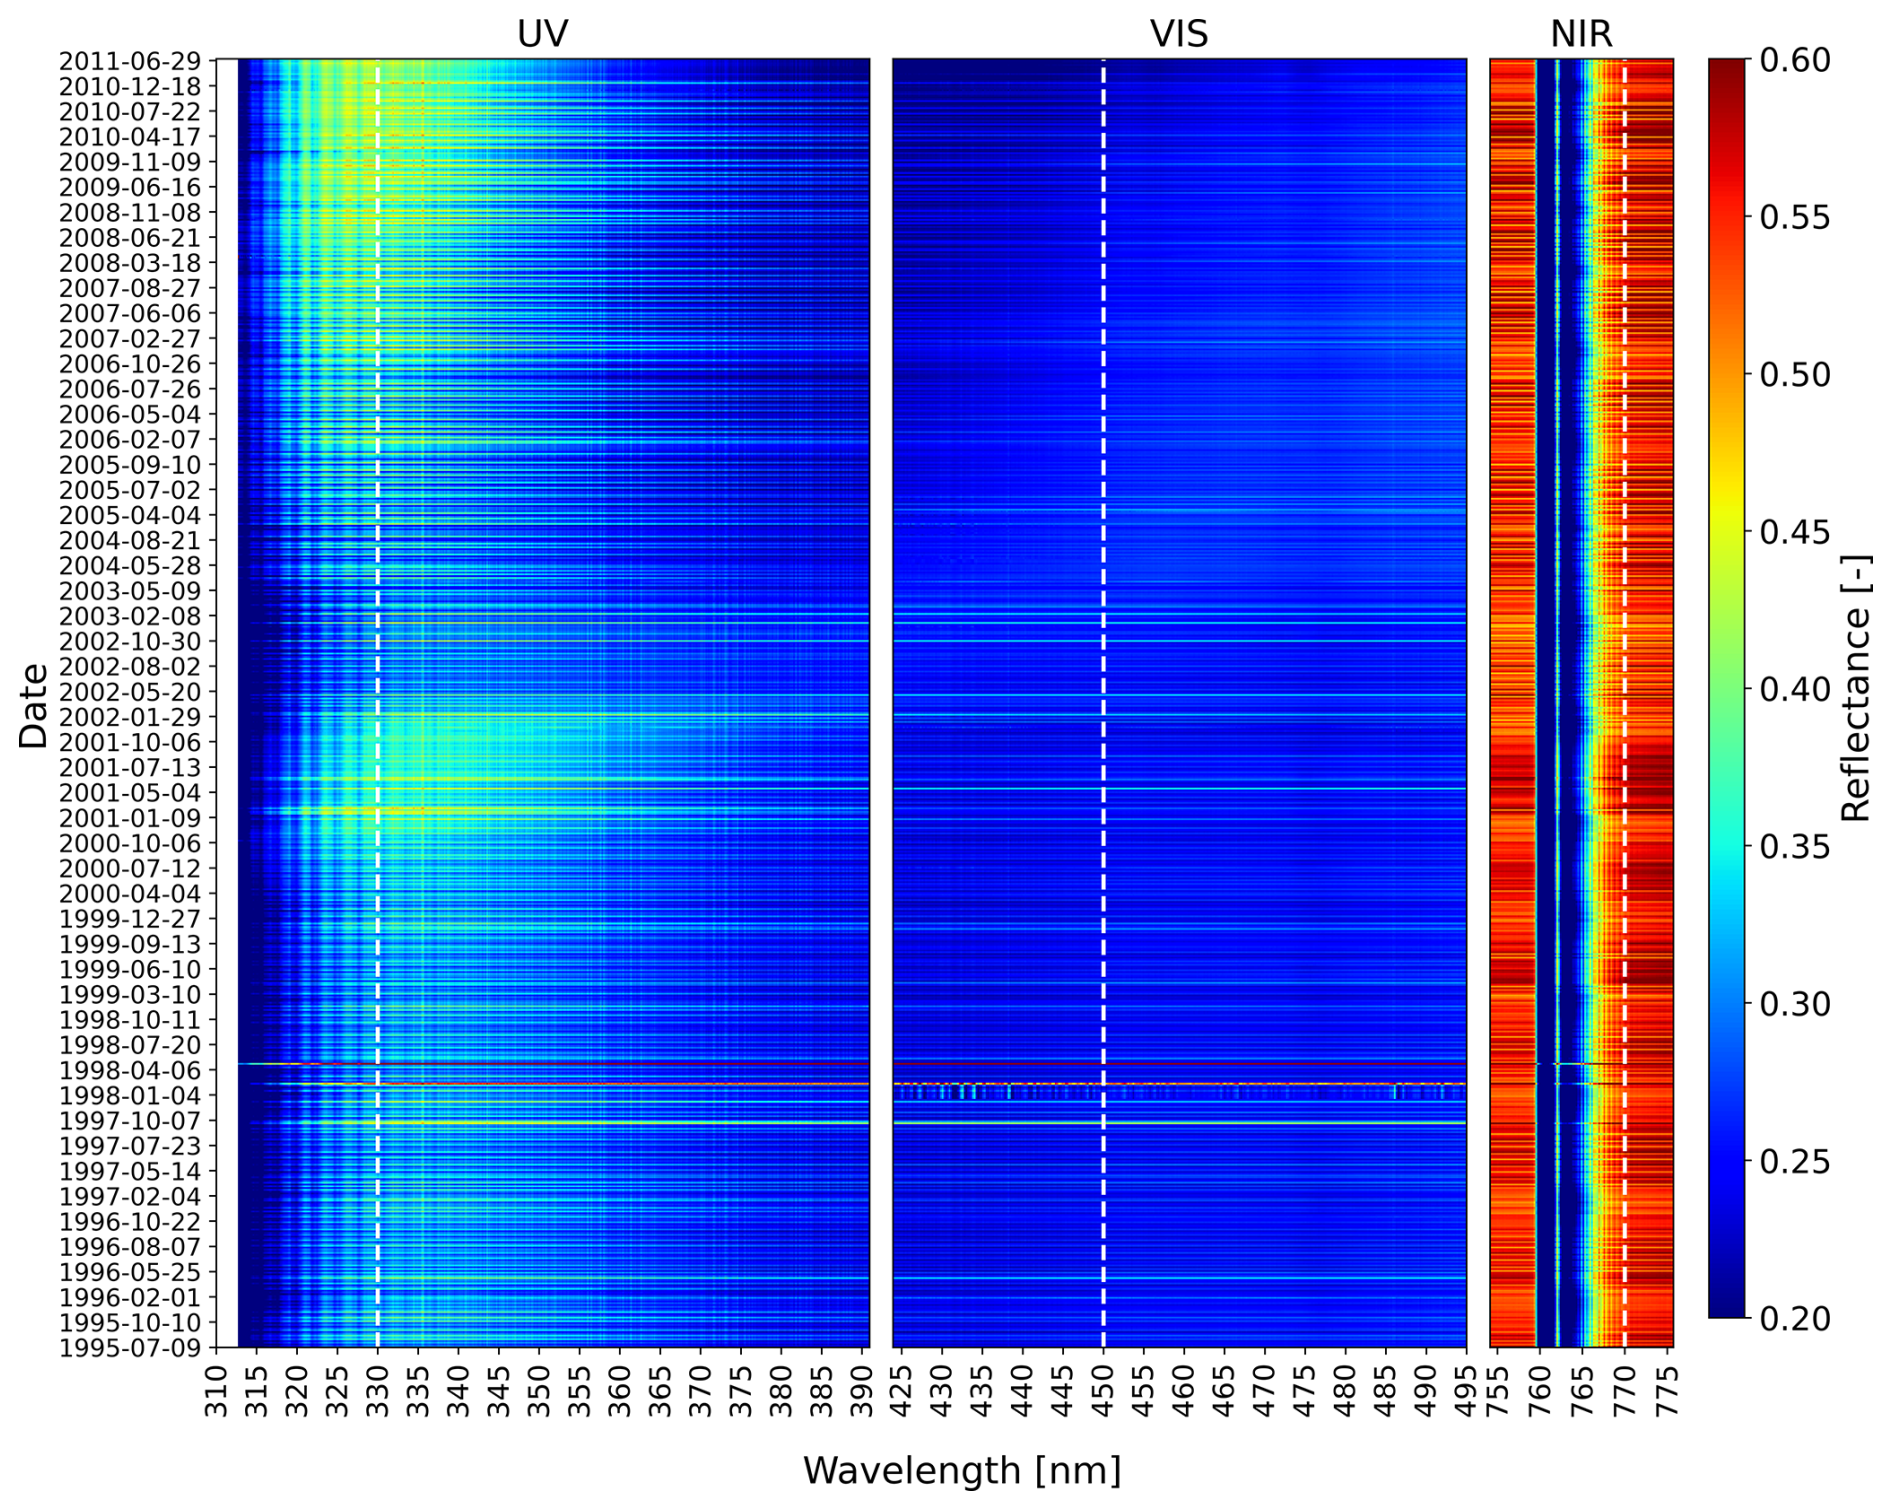
Figure 3Heatmap of the GOME reflectance observations (N=716) over Libya4. Three representative wavelengths from the UV, VIS, and NIR regions are highlighted with white dashed lines, and their time series are shown in Fig. 5.
To gain further insight into the variability of the reflectance time series observed in the heatmaps, three wavelengths were selected. These wavelengths, located approximately at 330 (UV), 450 (VIS), and 770 nm (NIR), were indicated by white dashed lines in the heatmaps. Figures 5 and 6 show the corresponding reflectance time series at these wavelengths, derived from GOME and SCIAMACHY data, respectively.
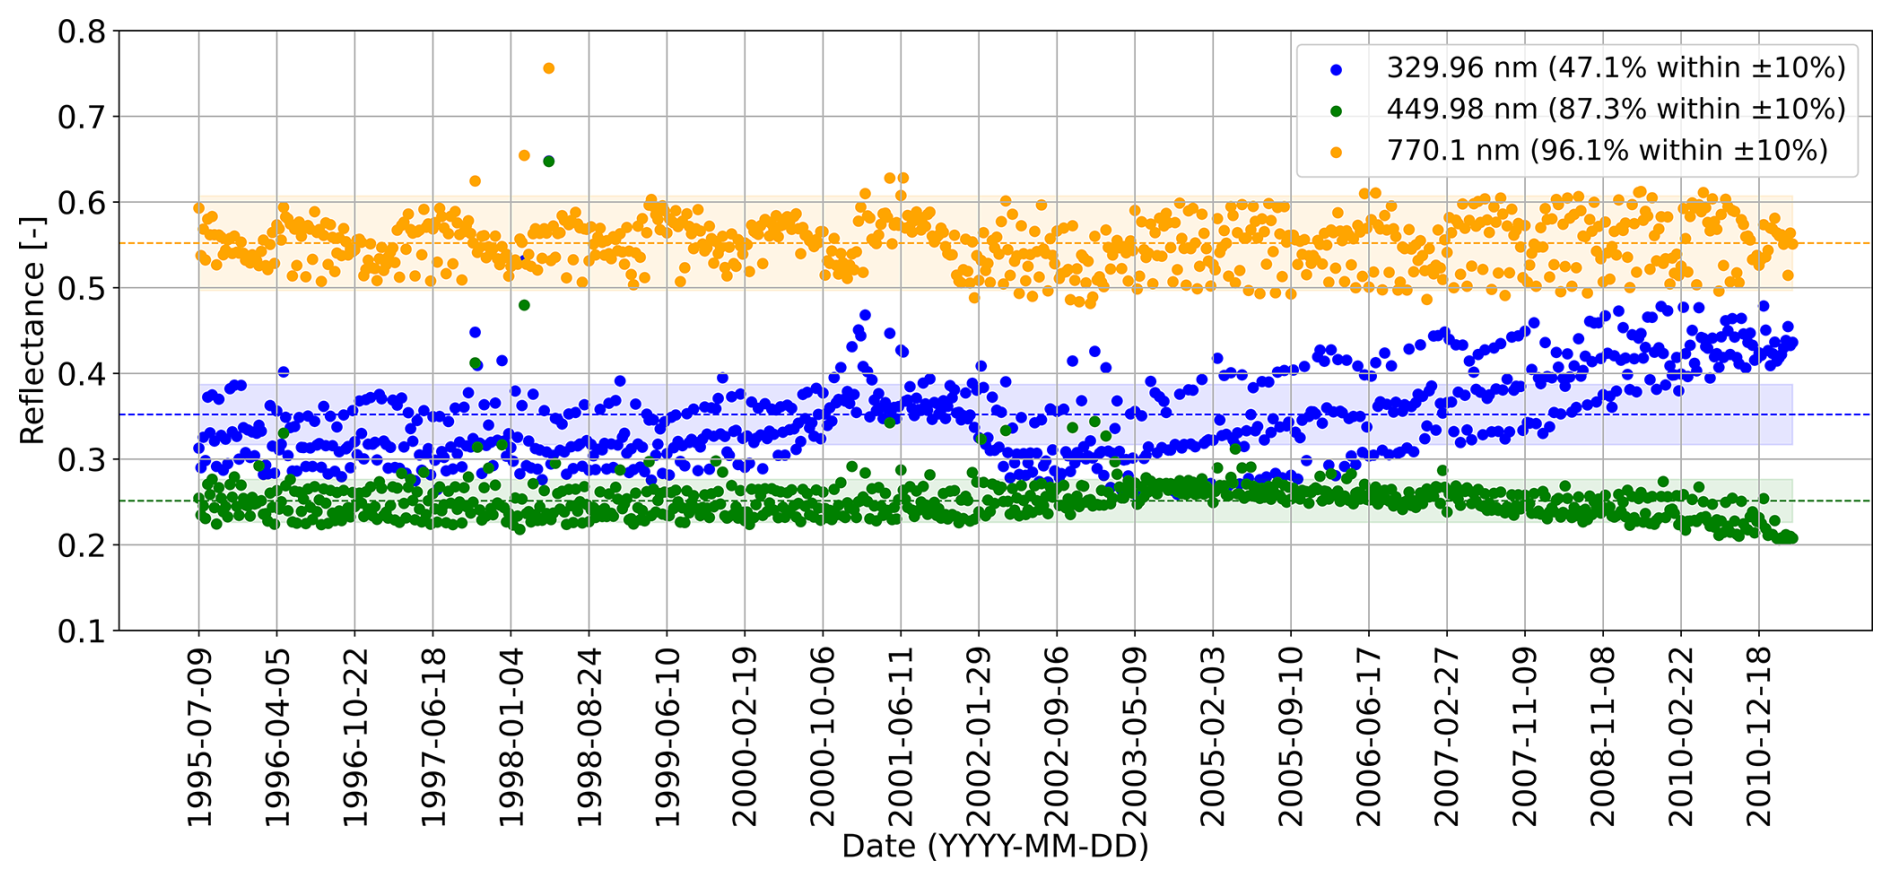
Figure 5The reflectance time series of the wavelengths: 329.96 nm in UV (blue), 449.98 nm in VIS (green), and 770.10 nm in NIR (orange) from GOME with (N=716).
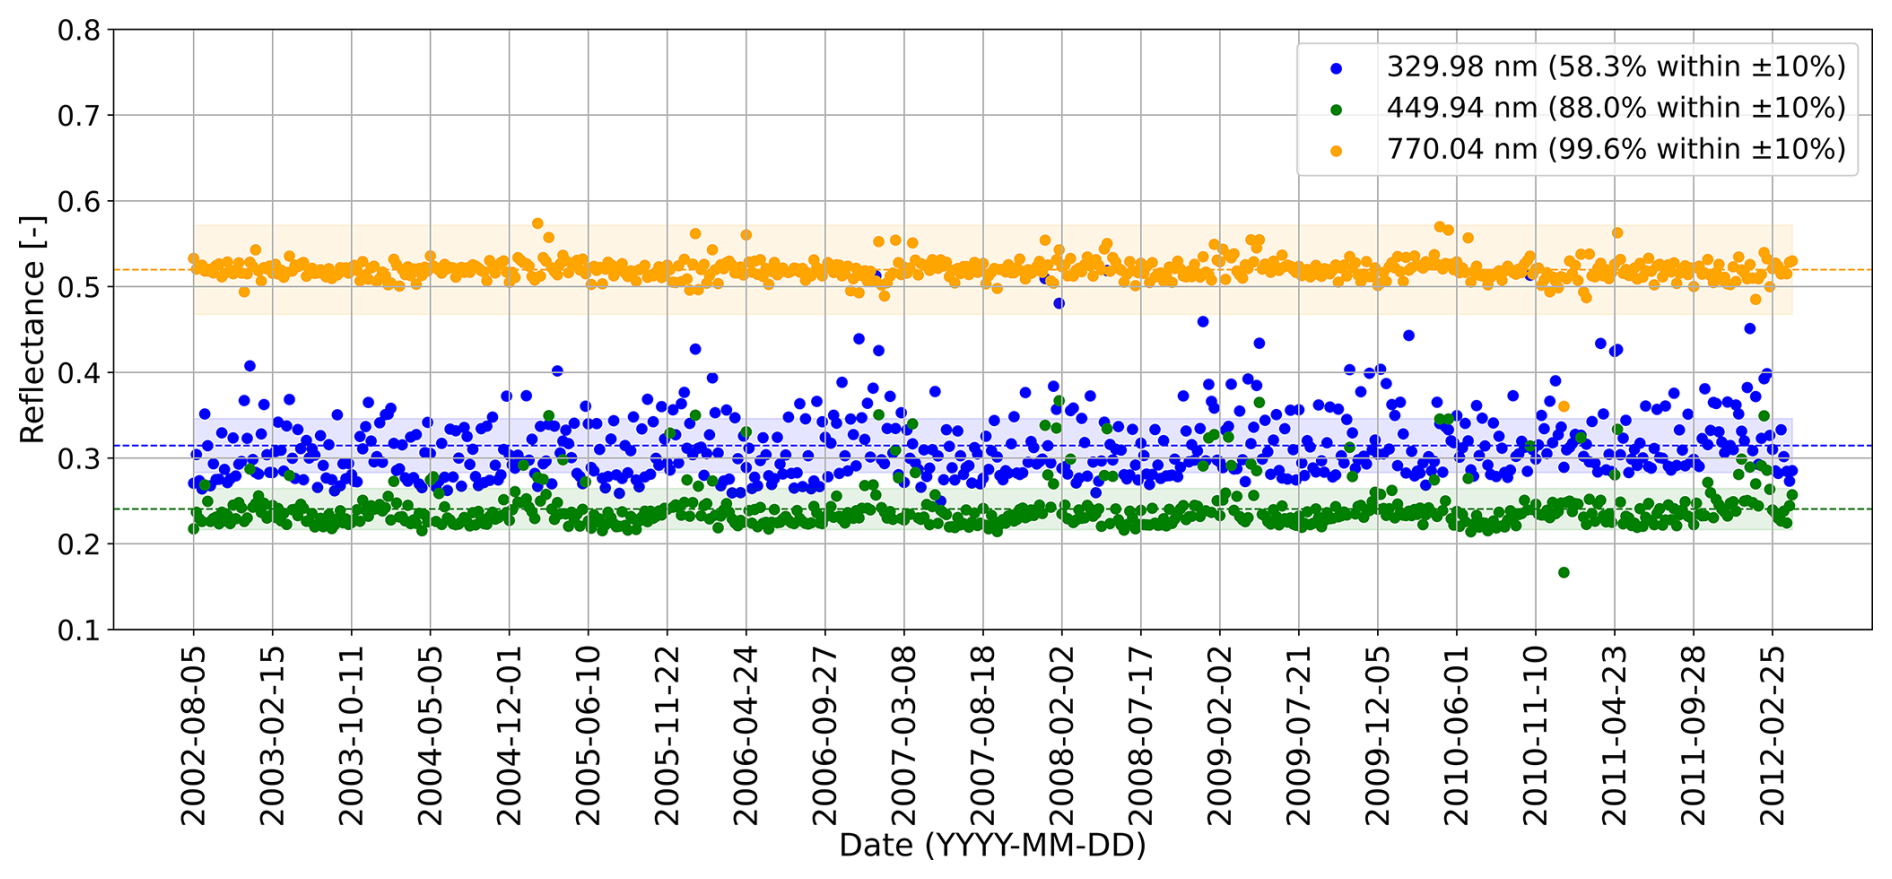
Figure 6The reflectance time series of the wavelengths 329.98 nm in UV (blue), 449.94 nm in VIS (green), and 770.04 nm in NIR (orange) from SCIAMACHY with (N=568).
The reflectance time series at the UV wavelength of GOME at 329.5 nm exhibited significant fluctuations, with approximately 47 % of the observations within ±10 % of the average value. A noticeable increase in reflectance was observed in 2001 and toward the end of the GOME mission due to degradation effects (see Fig. 5). Additionally, the reflectance time series exhibited three clearly separated clusters, likely resulting from the dependence of reflectance on VZA. In contrast, the selected wavelengths in the VIS (436.47 nm) and NIR (736.19 nm) regions demonstrated greater consistency, with 87 % and 96 % of the observations, respectively, remaining within ±10 % of their average values. Among them, the VIS wavelength showed a particularly more consistent pattern.
For SCIAMACHY, the average reflectance values at the corresponding wavelengths were comparable to those from GOME (see Fig. 6). A similar fluctuation pattern was observed in the UV band (329.98 nm), about 58.3 % of observations were within ±10 %. Additionally, sinusoidal-like patterns were more apparent in the SCIAMACHY UV time series than in GOME. Unlike the GOME UV reflectance time series, the scatter distribution did not show distinct clustering. The reflectance time series for the selected VIS (449.94 nm) and NIR (770.04 nm) wavelengths appeared even more consistent than those of GOME, with no evident degradation effects over the mission period.
5.2 Temporal metrics from GOME and SCIAMACHY reflectance time series
The derived temporal metrics of the GOME and SCIAMACHY reflectance time series of each spectral channel from the investigated PICS are presented in Figs. 7 and 8. These results offered a comprehensive comparison of statistical features across the PICS sites and spectral channels.
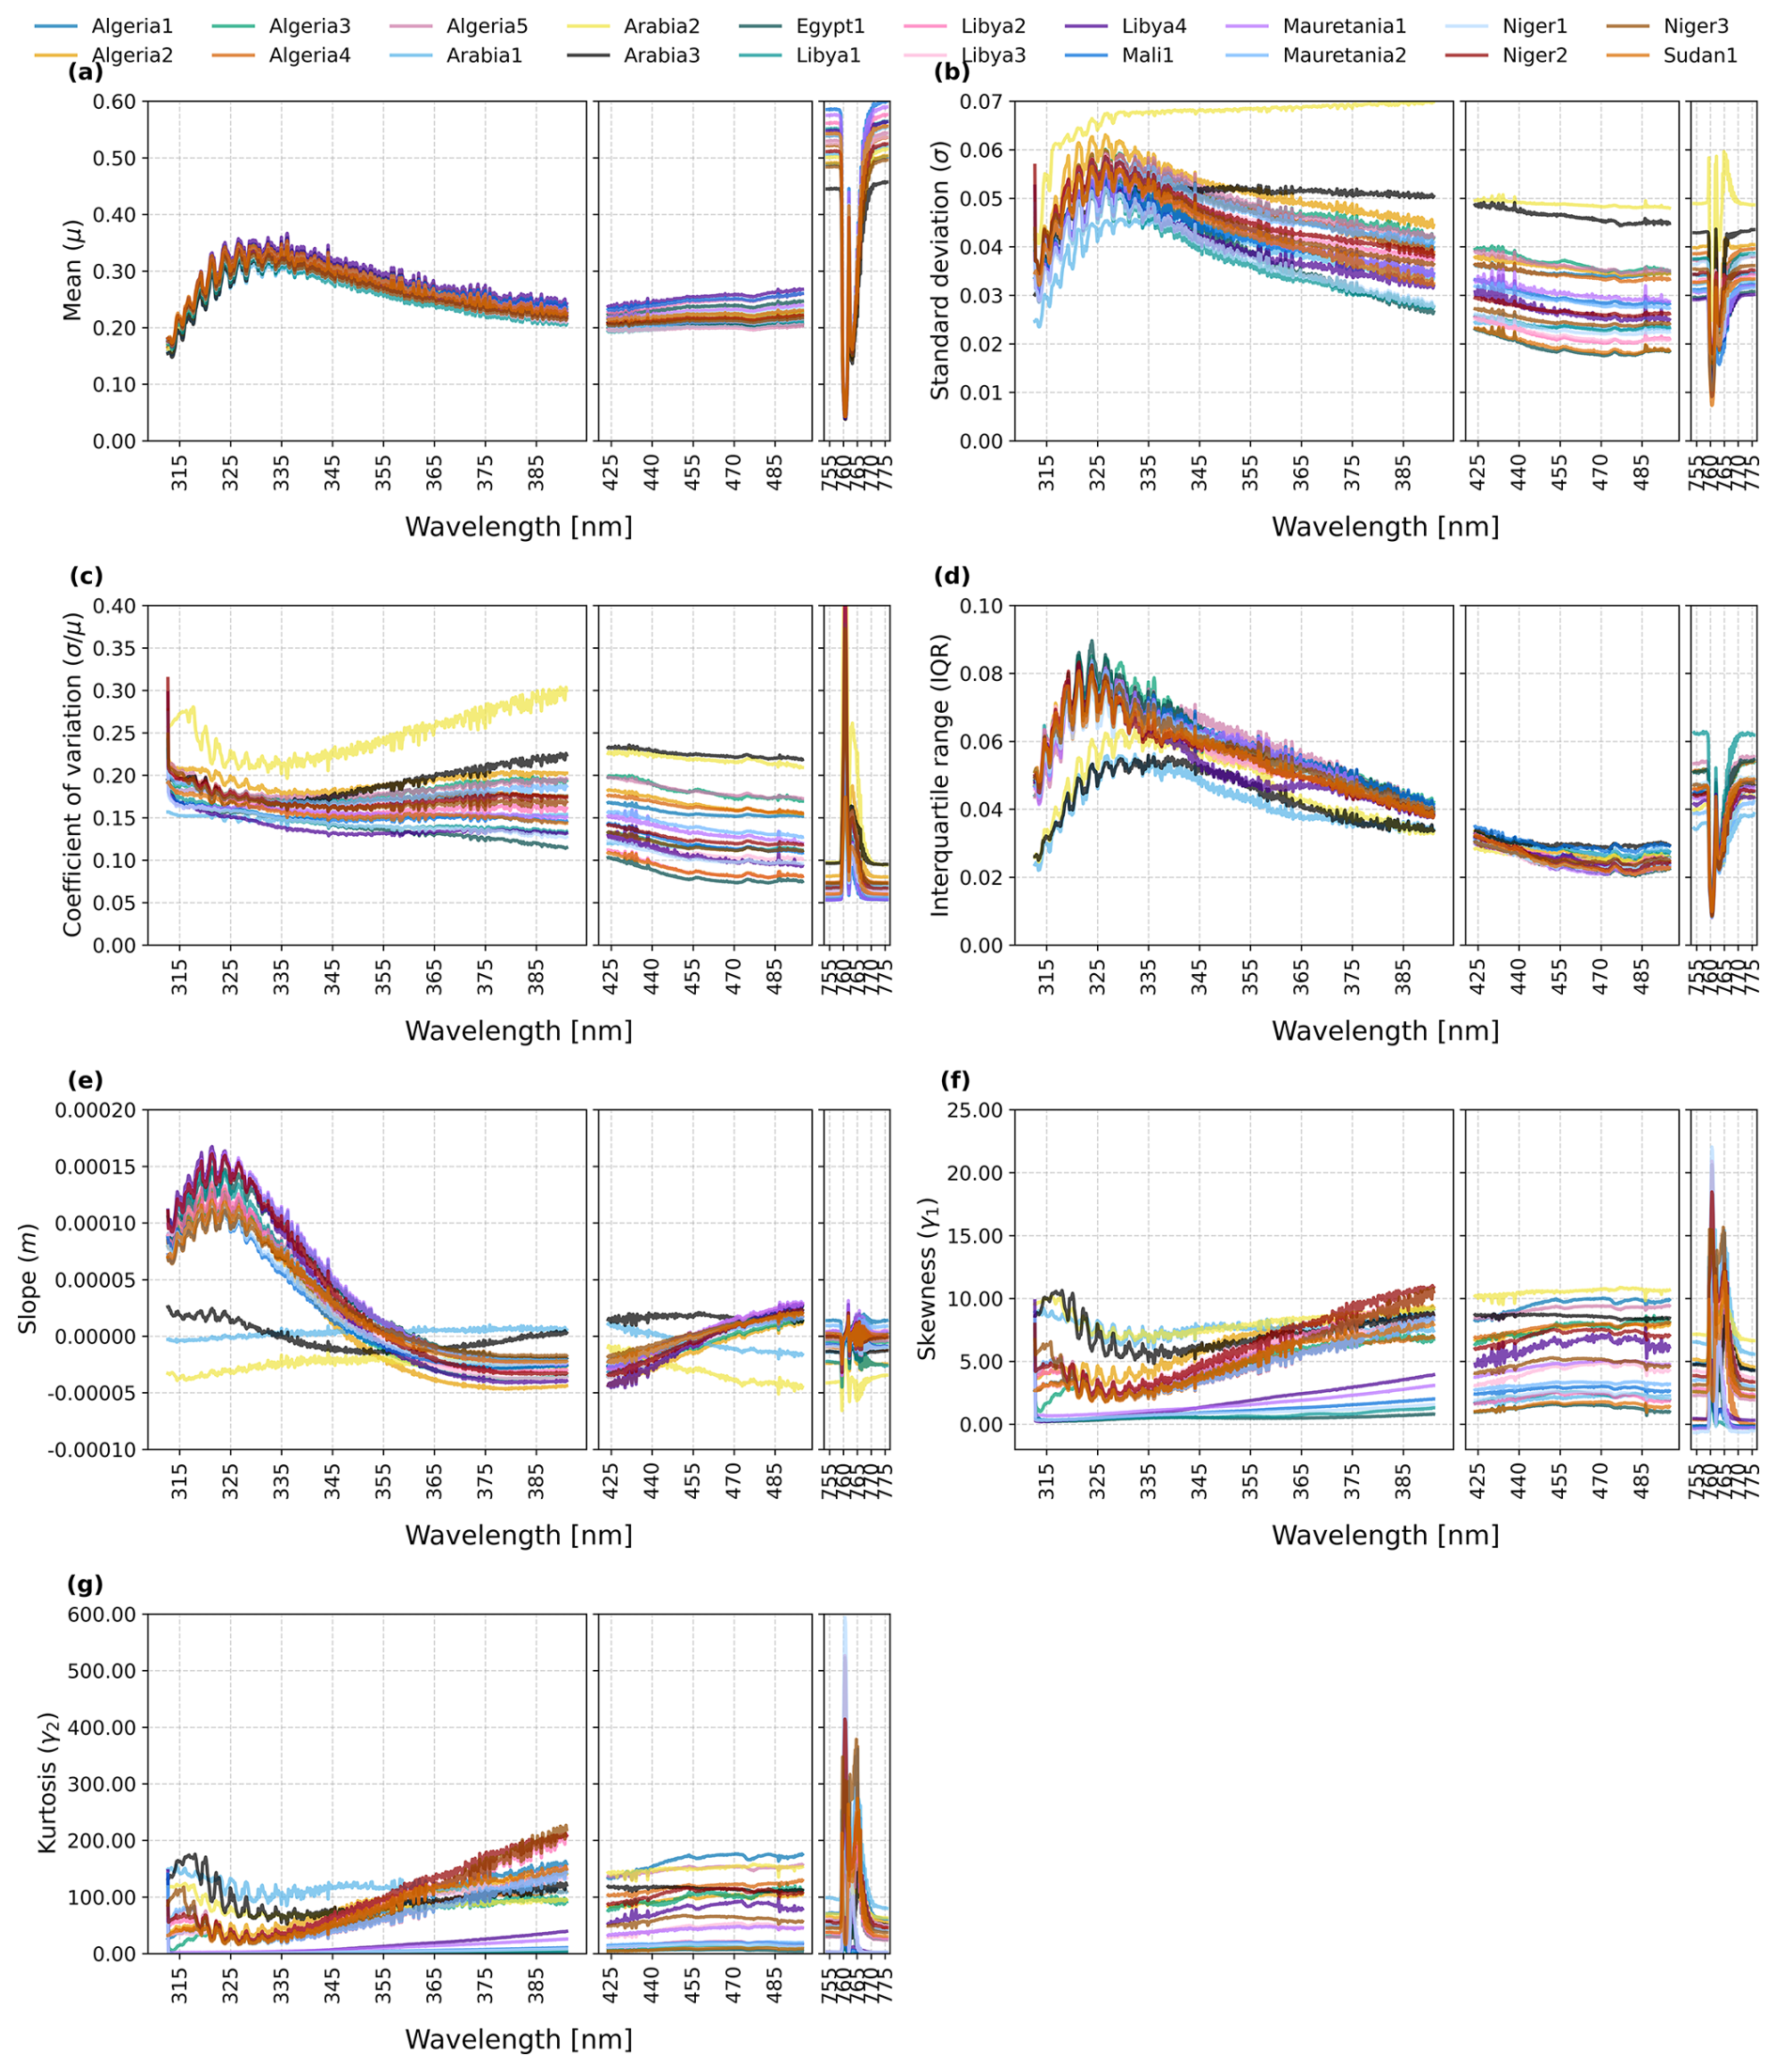
Figure 7Temporal metrics of GOME reflectance time series of the investigated PICS include mean, standard deviation, coefficient of variation, interquartile range, slope, skewness, and kurtosis. Each subplot consists of three boxes, which refer to the wavelength ranges in UV/VIS/NIR.
The mean of the GOME reflectance time series in Fig. 7a demonstrated relatively low reflectance values in UV and VIS and higher reflectance values near the O2 absorption window (O2 A-band). The standard deviation in Fig. 7b and IQR in Fig. 7d showed higher UV variability for most sites. However, tighter spreads of the IQR were observed in VIS (see Fig. 7d). The CV in Fig. 7c showed notably higher values and a wide range across spectral channels and sites. The CV values were suddenly increased in the O2 A-band. This was likely due to the low mean reflectance value in the absorption window. The slope values in Fig. 7e showed a notable pattern of degradation across most of the sites, particularly for the short wavelengths in UV. Smaller degradation patterns were observed in the VIS and NIR ranges. GOME reflectance time series demonstrated large magnitudes of skewness in Fig. 7f and kurtosis in Fig. 7g, suggesting higher variability and asymmetry across the spectral channels, especially in the O2 A-band in NIR, which could be due to the influence of the clouds and aerosols (Min et al., 2014).
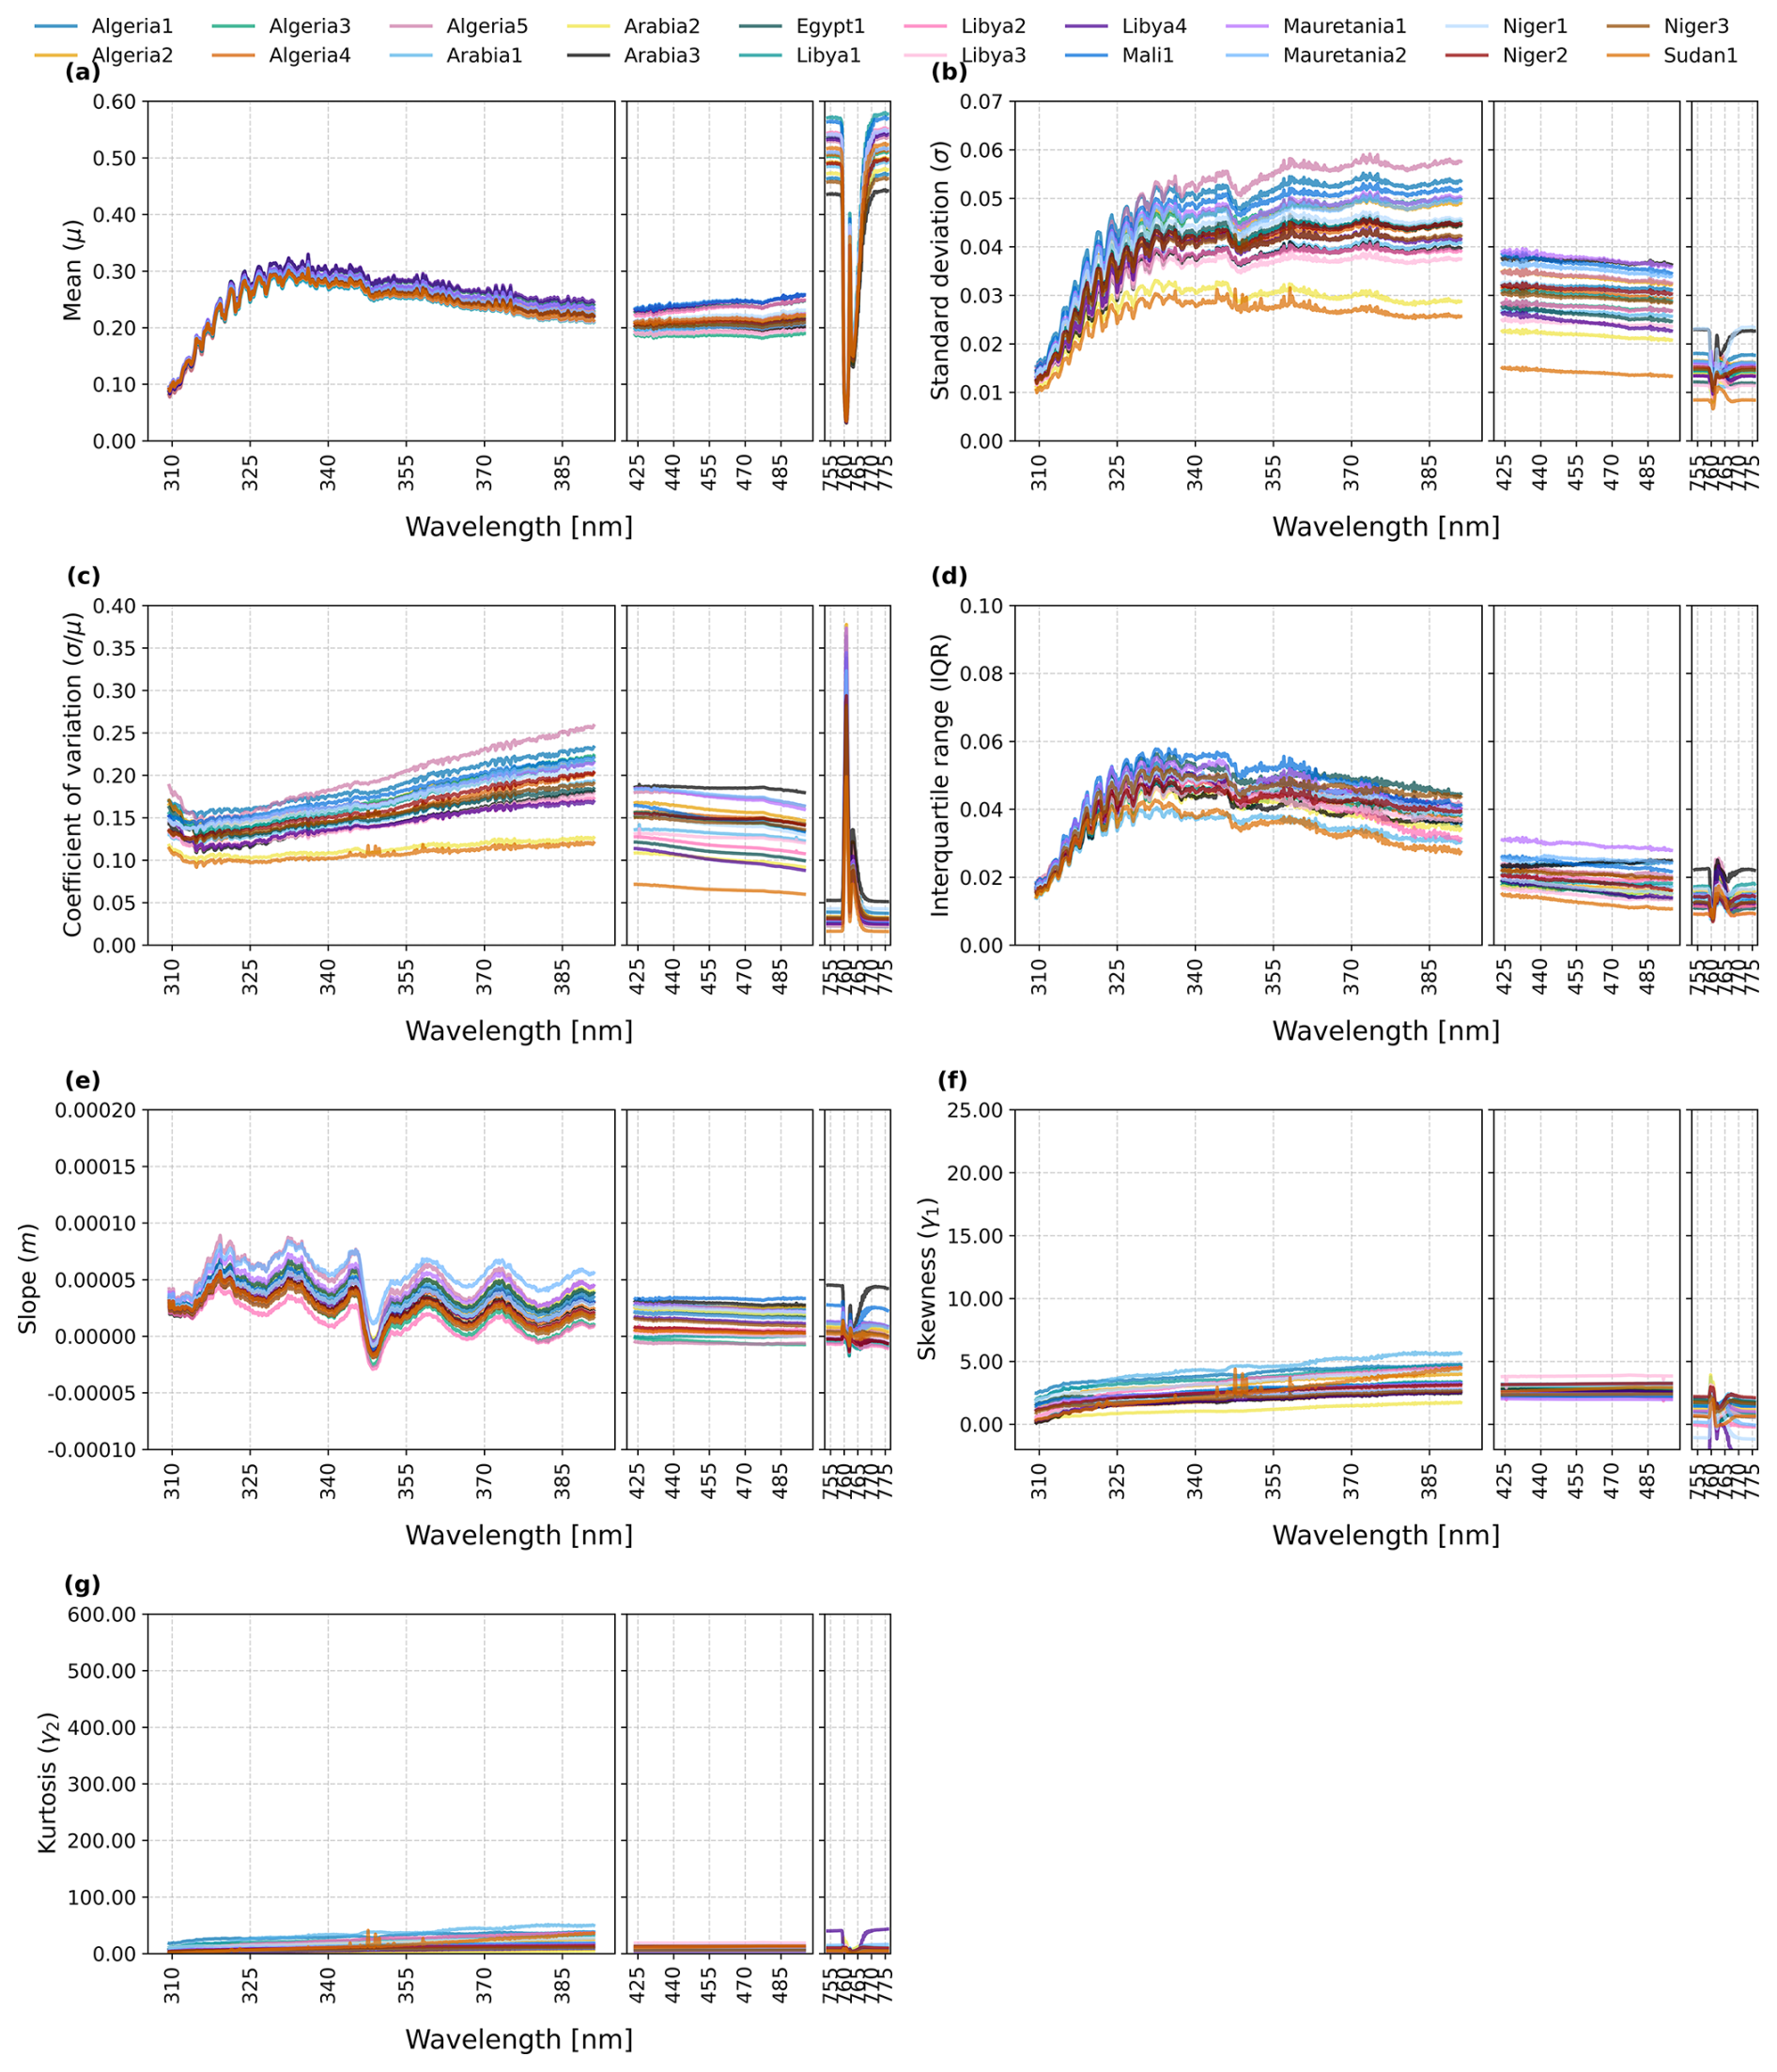
The mean reflectance values of SCIAMACHY were similar to GOME and showed similar patterns across all sites in Fig. 8a. There were relatively low reflectance values in UV and VIS and higher reflectance values in NIR near the O2 A-band. Low reflectance values were observed within the O2 A-band (759–770 nm), indicating strong atmospheric absorption. The standard deviation in Fig. 8b and the IQR in Fig. 8d provided insights into the temporal variability of reflectance. Higher values in the UV range suggested greater fluctuations and noise, while lower values were in the VIS and on both sides of the O2 A-band in NIR. The CV in Fig. 8c revealed differing levels of stability across spectral bands and among the PICS sites. In the UV, CV tends to increase with wavelength, while in the VIS, it remains relatively consistent. High CV values in the O2 A-band in the NIR. Overall, the results suggested greater temporal stability in the VIS and spectral channels adjacent to the O2 A-band compared to the UV. CV values among the sites range between 0.05 (5 %) and 0.20 (20 %). The slope values in Fig. 8e, especially in the UV, showed slight changes in the spectral signature of the sites. The oscillations in the slope of the UV channel were possibly caused by residual etalon variations. The dip around 350 nm was likely due to stronger degradation of the Band 2 detector, which was a known characteristic of the instrument. In contrast, many PICS sites exhibited slope values close to zero in the VIS and NIR, suggesting negligible long-term trends and stable reflectance behavior in these regions. The skewness values in Fig. 8f varied among sites and bands but remained consistent, reflecting differing degrees of asymmetry in the reflectance distributions. The VIS region exhibited more symmetric reflectance distributions compared to the UV. In the NIR, the absorption feature caused noticeable disruptions in symmetry. Similarly, kurtosis values in Fig. 8g, especially in the UV and NIR, suggested the presence of occasional outliers or extreme values. The VIS region, in contrast, showed fewer such anomalies.
The comparative analysis of temporal metrics for GOME and SCIAMACHY reflectance revealed different sensor performances and varying patterns across both PICS sites and spectral bands. Before assessing the stability of PICS, it is essential to first identify the most stable sensor data to be used in the analysis.
5.3 GOME versus SCIAMACHY: a comparative analysis
The averages of the metric temporal parameters of each spectral band and site are shown in Fig. 9. The average values were computed by taking the mean of the parameters across the wavelength ranges defined for each band in Table 2. Key findings from these temporal metrics for both sensors are presented in Table 4. It presents the comparison of GOME and SCIAMACHY for each extracted parameter of each band.
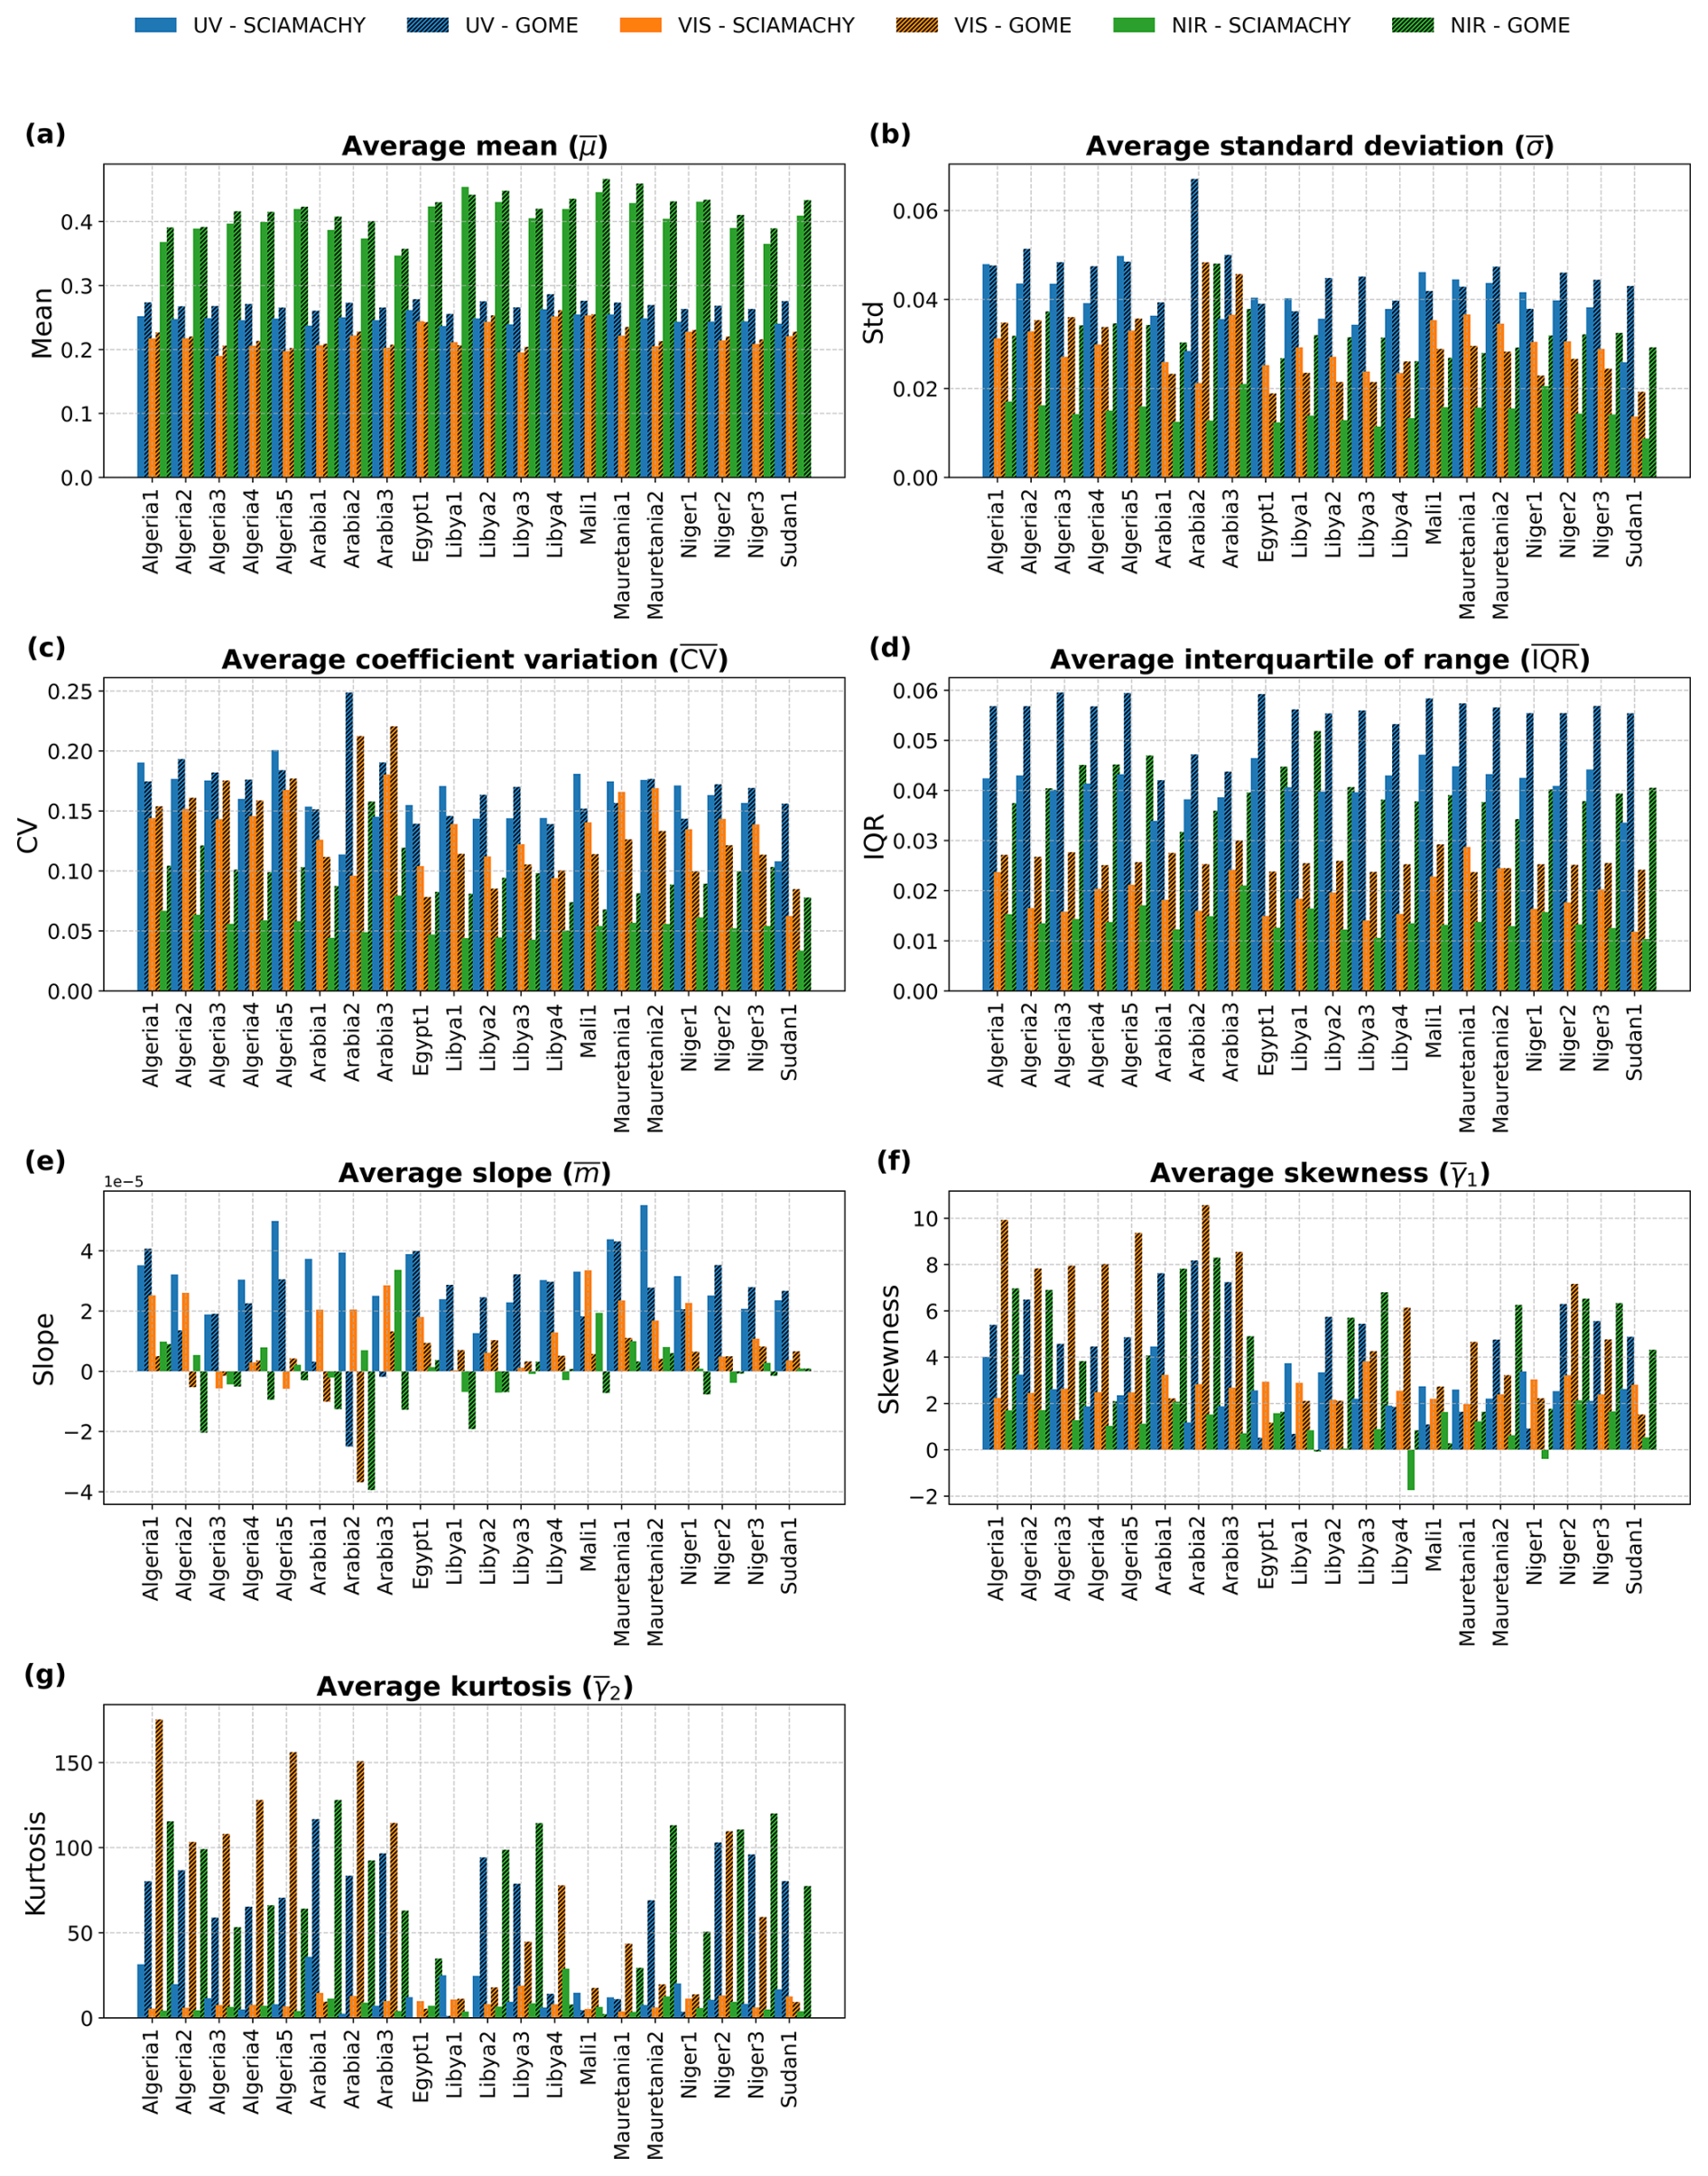
Figure 9Average of metric temporal parameters for the investigated PICS. For each PICS site and sensor, three bars represent the metric values in the UV, VIS, and NIR bands (blue, orange, and green, respectively). Solid bars denote SCIAMACHY results, while hatched bars denote GOME.
Table 4Comparison of the average of metric temporal parameters for the investigated PICS.
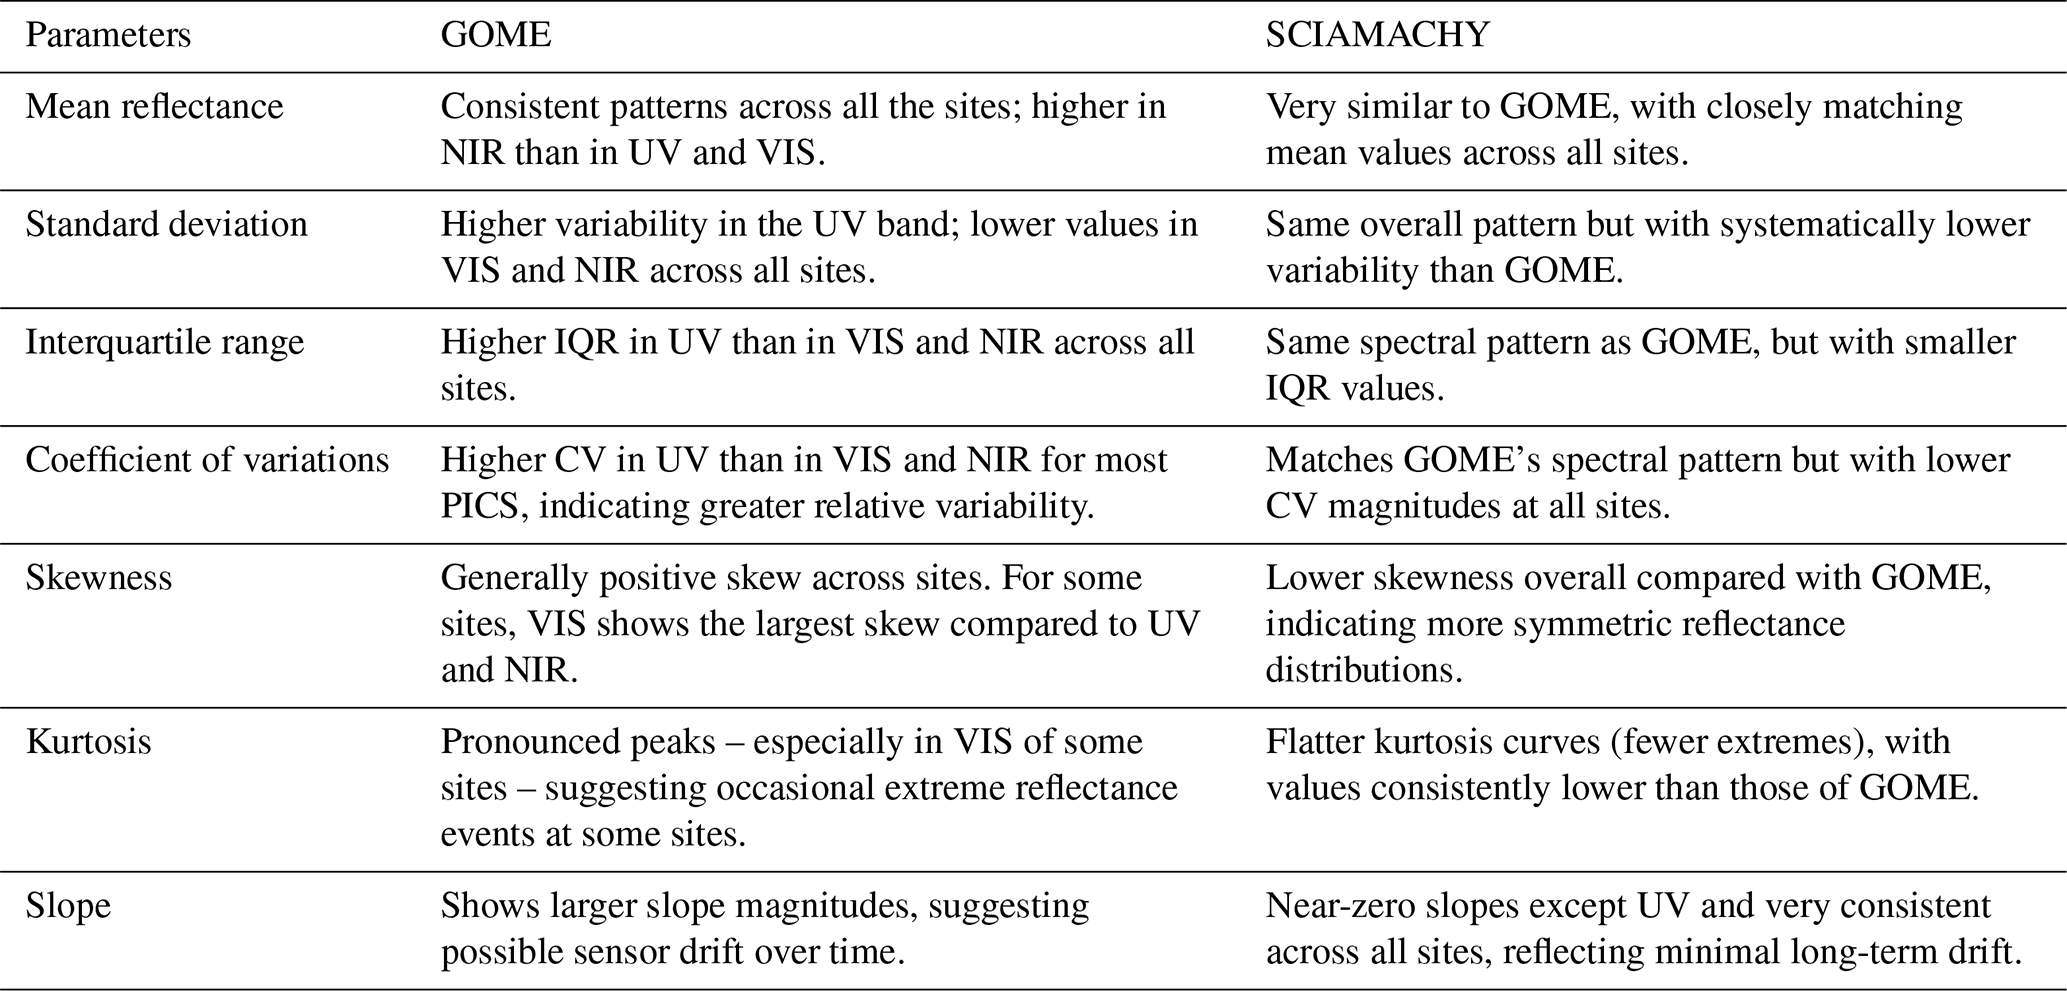
GOME and SCIAMACHY shared several characteristics, particularly in their mean reflectance profiles. Both sensors exhibited similar reflectance patterns across the spectral channels (Fig. 9a). While both sensors displayed high temporal variability in the UV band, they had less variability in VIS and the lowest in NIR (see Fig. 9b and c).
However, GOME consistently displayed higher temporal variability and drift indicators than SCIAMACHY. Specifically, GOME's standard deviation, IQR, and CV were relatively higher (Fig. 9b–d); its slope values suggested greater sensor drift (Fig. 7e); skewness was more strongly positive across most sites (Fig. 9f); kurtosis revealed more frequent extreme reflectance events (Fig. 9g). Collectively, these findings recommend adopting SCIAMACHY as the primary reference sensor for PICS stability assessments.
5.4 Reflectance correction for sun illumination and satellite viewing angles
To illustrate the effects of SZA and VZA on reflectance, the mean reflectance across all spectral channels was analyzed as an example. Figure 10a and b present scatter plots of the mean reflectance of the whole spectrum as a function of SZA and VZA, respectively. The black dashed lines represent linear regression fits and illustrate the overall trends in the observations. Consistent positive slopes were observed for all sites with increasing SZA, indicating an increase in reflectance with SZA. In contrast, reflectance exhibited consistent negative slopes with increasing VZA.
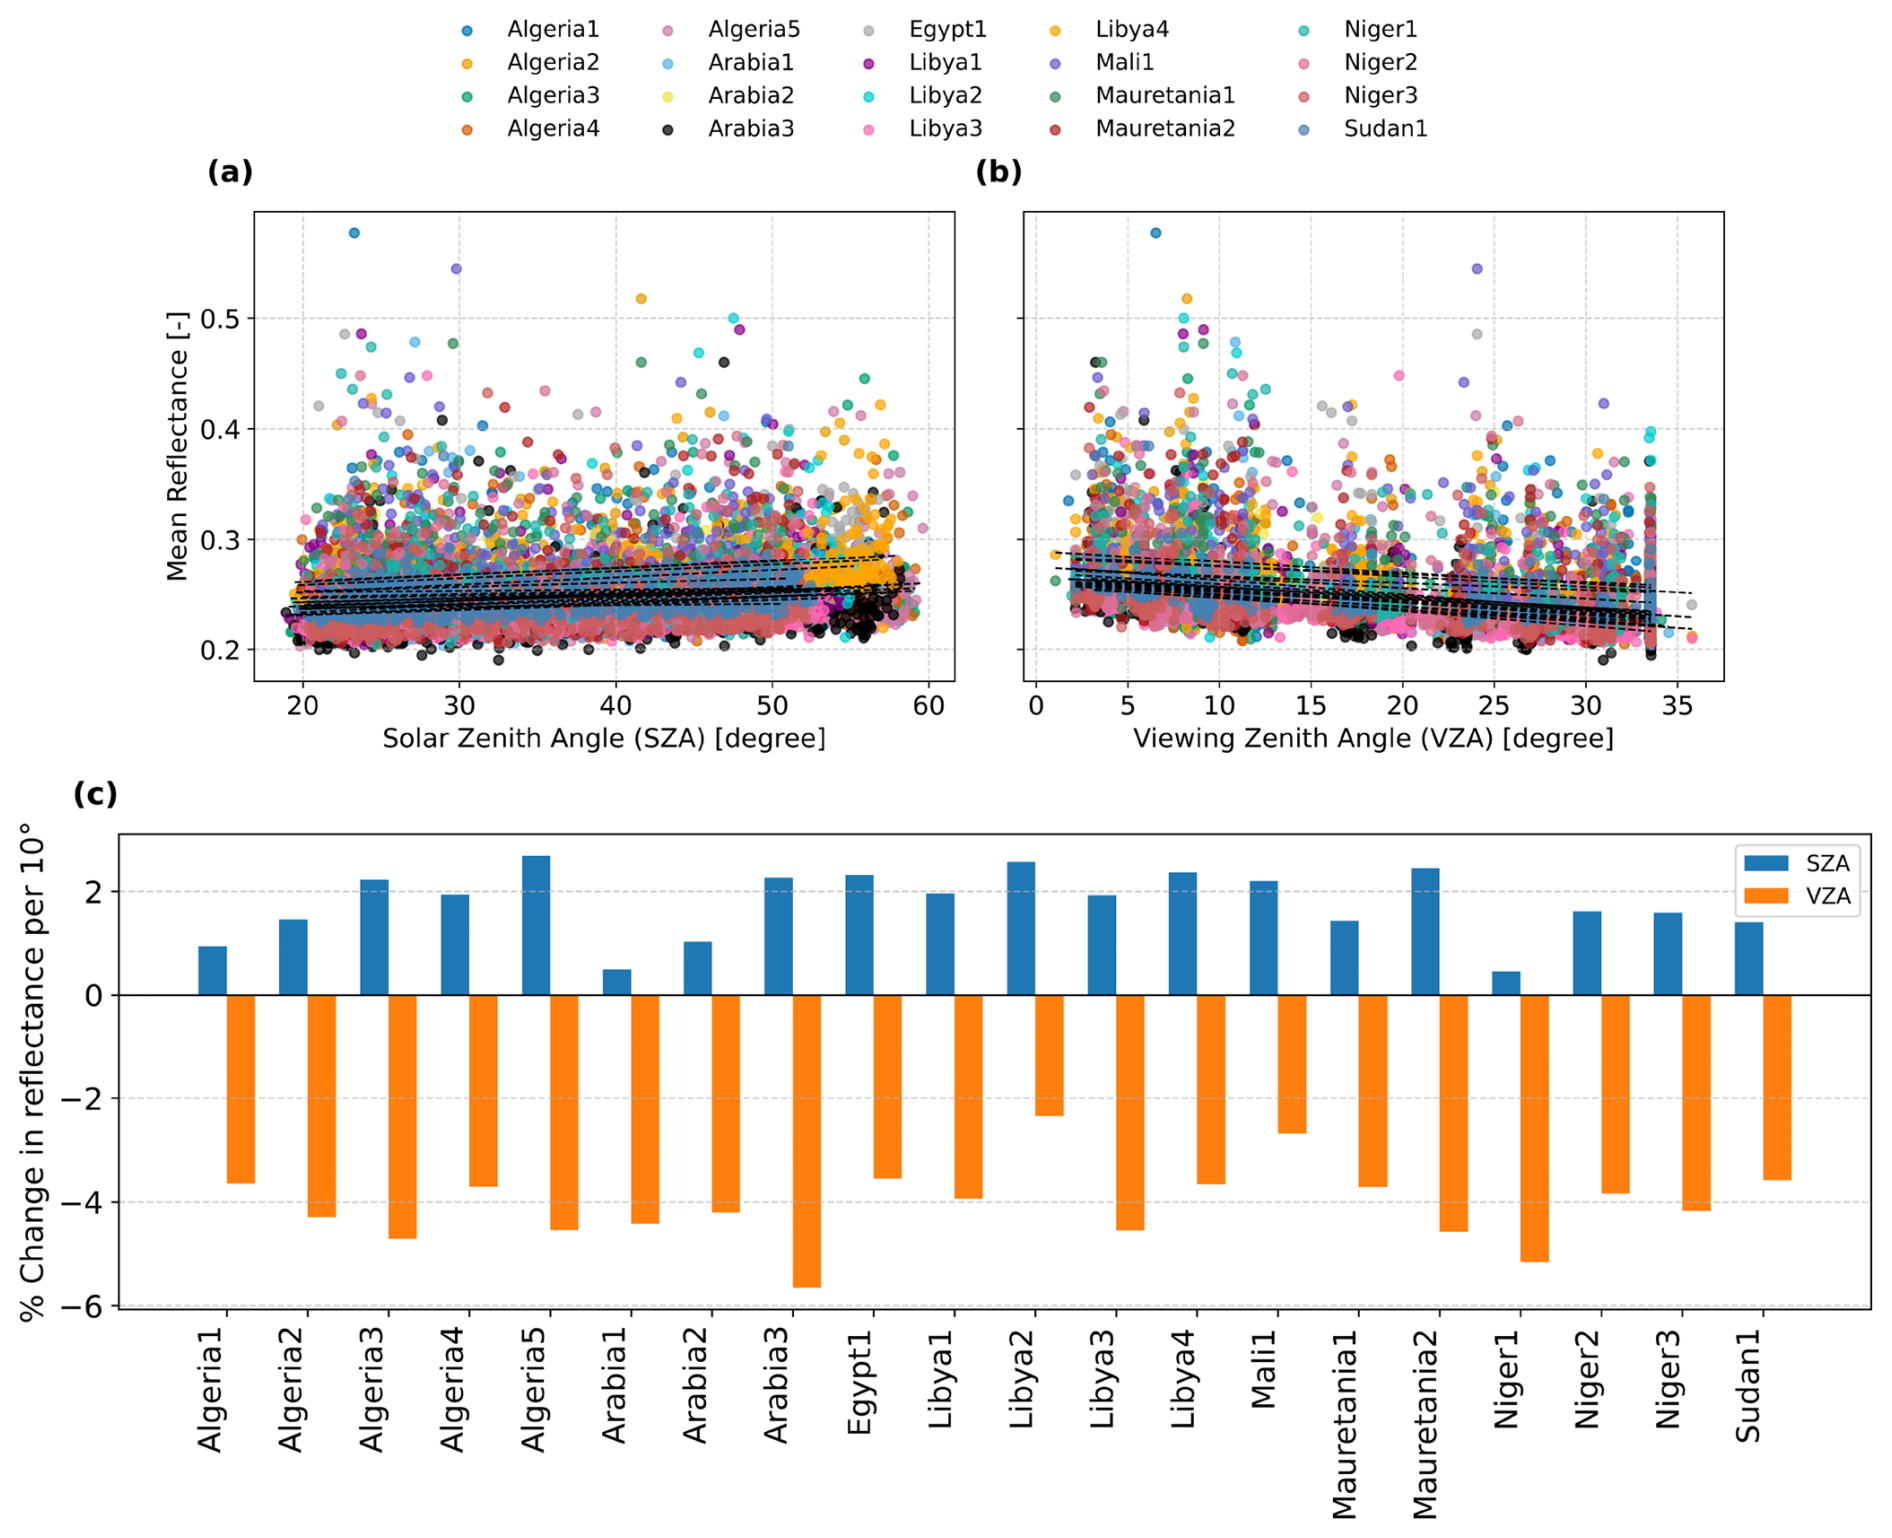
Figure 10Mean reflectance of the whole spectrum of the PICS observations with respect to SZA and VZA. The scatterplot of the mean reflectance versus (a) SZA, (b) VZA. The fitted linear regression equations for the samples are shown in the black dashed lines (c) the percentage of the changes in mean reflectance per 10° changes in SZA (blue bars) and VZA (orange bars).
Figure 10c shows the percentage change in reflectance corresponding to a 10° change in the sun-illumination and viewing geometry. The mean reflectance typically varies by 0.5 % per 10° to 2.57 % per 10° increase in SZA, with some sites, such as Arabia1 and Niger1, showing lower sensitivity of approximately 0.5 %. The effect of VZA was more pronounced, exhibiting an inverse relationship with reflectance. The corresponding absolute variations in reflectance ranged from 2 % per 10° to 6 % per 10° change in viewing angle.
The regression analysis revealed a systematic dependence of mean reflectance on both solar illumination and satellite viewing geometry. The magnitude of changes in reflectance was not the same across the PICS. Consequently, the reflectance observations over the PICS were corrected for the effects of both SZA and VZA. To account for spectral variability, the regression was applied separately to each spectral channel, ensuring that angular dependencies were corrected on a channel-by-channel basis.
As an illustrative example, the reflectance differences for the Libya4 site (corrected – original) are provided in the Supplement (see Fig. S1). The effect of the correction was strongest in the UV spectral channels, weaker in the VIS channels, and smallest in the NIR region. The correction applied to the reflectance time series exhibited a clear seasonal dependence, with the largest correction values for the reflectance time series of the summer months (May–September).
5.5 Stability score for PICS
The SS for the PICS sites were computed based on corrected SCIAMACHY reflectance observations. The SS was calculated for each spectral channel, excluding the O2 A-band. The scores were normalized and visualized in Fig. 11 with lower values indicating greater stability.
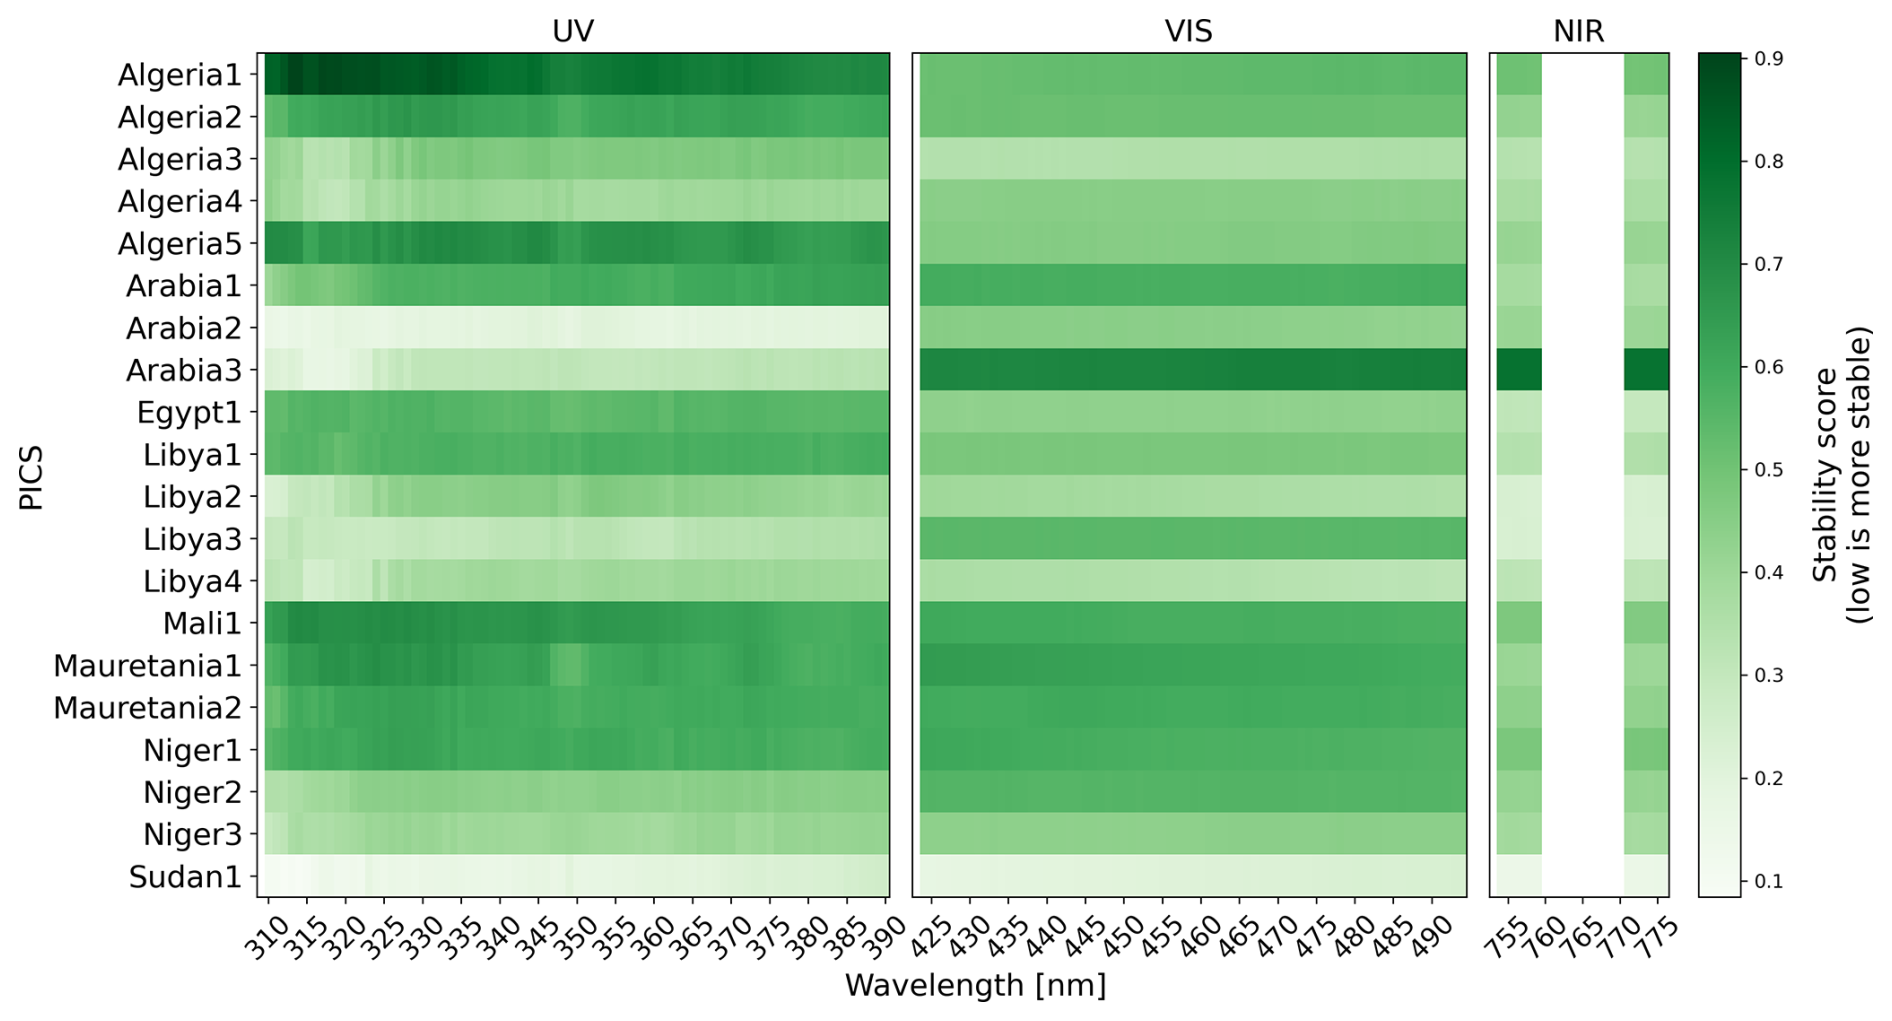
Figure 11The heatmap of the SS of each spectral channel of UV, VIS, and NIR spectral channels. The O2 A-band is excluded from SS computation and appears as a white rectangle in the NIR panel.
Some sites demonstrated stable performance across nearly all spectral channels. With the most stable sites being Sudan1, Arabia2, and Libya4. In contrast, other sites showed differences when comparing the stability of the different spectral bands. For instance, Arabia3, Arabia2, Libya3, and Niger2 showed higher stability in the UV band compared to the VIS band. Conversely, sites such as Algeria1, Algeria2, Algeria3, Libya4, and Sudan1 demonstrated greater stability in the VIS band than in the UV. A few sites, including Mali1, Mauritania1, Mauritania2, and Niger1 displayed generally low stability across all spectral regions. Additionally, high SS values were observed across multiple sites, appearing as vertically homogeneous patterns. This effect was particularly pronounced in the UV spectral region, likely due to the strong sensitivity of UV bands to atmospheric influences, such as cloud contamination and aerosols.
Based on the band-wise ranking shown in Fig. S2, the SS values of the PICS span a wide range across the spectral domains. In the UV range, SS varies from 0.11 to 0.75, while in the VIS range, it lies between 0.25 and 0.70. The NIR range exhibits SS values between 0.16 and 0.78. On average, the SS values for the UV and VIS bands are 0.45 and 0.50, respectively, which are higher than the average value for the NIR band (0.40). This indicates that PICS stability exhibits a clear dependence on spectral band. As an illustrative example, the Libyan sites (Libya1, Libya2, Libya3, and Libya4) exhibit SS values of 0.50, 0.38, 0.36, and 0.33, respectively (see Fig. S3). The high SS of Libya1 can be attributed to its being relatively higher SS in the UV and VIS bands compared to the other Libyan sites, as the SS represents a combined measure across all spectral bands.
The influence of geographical proximity is linked to the high potential of similar surface characteristics, which is evident in the band-wise ranking of the PICS, particularly in the NIR band, excluding the O2 A-band. Several geographically close sites showed similar SS values, including Algeria3 and Algeria4, Arabia1 and Arabia2, Mauretania1 and Mauretania2, Libya4 and Egypt1, and Libya3 and Libya2 (see Fig. S2). These geographically driven groupings – most clearly observed in the NIR band – suggest that sites within similar regional and geomorphological settings tend to exhibit comparable temporal characteristics. In contrast, this clustering effect was less pronounced in the VIS and UV bands.
6.1 Framework
To ensure the robustness and comprehensive assessment of the reflectance time series and the comparison between sensors, additional statistical descriptors were included. Besides the basic statistical parameters and CV, other parameters like IQR, slope, skewness, and kurtosis were included in the assessment. Skewness, kurtosis, and IQR parameters are used to identify the level of symmetry in the observations, reflect the presence of outliers, and quantify the spread of the central portion of the data. The slope serves as an indicator of the degradation in the sensor performance.
With only basic statistical parameters (mean, standard deviation, and CV), there were no significant differences observed for the spectrometer samples. When additional parameters such as slope, skewness, and kurtosis were considered, meaningful differences became apparent (see Fig. 9). These high-order statistical features provided greater sensitivity to distributional characteristics, subtle anomalies, and temporal trends, thereby offering a more robust basis for distinguishing the performance and stability of the spectrometers. This multi-parameter approach contributed to a more robust and resilient framework for sensor performance evaluation, radiometer drift monitoring, and identifying the constrained and reference sensors for cross-calibration.
6.2 Reflectance time series analysis
The derived indicators from the reflectance time series of GOME and SCIAMACHY revealed different statistical patterns among the PICS and across spectral channels. These differing patterns indicated that the initial hypothesis – that atmospheric conditions across the sites are relatively similar and that all PICS should exhibit similar behavior – may not hold in all cases. Therefore, PICS should be regularly investigated (Tuli et al., 2019). This finding underscored the need to quantify and compare the stability of each PICS site individually and across different spectral bands. The metric parameters derived from reflectance observations from both sensors consistently showed that deviation, variation, asymmetry, and degradation were highest in the UV bands, lower in the VIS bands, and lowest in the NIR bands. These results were expected for the following reasons: (i) TOA reflectance was used, which includes contributions from both surface and atmospheric reflectance; (ii) the UV bands are highly sensitive to atmospheric processes and aerosols (Chatzopoulou et al., 2025; Li et al., 2012); (iii) the VIS bands are influenced by Rayleigh scattering and aerosol variability (He et al., 2021); and (iv) the NIR bands (excluding the O2 A-band) are less affected by atmospheric processes and are more sensitive to surface reflectance; therefore, it serves as a baseline for atmospheric correction algorithms (Mishra et al., 2020).
6.3 Comparative analysis of GOME versus SCIAMACHY
A comparative analysis of key statistical parameters revealed that SCIAMACHY exhibited more statistically uniform and stable reflectance measurements than GOME. These indicators suggested lower temporal variability and fewer extreme values in SCIAMACHY data, making it a more robust choice. Noël et al. (2007) investigated the degradation across the spectral channels of SCIAMACHY and found that even after reaching the nominal lifetime of the mission in 2007, the SCIAMACHY instrument was still in good condition. However, the same study demonstrated an increased degradation in UV channels.
The discrepancy in the derived statistical parameters between GOME and SCIAMACHY might be partly attributed to sensor degradation effects. Tilstra and Stammes (2006); Coldewey-Egbers et al. (2008) referred to the severe degradation of the GOME instrument in the UV due to scan mirror degradation. Overall, SCIAMACHY's enhanced design and calibration capabilities resulted in better long-term radiometric stability compared to GOME. Hilbig et al. (2019) and Krijger et al. (2014) presented a degradation correction approach based on SCIAMACHY's internal white light measurements in combination with direct solar measurements. Consequently, SCIAMACHY was adopted as the reference sensor for evaluating the temporal stability of the PICS. Using SCIAMACHY observations in this paper ensured that the derived SS were based on a more stable and consistent dataset, enhancing the reliability of the site rankings and subsequent cross-calibration of both sensors by Owda et al. (2026).
6.4 Refinement reflectance observations for reliable estimation of the stability scores
The reflectance observations collected over PICS exhibited varying degrees of dependence on the SZA and VZA across the sites. An increase in SZA results in a longer atmospheric path length, leading to enhanced scattering and, consequently, TOA reflectance. This dependence on SZA is consistent with previous studies; for example, Wang et al. (2022) reported that reflectance tends to increase with both atmospheric aerosol optical depth and SZA. These findings indicated that a significant portion of the observed reflectance variability could be attributed to the sensitivity of TOA reflectance to changes in SZA. Differently, the reflectance time series as a function of VZA exhibited an inverse relationship, which may be attributed to degradation of the scan mirror angle over time, particularly in the UV band.
The correction applied to account for reflectance dependence on variations in SZA and VZA exhibited a clear seasonal pattern, with maximum corrections occurring during summer. Using a reference geometry with SZA=45°, the typically lower SZA values during summer led to increased reflectance after correction to the reference geometry compared with winter. The magnitude of the correction was wavelength dependent, with the largest corrections observed in the UV bands. This behavior was likely associated with enhanced atmospheric transport of aerosols and dust during summer. Previous studies reported a pronounced seasonal dust cycle, characterized by higher dust concentrations in the summer months (Rezaei-Nokandeh et al., 2025). Both the central Sahara Desert and the Arabian Peninsula experienced their highest aerosol optical depth during summer (Logothetis et al., 2021). Accounting for these effects was therefore essential for modeling SS and for ensuring comparable values across sites, without the influence of differing illumination and viewing geometries.
6.5 Stability of PICS
SS served as an indicator of temporal variability across the spectral channels. The SS for PICS were estimated based on groups of parameters that directly quantified variability, distribution, and temporal trends. The features describing temporal variability in reflectance were normalized to ensure comparability across sites. The SS was primarily determined by band characteristics. Overall, the values of SS were lower (more stable) in the NIR than in the VIS and UV bands. At longer wavelengths, contributions from surface properties – such as mineral composition, soil texture, surface roughness, and moisture – become increasingly significant (Fang et al., 2018), increasing the sensitivity of the metric to surface homogeneity and underlying geophysical conditions.
The band-wise ranking of the PICS showed strong clustering based on geographical proximity, which can be attributed to similar soil mineralogy and morphological conditions. In contrast, less clustering by geographic proximity was observed in the UV and VIS bands. This likely reflects regional differences in meteorological and atmospheric conditions, as these bands are more strongly influenced by atmospheric effects.
Overall, the results demonstrated a wide range of SS across spectral bands and sites. Our findings confirmed that Libya4 – one of the recommended sites for sensor cross-calibration – was among the most stable PICS. Some sites, such as Sudan1 and Arabia2, exhibited lower scores (more stable) than Libya4. These three sites are, therefore, recommended for further cross-calibration activities.
Differing SS across the PICS could refer to the following reasons:
-
Surface characteristics. Site properties affect radiometric stability; PICS are not fully invariant. Relevant factors include sand topography, grain size (Niro et al., 2021), composition, color, material type, and dune displacement (Govaerts, 2015). The sun's azimuth relative to dune alignment influences reflectance, with mean values depending on the area size (Govaerts, 2015).
-
Meteorological conditions. Strong winds can transport dust over large areas. Saharan dust storms in June 2020 caused high aerosol optical depths to extend to the USA within 4 d (Francis et al., 2020). Such events particularly affect short wavelengths (blue/visible) due to aerosol scattering.
-
Atmospheric conditions. The derived metrics used to compute the SS were based on TOA reflectance. Consequently, the SS remain influenced by atmospheric conditions, particularly in the UV and VIS spectral bands, where atmospheric scattering and absorption effects are more pronounced. Contributions from aerosols, molecular (Rayleigh) scattering, and trace gases can introduce additional variability in the TOA signal, which may not be fully separable from surface-related changes. As a result, the computed SS reflect the combined effects of surface properties and atmospheric variability rather than purely surface stability. Nevertheless, the analysis focuses on relative temporal behavior and inter-site comparisons, the impact of atmospheric effects is assumed to be comparable across the selected PICS, allowing meaningful assessment of their relative stability.
This paper presented a statistical framework based on multiple indicators to compare different sensors, monitor sensor performance, identify sensor-related issues, determine reference and constrained sensors for cross-calibration, and investigate the temporal variability of spectral bands and PICS based on TOA reflectance. The framework incorporated a wide range of parameters, including traditional time series metrics such as the mean, standard deviation, and CV. In addition, it included additional indicators that provide insights into the distribution shape of observations, the presence of anomalies, and temporal trends.
The GOME and SCIAMACHY spectrometers were used in this study due to their similar sensor characteristics and mission objectives, as well as overlapping spectral coverage. Additionally, their missions provided approximately 10 years of overlapping observation data, with a temporal offset of about 30 min in their overpass times. A decade of reflectance measurements from both sensors was retrieved under nearly clear-sky conditions over PICS.
The results highlighted instrumental issues in GOME, including significant degradation observed in 2001 and irregular observation patterns toward the end of its operational life. These findings agreed with previous studies that reported pronounced degradation of GOME, particularly in the UV spectral band. Moreover, statistical indicators revealed high positive values of skewness and kurtosis, indicating an asymmetrical distribution and the presence of numerous outliers. In contrast, SCIAMACHY observations were found to be more uniform and stationary, with substantially lower trends compared to GOME. As a result, SCIAMACHY was considered the reference sensor in this study for assessing the stability of PICS.
In terms of site stability, areas larger than the spatial extension of PICS were considered due to the large footprint of the spectrometers. Furthermore, this study aimed to establish a foundation for spectrometer cross-calibration, for which the temporal stability of areas larger than the PICS is a critical factor. The analysis revealed considerable variation among the PICS. While some sites exhibited high temporal stability across all spectral channels, others showed inconsistent behavior across bands, and a subset of sites displayed significantly lower stability, up to two to three times less stable than the most consistent sites. Additionally, the SS exhibited a clear band-wise dependency, with higher stability observed in the NIR band (excluding the O2 A-band) and lower stability in the VIS and UV bands. These findings emphasize the importance of selecting suitable PICS for radiometric calibration, taking into account the spectral band of interest.
The identification of the most stable PICS has broader implications for the satellite remote sensing community. Highly stable PICS can serve as reliable reference targets for monitoring long-term sensor performance, assessing radiometric consistency, and supporting cross-calibration activities. Improved radiometric stability at the calibration level directly propagates to higher-level satellite products. In particular, the retrieval of atmospheric trace gases depends critically on the accurate spectral structure of TOA reflectance. For example, Differential Optical Absorption Spectroscopy (DOAS) retrievals typically require a relative point-to-point accuracy on the order of 10−4. This stringent requirement highlights the importance of carefully selecting stable reference sites for tracking sensor performance, radiometric calibration, and cross-calibration. Furthermore, periodic evaluation of these sites is crucial to ensure their long-term stability. The follow-up paper performs the cross-calibration of GOME and SCIAMACHY based on the most stable sites of this research paper (Owda et al., 2026).
The findings of this study indicate that the initial hypothesis does not hold uniformly across all sites, as atmospheric conditions can vary significantly between desert regions. We recommend that future research focus on separating the atmospheric reflectance component from the TOA reflectance. Comparative statistical analyses of the NIR relative to the UV and VIS spectral ranges can provide insight into the stronger atmospheric influence in the UV and VIS. Under this framework, NIR observations may serve as a reference to correct UV and VIS reflectance. In addition, incorporating auxiliary parameters – such as aerosol optical depth and trace gas column densities derived from the corresponding Level-2 products – into the statistical analysis could further improve the robustness of the methodology.
-
SCIAMACHY Level 1b: https://doi.org/10.5270/EN1-5eab12a (European Space Agency, 2024a);
-
SCIAMACHY 1c tool: https://earth.esa.int/eogateway/tools/scial1c-command-line-tool (last access: 27 March 2026);
-
GOME-1 Level 1b: https://earth.esa.int/eogateway/instruments/gome/products-information (last access: 27 March 2026);
-
FDR4ATMOS products: https://doi.org/10.5270/ESA-852456e (European Space Agency, 2024b).
The supplement related to this article is available online at https://doi.org/10.5194/amt-19-3193-2026-supplement.
Abdalmenem Owda: Conceptualization, Methodology, Programming, Investigation, Writing – original draft. Günter Lichtenberg: Writing – review and editing.
The contact author has declared that neither of the authors has any competing interests.
Publisher's note: Copernicus Publications remains neutral with regard to jurisdictional claims made in the text, published maps, institutional affiliations, or any other geographical representation in this paper. The authors bear the ultimate responsibility for providing appropriate place names. Views expressed in the text are those of the authors and do not necessarily reflect the views of the publisher.
The FDR4ATMOS project, initiated by ESA, provides long-term records of Earth observation Level 1 parameters (radiance, irradiance, reflectance) to improve the performance of mission datasets (https://atmos.eoc.dlr.de/FDR4ATMOS/, last access: 20 September 2025).
This research has been supported by the European Space Agency (grant no. 4000128410/19/I-NS).
The article processing charges for this open-access publication were covered by the German Aerospace Center (DLR).
This paper was edited by Mark Weber and reviewed by Ralph Snel and one anonymous referee.
Barsi, J. A., Alhammoud, B., Czapla-Myers, J., Gascon, F., Haque, M. O., Kaewmanee, M., Leigh, L., and Markham, B. L.: Sentinel-2A MSI and Landsat-8 OLI radiometric cross comparison over desert sites, Eur. J. Remote Sens., 51, 822–837, https://doi.org/10.1080/22797254.2018.1507613, 2018. a
B ovensmann, H., Burrows, J., Buchwitz, M., Frerick, J., Noel, S., Rozanov, V., Chance, K., and Goede, A.: SCIAMACHY: Mission objectives and measurement modes, J. Atmos. Sci., 56, 127–150, 1999. a
Burrows, J. P., Weber, M., Buchwitz, M., Rozanov, V., Ladstätter-Weißenmayer, A., Richter, A., DeBeek, R., Hoogen, R., Bramstedt, K., Eichmann, K.-U., Eisinger, M., and Perner, D.: The global ozone monitoring experiment (GOME): Mission concept and first scientific results, J. Atmos. Sci., 56, 151–175, 1999. a
Cabor, F., Hagolle, O., Cosnefroy, H., and Briottet, X.: Inter-calibration using desertic sites as a reference target, in: IGARSS'98. Sensing and Managing the Environment. 1998 IEEE International Geoscience and Remote Sensing. Symposium Proceedings, no. 98CH36174, IEEE, 5, 2713–2715, https://doi.org/10.1109/IGARSS.1998.702327, 1998. a, b
CEOS: PICS: Pseudo-Invariant Calibration Sites, https://calvalportal.ceos.org/web/guest/pics_sites (last access: 27 March 2026), 2026. a
Chander, G., Hewison, T. J., Fox, N., Wu, X., Xiong, X., and Blackwell, W. J.: Overview of intercalibration of satellite instruments, IEEE T. Geosci. Remote, 51, 1056–1080, https://doi.org/10.1109/TGRS.2012.2228654, 2013. a
Chatzopoulou, A., Tourpali, K., Bais, A., and Braesicke, P.: Effects of different aerosol types on surface UV radiation in the 21st century, Atmos. Environ., 362, 121595, https://doi.org/10.1016/j.atmosenv.2025.121595, 2025. a
Coldewey-Egbers, M., Slijkhuis, S., Aberle, B., and Loyola, D.: Long-term analysis of GOME in-flight calibration parameters and instrument degradation, Appl. Optics, 47, 4749–4761, https://doi.org/10.1364/ao.47.004749, 2008. a, b
Cosnefroy, H., Leroy, M., and Briottet, X.: Selection and characterization of Saharan and Arabian desert sites for the calibration of optical satellite sensors, Remote Sens. Environ., 58, 101–114, https://doi.org/10.1016/0034-4257(95)00211-1, 1996. a, b, c
European Space Agency: Envisat SCIAMACHY Level 1b [SCI_____1P], Version 10, Earth Online [data set], https://doi.org/10.5270/EN1-5eab12a, 2024a. a
European Space Agency: FDR for Atmospheric Composition [ATMOS__L1B]. Version 1.0, Earth Online [data set], https://doi.org/10.5270/ESA-852456e, 2024b. a
ESA: FDR L1b Products, https://doi.org/10.5270/ESA-852456e, 2025a. a
ESA: GOME L1b, https://doi.org/10.5270/ER2-ua38y2m, 2025b. a, b
ESA: SCIAMACHY Instrument Overview, https://earth.esa.int/eogateway/instruments/sciamachy (last access: 27 March 2026), 2025c. a, b
Fajardo Rueda, J., Leigh, L., Teixeira Pinto, C., Kaewmanee, M., and Helder, D.: Classification and Evaluation of Extended PICS (EPICS) on a Global Scale for Calibration and Stability Monitoring of Optical Satellite Sensors, Remote Sens.-Basel, 13, 3350, https://doi.org/10.3390/rs13173350, 2021. a
Fang, Q., Hong, H., Zhao, L., Kukolich, S., Yin, K., and Wang, C.: Visible and near-infrared reflectance spectroscopy for investigating soil mineralogy: A review, J. Spectrosc., 2018, 3168974, https://doi.org/10.1155/2018/3168974, 2018. a
Francis, D., Fonseca, R., Nelli, N., Cuesta, J., Weston, M., Evan, A., and Temimi, M.: The atmospheric drivers of the major Saharan dust storm in June 2020, Geophys. Res. Lett., 47, e2020GL090102, https://doi.org/10.1029/2020GL090102, 2020. a
Govaerts, Y. M.: Sand dune ridge alignment effects on surface BRF over the Libya-4 CEOS calibration site, Sensors, 15, 3453–3470, https://doi.org/10.3390/s150203453, 2015. a, b
Han, J., Pei, J., and Tong, H.: Data Mining: Concepts and Techniques, The Morgan Kaufmann Series in Data Management Systems, Morgan Kaufmann, https://books.google.de/books?id=NR1oEAAAQBAJ (last access: 27 March 2026), 2022. a
Hasan, M. N., Shrestha, M., Leigh, L., and Helder, D.: Evaluation of an Extended PICS (EPICS) for calibration and stability monitoring of optical satellite sensors, Remote Sens.-Basel, 11, 1755, https://doi.org/10.3390/rs11151755, 2019. a, b
He, Q., Fang, Z., Shoshanim, O., Brown, S. S., and Rudich, Y.: Scattering and absorption cross sections of atmospheric gases in the ultraviolet–visible wavelength range (307–725 nm), Atmos. Chem. Phys., 21, 14927–14940, https://doi.org/10.5194/acp-21-14927-2021, 2021. a
Helder, D., Thome, K. J., Mishra, N., Chander, G., Xiong, X., Angal, A., and Choi, T.: Absolute radiometric calibration of Landsat using a pseudo invariant calibration site, IEEE T. Geosci. Remote, 51, 1360–1369, 2013. a, b, c, d
Hilbig, T., Bramstedt, K., Weber, M., Burrows, J. P., and Krijger, M.: Optimised degradation correction for SCIAMACHY satellite solar measurements from 330 to 1600 nm by using the internal white light source, Atmos. Meas. Tech., 13, 3893–3907, https://doi.org/10.5194/amt-13-3893-2020, 2020. a
Kabir, S., Leigh, L., and Helder, D.: Vicarious methodologies to assess and improve the quality of the optical remote sensing images: A critical review, Remote Sens.-Basel, 12, 4029, https://doi.org/10.3390/rs12244029, 2020. a
Khadka, N., Teixeira Pinto, C., and Leigh, L.: Detection of change points in pseudo-invariant calibration sites time series using multi-sensor satellite imagery, Remote Sens.-Basel, 13, 2079, https://doi.org/10.3390/rs13112079, 2021. a, b
Krijger, J. M., Snel, R., van Harten, G., Rietjens, J. H. H., and Aben, I.: Mirror contamination in space I: mirror modelling, Atmos. Meas. Tech., 7, 3387–3398, https://doi.org/10.5194/amt-7-3387-2014, 2014. a
Lacherade, S., Fougnie, B., Henry, P., and Gamet, P.: Cross calibration over desert sites: Description, methodology, and operational implementation, IEEE T. Geosci. Remote, 51, 1098–1113, https://doi.org/10.1109/TGRS.2012.2227061, 2013. a
Li, Q., Li, C., and Mao, J.: Evaluation of atmospheric aerosol optical depth products at ultraviolet bands derived from MODIS products, Aerosol Sci. Tech., 46, 1025–1034, https://doi.org/10.1080/02786826.2012.687475, 2012. a
Liang, S.: Comprehensive remote sensing, Elsevier, ISBN 9780128032206, 2017. a
Lichtenberg, G., Kleipool, Q., Krijger, J. M., van Soest, G., van Hees, R., Tilstra, L. G., Acarreta, J. R., Aben, I., Ahlers, B., Bovensmann, H., Chance, K., Gloudemans, A. M. S., Hoogeveen, R. W. M., Jongma, R. T. N., Noël, S., Piters, A., Schrijver, H., Schrijvers, C., Sioris, C. E., Skupin, J., Slijkhuis, S., Stammes, P., and Wuttke, M.: SCIAMACHY Level 1 data: calibration concept and in-flight calibration, Atmos. Chem. Phys., 6, 5347–5367, https://doi.org/10.5194/acp-6-5347-2006, 2006. a
Logothetis, S.-A., Salamalikis, V., Gkikas, A., Kazadzis, S., Amiridis, V., and Kazantzidis, A.: 15-year variability of desert dust optical depth on global and regional scales, Atmos. Chem. Phys., 21, 16499–16529, https://doi.org/10.5194/acp-21-16499-2021, 2021. a
Min, Q., Yin, B., Li, S., Berndt, J., Harrison, L., Joseph, E., Duan, M., and Kiedron, P.: A high-resolution oxygen A-band spectrometer (HABS) and its radiation closure, Atmos. Meas. Tech., 7, 1711–1722, https://doi.org/10.5194/amt-7-1711-2014, 2014. a
Mishra, M. K., Rathore, P. S., Misra, A., and Kumar, R.: Atmospheric Correction of Multispectral VNIR Remote Sensing Data: Algorithm and Inter-sensor Comparison of Aerosol and Surface Reflectance Products, Earth and Space Science, 7, e2019EA000710, https://doi.org/10.1029/2019EA000710, 2020. a
Niro, F., Goryl, P., Dransfeld, S., Boccia, V., Gascon, F., Adams, J., Themann, B., Scifoni, S., and Doxani, G.: European Space Agency (ESA) calibration/validation strategy for optical land-imaging satellites and pathway towards interoperability, Remote Sens.-Basel, 13, 3003, https://doi.org/10.3390/rs13153003, 2021. a
Noël, S., Bramstedt, K., Bovensmann, H., Burrows, J. P., Gottwald, M., and Krieg, E.: SCIAMACHY degradation monitoring results, in: Proceedings of the 2007 Envisat Symposium, Citeseer, https://elib.dlr.de/48296/ (last access: 27 March 2026), 2007. a
Ono, A., Sakuma, F., Arai, K., Yamaguchi, Y., Fujisada, H., Slater, P., Thome, K., Palluconi, F. D., and Kieffer, H.: Preflight and in-flight calibration plan for ASTER, J. Atmos. Ocean. Tech., 13, 321–335, https://doi.org/10.1175/1520-0426(1996)013<0321:PAIFCP>2.0.CO;2, 1996. a
Owda, A., Coldewey-Egbers, M., Slijkhuis, S., Lichtenberg, G., and Aberle, B.: Reflectance-based cross-calibration of GOME and SCIAMACHY spectrometers enhanced by polarization monitoring devices data, Atmos. Meas. Tech., 19, 3213–3229, https://doi.org/10.5194/amt-19-3213-2026, 2026. a, b, c
Pagano, T. S., Aumann, H. H., Hagan, D. E., and Overoye, K.: Prelaunch and in-flight radiometric calibration of the Atmospheric Infrared Sounder (AIRS), IEEE T. Geosci. Remote, 41, 265–273, https://doi.org/10.1109/TGRS.2002.808324, 2003. a
Rezaei-Nokandeh, N., Sabetghadam, S., Ahmadi-Givi, F., and Kaskaoutis, D. G.: Aerosol optical depth trends and variability over the Middle East from MODIS, MISR, OMI, and AERONET observations, Sci. Rep.-UK, 15, 41908, https://doi.org/10.1038/s41598-025-25895-4, 2025. a
Thenkabail, P. S.: Remotely sensed data characterization, classification, and accuracies, CRC Press, https://doi.org/10.1201/b19294, 2015. a
Tilstra, L. G. and Stammes, P.: Intercomparison of reflectances observed by GOME and SCIAMACHY in the visible wavelength range, Appl. Optics, 45, 4129–4135, https://doi.org/10.1364/ao.45.004129, 2006. a
Tuli, F. T. Z., Pinto, C. T., Angal, A., Xiong, X., and Helder, D.: New approach for temporal stability evaluation of pseudo-invariant calibration sites (PICS), Remote Sens.-Basel, 11, 1502, https://doi.org/10.3390/rs11121502, 2019. a, b
Wang, W., Wang, Y., Lyapustin, A., Hashimoto, H., Park, T., Michaelis, A., and Nemani, R.: A novel atmospheric correction algorithm to exploit the diurnal variability in hypertemporal geostationary observations, Remote Sens.-Basel, 14, 964, https://doi.org/10.3390/rs14040964, 2022. a
Wu, A., Mu, Q., Angal, A., and Xiong, X.: Assessment of MODIS and VIIRS calibration consistency for reflective solar bands calibration using vicarious approaches, in: Sensors, Systems, and Next-Generation Satellites XXIV, vol. 11530, SPIE, 235–246, https://doi.org/10.1117/12.2573022, 2020. a
Ye, X., Ren, H., Liang, Y., Zhu, J., Guo, J., Nie, J., Zeng, H., Zhao, Y., and Qian, Y.: Cross-calibration of Chinese Gaofen-5 thermal infrared images and its improvement on land surface temperature retrieval, Int. J. Appl. Earth. Obs., 101, 102357, https://doi.org/10.1016/j.jag.2021.102357, 2021. a