the Creative Commons Attribution 4.0 License.
the Creative Commons Attribution 4.0 License.
 | 22 May 2026
Ground-based total ozone column measurements in the Huggins and Chappuis bands using Direct-Sun DOAS observations
Alkiviadis Bais
Katerina Garane
Michel Van Roozendael
Dimitris Nikolis
Manuel Roca
Dimitris Balis
Accurate routine monitoring of the Total Ozone Column (TOC) is essential for understanding ozone temporal variability, assessing long-term trends and supporting satellite validation. In this work, we present TOC retrievals in both ultraviolet (UV, Huggins bands) and visible (VIS, Chappuis bands) spectral regions using direct sun Differential Optical Absorption Spectroscopy (DS-DOAS). We use the research-grade UV-VIS DOAS system Delta, recently designed and operated at the Laboratory of Atmospheric Physics in Thessaloniki, Greece. A dedicated retrieval algorithm was developed that includes the calibration of a measured reference spectrum using the Langley plot and the Minimum-Amount Langley-Extrapolation approaches. The analysis suggests that TOCs derived from the visible channel for the first time in Thessaloniki are highly consistent with those from the ultraviolet channel, with a median difference of −0.44 % and Pearson's correlation coefficient R= 0.97. The Delta TOC retrievals were compared with two collocated instruments, Brewer and Pandora, yielding very good agreement in both spectral regions (R>0.98), with median biases of −0.18 % and −0.63 % for the VIS and 0.08 % and −0.32 % for the UV channel compared to the Brewer and Pandora, respectively. The seasonal and diurnal variabilities of TOC were captured consistently from all three instruments, confirming the robustness of the retrievals. Enhanced aerosol loads, such as those observed during an extreme wildfire event, introduced significant deviations in the VIS TOC comparisons with the reference instruments, while the comparisons in the UV remained largely unaffected. The findings of this study confirm the capability of Delta to provide accurate and consistent TOC retrievals in both UV and VIS spectral bands. The successful exploitation of the Chappuis bands extends the applicability of DS-DOAS to conditions where UV sensitivity is limited, such as at high solar zenith angles or at high-latitude locations, thereby extending the continuity of ozone monitoring from ground-based systems and providing a complementary approach to traditional UV-based TOC retrievals.
- Article
(5626 KB) - Full-text XML
-
Supplement
(974 KB) - BibTeX
- EndNote


Ozone (O3), one of the most important and well-known trace gases in the atmosphere (WMO, 2022), plays a key role in atmospheric chemistry, radiative forcing, air-quality and climate change (Crutzen, 1979). Approximately 90 % of the Total Ozone Column (TOC) resides in the stratosphere, with highest concentrations at altitudes between 20 and 30 km (Seinfeld and Pandis, 2016; Langematz, 2019). By absorbing nearly all harmful ultraviolet (UV) solar radiation at wavelengths below 290 nm and also a large fraction of the short-wave UV-B solar radiation, between 290 and 315 nm, stratospheric O3 has a strong impact on the global radiative forcing and is essential for the biosphere, protecting humans and natural ecosystems. In the troposphere, ozone plays a key role in the oxidizing capacity of the atmosphere (Lelieveld et al., 2016) and acts as a greenhouse gas contributing to radiative forcing. Near the surface it is widely recognized as a secondary pollutant, produced by photochemical reactions of nitrogen oxides (NOx) and Volatile Organic Compounds (VOCs), having a strong impact on human health, vegetation and ecosystems (Fowler et al., 2009; Monks et al., 2015; Young et al., 2018).
Routine measurements of TOC began in the 1920s with the use of the Dobson spectrophotometer (Dobson, 1931). In the late 1970s, automated Brewer spectrophotometers were introduced (Brewer, 1973; Kerr et al., 1981, 1988) and have since been widely adopted operationally for observations. Both systems have been extensively used over the past decades for ozone monitoring. Especially after the discovery of the so-called “Antarctic ozone hole” in the mid-1980s (Farman et al., 1985; Chubachi, 1985), they played a critical role in assessing ozone trends and their links to climate change. Numerous studies have been conducted on the variability of stratospheric ozone and its long-term trends, on a global scale, based on both ground-based data measured by Dobson and Brewer instruments, as well as satellite observations (e.g., Harris et al., 1997; Zerefos et al., 2001; Fioletov et al., 2002; Ziemke et al., 2005). With the successful implementation of the Montreal Protocol (Mäder et al., 2010), the abundance of ozone-depleting substances (ODSs) in the stratosphere has been reduced and several studies have indicated a gradual recovery of TOC levels in recent years (Solomon et al., 2016; Kuttippurath and Nair, 2017; Pazmiño et al., 2018; Weber et al., 2022). Nevertheless, maintaining high-quality ground-based TOC observations remains of high importance. Despite their historical significance, Dobson and Brewer instruments are no longer produced and the required technical support for uninterrupted operation is very limited. The number of stations contributing TOC data to the global observing network is decreasing, while those that remain active and operational require regular high-cost calibration and maintenance procedures. To ensure the continuity of accurate TOC measurements and to further expand our knowledge on the interactions of ozone and climate change, gradual transitioning to alternative TOC measurement techniques is of high research and environmental significance.
Passive Differential Optical Absorption Spectroscopy (DOAS) is a well-established and widely used remote sensing method that has been applied since the 1970s for the detection of numerous trace gases, including O3, in the atmosphere, with characteristic narrow-band absorption structures in the UV and visible (VIS) spectral ranges (Platt and Stutz, 2008). Over time, DOAS has been adapted for multiple applications using different viewing geometries, each being sensitive to different altitudes within the atmosphere, depending on the target species. The principal idea of all passive DOAS applications is the same: in a first step, the trace gas Slant Column Density (SCD) is retrieved from spectral analysis, which is then converted to a Vertical Column Density (VCD) by division with an appropriate Air Mass Factor (AMF) (Noxon, 1979; Solomon et al., 1987a). Zenith-Sky (ZS) DOAS measurements were one of the earliest passive DOAS implementations and have been used in various studies about stratospheric nitrogen dioxide (NO2) (Brewer, 1973; Noxon, 1975), as well as O3 and chlorine oxide (OClO) (e.g., Mount et al., 1987; Solomon et al., 1987b, 1988). ZS-DOAS instruments, such as the Système d'Analyse par Observation Zénithale (SAOZ; Pommereau and Goutail, 1988), most of which are part of the Network for Detection of Atmospheric Composition Change (NDACC), are sensitive to stratospheric absorbers. They rely on scattered radiation spectra measured at the zenith during twilight, at high Solar Zenith Angles (SZAs), thus providing measurements of O3 twice a day, i.e., at sunrise and at sunset (Van Roozendael et al., 1998; Hendrick et al., 2011). The AMF for ZS-DOAS depends on several atmospheric parameters, such as the O3 vertical profile, surface albedo, as well as temperature and pressure profiles (Cede et al., 2006; Hendrick et al., 2011) and its calculation is based on Radiative Transfer Model (RTM) simulations. Direct-Sun (DS) DOAS is another application of DOAS that is equally sensitive to stratospheric and tropospheric absorbers for SZAs < 80°. It yields information about the total VCD, i.e., from ground level up to the top of the atmosphere and unlike ZS-DOAS, it allows for potential investigation of diurnal cycles. The AMF for direct sun observations can be easily approximated with a geometric approach. However, compared to other viewing geometries, such as those employed in Multi-AXis Differential Optical Absorption Spectroscopy (MAX-DOAS) measurements (Hönninger et al., 2004), the photon path lengths are relatively small leading to weaker signals, thus systems with high Signal to Noise Ratio (SNR) are usually required. TOC measurements employing the DS-DOAS technique have been used in various studies (e.g., Tzortziou et al., 2012, 2015; Herman et al., 2015; Kim et al., 2017; Gkertsi et al., 2018). In recent years, Pandora systems have been developed to provide standardized DS-DOAS measurements of ozone and other trace gases. These instruments form the Pandonia Global Network (PGN), which delivers quality-assured, near-real-time data products and plays an increasingly important role in long-term monitoring and satellite validation.
TOC retrievals from direct sun observations are traditionally conducted in the UV, typically within the wavelength range of 300–360 nm, where ozone exhibits distinct narrow-band absorption features, known as Huggins bands. However, ozone also shows weaker, but still significant structures in the visible and near-infrared (NIR) regions between 400 and 650 nm, referred to as Chappuis absorption bands. Using measurements in this spectral region has several benefits. Retrievals in the visible range are less sensitive to stray light interference, which often limits the accuracy of UV-based measurements, especially at high SZAs. Furthermore, many commercially available and research-grade spectrometers either lack sufficient sensitivity in the UV or are designed primarily for the visible region. Therefore, employing measurements in the Chappuis bands broadens the range of instruments that can be used for TOC monitoring. An additional advantage of TOC retrievals in the Chappuis bands is the reduced sensitivity of the retrieval to O3 temperature compared to retrievals in the Huggins bands. In the UV, the O3 absorption cross sections show a pronounced temperature dependence (Serdyuchenko et al., 2014), which can introduce systematic uncertainties in TOC retrievals if the effective O3 temperature is not accurately accounted for. This effect has been shown to impact UV-based TOC measurements (e.g., Zhao et al., 2016; Gröbner et al., 2021), while the VIS-based TOC retrievals are inherently less affected. Moreover, retrievals in the visible range provide an advantage for high-latitude and wintertime observations, where solar UV radiation is relatively weak and often limits the applicability of measurements in the Huggins bands. Under such conditions, solar radiation in the visible range is more intense, allowing the Chappuis bands to be exploited for TOC retrievals. This supports the continuity of ozone monitoring, which is essential for maintaining consistent long-term records and for providing reliable reference data for satellite validation in polar and subpolar regions. To our knowledge, direct sun observations in the Chappuis bands have not been previously used for TOC retrievals, and this study introduces such an application for the first time.
The aim of this work is to retrieve TOC both in the UV and VIS regions, by applying a DOAS-based algorithm to direct sun spectra recorded by the Delta UV-VIS system, operating at the Laboratory of Atmospheric Physics (LAP), in Thessaloniki, Greece. By conducting an intercomparison study with collocated Brewer and Pandora TOC measurements, we aim to establish linkages among these independent sources of information on ozone. Such linkages will facilitate their synergistic use in future monitoring and research activities. Furthermore, they will strengthen the role of ground-based observations in supporting satellite validation and in assessing regional ozone variability. Finally, the intercomparison provides a cross-checking framework that ensures internal consistency across the instruments, which is crucial for sustained ozone monitoring.
This article is structured as follows: In Sect. 2, a description is given for the instruments and datasets utilized in this study. In Sect. 3, the DOAS-based TOC retrieval methodology is presented along with the required calibration procedures. In Sect. 4, the intercomparison results with the Brewer and the Pandora are discussed, and in Sect. 5 the main conclusions of this study are summarized.
2.1 The measurement site
Thessaloniki is the second-largest city in Greece, located in the northern part of the country with a coastal orientation facing the Aegean Sea, which is part of the larger Mediterranean region. The measurement site is located in the city centre, on the rooftop of the School of Physics, at the Laboratory of Atmospheric Physics (40.633° N, 22.956° E, 60 m a.s.l.) of the Aristotle University of Thessaloniki (LAP.AUTH; https://lapweb.physics.auth.gr/en/home-english/, last access: 8 November 2025). Thessaloniki holds historical significance in the field of ground-based TOC measurements and hosts a range of remote-sensing instruments designed for this purpose. In the 1980s, when the decline of stratospheric ozone levels was of high research and environmental importance, LAP.AUTH was equipped with the first commercially available single-monochromator Brewer with serial number 005 (hereafter BR005). It was installed in 1982, providing the capability to monitor TOC for the first time in Thessaloniki and also investigate its effect on solar UV irradiance at ground level. BR005 is still operational and regularly calibrated. TOC measurements over Thessaloniki have also been performed since 2015 by a miniature spectrophotometer (Phaethon) by applying the DOAS technique on direct sun spectra (Gkertsi et al., 2018). Since June 2022, LAP.AUTH is equipped with a new research-grade spectrometer system (namely Delta). Delta represents a significant enhancement of the existing instrumentation as it is designed to provide spectral measurements of higher quality and is characterized by increased accuracy and sensitivity, with the capability to apply DS-DOAS and to retrieve TOC. In late 2022, TOC measurements over Thessaloniki were further supported through the installation of a Pandora 2S instrument that is part of PGN (https://www.pandonia-global-network.org/, last access: 8 November 2025). Pandora provides columnar measurements of O3 among other species, which are near-real-time, centrally processed, quality assured and distributed by PGN. The measurement site of LAP.AUTH along with the instrumentation utilized under the scope of this study are presented in Fig. 1.
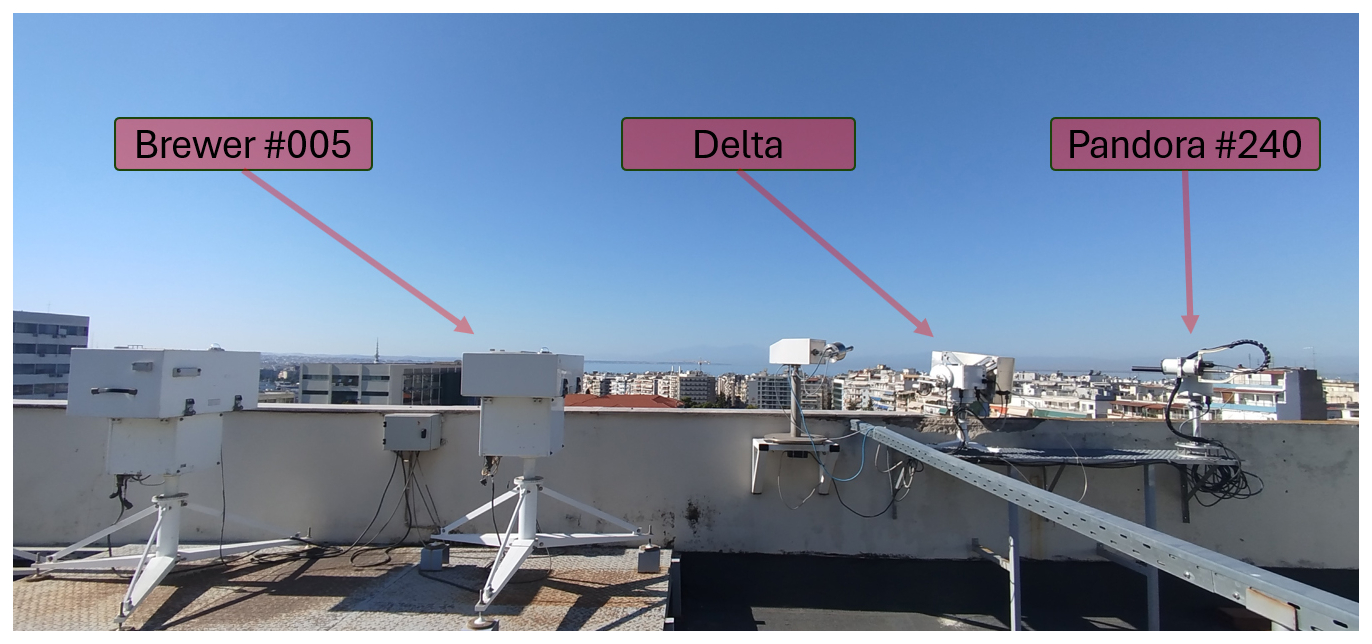
Figure 1The measurement site of LAP.AUTH and the three collocated ground-based instruments used in this study: Brewer spectrophotometer #005 (left), Delta UV-VIS DOAS system (centre), and Pandora #240 (right).
2.2 The Delta system
Delta is a scientific-grade instrument developed in collaboration with the Royal Belgian Institute for Space Aeronomy (BIRA-IASB) in the framework of the PANhellenic infrastructure for Atmospheric Composition and Climate Change (PANACEA; https://panacea-ri.gr/?lang=en, last access: 8 November 2025) project. The system consists of two main parts: an optical head, which is located outdoors, mounted on a dual-axis sun tracker, and a single-channel acquisition unit, located inside the building. The acquisition unit comprises a detector mounted on a spectrograph and a computer used for instrument control with a home-made software, data acquisition and data storage (Karagkiozidis, 2023). Light is collected by the optical head via a planoconvex lens, installed in its front part, and it is guided to the entrance slit of the spectrograph through a fiber bundle of rectangular ending. The spectrograph is a commercial Kymera 193i unit by Andor Oxford Instruments, which includes a grating of 600 grooves mm−1, allowing for a wavelength coverage of ∼230 nm. It is placed inside a thermo-regulated box, whose temperature is maintained constant at +20 °C. The instrument's slit function was measured using mercury discharge lamp spectral lines and it was found to approximately correspond to a Gaussian with Full Width at Half Maximum (FWHM) of ∼0.85 nm. Such lamp spectra are also used for accurate wavelength calibration. The spectral range of the spectrograph was set to 305–523 nm so that multiple trace gases can be detected using DOAS in the UV and visible regions (Platt and Stutz, 2008). The detector is a low-noise PIXIS 2KBUV back-illuminated and UV-enhanced charge-coupled device (CCD) of 2048×512 px by Princeton Instruments, which is thermo-electrically cooled to −50 °C by means of a Peltier system, thereby suppressing generation of dark current. Depending on the measurement type, and to avoid saturation of the measured spectra, the light intensity can be attenuated by neutral-density optical filters, transmission diffuser plates and cut-off filters, one by one or in various combinations, which are placed in six positions of a filter-wheel, located inside the optical head. The optical head also includes a commercial dual-axis inclinometer by Jewell Instruments, used to ensure a precise levelling of the instrument and proper orientation of the optical head.
The system was originally designed to collect scattered solar radiation at different elevation angles, required for MAX-DOAS measurements (Hönninger et al., 2004) for the retrieval of tropospheric aerosol (trace gas) extinction (concentration) vertical profiles and integrated columns. However, the EKO STR-22G sun tracker allows orientation of the optical head at any given azimuth (0–360°) and elevation (0–90°) viewing direction, with a pointing resolution of less than 0.01°, thus providing accurate direct sun capability. The first scientific application of the recently developed Delta system at LAP.AUTH has been the retrieval of total NO2 VCDs using the DS-DOAS technique (Nikolis et al., 2025), confirming its suitability for direct sun trace gas observations. Simultaneous calibration of the azimuth and elevation angles is performed by regular sun scans, i.e., by sighting of the sun disk, an approach that was found to provide low systematic uncertainties of ± 0.05° (Donner et al., 2020).
Since the beginning of its operation in 2022, the measurement schedule of Delta includes elevation scans at two azimuth directions, followed by a direct sun measurement. The total integration time of each elevation scan is about 15 min, hence direct sun observations are performed approximately every half an hour. Dark spectra are measured at nighttime (at SZAs higher than 105°) for 30 min and for all exposure times of the detector used during the daily cycles, which are then subtracted from the measured solar spectra, prior to the DOAS analysis. During the first year of operation in direct sun mode (until June 2023), the light throughput in the spectrograph was very high, as a result of inadequate attenuation of light intensity (solely from a teflon diffuser). To avoid saturation, the detector was operated in high-capacity mode, leading to direct sun spectra of increased spectral noise. In June 2023 an additional neutral-density optical filter was installed in combination with the (existing) diffuser to enhance attenuation, so the detector was reverted to its default low-noise mode of operation. In January 2024, a second filter/diffuser setup with the addition of a HOYA U340 bandpass filter was installed on a different position of the filter-wheel, to eliminate wavelengths longer than ∼390 nm, thus reducing the effect of stray light on the DOAS retrievals in the UV. Since then, direct sun measurements are repeated twice, once with and once without the U340 filter, each with an integration time of 30 s. In the end of May 2024, Delta was uninstalled and transported to Cabauw, the Netherlands, to participate in the third Cabauw Intercomparison of UV-VIS DOAS Instruments (CINDI-3) intercomparison campaign (https://actris.eu/news-events/news/cindi-3-extensive-air-pollution-measurement-campaign, last access: 8 November 2025). The instrument returned to its operational site at LAP.AUTH at the end of June 2024, but with a shift in the wavelength calibration, probably due to stress of the mechanical parts of the spectrograph during transportation.
In this study, we focus only on direct sun measurements performed by Delta during the period June 2023 to May 2024, when the instrument was stable and fully operational, thereby avoiding potential biases in the comparison with Brewer and Pandora due to different instrument states. The stability of the instrument has been regularly assessed by monitoring the spectrograph's slit function, derived by comparison of measured spectra with a high-resolution solar spectrum, convoluted with a Gaussian function (Fayt and Van Roozendael, 2001; Aliwell et al., 2002; Danckaert et al., 2017). The slit function remained stable throughout the study period, with a mean FWHM of 0.83 ± 0.02 nm, which is in very good agreement with the one derived from mercury lamp measurements (0.85 nm). In summary, the direct sun datasets of Delta considered in this study span from June 2023 to May 2024 (∼11 months) in the VIS range and from January to May 2024 (∼6 months) in the UV.
2.3 Brewer
The Brewer spectrophotometer (SN #005) that was used in this work is a MKII single-monochromator instrument that was installed at LAP.AUTH in 1982 (Fig. 1). It is still fully operational and regularly records total ozone, sulfur dioxide (SO2) as well as spectral UV in the wavelength range 290–330 nm and aerosol optical depth at selected wavelengths (Meleti and Cappellani, 2000; Gröbner and Meleti, 2004). Regular calibrations for TOC are conducted via participation in intercomparison campaigns organized by the European Regional Brewer Calibration Center (RBCC-E) (e.g., Redondas et al., 2018). The last calibration against the RBCC-E standard was performed in 2021 (WMO, 2024). Strict quality control protocols ensure the validity of Brewer observations, which are made available to the scientific community through the channels of the World Meteorological Organization's World Ozone and Ultraviolet Radiation Data Centre (WOUDC, https://woudc.org/, last access: 8 November 2025) and the European Brewer Network (EUBREWNET, https://eubrewnet.aemet.es/eubrewnet/, last access: 8 November 2025), a database established under COST Action ES1207, where TOC and spectral UV measurements are available in (almost) near-real time. It is noted that in the standard in-house Brewer data processing, observations with AMF larger than 3, corresponding to SZAs of approximately 70°, are typically rejected due to the known effect of stray light under such conditions, as documented in the RBCC-E campaign reports (e.g., WMO, 2024). In this study, however, these observations were intentionally retained in order to investigate the performance of the Delta retrievals under high-SZA conditions, although no stray light correction has been applied to the data. The extensive time series of Brewer TOC observations at LAP.AUTH has been widely used in scientific research studies regarding the long-term variability and trends of TOC and in satellite validation studies (e.g., Bais et al., 1993; Meleti et al., 2009; Fragkos et al., 2016; Fountoulakis et al., 2019b; Amiridis et al., 2024; Garane et al., 2024).
The retrieval method of TOC from Brewer measurements follows the established methodology described in Kerr et al. (1981). It is based on direct solar spectral irradiance measured simultaneously at four wavelengths in the UV (310.1, 313.5, 316.8 and 320.0 nm) and utilizes the Bass and Paur (1985) ozone absorption cross sections. Furthermore, the retrieval algorithm assumes an effective ozone absorption temperature of −44 °C and an effective ozone height of 22 km. The estimated uncertainty of the Brewer TOC observations is nominally about 1 % (Kerr et al., 1988).
2.4 Pandora
Pandora is a dual-spectrometer system that was collaboratively designed by the National Aeronautics and Space Administration (NASA), the European Space Agency (ESA), SciGlob Instruments and Services (https://sciglob.com/, last access: 8 November 2025) and Luftblick OG. It aims to improve and extend the capabilities of the ground-based infrastructure for satellite validation. To support this mission, the large-scale global monitoring network, PGN, was developed. PGN provides homogeneous instrument calibration, central data processing and formatting, and quick delivery of final data products. It focuses on the monitoring of air-quality-related species and delivers DS-DOAS total column and MAX-DOAS tropospheric column and surface concentration measurements of several trace gases, including NO2, O3, formaldehyde (HCHO), water vapor (H2O) and SO2 (e.g., Herman et al., 2009), with a high temporal resolution. Pandora instruments have not only been involved in satellite validation activities (e.g., Judd et al., 2020; Verhoelst et al., 2021), but have also been employed in the assessment of air pollution and for understanding of the physical and chemical processes in the atmosphere (e.g., Tzortziou et al., 2015; Spinei et al., 2018; Robinson et al., 2020). One such instrument (Pandora #240) has been installed at LAP.AUTH in September 2022. The system consists of two commercial spectrometers by Avantes (https://www.avantes.com/, last access: 8 November 2025), housed in a thermally isolated box for temperature stabilization, covering the UV-VIS and NIR regions, respectively. The operational TOC product is retrieved from the UV-VIS spectrometer, which features a symmetrical Czerny-Turner design with a grating of 1200 lines mm−1 and a 50 µm entrance slit. The spectrometer is equipped with a back-thinned Hamamatsu CCD detector of 2048×64 px, recording spectra in the range 277–538 nm with a resolution of approximately 0.55 nm FWHM (Herman et al., 2015).
The TOC retrieval methodology using DS-DOAS, along with the Algorithm Theoretical Baseline Document (ATBD), usage guidelines, and the calibration procedures that are applied, are described in detail in the corresponding manuals that are publicly available through the PGN website (https://www.pandonia-global-network.org/home/documents/manuals/, last access: 8 November 2025). In this study, we use the PGN TOC of the retrieval version “rout2p1-8”, processed with the BlickP processor, which is currently the operational PGN TOC product and is publicly available through the PGN website. The retrieval employs a high-resolution extraterrestrial reference spectrum within the spectral window 305.0–325.0 nm. For this product, the effective ozone temperature is derived from an ozone profile climatology, and the O3 absorption cross sections are adjusted to this climatological temperature prior to spectral fitting. Additional details for the product and the retrieval settings are provided in the PGN Data Products Readme Document (https://www.pandonia-global-network.org/assets/manuals/PGN_DataProducts_Readme_v1-8-10.pdf, p. 25, last access: 24 February 2026). All operational products of PGN include a quality flag for the retrievals, as part of the standard data quality control and in this study, only medium- and high-quality TOC data are used. Throughout the study period, the instrument remained fully operational, with minimal gaps in its timeseries due to routine maintenance.
3.1 DOAS-based TOC retrieval algorithm
This section deals with the TOC retrieval algorithm that is based on the application of DOAS on direct sun spectra measured by Delta. DOAS relies on the modified Beer-Lambert law, which describes the attenuation of solar radiation in the atmosphere by molecular and aerosol absorption and scattering. DOAS is based on the principle that molecular and aerosol extinction processes, various trace gas absorptions, as well as instrumental and turbulence effects show broad spectral features, while certain trace gases exhibit narrow absorption structures. Of key importance in the DOAS principle to detect and quantify trace gases in the atmosphere is the separation of the narrow-band absorptions from the broad-band spectral features, with the latter (including Rayleigh and aerosol extinction) being approximated by fitting a low-order polynomial function.
The TOC retrieval algorithm involves a two-step process. First, a least-squares fit is performed within a defined spectral window to calculate the O3 SCD, i.e., its concentration integrated along the light path. This process is usually referred to as DOAS fit. In the DOAS analysis, however, SCDs are retrieved with respect to a reference spectrum, also called Fraunhofer Reference Spectrum (FRS). Since FRS can also be influenced by trace gas absorptions, the primary output of the DOAS analysis is the differential slant column density (dSCD), defined as the difference between the SCD of the analyzed spectrum and that of the FRS (SCDFRS):
In DS-DOAS applications, the FRS is usually a single spectrum, or the average of multiple spectra measured under clear-sky conditions. In order to obtain high absorption signals in the DOAS analysis, the effect of O3 absorption should be minimal in the reference spectrum. Hence, the aim is to select a reference spectrum in a day when TOC is relatively small, measured under the shortest possible slant path (or small SZA). In this study, the chosen FRS is a spectrum recorded by the same instrument at LAP.AUTH on 6 May 2024, at SZA = 23.9°. The reference spectra are slightly different for the UV and VIS retrievals, as they were measured with a small temporal offset of approximately 30 s, as discussed in Sect. 2.2. An important benefit of using an FRS recorded with the same instrument is the precise wavelength alignment, thus ensuring effective removal of both the Fraunhofer absorption features of solar radiation and any characteristic features in the instrument's spectral response. Solar irradiance data measured by pyranometers in Thessaloniki (Sect. S1 in the Supplement) confirm clear-sky conditions during the whole day, except for a brief 30-minute period after 14:00 UTC, however this is not a concern, as the FRS was recorded around local noon at approximately 10:30 UTC.
The second step of the retrieval algorithm is the conversion from O3 SCD to VCD, by division with an AMF, according to Eq. (2).
Given that VCD equals TOC in this case, the combination of Eqs. (1) and (2) yields:
In the following subsections, a description is given of the DOAS settings that are applied for the retrieval of O3 SCDs in the Huggins and Chappuis bands, the calculation of the AMFs that are required for the conversion to VCDs, the calibration procedures applied for the estimation of the O3 SCD of the reference spectrum, and the associated uncertainty budget of the Delta TOC retrievals.
3.2 DOAS retrieval settings
Ozone dSCDs are retrieved separately in the UV and VIS spectral ranges. In both cases, the retrieval settings are based on recommendations of NDACC (Hendrick et al., 2011) and the Fiducial Reference Measurements for Ground-Based DOAS Air-Quality Observations (FRM4DOAS) project (Van Roozendael et al., 2024), as well as on results from the CINDI-2 campaign (https://uv-vis.aeronomie.be/groundbased/campaigns/CINDI2camp.php, last access: 8 November 2025) (e.g., Kreher et al., 2020) with some adaptations based on the specific instrumentation. The NDACC recommendation for ozone retrievals in the Chappuis bands is to use a spectral window of 450–540 nm (Hendrick et al., 2011), where uncertainties of ozone fitting are minimal. However, the spectrograph of Delta has a shorter spectral coverage. Therefore, the spectral window was set from 450 to 520 nm to cover a large enough wavelength range, in which ozone exhibits absorption features, without stretching the spectrograph to its upper spectral limit (523 nm), where ozone features are anyway broadband. This spectral window was also recommended during the CINDI-2 campaign (Kreher et al., 2020). In the UV, the ozone absorption cross section shows a significant temperature dependence (Serdyuchenko et al., 2014). To account for this effect, a linearization approach is applied by including two ozone absorption cross sections in the DOAS fit: one at 223 K, representative for stratospheric temperatures, and one temperature-differential cross section, obtained as the difference between cross sections at 243 and 223 K. In the analysis, both cross sections are fitted simultaneously, allowing the retrieval algorithm to account for the effective temperature of ozone absorption and thus for variations in the relative contributions of tropospheric and stratospheric ozone. In DOAS retrievals, additional fit parameters are usually included, such as an I0 correction and an intensity offset. The I0 effect originates from inconsistencies between laboratory absorption cross sections measured with a smooth light source and the structured atmospheric absorption spectra recorded with lower spectral resolution, while the intensity offset compensates for potential stray light or dark signal that is not effectively removed from the measured spectrum (Aliwell et al., 2002; Danckaert et al., 2017). However, for the retrieval in the Chappuis bands, no I0-correction has been applied since the ozone cross section structures in this region are broad and such a correction has a negligible effect on the retrieved dSCDs, which was also confirmed by a sensitivity test. A third- and fifth-order polynomial is used to fit the low frequency structures due to molecular and Mie scattering in the UV and VIS ranges, respectively, and a first-order polynomial to account for stray light effects through the aforementioned intensity offset term (Aliwell et al., 2002). While in MAX-DOAS retrievals an additional pseudo cross section is usually included in the DOAS fitting to account for the Ring effect in the scattered radiation spectra, DS-DOAS is based on direct radiance spectra and thus such a cross section is not included in the analysis.
The recorded spectra are analyzed using the QDOAS (version 3.6.0, December 2023) software developed at BIRA-IASB (https://uv-vis.aeronomie.be/software/QDOAS/, last access: 8 November 2025). The slit function parameters, as well as any shift of the wavelength calibration of the measured spectra are fitted by QDOAS using a high-resolution solar FRS (Chance and Kurucz, 2010) prior to the DOAS analysis. The retrieval settings of O3 in the UV and VIS ranges, as well as the trace gas absorption cross sections that are included in the DOAS fit are summarized in Table 1.
Table 1Retrieval settings used for the retrieval of ozone dSCDs in the UV and VIS spectral ranges.
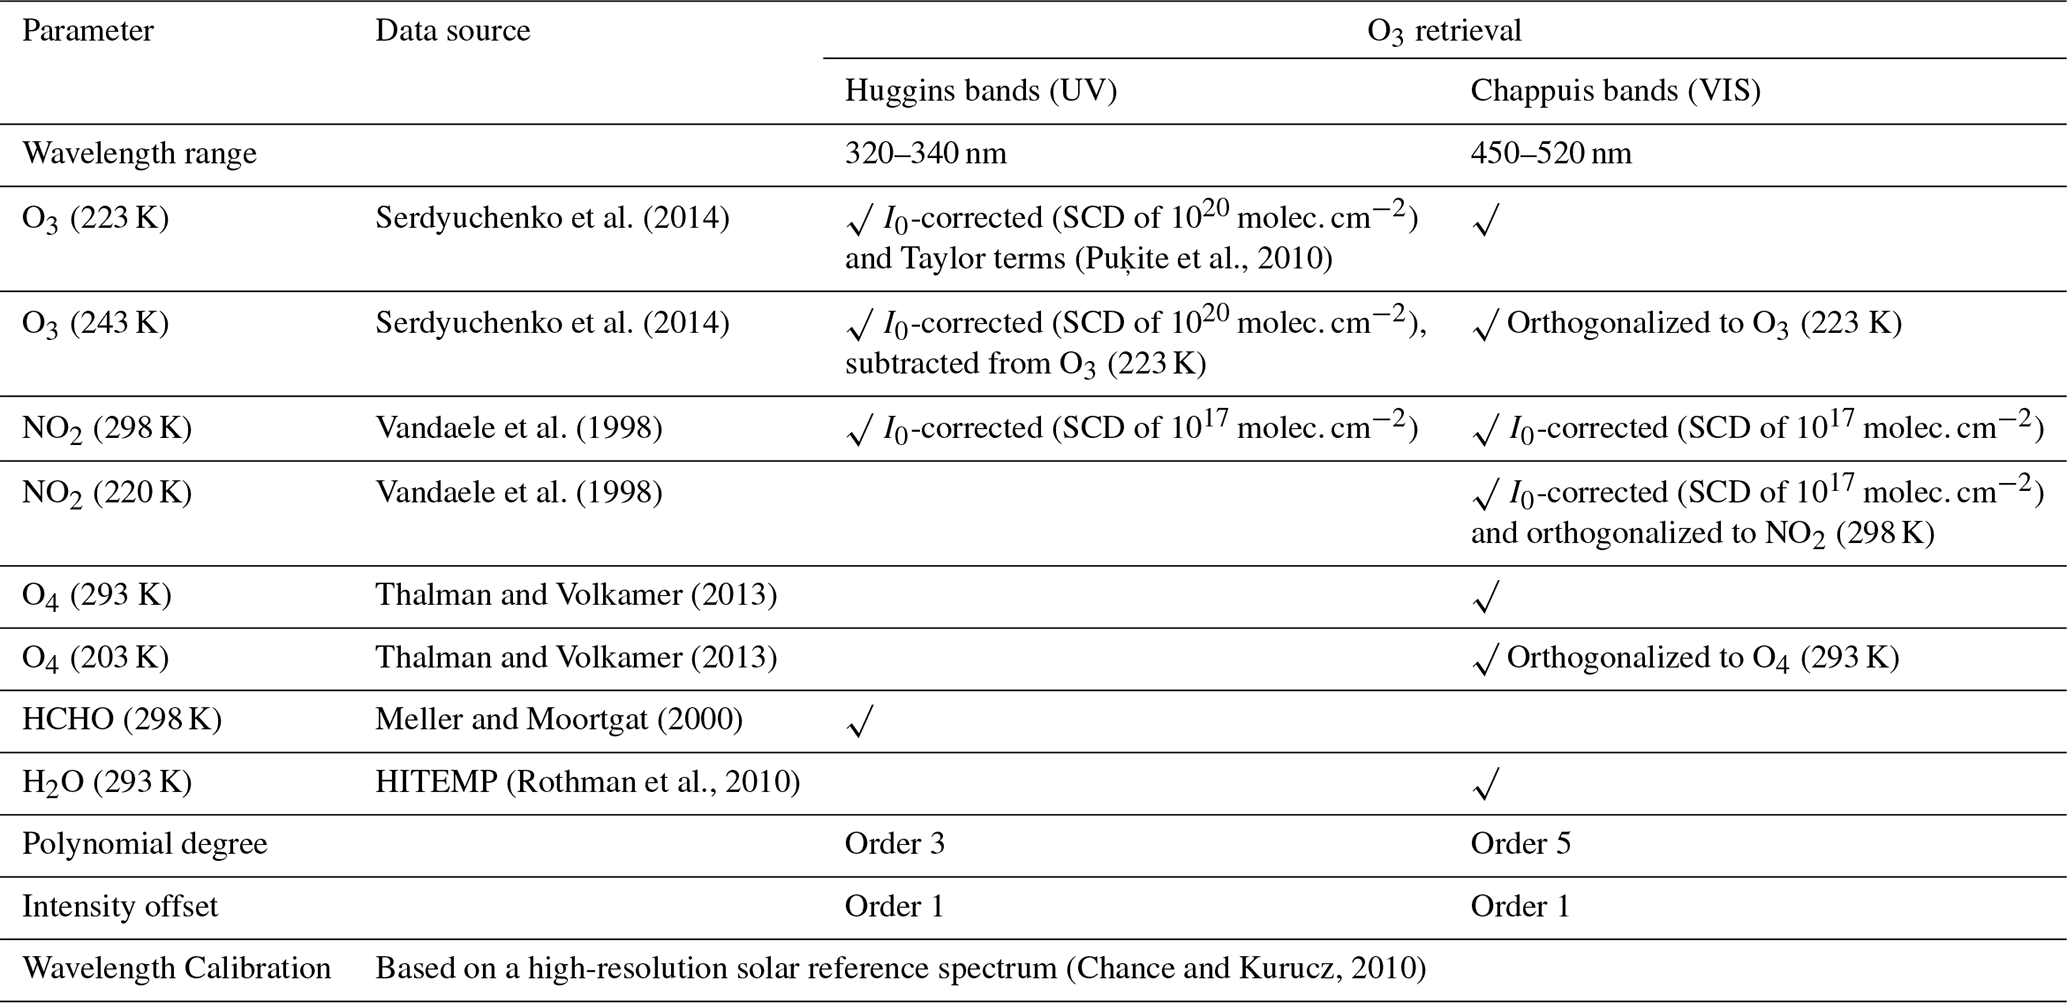
Figure 2 shows a typical DOAS fit example of O3 in the UV and VIS for two consecutive direct sun spectra (with a time difference of ∼30 s) measured by Delta on 30 March 2024 at 13:57 UTC and at 58.6° SZA, with and without the U340 bandpass filter. Only the trace gas fits that are common for the UV and VIS retrievals are presented in Fig. 2. The ozone dSCDs retrieved from the two channels are in very good agreement, with a relative difference of approximately 0.45 %. The DOAS fit of O3 is better in the UV due to the stronger absorption in the Huggins bands, leading to differential optical depths of about one order of magnitude higher. Nevertheless, the ozone fitting in the VIS provides consistent and reliable results, with the retrieval accurately resolving the three main absorption bands in the selected wavelength range. The root mean square (RMS) of the DOAS fit residual in the VIS (in this example ) is significantly lower than in the UV (), by a factor of approximately 4, primarily due to the higher SNRs in the visible range. However, this behavior is not limited to individual cases. Figure S2 (Sect. S2) shows that RMS values in the VIS range are generally lower than those in the UV. Moreover, the increase of RMS with increasing SZA is less pronounced in the VIS, whereas in the UV retrievals RMS exhibits a stronger increase, indicating higher sensitivity to stray light effects in the Huggins bands under low solar elevations. NO2 is more accurately captured in the VIS, because of its pronounced narrow-band absorption features compared to the UV range, where also the attenuation of solar radiation is dominated by ozone absorption.
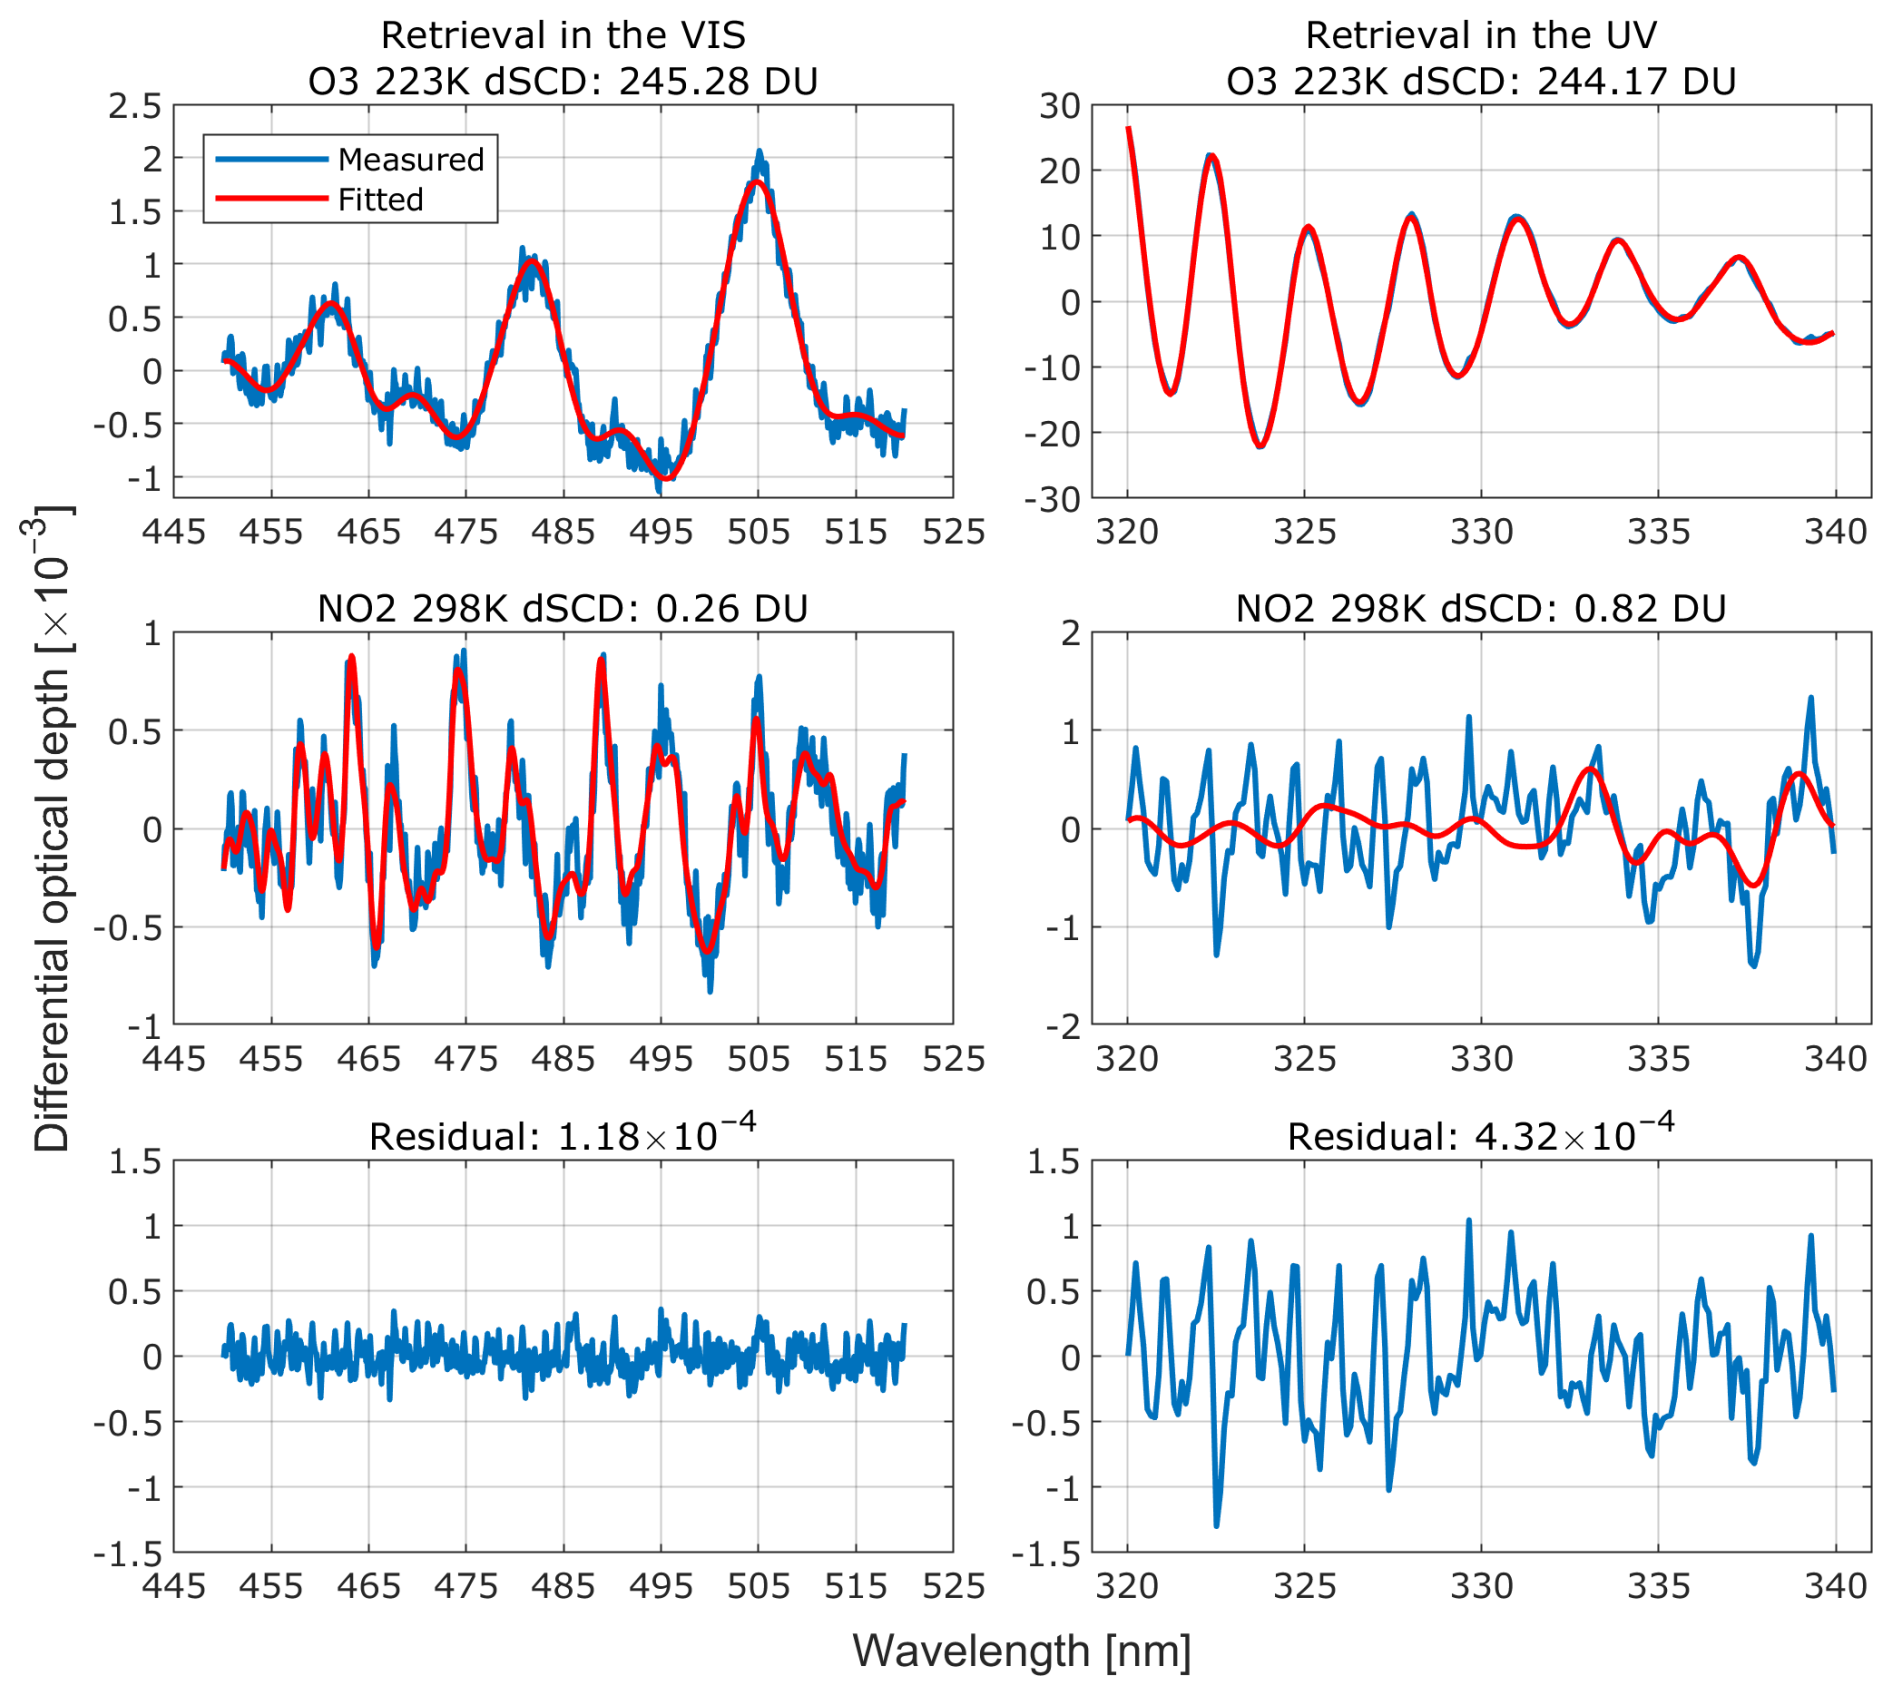
Figure 2Example of DOAS spectral fitting for ozone in the VIS (left column) and UV (right column) spectral ranges. The top panels show the measured (blue) and fitted (red) differential optical depths for O3, the middle panels for NO2, and the bottom panels the corresponding fitting residuals.
3.3 AMF calculation
The AMF represents the relative path length that solar radiation follows through the atmosphere compared to the vertical path. For direct sun observations, the AMF can be geometrically approximated by . While this approach is relatively accurate for gases located in the lowermost layers of the atmosphere and for small SZAs, it does not account for the Earth's curvature which introduces a dependency on the vertical distribution of the absorbing species. For ozone, which is predominantly concentrated in the stratosphere, this simplistic approximation can lead to significant errors in AMF calculations, which are directly propagated to TOC given their linear relationship as described by Eq. (2). In this study, we adopt for the AMF calculation the formula presented in Cede et al. (2006), i.e.,
where R is the Earth's radius (6370 km) and heff is the effective height of the ozone layer, which has a latitudinal gradient with a seasonal variability. For more precise AMF calculations we used the publicly available (https://avdc.gsfc.nasa.gov/, last access: 8 November 2025) atmospheric ozone profile climatology by Ziemke et al. (2021) which has been constructed by combining daytime ozone profiles from the Aura Microwave Limb Sounder (MLS) and Modern-Era Retrospective Analysis for Research Applications version 2 (MERRA-2) Global Modeling Initiative (GMI) model simulations, binned to latitude bands of 5°. This approach was adopted because routine ozone soundings are not available at Thessaloniki, and local ozonesonde profile measurements cannot be employed. The ozone effective height was calculated on a monthly basis using Eq. (5) as in Gröbner et al., (2021):
where c(z) is the concentration of O3 as a function of altitude, z.
Figure 3 shows the seasonal variability of heff for the latitude bands of 35–40° N and 40–45° N (blue and green lines, respectively). Since the latitude of our monitoring station is at the edge of these bands, the mean heff from both bands (red line) has been considered as more representative. The ozone profile climatology data reveal a distinct seasonal pattern with heff reaching a minimum of 22.3 km in winter (February) and gradually increasing through summer, reaching an autumn peak (in September) of 23.8 km. If a temporally constant heff of 23 km was applied in Eq. (4), the impact on the calculated AMFs would be negligible for SZAs less than 70° (within ± 0.1 %), however, at higher SZAs, this assumption would introduce an error of up to 0.8 %.
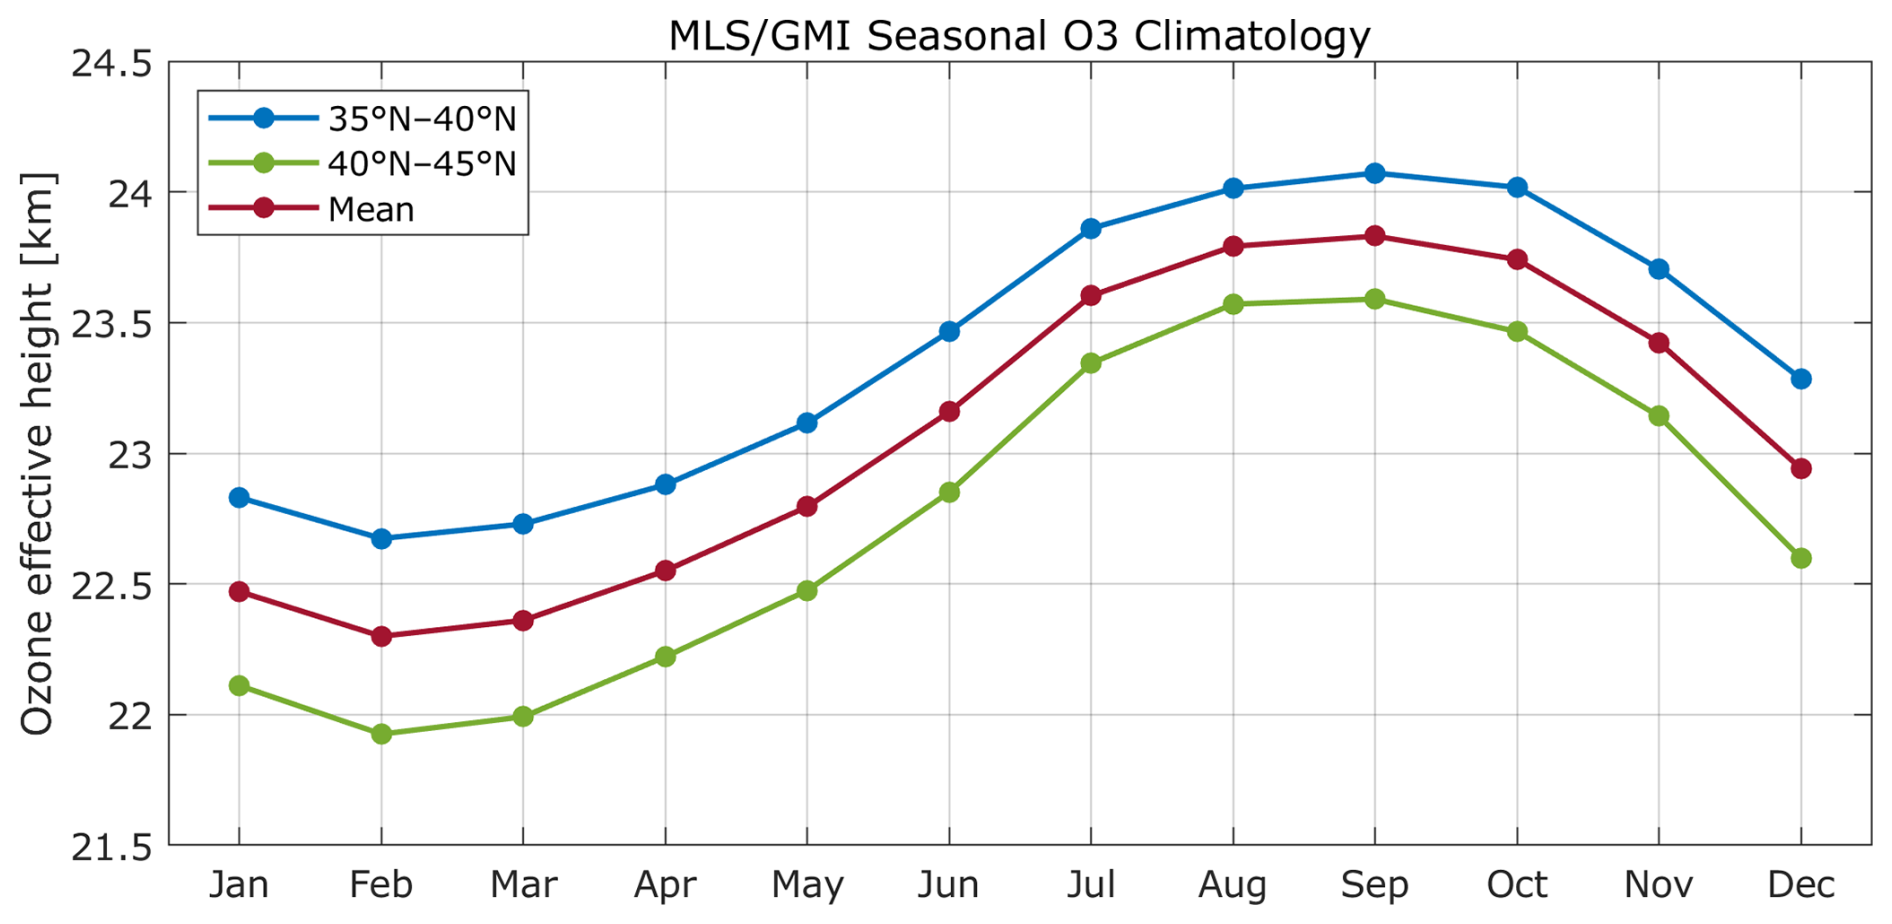
Figure 3Seasonal climatology of ozone effective height derived from MLS/GMI data for the latitude bands 35–40° N (blue) and 40–45° N (green), along with their mean (red), which is considered more representative for the latitude of LAP.AUTH.
3.4 Estimation of the O3 SCD of the reference spectrum
According to Eq. (3), TOC calculations require knowledge of the absolute slant column of the reference spectrum (SCDFRS). This calibration procedure is performed using two approaches, i.e., the standard Langley Extrapolation (LE) method (Gröbner and Kerr, 2001) and the Minimum-Amount Langley-Extrapolation (MLE) method, as described in Cede et al. (2006) and in Herman et al. (2009). In the former case, O3 dSCDs are measured during a day (or days) at different SZAs, corresponding to different AMFs and SCDFRS is calculated by extrapolating the differential O3 slant column to zero AMF. On 21 June 2023, Delta was configured to record only direct sun spectra with a high sampling rate (integration time of 30 s) from sunrise to sunset. This day was chosen not only due to cloud-free conditions (Sect. S1), but also due to the wide range of SZAs covered. One of the most important conditions that needs to be met for a proper application of LE is that TOC is constant throughout the day, ensuring a linear relationship between O3 dSCDs and AMF. Based on Brewer and Pandora TOC measurements on that day, it was found that TOC was relatively constant around noon and evening up to 75° SZA, followed by a gradual decrease in TOC levels afterwards (not shown here). Even though measurements in the early morning were also characterized by cloud-free conditions, the O3 dSCDs could not be retrieved because the direct sun direction was blocked by buildings in the campus. Hence, only data recorded between 10:30–16:00 UTC have been used for the LE method. The SZA limitation reduces the AMF range, but the high sampling rate allows for statistically robust results. Figure 4a shows the O3 dSCDs on 21 June 2023 as a function of the AMF. The Pearson's correlation coefficient is very close to unity (R2>0.999), revealing a very consistent linear relationship. The extrapolation to AMF = 0 (i.e., the intercept of the linear regression) yields SCDFRS=410.766 DU. The same method cannot be applied to the UV dataset, since no UV spectra were recorded on 21 June 2023 as noted in Sect. 2.2.
The MLE method is another technique that can be used for the calculation of SCDFRS. However, this method is only applicable when a large amount of O3 data is available, measured on different days and for a wide range of AMFs and TOCs, to provide statistically robust results. This approach relies on the assumption that the minimum vertical column amount of an atmospheric species is constant over part of the dataset, and is therefore independent of AMF (Herman et al., 2009). Under this assumption, the dSCDs would exhibit a linear dependence on AMF (Eq. 3), and the extrapolated dSCD at AMF = 0 would equal SCDFRS. The lowest TOC values in Thessaloniki typically occur during the summer and autumn months (Zerefos et al., 1998) and cover the entire range of the AMF annual variability. Given that a sufficient number of measurements is available in Thessaloniki during these months, the minimum TOC values are expected to be similar for the entire AMF range, thereby satisfying the assumption of the MLE method. Figure 4b shows the O3 dSCDs from the VIS range for the whole period of study against the respective AMFs. The O3 data are grouped in narrow AMF bins of 0.2, and for each group the 3rd percentile of the distribution is calculated, corresponding to the minimum measured dSCD for the respective AMF bin. In the selection of the AMF bin, we avoided overly broad bins which reduce the number of points used in the linear fit, but also excessively narrow bins which may contain too few measurements for a reliable estimation of the minimum dSCD in each percentile. A sensitivity analysis was performed to assess the robustness of the MLE method with respect to the choice of percentile. Percentiles ranging from the 2nd to the 5th, in steps of one, were tested. The resulting differences in the estimated SCDFRS were up to 0.6 % in the VIS and 2 % in the UV. These differences reflect the statistical nature of the MLE method, which requires a sufficiently large number of measurements to yield stable results. The larger variability observed in the UV retrievals is attributed to substantially less data in this spectral range (see Sect. 2.2). To minimize uncertainties in the calculated AMF and to remove O3 data measured at very high SZA, the analysis is limited to AMFs lower than 5.5. Like in the LE method, the minimum O3 dSCDs are linearly fitted to estimate the intercept of the regression that corresponds to the O3 slant column of the reference spectrum. In this case, the SCDFRS was found to be 409.054 DU, which is in very good agreement with the one calculated with the LE method (Fig. 4a).
In addition to the LE and MLE methods, an alternative approach for TOC retrievals is to use an extraterrestrial reference solar spectrum at the top of the atmosphere, which is free of atmospheric absorption, instead of a measured FRS (e.g., Egli et al., 2022). In this framework, the reference spectrum does not contain residual ozone absorption, and the TOC is retrieved directly from calibrated spectral measurements. As a result, this approach does not rely on AMF extrapolations, which usually require stable atmospheric conditions (e.g., the LE method). However, as noted by Herman et al. (2009), this approach requires very accurate wavelength matching between the extraterrestrial reference spectrum and the ground-based measurements (typically better than 0.01 nm) in order to effectively cancel solar Fraunhofer structures, which in practice is difficult to achieve. In the present study, TOC retrievals are therefore based on a measured FRS calibrated using the LE and MLE methods, while the use of an absorption-free extraterrestrial reference spectrum is not further explored, but is foreseen for future investigation.
For the TOC calculations, the SCDFRS that is used in Eq. (3) is taken as the mean of the two methods, i.e., SCDFRS=409.91 DU for the VIS retrievals. When the same MLE methodology is applied to data in the UV retrievals (Fig. 4c), a comparable SCDFRS=408.54 DU is obtained. However, the UV dataset covers a shorter time period and does not include the summer and autumn months, when TOC typically reaches its annual minimum. Furthermore, at larger SZAs the RMS filtering that is applied (see Sect. 4) removes a substantial number of measurements. As a result, the statistical assumptions of the MLE method are less optimally satisfied for the UV, which leads to a larger sensitivity to the choice of the percentile and the AMF range. In this case, to ensure statistical robustness, the AMF range was restricted to values below 4. Despite these limitations, the close agreement between the UV- and VIS-derived values of SCDFRS indicates that the calibration of the reference spectrum is robust. Given the small temporal difference between the acquisition of UV and VIS reference spectra and the negligible atmospheric variability on that timescale, the same SCDFRS is applied consistently to both UV and VIS TOC retrievals.
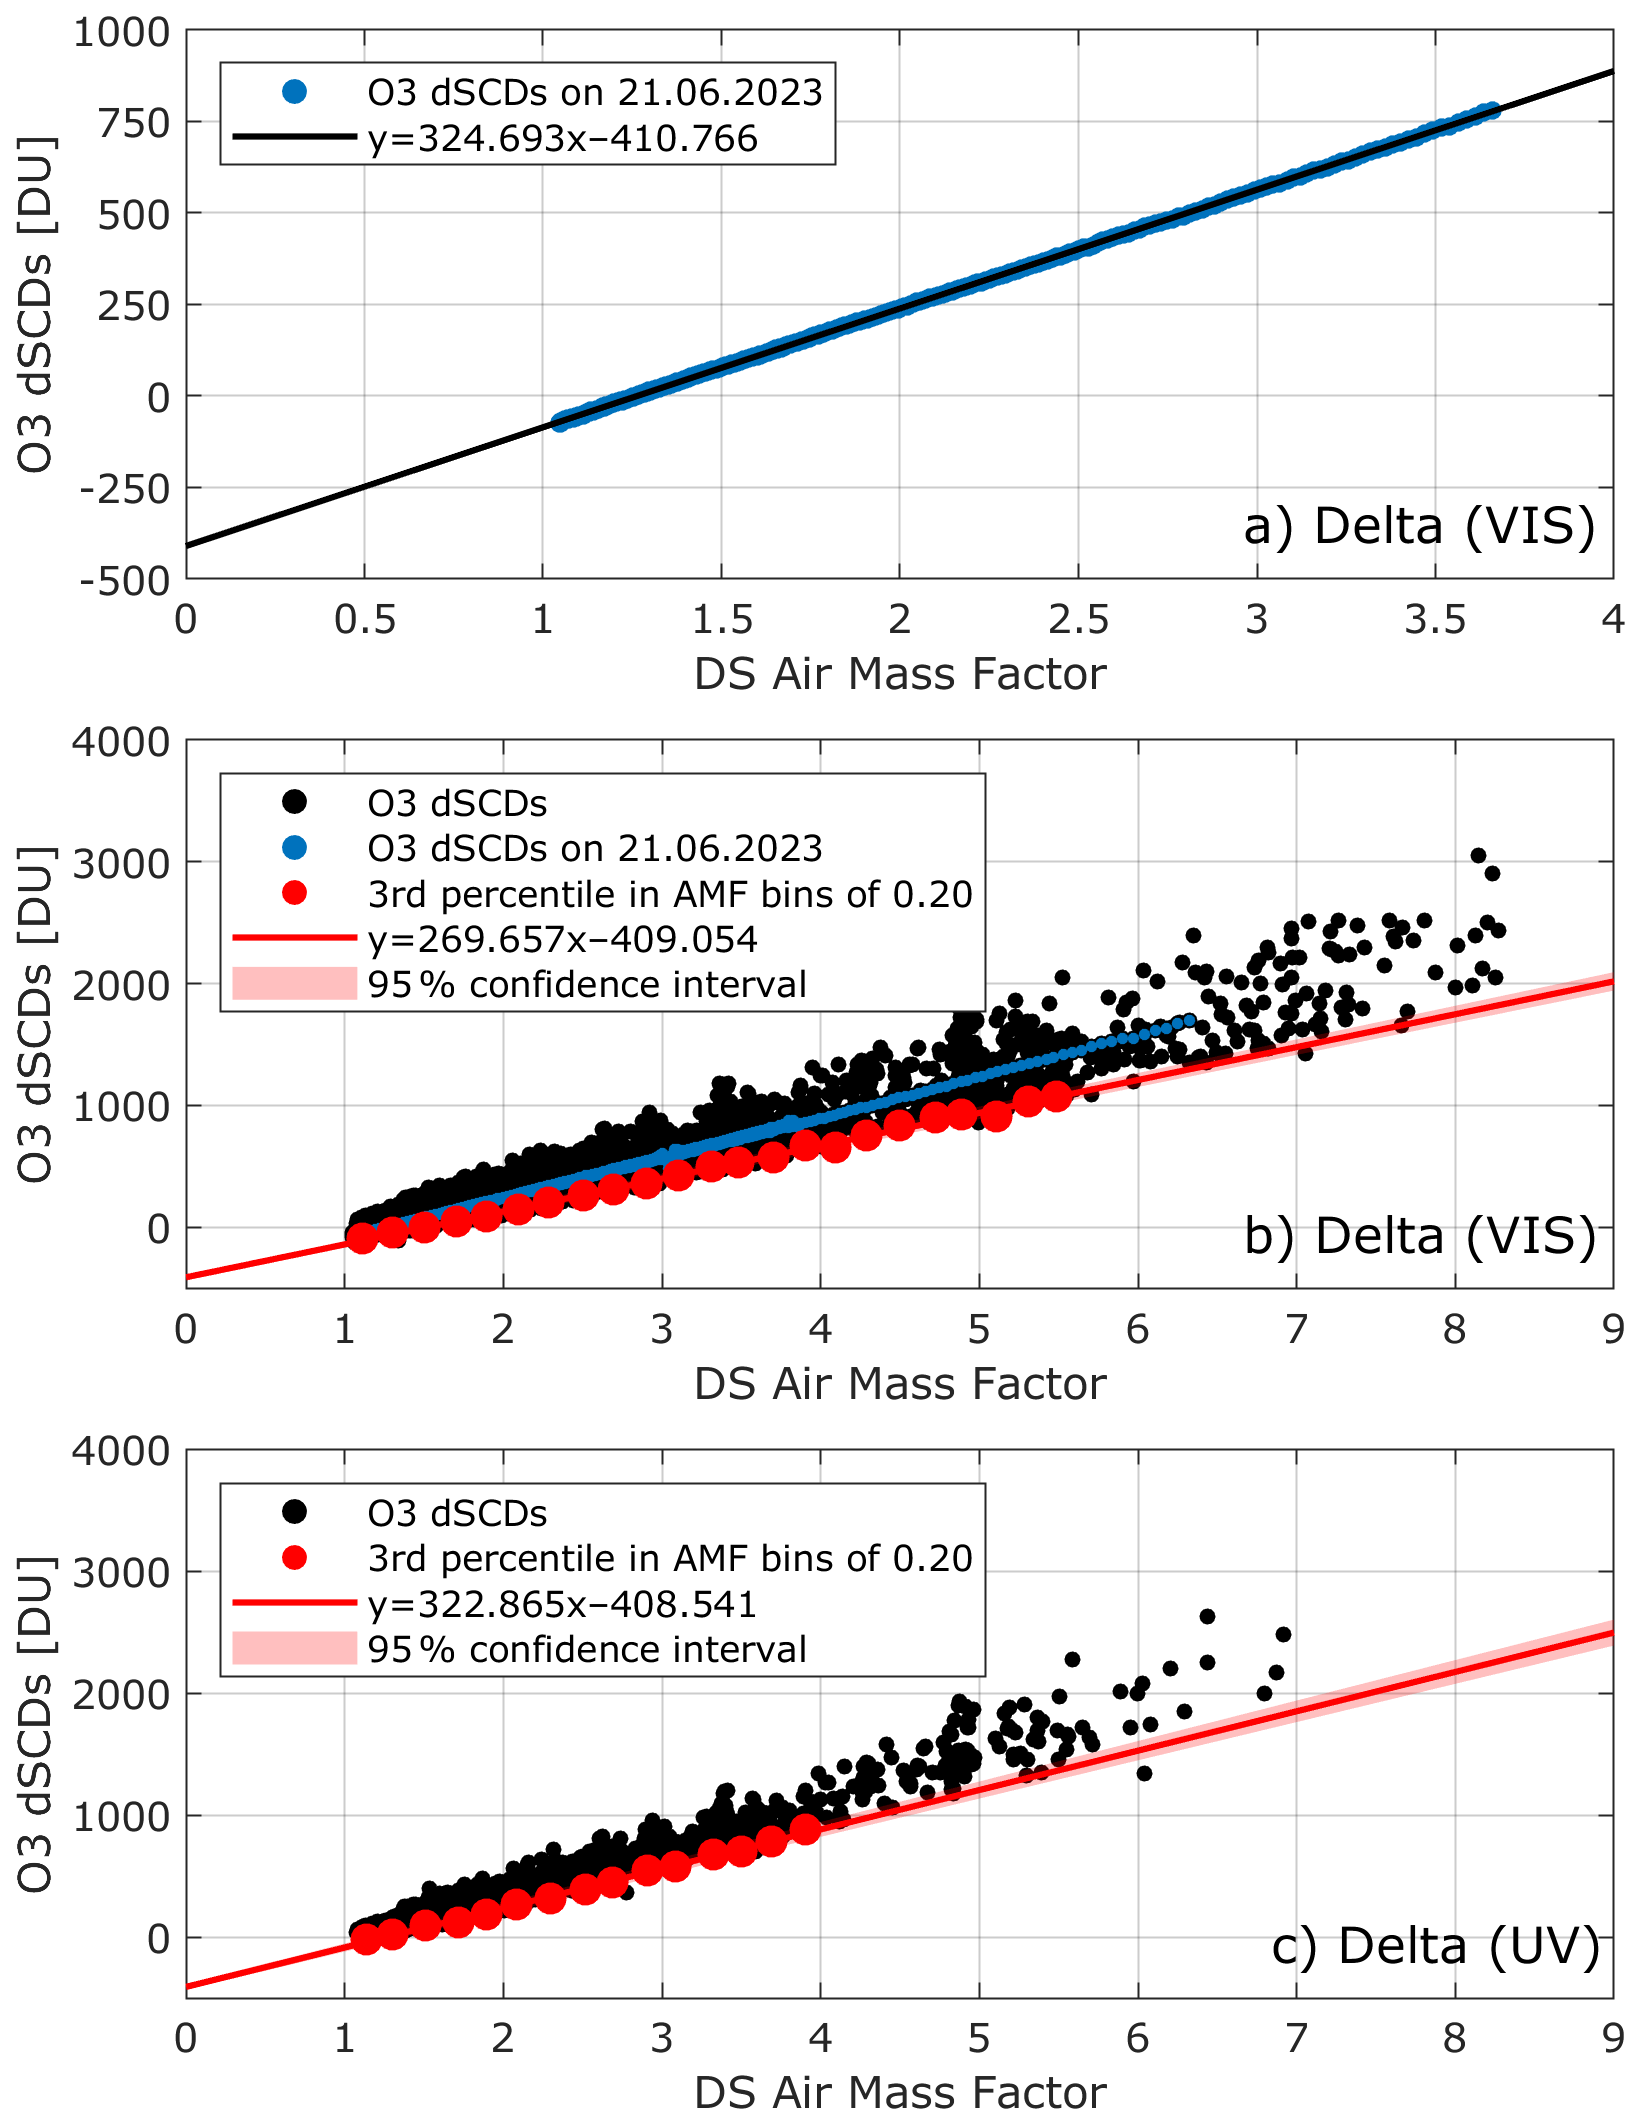
Figure 4(a) Langley plot for a single clear-sky day (21 June 2023) showing O3 dSCDs as a function of AMF. The solid black line represents the linear regression used to estimate the SCDFRS. (b) Minimum-Amount Langley-Extrapolation analysis applied to the VIS dataset over the entire study period. Black markers represent all O3 dSCDs, blue markers correspond to measurements on 21 June 2023, and red markers correspond to the 3rd percentiles within AMF bins of 0.20. (c) Same as panel (b), but for O3 dSCDs retrieved in the UV range.
3.5 Uncertainty budget
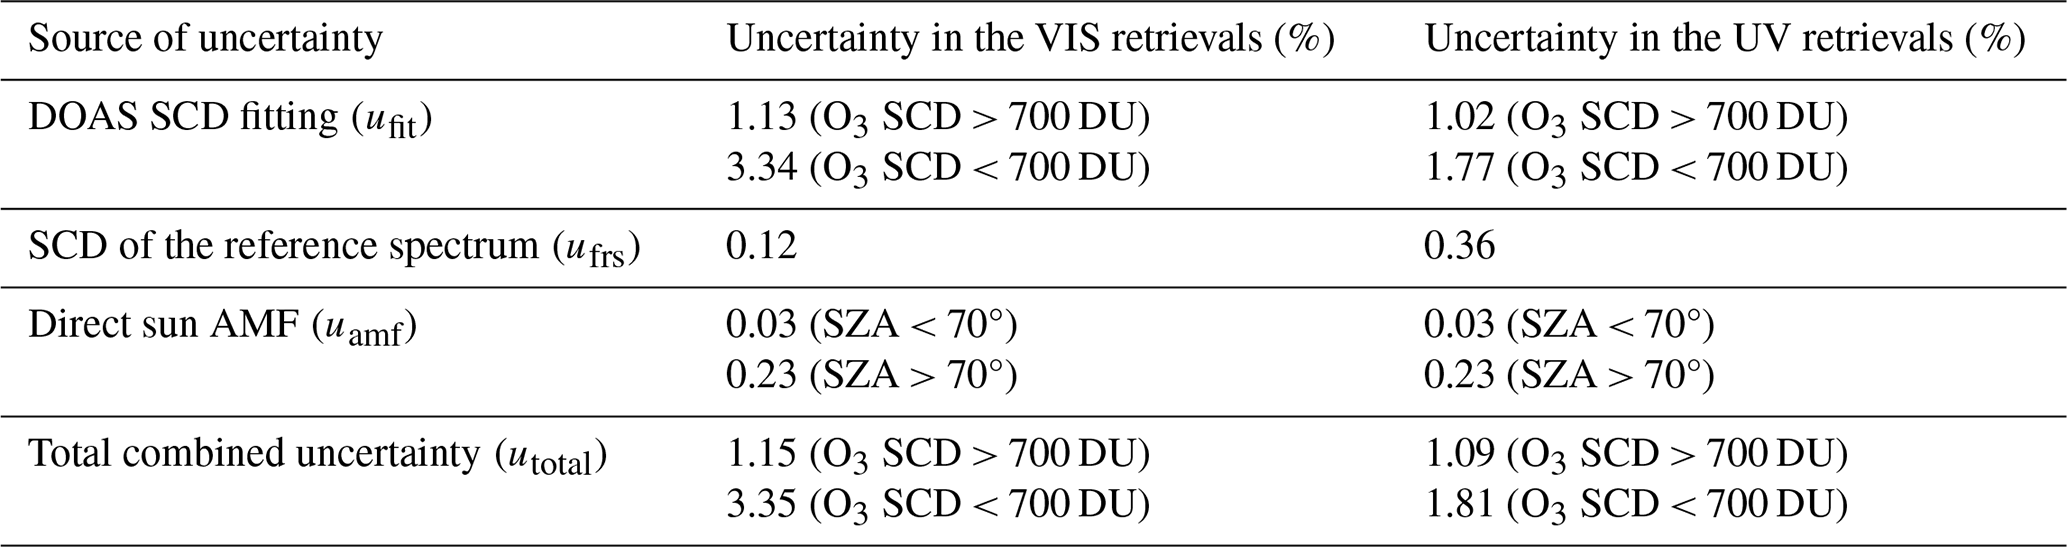
Following the discussion of the retrieval methodology in Sect. 3.2–3.4, the uncertainty budget of the Delta TOC retrievals can be evaluated by considering three primary components: (i) the DOAS SCD fitting uncertainty, (ii) the determination of the SCD of the reference spectrum from the Langley/MLE analysis, and (iii) the uncertainty of the AMF. In this section, the reported values represent standard uncertainties (k=1), corresponding to a coverage probability of approximately 68 %.
Since the relative fitting uncertainty (calculated as the ratio between the fitting uncertainty and the retrieved SCD) depends on the strength of the ozone absorption signal, it is reported separately for O3 SCDs smaller or larger than 700 DU. This threshold, corresponding to the mean SCD of the VIS dataset, is used to distinguish typical low and high absorption conditions. In the VIS range, the relative fitting uncertainties are 3.34 % and 1.13 % under low and high absorption conditions, respectively. The higher uncertainty for SCDs below 700 DU is associated with weak differential ozone absorption signal, resulting in increased measurement noise. These values are comparable to the fitting uncertainties of 3 % reported by Hendrick et al. (2011), even though that study was based on different viewing geometry (twilight zenith-sky observations). In the UV, the relative fitting uncertainties are 1.77 % and 1.02 % for low and high absorption conditions, respectively. The lower overall uncertainty of the UV retrievals for low SCDs is due to the stronger absorption of O3 in the Huggins bands compared to the Chappuis bands, as already discussed in Sect. 3.2. Under high absorption conditions, which are typically associated with large SZAs, the SNR of the measured spectra decreases, especially in the UV, resulting in uncertainties comparable to those in the VIS.
The uncertainty associated with the determination of the O3 SCD of the FRS is discussed in Sect. 3.4, where SCDFRS variations of up to 0.6 % and 2 % are found for the VIS and UV ranges, respectively. This source of uncertainty does not depend on the magnitude of the retrieved ozone absorption. As already noted, the larger uncertainty in the UV is associated with the reduced number of observations and may be further refined when more data become available. These uncertainties propagate to TOC via Eq. (3), corresponding to a median contribution of 0.4 % in the VIS and 1.23 % in the UV. Assuming a rectangular uncertainty distribution, the corresponding standard uncertainties are 0.12 % and 0.36 %, respectively.
As discussed in Sect. 3.3, the estimated uncertainty in the AMF, arising from the seasonal variability of the effective ozone height, is up to 0.1 % for SZAs smaller than 70° and up to 0.8 % at larger SZAs. Assuming a rectangular uncertainty distribution, the corresponding standard uncertainties are 0.03 % and 0.23 %, respectively. These uncertainties propagate directly to the retrieved TOC and are the same for both the UV and VIS retrievals. Comparable uncertainties, of about 0.085 %, have been reported in previous studies (e.g., Egli et al., 2022).
Assuming independent contributions from the aforementioned sources of uncertainty, the total combined uncertainty of the Delta TOC retrievals is calculated using Eq. (6):
where ufit, ufrs and uamf denote the uncertainties associated with the DOAS SCD fitting, the determination of the SCD of the reference spectrum, and the direct sun AMF, respectively. The combined uncertainty of the TOC retrievals is dominated by the SCD fitting uncertainty and is estimated to be approximately 1.15 % in the VIS and 1.09 % in the UV under high absorption conditions and 3.35 % in the VIS and 1.81 % in the UV under low absorption conditions. An overview of the uncertainty sources is provided in Table 2.
Table 2Uncertainty budget of the Delta TOC retrievals in the UV and VIS ranges.
This section presents the results of TOC retrievals in the UV and VIS spectral ranges, including an intercomparison of data from the two channels, as well as comparison and validation against collocated measurements from the Brewer and Pandora instruments, which here are considered reference instruments because of their proven measurement quality and much longer history in TOC monitoring.
It should be noted that no direct cloud flagging algorithm is applied to the data measured by Delta. Only a coarse cloud-filtering procedure is implemented, based on the calculated exposure time of the CCD camera, to reject highly contaminated measurements. During the instrument's operation, the exposure time is automatically adjusted to optimize the signal strength while preventing spectral saturation. When the calculated exposure time exceeds the threshold value of 4 sec, direct sun measurements are aborted. While this approach effectively eliminates measurements under thick cloud conditions, measurements are still performed under thin clouds, potentially introducing at some degree cloud-related contamination. To ensure high-quality DOAS fits and to minimize errors due to weak radiation levels, the data are additionally filtered based on the SZA (measurements at SZAs greater than 85° are excluded from the analysis), as well as on the RMS of the DOAS fit residuals. Different threshold values are applied for the UV and VIS spectral regions, to account for their SNR differences, as previously discussed in Sect. 3.2. The peaks of the frequency distribution of the DOAS fit RMS over the whole datasets are approximately and in the UV and VIS, respectively. In the UV channel, even though an RMS threshold of ensures good-quality DOAS fits, it removes almost all data measured at SZAs higher than 70°. Hence, in order to retain measurements up to at least 80° SZA, the RMS threshold was adjusted to as in Kumar et al. (2020). Due to the lower O3 optical depths in the VIS channel, the RMS threshold was set to , which, while stricter than for the UV channel, ensures accurate fits. These threshold values remove 7.1 % and 10.4 % of the O3 retrievals measured at SZAs lower than 85°, in the UV and VIS ranges, respectively.
4.1 Comparison of UV and VIS TOC retrievals
Figure 5 shows the comparison of ozone absolute SCDs (calculated using Eq. (2) by multiplying TOC with its corresponding AMF) retrieved from Delta UV and VIS spectra over the whole period of study.
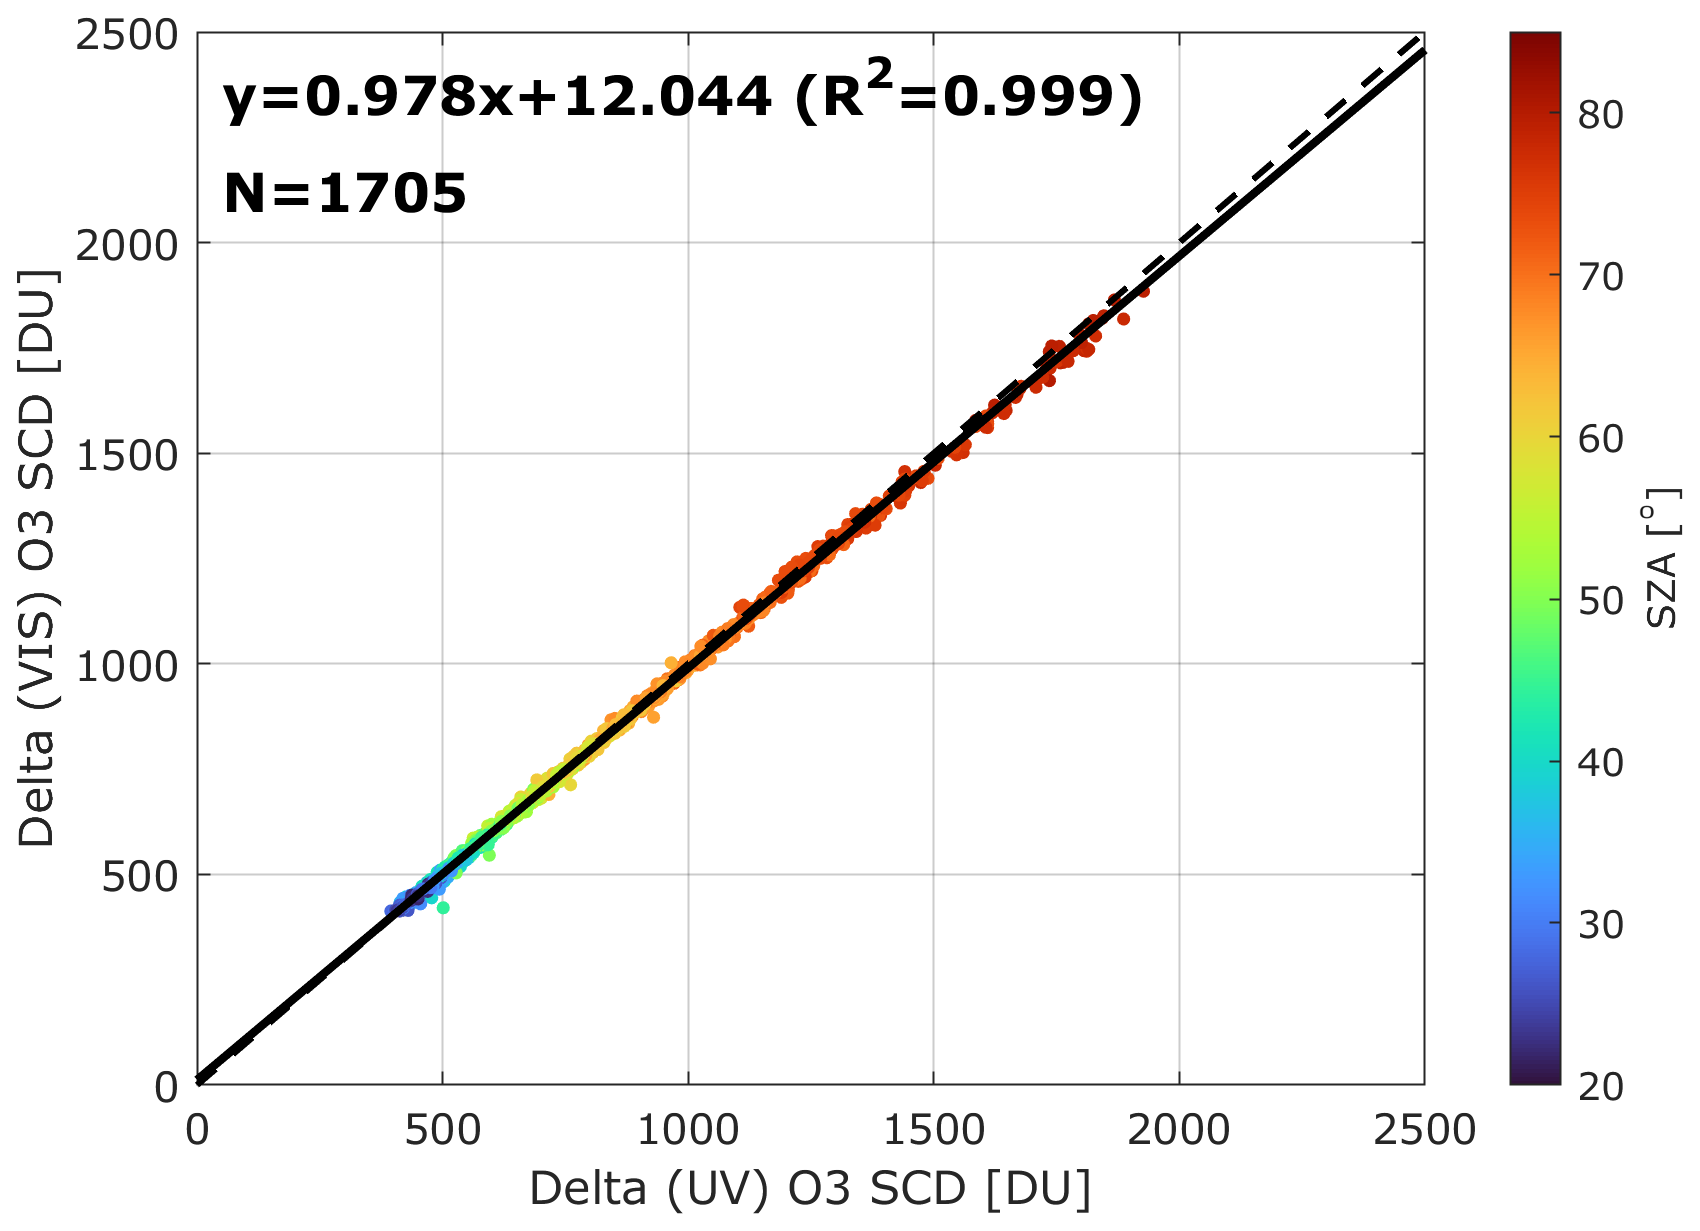
Figure 5Comparison of ozone SCDs retrieved from Delta UV and VIS spectra over the study period. The data are color-coded by SZA. The dashed line represents the 1:1 reference, while the solid line shows the linear regression fit. N corresponds to the total number of Delta measurements.
The two datasets show an almost perfect linear correlation (R2=0.999), that highlights the consistency of the DOAS retrievals across the UV and VIS spectral windows. The data are color-coded by SZA, indicating that the good agreement applies to the full SZA range, from about 17° up to 85°. The higher O3 SCDs observed at large SZAs do not necessarily correspond to increased TOC but rather reflect the longer atmospheric light paths of radiation. At smaller SZAs the scatter is minimal, while a slight increase appears at larger SZAs. This behavior is consistent with the reduced signal strength in the UV, as well as the stronger influence of stray light under such conditions. Despite these effects, no strong systematic SZA-dependent bias is evident, supporting the robustness of both retrievals. Overall, the comparison suggests that the Delta instrument can deliver reliable and consistent ozone SCD measurements in both spectral regions, supporting the feasibility of using the Chappuis bands for TOC retrievals, thereby complementing the traditional UV-based approaches. The regression's slope indicates a small systematic bias of approximately 2 % between UV and VIS O3 SCDs, which highlights the strong consistency between the retrievals in two spectral regions.
The corresponding comparison of TOC measurements, derived from the UV and VIS channels of Delta over the study period is presented in Fig. 6. Compared to the O3 SCDs, the dynamic range of the TOC values is significantly smaller, which statistically leads to a weaker correlation between the two datasets. Nevertheless, the scatter plot (left panel) indicates a very strong correlation between the two datasets, with a high Pearson's correlation coefficient (R2=0.975). Most of the data points are close to the 1:1 line (dashed black), indicating high agreement between TOC values obtained from the two channels. The data are color-coded by the O3 dSCD, which represents the strength of the ozone differential absorption signal. Data points exhibiting significant deviations from the 1:1 line, as well as most of the outliers, are associated with very low O3 differential optical depths, which increase the noise in the visible measurements, as the ozone absorption signal becomes weak under such conditions. The linear regression yields a slope of 0.957 and an intercept of 14.922 DU, suggesting a slight systematic deviation. The histogram (right panel) illustrates the frequency distribution of TOC percentage differences between the VIS and UV channels. The distribution is closely approximated by a gaussian, with a median and mean differences of −0.44 % and −0.39 %, respectively, indicating a slight negative bias for the VIS channel. Most of the differences fall within a relatively narrow range of approximately ± 2%, as defined by the 5th and 95th percentiles (green lines). Additionally, the interquartile range (magenta lines) further highlights that 50 % of the data falls within a narrower band around the median (within −1 % and 0.5 %). The high correlation and the narrow spread of differences confirm the robustness of DS-DOAS in retrieving TOC across both spectral regions and provide the general overview of their comparison. In the following subsection, the TOC data from both channels of Delta are compared and validated with respective O3 data from Brewer and Pandora.
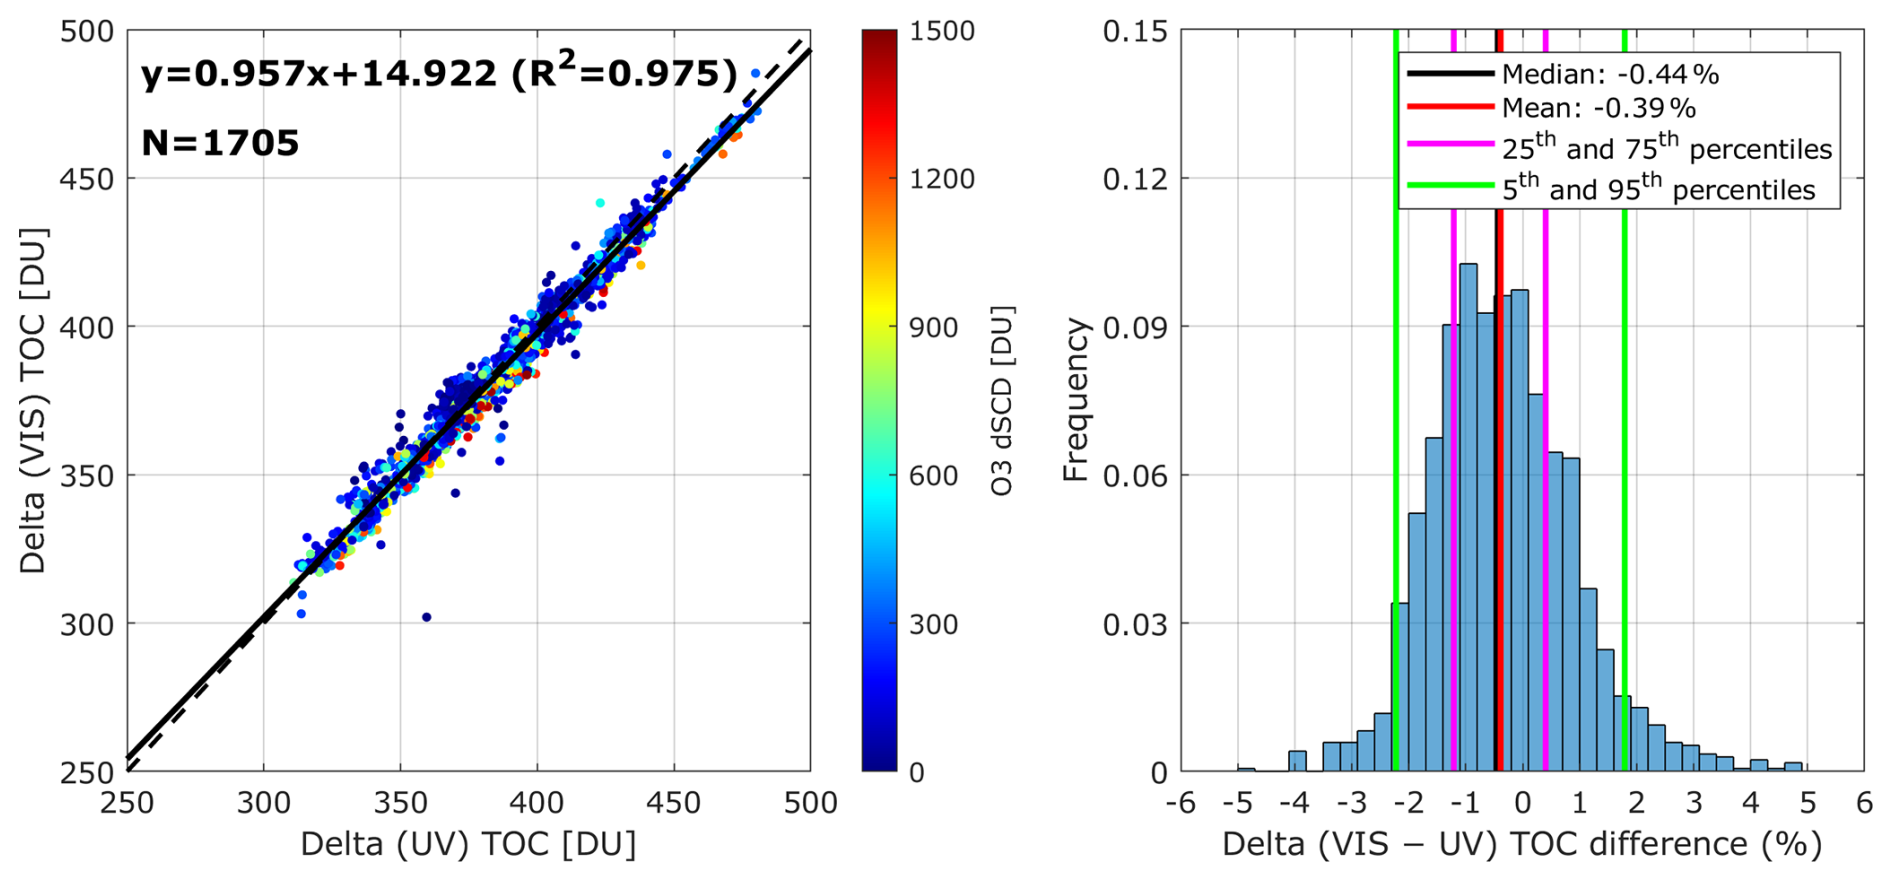
Figure 6Comparison of TOC measurements from the UV and VIS channels of Delta over the study period. (left) Scatter plot of VIS against UV retrievals, color-coded by ozone dSCDs. The dashed line represents the 1:1 reference, while the solid line shows the linear regression fit. N corresponds to the total number of Delta measurements. (right) Frequency distribution of their respective percentage differences (VIS – UV). The vertical lines indicate the median (black), mean (red), the 25th and 75th percentiles (magenta), and the 5th and 95th percentiles (green).
4.2 Intercomparison with the Brewer and Pandora
For the intercomparison, collocated TOC measurements from Delta, Brewer, and Pandora were identified using a temporal matching criterion of ± 10 min between observations. This temporal window was selected to balance the need for sufficient data pairs with the requirement to minimize short-term atmospheric variability and to avoid large AMF differences, particularly at high SZAs.
Figure 7 presents the intercomparison of ozone SCDs from Delta with Brewer (left panels) and Pandora (right panels) data, for both VIS (top) and UV (bottom) retrievals. As in Sect. 4.1, the O3 SCDs have been calculated using Eq. (2). For the Brewer and Pandora measurements, the AMFs provided in their respective operational products were used. In all cases, the correlation is exceptionally high (R2>0.98), with slopes close to unity and intercepts of a few DU. This confirms that the Delta SCDs from both channels are fully consistent with those derived from the reference instruments across the full dynamic range of observations. The color coding that follows the SZAs shows that the agreement is maintained throughout the range of viewing geometries, although the scatter is significantly larger at large SZAs (>70°). Notably, small differences between instruments may arise not only from instrumental characteristics and retrieval methodologies, but also from their different sampling strategies. For instance, Delta records direct sun spectra with an integration time of ∼30 s, while a single Brewer measurement requires ∼3 min, leading to slightly different AMFs being assigned to the observations. In addition, the Brewer software calculates the AMF for a constant effective ozone height which can introduce minor differences in the SCD calculation. Further discrepancies among the three instruments may also arise from differences in the TOC retrieval settings. Brewer TOCs are derived from measurements at 4 discrete wavelengths in the range 310–320 nm, an approach that minimises the sensitivity to ozone temperature changes but also inherently limits spectral redundancy relative to multi-wavelength DOAS retrievals. Moreover, Delta in the UV employs the 320–340 nm region (Sect. 3.2), while Pandora applies a DOAS fit over the 305–325 nm spectral window, which may also introduce differences in the retrieved TOC, as the sensitivity to ozone absorption structures varies across these ranges. Finally, the ozone absorption cross sections used for the TOC retrieval from each instrument may also introduce discrepancies. As mentioned in Sect. 3.2, the TOC retrieval from Delta is based on Serdyuchenko et al. (2014) O3 cross sections, which are also used in the Pandora retrieval algorithm. The Brewer TOC data that are used in this study are based on Paur and Bass (1985) cross sections which result in higher TOC, on average 0.8 %, than with Serdyuchenko et al. (2014) cross sections (Fragkos et al., 2015).
As outlined in Sect. 2.2, the VIS measurements span the period from June 2023 to May 2024 (∼11 months), whereas the UV measurements became operational in January 2024 (∼6 months of coverage). As a result, the number of available collocations (N) in the VIS datasets is substantially larger than in the UV, by approximately a factor of two for the Brewer comparisons and a factor of three for the Pandora comparisons. This limitation, however, does not affect the objectives of this study, which focuses on the investigation and robustness of VIS-based retrievals rather than assessing long-term variability of TOC. Moreover, the six-month UV record covers the period of the year when ozone exhibits its strongest variability in Thessaloniki (Zerefos et al., 1998; Fragkos et al., 2016), thereby including both low and high TOC values, even though the full seasonal cycle is not captured. The linear regressions indicate negligible systematic biases, which are within the typical uncertainties of DOAS retrievals and do not show a pronounced dependence on SZA. Overall, the good agreement of Delta with both Brewer and Pandora at the SCD level provides a strong basis for the subsequent TOC intercomparisons presented in this section.
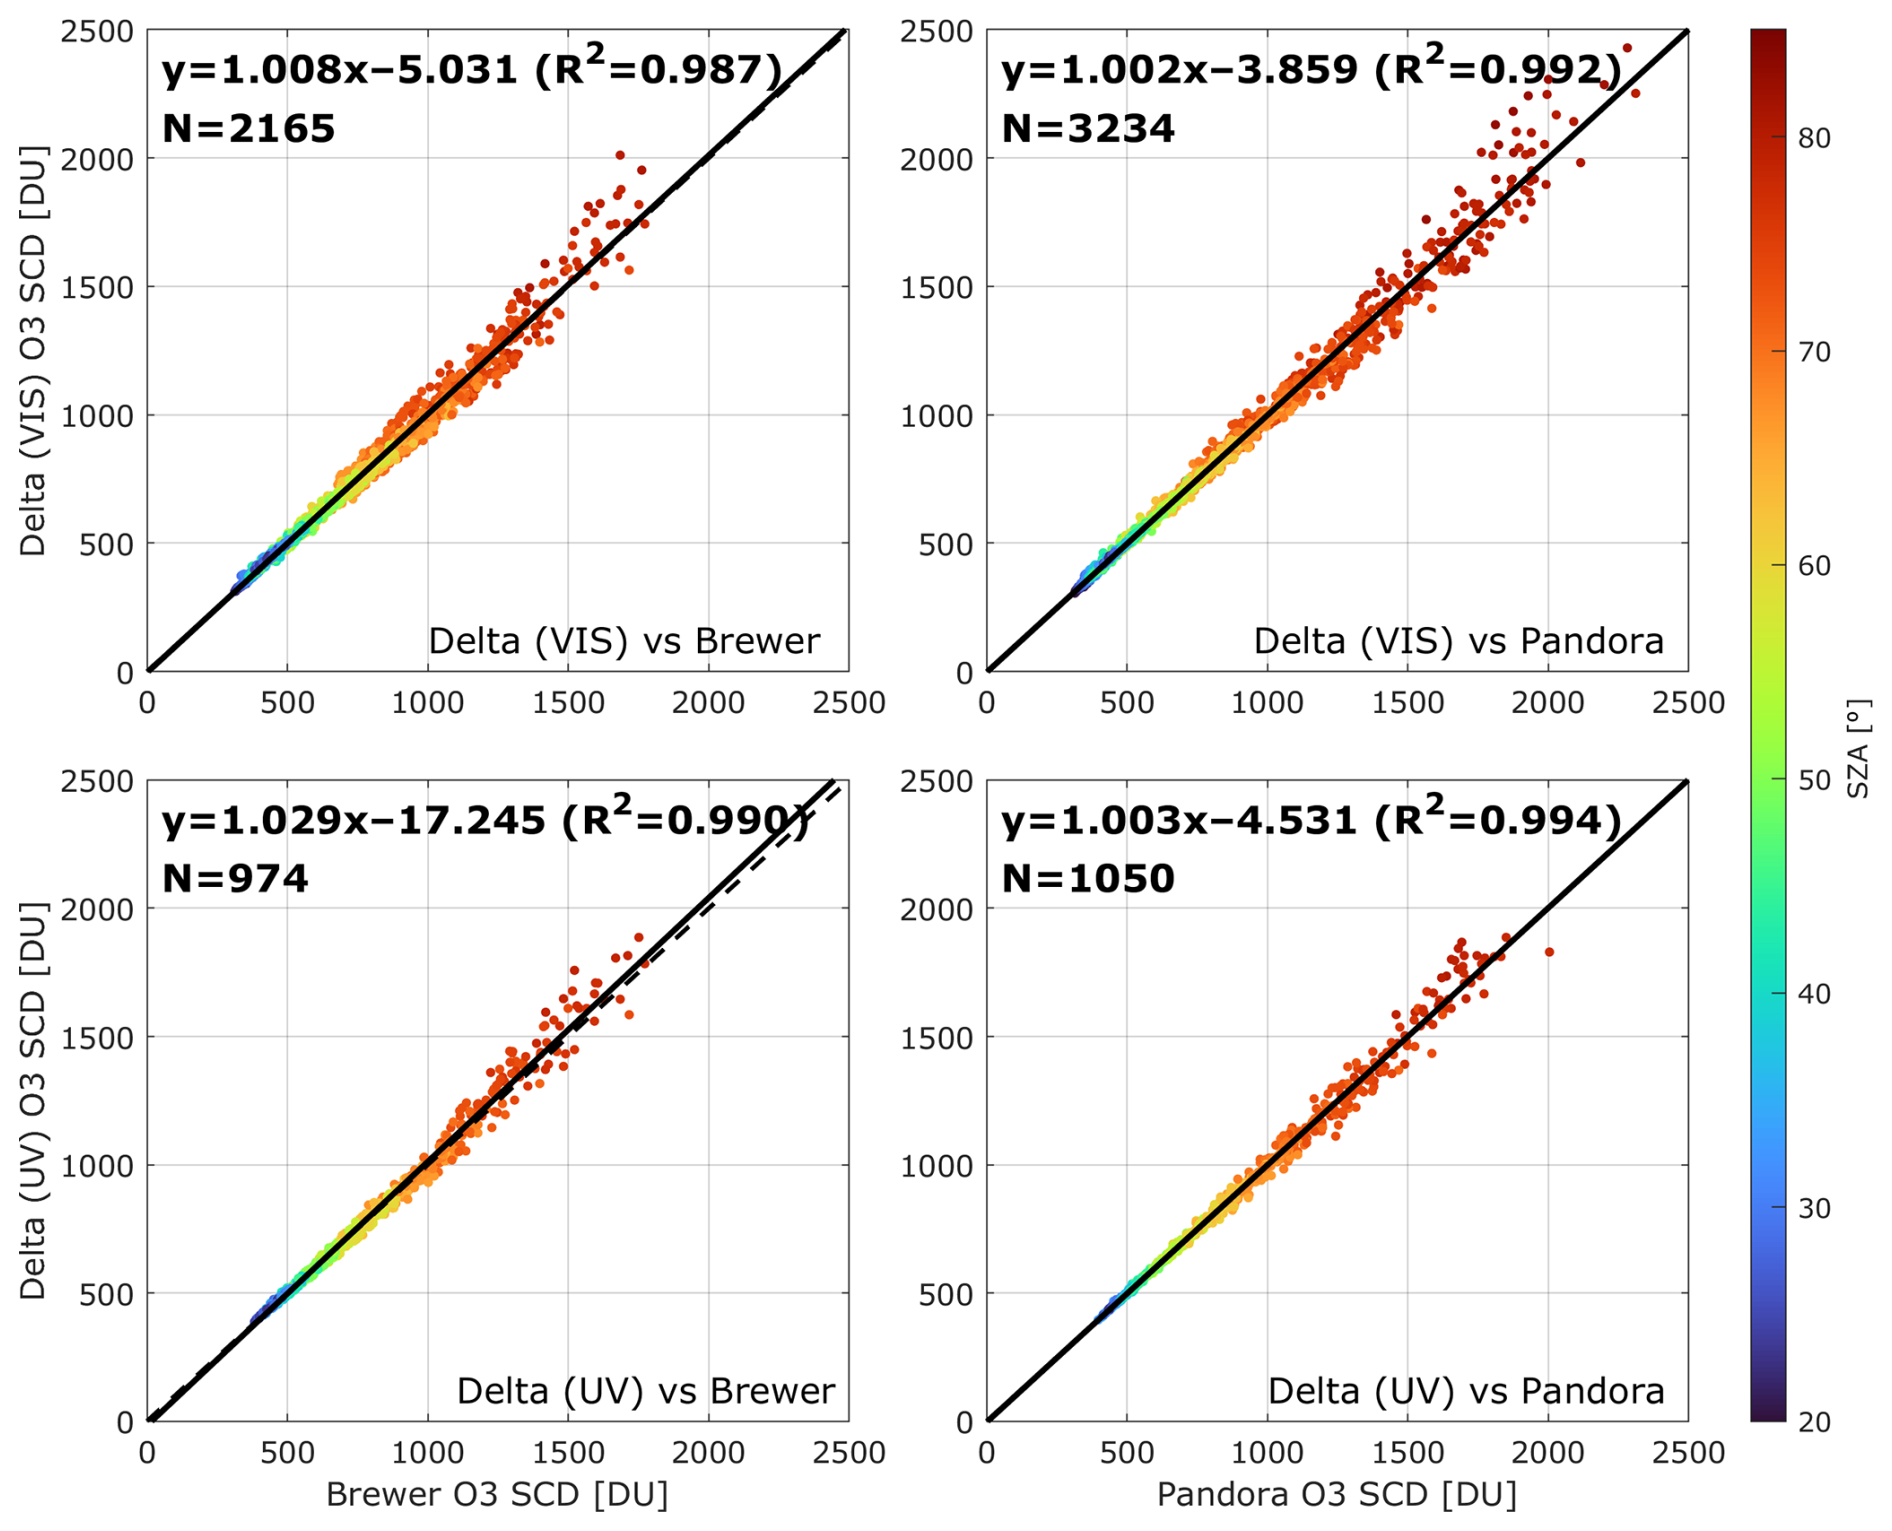
Figure 7Intercomparison of ozone SCDs retrieved by Delta against the Brewer and Pandora instruments. Top row: Delta VIS compared to the Brewer (left) and the Pandora (right). Bottom row: Delta UV compared to the Brewer (left) and the Pandora (right). Data points are color-coded by SZA. The dashed lines indicate the 1:1 reference, while the solid lines show the fitted regression. N corresponds to the number of collocated measurements.
Figure 8 presents the comparison of TOC measurements from Delta (VIS shown on the top row and UV at the bottom) with collocated Brewer observations. Both comparisons show very good agreement, with very high correlation coefficients (R2=0.986 for the VIS and R2=0.985 for the UV, respectively). The regression slopes are close to unity (0.981 for VIS and 0.999 for UV, respectively), while the intercepts remain small (up to 6 DU for VIS), indicating minor systematic deviations. The scatter plots confirm that most points are closely aligned with the 1:1 line, with only limited spread. It should be noted that in the Delta UV dataset, the lowest TOC values are missing, since the available six-month record does not cover the October–November period, when ozone concentrations typically reach their annual minimum over Thessaloniki (Garane et al., 2024). The histograms of percentage differences (Delta–Brewer) further highlight the consistency of the datasets. For the Delta (VIS)–Brewer comparison (panel a), the mean and median biases are −0.08 % and −0.18 %, respectively, with most differences falling within ± 2 % (5th–95th percentiles). For the Delta (UV)–Brewer comparison (panel b), the distribution is slightly asymmetric, while the mean and median biases are 0.24 % and 0.08 %, and with the majority of the differences confined to within ± 2 %. The interquartile ranges (magenta lines) indicate that half of the data lie within a very narrow band (<1 %) around the median in both cases. The narrower interquartile range in the UV comparison suggests a slightly better overall agreement with the Brewer relative to the VIS retrievals, although in both cases the differences remain well within the expected uncertainty of DS TOC measurements.
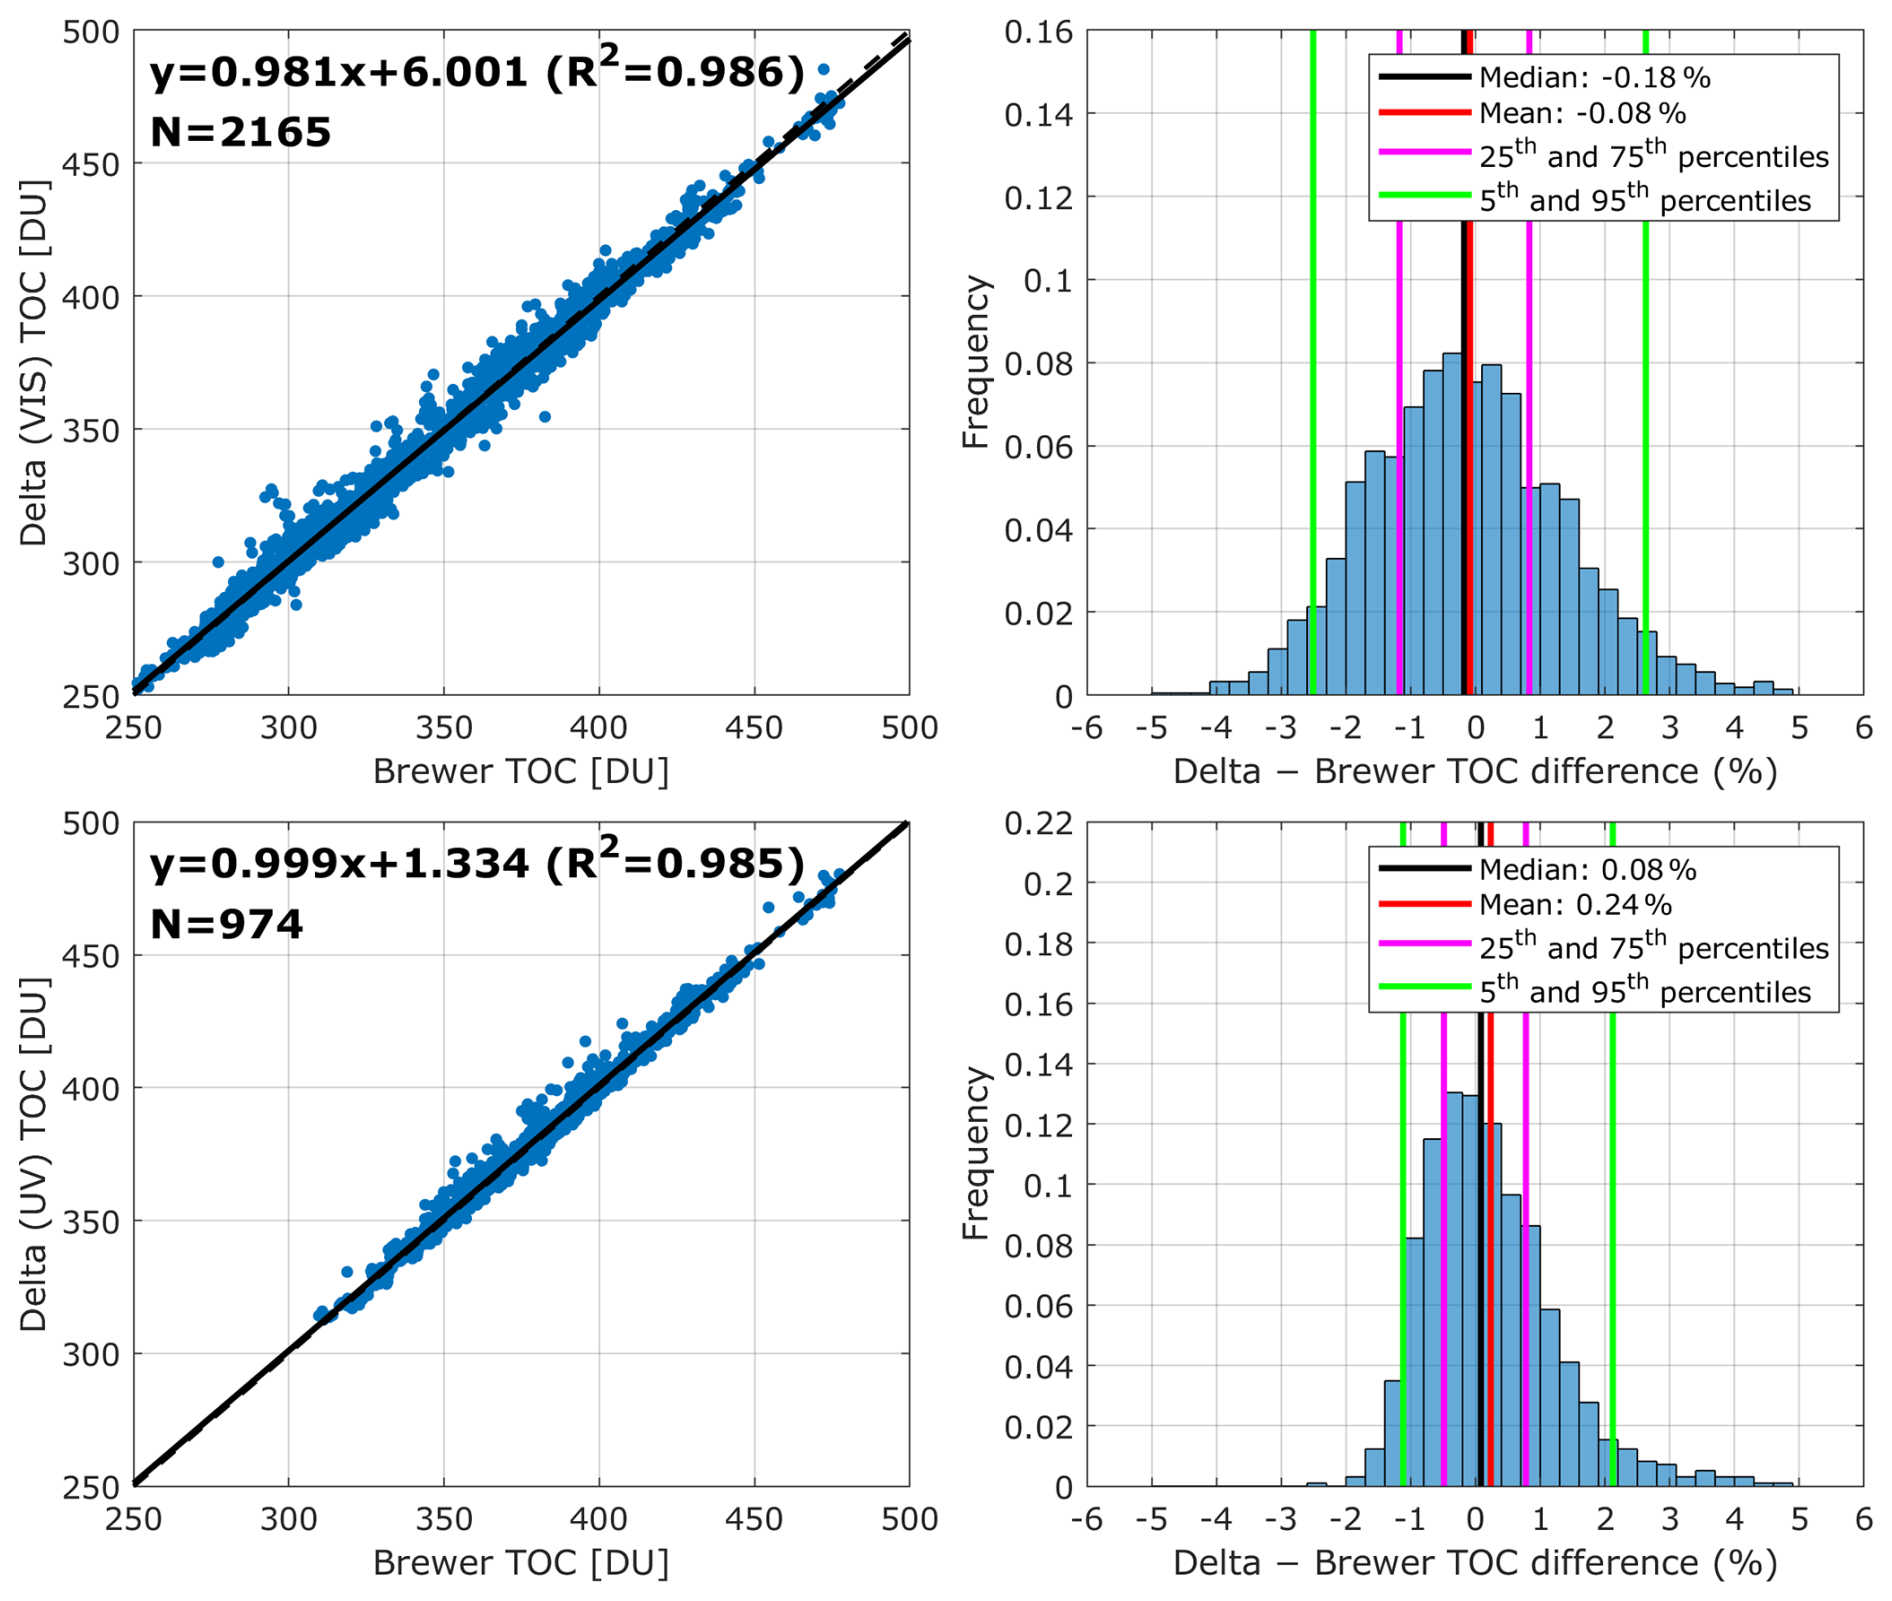
Figure 8Comparison of TOC measurements from Delta and the Brewer. The left panels show scatter plots of collocated TOC retrievals from Delta VIS (top) and Delta UV (bottom), with regression fits (solid line) and the 1:1 reference (dashed line). N corresponds to the number of collocated measurements. The right panels show the corresponding frequency distributions of TOC percentage differences (Delta–Brewer), with mean, median, and percentile ranges indicated.
Figure 9 shows the comparison of TOC measurements of Delta (VIS shown on top panel and UV on the bottom panel) with the collocated Pandora system. The number of collocations in this case is higher than in the Delta-Brewer comparison, since Pandora has a significantly higher sampling rate than the Brewer. Both products show very good consistency with Pandora, with R2 values exceeding 0.98. The VIS retrievals (panel a) exhibit a slope of 0.966 and a small negative bias (mean and median of −0.49% and −0.63 %, respectively), while the UV retrievals (panel b) yield a slope slightly above unity (1.016) and biases closer to zero (mean and median of −0.27 % and −0.32 %, respectively). These differences remain well within the typical uncertainty range of ground-based TOC retrievals. The frequency distributions confirm that most of the differences are confined to a narrow ± 2 % range, with interquartile ranges of about 1 %. The Delta–Pandora agreement is similar to the Brewer comparison, but with a slightly negative bias in the VIS. Overall, the intercomparison results indicate that both the UV and VIS retrievals of Delta are in very good agreement with the Brewer and Pandora, with only minimal systematic deviations of less than ± 0.5 %. This confirms that the VIS retrievals can achieve performance levels comparable to the established UV-based measurements, supporting the feasibility of exploiting the Chappuis bands for TOC retrievals from DS observations.
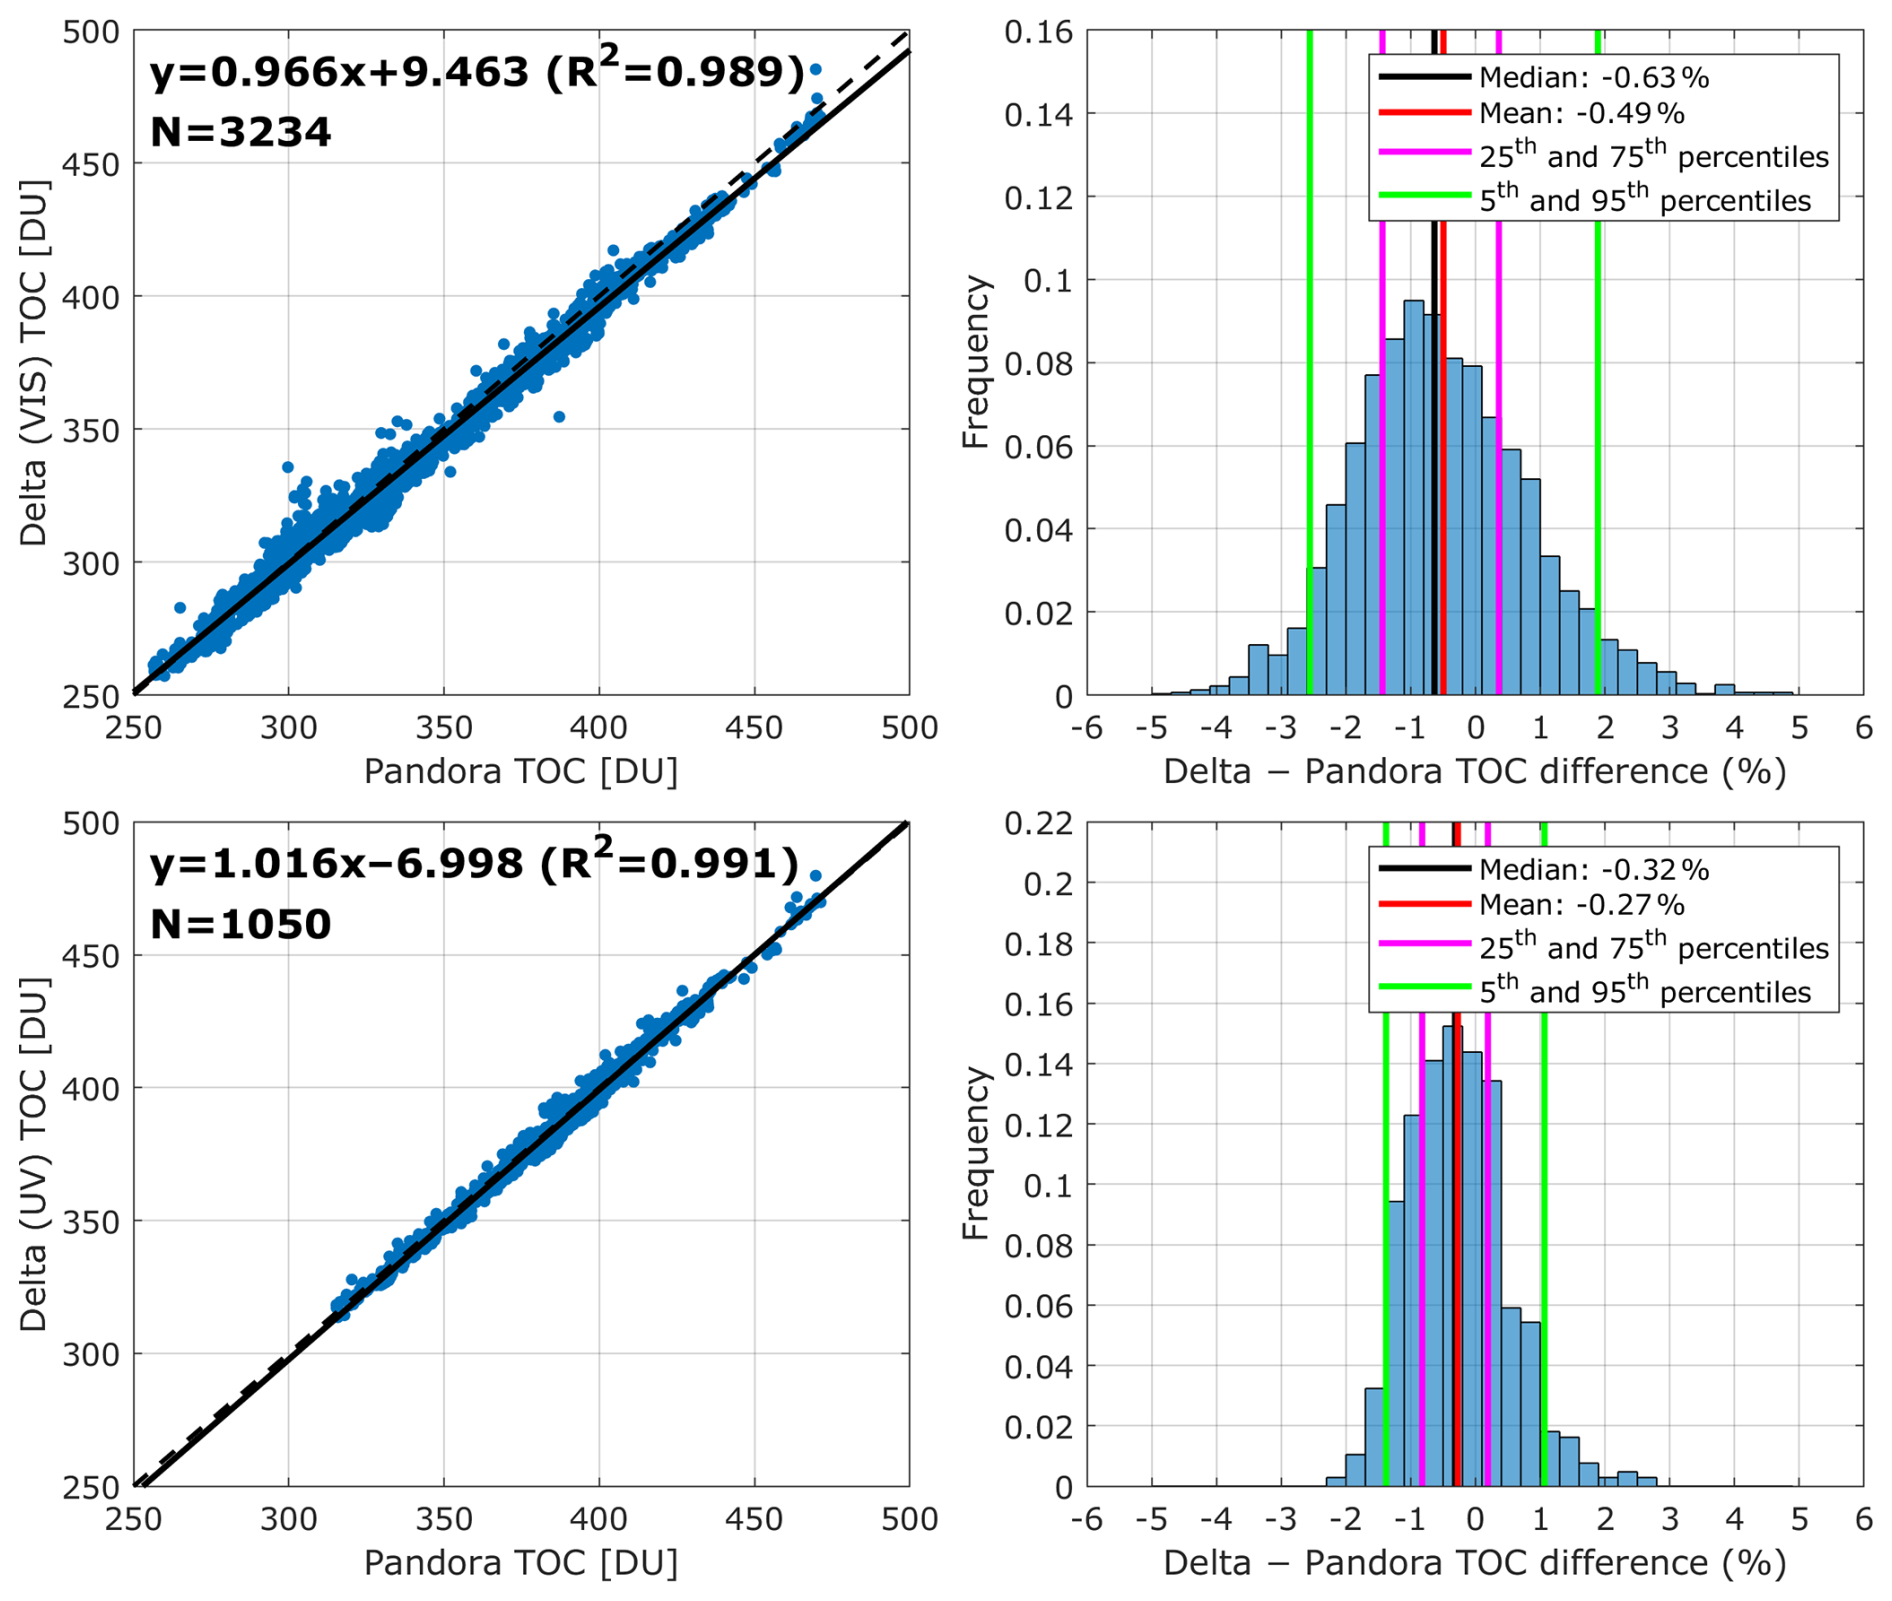
Overall, the intercomparison results indicate that the UV-based TOC retrievals from Delta agree with Brewer and Pandora measurements within approximately 1 %, which is consistent with the Global Climate Observing System (GCOS) Essential Climate Variable (ECV) target uncertainty for TOC (GCOS-245, 2022). The VIS-based retrievals exhibit a larger spread than the UV, with most differences remaining within approximately ± 2.5 %. However, part of this increased variability can be attributed to aerosol-related effects that influence the UV and VIS spectral ranges differently, as discussed in Sect. 4.4.
The time series of the TOC percentage differences between Delta and Brewer (panel a) and between Delta and Pandora (panel b) over the whole period of study is shown in Fig. 10. For the VIS, the temporal patterns of the respective percentage differences against Brewer and Pandora are very similar, showing a weak seasonal variability, with slightly positive deviations during summer and slightly negative ones in winter, likely related to the seasonal variation of SZA and to the seasonality of the Aerosol Optical Depth (AOD) in Thessaloniki, as discussed in Sect. 4.4., Nevertheless, the overall performance of the VIS retrievals remains stable throughout the year. In both cases, most differences lie within ± 3 %, with a few outliers. The largest deviations, reaching up to ∼12 %, occurred on 23 August 2023, coinciding with an extreme wildfire event that took place close to the city of Alexandroupolis, Greece, at a distance of approximately 250 km east of Thessaloniki (Michailidis et al., 2024; Koukouli et al., 2025). The smoke plume was transported over Thessaloniki and was detected at LAP.AUTH between the 22 and 25 August, resulting in record high AOD, reaching values up to 3.35 at 340 nm and at 2.39 at 500 nm, and reduction of surface solar UV irradiance by up to 90 %. High aerosol load with elevated AOD in April–May 2024 also contributed to enhanced TOC differences, though of smaller magnitude (up to 7 %). The effect of aerosols on the retrieved TOC is further discussed in Sect. 4.4. For the UV retrievals, the available six-month record is not sufficiently long to allow for a meaningful assessment of seasonal behavior. Nevertheless, the UV-based TOC differences exhibit a smaller overall spread than the VIS retrievals and fewer extreme deviations in daily averages, indicating a more robust performance under varying atmospheric conditions.
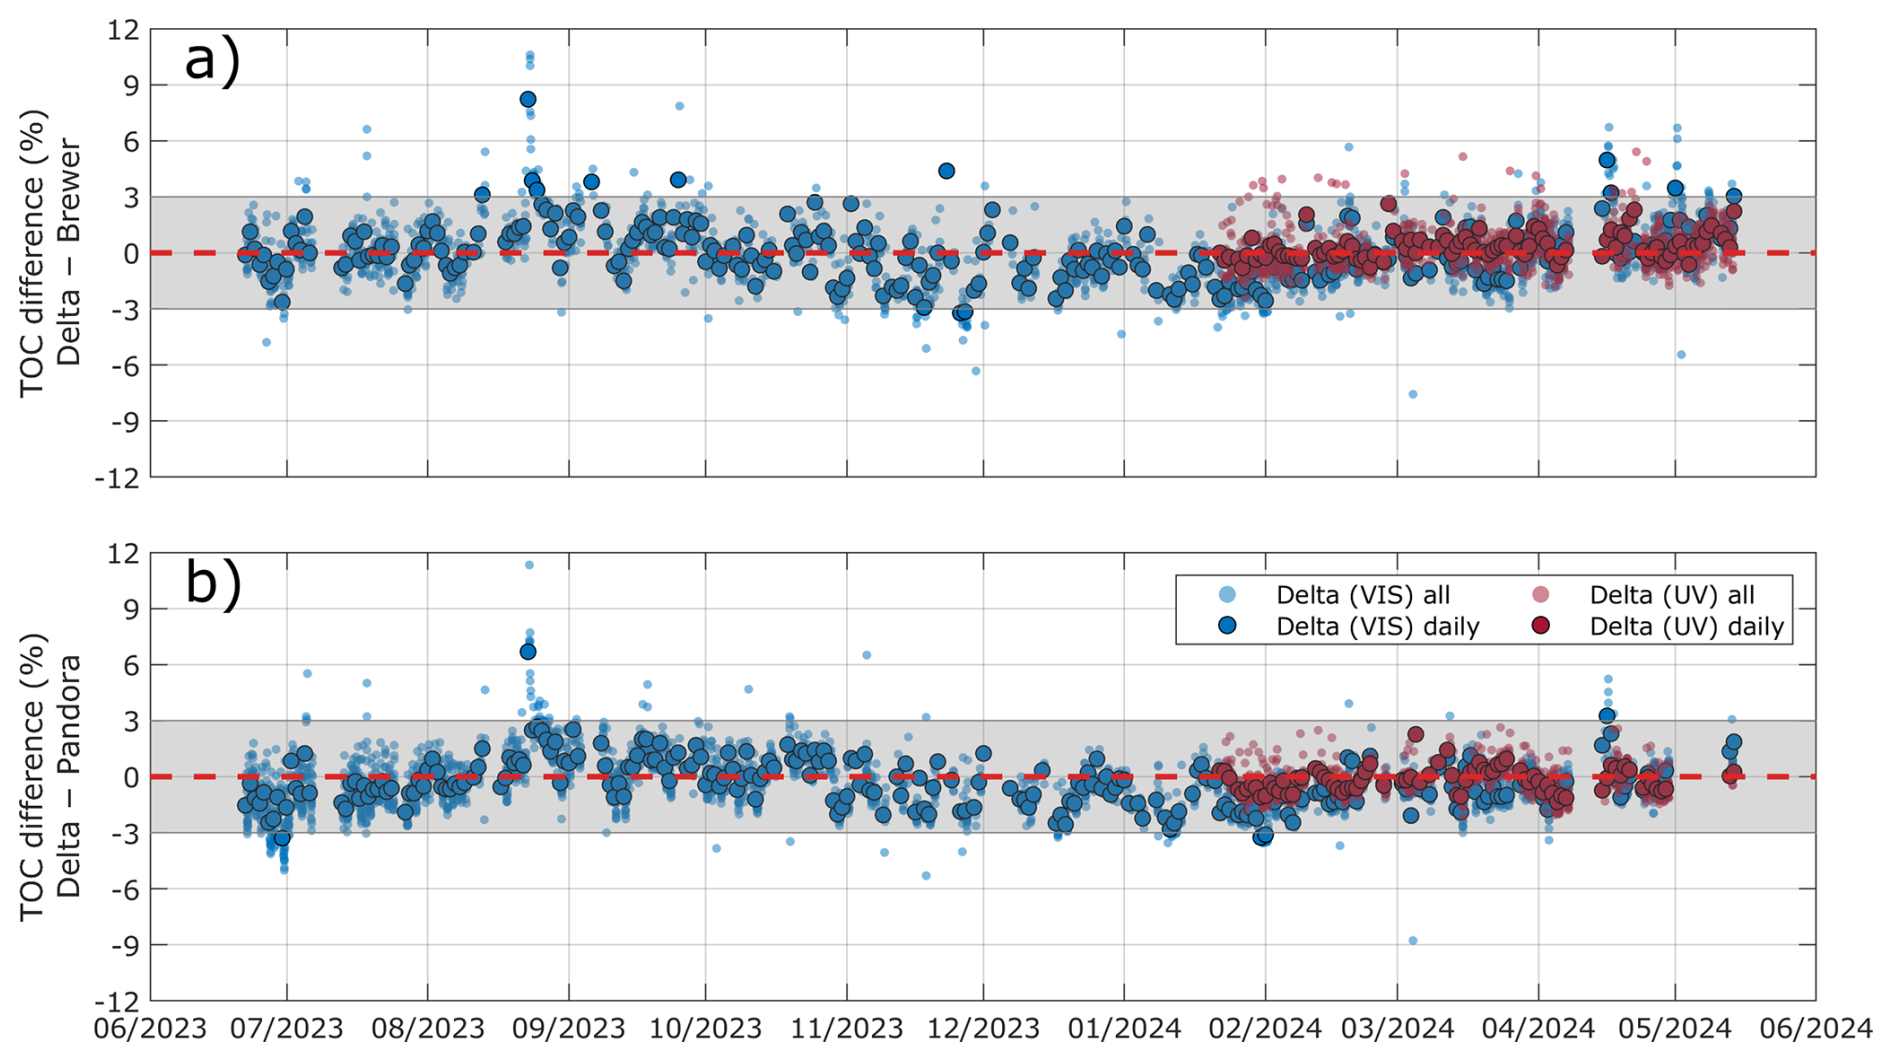
Figure 10Time series of relative TOC differences between Delta and Brewer (a) and between Delta and Pandora (b). Small markers correspond to individual collocated measurements and larger markers to daily means. Blue and red markers denote VIS- and UV-based retrievals, respectively. The shaded grey area corresponds to the ± 3 % range around zero (red dashed line).
The dependence of TOC percentage differences on SZA, separated by season, is shown in Fig. 11. Panels (a) and (b) show the differences of Delta VIS and UV retrievals with the Brewer, while panels (c) and (d) show the differences with Pandora, respectively. It should be noted that the Brewer observations are not continuous in time, since the instrument follows a fixed operational schedule and performs measurements at specific SZAs. In contrast, Delta and Pandora provide quasi-continuous direct sun measurements throughout the day, which explains the denser temporal coverage of these datasets. In the UV retrievals (panels b and d), the differences show a narrow distribution with minimal scatter, in line with the intercomparison results presented in Figs. 8 and 9. As already discussed, TOC data are available from the Delta UV channel only in winter and spring. Especially in the comparison with Pandora (panel d), the differences are distributed very smoothly for SZAs below 70°, with most points lying within ± 3% and without clear seasonal dependence. At higher SZAs (>70°), a positive drift is found, possibly reflecting the increasing influence of stray light. This effect is most pronounced in the comparison with the Brewer, which being a single-monochromator instrument suffers from stray light, leading to underestimation of TOC at large SZAs (e.g., Redondas et al., 2018). Delta is also impacted by stray light, though to a lesser degree, which explains the smaller drift in the Delta–Pandora comparison.
The VIS retrievals (panels a and c) show a much larger scatter across the entire SZA range, which is consistent with the intercomparison results. Any systematic effect, such as the drift observed in the UV, is likely masked by the larger spread. In the Delta (VIS)–Pandora comparison (panel c) a negative drift is found during summer at low SZAs, which is not observed in the corresponding Brewer comparison, for reasons not yet identified. We also tested the non-operational Pandora v1.9.7 ozone dataset, which employs a fitted effective ozone temperature and includes a stray light correction compared to the operational v1.8.49 that is currently used, but no major differences were found. Nevertheless, no clear seasonal dependence is found in either spectral range, and overall, the results indicate that the VIS retrievals provide consistent performance despite their larger scatter, while UV retrievals show less variable comparisons both with the Brewer and the Pandora, but require careful consideration of stray light effects at large SZAs.
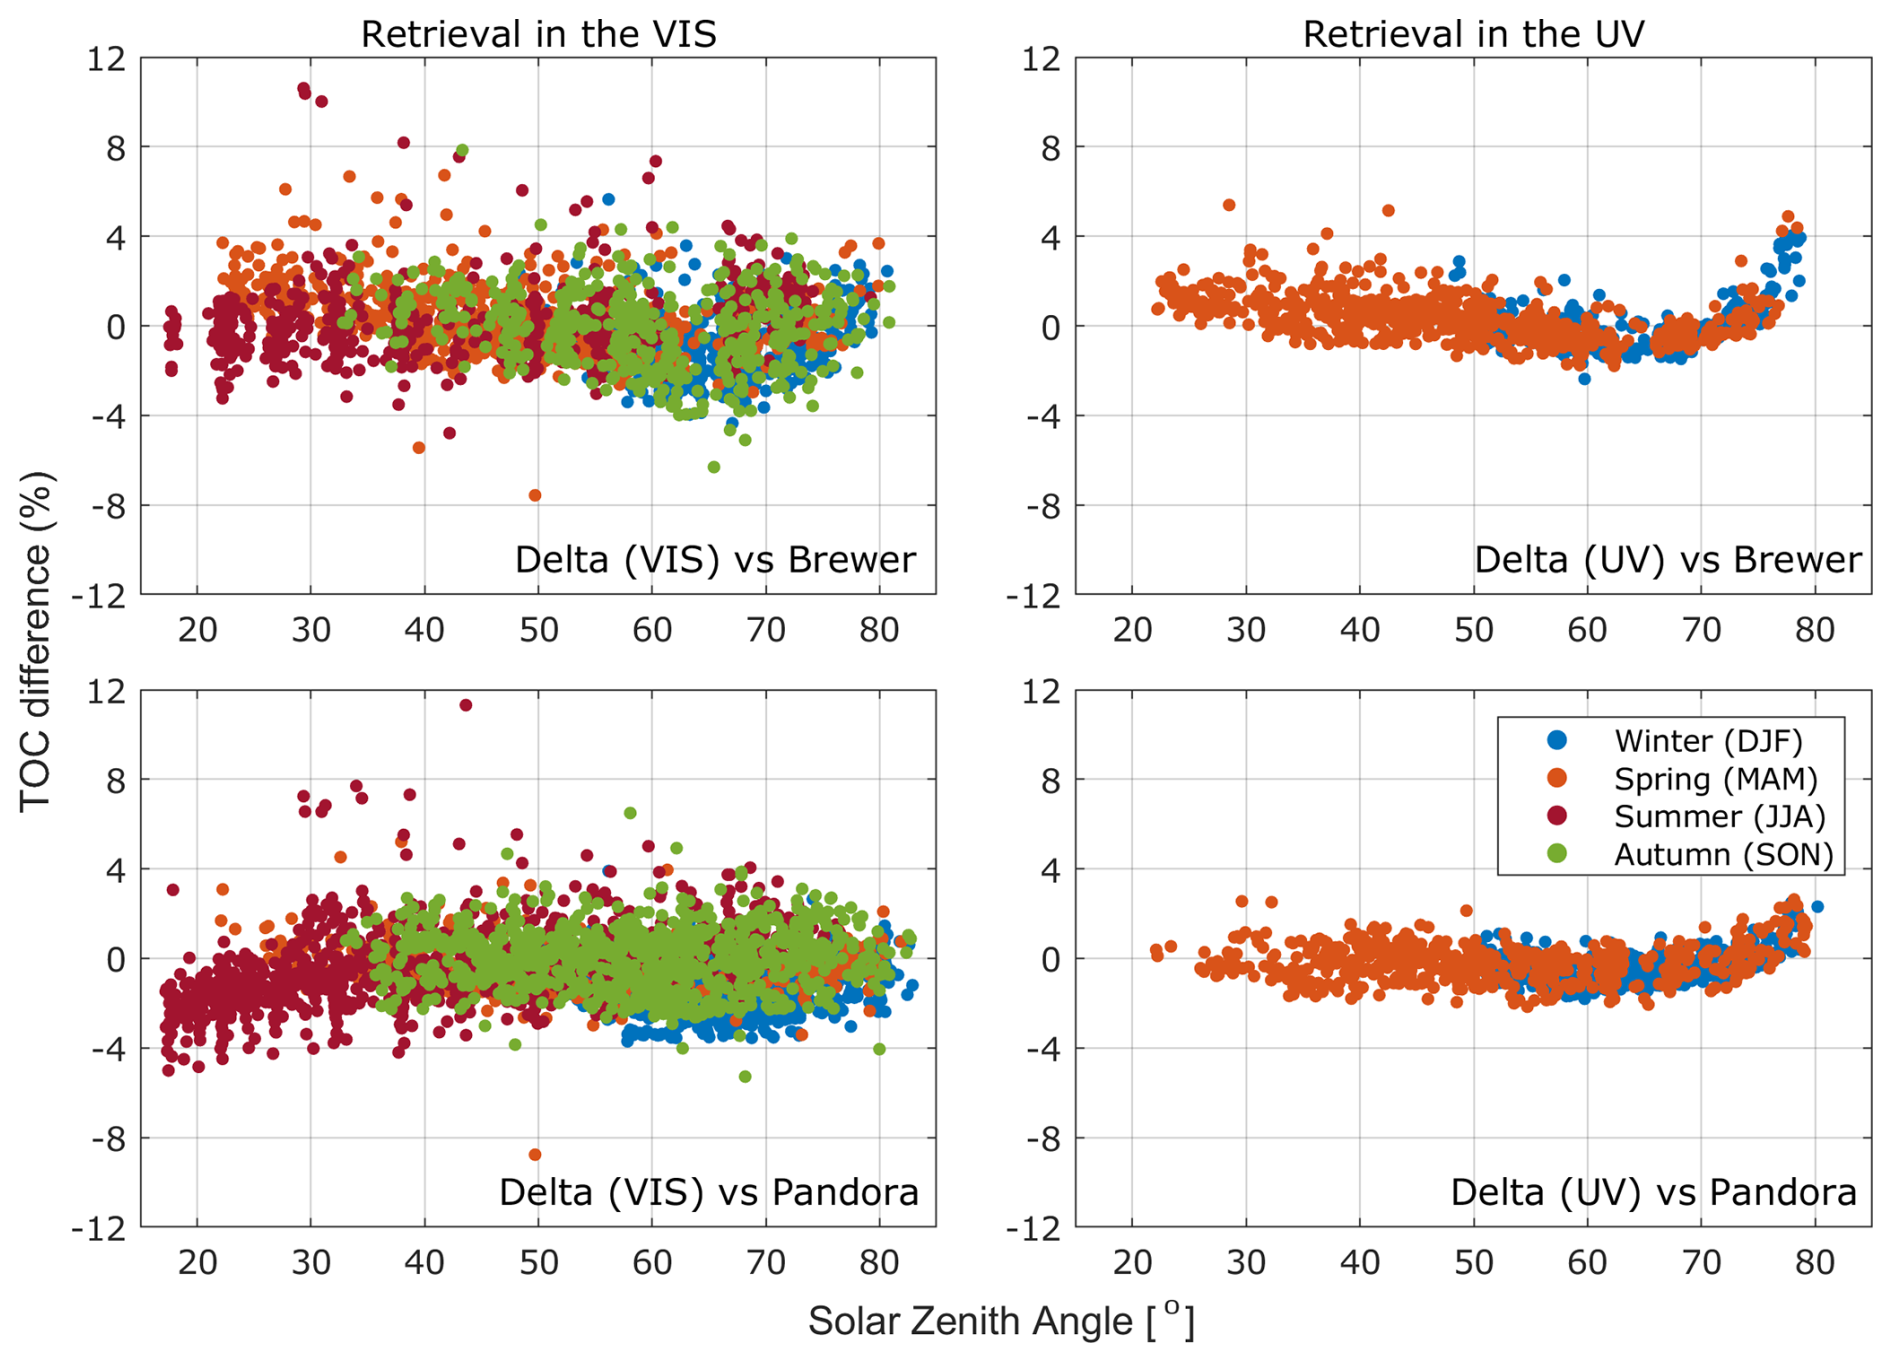
Figure 11Seasonal dependence of TOC differences between Delta-Brewer, and Delta-Pandora as a function of SZA. The top row shows the percentage differences of Delta VIS (left) and Delta UV (right) with the Brewer, while the bottom row shows the corresponding differences with the Pandora. Note that no data are available in summer and autumn for the Delta UV dataset.
A detailed intercomparison of the two reference instruments is beyond the scope of this study, therefore, a brief comparison of Brewer and Pandora TOC measurements over the study period is provided in the Supplement (Fig. S3). The same temporal collocation criterion of ± 10 min was applied, which is consistent with the approach used in the Delta intercomparisons. A high level of agreement is found between the two reference instruments (mean difference <0.4 %) and a narrow spread, with most differences confined within approximately ± 1 %. Previous studies have compared and evaluated Pandora TOC retrievals against Brewer and Dobson observations and reported similar levels of agreement, despite the different instrument designs and retrieval approaches (e.g., Herman et al., 2015, 2017; Kim et al., 2017; Tzortziou et al., 2012; Zhao et al., 2016, 2021). Such residual differences between the two reference datasets are not expected to influence the interpretation of the Delta comparisons to reference instruments and do not affect the conclusions regarding the performance of the Delta TOC retrievals.
4.3 Temporal variability
The seasonal cycle of monthly mean TOC measured by Delta, Brewer, and Pandora between June 2023 and May 2024 is presented in Fig. 12. All three instruments capture a very similar annual variability, with TOC values decreasing from early summer to autumn, reaching their minimum in October (∼290 DU), and subsequently increasing through winter to peak in spring (∼400 DU in April–May). This behavior is fully consistent with the well-documented seasonal ozone cycle over Thessaloniki (e.g., Zerefos et al., 1998, 2000; Fragkos et al., 2016; Garane et al., 2024). The agreement among the three datasets is very good throughout the entire period, with the individual monthly mean data almost overlapping, being well within ± 3 % of the Brewer TOC data (shaded area). Brewer and Pandora are in almost excellent agreement, while Delta shows slightly lower values from October until December, coinciding with the seasonal minimum, and slightly higher values during the late spring maximum. However, these differences remain small compared to the expected uncertainty range and do not affect the overall consistency of the seasonal variability.
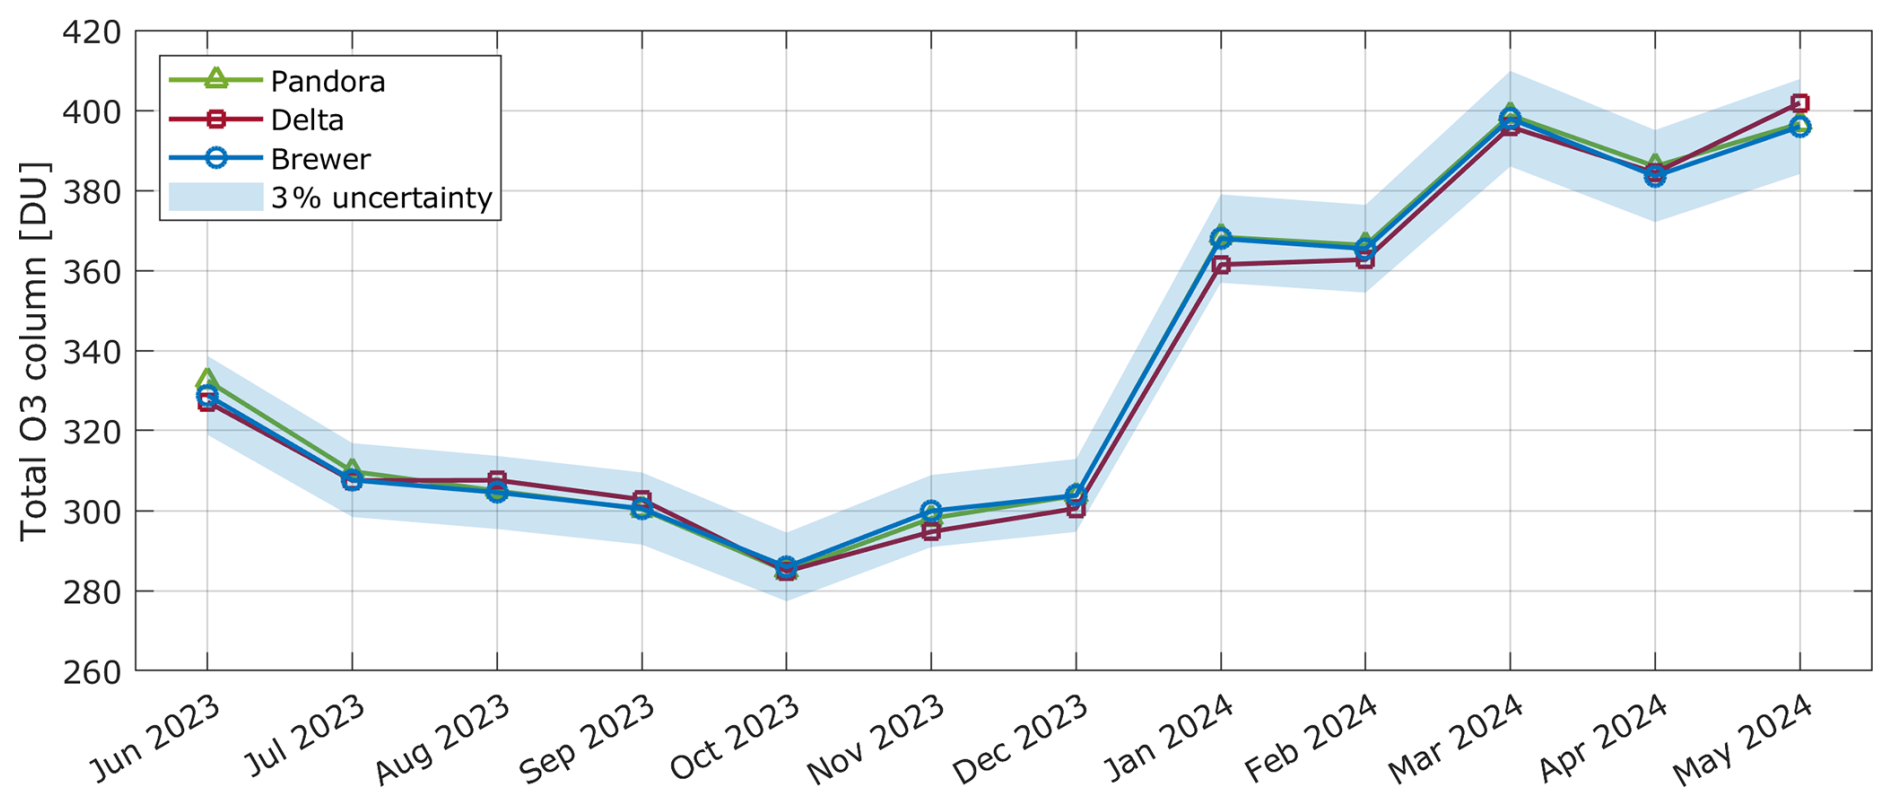
Figure 12The seasonal variability of TOC captured by Pandora (green), Delta VIS (red), and Brewer (blue). The shaded blue area represents the ± 3% uncertainty range around the Brewer observations.
As a next step, the agreement of the three datasets in terms of the TOC diurnal variability was investigated. Examples are shown in Fig. 13 for selected days under cloud-free conditions, that were specifically chosen due to interesting features in their diurnal cycle. Delta UV retrievals were not yet operational in 2023 and thus the respective data are missing from the top row of figures. For most days, all three instruments follow a very consistent evolution throughout the day, with only small deviations and no systematic biases. A notable exception is observed on 31 August 2023, where in the morning hours all instruments are in very good agreement, but in the afternoon the Delta VIS retrievals begin to overestimate TOC compared to Brewer and Pandora. This divergence coincides with a substantial increase in AOD (from less than 0.2 to approximately 0.9 at 500 nm), as recorded by a collocated CIMEL sun-photometer, pointing to enhanced aerosol load as the primary driver of the discrepancy.
The sensitivity of Delta VIS retrievals to high aerosol loads is also consistent with the findings from the Alexandroupolis wildfire case (Sect. S4). Figure S4 illustrates this case in detail, showing the diurnal evolution of TOC from Delta VIS, Brewer, and Pandora between 20 and 24 August 2023 (top panels), along with collocated AOD observations at 340 and 500 nm from the CIMEL sun-photometer (bottom panels). During the first two days of the event (20 and 21 August), the agreement among all instruments was very good throughout the day, with TOC differences generally remaining within the expected ± 3 % uncertainty range. AOD is low (<0.5), indicating relatively clean conditions and is associated with negligible aerosol influence on the TOC retrievals. From 22 August onward, however, the influence of wildfire smoke becomes evident. AOD increases sharply, peaking at values over 3 at 340 nm on 23 August. On this day, Delta VIS shows a clear positive bias compared to the reference instruments, while even Brewer and Pandora, which typically agree closely, exhibit noticeable differences. On 24 August, AOD values remained elevated (AOD > 1 at 340 nm) but lower than in the previous day. TOC differences are still evident, with Delta VIS maintaining a positive bias relative to Brewer and Pandora, though less pronounced than during the peak of the event. The broader statistical picture of the TOC diurnal variability captured is provided in Fig. S5 (Sect. S5), which shows boxplots of TOC values for Delta VIS (top) and Delta UV (bottom) compared with collocated Brewer and Pandora observations. The variability of all three instruments' distribution is higher in the top panel since the VIS dataset covers an 11-month period, whereas the UV dataset spans only 6 months, resulting in a narrower statistical spread. At very early or late hours of the day, when SZAs are high, the number of available measurements is smaller, which can explain the different behavior of the distributions in those time bins. In both spectral ranges, the three instruments show a high degree of consistency across the day, with median values closely aligned and interquartile ranges overlapping and overall, no systematic diurnal drift is apparent in either case.
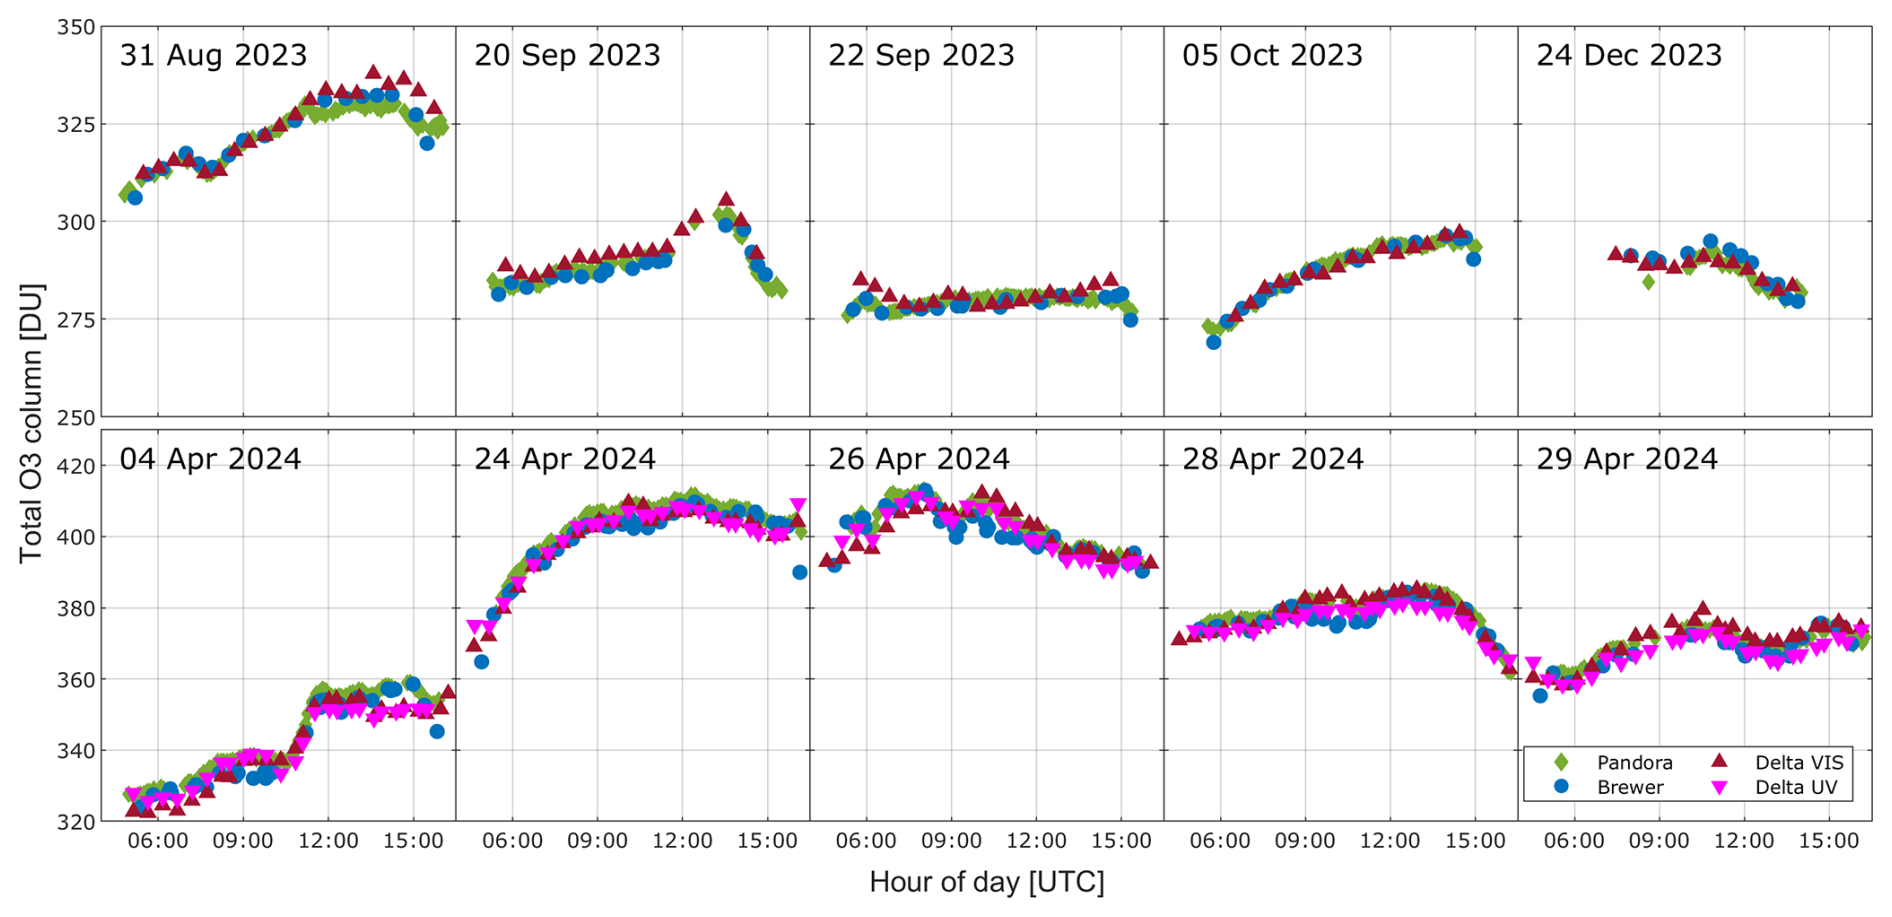
Figure 13The diurnal variability of TOC captured by Pandora (green), Brewer (blue), Delta VIS (red) and Delta UV (magenta) for selected days.
4.4 Dependency of TOC retrieval on AOD
Figure 14 shows the TOC differences of Delta VIS (panel a) and Delta UV (panel b) from Pandora and Brewer as a function of AOD at 500 nm. We used Level 1.5 data from the collocated Aerosol Robotic Network (AERONET) station, which represent near-real-time, automatically cloud-screened observations, because Level 2 data were not yet available for the entire period. A temporal collocation criterion of ± 10 min was applied, the same that was used in the intercomparison of Delta with Brewer and Pandora TOC measurements. In the VIS retrievals (panel a), a clear positive dependence of TOC differences with AOD is found with R= 0.57 and R= 0.62 for Pandora and Brewer, respectively. This suggests that under high AOD conditions, the Delta retrievals in the VIS tend to overestimate TOC compared to both reference instruments, despite the stronger scattering of radiation in the UV. This behavior may be related to wavelength-dependent aerosol effects on radiative transfer, such as changes in the effective optical path length and the scattering phase function, as forward scattering is typically stronger in the VIS than in the UV. In addition, part of the observed bias may arise from spectral fitting artefacts under enhanced aerosol loading. If not fully accounted for in the retrieval, these effects can propagate into systematic deviations in the retrieved TOC. Although the enhancement of the ozone absorption signal due to aerosol scattering, which affects the AMF, is expected to be relatively small, given that most of the aerosol load resides in the lower troposphere, where ozone is less abundant than in the stratosphere, it is unlikely to be negligible. A quantitative assessment of this effect would require dedicated RTM simulations, but such analysis is beyond the scope of this study.
The sensitivity of VIS retrievals to aerosol contamination is consistent with the diurnal patterns identified in Supplement Sect. S4, where episodes of elevated AOD, such as during the Alexandroupolis wildfire event, were associated with enhanced discrepancies. In contrast, the Delta UV retrievals (Fig. 14, panel b) exhibit almost no dependence on AOD (R= 0.03 and R= 0.09 with the Pandora and the Brewer, respectively), indicating that the effect of aerosols on TOC retrieval is negligible in this spectral region. This might be expected since for all three instruments TOC is retrieved from radiances in the UV, hence any aerosol-related path length modifications are similar and are effectively cancelled out in the comparisons. In addition, we investigated the dependency of the differences between Delta (VIS) and Delta (UV) TOC retrievals on the AOD, which resulted in a less pronounced correlation coefficient (R= 0.25). It should be noted, however, that the UV dataset does not cover summer months, when AOD in Thessaloniki typically reaches its highest values (Kazadzis et al., 2007; Siomos et al., 2018; Fountoulakis et al., 2019a), and therefore the statistical robustness of the comparison is limited.
The contrast between the TOC retrievals in the two spectral ranges highlights that aerosol effects should be considered in VIS-based TOC retrievals. In particular, it demonstrates the need for AMFs that explicitly incorporate both the spectral dependence of ozone absorption and the influence of aerosols on the effective optical path. In this study, the DS AMF applied for both UV and VIS retrievals is solely based on a geometrical approximation according to Eq. (4), a similar approach that is also applied operationally to Brewer and Pandora instruments, without accounting for aerosol effects. Such corrections would potentially reduce the observed discrepancies and help bring VIS retrievals closer to the UV retrievals. However, to confirm this, further investigation is required, which is beyond the scope of this study.
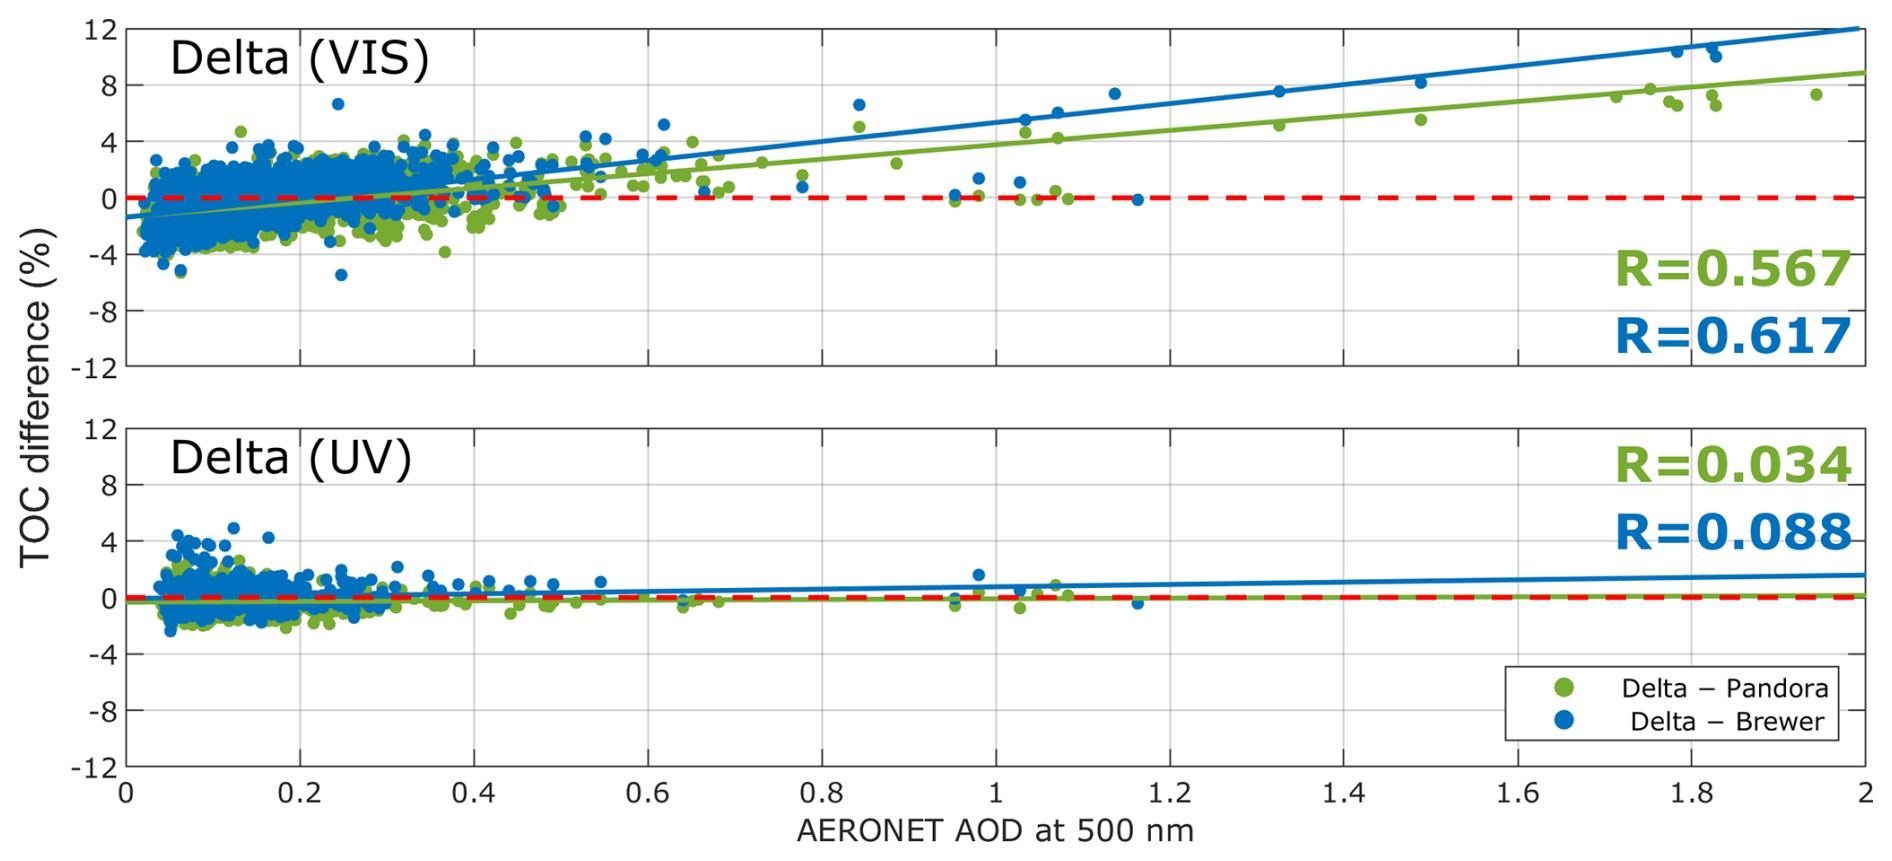
Figure 14TOC differences of Delta from Pandora (green markers) and Brewer (blue markers) retrieved in the VIS (top panel) and the UV (bottom panel) spectral ranges as a function of AOD at 500 nm.
In this study, TOC retrievals were performed in both Huggins and Chappuis bands using direct sun DOAS observations from the recently developed Delta UV-VIS system in Thessaloniki, Greece. By applying a dedicated retrieval algorithm and appropriate calibration procedures, reliable TOC measurements were obtained across both spectral regions. The analysis indicated very good internal consistency between UV- and VIS-based retrievals, with differences typically below 2 %. This confirms that ozone absorption in the Chappuis bands, although weaker than in the Huggins bands, can be successfully exploited to derive TOC of comparable quality to those obtained in the UV. Comparisons with collocated Brewer and Pandora instruments further validate the robustness of the Delta measurements. In both spectral regions, the agreement with the two reference instruments is very good, with correlation coefficients (R) exceeding 0.98. The median biases of the Delta VIS TOC retrievals from the Brewer and Pandora are −0.18 % and −0.63 %, respectively, and 0.08 % and −0.32 % for Delta UV. The VIS retrievals show slightly larger scatter and a subtle negative bias compared to UV, but their overall performance remains well within the uncertainty range of direct sun TOC observations. Seasonal and diurnal cycles, as well as the interannual variability of TOC over Thessaloniki, are consistently captured by all three instruments, showing coherent temporal patterns and good agreement between the different datasets.
The analysis indicates that the differences between TOC retrievals in the VIS from Delta and the reference instruments exhibit a dependence on aerosol load, likely due to the wavelength-dependent aerosol effects on radiative transfer, including modifications of the effective optical path length and scattering phase function, as well as potential spectral fitting artefacts. Increased aerosol loads, such as during the Alexandroupolis wildfire event in August 2023, resulted in significant positive deviations in the VIS TOC comparisons with the reference instruments, whereas in the UV, the differences remained comparatively small. This finding highlights the importance of accounting for aerosol effects in future refinements of the VIS retrieval approach, including the development of AMFs that consider the impact of aerosol scattering and absorption across different domains of the spectrum. Moreover, since TOC retrievals in the Chappuis bands require higher signal-to-noise ratios than the Huggins bands, further investigation is needed to assess their applicability across a wider range of ground-based DOAS instruments, especially those with lower sensitivity or different optical characteristics.
Future work is expected to improve the statistical robustness of these results as the time series are expanded with additional years of observations. Furthermore, the use of a synthetic, absorption-free reference spectrum in the TOC retrieval algorithm, instead of a measured FRS, could be investigated to determine whether it improves the effectiveness of the approach. In that case the measured reference spectrum would not require calibration for determining its O3 SCD. However, the current results suggest that the Delta instrument provides reliable TOC retrievals in both UV and VIS ranges of acceptable quality, demonstrating the feasibility of employing the Chappuis bands as a complementary approach to the traditional Huggins band retrievals of TOC. This capability broadens the applicability of DOAS-based ozone monitoring, particularly under conditions where UV sensitivity is limited, such as at high latitudes or high SZAs. The successful intercomparison with Brewer and Pandora also establishes a strong framework for the continued integration of Delta measurements into long-term monitoring and satellite validation activities.
Total Ozone Column data from the Delta instrument that were analyzed during the current study are available upon request from D. Karagkiozidis (dkaragki@auth.gr) or A.F. Bais (abais@auth.gr). Data from the Brewer spectrophotometer are available from WOUDC (https://woudc.org/en/, last access: 8 November 2025) as well as also available upon request from A.F. Bais or K. Garane (agarane@auth.gr). The Pandora 240 operational L2 data from Thessaloniki are publicly available from the official PGN website (https://data.hetzner.pandonia-global-network.org/Thessaloniki/Pandora240s1/L2/, last access: 8 November 2025).
The supplement related to this article is available online at https://doi.org/10.5194/amt-19-3309-2026-supplement.
DK performed the retrievals of TOC for Delta in the UV and VIS ranges, developed the intercomparison strategy, conducted the data analysis from Delta, Pandora, Brewer and CIMEL instruments, and wrote the manuscript. KG provided the TOC data from the Brewer spectrophotometer. MVR, MR, KG, DB and DN reviewed the paper. AB supervised the whole study and provided general guidance for the manuscript preparation. All authors discussed, commented on, and helped review the manuscript.
At least one of the (co-)authors is a member of the editorial board of Atmospheric Measurement Techniques. The peer-review process was guided by an independent editor, and the authors also have no other competing interests to declare.
Publisher's note: Copernicus Publications remains neutral with regard to jurisdictional claims made in the text, published maps, institutional affiliations, or any other geographical representation in this paper. The authors bear the ultimate responsibility for providing appropriate place names. Views expressed in the text are those of the authors and do not necessarily reflect the views of the publisher.
This work was carried out in the frame of the Instrument Data quality Evaluation and Assessment Service – Quality Assurance for Earth Observation (IDEAS-QA4EO) contract funded by ESA-ESRIN (no. 4000128960/19/I-NS) and builds on the work of previous projects. The authors would like to warmly thank Caroline Fayt (caroline.fayt@aeronomie.be) and Thomas Danckaert (thomas.danckaert@aeronomie.be) from the Royal Belgian Institute for Space Aeronomy (BIRA-IASB) for the free use of the QDOAS software. We also thank PGN, a bilateral project supported with funding from NASA and ESA.
This research received funding by the European Space Agency's FRM Programme under grant agreement 4000135355/21/I-DT-Ir (FRM4DOAS-2.0). The research has also been supported by the project “Panhellenic infrastructure for Atmospheric Composition and Climate change” (MIS 5021516), which is implemented under the Action “Reinforcement of the Research and Innovation Infrastructure”, funded by the Operational Programme “Competitiveness, Entrepreneurship and Innovation” (NSRF 2014-2020) and co-financed by Greece and the European Union (European Regional Development Fund).
This paper was edited by Christof Janssen and reviewed by three anonymous referees.
Aliwell, S. R., Van Roozendael, M., Johnston, P. V., Richter, A., Wagner, T., Arlander, D. W., Burrows, J. P., Fish, D. J., Jones, R. L., Tørnkvist, K. K., Lambert, J.-C., Pfeilsticker, K., and Pundt, I.: Analysis for BrO in zenith-sky spectra: An intercomparison exercise for analysis improvement, J. Geophys. Res., 107, https://doi.org/10.1029/2001JD000329, 2002.
Amiridis, V., Kazadzis, S., Gkikas, A., Voudouri, K. A., Kouklaki, D., Koukouli, M.-E., Garane, K., Georgoulias, A. K., Solomos, S., Varlas, G., Kampouri, A., Founda, D., Psiloglou, B. E., Katsafados, P., Papachristopoulou, K., Fountoulakis, I., Raptis, P.-I., Georgiou, T., Gialitaki, A., Proestakis, E., Tsekeri, A., Drakaki, E., Marinou, E., Giannakaki, E., Misios, S., Kapsomenakis, J., Eleftheratos, K., Hatzianastassiou, N., Kalabokas, P., Zanis, P., Vrekoussis, M., Papayannis, A., Kazantzidis, A., Kourtidis, K., Balis, D., Bais, A. F., and Zerefos, C.: Natural Aerosols, Gaseous Precursors and Their Impacts in Greece: A Review from the Remote Sensing Perspective, Atmosphere, 15, 753, https://doi.org/10.3390/atmos15070753, 2024.
Bais, A. F., Zerefos, C. S., Meleti, C., Ziomas, I. C., and Tourpali, K.: Spectral measurements of solar UVB radiation and its relations to total ozone, SO2, and clouds, J. Geophys. Res.-Atmos., 98, 5199–5204, https://doi.org/10.1029/92JD02904, 1993.
Bass, A. M. and Paur, R. J.: The Ultraviolet Cross-Sections of Ozone: I. The Measurements, in: Atmospheric Ozone, edited by: Zerefos, C. S. and Ghazi, A., Springer Netherlands, Dordrecht, 606–610, https://doi.org/10.1007/978-94-009-5313-0_120, 1985.
Brewer, A. W.: A replacement for the Dobson spectrophotometer?, PAGEOPH, 106–108, 919–927, https://doi.org/10.1007/BF00881042, 1973.
Cede, A., Herman, J., Richter, A., Krotkov, N., and Burrows, J.: Measurements of nitrogen dioxide total column amounts using a Brewer double spectrophotometer in direct Sun mode, J. Geophys. Res.-Atmos., 111, https://doi.org/10.1029/2005JD006585, 2006.
Chance, K. and Kurucz, R. L.: An improved high-resolution solar reference spectrum for earth's atmosphere measurements in the ultraviolet, visible, and near infrared, J. Quant. Spectrosc. Ra., 111, 1289–1295, https://doi.org/10.1016/j.jqsrt.2010.01.036, 2010.
Chubachi, S.: A Special Ozone Observation at Syowa Station, Antarctica from February 1982 to January 1983, in: Atmospheric Ozone, edited by: Zerefos, C. S. and Ghazi, A., Springer Netherlands, Dordrecht, 285–289, https://doi.org/10.1007/978-94-009-5313-0_58, 1985.
Crutzen, P. J.: The Role of NO and NO2 in the Chemistry of the Troposphere and Stratosphere, Annu. Rev. Earth Planet. Sci., 7, 443–472, https://doi.org/10.1146/annurev.ea.07.050179.002303, 1979.
Danckaert, T., Fayt, C., Van Roozendael, M., De Smedt, I., Letocart, V., Merlaud, A., and Pinardi, G.: QDOAS Software user manual, BIRA-IASB, Brussels, Belgium, https://uv-vis.aeronomie.be/software/QDOAS/QDOAS_manual.pdf (last access: 13 May 2026), 2017.
Dobson, G. M. B.: A photoelectric spectrophotometer for measuring the amount of atmospheric ozone, Proc. Phys. Soc., 43, 324–339, https://doi.org/10.1088/0959-5309/43/3/308, 1931.
Donner, S., Kuhn, J., Van Roozendael, M., Bais, A., Beirle, S., Bösch, T., Bognar, K., Bruchkouski, I., Chan, K. L., Dörner, S., Drosoglou, T., Fayt, C., Frieß, U., Hendrick, F., Hermans, C., Jin, J., Li, A., Ma, J., Peters, E., Pinardi, G., Richter, A., Schreier, S. F., Seyler, A., Strong, K., Tirpitz, J.-L., Wang, Y., Xie, P., Xu, J., Zhao, X., and Wagner, T.: Evaluating different methods for elevation calibration of MAX-DOAS (Multi AXis Differential Optical Absorption Spectroscopy) instruments during the CINDI-2 campaign, Atmos. Meas. Tech., 13, 685–712, https://doi.org/10.5194/amt-13-685-2020, 2020.
Egli, L., Gröbner, J., Hülsen, G., Schill, H., and Stübi, R.: Traceable total ozone column retrievals from direct solar spectral irradiance measurements in the ultraviolet, Atmos. Meas. Tech., 15, 1917–1930, https://doi.org/10.5194/amt-15-1917-2022, 2022.
Farman, J. C., Gardiner, B. G., and Shanklin, J. D.: Large losses of total ozone in Antarctica reveal seasonal ClOx/NOx interaction, Nature, 315, 207–210, https://doi.org/10.1038/315207a0, 1985.
Fayt, C. and Van Roozendael, M.: WINDOAS user manual, https://uv-vis.aeronomie.be/software/WinDOAS/WinDOAS-SUM-210b.pdf (last access: 13 May 2026), 2001.
Fioletov, V. E., Bodeker, G. E., Miller, A. J., McPeters, R. D., and Stolarski, R.: Global and zonal total ozone variations estimated from ground-based and satellite measurements: 1964–2000, J.-Geophys.-Res., 107, https://doi.org/10.1029/2001JD001350, 2002.
Fountoulakis, I., Natsis, A., Siomos, N., Drosoglou, T., and Bais, A. F.: Deriving Aerosol Absorption Properties from Solar Ultraviolet Radiation Spectral Measurements at Thessaloniki, Greece, Remote Sens., 11, https://doi.org/10.3390/rs11182179, 2019a.
Fountoulakis, I., Diémoz, H., Siani, A.-M., Laschewski, G., Filippa, G., Arola, A., Bais, A. F., De Backer, H., Lakkala, K., Webb, A. R., De Bock, V., Karppinen, T., Garane, K., Kapsomenakis, J., Koukouli, M.-E., and Zerefos, C. S.: Solar UV Irradiance in a Changing Climate: Trends in Europe and the Significance of Spectral Monitoring in Italy, Environments, 7, 1, https://doi.org/10.3390/environments7010001, 2019b.
Fowler, D., Pilegaard, K., Sutton, M. A., Ambus, P., Raivonen, M., Duyzer, J., Simpson, D., Fagerli, H., Fuzzi, S., Schjoerring, J. K., Granier, C., Neftel, A., Isaksen, I. S. A., Laj, P., Maione, M., Monks, P. S., Burkhardt, J., Daemmgen, U., Neirynck, J., Personne, E., Wichink-Kruit, R., Butterbach-Bahl, K., Flechard, C., Tuovinen, J. P., Coyle, M., Gerosa, G., Loubet, B., Altimir, N., Gruenhage, L., Ammann, C., Cieslik, S., Paoletti, E., Mikkelsen, T. N., Ro-Poulsen, H., Cellier, P., Cape, J. N., Horváth, L., Loreto, F., Niinemets, Ü., Palmer, P. I., Rinne, J., Misztal, P., Nemitz, E., Nilsson, D., Pryor, S., Gallagher, M. W., Vesala, T., Skiba, U., Brüggemann, N., Zechmeister-Boltenstern, S., Williams, J., O'Dowd, C., Facchini, M. C., de Leeuw, G., Flossman, A., Chaumerliac, N., and Erisman, J. W.: Atmospheric composition change: Ecosystems–Atmosphere interactions, Atmos. Environ., 43, 5193–5267, https://doi.org/10.1016/j.atmosenv.2009.07.068, 2009.
Fragkos, K., Bais, A. F., Balis, D., Meleti, C., and Koukouli, M. E.: The Effect of Three Different Absorption Cross-Sections and their Temperature Dependence on Total Ozone Measured by a Mid-Latitude Brewer Spectrophotometer, Atmos.-Ocean, 53, 19–28, https://doi.org/10.1080/07055900.2013.847816, 2015.
Fragkos, K., Bais, A. F., Fountoulakis, I., Balis, D., Tourpali, K., Meleti, C., and Zanis, P.: Extreme total column ozone events and effects on UV solar radiation at Thessaloniki, Greece, Theor. Appl. Climatol., 126, 505–517, https://doi.org/10.1007/s00704-015-1562-3, 2016.
Garane, K., Fountoulakis, I., Karanikolas, A., Bais, A. F., and Meleti, C.: Thirty years of solar ultraviolet spectral irradiance measurements in Thessaloniki: Variability and trends, Radiation Processes In The Atmosphere And Ocean, AIP Conf. Proc. 18 January 2024, 2988, 090003, https://doi.org/10.1063/5.0183293, 2024.
GCOS-245: The 2022 GCOS ECVs Requirements (GCOS 245), WMO, Geneva, https://library.wmo.int/idurl/4/58111 (last access: 13 May 2026), 2022.
Gkertsi, F., Bais, A. F., Kouremeti, N., Drosoglou, T., Fountoulakis, I., and Fragkos, K.: DOAS-based total column ozone retrieval from Phaethon system, Atmos. Environ., 180, 51–58, https://doi.org/10.1016/j.atmosenv.2018.02.036, 2018.
Gröbner, J. and Kerr, J. B.: Ground-based determination of the spectral ultraviolet extraterrestrial solar irradiance: Providing a link between space-based and ground-based solar UV measurements, J. Geophys. Res., 106, 7211–7217, https://doi.org/10.1029/2000JD900756, 2001.
Gröbner, J. and Meleti, C.: Aerosol optical depth in the UVB and visible wavelength range from Brewer spectrophotometer direct irradiance measurements: 1991–2002, J. Geophys. Res.-Atmos., 109, https://doi.org/10.1029/2003JD004409, 2004.
Gröbner, J., Schill, H., Egli, L., and Stübi, R.: Consistency of total column ozone measurements between the Brewer and Dobson spectroradiometers of the LKO Arosa and PMOD/WRC Davos, Atmos. Meas. Tech., 14, 3319–3331, https://doi.org/10.5194/amt-14-3319-2021, 2021.
Harris, N. R. P., Ancellet, G., Bishop, L., Hofmann, D. J., Kerr, J. B., McPeters, R. D., Prendez, M., Randel, W. J., Staehelin, J., Subbaraya, B. H., Volz-Thomas, A., Zawodny, J., and Zerefos, C. S.: Trends in stratospheric and free tropospheric ozone, J. Geophys. Res., 102, 1571–1590, https://doi.org/10.1029/96JD02440, 1997.
Hendrick, F., Pommereau, J.-P., Goutail, F., Evans, R. D., Ionov, D., Pazmino, A., Kyrö, E., Held, G., Eriksen, P., Dorokhov, V., Gil, M., and Van Roozendael, M.: NDACC/SAOZ UV-visible total ozone measurements: improved retrieval and comparison with correlative ground-based and satellite observations, Atmos. Chem. Phys., 11, 5975–5995, https://doi.org/10.5194/acp-11-5975-2011, 2011.
Herman, J., Cede, A., Spinei, E., Mount, G., Tzortziou, M., and Abuhassan, N.: NO2 column amounts from ground-based Pandora and MFDOAS spectrometers using the direct-sun DOAS technique: Intercomparisons and application to OMI validation, J. Geophys. Res.-Atmos., 114, https://doi.org/10.1029/2009JD011848, 2009.
Herman, J., Evans, R., Cede, A., Abuhassan, N., Petropavlovskikh, I., and McConville, G.: Comparison of ozone retrievals from the Pandora spectrometer system and Dobson spectrophotometer in Boulder, Colorado, Atmos. Meas. Tech., 8, 3407–3418, https://doi.org/10.5194/amt-8-3407-2015, 2015.
Herman, J., Evans, R., Cede, A., Abuhassan, N., Petropavlovskikh, I., McConville, G., Miyagawa, K., and Noirot, B.: Ozone comparison between Pandora #34, Dobson #061, OMI, and OMPS in Boulder, Colorado, for the period December 2013–December 2016, Atmos. Meas. Tech., 10, 3539–3545, https://doi.org/10.5194/amt-10-3539-2017, 2017.
Hönninger, G., von Friedeburg, C., and Platt, U.: Multi axis differential optical absorption spectroscopy (MAX-DOAS), Atmos. Chem. Phys., 4, 231–254, https://doi.org/10.5194/acp-4-231-2004, 2004.
Judd, L. M., Al-Saadi, J. A., Szykman, J. J., Valin, L. C., Janz, S. J., Kowalewski, M. G., Eskes, H. J., Veefkind, J. P., Cede, A., Mueller, M., Gebetsberger, M., Swap, R., Pierce, R. B., Nowlan, C. R., Abad, G. G., Nehrir, A., and Williams, D.: Evaluating Sentinel-5P TROPOMI tropospheric NO2 column densities with airborne and Pandora spectrometers near New York City and Long Island Sound, Atmos. Meas. Tech., 13, 6113–6140, https://doi.org/10.5194/amt-13-6113-2020, 2020.
Karagkiozidis, D.: Remote sensing of the vertical distribution of gaseous pollutants and aerosols in the troposphere by differential optical absorption spectroscopy and comparison with satellite observations, Aristotle University of Thessaloniki, https://doi.org/10.26262/HEAL.AUTH.IR.351247, 2023.
Kazadzis, S., Bais, A., Amiridis, V., Balis, D., Meleti, C., Kouremeti, N., Zerefos, C. S., Rapsomanikis, S., Petrakakis, M., Kelesis, A., Tzoumaka, P., and Kelektsoglou, K.: Nine years of UV aerosol optical depth measurements at Thessaloniki, Greece, Atmos. Chem. Phys., 7, 2091–2101, https://doi.org/10.5194/acp-7-2091-2007, 2007.
Kerr, J. B., McElroy, C. T., and Olafson, R. A.: Measurements of ozone with the Brewer ozone spectrophotometer, in: Quadrennial International Ozone Symposium, Boulder, CO, edited by: London, J., Vol. I, pp. 74–79, Natl. Cent. for Atmos. Res, 1981.
Kerr, J. B., Asbridge, I. A., and Evans, W. F. J.: Intercomparison of total ozone measured by the Brewer and Dobson spectrophotometers at Toronto, J. Geophys. Res., 93, 11129–11140, https://doi.org/10.1029/JD093iD09p11129, 1988.
Kim, J., Kim, J., Cho, H.-K., Herman, J., Park, S. S., Lim, H. K., Kim, J.-H., Miyagawa, K., and Lee, Y. G.: Intercomparison of total column ozone data from the Pandora spectrophotometer with Dobson, Brewer, and OMI measurements over Seoul, Korea, Atmos. Meas. Tech., 10, 3661–3676, https://doi.org/10.5194/amt-10-3661-2017, 2017.
Koukouli, M.-E., Pseftogkas, A., Karagkiozidis, D., Mermigkas, M., Panou, T., Balis, D., and Bais, A.: Extreme wildfires over Northern Greece during Summer 2023 – Part B. Adverse effects on regional air quality, Atmos. Res., 320, https://doi.org/10.1016/j.atmosres.2025.108034, 2025.
Kreher, K., Van Roozendael, M., Hendrick, F., Apituley, A., Dimitropoulou, E., Frieß, U., Richter, A., Wagner, T., Lampel, J., Abuhassan, N., Ang, L., Anguas, M., Bais, A., Benavent, N., Bösch, T., Bognar, K., Borovski, A., Bruchkouski, I., Cede, A., Chan, K. L., Donner, S., Drosoglou, T., Fayt, C., Finkenzeller, H., Garcia-Nieto, D., Gielen, C., Gómez-Martín, L., Hao, N., Henzing, B., Herman, J. R., Hermans, C., Hoque, S., Irie, H., Jin, J., Johnston, P., Khayyam Butt, J., Khokhar, F., Koenig, T. K., Kuhn, J., Kumar, V., Liu, C., Ma, J., Merlaud, A., Mishra, A. K., Müller, M., Navarro-Comas, M., Ostendorf, M., Pazmino, A., Peters, E., Pinardi, G., Pinharanda, M., Piters, A., Platt, U., Postylyakov, O., Prados-Roman, C., Puentedura, O., Querel, R., Saiz-Lopez, A., Schönhardt, A., Schreier, S. F., Seyler, A., Sinha, V., Spinei, E., Strong, K., Tack, F., Tian, X., Tiefengraber, M., Tirpitz, J.-L., van Gent, J., Volkamer, R., Vrekoussis, M., Wang, S., Wang, Z., Wenig, M., Wittrock, F., Xie, P. H., Xu, J., Yela, M., Zhang, C., and Zhao, X.: Intercomparison of NO2, O4, O3 and HCHO slant column measurements by MAX-DOAS and zenith-sky UV–visible spectrometers during CINDI-2, Atmos. Meas. Tech., 13, 2169–2208, https://doi.org/10.5194/amt-13-2169-2020, 2020.
Kumar, V., Beirle, S., Dörner, S., Mishra, A. K., Donner, S., Wang, Y., Sinha, V., and Wagner, T.: Long-term MAX-DOAS measurements of NO2, HCHO, and aerosols and evaluation of corresponding satellite data products over Mohali in the Indo-Gangetic Plain, Atmos. Chem. Phys., 20, 14183–14235, https://doi.org/10.5194/acp-20-14183-2020, 2020.
Kuttippurath, J. and Nair, P. J.: The signs of Antarctic ozone hole recovery, Sci. Rep., 7, 585, https://doi.org/10.1038/s41598-017-00722-7, 2017.
Langematz, U.: Stratospheric ozone: down and up through the anthropocene, ChemTexts, 5, 8, https://doi.org/10.1007/s40828-019-0082-7, 2019.
Lelieveld, J., Gromov, S., Pozzer, A., and Taraborrelli, D.: Global tropospheric hydroxyl distribution, budget and reactivity, Atmos. Chem. Phys., 16, 12477–12493, https://doi.org/10.5194/acp-16-12477-2016, 2016.
Mäder, J. A., Staehelin, J., Peter, T., Brunner, D., Rieder, H. E., and Stahel, W. A.: Evidence for the effectiveness of the Montreal Protocol to protect the ozone layer, Atmos. Chem. Phys., 10, 12161–12171, https://doi.org/10.5194/acp-10-12161-2010, 2010.
Meleti, C. and Cappellani, F.: Measurements of aerosol optical depth at Ispra: Analysis of the correlation with UV-B, UV-A, and total solar irradiance, J. Geophys. Res., 105, 4971–4978, https://doi.org/10.1029/1999JD900459, 2000.
Meleti, C., Bais, A. F., Kazadzis, S., Kouremeti, N., Garane, K., and Zerefos, C.: Factors affecting solar ultraviolet irradiance measured since 1990 at Thessaloniki, Greece, Int. J. Remote Sens., 30, 4167–4179, https://doi.org/10.1080/01431160902822864, 2009.
Meller, R. and Moortgat, G. K.: Temperature dependence of the absorption cross sections of formaldehyde between 223 and 323 K in the wavelength range 225–375 nm, J. Geophys. Res.-Atmos., 105, 7089–7101, https://doi.org/10.1029/1999JD901074, 2000.
Michailidis, K., Garane, K., Karagkiozidis, D., Peletidou, G., Voudouri, K.-A., Balis, D., and Bais, A.: Extreme wildfires over northern Greece during summer 2023 – Part A: Effects on aerosol optical properties and solar UV radiation, Atmos. Res., 311, 107700, https://doi.org/10.1016/j.atmosres.2024.107700, 2024.
Monks, P. S., Archibald, A. T., Colette, A., Cooper, O., Coyle, M., Derwent, R., Fowler, D., Granier, C., Law, K. S., Mills, G. E., Stevenson, D. S., Tarasova, O., Thouret, V., von Schneidemesser, E., Sommariva, R., Wild, O., and Williams, M. L.: Tropospheric ozone and its precursors from the urban to the global scale from air quality to short-lived climate forcer, Atmos. Chem. Phys., 15, 8889–8973, https://doi.org/10.5194/acp-15-8889-2015, 2015.
Mount, G. H., Sanders, R. W., Schmeltekopf, A. L., and Solomon, S.: Visible spectroscopy at McMurdo Station, Antarctica: 1. Overview and daily variations of NO2 and O3, Austral Spring, 1986, J. Geophys. Res., 92, 8320–8328, https://doi.org/10.1029/JD092iD07p08320, 1987.
Nikolis, D., Bais, A., Karagkiozidis, D., Koukouli, M.-E., and Balis, D.: Direct sun total NO2 column measurements at Thessaloniki, Greece with two DOAS systems and comparisons with S5P/TROPOMI, Atmos. Environ., 352, https://doi.org/10.1016/j.atmosenv.2025.121161, 2025.
Noxon, J. F.: Nitrogen Dioxide in the Stratosphere and Troposphere Measured by Ground-Based Absorption Spectroscopy, Science, 189, 547–549, https://doi.org/10.1126/science.189.4202.547, 1975.
Noxon, J. F.: Stratospheric NO2: 2. Global behavior, J. Geophys. Res.-Oceans, 84, 5067–5076, https://doi.org/10.1029/JC084iC08p05067, 1979.
Paur, R. J. and Bass, A. M.: The Ultraviolet Cross-Sections of Ozone: II. Results and Temperature Dependence, in: Atmospheric Ozone, edited by: Zerefos, C. S. and Ghazi, A., Springer Netherlands, Dordrecht, 611–616, https://doi.org/10.1007/978-94-009-5313-0_121, 1985.
Pazmiño, A., Godin-Beekmann, S., Hauchecorne, A., Claud, C., Khaykin, S., Goutail, F., Wolfram, E., Salvador, J., and Quel, E.: Multiple symptoms of total ozone recovery inside the Antarctic vortex during austral spring, Atmos. Chem. Phys., 18, 7557–7572, https://doi.org/10.5194/acp-18-7557-2018, 2018.
Platt, U. and Stutz, J.: Differential optical absorption spectroscopy: principles and applications, Springer, Berlin, https://doi.org/10.1007/978-3-540-75776-4, 2008.
Pommereau, J. P. and Goutail, F.: O3 and NO2 ground-based measurements by visible spectrometry during Arctic winter and spring 1988, Geophys. Res. Lett., 15, 891–894, https://doi.org/10.1029/GL015i008p00891, 1988.
Puķite, J., Kühl, S., Deutschmann, T., Platt, U., and Wagner, T.: Extending differential optical absorption spectroscopy for limb measurements in the UV, Atmos. Meas. Tech., 3, 631–653, https://doi.org/10.5194/amt-3-631-2010, 2010.
Redondas, A., Carreño, V., León-Luis, S. F., Hernández-Cruz, B., López-Solano, J., Rodriguez-Franco, J. J., Vilaplana, J. M., Gröbner, J., Rimmer, J., Bais, A. F., Savastiouk, V., Moreta, J. R., Boulkelia, L., Jepsen, N., Wilson, K. M., Shirotov, V., and Karppinen, T.: EUBREWNET RBCC-E Huelva 2015 Ozone Brewer Intercomparison, Atmos. Chem. Phys., 18, 9441–9455, https://doi.org/10.5194/acp-18-9441-2018, 2018.
Robinson, J., Kotsakis, A., Santos, F., Swap, R., Knowland, K. E., Labow, G., Connors, V., Tzortziou, M., Abuhassan, N., Tiefengraber, M., and Cede, A.: Using networked Pandora observations to capture spatiotemporal changes in total column ozone associated with stratosphere-to-troposphere transport, Atmos. Res., 238, 104872, https://doi.org/10.1016/j.atmosres.2020.104872, 2020.
Rothman, L. S., Gordon, I. E., Barber, R. J., Dothe, H., Gamache, R. R., Goldman, A., Perevalov, V. I., Tashkun, S. A., and Tennyson, J.: HITEMP, the high-temperature molecular spectroscopic database, J. Quant Spectrosc. Ra., 111, 2139–2150, https://doi.org/10.1016/j.jqsrt.2010.05.001, 2010.
Seinfeld, J. H. and Pandis, S. N.: Atmospheric chemistry and physics: from air pollution to climate change, 3rd edn., John Wiley & Sons, Inc, Hoboken, New Jersey, 1120 pp., ISBN 978-1-118-94740-1, 2016.
Serdyuchenko, A., Gorshelev, V., Weber, M., Chehade, W., and Burrows, J. P.: High spectral resolution ozone absorption cross-sections – Part 2: Temperature dependence, Atmos. Meas. Tech., 7, 625–636, https://doi.org/10.5194/amt-7-625-2014, 2014.
Siomos, N., Balis, D. S., Voudouri, K. A., Giannakaki, E., Filioglou, M., Amiridis, V., Papayannis, A., and Fragkos, K.: Are EARLINET and AERONET climatologies consistent? The case of Thessaloniki, Greece, Atmos. Chem. Phys., 18, 11885–11903, https://doi.org/10.5194/acp-18-11885-2018, 2018.
Solomon, S., Schmeltekopf, A. L., and Sanders, R. W.: On the interpretation of zenith sky absorption measurements, J. Geophys. Res.-Atmos., 92, 8311–8319, https://doi.org/10.1029/JD092iD07p08311, 1987a.
Solomon, S., Mount, G. H., Sanders, R. W., and Schmeltekopf, A. L.: Visible spectroscopy at McMurdo Station, Antarctica: 2. Observations of OClO, J. Geophys. Res., 92, 8329–8338, https://doi.org/10.1029/JD092iD07p08329, 1987b.
Solomon, S., Mount, G. H., Sanders, R. W., Jakoubek, R. O., and Schmeltekopf, A. L.: Observations of the Nighttime Abundance of OClO in the Winter Stratosphere Above Thule, Greenland, Science, 242, 550–555, https://doi.org/10.1126/science.242.4878.550, 1988.
Solomon, S., Ivy, D. J., Kinnison, D., Mills, M. J., Neely, R. R., and Schmidt, A.: Emergence of healing in the Antarctic ozone layer, Science, 353, 269–274, https://doi.org/10.1126/science.aae0061, 2016.
Spinei, E., Whitehill, A., Fried, A., Tiefengraber, M., Knepp, T. N., Herndon, S., Herman, J. R., Müller, M., Abuhassan, N., Cede, A., Richter, D., Walega, J., Crawford, J., Szykman, J., Valin, L., Williams, D. J., Long, R., Swap, R. J., Lee, Y., Nowak, N., and Poche, B.: The first evaluation of formaldehyde column observations by improved Pandora spectrometers during the KORUS-AQ field study, Atmos. Meas. Tech., 11, 4943–4961, https://doi.org/10.5194/amt-11-4943-2018, 2018.
Thalman, R. and Volkamer, R.: Temperature dependent absorption cross-sections of O2–O2 collision pairs between 340 and 630 nm and at atmospherically relevant pressure, Phys. Chem. Chem. Phys., 15, 15371–15381, https://doi.org/10.1039/C3CP50968K, 2013.
Tzortziou, M., Herman, J. R., Cede, A., and Abuhassan, N.: High precision, absolute total column ozone measurements from the Pandora spectrometer system: Comparisons with data from a Brewer double monochromator and Aura OMI, J. Geophys. Res.-Atmos., 117, https://doi.org/10.1029/2012JD017814, 2012.
Tzortziou, M., Herman, J. R., Cede, A., Loughner, C. P., Abuhassan, N., and Naik, S.: Spatial and temporal variability of ozone and nitrogen dioxide over a major urban estuarine ecosystem, J. Atmos. Chem., 72, 287–309, https://doi.org/10.1007/s10874-013-9255-8, 2015.
Van Roozendael, M., Peeters, P., Roscoe, H. K., De Backer, H., Jones, A. E., Bartlett, L., Vaughan, G., Goutail, F., Pommereau, J.-P., Kyro, E., Wahlstrom, C., Braathen, G., and Simon, P. C.: Validation of Ground-Based Visible Measurements of Total Ozone by Comparison with Dobson and Brewer Spectrophotometers, J. Atmos. Chem., 29, 55–83, https://doi.org/10.1023/A:1005815902581, 1998.
Van Roozendael, M., Hendrick, F., Friedrich, M. M., Fayt, C., Bais, A., Beirle, S., Bösch, T., Navarro Comas, M., Friess, U., Karagkiozidis, D., Kreher, K., Merlaud, A., Pinardi, G., Piters, A., Prados-Roman, C., Puentedura, O., Reischmann, L., Richter, A., Tirpitz, J.-L., Wagner, T., Yela, M., and Ziegler, S.: Fiducial Reference Measurements for Air Quality Monitoring Using Ground-Based MAX-DOAS Instruments (FRM4DOAS), Remote Sens., 16, 4523, https://doi.org/10.3390/rs16234523, 2024.
Vandaele, A. C., Hermans, C., Simon, P., Carleer, M., Colin, R., Fally, S., Mérienne, M. F., Jenouvrier, A., and Coquart, B.: Measurements of the NO2 absorption cross-section from 42 000 cm−1 to 10 000 cm−1 (238–1000 nm) at 220 K and 294 K, J. Quant. Spectrosc. Ra., 59, 171–184, https://doi.org/10.1016/S0022-4073(97)00168-4, 1998.
Verhoelst, T., Compernolle, S., Pinardi, G., Lambert, J.-C., Eskes, H. J., Eichmann, K.-U., Fjæraa, A. M., Granville, J., Niemeijer, S., Cede, A., Tiefengraber, M., Hendrick, F., Pazmiño, A., Bais, A., Bazureau, A., Boersma, K. F., Bognar, K., Dehn, A., Donner, S., Elokhov, A., Gebetsberger, M., Goutail, F., Grutter de la Mora, M., Gruzdev, A., Gratsea, M., Hansen, G. H., Irie, H., Jepsen, N., Kanaya, Y., Karagkiozidis, D., Kivi, R., Kreher, K., Levelt, P. F., Liu, C., Müller, M., Navarro Comas, M., Piters, A. J. M., Pommereau, J.-P., Portafaix, T., Prados-Roman, C., Puentedura, O., Querel, R., Remmers, J., Richter, A., Rimmer, J., Rivera Cárdenas, C., Saavedra de Miguel, L., Sinyakov, V. P., Stremme, W., Strong, K., Van Roozendael, M., Veefkind, J. P., Wagner, T., Wittrock, F., Yela González, M., and Zehner, C.: Ground-based validation of the Copernicus Sentinel-5P TROPOMI NO2 measurements with the NDACC ZSL-DOAS, MAX-DOAS and Pandonia global networks, Atmos. Meas. Tech., 14, 481–510, https://doi.org/10.5194/amt-14-481-2021, 2021.
Weber, M., Arosio, C., Coldewey-Egbers, M., Fioletov, V. E., Frith, S. M., Wild, J. D., Tourpali, K., Burrows, J. P., and Loyola, D.: Global total ozone recovery trends attributed to ozone-depleting substance (ODS) changes derived from five merged ozone datasets, Atmos. Chem. Phys., 22, 6843–6859, https://doi.org/10.5194/acp-22-6843-2022, 2022.
WMO: Scientific Assessment of Ozone Depletion: 2022, GAW Report No. 278, 509 pp, Geneva, https://ozone.unep.org/sites/default/files/2023-02/Scientific-Assessment-of-Ozone-Depletion-2022.pdf (last access: 13 May 2026), 2022.
WMO: Sixteenth Intercomparison Campaign of the Regional Brewer Calibration Centre Europe, GAW report 301, 240 p., https://library.wmo.int/idurl/4/69076 (last access: 13 May 2026), 2024.
Young, P. J., Naik, V., Fiore, A. M., Gaudel, A., Guo, J., Lin, M. Y., Neu, J. L., Parrish, D. D., Rieder, H. E., Schnell, J. L., Tilmes, S., Wild, O., Zhang, L., Ziemke, J., Brandt, J., Delcloo, A., Doherty, R. M., Geels, C., Hegglin, M. I., Hu, L., Im, U., Kumar, R., Luhar, A., Murray, L., Plummer, D., Rodriguez, J., Saiz-Lopez, A., Schultz, M. G., Woodhouse, M. T., and Zeng, G.: Tropospheric Ozone Assessment Report: Assessment of global-scale model performance for global and regional ozone distributions, variability, and trends, Elementa: Science of the Anthropocene, 6, 10, https://doi.org/10.1525/elementa.265, 2018.
Zerefos, C., Meleti, C., Balis, D., Tourpali, K., and Bais, A. F.: Quasi-biennial and longer-term changes in clear sky UV-B solar irradiance, Geophys. Res. Lett., 25, 4345–4348, https://doi.org/10.1029/1998GL900160, 1998.
Zerefos, C. S., Meleti, C., Balis, D. S., Bais, A. F., and Gillotay, D.: On changes of spectral UV-B in the 90's in Europe, Adv. Space Res., 26, 1971–1978, https://doi.org/10.1016/S0273-1177(00)00167-8, 2000.
Zerefos, C. S., Balis, D. S., Zanis, P., Meleti, C., Bais, A. F., Tourpali, K., Melas, D., Ziomas, I., Galani, E., Kourtidis, K., Papayannis, A., and Gogosheva, Z.: Changes in surface UV solar irradiance and ozone over the balkans during the eclipse of August 11, 1999, Adv. Space Res., 27, 1955–1963, https://doi.org/10.1016/S0273-1177(01)00279-4, 2001.
Zhao, X., Fioletov, V., Cede, A., Davies, J., and Strong, K.: Accuracy, precision, and temperature dependence of Pandora total ozone measurements estimated from a comparison with the Brewer triad in Toronto, Atmos. Meas. Tech., 9, 5747–5761, https://doi.org/10.5194/amt-9-5747-2016, 2016.
Zhao, X., Fioletov, V., Brohart, M., Savastiouk, V., Abboud, I., Ogyu, A., Davies, J., Sit, R., Lee, S. C., Cede, A., Tiefengraber, M., Müller, M., Griffin, D., and McLinden, C.: The world Brewer reference triad – updated performance assessment and new double triad, Atmos. Meas. Tech., 14, 2261–2283, https://doi.org/10.5194/amt-14-2261-2021, 2021.
Ziemke, J. R., Chandra, S., and Bhartia, P. K.: A 25-year data record of atmospheric ozone in the Pacific from Total Ozone Mapping Spectrometer (TOMS) cloud slicing: Implications for ozone trends in the stratosphere and troposphere, J. Geophys. Res., 110, 2004JD005687, https://doi.org/10.1029/2004JD005687, 2005.
Ziemke, J. R., Labow, G. J., Kramarova, N. A., McPeters, R. D., Bhartia, P. K., Oman, L. D., Frith, S. M., and Haffner, D. P.: A global ozone profile climatology for satellite retrieval algorithms based on Aura MLS measurements and the MERRA-2 GMI simulation, Atmos. Meas. Tech., 14, 6407–6418, https://doi.org/10.5194/amt-14-6407-2021, 2021.