the Creative Commons Attribution 4.0 License.
the Creative Commons Attribution 4.0 License.
 | 26 May 2026
Particle nitrate measurement using a thermal-dissociation, cavity-ringdown-spectrometer with gas-phase denuder (D-TD-CRDS)
Patrick Dewald
Tobias Seubert
Laura Wüst
Jan Schuladen
Frank Drewnick
Friederike Fachinger
Thorsten Hoffmann
Ambient inorganic and organic particulate nitrate has been connected to cardiovascular and respiratory illness. Accurate measurement of nitrate in both gas- and aerosol-phases is essential for understanding its partitioning and thus its impact on human health. We report modifications to an existing Denuded-Thermal-Dissociation-Cavity-Ring-Down Spectrometer (D-TD-CRDS) system that reliably measured gas-phase NOX (NO and NO2) and NOY (NOX plus other reactive nitrogen species, see below) but suffered from a positive bias in particle nitrate measurement owing to denuder breakthrough and memory effects associated with changes in relative humidity. We describe an air drying system with low particle transmission losses that reduces the relative humidity at the inlet of the denuder to < 5 % so that no measurable denuder breakthrough of NOY (even of highly volatile species such as NO) was observed after continuous use over the course of month-long campaigns. The D-TD-CRDS measurement of particulate nitrate has a limit of detection (1 min) of ∼ 0.035 µg m−3 under laboratory conditions and ∼ 0.085 µg m−3 during field deployment. The associated uncertainty is estimated to be < 15 %. Laboratory experiments in which either inorganic nitrate aerosol (ammonium nitrate) or organic nitrate aerosol (generated from the NO3-induced oxidation of limonene) were sampled simultaneously from an environmental chamber by the D-TD-CRDS and with an Aerosol Mass Spectrometer (AMS) showed excellent agreement.
- Article
(1828 KB) - Full-text XML
-
Supplement
(743 KB) - BibTeX
- EndNote


Combustion-related, anthropogenic emissions (mainly as NO) are the primary source of reactive oxides of nitrogen to the atmosphere. Through oxidation via reaction with O3 and peroxy radicals, NO is converted to NO2; together NO and NO2 are referred to as NOX. The further oxidation/reactions of NO and NO2 results in the formation of many other reactive nitrogen oxides, classed together as NOZ, which includes NO3, N2O5, HNO3, HONO, alkyl-nitrates, peroxy-nitrates, halogen containing nitrates and particulate nitrate (P-Nit). Upon photolysis, particulate nitrate can release HONO, thus acting as an exporter of both NOX and radicals from polluted to unperturbed regions (Andersen et al., 2023). The major gas-phase components of NOZ in the troposphere are often organic nitrates and HNO3 and recent measurements have confirmed that a substantial amount of reactive nitrogen can be transferred from the gas to the particle phase (see below), which, by reducing NOX levels has a negative impact on e.g. the rate of photochemical O3 formation.
In regions impacted by agriculture, inorganic nitrates are predominantly in the form of ammonium nitrate, whereas in coastal regions with anthropogenic influence, sodium, potassium magnesium nitrates (formed from reaction of HNO3 with sea-salt) are often present. Calcium nitrate can also be formed e.g. in the interaction of mineral dust with HNO3 and mineral dust.
In the continental lower atmosphere, field studies have revealed the formation of highly functionalised organic nitrates which transfer to the aerosol phase (Rollins et al., 2012; Fry et al., 2013; Palm et al., 2017), play an important role in the formation and growth of secondary organic aerosol (SOA) (Kiendler-Scharr et al., 2016; Huang et al., 2019) and contribute of up to 25 % to the total aerosol mass (Xu et al., 2015; Huang et al., 2019; Lee et al., 2016). It is firmly established that fine particulate matter has a significant, negative impact on human life expectancy (Pozzer et al., 2023; Lelieveld et al., 2015) and particulate nitrate is understood to modify the health aspects of particle inhalation (Hang et al., 2022).
A number of online techniques are available to measure (in-situ) the nitrate content of ambient aerosol, whereby the particulate nitrate is transferred either to an aqueous-phase prior to chromatographic analysis or to the gas-phase by thermal vaporisation prior to mass-spectrometric or optical detection of nitrogen species. Transfer of the particle nitrate to an aqueous sample as in the Monitor for AeRosols and Gases in Ambient air (MARGA), Ambient Ion Monitor (AIM), and Particle into Liquid Sampler (PILS) instruments (Khlystov et al., 1995; Weber et al., 2001; Twigg et al., 2023) is achieved using mist chambers or similar in combination with inertial separation, which efficiently collect the soluble content of particles subsequent to removal of gas-phase nitrate (e.g. HNO3 or N2O5) using e.g. aqueous denuders (Phillips et al., 2013). Analysis of the nitrate content is then performed e.g. via ion-chromatography. These wet-chemical methods are sensitive primarily to inorganic nitrates although organic nitrates that hydrolyse rapidly to HNO3 may also be detected (but not quantitatively) and their behaviour in such systems is not well known. Calibration of the MARGA/PILS/AIM instruments for gas-phase HNO3/N2O5 and particulate nitrate is with standard nitrate solutions and the instrumental time resolution is generally close to 1 h per sample.
Aerosol Mass Spectrometers (AMS, see e.g. Jimenez et al., 2003; Canagaratna et al., 2007) are widely used to measure the organic, nitrate, sulphate and ammonium content of sub-micron ambient aerosol. In the AMS, an aerodynamic lens directs a collimated beam of particles towards a heated target on which they flash vaporize directly prior to electron-ionisation and mass spectrometric detection (generally with time-of-flight mass separation) of product ions. The aerodynamic lens system removes sensitivity to gas-phase nitrates and, in addition, the gas-phase background signal is determined (and subtracted) by blocking the particle beam so that denuding the gas-phase is not required. The nitrate content of the particle ensemble is derived from the signals at ratios of 30 (NO+) and 46 (NO). The AMS can distinguish between organic nitrates and inorganic nitrates (Farmer et al., 2010; Day et al., 2022). Calibration of the AMS is via provision of a known mass concentration of particulate nitrate (usually ammonium nitrate) to the inlet, which requires generation of a monodisperse aerosol and measurement of the particle number concentration, usually provided by scanning mobility particle sizer (SMPS) instrumentation. The time resolution of the AMS is usually a few seconds, although it can be used in “fast mode” with sub-second time-resolution for some applications.
Conversion of particulate nitrate to gas-phase NO2 that can be detected by laser-induced fluorescence (LIF) is the basis of the thermal-dissociation techniques developed by the Cohen group (Rollins et al., 2010; Lee et al., 2015; Womack et al., 2017). In this case, a denuder is necessary to remove gas-phase nitrogen oxides prior to particle vaporisation in inlets heated to up to 700 °C. Variations of this method include use of chemiluminescence (CLD) to detect NOX (but with particle collection prior to flash volatilisation; Hogrefe et al., 2004; Stolzenburg and Hering, 2000) or cavity-ring-down spectroscopy to detect NO2 rather than LIF (Friedrich et al., 2020; Brownwood et al., 2021; Garner et al., 2020; Keehan et al., 2020).
Calibration of TD-LIF and CLD instruments is achieved via use of gas-phase standards of NO2 whereas the TD-CRDS instruments are essentially calibration free as the NO2 absorption cross section at the laser wavelength is associated with an uncertainty of < 5 %. Both TD-LIF and TD-CRDS instruments operate at the plateau of thermograms (see Sect. 2.1) that define the temperature dependent conversion of all gas-phase and particulate nitrate to NO2 and both have time resolutions of the order of a few seconds. Advantages and disadvantages of the three methods outlined above are provided in Sect. 3.3.
In the following, we describe modifications made to an existing D-TD-CRDS set-up to enable accurate measurement of not only gas-phase NOX and NOY but also particulate nitrate (P-Nit).
The instrument is described in detail in Friedrich et al. (2020) and only centrally important features and modifications are described here. The D-TD-CRDS instrument consists of two identically constructed cavities in which NO2 is detected at 405 nm. As O3 (∼ 20 ppm) is added to the gas-sample in front of the cavity, NO is converted stoichiometrically to NO2 and the instrument thus measures the sum of NO + NO2 (i.e. NOX). This has been shown to have substantial advantages over instruments that measure only NO2 as it avoids bias caused by the oxidation of NO by peroxy radicals and O3 in the heated inlets (Friedrich et al., 2020; Wüst et al., 2025).
One cavity samples air continuously from an inlet at ambient temperature, the second cavity samples air via either of two heated inlets (one equipped with a denuder, see below) and thereby sequentially monitors either NOY or particulate nitrate, usually with a 50 % duty-cycle for each. Mixing ratios of NO2 are derived by measuring the change in ring-down constant in the absence (k0) and presence (k) of the absorbing gas at 405 nm:
where is the ratio of the physical distance (d) between the cavity mirrors and the effective path length (l) over which light is absorbed, σ is the absorption-cross section of NO2 at the laser wavelength(s) and c is the speed of light. Values of k0 are measured at regular intervals by overflowing the inlet with dry zero-air and require correction for any changes in pressure and relative humidity when zeroing compared to sampling ambient air. Typically, in all channels of the TD-CRDS, ring-downs are acquired at a rate of 2400 Hz and averaged over a period of 5 s to generate a single data point at approximately this time interval. The limit of detection (LOD) and overall uncertainty associated with particulate nitrate detection using the D-TD-CRDS set up are presented in Sect. 2.6.
The major modifications of the instrument compared to that described in Friedrich et al. (2020) are described below. A schematic of the new instrument including the gas-flows is found in Fig. 1.
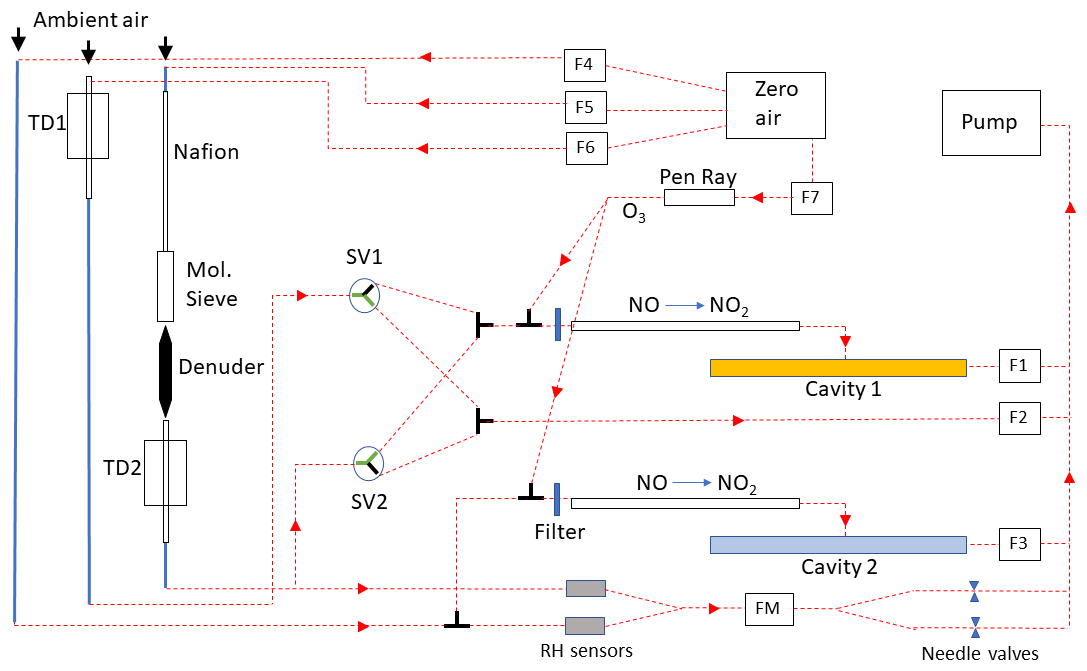
Figure 1Schematic representation of the modified D-TD-CRDS for measurement of NOX (blue cavity 2) and NOy/P-Nit (yellow cavity 1). Flow settings were as follows: F1, F2 and F3 (cavity flows) were set to 2100 sccm. F4, F5 and F6 (Zero overflows) were set to 2400 sccm. F7 (air/O3 flow) was set to 70 sccm. The flow through the relative humidity (RH) sensors (iST, type-HYT939P, 0 %–100 % RH, accuracy 1.8 %) was regulated by needle valves to ∼ 20 sccm for each sensor (measured by the flow meter, FM). The mirror-purge flows (not shown) were ∼ 140 sccm per mirror. The red, dotted lines represent 1/4 in. (external diameter) PFA sections of tubing, the thicker blue lines are 3/8 in. PFA. TD1 and TD2 are the thermal dissociation inlets consisting of 70 cm long quartz tubes with a ∼ 40 cm long section heated by resistive wire to 700 °C. The filters are PTFE membrane filters (Pall Corporation, R2PJ047).
2.1 TD-inlet
In the previous version of the TD-inlet (Friedrich et al., 2020), which used a commercial oven that heated a ∼ 8 cm section of a quartz tube, the complete thermal dissociation of HNO3 was achieved only at temperatures above 800 °C. Note that HNO3 is the NOY trace-gas that requires the highest temperatures for thermal dissociation to NO2, with all others, especially organic nitrates, dissociating at temperatures of 200–400 °C. The fractional thermal dissociation in the TD-inlet depends on both the residence time and temperature of the heated section. As some (unwanted) conversion of ammonia to NOX can occur at temperatures > 700 °C if ozone is present (Friedrich et al., 2020) a reduction in temperature is beneficial in avoiding a positive bias to NOY measurements if high mixing ratios of NH3 or ammonium nitrate particles are present. We note that the reduction in temperature will also make the instrument even less sensitive to sodium nitrate than the ∼ 15 % conversion efficiency reported by Friedrich et al. (2020).
In order to reduce the temperature required for complete dissociation of HNO3 we constructed new inlets in which the heated section was longer. This was achieved by tightly wrapping 0.9 mm NiCr resistance wire around a ∼ 40 cm long section (close to one end) of a 70 cm long quartz tube (id = 10 mm). The temperature at the outer surface of the quartz tube was measured and regulated using a type-K thermocouple (RS PRO 407-1393). At 700 °C set-temperature, the temperature inside the quartz tubing (at approximately the centre of the heated section) under normal flow conditions was measured using a long temperature probe (RS PRO 255-588) as 733 °C. The tip of the temperature probe had contact with the inner surface of the quartz tube, so this does not necessarily represent the temperature of the gas only. 10 cm thick insulating material was wrapped around the quartz tube, heating wire and thermocouple before being encased in a welded aluminium housing.
The temperature required to fully dissociate HNO3 when a 2 L (STD) min−1 (SLM) flow of air passed through the inlet was determined by measuring thermal dissociation curves (thermograms) for HNO3 and ammonium nitrate particles (NH4NO3). For the former we used a constant flow of HNO3 in air (≈ 8 ppbv) from a permeation source (Friedrich et al., 2020). A flow of ammonium nitrate particles was generated from a 0.01 M solution of ammonium nitrate using an atomizer (TSI, model 3076) and a diffusion aerosol drier (TSI, model 3062) filled with a drying agent. In both cases, the total flow through the TD-inlets was 2.1 SLM at an absolute pressure close to 1000 mbar, resulting in mean residence times in the inlets between ∼ 0.9 s at room temperature and ∼ 0.3 s at 850 °C. The results are displayed in Fig. 2, in which a plateau in the thermogram between ∼ 600 and 850 °C was observed for both HNO3 and ammonium nitrate particles. Similar thermograms for HNO3 and NH4NO3 have been reported by Garner et al. (2020) and Keehan et al. (2020). The solid line is the expected thermogram based on the literature rate constant (k) for the thermal dissociation of HNO3 in the gas-phase (Glänzer and Troe, 1974), accounting for the change in residence time (t) with temperature (Eq. 1):
Note that the initial HNO3 concentration ([HNO3]0) is consistent (±10 %) with the known permeation rate and dilution factor, indicating that the recombination of OH with NO2 to reform HNO3 does not compete with OH losses to the walls.
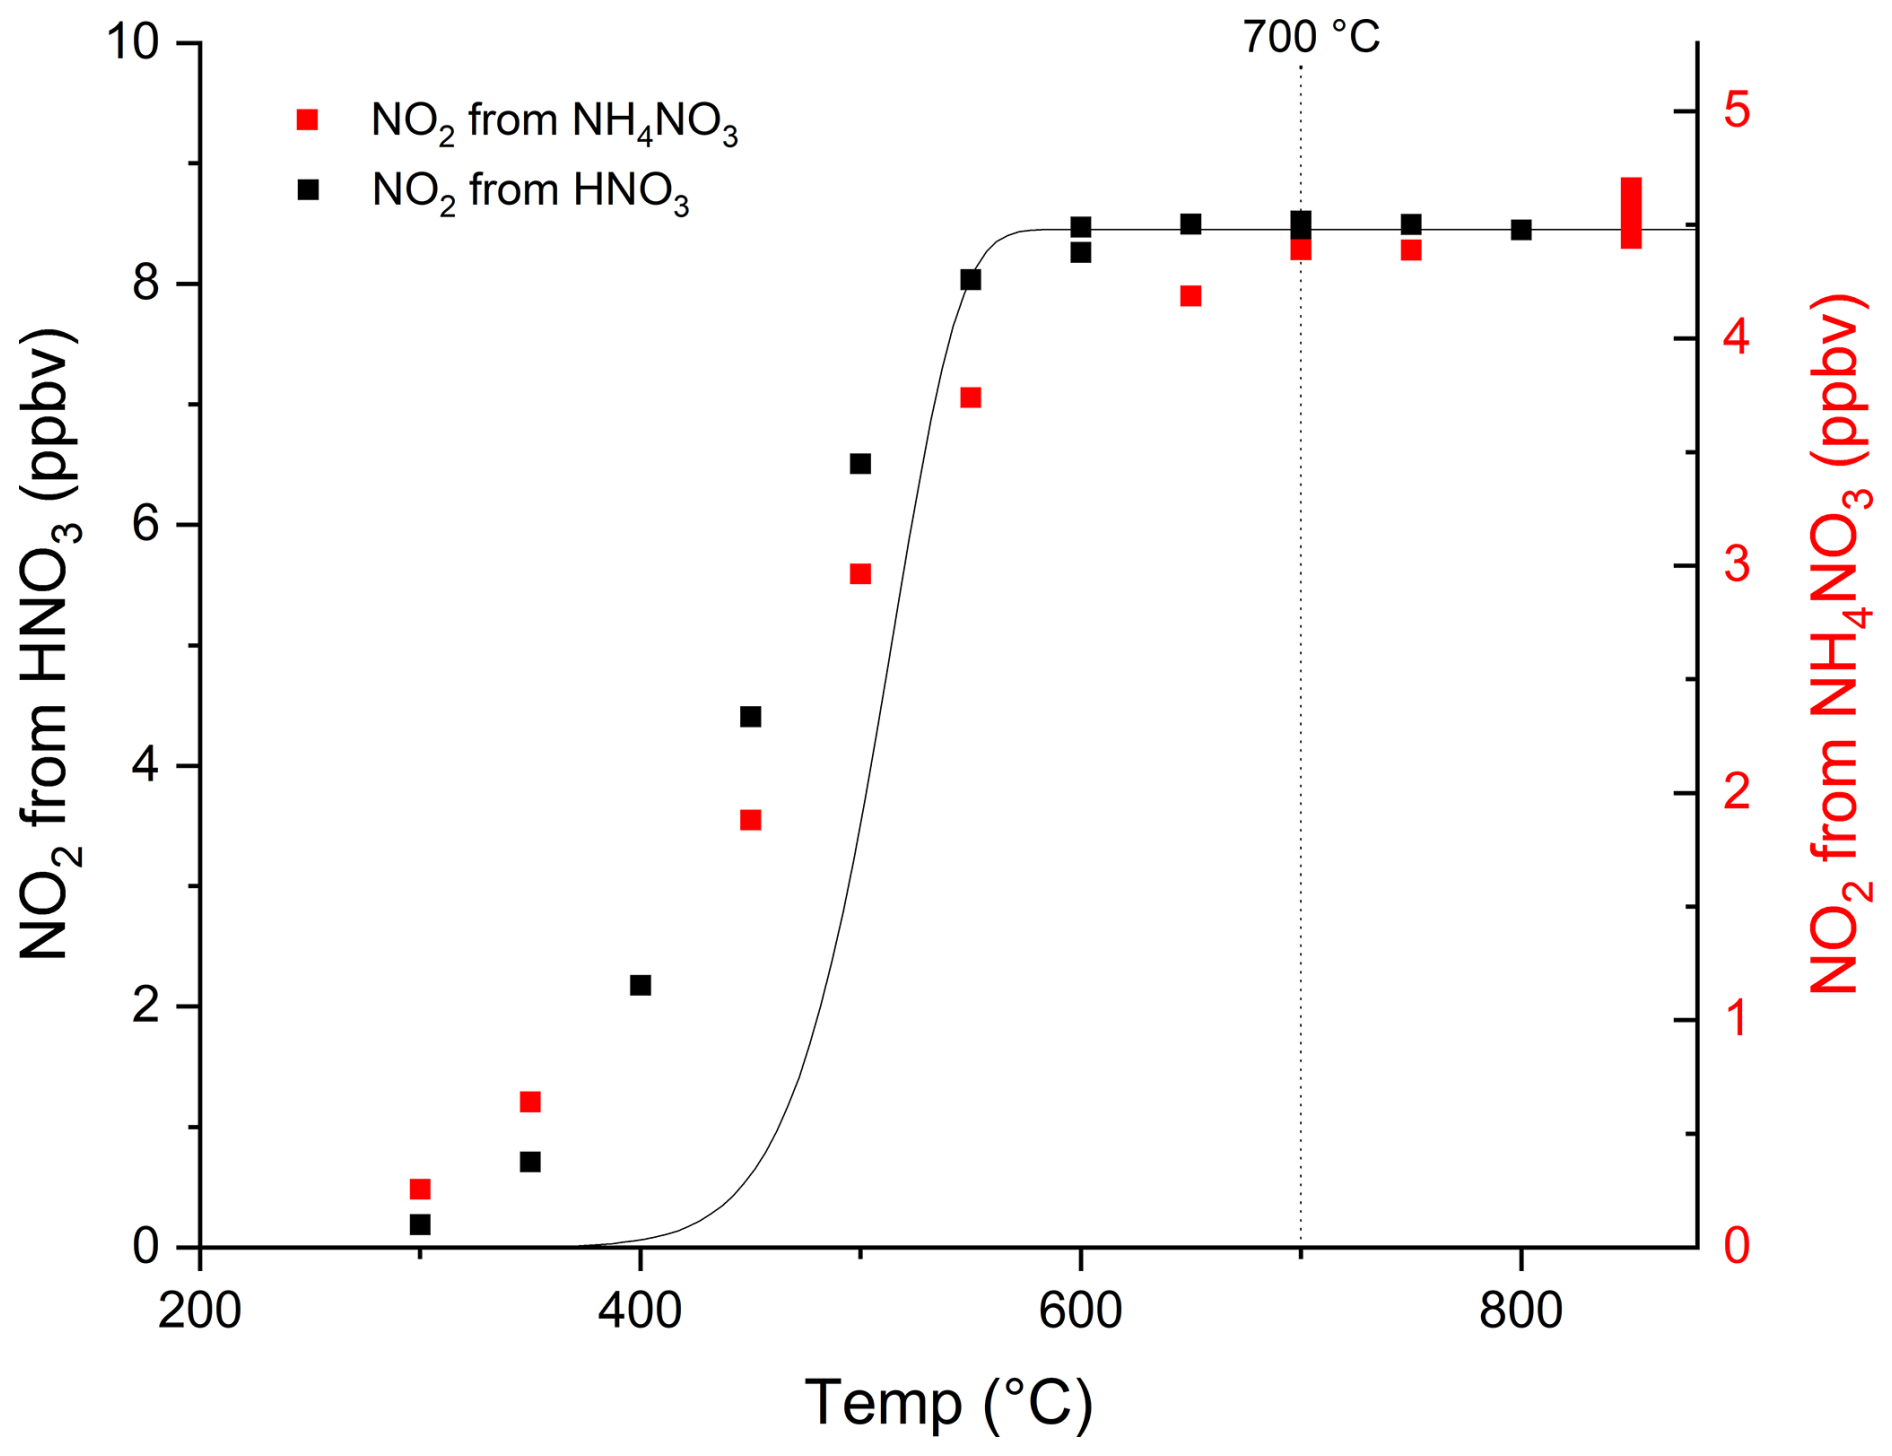
Figure 2Temperature dependent dissociation (thermograms) of HNO3 and NH4NO3 to NO2 in the TD-inlet. The vertical, dotted line indicates at which temperature the TD-inlets are operated in normal operation (i.e. in the plateau of the thermogram). The solid curve is the calculated conversion of HNO3 to NO2 using a temperature dependent rate coefficient for the thermal dissociation of HNO3 in the gas-phase (see text for details) and is scaled to match the plateau in the measured signal at high temperatures.
The calculated thermogram displays a plateau at temperatures above ∼ 600 °C, which is consistent with that measured. Complete dissociation is also achieved at temperatures that are ∼ 200 °C cooler than with our previous set up (Friedrich et al., 2020). The deviation between the calculated thermogram and that measured at temperatures < 600 °C is not unexpected and is related to e.g. surface-activated, thermal dissociation of HNO3 which occurs even at room temperature (Crowley et al., 1993), differences in the gas temperature compared to that measured on the outside of the quartz tubing, axial and radial gradients in the temperature in the TD-inlet, radial gradient in the gas velocity and the resulting uncertainty in the reaction time (t). The slightly higher temperature required by ammonium nitrate particles to reach the plateau may be related to the extra time required to fully thermally decompose particles of 100–200 nm diameter to HNO3 (and NH3). Based on this thermogram, a TD-inlet temperature of 700 °C was chosen to ensure that all HNO3 molecules and ammonium nitrate particles are detected, but avoiding detection of NH3 which only becomes significant at TD-inlet temperatures of > 800 °C in the absence of trace gases that can scavenge oxygen atoms (Friedrich et al., 2020; Womack et al., 2017; Wild et al., 2016).
2.2 Switching between measurement of NOY and P-Nit and zeroing
In the previous version of the instrument, a three-way valve was used to direct the 2 SLM flow from either of the heated inlets (one with and one without denuder) into the cavity. This meant that heated air in one of the TD-inlets was static for a period of several minutes, which lead to an increase in the gas-temperature. In order to avoid this, extra 3-way, solenoid valves (NR 225K032) were built in which switched between the 2 SLM flow to the cavity and a 2 SLM flow to a pump for each TD-inlet, ensuring that the gas flow was not interrupted and that the TD-inlet temperature was constant. In addition, we found that, when working with long inlet lines, overflowing zero-air close to the front-end of the inlet tubing (as opposed to close to the CRDS) avoided creating pressure differences when sampling ambient air or when zeroing. As pressure differences result (via changes in Rayleigh scattering) in different ring-down times, zeroing at the end of the inlet lines avoids the need to correct the data using Rayleigh scattering coefficients (Thieser et al., 2016).
2.3 Denuder and gas-phase NOY breakthrough
The denuder we use is a 15 cm long, 4 cm diameter active-carbon tube (Dynamic AQS) with internal honeycomb structure (∼ 450 square holes of 1 mm × 1 mm) to enhance the trapping of trace-gases. The denuder, a slightly larger version than the one described by Friedrich et al. (2020), is housed in an aluminium casing with 1/2 in. connectors on conical end-sections (total length 33 cm). As discussed in detail by Friedrich et al. (2020) the efficiency of the active-carbon surface in removing various gas-phase NOY components (including NO, NO2, N2O5 HNO3, PAN) depends on the relative humidity of the air sampled. This can readily be understood in terms of competitive adsorption between H2O and the NOY gas to be denuded (scavenging efficiency) or in terms of H2O induced desorption of previous adsorbed NOY trace gases (memory effect). Both effects depend on the duration and intensity of exposure of the denuder to NOY components of ambient air samples and the relative strength of interaction of H2O or the trace gas with the active carbon surface as defined by a gas-surface partition coefficient such as the Langmuir equililibrium coefficient (KLang). The latter, using NO as example trace-gas, is given by . As H2O mixing ratios in the lower atmosphere are generally many orders of magnitude larger than those of NO (or any other NOY trace-gas), it is important to protect the denuder from interaction with ambient water-vapour, requiring drying of the air to be sampled. Friedrich et al. (2020) showed that, for NO, the denuding efficiency (at room temperature) decreased dramatically at a relative humidity above ∼ 20 %. The effect on the denuding efficiency of other NOY traces gases such as 2-propyl-nitrate or HNO3 was much weaker, reflecting the stronger interaction of more polar NOY trace gases with the active-carbon surface than found for NO.
Two goals of the present study were to develop a system with high particle transmission that could dry the ambient air to a RH of < 5 % for long periods and to explore ways to reactivate denuder surfaces that had reached full capacity to adsorb NOY. Initial experiments with commercial drying systems (e.g. a silica-gel based diffusion aerosol drier, TSI, model 3062) revealed efficient drying to RH < 5 % for only short periods of time (a few hours) when exposed to air of 90 %–100 % RH. As replacement of the drying medium at such short intervals is generally not an option for implementation in instruments that operate continuously under field conditions, we placed a Nafion-based diffusion dryer serially in flow in front of the diffusion aerosol drier. The Nafion drier (PermaPure model 274) is a single Nafion tube of length 120 cm and diameter 1 cm in a stainless-steel shroud which creates an annular space through which a dry counter-flow is passed. A counter-flow of 4–5 L of dry air (provided by a compressor with removal of condensed water) was required to reduce the RH from ∼ 100 % to ∼ 10 %–15 % when sampling 2.1 SLM of humid air through the Nafion tube.
Figure 3 shows the results of two experiments in which 2 SLM of air initially at RH of 80 %–90 % (continuously monitored using a RH sensor) was passed through the Nafion drier and then through the TSI-3062 which was loaded with ≈ 0.9 kg of either dry silica-gel (AppliChem A7220, 1000 grained orange) or molecular sieve (Roth, type 564, 0.3 nm) before the RH was measured with a second RH sensor. Under these operating conditions, the Nafion drier alone reduced the RH from ∼ 80 %–90 % to ∼ 10 %–15 %. When combined with the silica gel drier, the RH was initially reduced to < 2 % which however had increased to 5 % (our threshold) after ∼ 8 h. In contrast, the combination of Nafion drier with molecular sieve drier initially reduced the RH to < 1 %, and the 5 % threshold was reached only after 45 h of exposure. Clearly, use of molecular sieve is preferred over that of silica-gel in terms of capacity to dry air at an input RH of ≈ 10 %–15 %. One potential disadvantage of using molecular sieve is the higher temperature needed to reactivate it (i.e. to drive the strongly bound H2O from the surface). While silica-gel can be reactivated at temperatures close to 100 °C, molecular sieve requires temperatures > 300 °C. In order to reactivate the molecular sieve under field-conditions, we deployed a heat-gun attached to a vertically mounted metal tube with a steel mesh at the lower end into which the “wet” molecular sieve was transferred. When operating the heat gun at 350 °C the molecular sieve (≈ 1 kg) was dried in ≈ 30 min.
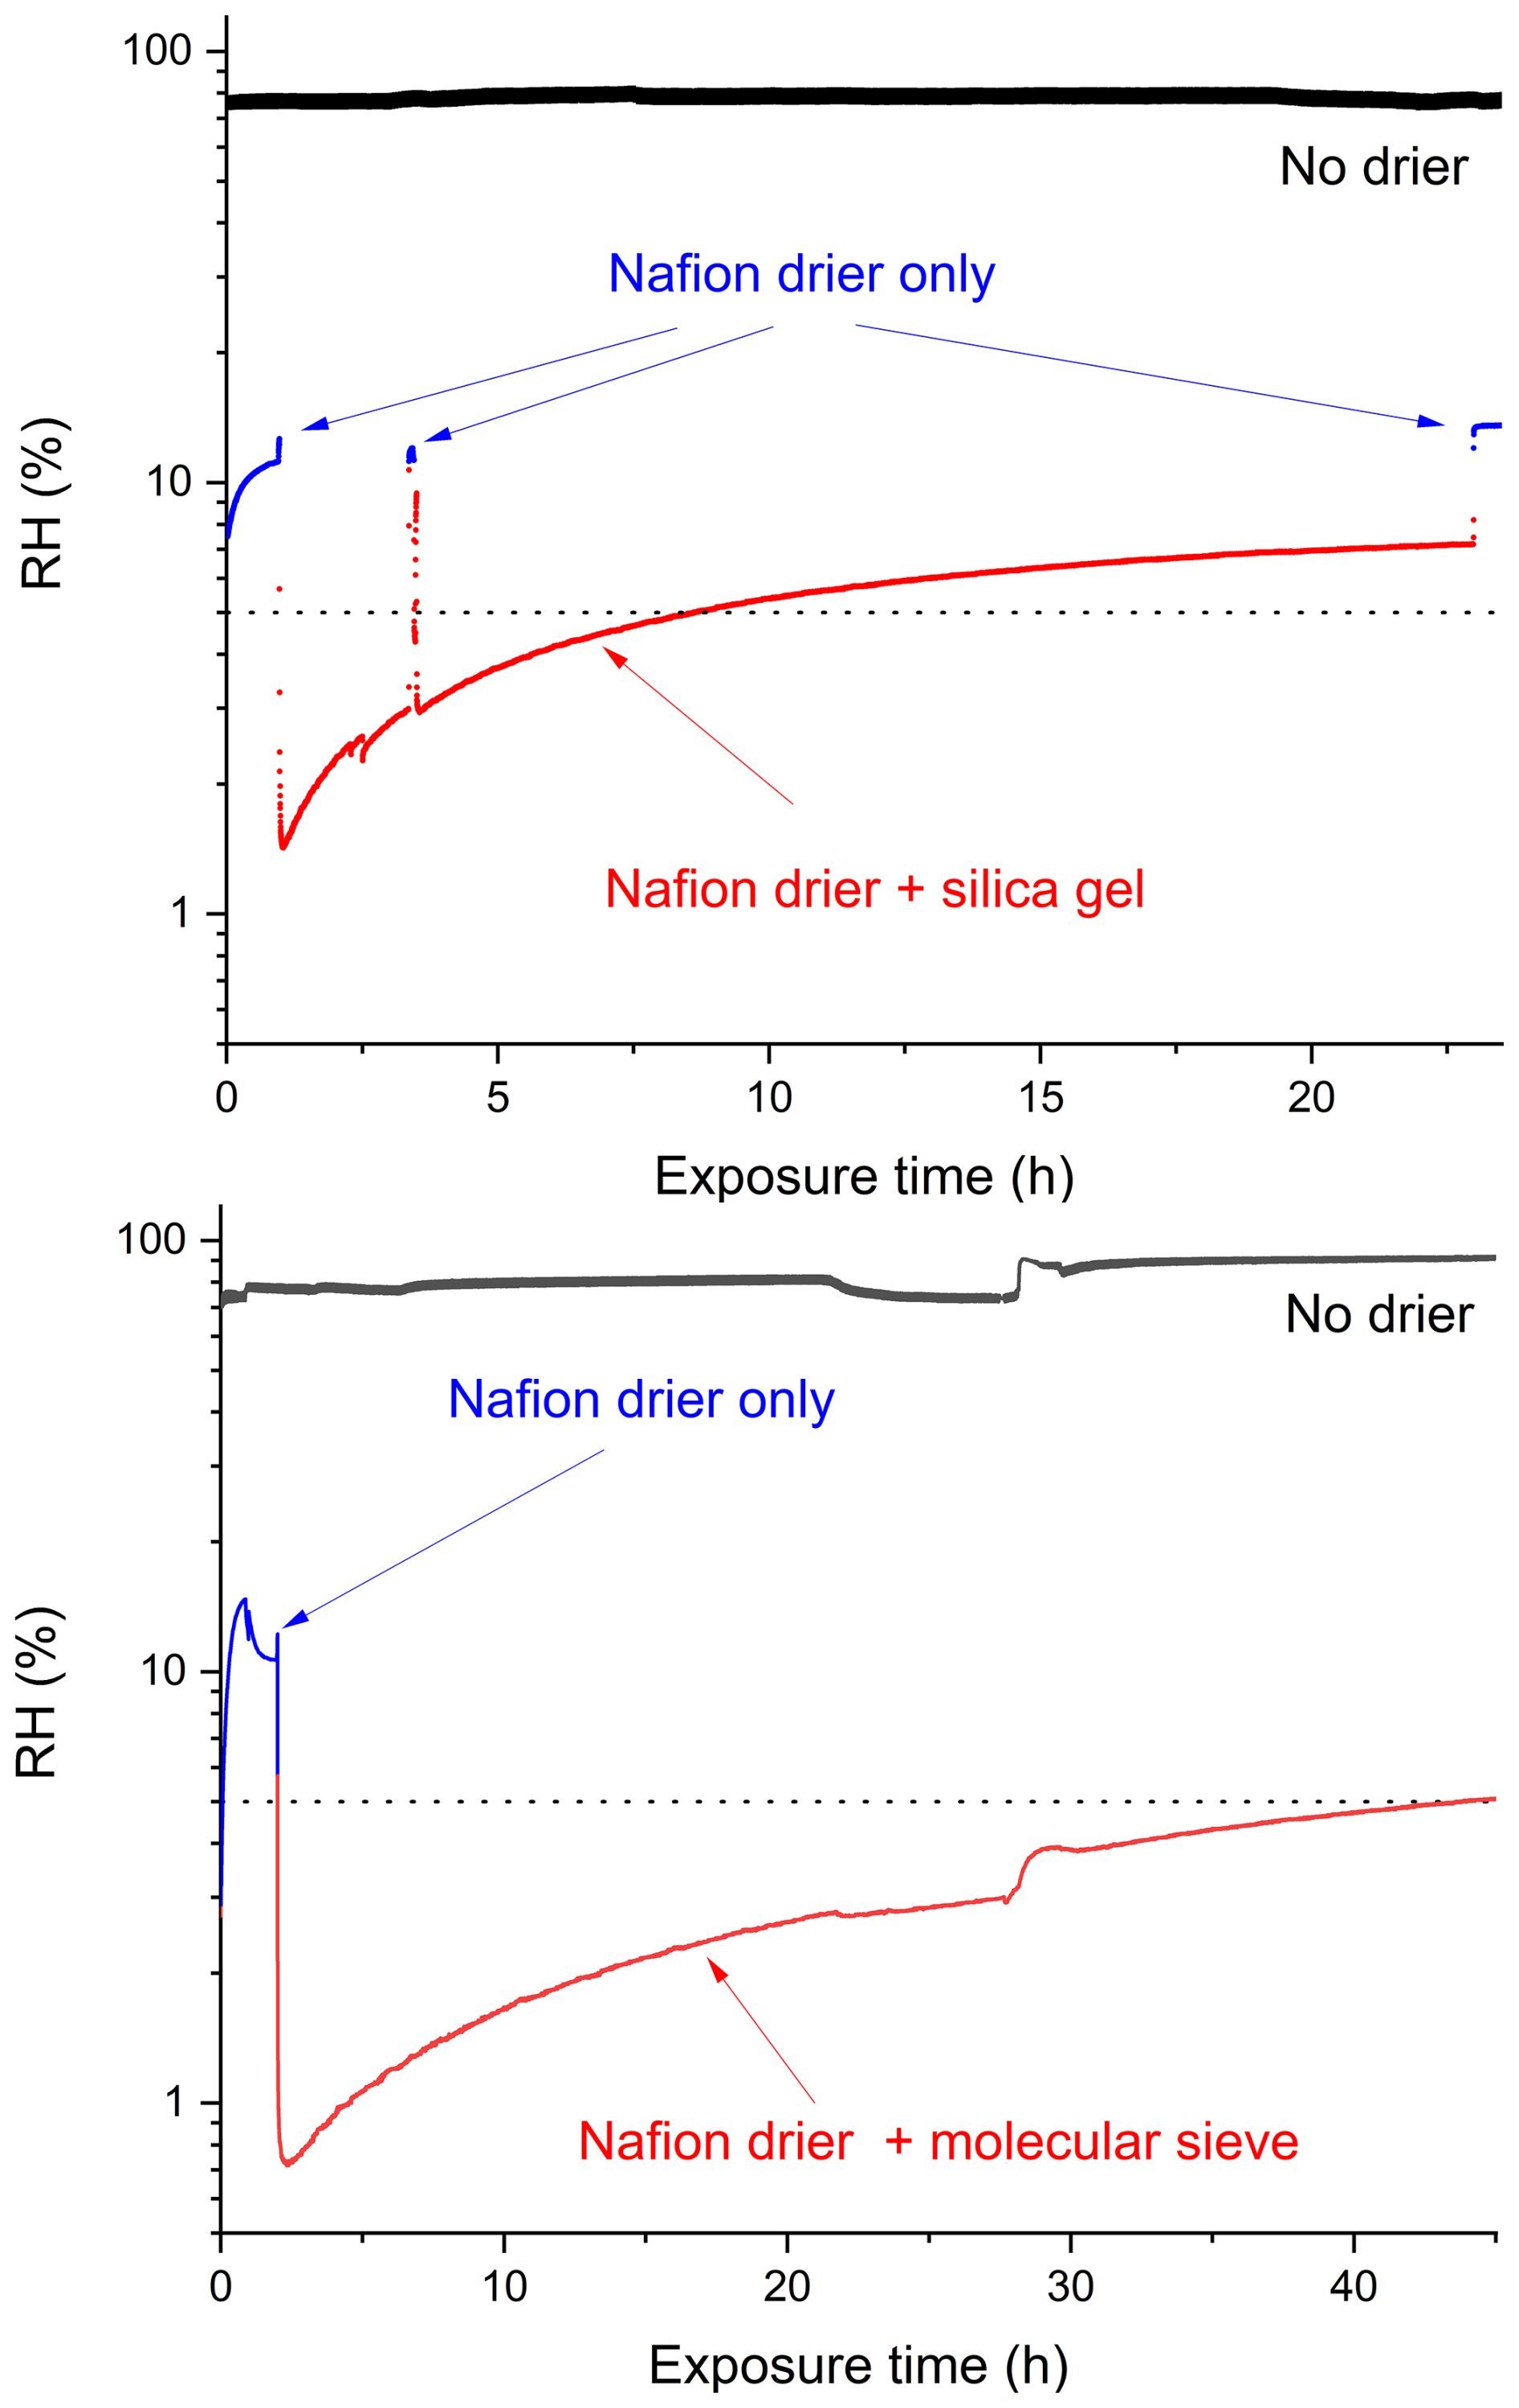
Figure 3Tests of the drying capacity of the Nafion drier alone (both panels, blue), Nafion drier with silica-gel in the diffusion aerosol dryer (upper panel, red) and Nafion drier with molecular sieve in the diffusion aerosol dryer (lower panel, red). The black lines show the relative humidity of the air (at a total flow of ∼ 2 SLM) entering the drying system (70 %–90 %). The dotted lines represent 5 % RH.
During operation of the D-TD-CRDS, ∼ 20 cm3 (STD) min−1 (sccm) of the air sampled by the P-Nit cavity and NOX cavity was passed through RH -sensors (see Fig. 1). When the sensor attached to the P-Nit channel indicated that the RH was 5 %, the “wet” molecular sieve was exchanged for a reactivated sample. This is a conservative approach to avoid even low levels of denuder breakthrough and implied that, for ambient measurements in the mid-latitude boundary layer (with 30 % < RH < 90 %), the molecular sieve was replaced every 4–5 d. In principal this interval could be lengthened by using a larger molecular sieve drier.
2.4 Particle transmission of Nafion drier, molecular sieve drier and denuder
The transmission of particles of various size through the drying system and denuder was tested in a similar manner to that described by Friedrich et al. (2020) who however only tested the denuder transmission (i.e. without the Nafion drier and molecular sieve drier components and their connectors). For these tests we generated polydisperse ammonium sulphate aerosol using an atomizer (TSI model 3076) with two different concentrations of ammonium sulphate solution, dried the aerosol using a diffusion drier (TSI model 3062) and detected particles using a scanning mobility particle sizer (SMPS, consisting of TSI model 3080/3081 classifier/differential mobility analyser, DMA, coupled to an Ultrafine Condensation Particle Counter; TSI Model 2025). The particle size distributions and number concentrations measured after the aerosol passed either through the Nafion drier or through conductive tubing of approximately the same length and volume are shown in Fig. S1 in the Supplement. Using the “dilute” ammonium sulphate solution, at the peak of the log-normal distribution (38.5 nm) was ∼ 1.0 × 106 cm−3 with a factor ∼ 10 more (1.1 × 107 cm−3 at 63.8 nm) obtained using the “concentrated” ammonium sulphate solution.
We first tested the transmission of the Nafion drier by switching the flow of polydispersed aerosol back-and-forth between the conductive tubing and the Nafion drier. In Fig. S1 we plot both the particle number distribution and particle volume distribution for the two scenarios outlined above (conductive tubing versus Nafion dryer) and also for the two different ammonium sulphate concentrations. The diameter dependent transmission from two experiments (derived by dividing the particle number concentration in each size bin when flowing through the Nafion tubing by that obtained when flowing through the steel tube) is displayed as the solid red lines in Fig. 4. While the transmission for larger particles is indistinguishable from 100 %, there is a clear loss of particles of diameter < ∼ 100 nm, with the 50 % cut-off (d50) at ∼ 25 nm. We note that the atomizer used to physically generate the test-aerosol produces multiply charged particles and the loss of the small particles is likely a combination of their high diffusivity and larger losses through electrostatic deposition to the Nafion tube.
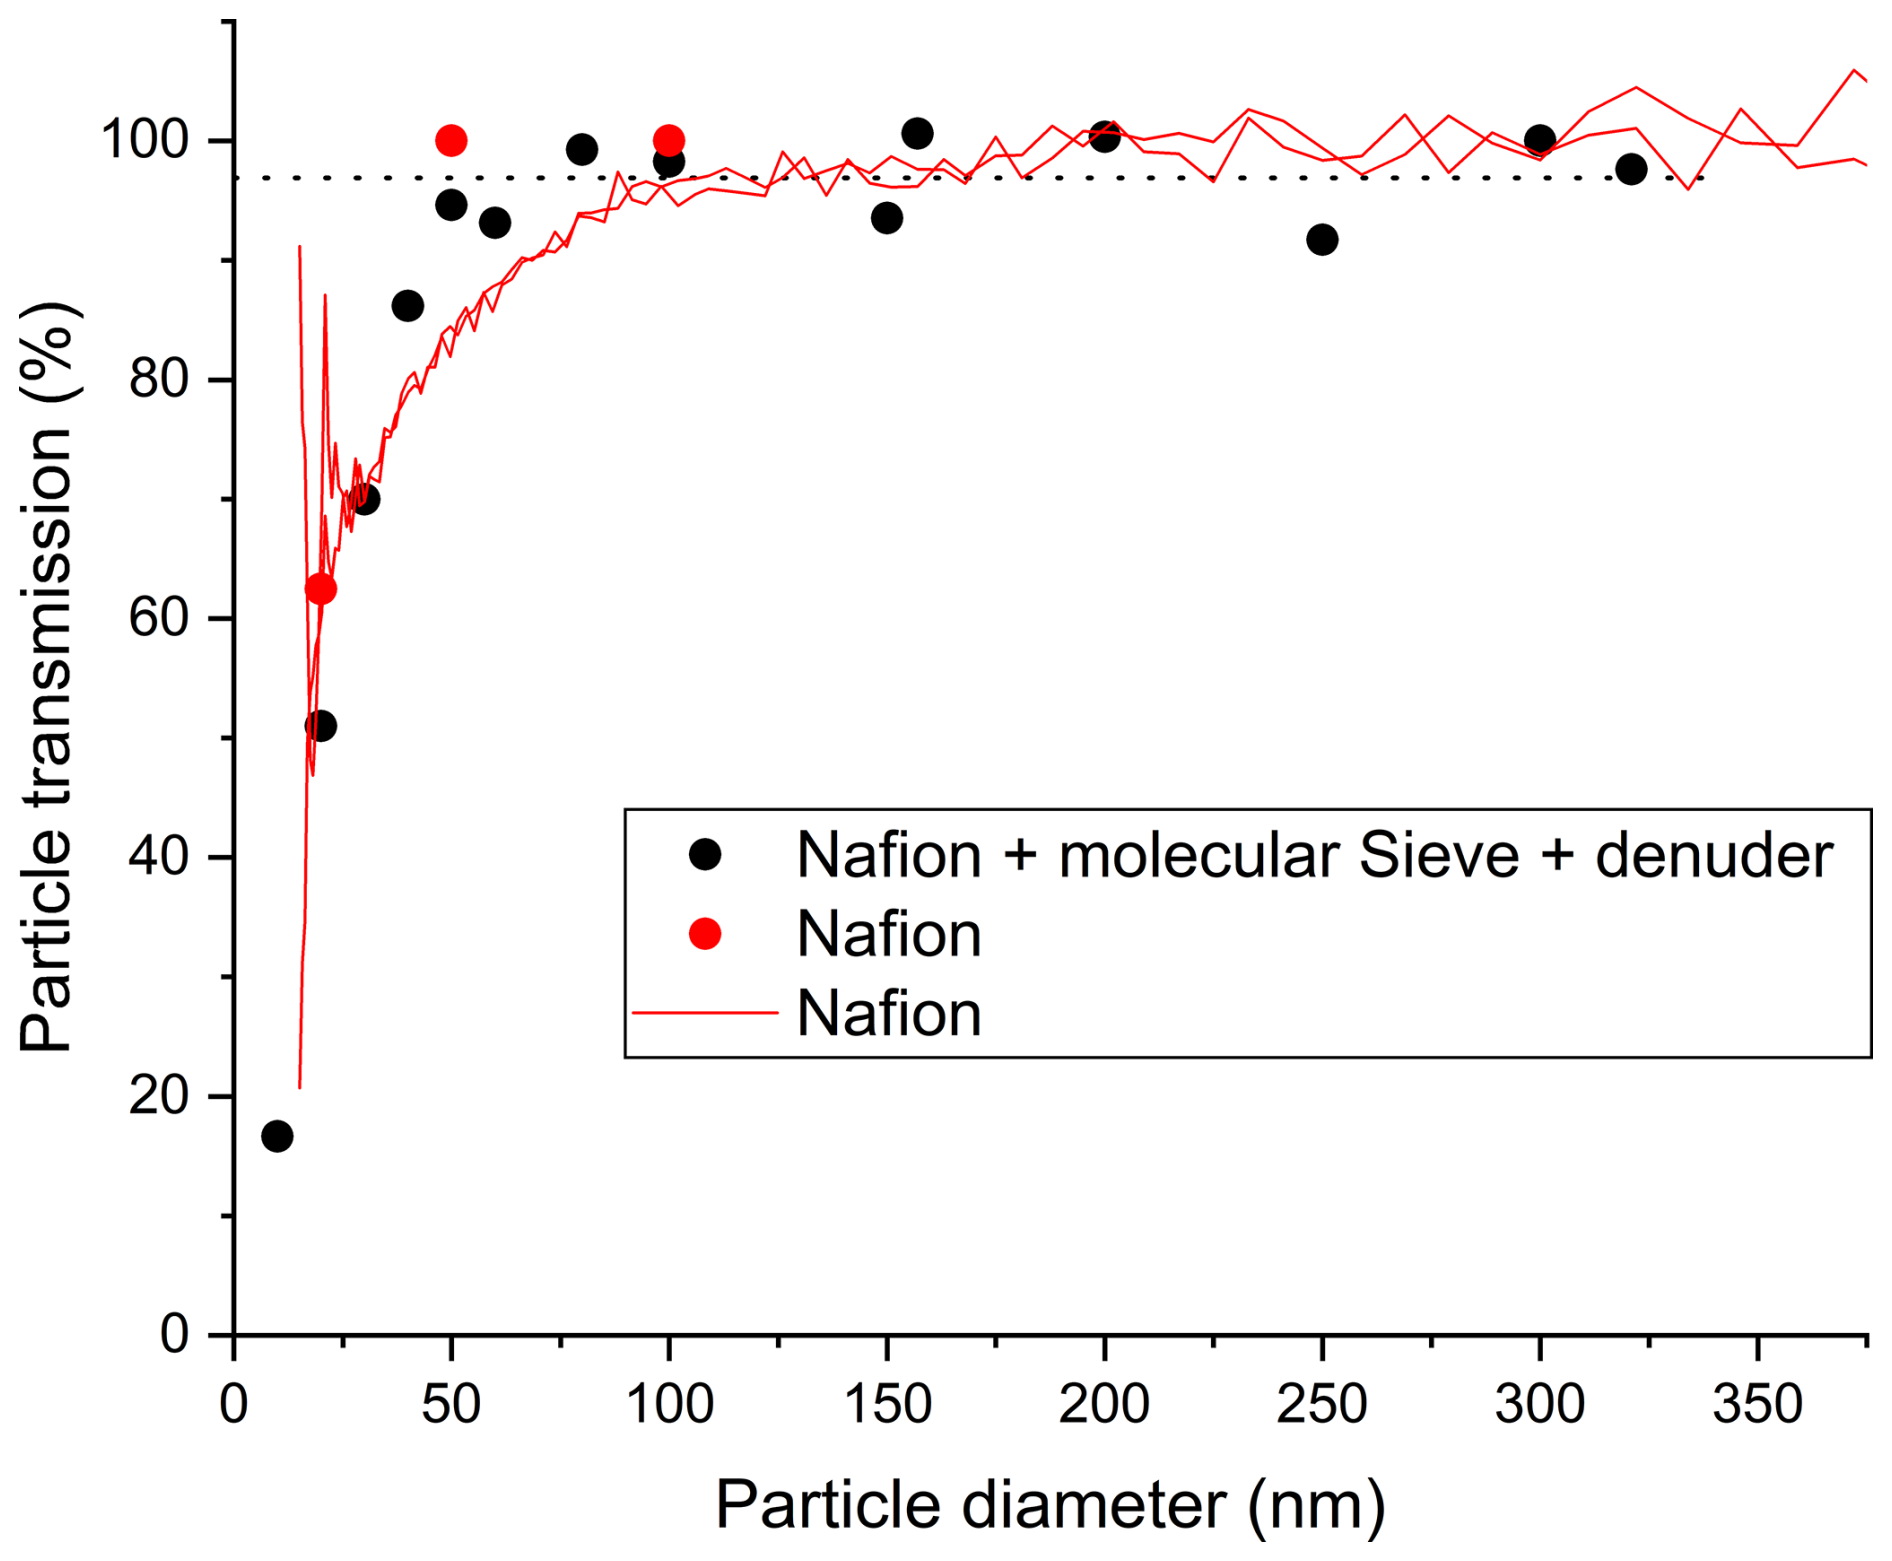
Figure 4Transmission of polydisperse (mainly multiply charged) ammonium sulphate particles (red lines) and charge neutralized (mainly single charged), monodisperse particles (red data points) through the Nafion drier. The transmission of the monodisperse particles through the complete inlet system (Nafion drier, molecular sieve drier and denuder) is given as black data points. The dotted line is the average transmission (96.9 ± 6.6 %) for mono-disperse particles of diameter ≥ 50 nm. For the experiments using polydisperse aerosol, the transmission is indistinguishable from 100 % at the larger diameters.
Despite the loss of some particles, the total particle volume (and thus mass) barely changed between using the conductive tubing and the Nafion drier with less than 1 % losses for both “diluted” and “concentrated” ammonium sulphate aerosol. This reflects the fact that the vast majority of the particle mass is in the larger particles, in this case with a maximum contribution from particles of diameter ∼ 270 nm, for which electrostatic loss is negligible.
In a separate set of experiments, we removed the majority of multiply charged particles by passing the polydisperse aerosol first through the X-Ray driven charge-neutralizer (TSI Model 308801) and DMA to pre-select particles of different diameters before flowing them either through the Nafion drier or the conductive tubing (as reference) and then to the CPC. Alternatively, the size selected particles were passed through the entire inlet assembly in which the Nafion drier, molecular sieve drier, denuder and TD-inlet are mounted vertically in line (see Fig. 1). A reference system consisting of a vertically mounted steel tube of 10 mm o.d. in which particle losses are negligible except for very small particles (von der Weiden et al., 2009) was used to define the relative transmission at the same flow rate. The steel tubing had the same length (∼ 2 m) and approximately the same residence time as the combined Nafion tube, molecular sieve drier and denuder (also vertically mounted). The results, expressed as the percentage transmission of particles through the Nafion drier are plotted in Fig. 4 (black data points) which indicates particle transmission is 96.9 ± 6.6 % (2σ) for particles of diameter ≥ 50 nm.
In terms of the transmission of small particles this represents an improvement on the results using polydisperse (multiply charged) aerosol. While the X-ray neutralizer removes multiple charges, all particles that are transmitted through the DMA have a charge. As mentioned above, this will have the effect of increasing electrostatic deposition of small particles and reduce the transmission compared to neutral (i.e. ambient) aerosol.
In summary, the particle transmission test showed that transmission losses (for charged particles) are only significant for particles of diameter < 50 nm. For small particles in charge equilibrium (i.e. chemically generated or ambient particles) the transmission could be even higher. However, in many situations, the mass (and thus nitrate content) of atmospheric particles is dominated by particles of diameter > 60 nm, in which case no correction for particle losses needs to be applied. The loss of very small particles does however imply a significant, negative bias when sampling nucleation mode particles. However, the nitrate mass found in ambient, nucleation mode particles (e.g., of diameter 10 nm) is in any case orders of magnitude below the detection limit of the D-TD-CRDS set up and indeed that of other presently available instruments (see below).
At a flow of 2.1 SLM, the residence time in the drying system and denuder is ∼ 3 s and thus compareble to that found between the differential mobility analyser (DMA) and and AMS-inlet in AMS calibration systems for which loss of ammonium nitrate through thermal decomposition to HNO3 and NH3 is known to be insignificant.
2.5 Reactivation of the denuder
Even under dry conditions, the capacity of the denuder to remove NOY from the gas-phase is not infinite. In some laboratory experiments after flowing several hundred ppbv of HNO3 for several hours through the denuder we observed breakthrough, i.e. a slow increase in the P-Nit cavity signal in the absence of (nitrate containing) particles. We therefore explored means to “reactivate” the denuder after such experiments. Considering that the addition of gas-phase humidity > 20 % leads to denuder breakthrough of NO and also results in the release of previously adsorbed NOY from the denuder, our approach is to use distilled water to “wash” NOY species from the denuder surface. This is achieved by completely immersing the denuder in distilled water and agitating using a sonic bath for several minutes before replacing the distilled water and repeating the procedure three or four times. Following this, the denuder was rinsed by flowing 2–3 L of distilled water through it. Finally, warm (∼ 40–50 °C), dry air was passed through the denuder and the relative humidity of the exhaust was monitored. The cleaning procedure was considered completed when the exhaust RH was below 1 %. Following such a reactivation procedure the denuder could be operated continuously for > 1 month (during which > 80 000 L of air of RH < 5 % passed through the denuder) with average ambient NOY levels of 1–2 ppbv without any observation of breakthrough. The lack of breakthrough could be established by analysing datasets in which large spikes in NO and NO2 (caused by very close vehicular emissions) were observed in the NOX channel but not in the P-Nit channel of the instrument (see Fig. S2) even after weeks of exposure.
2.6 Total uncertainty and LOD for P-Nit detection by the D-TD-CRDS
The total uncertainty of the P-Nit measurements by the D-TD-CRDS is a product of uncertainties in the parameters listed in Eq. (1) related to NO2 detection, as well as the uncertainty in the fractional conversion by thermal dissociation of P-Nit to NOX and in the denuder efficiency for removal of gas-phase NOY before the particle nitrate is thermally dissociated to NO2, and in the particle transmission through the drying system and denuder.
As discussed by Thieser et al. (2016), the total uncertainty for NO2 detection is a product of uncertainty in the NO2 cross-section (4 %), uncertainty in the ratio (1 %) and Rayleigh scattering corrections for differences in pressure δP and humidity δRH between zeroing and sampling. In the present configuration, with zeroing at the front-end of the sampling line and with a drying system for the P-Nit channel, both δP and δRH are negligible. As we work on the plateau of thermograms defining the fractional conversion of HNO3 and ammonium nitrate to NOx the conversion of P-Nit to NO2 is close to stoichiometric and we have previously shown (Friedrich et al., 2020) that HNO3 is expected to be detected with 100 % efficiency. In Fig. 4, we have shown that the average particle transmission is 96.9 ± 6.6 % for particles of diameter ≥ 50 nm. Propagating these individual uncertainties results in an overall uncertainty for P-Nit detection of 13 %.
The LOD of the P-Nit channel is determined by the minimum value of (k−k0) that can be measured (see Eq. 1), which depends on the reproducibility of the zero measurement (k0). The integration time dependent LOD was thus derived from an Allan deviation analysis of the signal from the P-Nit channel when zeroing as displayed in Fig. S3. Under ideal, laboratory conditions (i.e. in stable temperature, draft and vibration-free location) the standard deviation (1σ) of k0 at 5 s sampling interval is 24 pptv NO2. Taking 2σ to define the LOD, this corresponds to 0.12 µg m−3 of particulate nitrate (conversion factor of pptv NO2 to µg m−3 nitrate is 2.50 × 10⁻³ for 298 K and 1 bar and using a molecular weight of 62 g mol−1 for nitrate).
Under laboratory conditions, extending the averaging time to 1 min (2σ = 14 pptv), would decrease the LOD to 0.035 µg m−3. One-minute averages of a P-Nit dataset obtained under field conditions (air conditioned container in a forest) are characterised by a factor 2.4 worse standard deviation of k0 (2σ = 34 pptv NO2) and thus a LOD for detection of P-Nit of 0.085 µg m−3. This is largely a result of drifts in k0 (see Eq. 1) resulting e.g. from temperature changes at the instrument induced by drafts or by air-conditioning in the container.
In order to evaluate the performance of the D-TD-CRDS set up, we compared the aerosol mass concentrations of inorganic and organic nitrates measured by the D-TD-CRDS to those measured by a High-Resolution Time-of-Flight aerosol mass spectrometer (HR-ToF-AMS) from Aerodyne Research Inc. (Drewnick et al., 2005; DeCarlo et al., 2006) with both instruments sampling from our Simulation Chamber for Atmospheric Reactions and Kinetics (SCHARK, Dewald et al., 2021). The D-TD-CRDS measurement of NO2 mixing ratio was converted to mass concentrations in µg m−3 at 298 K temperature and 1000 hPa pressure (Seinfeld, 1986).
The HR-ToF-AMS instrument we used samples ambient air with ∼ 0.1 L min−1 through a “Standard” Aerodyne aerodynamic lens (Liu et al., 2007) that focuses particles into the vacuum system. Considering the 50 % cut-offs for particle transmission leads to the reported range of detectable particle diameters of 70–700 nm. In order to reduce the residence time of the particles in the sampling lines, a stainless-steel T-piece was connected infront of the AMS inlet. The 100 sccm flow to the AMS passed straight through the T-piece with 1 SLM drawn through the T at 90°. The particle beam exiting the aerodynamic lens passes the chopper and the particle-sizing chamber as used in particle time-of-flight (PToF) mode, which enables assessment of the size distribution of the sampled particles. During the experiments presented in this work, we operated the HR-ToF-AMS mainly in the mass spectrum (MS) mode which measures concentrations of non-refractory particle components without particle size information. In the HR-ToF-AMS, aerosol particles are flash-vaporized on a tungsten surface (∼ 600 °C) prior to ionization of gas-phase molecules by electron impact at 70 eV. After transfer of the ions into the mass spectrometer chamber, an orthogonal extractor transfers them into the ToF-MS operated in V-mode for positive ions. Nitrate is detected as NO+ and NO at 30 and 46, respectively. The mass resolution at these masses is ca. 2500 .
The MS spectra were corrected for instrument background signals derived from periods when the chopper blocked the particle beam. Data was evaluated with the Igor (WaveMetrics Inc.) programs “SQUIRREL 1.66 G” and “PIKA 1.23 G”.
Before making a detailed comparison between the D-TD-CRDS and HR-ToF-AMS, the AMS ionization efficiencies (IE) for inorganic (ammonium nitrate) and organic nitrate (derived from the NO3 initiated oxidation of limonene) were freshly determined. The details are found in the Supplement “Calibration of the HR-ToF-AMS ionization efficiency”. For inorganic nitrate particles (IP-Nit) the ionization efficiency was retrieved from a calibration with ammonium nitrate particles as 7.41 × 10⁻⁸ ion molec.−1. The uncertainty associated with the inorganic nitrate mass concentrations is ∼ 16 %, which is related mainly to uncertainty in IE (16 %) with a minor contribution from variability in the air beam correction factor (3 %). The limit of detection (LOD) for nitrate is 0.016 µg m−3 (1.5 min, 2σ) as derived from the 2σ variation of the signal with the particle beam blocked.
For the quantification of organic nitrate particles (OP-Nit, the product of the ionization efficiency (IE) and the collection efficiency (CE) was derived from an online-calibration of the HR-ToF-AMS with an SMPS during a SCHARK experiment with limonene-derived OP-Nit with the volume weighted mode maximum diameter (d(v)) > 60 nm and found to be 6.64 × 10⁻⁸ ion molec.−1 with 34 % uncertainty. The same limonene-derived OP-Nit are later used in an intercomparison between the TD-CRDS and the AMS. Smaller particles with e.g. d(v) = 38.5 nm were associated with a lower HR-ToF-AMS ion-signal per aerosol mass, which is associated with the lower transmission of small particles through the aerodynamic lens (see the Supplement for details). The limit of detection (LOD) for OP-Nit is 0.013 µg m−3 (1.5 min, 2σ) as derived from the 2σ variation of the signal with the particle beam blocked.
3.1 Inorganic nitrate particles (IP-Nit, NH4NO3)
To make quantitative comparison of the measurement of inorganic nitrate particles by D-TD-CRDS and HR-ToF-AMS, dry ammonium nitrate (NH4NO3) particles (ca. 10–400 nm) were generated from aqueous NH4NO3 solution using an atomizer (TSI, model 3076), and a diffusion drier (TSI, model 3062) filled with silica gel as drying agent. The aerosol flow (≈ 2 SLM for 30–100 s during each “injection”) was directed into the SCHARK where it was dynamically diluted with a continuous flow of 6 SLPM dry zero air. The mixing time in the SCHARK is ≈ 1 min. Figure 5a shows a 24 h-time series in which polydisperse ammonium nitrate particles were added to the SCHARK three times. Both the D-TD-CRDS and the HR-ToF-AMS observe co-varying increases in nitrate mass concentrations up to 25 µg m−3 over extended time-periods. Note that data between 18:45 UTC on 12 June and 06:50 UTC on 13 June has been excluded from the correlation as only background signal was collected. Figure 5b reveals excellent correlation (Pearson correlation coefficient r = 0.99) between the two datasets with an unweighted linear regression yielding a slope of IP-Nit (HR-ToF-AMS) IP-Nit (D-TD-CRDS) = 0.95 ± 0.02 and an intercept of (−0.11 ± 0.04) µg m−3. The deviation of the slope from unity is well within the combined uncertainty of the two instruments. At the lowest particulate nitrate masses the plot deviates slightly from a purely linear correlation. These low nitrate masses are associated with the data obtained at long times after injection into the SCHARK when (1) less particles are available because of flow out from the SCHARK and (2) substantial shrinkage of the ammonium nitrate particles (resulting from thermal decomposition and loss of HNO3 and NH3 to the chamber walls) will have occurred so that the particle diameter was reduced compared to the larger masses. The change in slope at the lowest nitrate mass could thus potentially be associated with a lower AMS inlet transmission and detection efficiency for the smallest particles, compared to the D-TD-CRDS collection and detection efficiency, which is less affected by very small particle sizes.
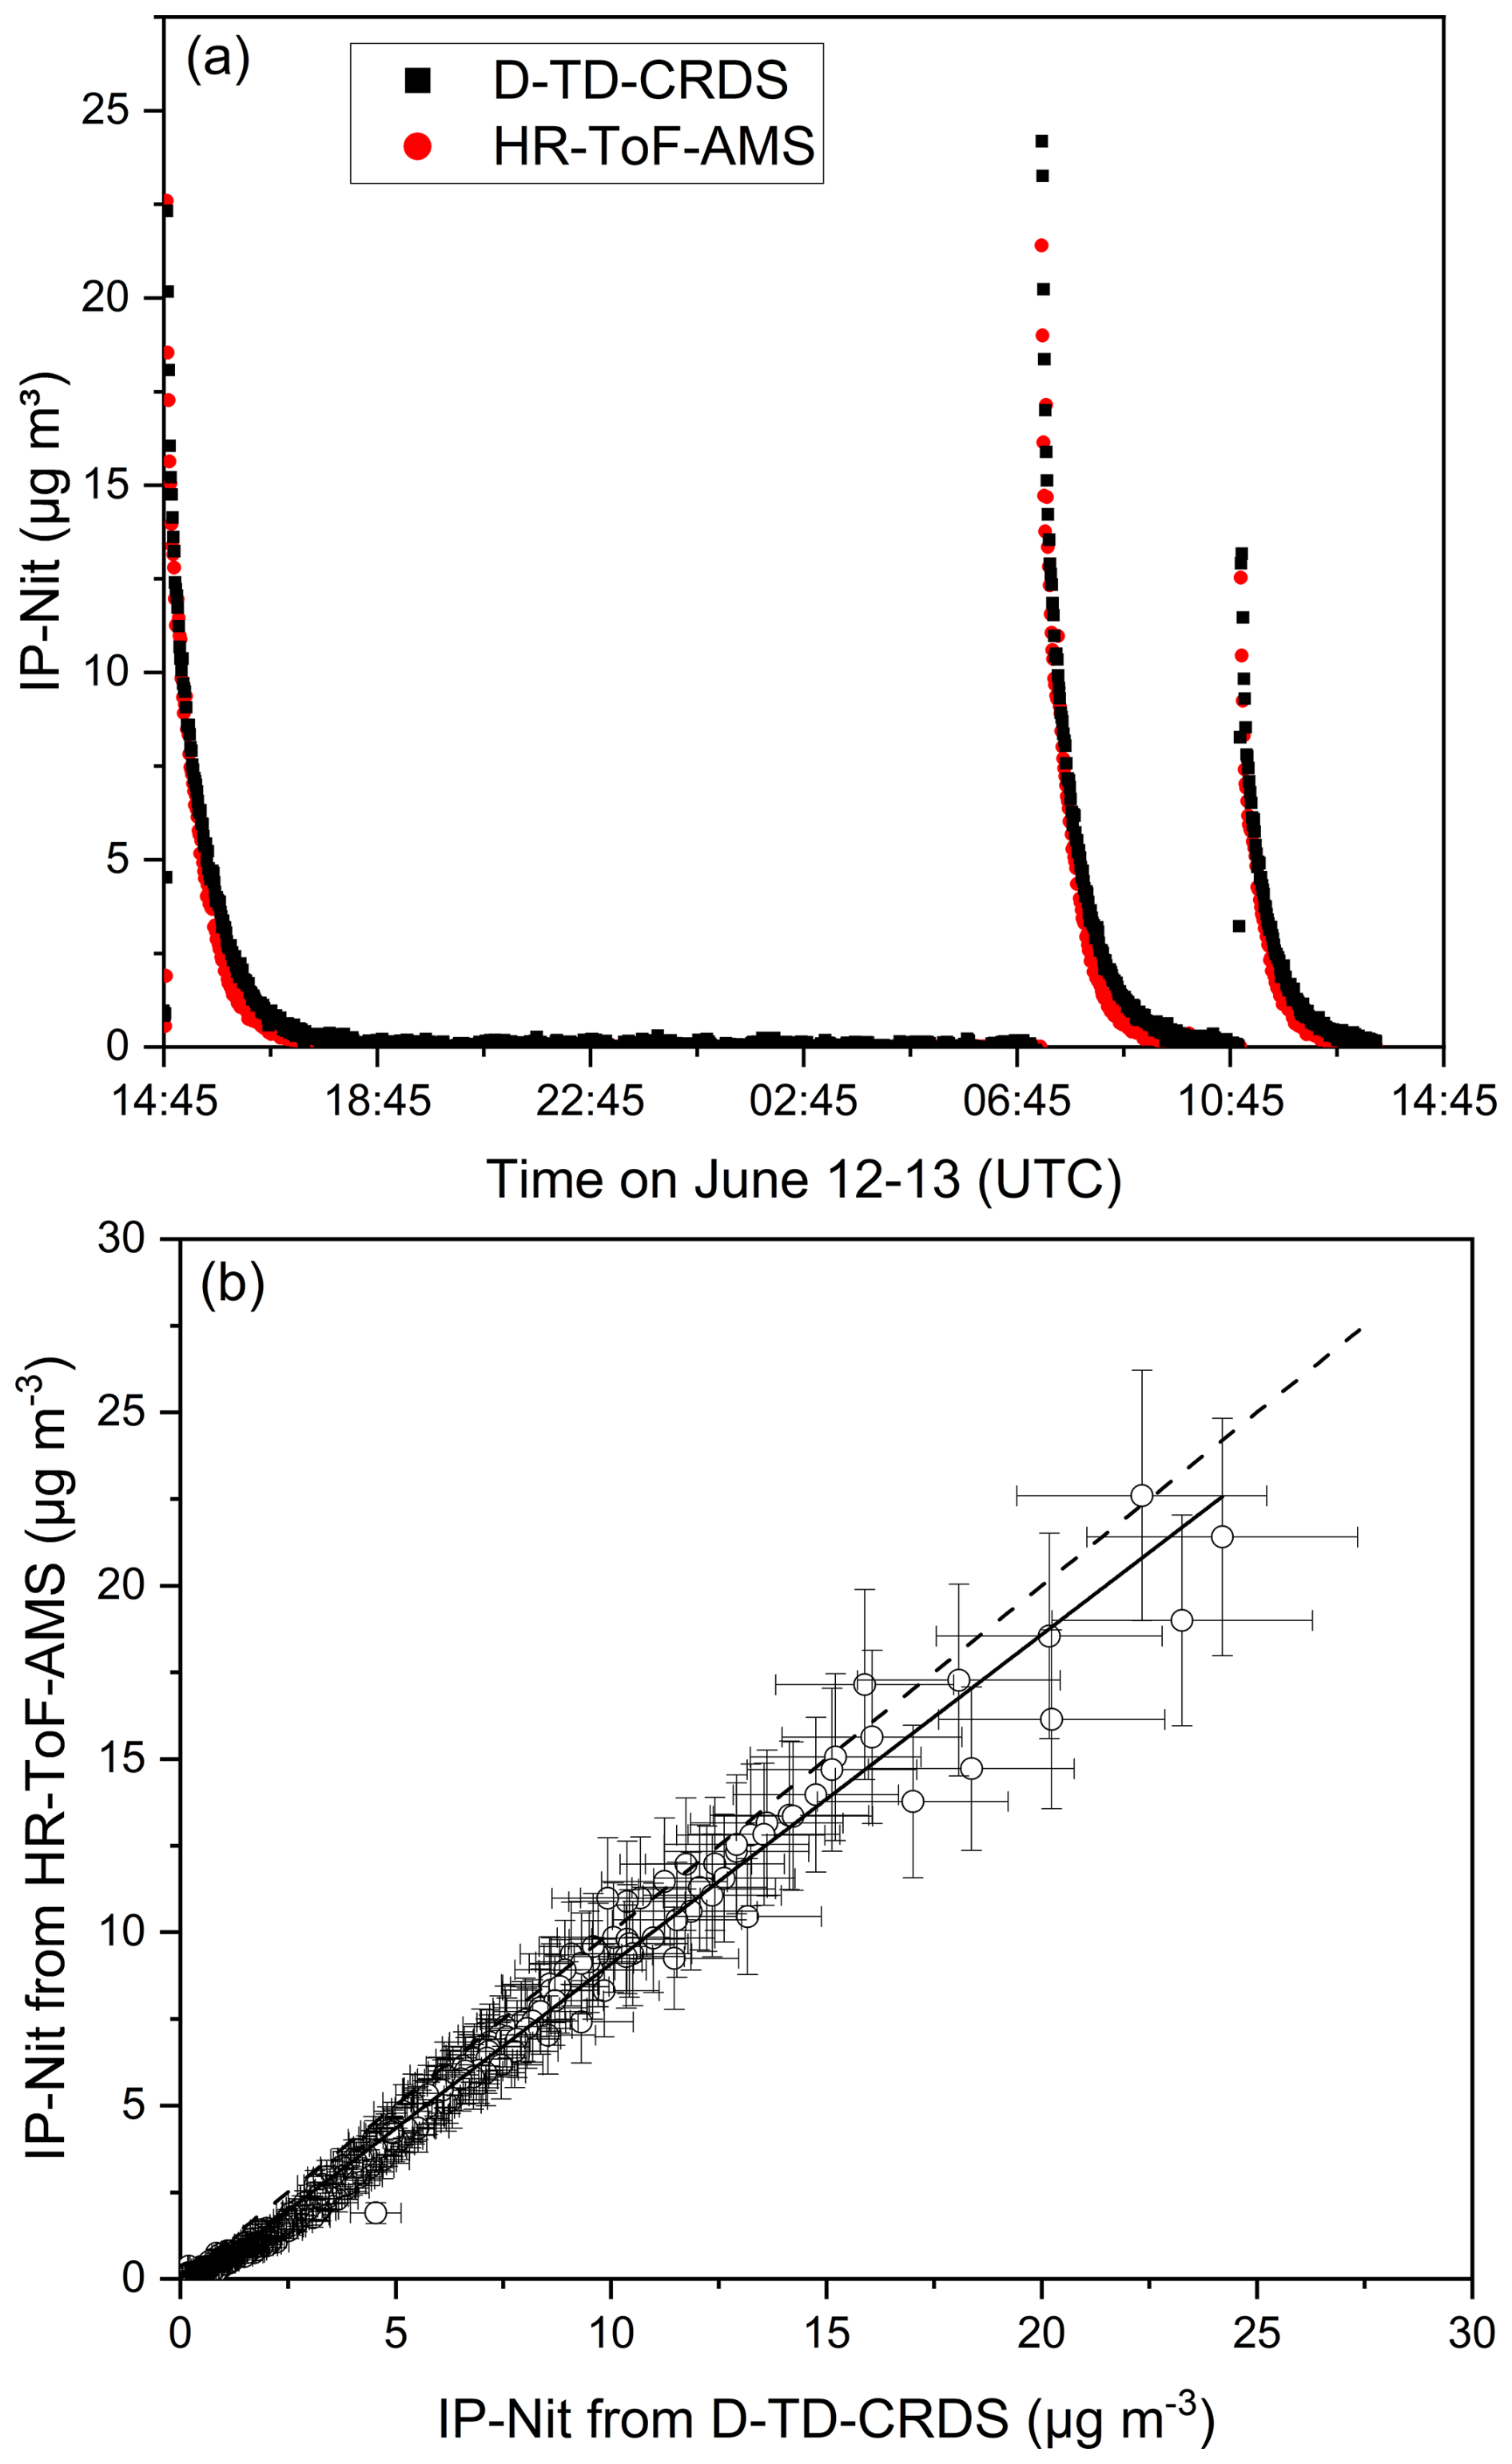
Figure 5(a) A time series and (b) correlation plot of inorganic nitrate particles (IP-Nit) measured from the SCHARK chamber with the D-TD-CRDS and HR-ToF-AMS instruments. The solid black line in panel (b) is an unweighted linear regression with a slope of 0.95 ± 0.02 and a Pearson correlation coefficient (r) of 0.99. The dashed black line is the 1:1 line. Error bars represent total measurement uncertainty. Data between 18:45 UTC on 12 June and 06:50 UTC on 13 June has been excluded as only background signal was collected.
3.2 Particulate organic nitrates (OP-Nit)
Figure 6a shows a time series of D-TD-CRDS and HR-ToF-AMS measurement of OP-Nit derived from the reaction between limonene and NO3 in the SCHARK chamber. Details of the experiment are given in the Supplement (Figs. S5–S7). The slope of the correlation plot (Fig. 6b) is OP-Nit (HR-ToF-AMS) OP-Nit (D-TD-CRDS) = 1.08 ± 0.09 with an intercept of 0.22 ± 0.19 µg m−3. The deviation of the slope from unity is well within the combined uncertainty of the two instruments.
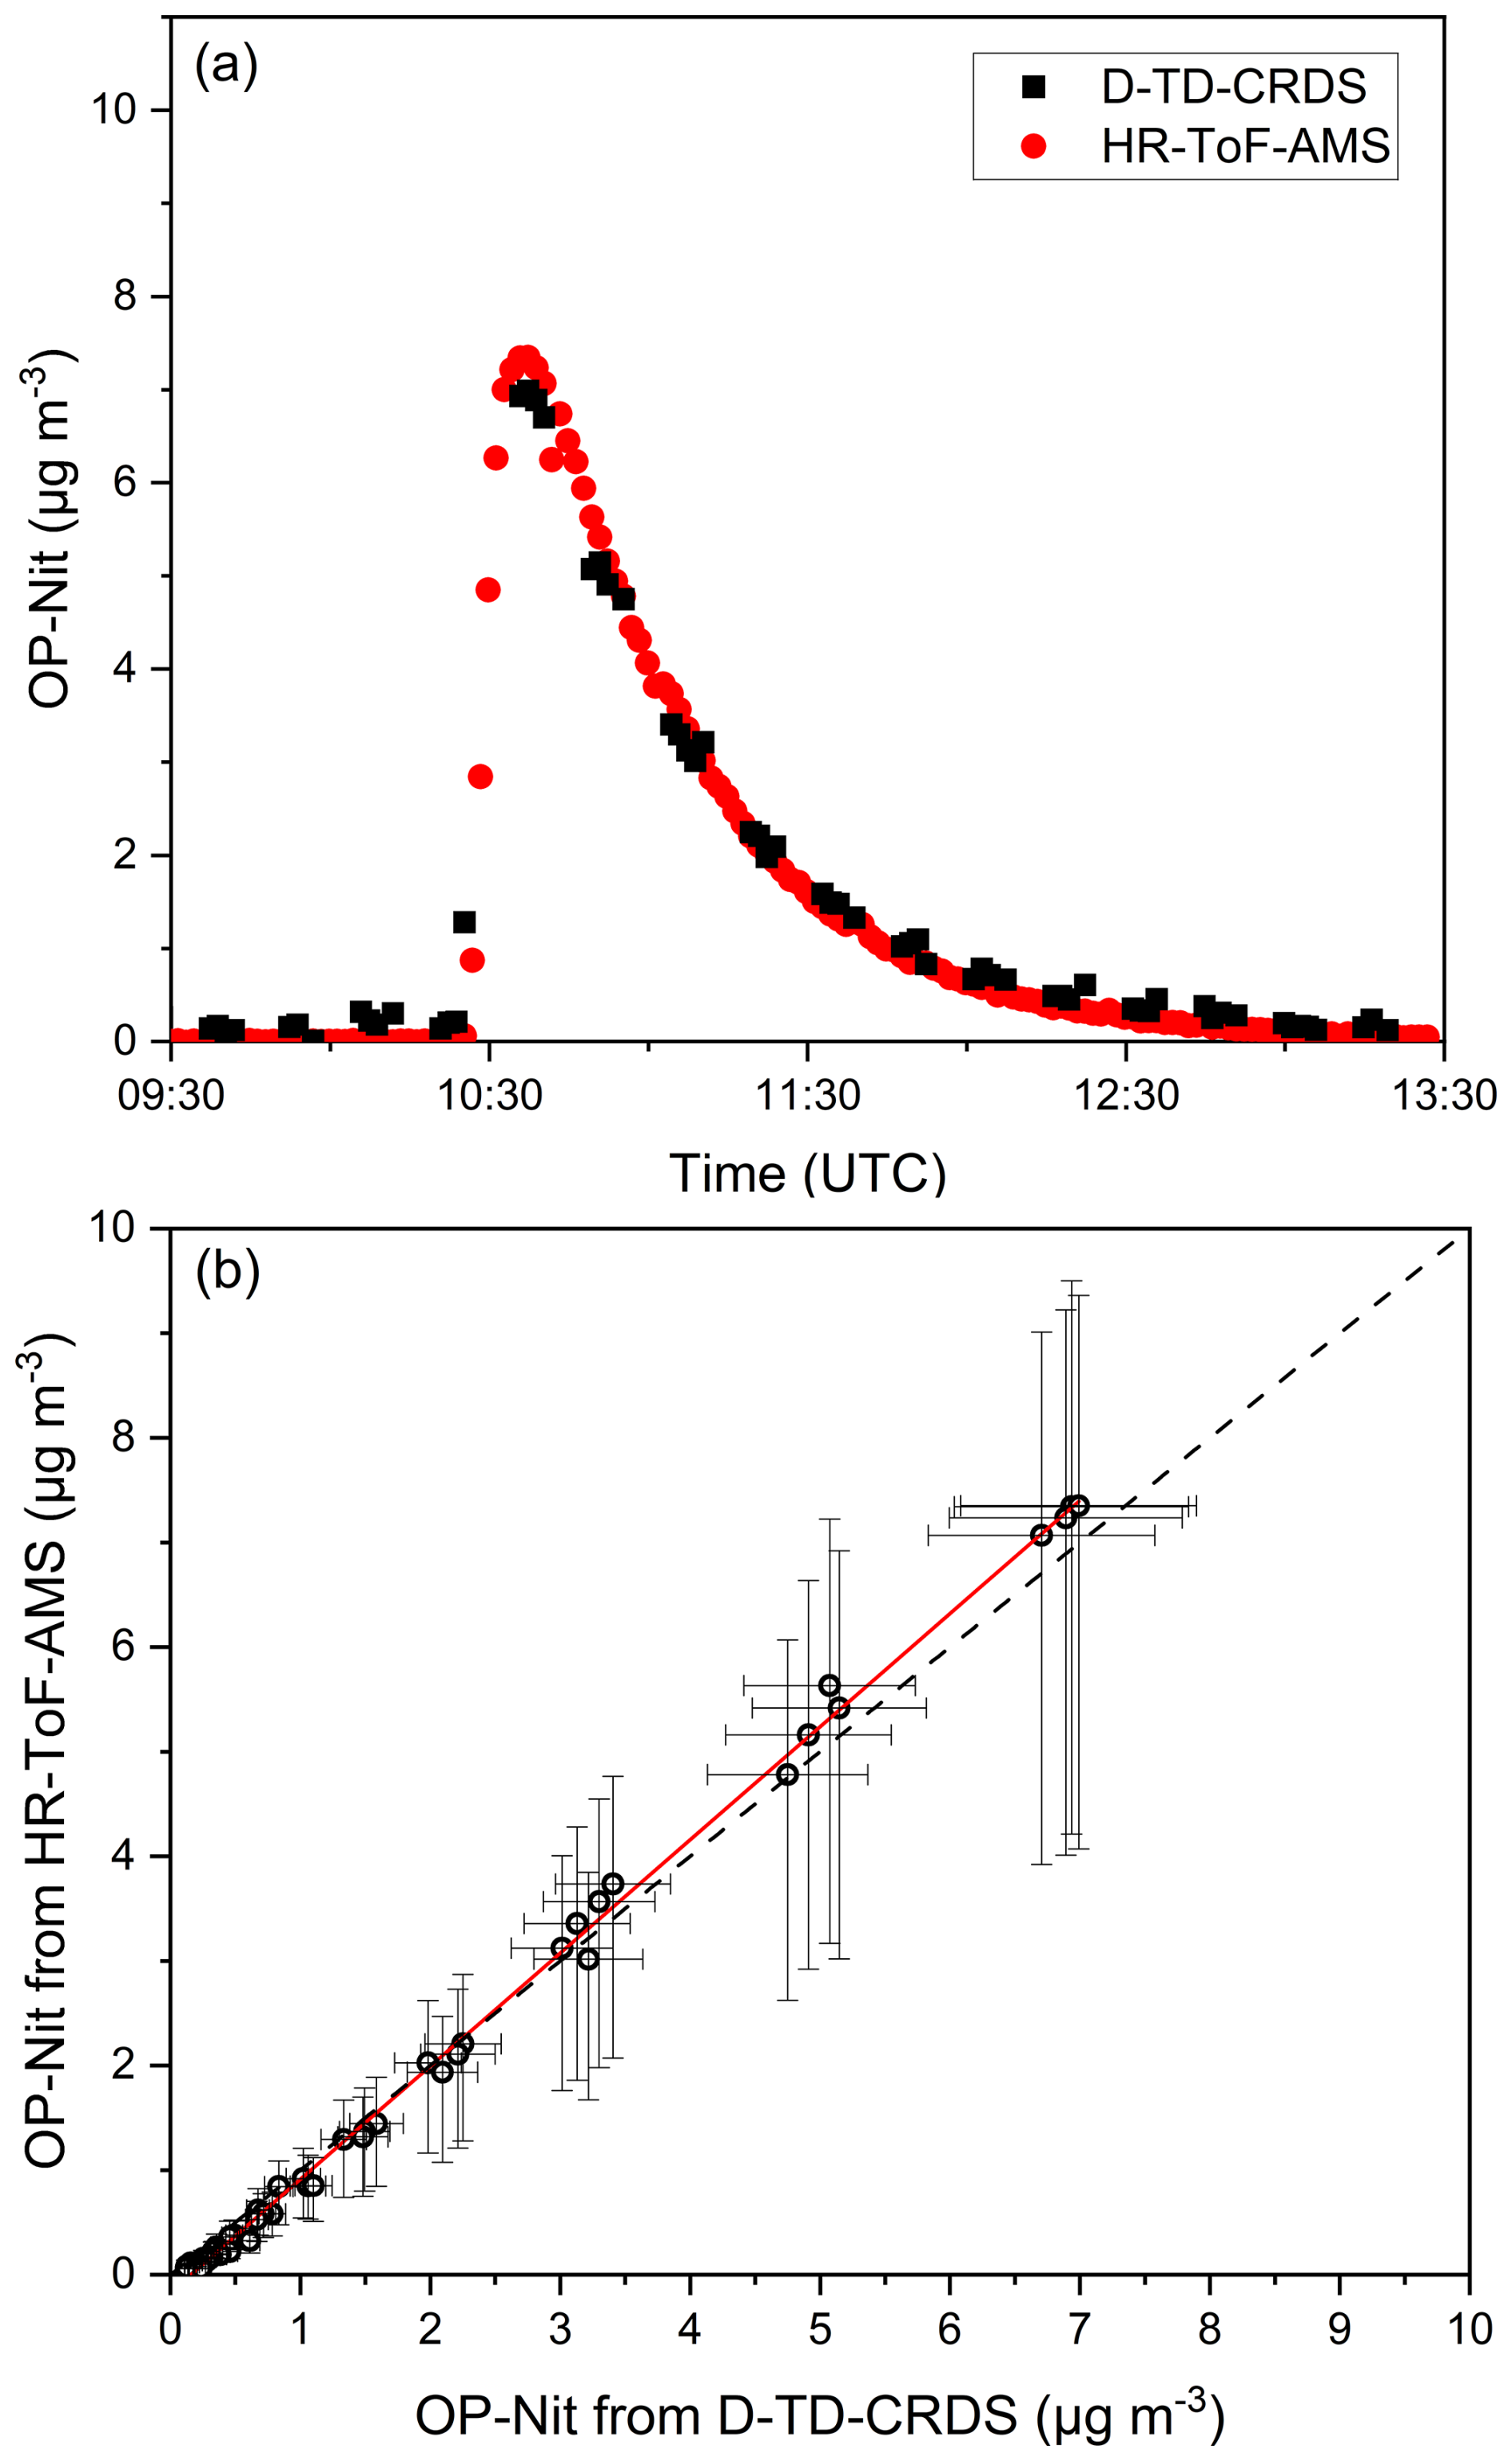
Figure 6(a) Time series and (b) correlation plot of organic nitrate particles (OP-Nit) measured with the D-TD-CRDS and HR-ToF-AMS instruments. The data-gaps in the D-TD-CRDS dataset are periods when the instrument was zeroed. The solid red line in panel (b) shows an unweighted linear regression with a slope of 1.08 ± 0.1 (1σ) and a Pearson correlation coefficient (r) of 0.999. The dashed black line is the 1:1 line. The error bars show the associated measurement uncertainties.
Note that in our chamber experiments we generate a large number of different organic nitrate species (C7 to C10) and the OP-Nit is thus not a single molecule. In this case the contribution of organic fragments to m/z 30 might vary from one organic nitrate to the next and the IE (and CE) of these organic nitrate species might also vary. However, as our SMPS-based calibration of IE was carried out with the same organic nitrate system (i.e. formed in the NO3 + limonene system), such effects will cancel when comparing OP-Nit (HR-ToF-AMS) and OP-Nit (D-TD-CRDS).
3.3 Advantages and Disadvantages of D-TD-CRDS compared to AMS and wet-chemical methods
When compared to each other, a number of advantages and disadvantages of the methods outlined in the introduction for measuring particle nitrate (AMS, wet-chemical, D-TD-LIF/CRDS) become apparent. For the AMS, the advantages include widespread use and very large user community, good sensitivity and high time resolution. In principle, the AMS can differentiate between inorganic and organic nitrates although most accurate evaluation of the HR-ToF-AMS data may necessitate prior knowledge of the aerosol composition. The disadvantages of the HR-ToF-AMS include high weight/large size, high instrument costs and complex calibration procedures.
For the wet-chemical systems the main advantages are good sensitivity and accuracy and simple calibration and the simultaneous detection of soluble trace gases such as HNO3, HONO and N2O5. The major disadvantage includes low time resolution (∼ 1 h, which may limit deployment to non-mobile platforms), non-quantitative detection of organic nitrates, high instrument costs and large weight/size.
The advantages of the TD-based systems are their high time-resolution (apart from instruments that collect particles for several minutes on a filter prior to flash volatilisation), reasonable sensitivity, comparably low costs and simple calibration schemes (or no calibration at all for CRDS based detection schemes).
The TD-CRDS instruments described by Garner et al. (2020) and Keehan et al. (2020) have many similarities to that described here and also to its previous version (Friedrich et al., 2020). There are however some significant differences: In order to separate contributions from particluate and gas-phase nitrate to NOY Garner et al. (2020) used a filter to remove particles rather than a denuder to remove the gas-phase. This approach has the potential disadvantage that filters will not only collect particles but also to a variable extent (depending e.g. on ambient humidity, filter age and level of contamination) also trap HNO3 thus potentially biasing the measurement of gas phase NOY to low values and resulting in large memory effects that may hinder measurements at high frequency. While Garner et al. (2020) focussed on inorganic particulate nitrate, Keehan et al. (2020) also examined the response of their TD-CRDS to organic particulate nitrate fromed from reaction of NO3 with various VOCs (including Δ-carene, limonene, α-pinene and β-pinene) in a 400 L chamber and compared results to those obtained using an AMS. Their correlation of TD-CRDS with AMS data shows significantly more scatter that observed in the present experiments and a slope close to 0.9. Keehan et al. (2020) suggest that some of the scatter (i.e. variability in relative sensitivity) may be related to differences in the alkyl-nitrate structures that my alter the sensitivity e.g. of the AMS. As in the present study, Keehan et al. (2020) used an activated carbon denuder to remove gas-phase components of NOY and report time dependent changes in transmission of the denuder. They did not explore the effects of changing relative humidity on their denuder efficiency.
The better transmission of our D-TD-CRDS (compared e.g. to the AMS) for particles of diameter < 70 nm might represent an advantage in situations where a significant fraction of particulate nitrate is associated with small particles. Multi-channel instruments, such as the one described here and by others (Brownwood et al., 2021; Rollins et al., 2010; Lee et al., 2015; Womack et al., 2017) also measure nitrogen containing trace gases either as NOX and NOY or as organic nitrates that enables direct calculation of the gas-to-particulate partitioning of reactive nitrogen in one instrument. The main disadvantage of the D-TD-LIF/CRDS systems is non-separation of organic and inorganic particulate nitrate and (unless the air is dried as described here) the problem of denuder-breakthrough.
Finally, we note that the very good agreement between the HR-ToF-AMS and the D-TD-CRDS observed in this study strongly suggest that the D-TD-CRDS is not only a useful instrument for measuring ambient total particulate nitrate but also represents a further possibility to calibrate a HR-ToF-AMS for both organic and inorganic nitrate aerosol.
A denuded, thermal dissociation, cavity-ring-down spectrometer (D-TD-CRDS) has been developed to enable accurate determination of particulate nitrate concentrations. By deploying a combination of Nafion tube, and molecular-sieve based aerosol driers in front of an active-carbon, honeycomb denuder we ensure that gas-phase NOY is quantitatively removed and that denuder memory effects and breakthrough are avoided, while maintaining very high transmission of particles. The D-TD-CRDS measurement of particulate nitrate has a limit of detection (1 min) of ∼ 0.035 µg m−3 under laboratory conditions, worsening to 0.085 µg m−3 when deployed in a less favourable environment. The associated uncertainty is estimated to be < 15 %. The D-TD-CRDS was compared to an aerosol mass spectrometer (HR-ToF-AMS) in laboratory studies in which either inorganic nitrate (NH4NO3) or organic nitrate particles (OP-Nit, derived from the NO3 initiated oxidation of limonene) were sampled by both instruments. The slopes of correlation plots were 0.95 ± 0.02 for NH4NO3 and 1.08 ± 0.09 for OP-Nit. The deviations from unity are well within the combined uncertainties of the two instruments, which largely result from the AMS calibration uncertainty.
The data underlying Figs. 2–6 are available via https://doi.org/10.17617/3.TP76K3 (Crowley, 2026).
The supplement related to this article is available online at https://doi.org/10.5194/amt-19-3445-2026-supplement.
D-TD-CRDS modification: TS, JS. D-TD-CRDS laboratory tests: PD, TS, JC. AMS operation and SCHARK experiments: PD, FD, FF, TH, LW. Manuscript draft: JC, PD (with contributions from all authors in the final version).
The contact author has declared that none of the authors has any competing interests.
Publisher's note: Copernicus Publications remains neutral with regard to jurisdictional claims made in the text, published maps, institutional affiliations, or any other geographical representation in this paper. The authors bear the ultimate responsibility for providing appropriate place names. Views expressed in the text are those of the authors and do not necessarily reflect the views of the publisher.
We thank Ezra Wood for providing us with the activated-carbon denuder and Chemours for the provision of the FEP sample (FEPD 121) used to coat the cavity walls of the CRDS. The heat-gun based set-up for drying molecular sieve during field deployment was developed by Berthold Friederich at the Institute for Physics of the Atmosphere at the Johannes Gutenberg University Mainz.
This research has been supported by the Deutsche Forschungsgemeinschaft (MONOTONS (grant no. 522970430)).
The article processing charges for this open-access publication were covered by the Max Planck Society.
This paper was edited by Hans Osthoff and reviewed by two anonymous referees.
Andersen, S. T., Carpenter, L. J., Reed, C., Lee, J. D., Chance, R., Sherwen, T., Vaughan, A. R., Stewart, J., Edwards, P. M., Bloss, W. J., Sommariva, R., Crilley, L. R., Nott, G. J., Neves, L., Read, K., Heard, D. E., Seakins, P. W., Whalley, L. K., Boustead, G. A., Fleming, L. T., Stone, D., and Fomba, K. W.: Extensive field evidence for the release of HONO from the photolysis of nitrate aerosols, Science Advances, 9, eadd6266, https://doi.org/10.1126/sciadv.add6266, 2023.
Brownwood, B., Turdziladze, A., Hohaus, T., Wu, R., Mentel, T. F., Carlsson, P. T. M., Tsiligiannis, E., Hallquist, M., Andres, S., Hantschke, L., Reimer, D., Rohrer, F., Tillmann, R., Winter, B., Liebmann, J., Brown, S. S., Kiendler-Scharr, A., Novelli, A., Fuchs, H., and Fry, J. L.: Gas-particle partitioning and SOA yields of organonitrate products from NO3-initiated oxidation of isoprene under varied chemical regimes, ACS Earth Space Chem., 5, 785–800, https://doi.org/10.1021/acsearthspacechem.0c00311, 2021.
Canagaratna, M. R., Jayne, J. T., Jimenez, J. L., Allan, J. D., Alfarra, M. R., Zhang, Q., Onasch, T. B., Drewnick, F., Coe, H., Middlebrook, A., Delia, A., Williams, L. R., Trimborn, A. M., Northway, M. J., DeCarlo, P. F., Kolb, C. E., Davidovits, P., and Worsnop, D. R.: Chemical and microphysical characterization of ambient aerosols with the aerodyne aerosol mass spectrometer, Mass Spectrom. Rev., 26, 185–222, https://doi.org/10.1002/mas.20115, 2007.
Crowley, J.: Data from Figures in Dewald et al. (Particle nitrate measurement using a thermal-dissociation, cavity-ringdown-spectrometer with gas-phase denuder (D-TD-CRDS)), Version V1, Edmond [data set], https://doi.org/10.17617/3.TP76K3, 2026.
Crowley, J. N., Burrows, J. P., Moortgat, G. K., Poulet, G., and LeBras, G.: Optical detection of NO3 and NO2 in “pure” HNO3 vapor, the liquid-phase decomposition of HNO3, Int. J. Chem. Kinet., 25, 795–803, 1993.
Day, D. A., Campuzano-Jost, P., Nault, B. A., Palm, B. B., Hu, W., Guo, H., Wooldridge, P. J., Cohen, R. C., Docherty, K. S., Huffman, J. A., de Sá, S. S., Martin, S. T., and Jimenez, J. L.: A systematic re-evaluation of methods for quantification of bulk particle-phase organic nitrates using real-time aerosol mass spectrometry, Atmos. Meas. Tech., 15, 459–483, https://doi.org/10.5194/amt-15-459-2022, 2022.
DeCarlo, P. F., Kimmel, J. R., Trimborn, A., Northway, M. J., Jayne, J. T., Aiken, A. C., Gonin, M., Fuhrer, K., Horvath, T., Docherty, K. S., Worsnop, D. R., and Jimenez, J. L.: Field-deployable, high-resolution, time-of-flight aerosol mass spectrometer, Anal. Chem., 78, 8281–8289, https://doi.org/10.1021/ac061249n, 2006.
Dewald, P., Dörich, R., Schuladen, J., Lelieveld, J., and Crowley, J. N.: Impact of ozone and inlet design on the quantification of isoprene-derived organic nitrates by thermal dissociation cavity ring-down spectroscopy (TD-CRDS), Atmos. Meas. Tech., 14, 5501–5519, https://doi.org/10.5194/amt-14-5501-2021, 2021.
Drewnick, F., Hings, S. S., DeCarlo, P., Jayne, J. T., Gonin, M., Fuhrer, K., Weimer, S., Jimenez, J. L., Demerjian, K. L., Borrmann, S., and Worsnop, D. R.: A new Time-Of-Flight Aerosol Mass Spectrometer (TOF-AMS) – Instrument description and first field Deployment, Aerosol Sci. Technol., 39, 637–658, https://doi.org/10.1080/02786820500182040, 2005.
Farmer, D. K., Matsunaga, A., Docherty, K. S., Surratt, J. D., Seinfeld, J. H., Ziemann, P. J., and Jimenez, J. L.: Response of an aerosol mass spectrometer to organonitrates and organosulfates and implications for atmospheric chemistry, P. Natl. Acad. Sci. USA, 107, 6670–6675, https://doi.org/10.1073/pnas.0912340107, 2010.
Friedrich, N., Tadic, I., Schuladen, J., Brooks, J., Darbyshire, E., Drewnick, F., Fischer, H., Lelieveld, J., and Crowley, J. N.: Measurement of NOx and NOy with a thermal dissociation cavity ring-down spectrometer (TD-CRDS): instrument characterisation and first deployment, Atmos. Meas. Tech., 13, 5739–5761, https://doi.org/10.5194/amt-13-5739-2020, 2020.
Fry, J. L., Draper, D. C., Zarzana, K. J., Campuzano-Jost, P., Day, D. A., Jimenez, J. L., Brown, S. S., Cohen, R. C., Kaser, L., Hansel, A., Cappellin, L., Karl, T., Hodzic Roux, A., Turnipseed, A., Cantrell, C., Lefer, B. L., and Grossberg, N.: Observations of gas- and aerosol-phase organic nitrates at BEACHON-RoMBAS 2011, Atmos. Chem. Phys., 13, 8585–8605, https://doi.org/10.5194/acp-13-8585-2013, 2013.
Garner, N. M., Matchett, L. C., and Osthoff, H. D.: Quantification of Non-refractory Aerosol Nitrate in Ambient Air by Thermal Dissociation Cavity Ring-Down Spectroscopy, Environ. Sci. Technol., 54, 9854–9861, https://doi.org/10.1021/acs.est.0c01156, 2020.
Glänzer, K. and Troe, J.: Thermal decomposition of nitrocompounds in shock waves. IV: decomposition of nitric acid, Berichte der Bunsengesellschaft für physikalische Chemie, 78, 71–76, https://doi.org/10.1002/bbpc.19740780112, 1974.
Hang, Y., Meng, X., Li, T., Wang, T., Cao, J., Fu, Q., Dey, S., Li, S., Huang, K., Liang, F., Kan, H., Shi, X., and Liu, Y.: Assessment of long-term particulate nitrate air pollution and its health risk in China, iScience, 25, 104899, https://doi.org/10.1016/j.isci.2022.104899, 2022.
Hogrefe, O., Schwab, J. J., Drewnick, F., Lala, G. G., Peters, S., Demerjian, K. L., Rhoads, K., Felton, H. D., Rattigan, O. V., Husain, L., and Dutkiewicz, V. A.: Semicontinuous PM2.5 Sulfate and Nitrate Measurements at an Urban and a Rural Location in New York: PMTACS-NY Summer 2001 and 2002 Campaigns, J. Air Waste Manage. Assoc., 54, 1040–1060, https://doi.org/10.1080/10473289.2004.10470972, 2004.
Huang, W., Saathoff, H., Shen, X., Ramisetty, R., Leisner, T., and Mohr, C.: Chemical characterization of highly functionalized organonitrates contributing to night-time organic aerosol mass loadings and particle growth, Environ. Sci. Technol., 53, 1165–1174, https://doi.org/10.1021/acs.est.8b05826, 2019.
Jimenez, J. L., Jayne, J. T., Shi, Q., Kolb, C. E., Worsnop, D. R., Yourshaw, I., Seinfeld, J. H., Flagan, R. C., Zhang, X., Smith, K. A., Morris, J. W., and Davidovits, P.: Ambient aerosol sampling using the Aerodyne Aerosol Mass Spectrometer, J. Geophy. Res.-Atmos., 108, https://doi.org/10.1029/2001JD001213, 2003.
Keehan, N. I., Brownwood, B., Marsavin, A., Day, D. A., and Fry, J. L.: A thermal-dissociation–cavity ring-down spectrometer (TD-CRDS) for the detection of organic nitrates in gas and particle phases, Atmos. Meas. Tech., 13, 6255–6269, https://doi.org/10.5194/amt-13-6255-2020, 2020.
Khlystov, A., Wyers, G., and Slanina, J.: The steam-jet aerosol collector, Atmos. Environ., 29, 2229–2234, 1995.
Kiendler-Scharr, A., Mensah, A. A., Friese, E., Topping, D., Nemitz, E., Prevot, A. S. H., Aijala, M., Allan, J., Canonaco, F., Canagaratna, M., Carbone, S., Crippa, M., Dall Osto, M., Day, D. A., De Carlo, P., Di Marco, C. F., Elbern, H., Eriksson, A., Freney, E., Hao, L., Herrmann, H., Hildebrandt, L., Hillamo, R., Jimenez, J. L., Laaksonen, A., McFiggans, G., Mohr, C., O'Dowd, C., Otjes, R., Ovadnevaite, J., Pandis, S. N., Poulain, L., Schlag, P., Sellegri, K., Swietlicki, E., Tiitta, P., Vermeulen, A., Wahner, A., Worsnop, D., and Wu, H. C.: Ubiquity of organic nitrates from nighttime chemistry in the European submicron aerosol, Geophys. Res. Lett., 43, 7735–7744, https://doi.org/10.1002/2016GL069239, 2016.
Lee, B. H., Mohr, C., Lopez-Hilfiker, F. D., Lutz, A., Hallquist, M., Lee, L., Romer, P., Cohen, R. C., Iyer, S., Kurten, T., Hu, W. W., Day, D. A., Campuzano-Jost, P., Jimenez, J. L., Xu, L., Ng, N. L., Guo, H. Y., Weber, R. J., Wild, R. J., Brown, S. S., Koss, A., de Gouw, J., Olson, K., Goldstein, A. H., Seco, R., Kim, S., McAvey, K., Shepson, P. B., Starn, T., Baumann, K., Edgerton, E. S., Liu, J. M., Shilling, J. E., Miller, D. O., Brune, W., Schobesberger, S., D'Ambro, E. L., and Thornton, J. A.: Highly functionalized organic nitrates in the southeast United States: Contribution to secondary organic aerosol and reactive nitrogen budgets, P. Natl. Acad. Sci. USA, 113, 1516–1521, https://doi.org/10.1073/pnas.1508108113, 2016.
Lee, L., Wooldridge, P. J., deGouw, J., Brown, S. S., Bates, T. S., Quinn, P. K., and Cohen, R. C.: Particulate organic nitrates observed in an oil and natural gas production region during wintertime, Atmos. Chem. Phys., 15, 9313–9325, https://doi.org/10.5194/acp-15-9313-2015, 2015.
Lelieveld, J., Evans, J. S., Fnais, M., Giannadaki, D., and Pozzer, A.: The contribution of outdoor air pollution sources to premature mortality on a global scale, Nature, 525, 367–371, https://doi.org/10.1038/nature15371, 2015.
Liu, P. S. K., Deng, R., Smith, K. A., Williams, L. R., Jayne, J. T., Canagaratna, M. R., Moore, K., Onasch, T. B., Worsnop, D. R., and Deshler, T.: Transmission Efficiency of an Aerodynamic Focusing Lens System: Comparison of Model Calculations and Laboratory Measurements for the Aerodyne Aerosol Mass Spectrometer, Aerosol Sci. Tech., 41, 721–733, https://doi.org/10.1080/02786820701422278, 2007.
Palm, B. B., Campuzano-Jost, P., Day, D. A., Ortega, A. M., Fry, J. L., Brown, S. S., Zarzana, K. J., Dube, W., Wagner, N. L., Draper, D. C., Kaser, L., Jud, W., Karl, T., Hansel, A., Gutiérrez-Montes, C., and Jimenez, J. L.: Secondary organic aerosol formation from in situ OH, O3, and NO3 oxidation of ambient forest air in an oxidation flow reactor, Atmos. Chem. Phys., 17, 5331–5354, https://doi.org/10.5194/acp-17-5331-2017, 2017.
Phillips, G. J., Makkonen, U., Schuster, G., Sobanski, N., Hakola, H., and Crowley, J. N.: The detection of nocturnal N2O5 as HNO3 by alkali- and aqueous-denuder techniques, Atmos. Meas. Tech., 6, 231–237, https://doi.org/10.5194/amt-6-231-2013, 2013.
Pozzer, A., Anenberg, S. C., Dey, S., Haines, A., Lelieveld, J., and Chowdhury, S.: Mortality attributable to ambient air pollution: A review of global estimates, GeoHealth, 7, e2022GH000711, https://doi.org/10.1029/2022GH000711, 2023.
Rollins, A. W., Smith, J. D., Wilson, K. R., and Cohen, R. C.: Real Time In Situ Detection of Organic Nitrates in Atmospheric Aerosols, Environ. Sci. Technol., 44, 5540–5545, https://doi.org/10.1021/es100926x, 2010.
Rollins, A. W., Browne, E. C., Min, K.-E., Pusede, S. E., Wooldridge, P. J., Gentner, D. R., Goldstein, A. H., Liu, S., Day, D. A., Russell, L. M., and Cohen, R. C.: Evidence for NOx control over nighttime SOA formation, Science, 337, 1210–1212, 2012.
Seinfeld, J. H.: Atmospheric chemistry and physics of air pollution, John Wiley and Sons, ISBN 978-0471828570, 1986.
Stolzenburg, M. R. and Hering, S. V.: Method for the automated measurement of fine particle nitrate in the atmosphere, Environ. Sci. Technol., 34, 907–914, https://doi.org/10.1021/es990956d, 2000.
Thieser, J., Schuster, G., Schuladen, J., Phillips, G. J., Reiffs, A., Parchatka, U., Pöhler, D., Lelieveld, J., and Crowley, J. N.: A two-channel thermal dissociation cavity ring-down spectrometer for the detection of ambient NO2, RO2NO2 and RONO2, Atmos. Meas. Tech., 9, 553–576, https://doi.org/10.5194/amt-9-553-2016, 2016.
Twigg, M. M., Di Marco, C. F., McGhee, E. A., Braban, C. F., Nemitz, E., Brown, R. J. C., Blakley, K. C., Leeson, S. R., Sanocka, A., Green, D. C., Priestman, M., Riffault, V., Bourin, A., Minguillón, M. C., Via, M., Ovadnevaite, J., Ceburnis, D., O'Dowd, C., Poulain, L., Stieger, B., Makkonen, U., Rumsey, I. C., Beachley, G., Walker, J. T., and Butterfield, D. M.: The potential of high temporal resolution automatic measurements of PM2.5 composition as an alternative to the filter-based manual method used in routine monitoring, Atmos. Environ., 315, 120148, https://doi.org/10.1016/j.atmosenv.2023.120148, 2023.
von der Weiden, S.-L., Drewnick, F., and Borrmann, S.: Particle Loss Calculator – a new software tool for the assessment of the performance of aerosol inlet systems, Atmos. Meas. Tech., 2, 479–494, https://doi.org/10.5194/amt-2-479-2009, 2009.
Weber, R., Orsini, D., Daun, Y., Lee, Y.-N., Klotz, P., and Brechtel, F.: A particle-into-liquid collector for rapid measurement of aerosol bulk chemical composition, Aerosol Sci. Tech., 35, 718–727, 2001.
Wild, R. J., Edwards, P. M., Bates, T. S., Cohen, R. C., de Gouw, J. A., Dubé, W. P., Gilman, J. B., Holloway, J., Kercher, J., Koss, A. R., Lee, L., Lerner, B. M., McLaren, R., Quinn, P. K., Roberts, J. M., Stutz, J., Thornton, J. A., Veres, P. R., Warneke, C., Williams, E., Young, C. J., Yuan, B., Zarzana, K. J., and Brown, S. S.: Reactive nitrogen partitioning and its relationship to winter ozone events in Utah, Atmos. Chem. Phys., 16, 573–583, https://doi.org/10.5194/acp-16-573-2016, 2016.
Womack, C. C., Neuman, J. A., Veres, P. R., Eilerman, S. J., Brock, C. A., Decker, Z. C. J., Zarzana, K. J., Dube, W. P., Wild, R. J., Wooldridge, P. J., Cohen, R. C., and Brown, S. S.: Evaluation of the accuracy of thermal dissociation CRDS and LIF techniques for atmospheric measurement of reactive nitrogen species, Atmos. Meas. Tech., 10, 1911–1926, https://doi.org/10.5194/amt-10-1911-2017, 2017.
Wüst, L., Dewald, P., Türk, G. N. T. E., Lelieveld, J., and Crowley, J. N.: Influence of ambient NO and NO2 on the quantification of total peroxy nitrates (ΣPNs) and total alkyl nitrates (ΣANs) by thermal dissociation cavity ring-down spectroscopy (TD-CRDS), Atmos. Meas. Tech., 18, 1943–1959, https://doi.org/10.5194/amt-18-1943-2025, 2025.
Xu, L., Suresh, S., Guo, H., Weber, R. J., and Ng, N. L.: Aerosol characterization over the southeastern United States using high-resolution aerosol mass spectrometry: spatial and seasonal variation of aerosol composition and sources with a focus on organic nitrates, Atmos. Chem. Phys., 15, 7307–7336, https://doi.org/10.5194/acp-15-7307-2015, 2015.