the Creative Commons Attribution 4.0 License.
the Creative Commons Attribution 4.0 License.
 | 30 Jun 2026
Monitoring of lower thermospheric neutral density variations using meteor head echoes
Devin Huyghebaert
Juha Vierinen
Björn Gustavsson
Ralph Latteck
Toralf Renkwitz
Marius Zecha
Claudia C. Stephan
J. Federico Conte
Daniel Kastinen
Johan Kero
Jorge L. Chau
Observations of neutral density in the mesosphere and lower thermosphere (MLT) region of the terrestrial atmosphere are important for understanding lower atmospheric, geomagnetic, and anthropogenic forcing. This study introduces a statistical method for measuring neutral density variations using an extensive dataset of meteor head echoes that were observed using the MAARSY high-power large-aperture (HPLA) mesosphere–stratosphere–troposphere (MST) radar. The method relies on observing the mean geocentric velocity of meteor head echoes as a function of initial detection altitude and day-of-year. The meteor head echo catalog used contains 1.4 million meteor head echoes between 2016–2023. Neutral density variations are observed with a 6 d time and 2 km altitude resolution between 85–115 km. The measurements show variations in neutral density potentially due to geomagnetic and atmospheric events. Variations of up to 20 % are common in the dataset, and agree with the magnitude of atmospheric neutral density fluctuations from an Upper-Atmosphere ICOsahedral Non-hydrostatic (UA-ICON) atmosphere model run.
- Article
(5630 KB) - Full-text XML
- BibTeX
- EndNote


Neutral density in the high latitude mesosphere and lower thermosphere (MLT) region is influenced by forcing from above and below and can act as a tracer for different geophysical phenomena. From above, the forcing is in the form of direct solar heating as well as Joule heating due to auroral currents that close in the E-region ionosphere. The lower atmospheric forcings include phenomena related to gravity waves, planetary waves, and atmospheric tides. The MLT region is of particular significance for space weather, where variations in the neutral density can serve as indicators of, and will result in, variations in satellite drag and the atmospheric entry dynamics of spacecraft, space debris, and meteors. Small variations in the neutral density at the base of the thermosphere can correspond to large density perturbations at higher altitudes (e.g., Doornbos, 2012).
In this study we focus on the measurement of neutral density variations between years in the MLT. Previous researchers have used techniques involving specular meteor radars (Stober et al., 2012, 2014; Younger et al., 2015; Yi et al., 2018; Dawkins et al., 2024), high-power large-aperture (HPLA) meteor head echoes (Li and Close, 2016; Limonta et al., 2020), and incoherent scatter radars (Günzkofer et al., 2023; Thomas et al., 2024) for MLT neutral density measurements. Here we provide a brief overview of the previous meteor measurement strategies for inferring details about the neutral density of the MLT region.
The monitoring of neutral density with meteor radars can be effectively separated into two categories based on the measurement technique. The two categories are as follows: radio scattering from the relatively stationary meteor trail and radio scattering from the fast-moving, localized meteor head plasma. The scattering from meteor trails require the line of sight vector to be approximately perpendicular to the meteor trail, providing a large radar cross-section and thereby allowing wide field-of-view measurements with relatively low power radar systems. Studies investigating height variations of the meteor trail and relating these variations to the neutral density can be found in Stober et al. (2012, 2014), Younger et al. (2015), and Dawkins et al. (2024). With this technique the height variations are determined as an average quantity with a neutral density isocontour assumed to follow this altitude variation. This provides a general overview of atmospheric neutral density variations, but provides minimal information about differences between altitudes for the same time.
There is another type of meteor scatter that can occur, specifically the range-spread trail echo, also referred to as the non-specular trail. This type of meteor trail detection is from radio wave scattering from plasma turbulence generated during the diffusion of the meteor trail and does not require perpendicularity of the radar signal with the trail (Dyrud et al., 2008; Close et al., 2008).
Measurements of the meteor head plasma provide details on the meteor ablation and trajectory, but require HPLA radars to consistently make measurements of microgram sized ablating meteoroids, which greatly increases the number of meteor head echo detections (e.g., Chau and Woodman, 2004; Chau et al., 2007). The meteor head echo is the process of scattering a radar signal from the dense plasma in the immediate surroundings of an ablating meteoroid. This dense region of plasma rapidly expands and diffuses. By tracking the region of dense plasma, we are thereby able to track the meteoroid. The corresponding radar cross-section can be used to derive bulk densities and mass estimates of meteoroids (e.g., Close et al., 2012). HPLA meteor head echo measurements can also be used to determine the deceleration of the meteor for a given altitude (Li and Close, 2016; Limonta et al., 2020). This deceleration can be used with the scattering cross-section of the meteor and an accurate ablation model to estimate the neutral atmospheric density. There are some difficulties with this approach, including a list of assumptions and constraints on the fitting parameters provided in Limonta et al. (2020). Reported results compare relatively well with the MSIS neutral density model (Picone et al., 2002) and can provide an altitude profile of the neutral atmospheric density.
We present a novel way of investigating the neutral density variations between years of the MLT region using HPLA meteor head echo measurements. This method is only possible due to the extensive dataset of meteor head echo measurements analyzed with the Middle Atmosphere Alomar Radar System (MAARSY) mesosphere–stratosphere–troposphere (MST) radar (Latteck et al., 2012). The analysis uses the three-dimensional trajectory and geocentric velocity of each meteor to determine relationships between the geocentric velocity, initial radar detection altitude, and time of year of the meteors between multiple years. Details on the dataset and potential uses are provided in the following sections.
MAARSY is a MST radar located on the island of Andøya, Norway (69.30° N, 16.04° E), and operates at 53.5 MHz (Latteck et al., 2012). The radar has a maximum peak power output of 433 × 2 kW and consists of 433 three-element crossed-Yagi antennas with 16 receiver channels. The system transmits a left circularly polarized signal, and receives a right circularly polarized signal. Meteor head echoes have been shown previously to have approximately equal SNR for both right and left circularly polarized signals on reception with a right circularly polarized transmit signal (Close et al., 2011). The MAARSY receiver channels can be used to determine the three-dimensional trajectory of meteoroids as they ablate in the terrestrial atmosphere through interferometry (Schult et al., 2013). In this study an analysis similar to that of Schult et al. (2013) has been used for the detection and analysis of the meteor head echoes measured by MAARSY.
Meteor head plasma is different from the meteor trail plasma in that it is confined and very short-lived and corresponds to the relatively high plasma density directly in the vicinity of the meteoroid as it ablates. By tracking the meteor head plasma with a radar it is possible to determine the velocity of the meteoroid. No perpendicularity condition to the trail is required for the head echo measurements, but a much larger radar aperture is usually required to observe the head echo due to the small target size of the dense plasma region surrounding the meteoroid.
The MAARSY radar has been previously used by Schult et al. (2017, 2018) for meteor head echo surveys. In the present study we have processed and use meteor head echo measurements from 2016–2023 with MAARSY to investigate variations in the neutral density of the MLT region between years for the same day of year (DOY). A novel result is that we are able to obtain details on the neutral density variations as a function of altitude. Over 1.4 million good quality meteor head echo detections are included in this study. Note that different studies have investigated the height of meteor trails and meteor head echoes in the past, but to the authors knowledge this is the first dataset spanning 5+ years of consistent meteor head echo measurements. This allows comparisons between the years to be made regarding the meteor ablation altitudes and meteor geocentric velocities.
The meteor head echo initial detection altitude is determined by several different factors: geocentric velocity, entry angle and position with respect to the radar beam, meteoroid composition and size, and atmospheric density (Vondrak et al., 2008). Two factors that we focus on are geocentric velocity vg and atmospheric density ρa, which affect the ablation-rate based on the equation (Vondrak et al., 2008),
where m is the mass of the meteor, R is the radius of the particle, vg is the velocity of the particle, ρa is the mass density of the atmosphere, Λ is the “free molecular heat transfer coefficient”, ϵ is the emissivity coefficient, σ is the Stefan-Boltzmann constant, T and Tenv are the temperatures of the surface of the meteoroid and the atmospheric temperature, ρm is the mass density of the particle, C is the specific heat, and L is the latent heat of vaporization. In the current dataset, we only consider meteor head echo detections with entry angles that are between a zenith pointing direction of 0 and 86°. Therefore atmosphere grazing meteoroids are neglected in the analysis.
Following Dimant and Oppenheim (2017a, b) and Sugar et al. (2018), we assume that the majority of the ionization produced in the ablation process is attributable to the meteoric material. The meteoroid geocentric velocity and the neutral atmospheric density are identified as the principal factors influencing changes to the ablation rate and plasma density between years for the same DOY for a statistical population of meteors. A higher ablation rate will produce a larger plasma density, which then produces a larger radar cross-section. This means that meteoroids with higher velocity are, on average, detected at higher altitudes, and that an increase in atmospheric neutral density will result in the detection of meteor head echoes at a higher altitude. This effect can be seen in Fig. 1 as a correlation between initial detection height and vg.
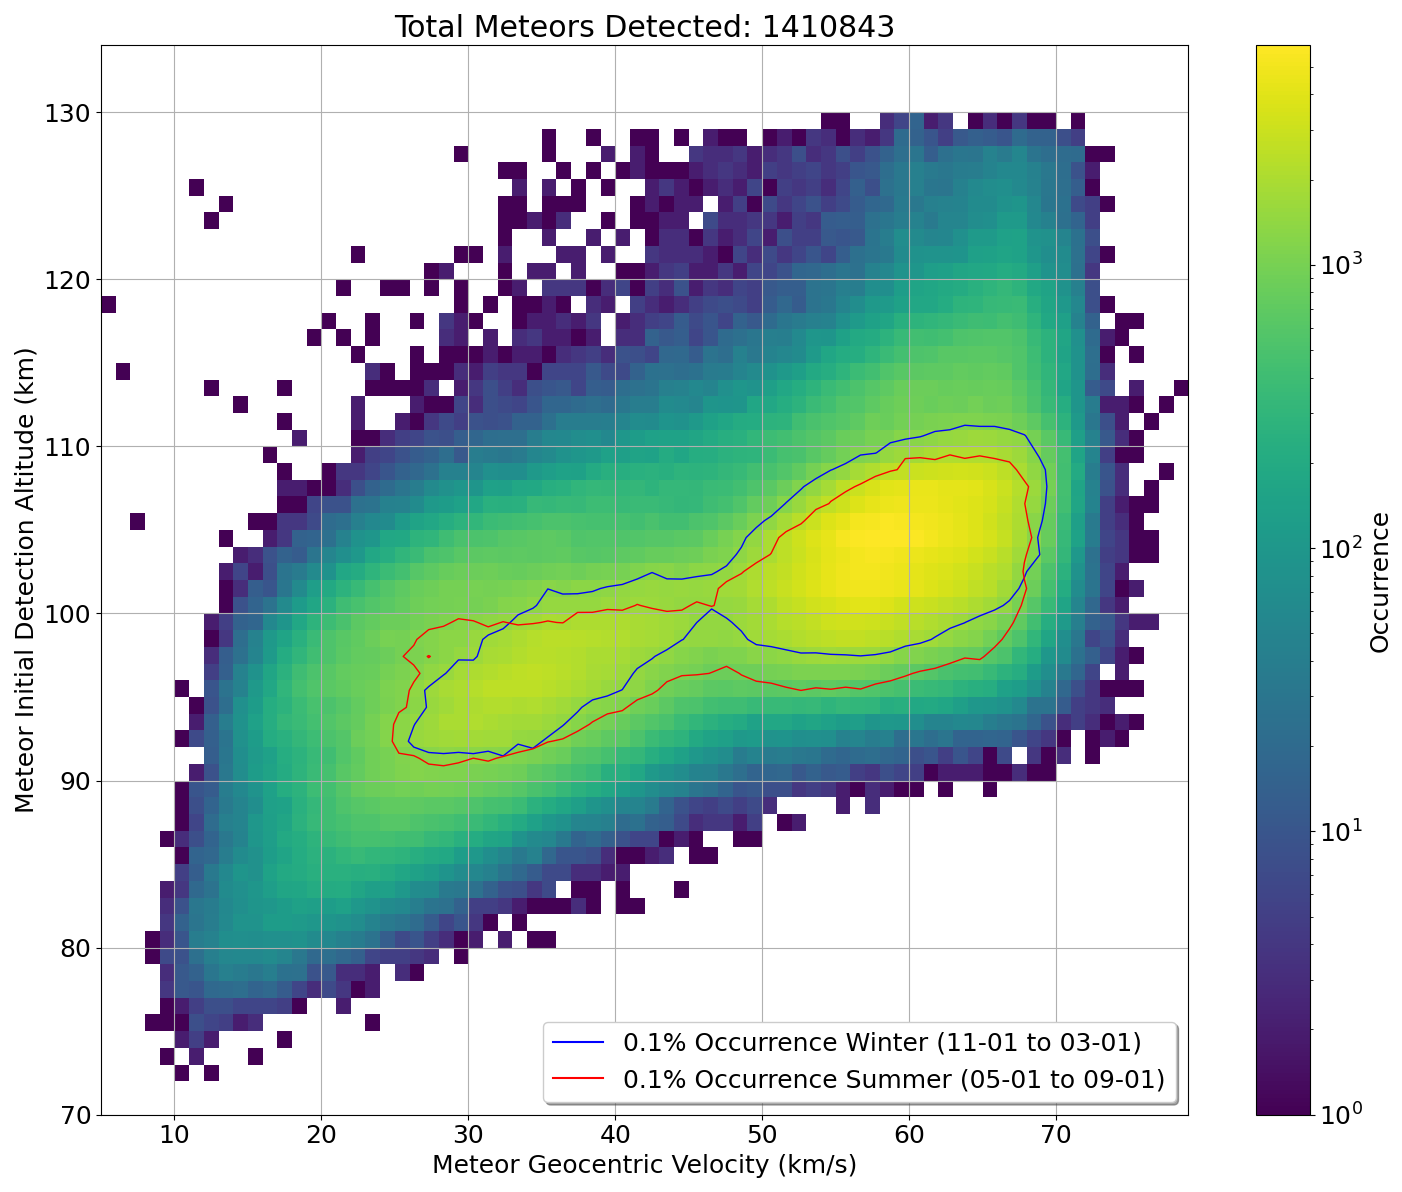
Figure 1Histograms of the total meteor population as a function of initial detection altitude and geocentric velocity. An occurrence ratio contour of 0.1 % of the total meteor count is included for the summer (red) and winter (blue) meteor distributions. The seasonal occurrence ratio plotted shows a difference in meteor counts in the summer (1 May to 1 September) and winter (1 November to 1 March). The maximum altitude of detections for this dataset is 130 km.
The ablation of the meteoroid also depends on composition, emissivity, and the thermal state. The the present study, we are assuming that by taking a large enough sampling of the meteoroid population for the same time of year, these terms should be relatively consistent from year to year. If these values are not consistent on a statistical basis, it will add some error to the analysis. It should also be noted that the detection of the meteoroid depends on the full plasma production, and not only the mass loss. Again, this analysis relies on the assumption that the majority of the plasma production is from the mass-loss of the meteoroid (Dimant and Oppenheim, 2017a, b; Sugar et al., 2018). There are also events with differential ablation occurring, which we consider is based on the composition of the meteor and which will also be relatively consistent for the same time of year between years. Due to the many factors in the ablation equations that are not known, we do not aim to estimate the absolute values of the neutral atmospheric density from the observed meteor ablation. Instead, our goal is to determine how the neutral atmospheric density varies between years at scales of several days.
Throughout the year, the radiant distribution of meteors observed by a radar changes, though this variability is highly location dependent (e.g., Janches et al., 2006; Campbell-Brown, 2008; Kero et al., 2012). During the autumn, the Earth's apex sources are at a higher elevation angle, allowing more high-velocity meteors to be observed, whereas during the spring months, much of the apex sources are below the horizon. The apex sources are produced from retrograde orbits of meteoroids, and the sources are at approximately 15° N and 15° S with respect to the Earth's ecliptic plane, in the direction of the Earth's orbital motion. During several time periods throughout the year, there are also meteor showers which are associated with larger meteoroids. These larger meteoroids can be detected at higher altitudes. A few notable showers include the Eta Aquariids (≈ DOY 125 peak) and the Geminids (≈ 347 DOY peak). These factors influence the average detection altitude of a meteor. For this study we assume the meteor input function is relatively constant from year-to-year for the same DOY for the same radar facility. Using the same radar facility with the analysis technique presented here is important, as factors such as signal polarization and radar frequency will have significant influence on the meteor head echo detections. Considering the same DOY, or multi-day interval, allows us to compare the average initial detection altitude from one year to another. The atmospheric density variations are then considered to be responsible for increases or decreases of the initial altitude for a given meteoroid velocity.
It is shown in Fig. 1 and accepted in the community that there is a difference in the distribution of meteors for the summer and winter months at high latitudes (e.g., Sparks and Janches, 2009). This variability is greatly reduced at equatorial latitudes. Meteors with larger geocentric velocities (> 40 km s−1) tend to be detected at lower altitudes in summer than in winter. We do not attempt to separate differences in meteoric input from atmospheric variations as the cause of the change in distributions between seasons, as we do not need to when comparing the same DOY distributions between years. By subtracting the DOY data for each year from a background mean model we can observe variations in the geocentric velocities for the corresponding initial meteor detection altitudes between years.
To confirm that a similar statistical population of meteors is sampled for the same time period between years, the zenith angle and geocentric velocity distributions for the first 6 d of each month are presented in Appendix A. Between the years the zenith angle and geocentric velocity distributions are shown to be relatively consistent, and, based on previous research by e.g., Blaauw et al. (2011), we assume that the meteoroid populations from similar source regions have similar mass and size characteristics for the same time period. With a large enough statistical population of meteoroid detections, we can then assume that, statistically, the characteristics of the meteoroid population are similar for the same time period between years and that changes due to the detection altitude are due to atmospheric effects.
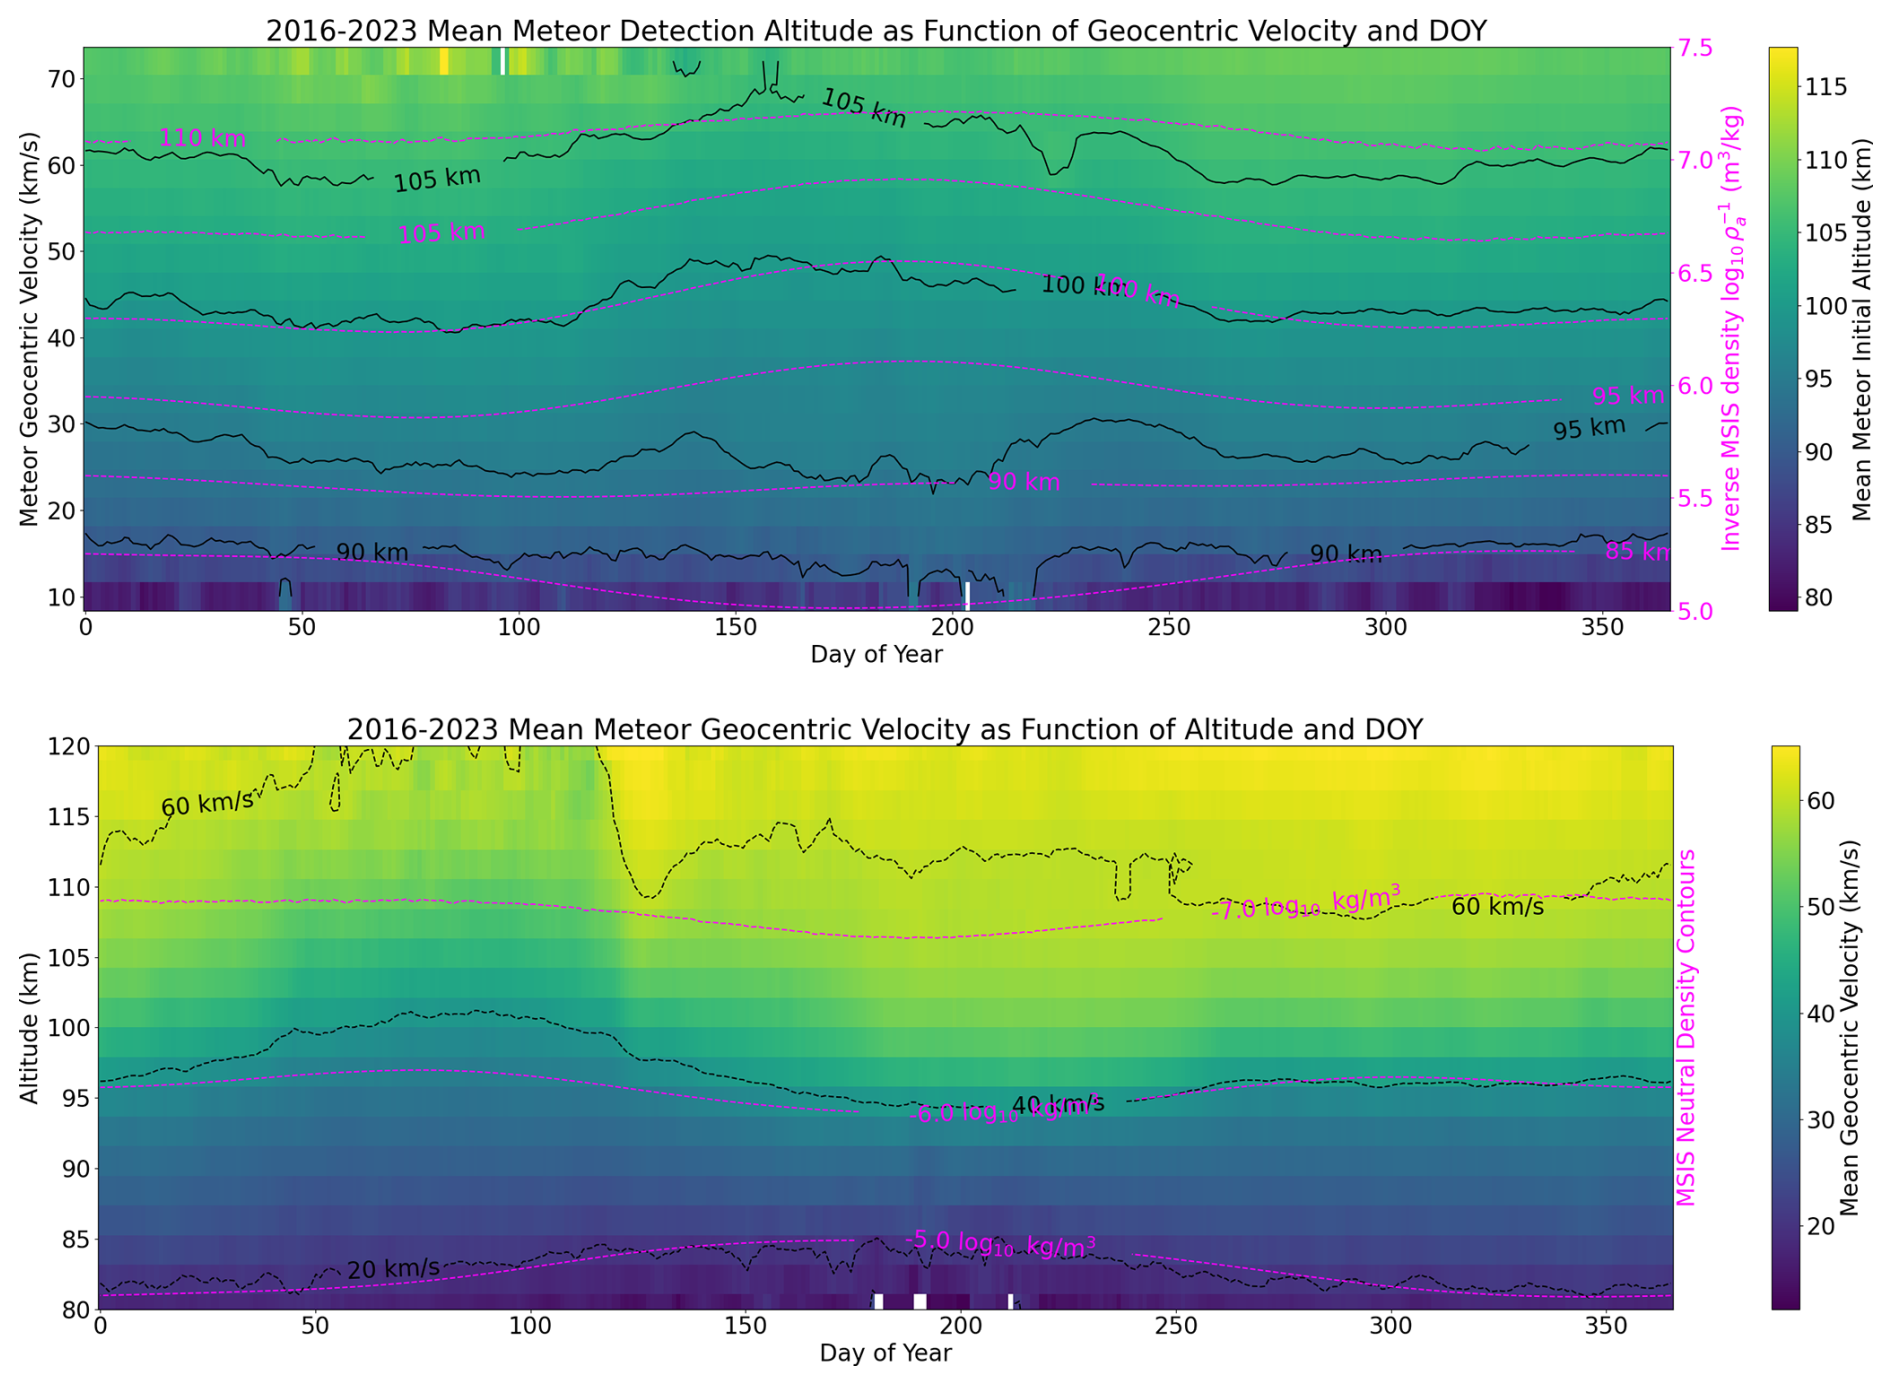
Figure 2Meteor characteristics as a function of the DOY with a 6 d running mean. The mean initial meteor altitude with respect to the meteor geocentric velocity is shown in the top panel, with iso-altitude contours of the inverse density from the MSIS v2.1 model plotted in magenta. The bottom panel shows the mean geocentric velocity of the meteors with respect to the initial detection altitude, with iso-density contours from the MSIS model plotted in magenta.
To further investigate if trends in the meteor ablation characteristics follow trends in the neutral atmospheric density and to create the background empirical model, the meteor head echo measurements were binned and averaged by DOY across the measurement period of 2016–2023. The results are presented in Fig. 2, where the top panel shows the initial detection altitude of the meteors as a function of velocity and DOY, and the bottom panel shows the meteor velocity as a function of initial detection altitude and DOY. Also plotted in the figure are the iso-altitude inverse density contours (top panel) and the iso-density altitude contours (bottom panel) from the Naval Research Laboratory Mass Spectrometer, Incoherent Scatter Radar Extended Model (MSIS) v2.1 atmospheric neutral density model (Picone et al., 2002; Emmert et al., 2021, 2022; Lucas, 2023). The meteor data was smoothed by applying a running 6 d average. We do not expect the meteor ablation characteristics to exactly match the MSIS model, only that there should be similar trends evident in both datasets.
Considering Eq. (1), we simplify that the radar cross-section of a meteor plasma is . The minimum detection radius of a meteor head echo plasma above the critical plasma frequency for MAARSY is ≈ 0.359 m, which can be calculated from the radar equation and assuming a Rayleigh scattering regime. The radar cross-section has been also modeled for determination of the size and mass of the meteoroids by previous researchers (Close et al., 2004; Marshall et al., 2017), though here we only investigate changes to the geocentric velocity and altitude of detection for the bulk population of meteor head echoes detected for the determination of neutral density variations. Details on the MAARSY radar characteristics can be found in Schult et al. (2018). There also will not be a significant effect from the aspect angle of the meteor head echo detections on the detection rate (e.g., Kero et al., 2008).
We expect that there will be a decrease in the initial detection altitude of meteors at a constant velocity for a decrease in neutral atmospheric density. This can be clearly observed in the top panel of Fig. 2 during the summer months, where the MSIS model contours are provided as the inverse of the density. Further, we can observe that the opposite is true for the smaller meteor velocities that reach lower altitudes before achieving a plasma density detectable by the radar. These meteors are detected at higher altitudes in the summer months than in the winter months.
We also provide a different way to illustrate the data in the bottom panel of Fig. 2. Similar trends can be seen as those in the top panel, though bias from some of the meteor shower events are much more evident (e.g., Eta Aquariids in the Spring). These biases based on the seasonality of the data are a reason we only aim to investigate variations in the neutral density between years. By removing the average DOY trends from the initial data we can then investigate variations of the neutral density on time-scales of days. For ease of comparison with atmospheric models, we will use the bottom panel of the background velocity as a function of altitude and investigate changes in the velocity of meteors for a given altitude between years.
The Upper-Atmosphere ICOsahedral Non-hydrostatic (UA-ICON) Model v2.1 (Kunze et al., 2025) is used in the present study to provide a relative magnitude verification of the results obtained. The UA-ICON model run presented here is free-running from initial conditions in 2018 starting from March 1. The horizontal resolution is 20 km and the output is taken from above MAARSY. The solar radiation included in the model is from a monthly mean time series taken as an average over 3 solar cycles. No short term geomagnetic effects are included. The vertical resolution is variable, though it is ≈ 1.5 km in the altitude range of interest.
The meteor geocentric velocity dataset was binned by initial altitude of detection and day with a 6 d moving average. The background model for the DOY meteor velocities shown in the bottom panel of Fig. 2 was then used as the baseline for comparison. To determine the change from the background model that can approximate the corresponding change in neutral density, the following equation was used:
where vbg corresponds to the geocentric velocity from the background model. The cubed geocentric velocity was used to relate the change in velocity to the neutral density for a constant ablation rate based on Eq. (1). Negative variations in velocity therefore correspond to positive changes in neutral density. The results of this analysis are shown in Fig. 3. Some data gaps in the meteor head echo measurements are evident, though there are multiple years of data available for each of the days of the year that go into the background model. Only DOY-altitude bins with more than 20 meteor head echoes detected are included in the output, where the altitude bins are 2 km high. Variations to the data based on the averaging window size chosen for the analysis are provided in Appendix B.
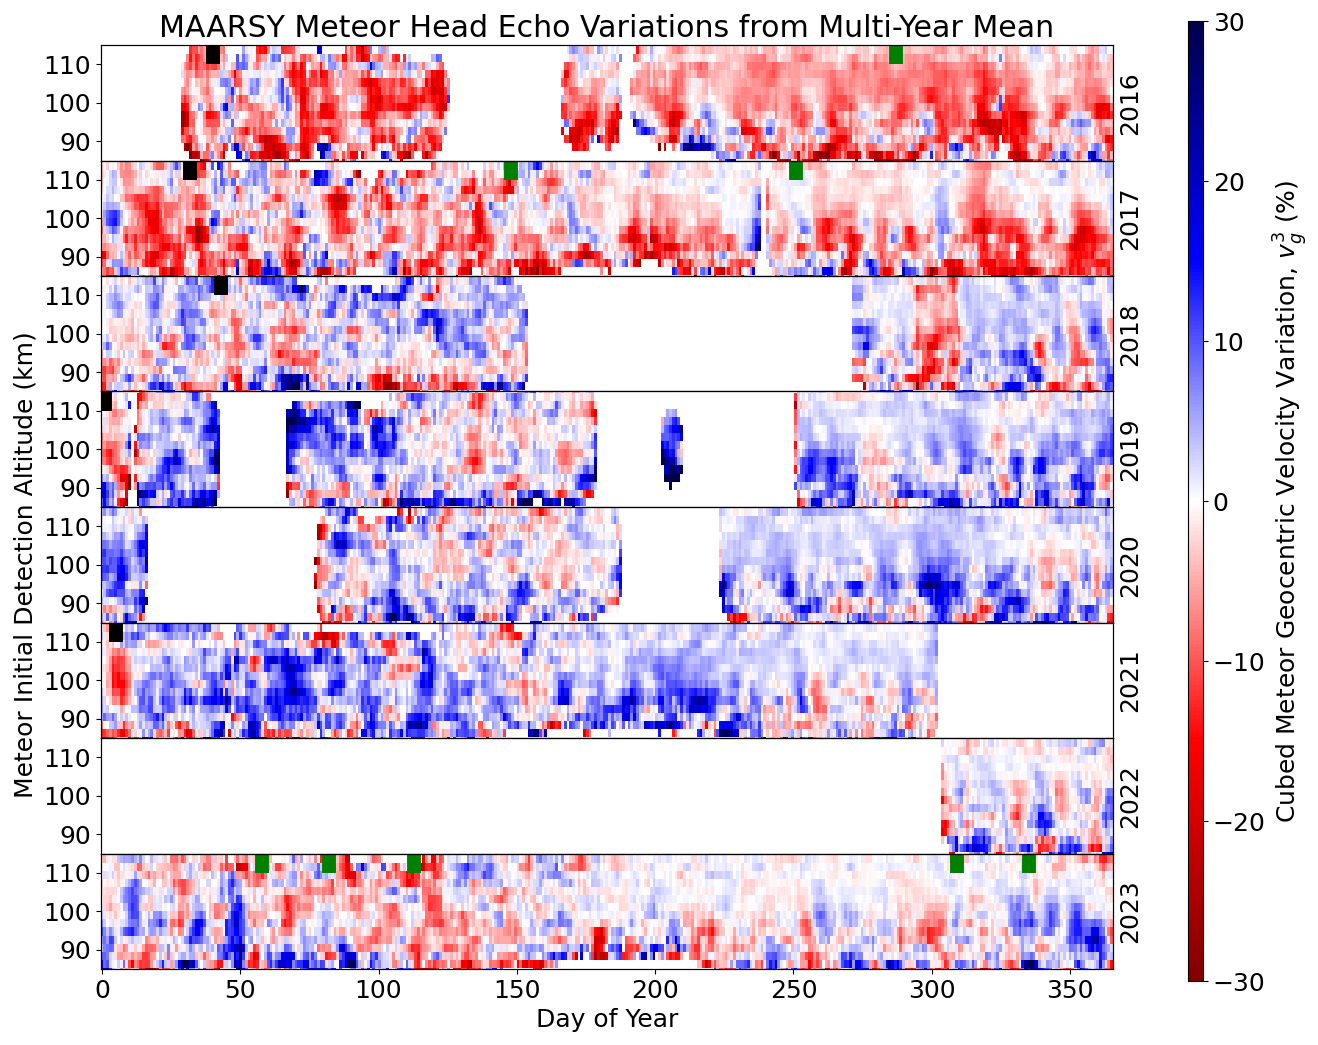
Figure 3The variation between the cubed meteor geocentric velocity for a given initial altitude detection bin with a 6 d moving mean and the cubed average of the meteor geocentric velocity for the same centered DOY across all measurement years (bottom-panel Fig. 2). The results are presented in this manner to approximately correspond to the neutral atmospheric density for a constant ablation rate (Eq. 1). Red corresponds to an increase in the neutral density, while blue corresponds to a decrease. Only data with greater than 20 meteor head echoes detected in the altitude-DOY bin are shown. The black marks at 110–115 km correspond to SSW events and the green marks correspond to geomagnetic storm events with DST < −100 nT.
The majority of cubed velocity variations from the background are between −20 % to 20 %, with some outlier events larger than this. This agrees with well with the NAVGEM-HA model (Navy Global Environmental Model – High Altitude) results presented in Vida et al. (2021), where short term density variability was found to be on the order of ±25 %. To further confirm that these neutral atmospheric density changes between years are realistic, a UA-ICON model (Kunze et al., 2025) run has been examined and shows similar magnitudes of changes in the MLT neutral density values. The output of this UA-ICON model with a similar analysis to that performed on the MAARSY meteor head echo dataset is shown in Fig. 4.
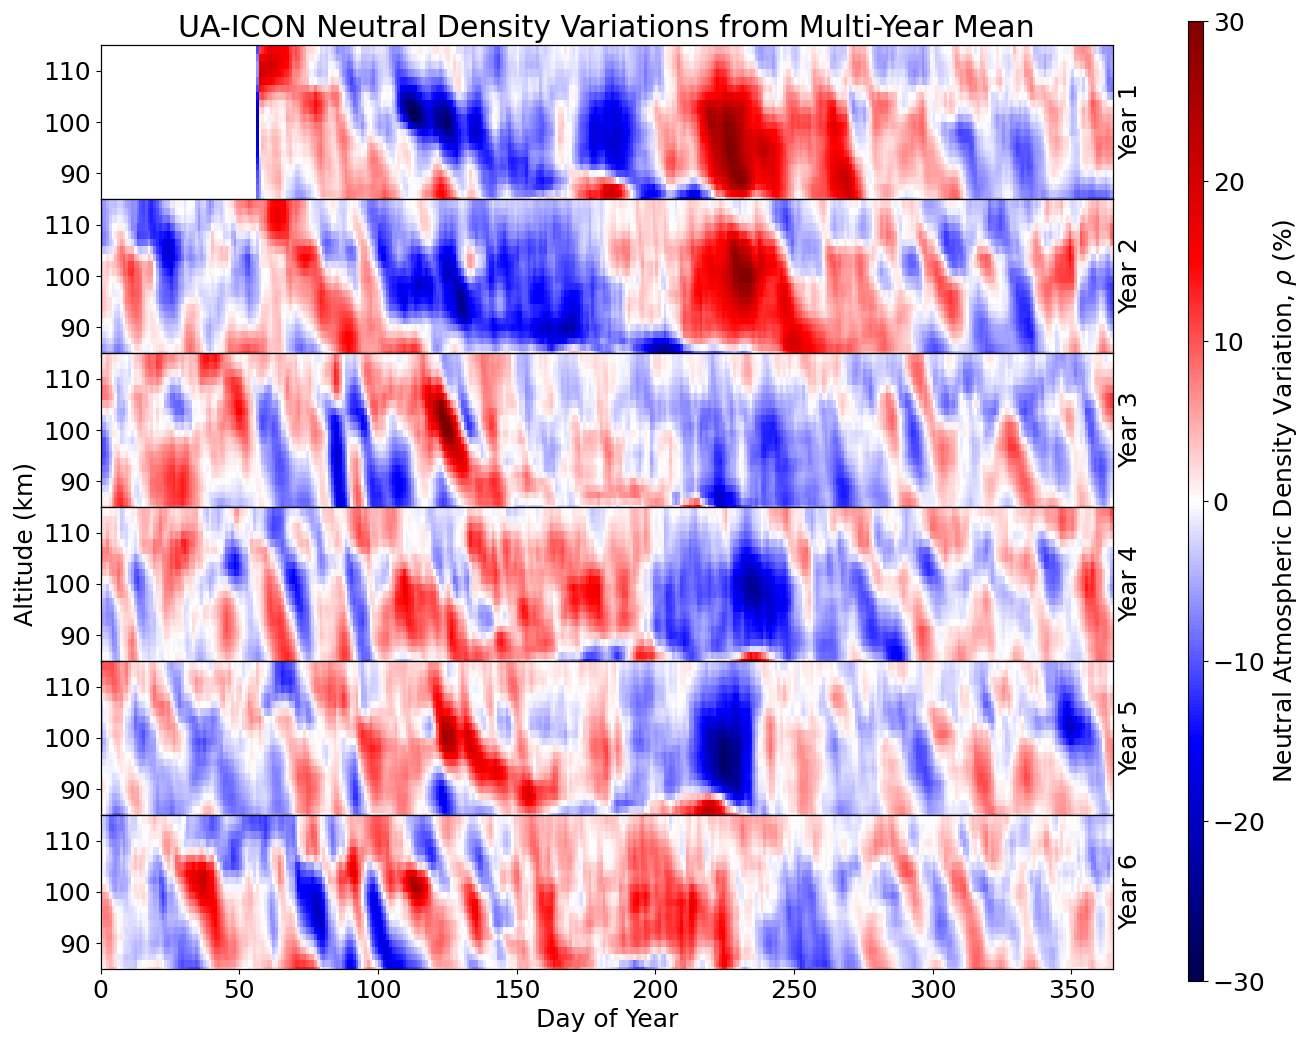
Figure 4Presented is an UA-ICON Model run for MLT neutral atmospheric density comparisons with the meteor head echo data. A 6 d multi-year running mean around the DOY was taken for all years as the background to be subtracted and the analyzed data was filtered with a 6 d running mean after the subtraction, the same as Fig. 3.
In Fig. 4 clear oscillations can be observed when comparing the neutral atmospheric density for a given DOY from the multi-year mean. The magnitudes are similar to Fig. 3, though many of the oscillations are much more clear. This is not unexpected. Comparisons between data and models will commonly produce different results. Even with the differences, there are some trends that are evident between the datasets.
The data in Figs. 1 and 2 are not new findings and are relatively well accepted in the community. Where we expand on the current state of the art is in Fig. 3, where we remove the multi-year average for a given DOY from the data to only investigate variations between the years. For the MAARSY meteor data we examine the variation of based on the relationship between meteor ablation rate, atmospheric density, and the geocentric velocity given in Eq. (1). Changes in should approximately correspond to the atmospheric neutral density variations for a constant ablation rate and altitude. We consider the ablation rate at the initial detection altitude to correspond to a constant detection threshold with the radar.
Further examining the results, there are many different geophysical phenomena that can be linked to the results displayed in Fig. 3. Here, we focus on some noticeable events and trends in the meteor head echo data and highlight some similarities with the UA-ICON Model. Only a qualitative analysis is performed here to show that this method of determining atmospheric neutral density variations with meteor head echo measurements is viable for long-term monitoring of this region. As this is a difficult region to consistently measure for neutral density quantities, there are very few datasets available for comparison.
4.1 Sudden Stratospheric Warmings
Zhou et al. (2023) showed that there is a positive increase in the neutral atmospheric density at altitudes between 85 and 95 km in the days after the onset of the SSW at a similar latitude to that of MAARSY in an epoch analysis. In this current study, we examine the neutral density variations at altitudes of 85 to 115 km, which is slightly above the altitude of the study by Zhou et al. (2023). From Sato et al. (2023), we can consider the following dates for major SSWs in the MAARSY dataset (YYYY/MM/DD format, DOY in parentheses): 2016/02/09 (40), 2017/02/01 (32), 2018/02/12 (43), 2019/01/01 (1), and 2021/01/05 (5). All of these dates show a relative decrease in the meteor geocentric velocity ratio in Fig. 3 (highlighted by black marks at 110–115 km), corresponding to a relative increase in neutral atmospheric density.
4.2 Solar Cycle Effects
The solar cycle will have an effect on the thermospheric neutral density, where during solar maximum it is expected that the density at a fixed altitude will be larger (Doornbos, 2012). This increase in the neutral density can be attributed to the increased temperatures, which cause lower, more dense layers of the atmosphere to expand vertically to higher altitudes. In addition, enhanced dissociation and ionization of O2 and N2, for example, result in an increase of the neutral density (number of neutral particles per unit volume). In Fig. 3, it can be observed that 2016 shows the largest neutral density variations on average and it was during the decline of the previous solar maximum period. The solar minimum of 2019–2020 shows on average the lowest corresponding neutral densities, and we are beginning to observe increases in the neutral density variations again for 2023.
4.3 Geomagnetic Storms
Yamazaki et al. (2024) has previously investigated changes to the MLT region using SABER data and Hp30 geomagnetic activity index. Increases to the MLT region temperatures were evident during geomagnetic storm-time conditions. There was also a time of day dependence on the temperature variations.
Some dates where the DST was less than −100 nT are provided here, where this threshold is considered to be between moderate and intense geomagnetic storm-time conditions. A different threshold would either result in too many events for the purpose of this qualitative assessment, or not enough events for a proper determination of whether the data shows any trend. The dates selected to be examined are (DOY in parentheses): 2016/10/13 (287), 2017/05/28 (148), 2017/09/08 (251), 2023/02/27 (58), 2023/03/23 (82), 2023/04/23 (113), 2023/11/05 (309), and 2023/12/01 (335). These dates have in general a less clear signature in Fig. 3 (highlighted by green marks at 110–115 km), though a further analysis is required to properly assess the impact of the geomagnetic storms at the location of MAARSY.
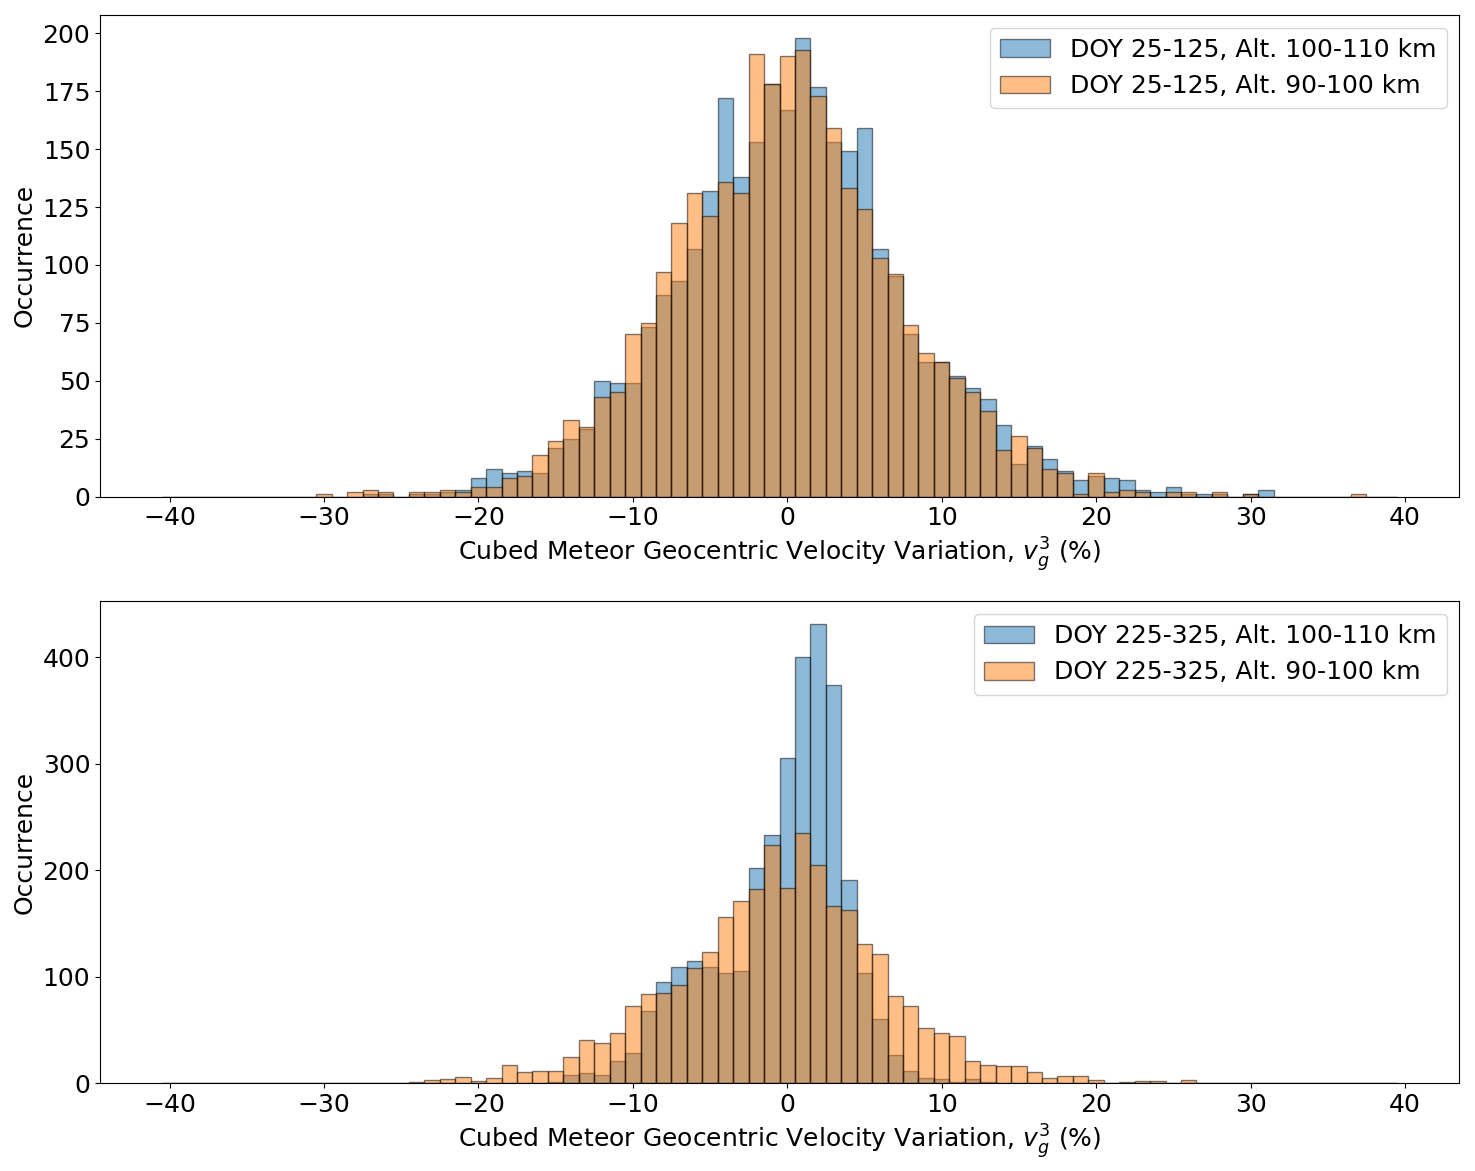
Figure 5Histograms of the cubed geocentric velocity variations, separated by DOY. The top panel presents data from DOY 25–125, and shows the distribution of cubed geocentric velocity variations for altitudes of 90–100 and 100–110 km. The bottom panel presents data from DOY 225–325 with the same altitude separations.
4.4 Potential Turbopause Monitoring
In the MAARSY meteor head echo data there is a consistent feature in the dataset where, at altitudes above 100 km in the summer and autumn, the neutral density variations are reduced between the years compared to other seasons and altitudes. If we compare with the UA-ICON model data in Fig. 4, we can observe that there is also a potential reduction in the variability of the neutral density at these times and altitudes. It should be noted that this region is above the approximate altitude of the turbopause (e.g., Hall et al., 2016), which could be a reason for this reduction in variation.
To further highlight this reduction in variation at different times of year and different altitudes, histograms of the cubed velocity variation of the meteors are shown in Fig. 5. The distribution clearly changes for the altitude range of 100–110 km in the second half of the year. Further investigations on the cause of this variation reduction is left for a future study.
4.5 Planetary Wave Activity
There are many instances of potential planetary waves in the MAARSY meteor head echo data. These are especially evident in the winter season with a periodicity of several days. Some examples of planetary waves in the data include the density variation oscillations during ≈ day 350 of year 2018 and 2020. In 2018 especially it can be observed that there is an altitude propagation component to the variations in the neutral density (Fig. 6). It is clear that wave activity on multi-day scales is detectable with this method of analyzing the meteor head echoes for MLT investigations.
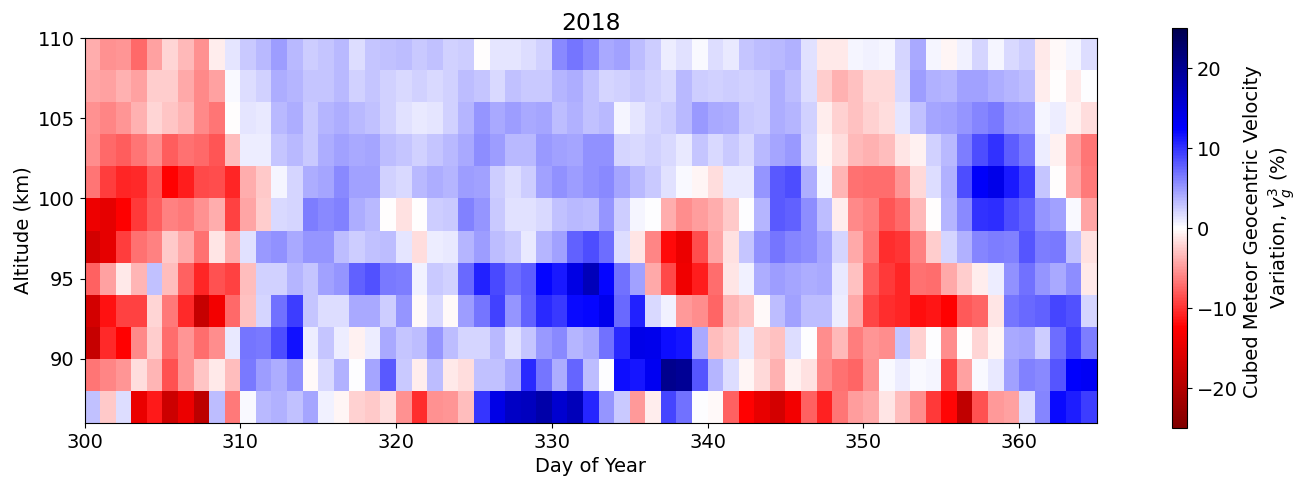
Figure 6Geocentric velocity variations for the end of year 2018. Potential planetary wave activity is evident after DOY 340.
4.6 Closing Remarks
To close the discussion, we do not expect the UA-ICON model and MAARSY meteor head echo data to exactly match. The UA-ICON model is a free running model that produces a realization of atmospheric parameters derived from sea level forcing. For the density variations derived from MAARSY meteor head echoes in this analysis we have to assume that the neutral density is the primary cause of changing meteor ablation rates for a given altitude at the same time each year. It is sufficient to say that many characteristics between the model and MAARSY meteor head echo derived neutral density variations are similar. Further validation of the MAARSY meteor head echo data is planned, with the potential to constrain the neutral density values through the implementation of accurate meteor ablation models with the data.
Here we have shown a novel method to measure neutral density variations between years for the same yearly time interval as a function of altitude. This is possible due to the extensive dataset of over 1.4 million meteor head echoes during the years of 2016–2023 that have been recorded with the MAARSY radar system. The data provides MLT neutral density information with 2 km altitude resolution between 85–115 km and a time resolution of approximately 6 d. Many different geophysical phenomena are evident in the dataset, such as sudden stratospheric warmings, planetary waves, and geomagnetic storms. These will be explored further in the future. One of the valuable features of this analysis is the ability to provide an altitude profile to the neutral density variations which allows the altitude propagation of different perturbations to be detected.
We show that the fluctuation level of neutral MLT densities derived from MAARSY meteor head echo measurements are consistent with neutral density models. This novel method of monitoring the neutral density can therefore contribute to constraining the neutral density variations in models at the difficult to measure MLT region altitudes. Combining the neutral density variations from MAARSY with the SIMONe Norway (Huyghebaert et al., 2022; Jaen et al., 2023) radar system measurements of neutral winds will be a powerful tool to monitor the neutral atmospheric momentum and energy transfer in the MLT. Future plans will involve obtaining the values for the neutral atmospheric density and temperature rather than only variations from the multi-year mean. This can be accomplished through the inclusion of ablation models and further analysis (e.g., Limonta et al., 2020).
As these meteor head echo measurements are ongoing and analysis of 2024 will commence soon, it is expected that the large geomagnetic storms that have occurred in the past year will show noticeable fluctuation signatures in the MLT density. In addition, as the dataset is continually growing the background empirical model (bottom panel of Fig. 2) will only improve with an increase in the number of measurements. This dataset and method of analysis is a valuable addition to the methods by which to measure the neutral atmosphere in the MLT region.
This appendix presents the distributions of the meteor head echo detection event data between the years for the first 6 d of each month. Not all years and months have data, but it can be seen in both Figs. A1 and A2 that the zenith angle and geocentric velocity distributions for the same time period between the years are similar. This corresponds to the meteoroids being from similar sources and therefore likely having similar compositions, an important assumption in the derivation of neutral density variations in this study.
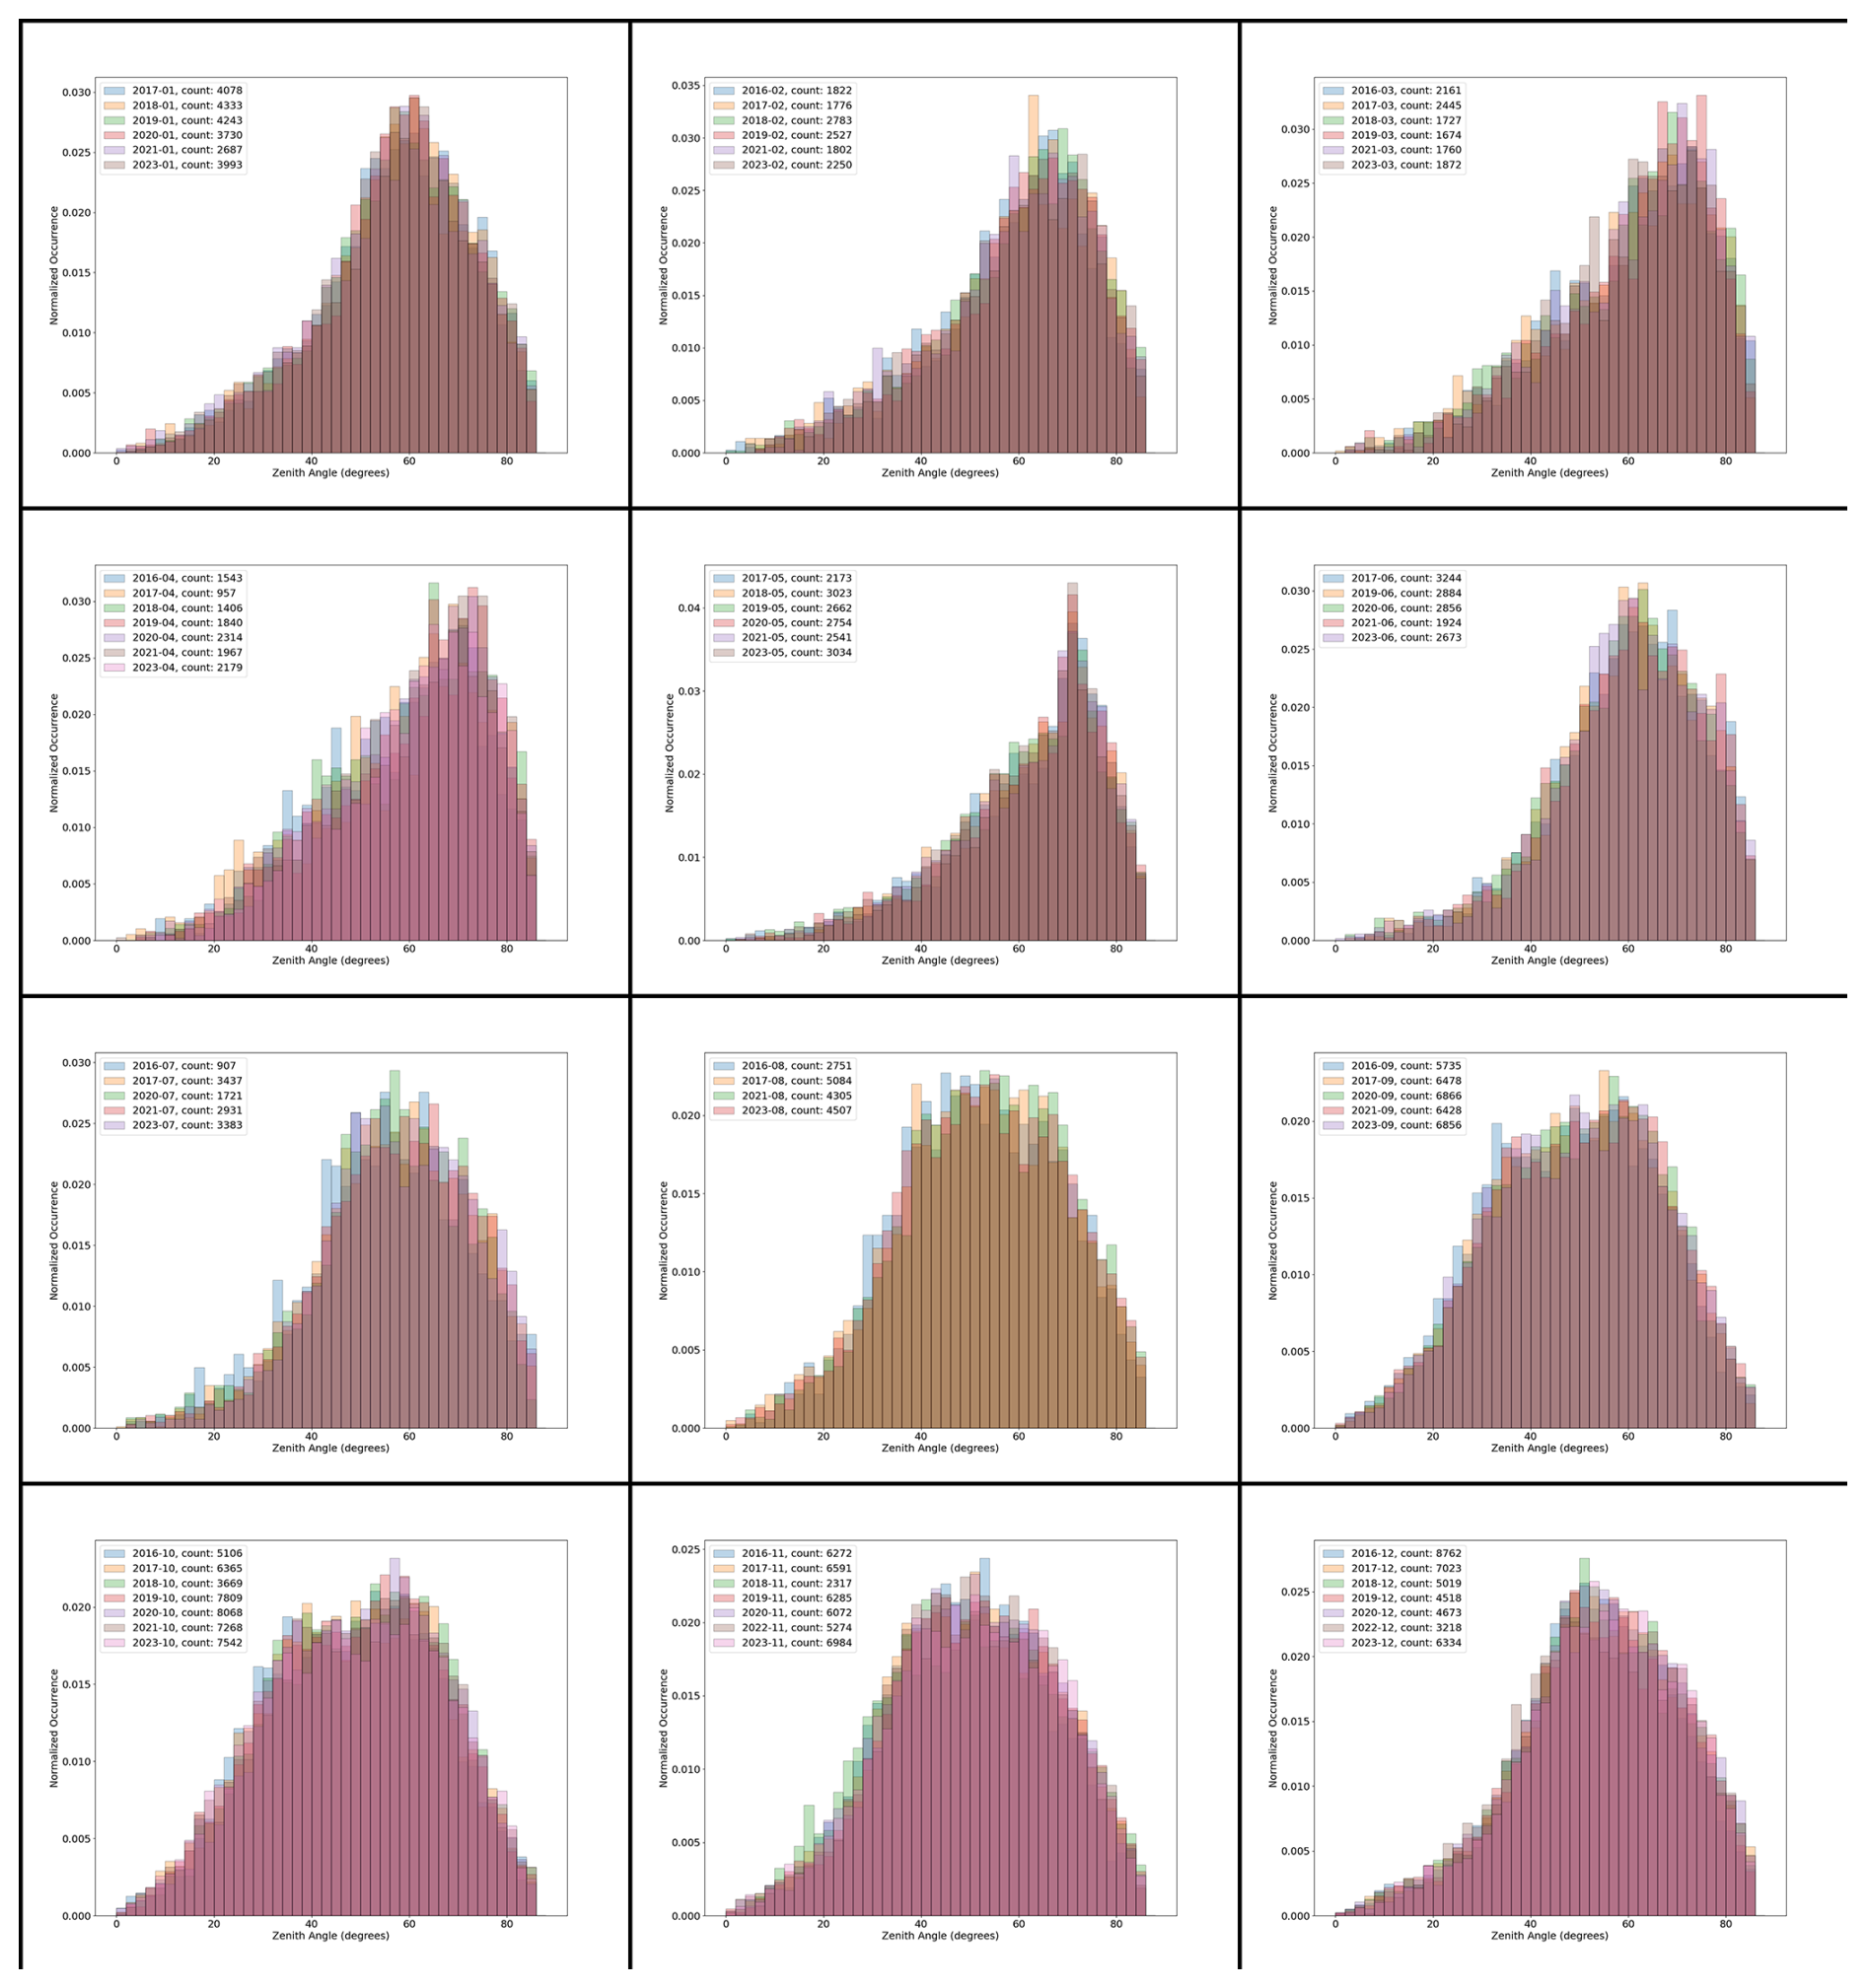
Figure A1Zenith angle distributions for the first 6 d of each month for the years with data.
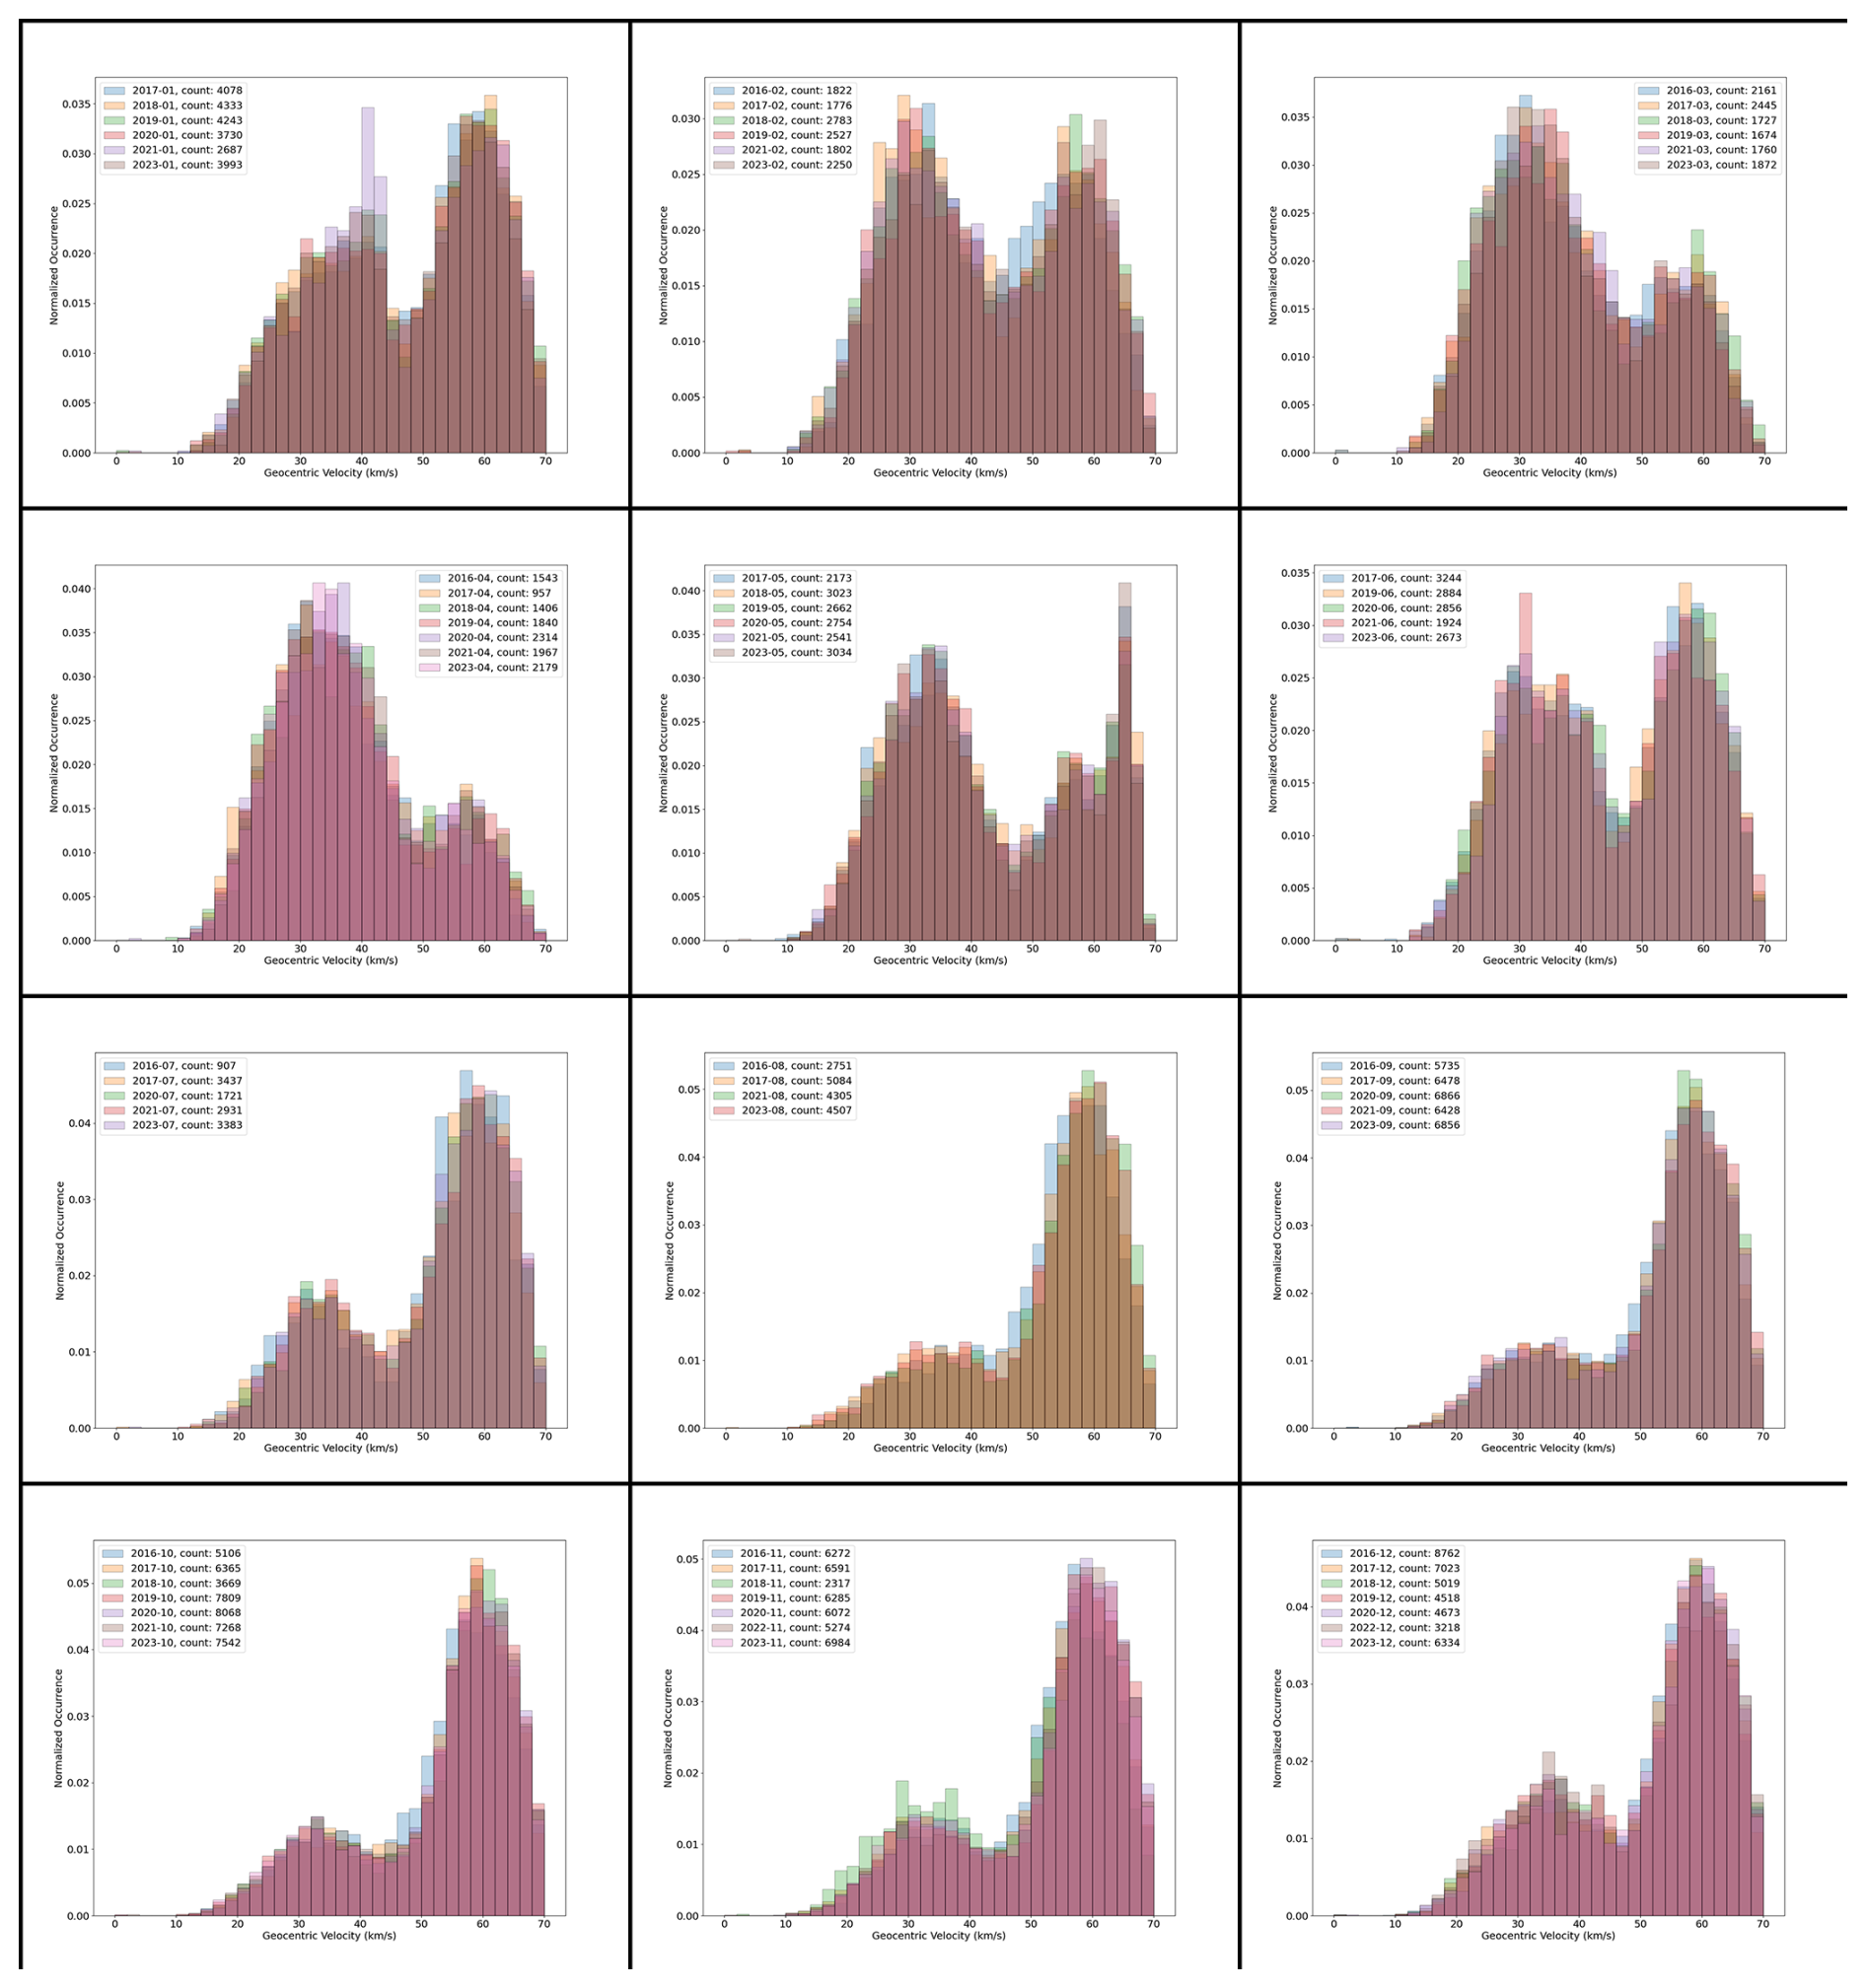
Figure A2Geocentric velocity distributions for the first 6 d of each month for the years with data.
The effects of varying the window size for the meteor head echo detections were investigated, with the results presented in Fig. B1. It is clear that a sufficient number of meteor head echoes must be included in the analysis to obtain usable results. It was determined that using a time window of 6 d with an altitude bin size of 2 km provided a sufficient sampling of the detected meteoroid population, while also providing altitude resolved atmospheric density perturbations with a few day resolution.
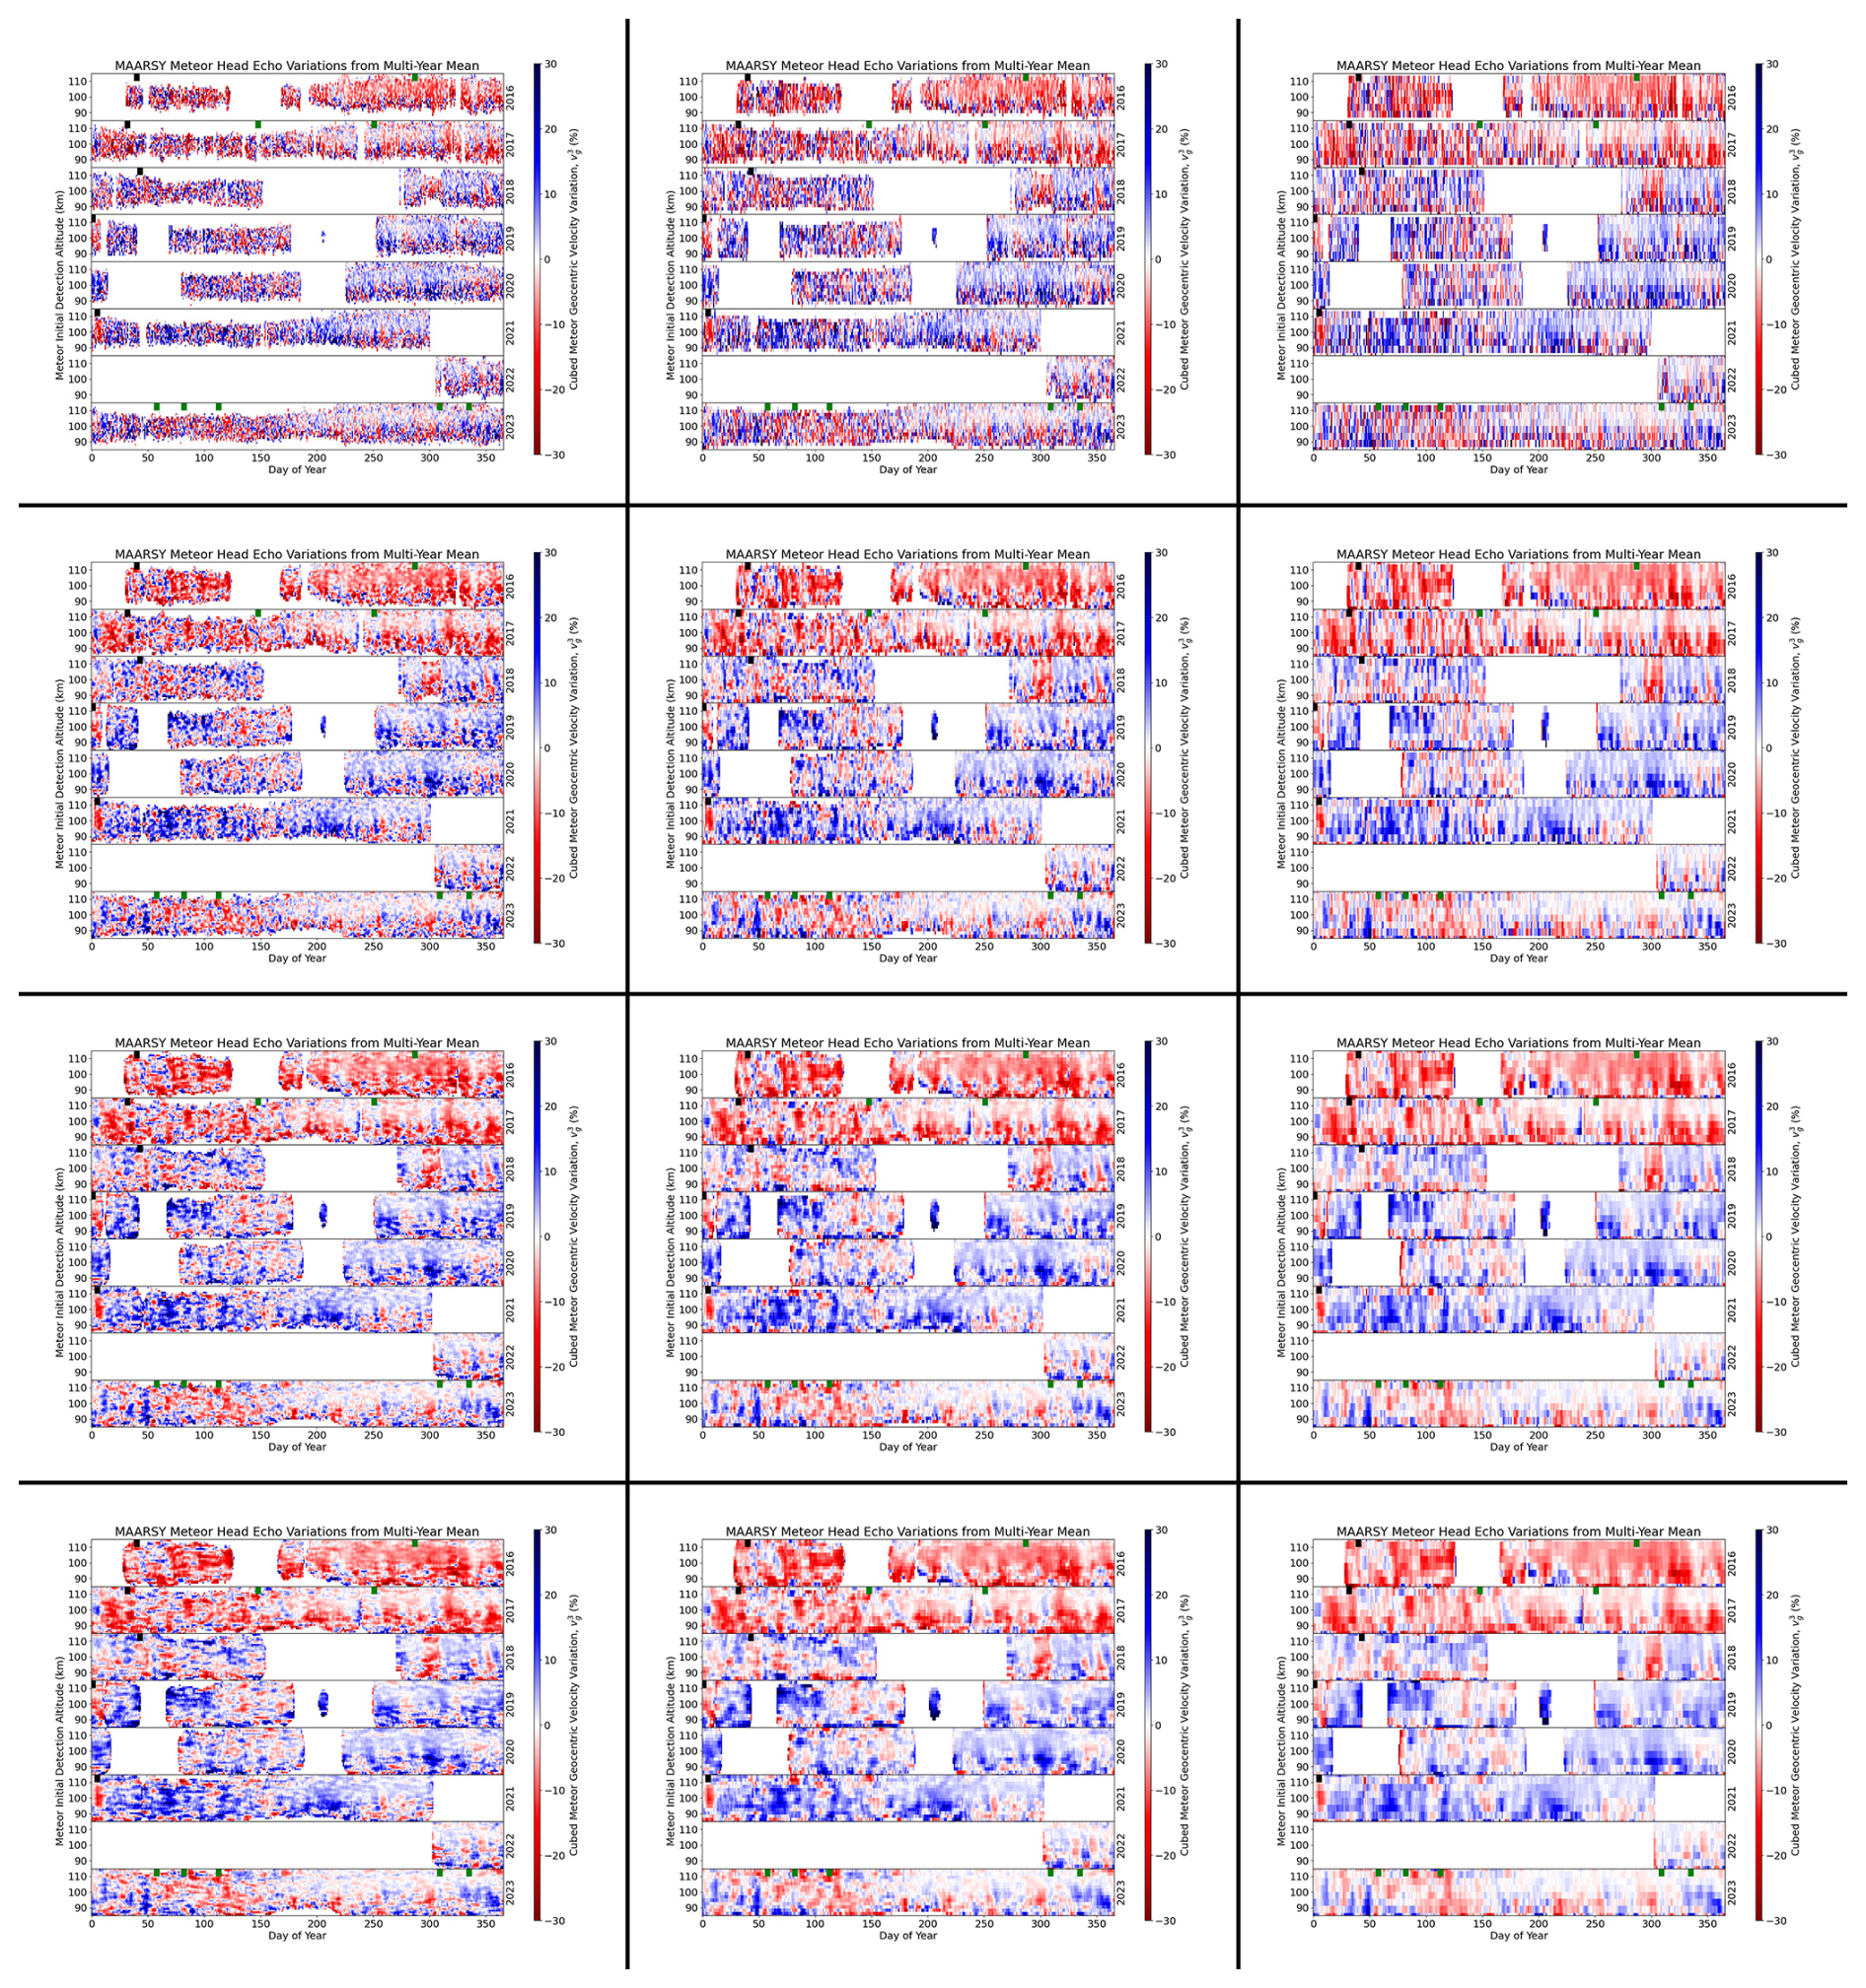
Figure B1Changes to the bin sizes for the corresponding geocentric velocity cubed values. From top to bottom, the rows correspond to integrating the data over 2, 4, 6, and 8 d. The columns from left to right correspond to 1, 2, and 4 km altitude bins.
The data can be accessed at the DOI: https://doi.org/10.22000/yk29t2gu0h4jhkjg (Huyghebaert and Vierinen, 2026).
DH, JV, and BG conceptualized the study. RL, TR, MZ, and JLC operated the MAARSY radar and managed the data storage and distribution. JV processed the MAARSY meteor head echo data. DH, JV, and BG discussed and processed the meteor head echo mean model and variation subtraction. CCS provided the UA-ICON model run data. CCS, JFC, and JLC provided discussions on the neutral dynamics that can be detected with the technique. DH, JV, TR, DK, JK, and JLC discussed the meteor head echo processing and results. All authors contributed to the writing, editing, and reviewing of the manuscript.
At least one of the (co-)authors is a member of the editorial board of Atmospheric Measurement Techniques. The peer-review process was guided by an independent editor, and the authors also have no other competing interests to declare.
Publisher's note: Copernicus Publications remains neutral with regard to jurisdictional claims made in the text, published maps, institutional affiliations, or any other geographical representation in this paper. The authors bear the ultimate responsibility for providing appropriate place names. Views expressed in the text are those of the authors and do not necessarily reflect the views of the publisher.
We thank Carsten Schult, who developed the real-time detection procedure of meteor-head echoes used in this work.
DH was funded during a portion of this study through a UiT The Arctic University of Norway contribution to the EISCAT_3D project funded by Research Council of Norway through research infrastructure grant 245683.
This paper was edited by Markus Rapp and reviewed by Joel Younger and two anonymous referees.
Blaauw, R. C., Campbell-Brown, M. D., and Weryk, R. J.: Mass distribution indices of sporadic meteors using radar data, Mon. Not. R. Astron. Soc., 412, 2033–2039, https://doi.org/10.1111/j.1365-2966.2010.18038.x, 2011. a
Campbell-Brown, M.: High resolution radiant distribution and orbits of sporadic radar meteoroids, Icarus, 196, 144–163, https://doi.org/10.1016/j.icarus.2008.02.022, 2008. a
Chau, J. L. and Woodman, R. F.: Observations of meteor-head echoes using the Jicamarca 50 MHz radar in interferometer mode, Atmos. Chem. Phys., 4, 511–521, https://doi.org/10.5194/acp-4-511-2004, 2004. a
Chau, J. L., Woodman, R. F., and Galindo, F.: Sporadic meteor sources as observed by the Jicamarca high-power large-aperture VHF radar, Icarus, 188, 162–174, https://doi.org/10.1016/j.icarus.2006.11.006, 2007. a
Close, S., Oppenheim, M., Hunt, S., and Coster, A.: A technique for calculating meteor plasma density and meteoroid mass from radar head echo scattering, Icarus, 168, 43–52, https://doi.org/10.1016/j.icarus.2003.11.018, 2004. a
Close, S., Hamlin, T., Oppenheim, M., Cox, L., and Colestock, P.: Dependence of radar signal strength on frequency and aspect angle of nonspecular meteor trails, J. Geophys. Res.-Space, 113, https://doi.org/10.1029/2007JA012647, 2008. a
Close, S., Kelley, M., Vertatschitsch, L., Colestock, P., Oppenheim, M., and Yee, J.: Polarization and scattering of a long-duration meteor trail, J. Geophys. Res.-Space, 116, https://doi.org/10.1029/2010JA015968, 2011. a
Close, S., Volz, R., Loveland, R., Macdonell, A., Colestock, P., Linscott, I., and Oppenheim, M.: Determining meteoroid bulk densities using a plasma scattering model with high-power large-aperture radar data, Icarus, 221, 300–309, https://doi.org/10.1016/j.icarus.2012.07.033, 2012. a
Dawkins, E. C. M., Janches, D., Stober, G., Carrillo-Sánchez, J. D., Lieberman, R. S., Jacobi, C., Moffat-Griffin, T., Mitchell, N. J., Cobbett, N., Batista, P. P., Andrioli, V. F., Buriti, R. A., Murphy, D. J., Kero, J., Gulbrandsen, N., Tsutsumi, M., Kozlovsky, A., Lester, M., Kim, J.-H., Lee, C., Liu, A., Fuller, B., O’Connor, D., Palo, S. E., Taylor, M. J., Marino, J., and Rainville, N.: Seasonal and Local Time Variation in the Observed Peak of the Meteor Altitude Distributions by Meteor Radars, J. Geophys. Res.-Atmos., 129, e2024JD040978, https://doi.org/10.1029/2024JD040978, 2024. a, b
Dimant, Y. S. and Oppenheim, M. M.: Formation of plasma around a small meteoroid: 1. Kinetic theory, J. Geophys. Res.-Space, 122, 4669–4696, https://doi.org/10.1002/2017JA023960, 2017a. a, b
Dimant, Y. S. and Oppenheim, M. M.: Formation of plasma around a small meteoroid: 2. Implications for radar head echo, J. Geophys. Res.-Space, 122, 4697–4711, https://doi.org/10.1002/2017JA023963, 2017b. a, b
Doornbos, E.: Empirical Modelling of the Thermosphere, Springer Berlin Heidelberg, Berlin, Heidelberg, 21–57, ISBN 978-3-642-25129-0, https://doi.org/10.1007/978-3-642-25129-0_2, 2012. a, b
Dyrud, L., Wilson, D., Boerve, S., Trulsen, J., Pecseli, H., Close, S., Chen, C., and Lee, Y.: Plasma and electromagnetic wave simulations of meteors, Adv. Space Res., 42, 136–142, https://doi.org/10.1016/j.asr.2007.03.048, 2008. a
Emmert, J. T., Drob, D. P., Picone, J. M., Siskind, D. E., Jones Jr., M., Mlynczak, M. G., Bernath, P. F., Chu, X., Doornbos, E., Funke, B., Goncharenko, L. P., Hervig, M. E., Schwartz, M. J., Sheese, P. E., Vargas, F., Williams, B. P., and Yuan, T.: NRLMSIS 2.0: A Whole-Atmosphere Empirical Model of Temperature and Neutral Species Densities, Earth Space Sci., 8, e2020EA001321, https://doi.org/10.1029/2020EA001321, 2021. a
Emmert, J. T., Jones Jr, M., Siskind, D. E., Drob, D. P., Picone, J. M., Stevens, M. H., Bailey, S. M., Bender, S., Bernath, P. F., Funke, B., Hervig, M. E., and Pérot, K.: NRLMSIS 2.1: An Empirical Model of Nitric Oxide Incorporated Into MSIS, J. Geophys. Res.-Space, 127, e2022JA030896, https://doi.org/10.1029/2022JA030896, 2022. a
Günzkofer, F., Stober, G., Pokhotelov, D., Miyoshi, Y., and Borries, C.: Difference spectrum fitting of the ion–neutral collision frequency from dual-frequency EISCAT measurements, Atmos. Meas. Tech., 16, 5897–5907, https://doi.org/10.5194/amt-16-5897-2023, 2023. a
Hall, C. M., Holmen, S. E., Meek, C. E., Manson, A. H., and Nozawa, S.: Change in turbopause altitude at 52 and 70° N, Atmos. Chem. Phys., 16, 2299–2308, https://doi.org/10.5194/acp-16-2299-2016, 2016. a
Huyghebaert, D. and Vierinen, J.: HuyghebaertAMT2025, Leibniz Institute of Atmospheric Physics at the University of Rostock [data set], https://doi.org/10.22000/yk29t2gu0h4jhkjg, 2026. a
Huyghebaert, D., Clahsen, M., Chau, J. L., Renkwitz, T., Latteck, R., Johnsen, M. G., and Vierinen, J.: Multiple E-Region Radar Propagation Modes Measured by the VHF SIMONe Norway System During Active Ionospheric Conditions, Front. Astron. Space Sci., 9, https://doi.org/10.3389/fspas.2022.886037, 2022. a
Jaen, J., Renkwitz, T., Liu, H., Jacobi, C., Wing, R., Kuchař, A., Tsutsumi, M., Gulbrandsen, N., and Chau, J. L.: Long-term studies of the summer wind in the mesosphere and lower thermosphere at middle and high latitudes over Europe, Atmos. Chem. Phys., 23, 14871–14887, https://doi.org/10.5194/acp-23-14871-2023, 2023. a
Janches, D., Heinselman, C. J., Chau, J. L., Chandran, A., and Woodman, R.: Modeling the global micrometeor input function in the upper atmosphere observed by high power and large aperture radars, J. Geophys. Res.-Space, 111, https://doi.org/10.1029/2006JA011628, 2006. a
Kero, J., Szasz, C., Wannberg, G., Pellinen-Wannberg, A., and Westman, A.: On the meteoric head echo radar cross section angular dependence, Geophys. Res. Lett., 35, https://doi.org/10.1029/2008GL033402, 2008. a
Kero, J., Szasz, C., Nakamura, T., Meisel, D. D., Ueda, M., Fujiwara, Y., Terasawa, T., Nishimura, K., and Watanabe, J.: The 2009–2010 MU radar head echo observation programme for sporadic and shower meteors: radiant densities and diurnal rates: The 2009–2010 MU radar head echo observation programme, Mon. Not. R. Astron. Soc., 425, 135–146, https://doi.org/10.1111/j.1365-2966.2012.21407.x, 2012. a
Kunze, M., Zülicke, C., Siddiqui, T. A., Stephan, C. C., Yamazaki, Y., Stolle, C., Borchert, S., and Schmidt, H.: UA-ICON with the NWP physics package (version ua-icon-2.1): mean state and variability of the middle atmosphere, Geosci. Model Dev., 18, 3359–3385, https://doi.org/10.5194/gmd-18-3359-2025, 2025. a, b
Latteck, R., Singer, W., Rapp, M., Vandepeer, B., Renkwitz, T., Zecha, M., and Stober, G.: MAARSY: The new MST radar on Andøya – System description and first results, Radio Sci., 47, https://doi.org/10.1029/2011RS004775, 2012. a, b
Li, A. and Close, S.: Neutral density estimation derived from meteoroid measurements using high-power, large-aperture radar, J. Geophys. Res.-Atmos., 121, 8023–8037, https://doi.org/10.1002/2015JD024547, 2016. a, b
Limonta, L., Close, S., and Marshall, R. A.: A technique for inferring lower thermospheric neutral density from meteoroid ablation, Planet. Space Sci., 180, 104735, https://doi.org/10.1016/j.pss.2019.104735, 2020. a, b, c, d
Lucas, G.: pymsis, Zenodo [code], https://doi.org/10.5281/zenodo.7581692, 2023. a
Marshall, R. A., Brown, P., and Close, S.: Plasma distributions in meteor head echoes and implications for radar cross section interpretation, Planet. Space Sci., 143, 203–208, https://doi.org/10.1016/j.pss.2016.12.011, 2017. a
Picone, J. M., Hedin, A. E., Drob, D. P., and Aikin, A. C.: NRLMSISE-00 empirical model of the atmosphere: Statistical comparisons and scientific issues, J. Geophys. Res.-Space, 107, SIA 15-1–SIA 15-16, https://doi.org/10.1029/2002JA009430, 2002. a, b
Sato, K., Tomikawa, Y., Kohma, M., Yasui, R., Koshin, D., Okui, H., Watanabe, S., Miyazaki, K., Tsutsumi, M., Murphy, D., Meek, C., Tian, Y., Ern, M., Baumgarten, G., Chau, J. L., Chu, X., Collins, R., Espy, P. J., Hashiguchi, H., Kavanagh, A. J., Latteck, R., Lübken, F.-J., Milla, M., Nozawa, S., Ogawa, Y., Shiokawa, K., Alexander, M. J., Nakamura, T., and Ward, W. E.: Interhemispheric Coupling Study by Observations and Modelling (ICSOM): Concept, Campaigns, and Initial Results, J. Geophys. Res.-Atmos., 128, e2022JD038249, https://doi.org/10.1029/2022JD038249, 2023. a
Schult, C., Stober, G., Chau, J. L., and Latteck, R.: Determination of meteor-head echo trajectories using the interferometric capabilities of MAARSY, Ann. Geophys., 31, 1843–1851, https://doi.org/10.5194/angeo-31-1843-2013, 2013. a, b
Schult, C., Stober, G., Janches, D., and Chau, J. L.: Results of the first continuous meteor head echo survey at polar latitudes, Icarus, 297, 1–13, https://doi.org/10.1016/j.icarus.2017.06.019, 2017. a
Schult, C., Brown, P., Pokorný, P., Stober, G., and Chau, J. L.: A meteoroid stream survey using meteor head echo observations from the Middle Atmosphere ALOMAR Radar System (MAARSY), Icarus, 309, 177–186, https://doi.org/10.1016/j.icarus.2018.02.032, 2018. a, b
Sparks, J. J. and Janches, D.: Latitudinal dependence of the variability of the micrometeor altitude distribution, Geophys. Res. Lett., 36, https://doi.org/10.1029/2009GL038485, 2009. a
Stober, G., Jacobi, C., Matthias, V., Hoffmann, P., and Gerding, M.: Neutral air density variations during strong planetary wave activity in the mesopause region derived from meteor radar observations, J. Atmos. Sol.-Terr. Phy., 74, 55–63, https://doi.org/10.1016/j.jastp.2011.10.007, 2012. a, b
Stober, G., Matthias, V., Brown, P., and Chau, J. L.: Neutral density variation from specular meteor echo observations spanning one solar cycle, Geophys. Res. Lett., 41, 6919–6925, https://doi.org/10.1002/2014GL061273, 2014. a, b
Sugar, G., Oppenheim, M. M., Dimant, Y. S., and Close, S.: Formation of Plasma Around a Small Meteoroid: Simulation and Theory, J. Geophys. Res.-Space, 123, 4080–4093, https://doi.org/10.1002/2018JA025265, 2018. a, b
Thomas, N., Kero, A., Virtanen, I., Nozawa, S., and Saito, N.: D-region ion-neutral collision frequency observed by incoherent scatter spectral width combined with LIDAR measurements, ESS Open Archive, https://doi.org/10.22541/essoar.172081412.21962979/v1, 2024. a
Vida, D., Brown, P. G., Campbell-Brown, M., Weryk, R. J., Stober, G., and McCormack, J. P.: High precision meteor observations with the Canadian automated meteor observatory: Data reduction pipeline and application to meteoroid mechanical strength measurements, Icarus, 354, 114097, https://doi.org/10.1016/j.icarus.2020.114097, 2021. a
Vondrak, T., Plane, J. M. C., Broadley, S., and Janches, D.: A chemical model of meteoric ablation, Atmos. Chem. Phys., 8, 7015–7031, https://doi.org/10.5194/acp-8-7015-2008, 2008. a, b
Yamazaki, Y., Stolle, C., Stephan, C., and Mlynczak, M. G.: Lower Thermospheric Temperature Response to Geomagnetic Activity at High Latitudes, J. Geophys. Res.-Space, 129, e2024JA032639, https://doi.org/10.1029/2024JA032639, 2024. a
Yi, W., Xue, X., Reid, I. M., Younger, J. P., Chen, J., Chen, T., and Li, N.: Estimation of Mesospheric Densities at Low Latitudes Using the Kunming Meteor Radar Together With SABER Temperatures, J. Geophys. Res.-Space, 123, 3183–3195, https://doi.org/10.1002/2017JA025059, 2018. a
Younger, J. P., Reid, I. M., Vincent, R. A., and Murphy, D. J.: A method for estimating the height of a mesospheric density level using meteor radar, Geophys. Res. Lett., 42, 6106–6111, https://doi.org/10.1002/2015GL065066, 2015. a, b
Zhou, B., Yi, W., Xue, X., Ye, H., Zeng, J., Li, G., Tsutsumi, M., Gulbrandsen, N., Chen, T., and Dou, X.: Impact of sudden stratospheric warmings on the neutral density, temperature and wind in the MLT region, Front. Astron. Space Sci., 10, https://doi.org/10.3389/fspas.2023.1192985, 2023. a, b
- Abstract
- Introduction
- Method
- Results
- Discussion
- Summary
- Appendix A: Meteor Head Echo Zenith Angle and Geocentric Velocity Distributions
- Appendix B: Meteor Head Echo Bin Size Effects
- Data availability
- Author contributions
- Competing interests
- Disclaimer
- Acknowledgements
- Financial support
- Review statement
- References