
the Creative Commons Attribution 4.0 License.
the Creative Commons Attribution 4.0 License.
 | 21 Jul 2026
Development and validation of an integrated Ambient Air Test Facility (AATF) for multi-instrument aerosol characterization
Paul Johns
Cathy Scotto
Landon Hernandez
Matthew Hart
Oyedoyin Aduroja
Mark Hammond
Braden Giordano
Kenneth Grabowski
Jay Eversole
Vasanthi Sivaprakasam
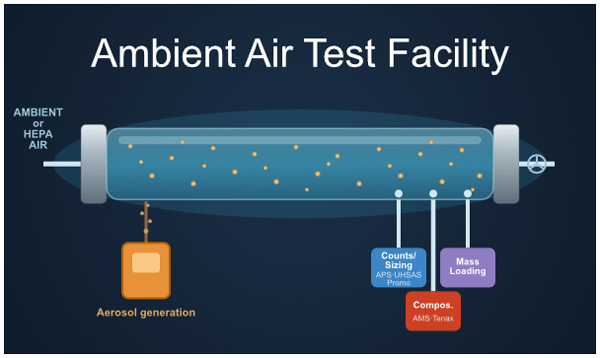
The U.S. Naval Research Laboratory has developed and validated an Ambient Air Test Facility (AATF) for controlled multi-instrument aerosol generation and characterization under realistic sampling conditions. The facility consists of a 14 m flow tube system that provides turbulent (Re=40 000) outdoor ambient air flow at 2 m s−1 for testing aerosol detection and measurement systems in a controlled indoor environment. The AATF integrates 13 diagnostic instruments across four measurement categories: individual particle measurement, aerosol loading, aerosol composition, and flow characterization. Multiple aerosol generation systems enable dispersion of both liquid solutions or suspensions and dry powders, producing particle concentrations from 50 to 3000 µg m−3 and the ability to detect particles across a mean diameter range of 50 nm to 15 µm. Facility validation was conducted using multiple test chemicals including caffeine, oleic acid, phenanthrene, glycerol, tributyl phosphate, and Arizona test dust for three nominal concentration levels (low ∼ 100, medium ∼ 500, high >800 µg m−3). Aerosol concentration uniformity across the flow cross-section showed relative standard deviations below 3.5 %. Multi-instrument comparisons between redundant particle sizing systems (dual APS units, UHSAS, and Promo) demonstrated good measurement consistency, with gravimetric validation confirming total aerosol mass concentrations with a 20 % difference between the types of measurements. The Aerodyne Aerosol Mass Spectrometer correctly identified particle chemical signatures consistent with NIST fragmentation patterns for all test compounds. The facility employs shrouded probe sampling systems with isokinetic coupling to individual instruments to minimize particle losses and sampling biases across the particle size distribution. The AATF provides a repeatable and reliable aerosol generation testbed for detector development, evaluation, instrument inter-comparison, and aerosol measurement validation under controlled yet realistic ambient air conditions with controlled size distributions and total mass concentrations for a wide range of chemical aerosols.
- Article
(4652 KB) - Full-text XML
-
Supplement
(782 KB) - BibTeX
- EndNote


Accurate characterization of atmospheric aerosols is critical for environmental monitoring, public health assessment, and security applications. However, validation and inter-comparison of aerosol detection systems under controlled yet realistic ambient conditions remains a challenge for new capability development (Guo et al., 2021; Peck et al., 2023). Traditional laboratory testing often fails to replicate the complex flow dynamics and sampling conditions encountered in real-world ambient air monitoring, while outdoor field testing lacks the control necessary for systematic instrument validation and performance assessment.
The need for specialized facilities to address this gap has led to the development of various aerosol testing platforms. Chamber-based facilities have proven valuable for studying aerosol formation and aging processes (Cocker et al., 2001; Carter et al., 2005; Paulsen et al., 2005; Wang et al., 2014), but their static environments do not adequately represent the dynamic ambient conditions. Wind tunnel facilities, while providing controlled flow conditions, are typically designed for studying aerodynamic flow and mixing phenomena rather than aerosols entrained in the flow.
Recent advances in aerosol facility design have focused on creating ambient-like testing conditions in controlled laboratory environments. Facilities have been developed to test developmental sensors for biological and chemical agent detection, including U.S. Army Combat Capabilities Development Command Chemical Biological Center's (DEVCOM CBC) Aerosol Test Facility (U.S. Army Edgewood Chemical Biological Center, 2014), Johns Hopkins University's Dynamic Concentration Aerosol Generator (DYCAG, (Ratnesar-Shumate et al., 2011)), and Swiss Federal Institute of Metrology's (METAS) Production of Ambient-Like Model Aerosols (PALMA) facility (Horender et al., 2021) specifically for validating automated particulate matter (PM) monitors against gravimetric reference methods. This work demonstrated the value of controlled aerosol generation for instrument validation, but focused primarily on particle mass measurements rather than comprehensive multi-instrument characterization including continuous chemical composition analysis coupled with the ability to maintain outside ambient air in its initial state.
To address these limitations, the U.S. Naval Research Laboratory has revamped an Ambient Air Test Facility (AATF) by enabling multi-instrument aerosol characterization under realistic but controlled flow conditions. The facility was operated as a test facility for Intelligence Advanced Research Projects Activity's (IARPA) chemical aerosol identification program, Pursuing Intelligent and Complex Aerosols for Rapid Detection (PICARD) where developmental performer's sensors were subject to a variety of tests and performance metrics (IARPA, 2022). The AATF builds upon existing facility designs by incorporating several key innovations: (1) a flow-through design that simulates ambient air sampling conditions with turbulent flow (Re=40 000) at typical outdoor velocities (2 m s−1), (2) integration of 13 diagnostic instruments across four measurement categories with deliberate redundancy for validation, (3) shrouded probe sampling systems to minimize particle-size sampling biases, and (4) automated data integration and processing capabilities.
This paper presents the design, characterization, and validation of the AATF, demonstrating its capabilities for multi-instrument aerosol validation across a wide range of particle sizes (50 nm–15 µm) and concentrations (50–3000 µg m−3). Aerosols can be generated from a broad range of liquids (solutions or suspensions) with vapor pressures in the range of 0.15 to Pa or from dry powdered samples. The facility addresses a critical gap in existing aerosol testing capabilities by providing a platform for simultaneous validation of multiple detection technologies under controlled ambient-like conditions which supports the development and evaluation of next-generation aerosol detection systems including evaluating aerosol detection sensitivity (limit of detection and/or identification), dynamic range, and specificity as well as other system characteristics such as latency or carry-over between measurements, response time, recovery time, etc. The facility also offers a method to collect data for long durations to enable statistical characterizations of instruments such as the probability of detection or the probability of false alarms for specific compounds of interest in typical ambient conditions.
The AATF was designed to provide a plenum of outdoor ambient air in a controlled setting, principally to provide long-term prototype testing in ambient air. It consists of a cylindrical stainless steel tube nominally 30 cm in diameter and >14 m total length (4 m outdoors, 10 m indoors) at a nominal height of 1.8 m above the floor. A diagram and photograph of the facility is shown in Fig. 1. The air flow is pulled through the AATF by an impeller at the discharge of the tube on the roof of the building, and is capable of providing controlled mean flow velocities in the range of 0.5 to 20 m s−1 (2200 to 88 000 L min−1). Two outdoor inlets offer an option of either raw ambient air or filtered air pulled through a HEPA filter and an activated carbon filter to provide a clean reference plenum. The flow tube is constructed from stainless steel sections joined by rubber gaskets and clamps. The sections are covered in thermal insulation with a white fiberglass exterior to help maintain the temperature and relative humidity of the air as it flows through the tube. Being an ambient air facility, there is currently no capability of adjusting the temperature or relative humidity from ambient outdoor conditions. The outdoor seasonal changes at the AATF provide the capability of testing a range of ambient conditions, from hot and humid in the summer to cold and dry in the winter.
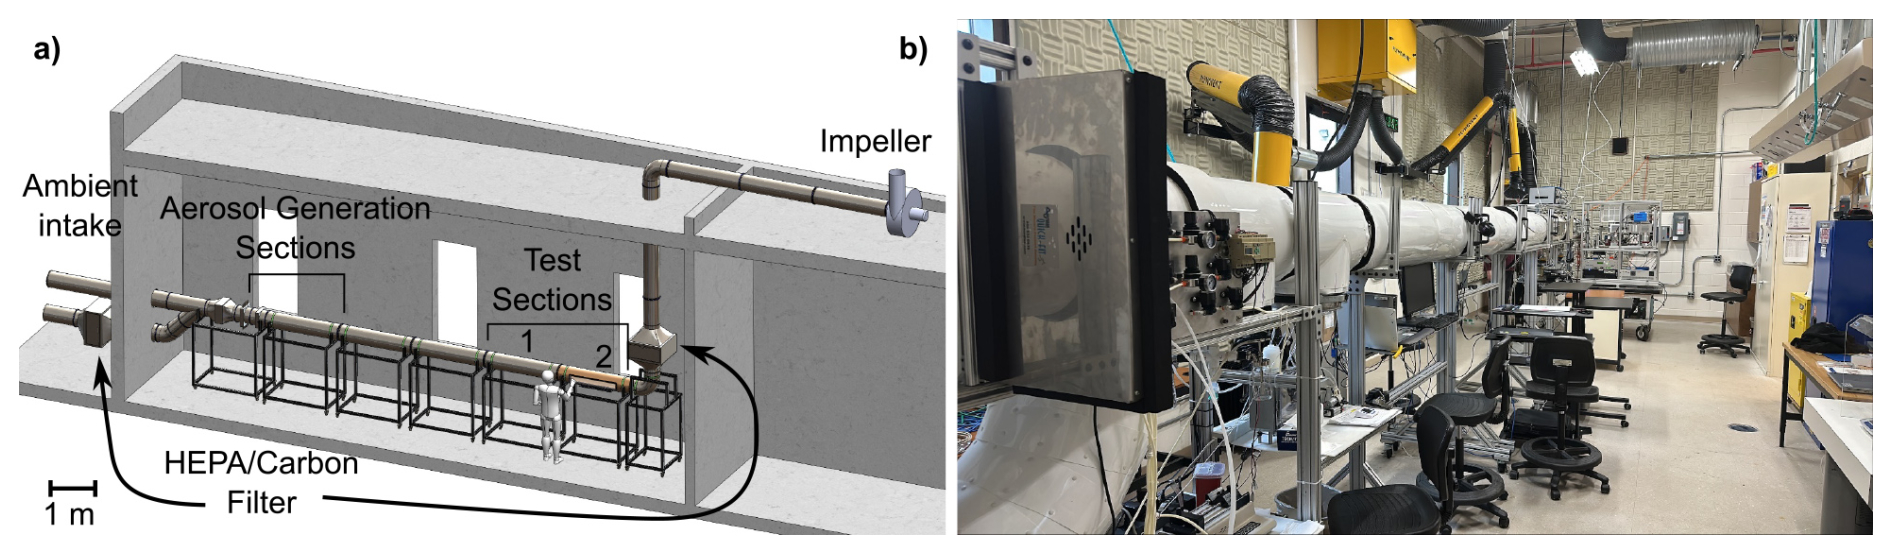
Figure 1(a) Diagram of the design of the AATF. (b) Photo of the implementation. Manufactured by S3I, Inc. (S3I Engineering, 2025).
Aerosols are typically injected into the flow tube in a section just after the tube enters the building. The aerosols travel nominally 4.5 m downstream before reaching two final sections where sampling takes place. This gives the aerosols a travel time of ∼ 2.25 s when the air flow velocity is 2 m s−1. For aerosols generated from liquid solutions or suspensions, this travel time generally allows for solvent evaporation to occur, resulting in a target material residue aerosol. The sampling tubes are located within 1.5 m of each other, corresponding to a travel time of 0.75 s.
After the sampling sections, flexible tubing of the same diameter as the AATF connects the flow tube to a second combination HEPA and activated charcoal filter. These filters remove the test materials from the airflow before the remainder of the air continues to the impeller mounted on the roof of the building and is discharged to the environment.
As a high-level summary, the AATF provides a continuous flow of ambient air (either complete with its environmental constituents, or as a clean plenum) into which one or more target or interferent material aerosols can be mixed in a controlled manner.
2.1 Aerosol Generation
The aerosols are introduced just downstream of the gate valves that control the inlet flow. Two sections of the tube are dedicated to aerosol injection from either liquid (solution or suspension) or powdered samples. Multiple aerosol generators are available with dedicated inputs into the AATF which allows for a variety of different aerosols to be generated simultaneously.
Many samples for the AATF are first dissolved or suspended in a solvent which is then injected into the air flow as a droplet spray. The subsequent solvent evaporation in the plenum results in a target material residue aerosol. The resulting aerosol size distribution is directly proportional to the initial droplet size distribution and the mass fraction of the dissolved (or suspended) target material in the solvent.
For the purposes of aerosol generation from liquids, attached to the AATF are two six-jet Collison nebulizers (CH Technologies (USA), Inc., 2025), a disposable medical nebulizer, a Sono-tek generator (Sono-Tek Corp., 2025), and a Tekceleo Micronice P&S T45 device (Tekceleo, 2025). Depending on the specific generator, parameters such as the generator pore size, starting solution concentration, fluid flow rate, air pressure/flow, and duty cycle can be varied to produce aerosols with desired characteristics such as aerosol size distribution and concentration.
The Collison nebulizer and the medical nebulizer are typically used to generate aerosols with the initial number median diameters under 1 µm. The Tekceleo and Sono-tek can be used with different heads to generate droplets in a wide range of diameters with number median diameters from 5–60 µm. Upon drying, the downstream aerosol mean diameter is smaller than at the generator (as small as <1 µm), but varies in size depending on the starting solution concentration. Additionally, the various generators can be operated at the same time to inject two or more aerosol populations simultaneously. When this is done, the individual size distributions are determined based on single compound dissemination immediately prior to or immediately after simultaneous dissemination.
Figure 2 shows one such example of the size distributions of simultaneous dissemination events. In (a), the total mass concentration of the simultaneous dissemination of glycerol and oleic acid as reported by a TSI APS 3321 (TSI Incorporated, 2025) unit is displayed. The APS itself is unable to discriminate between chemicals of different identities, and so the resulting mass concentration is an estimate of the actual mass concentrations. In parts (b) and (c), individual disseminations of glycerol and oleic acid are shown, respectively. Summing the individual disseminations (b) and (c) would result in roughly the same mass concentration distribution as was measured in (a).
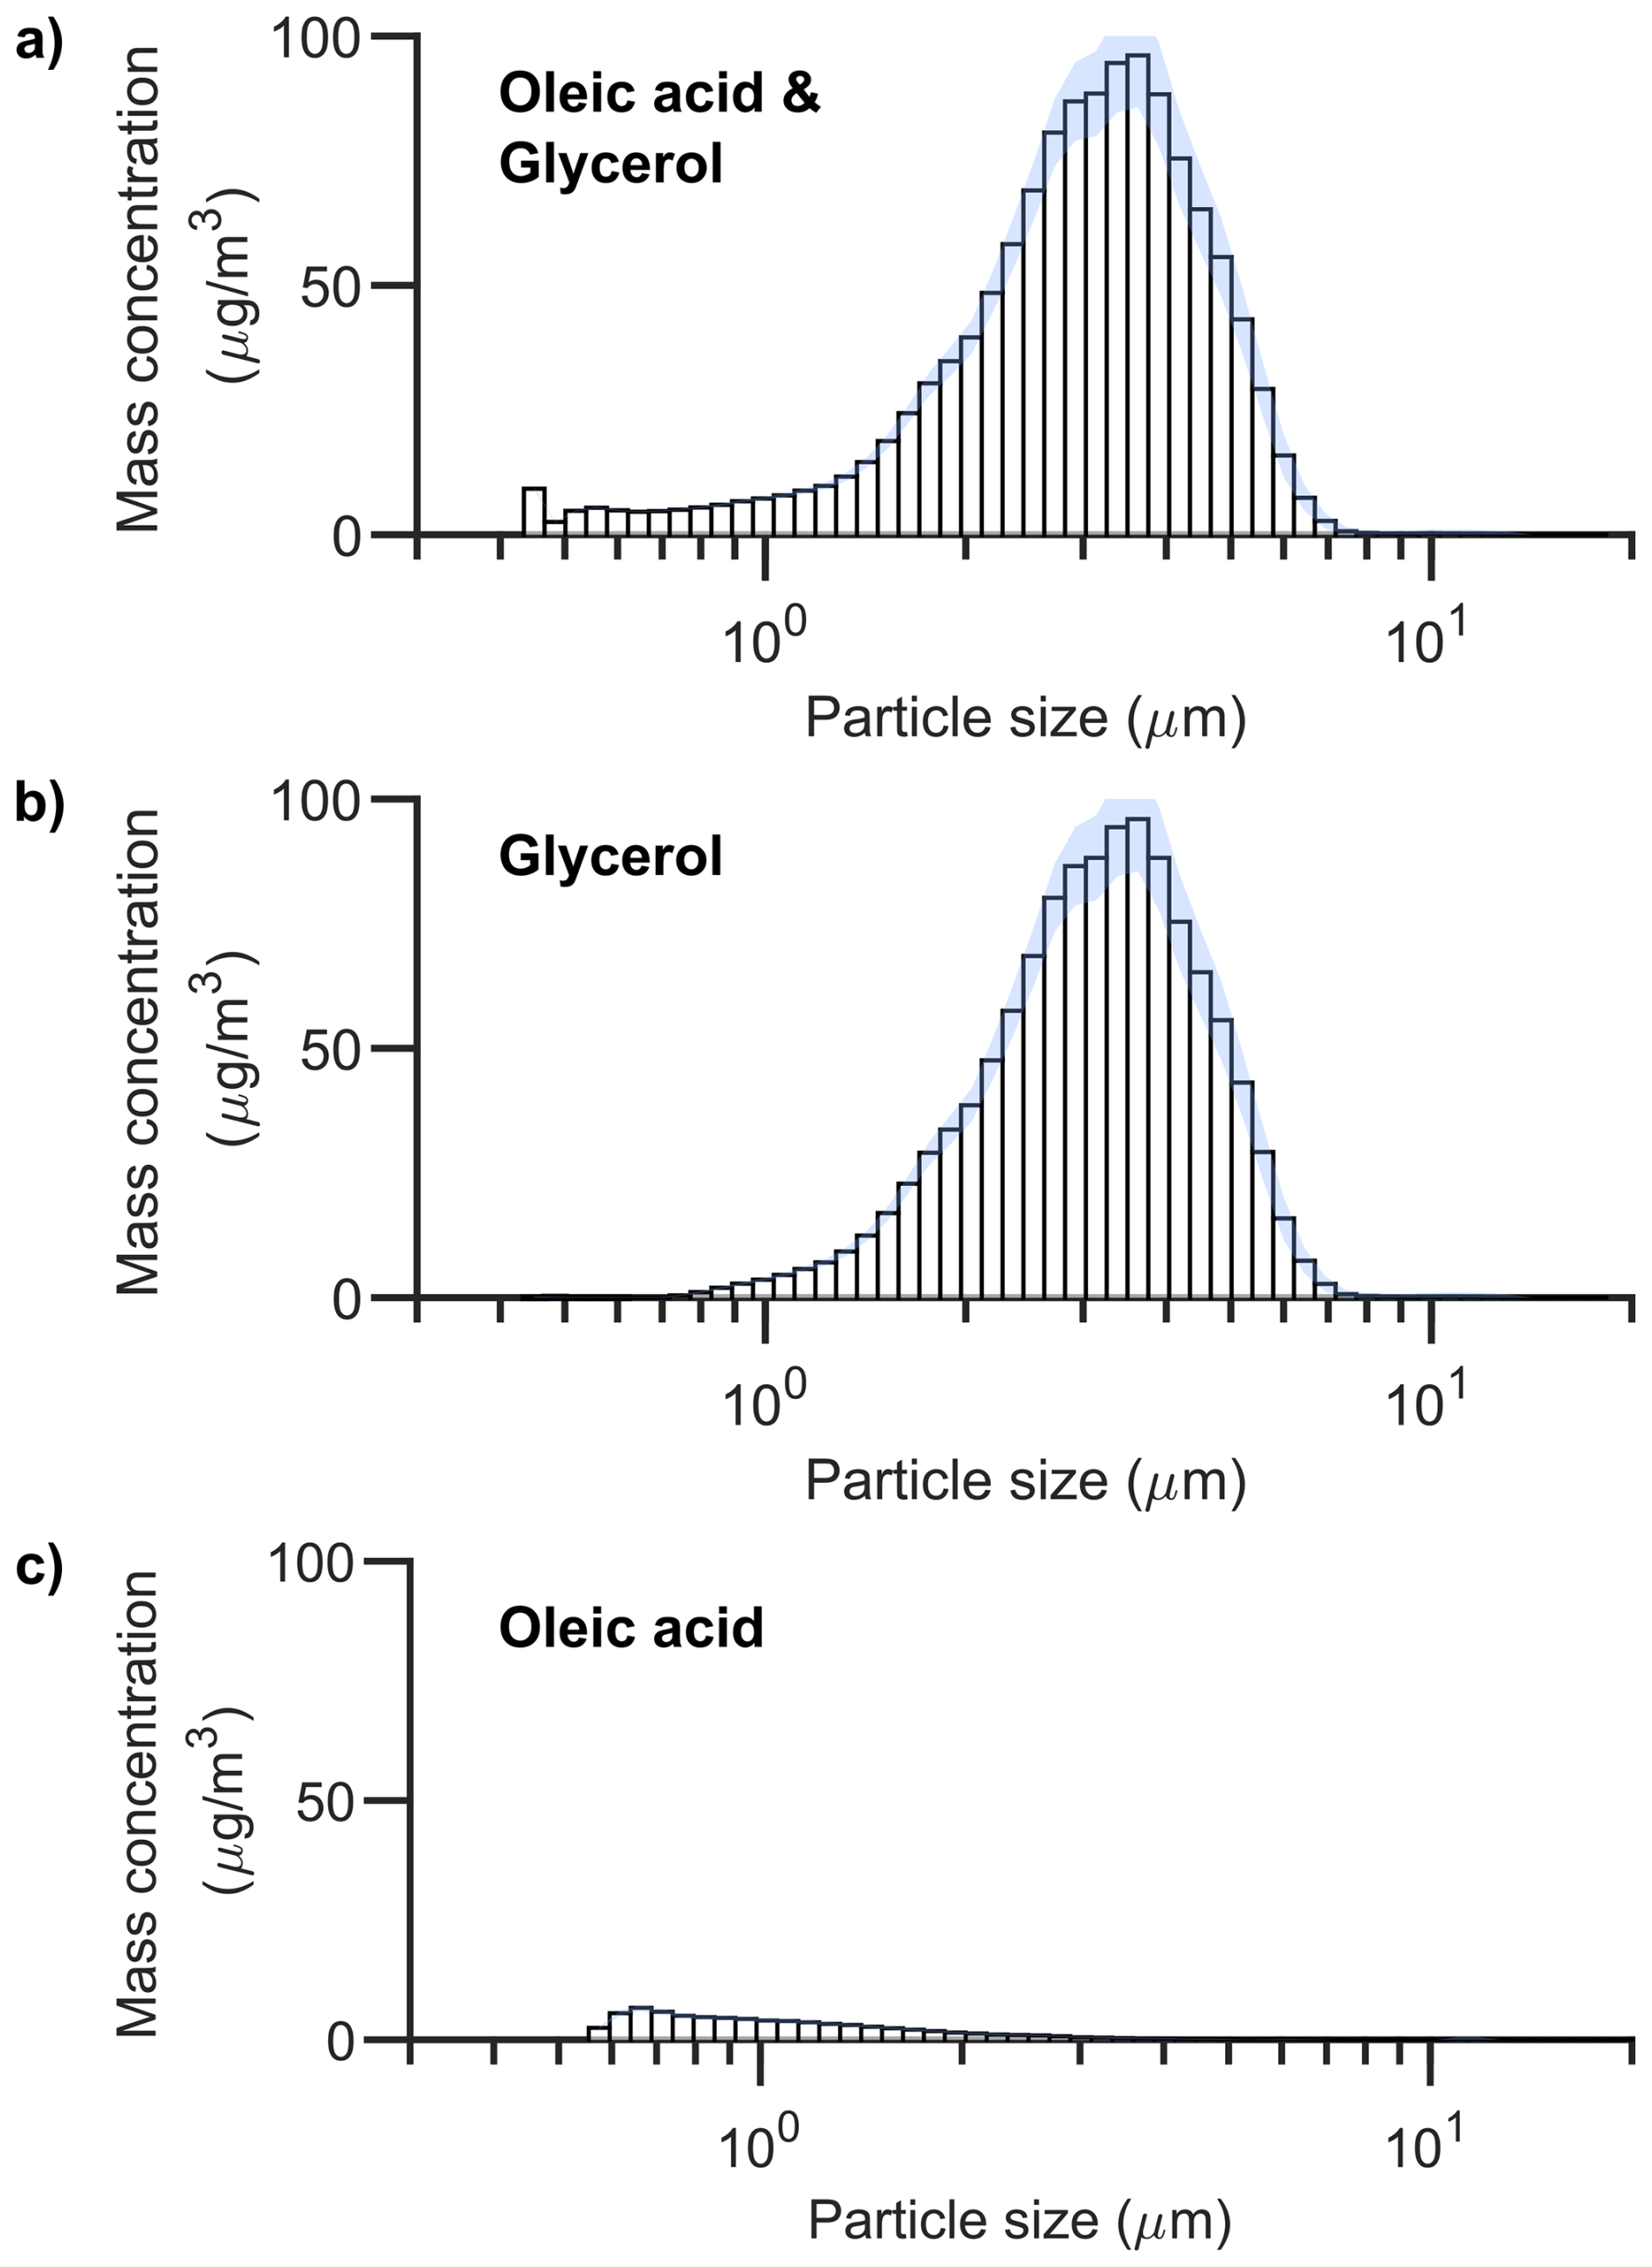
Figure 2(a) Simultaneous dissemination of glycerol and oleic acid. (b) Individual dissemination of glycerol. (c) Individual dissemination of oleic acid. The combined dissemination shown in (a) can be seen by eye to be roughly equivalent to the sum of the two individual chemical disseminations. (Mass concentrations as reported by APS 2. Shaded region is the standard deviation.)
Physical properties of the chemicals in the aerosols (such as vapor pressure, solubility, concentration, viscosity, surface tension, etc.) also affect the characteristics of the generated aerosols. The two largest factors that have been apparent in the AATF are vapor pressure and solubility. Generally, a higher vapor pressure results in a smaller number median diameter of the resulting aerosol due to a faster rate of evaporation. In these cases, to obtain a larger diameter aerosol, either a higher concentration of the target chemical is needed (which increases the amount of target chemical per droplet) or a larger initial droplet size needs to be generated (such as by changing which generator is used or the specific head that is being used.) In turn, this means that the maximum solubility of a given target chemical dictates the maximum particle diameter that can be achieved with a given target/generator pair. A very low solubility chemical will result in a low median diameter. One way to mitigate this effect is to change the solvent for one that more readily dissolves the target chemical.
Powdered samples can be introduced using a custom Venturi turntable device similar to the one described by Reist and Taylor (2000). Powder is continuously fed onto the turntable using a Sympatec VIBRI/L vibratory feeding unit (Sympatec GmbH, 2025) that allows for crude control of the amount of material being loaded into the groove of the turntable. The rotational speed of the turntable and the Venturi airflow rate can also be varied to control aerosol concentration.
2.2 Aerosol Homogenization & Turbulence Characteristics
The mean flow velocity is typically maintained at a nominal value of 2 m s−1 (8800 L min−1). This value was chosen based on two criteria: it represents a statistical annual mean value of the outdoor wind velocity for the Washington, D.C. metropolitan area, and it usually provides an adequate travel time from the aerosol generation section to the test sections of the wind tunnel to allow for completely drying solvent-based microdroplets. Despite this relatively slow flow rate, the flow in the wind tunnel is significantly turbulent with a Reynolds number Re=40 000, which is well above the transition region between laminar and turbulent flow (between 2000 and 4000) (Saldana et al., 2024). Sampling takes place 4.5 m downstream of the aerosol injection after fully developed turbulent flow has been established, providing thorough and uniform mixing of the aerosol.
A critical design consideration for the AATF is the mitigation of particle loss from gravitational settling and thorough homogenization of the aerosol sample into the flow of the AATF. The terminal settling velocity of a particle, as described by Stokes' Law, increases with the square of its diameter. For example, a 10 µm particle would settle at approximately 0.3 cm s−1 in a quiescent environment. This would mean that in the time that it takes for particles to reach the test section, the larger particles would have settled 0.75 cm downward, and in the sampling region, they would have settled an additional 0.23 cm if the flow were laminar. However, in the AATF's fully developed turbulent flow regime, particle transport is dominated by turbulent diffusion rather than gravitational settling. The characteristic velocity of the turbulent fluctuations is estimated as 5 % of the mean flow velocity, or approximately 10 cm s−1, which is more than 30 times greater than the terminal settling velocity of a 10 µm particle. When the ratio of the velocity of the turbulent fluctuations to terminal settling velocity is significantly greater than one, particles remain suspended and well-mixed (Hinds, 1999). The AATF's operating conditions therefore ensure that particles across the tested size range are effectively homogenized and transported to the sampling region, minimizing gravitational losses.
Although the instantaneous velocity distribution in turbulent flow is not known, empirical power law expressions for the fully developed mean velocity profile across a cylindrical pipe flow are well known. They describe the flattening of the velocity profile across the central disk of the flow with extremely high shear flows near the walls of the cylinder. At high Re values, this is sometimes referred to as “plug flow”. In Fig. 3, we used an expression from a recent reference (Salama, 2021) to calculate the velocity distribution shown for our specific conditions:
where , r is the distance from the center of the tube, and R is the radius of the tube. Using where the derivative of the velocity profile equals unity as a (somewhat arbitrary) boundary between the high-sheer wall flow, indicates that the velocity variation for the central 85 % of the diameter of the flow cross section is only 20 % of Vmax at the centerline.
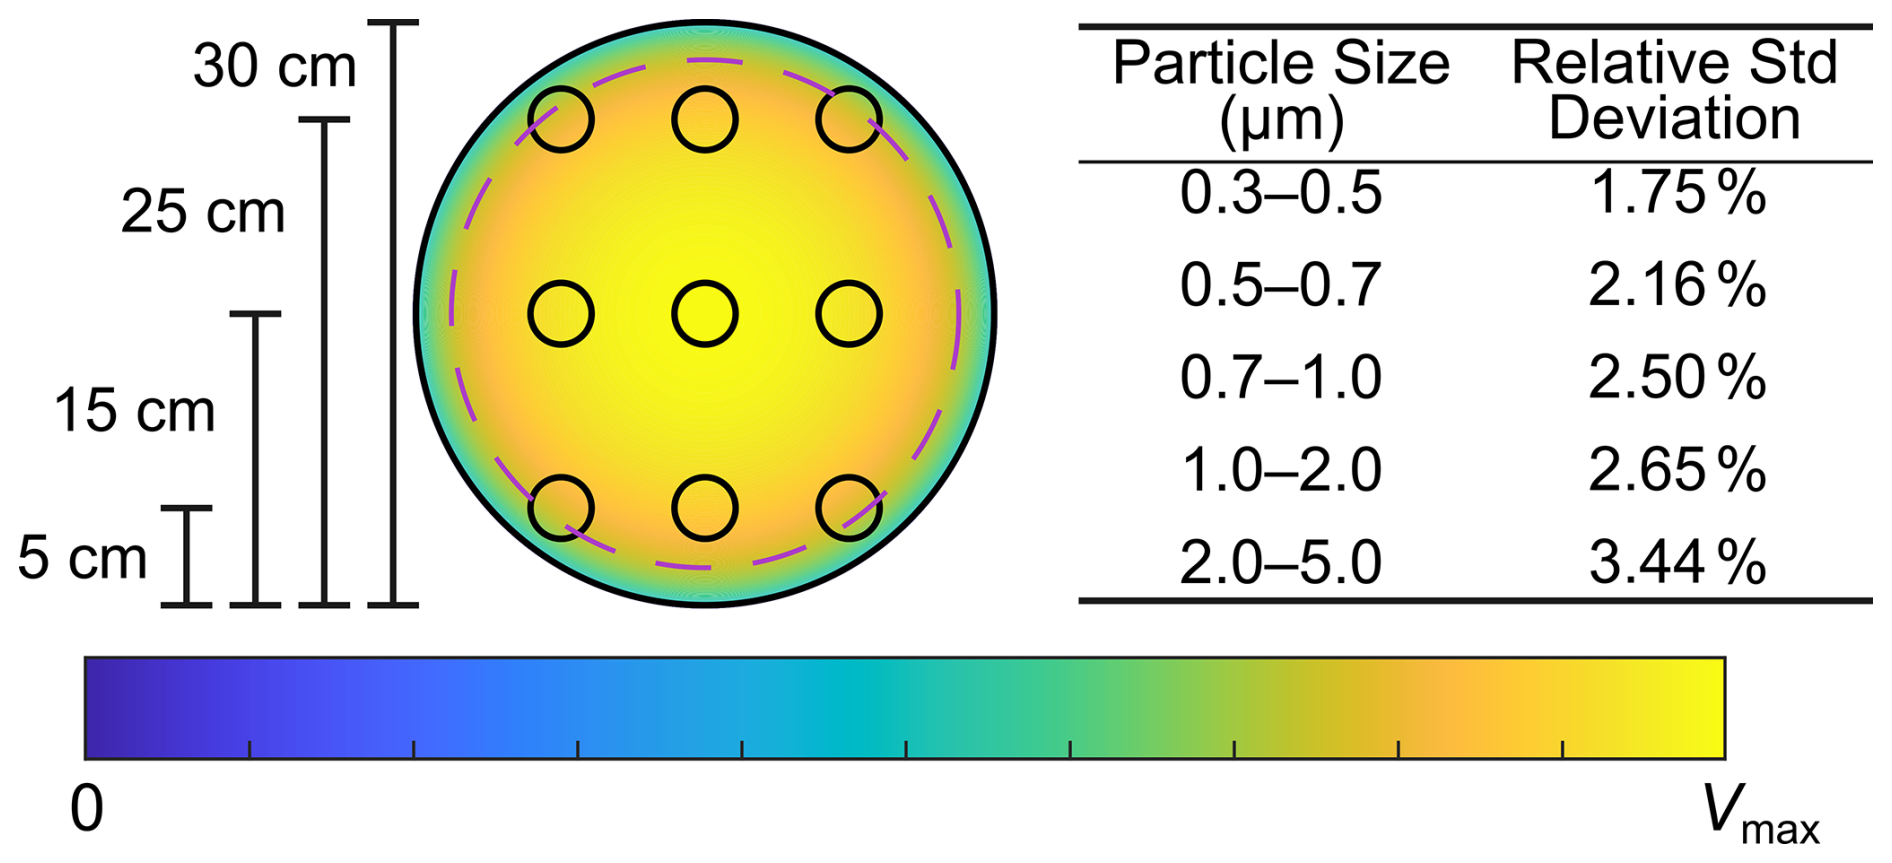
Figure 3The schematic on the left indicates the locations of fixed sample positions within the cross section of the AATF wind tunnel. The contour color indicates the mean velocity profile of the cross section of the tunnel. The dashed line indicates where the slope of the derivative equals unity. The table on the right tabulates the variation of the particle counts across all the sample locations for a polydisperse calibration aerosol over a fixed period of time with a Vmax=2 m s−1, as a function of particle size range. The somewhat larger variation among the largest size range is partially due to the relatively lower number of particles sampled.
Measurements of a polydisperse calibration aerosol (ammonium nitrate) were made of aerosol concentrations sampled at different locations within the central disk of a single cross-section of the first test section as shown as small circles in the cross-section of Fig. 3. Relative standard deviations of multiple aerosol concentration measurements show that good uniformity was achieved for different particle size ranges of the polydisperse aerosol in the flow tube, even for sampling locations that were only partially in the central disk. This result indicates that staggering sampling tubes across the face of a cross-section should have little impact on a given detector's accuracy provided that the sampling probe is not physically obstructed by other probes or objects. Actual instrument sampling locations were fully within the central disk.
2.3 Instrumentation
Diagnostic instruments were selected to provide measurements in four categories: individual aerosol particle measurement (count, size, etc.), aerosol loading, aerosol composition, and flow characterization (velocity, temperature, and relative humidity). A complete list of the diagnostic equipment following this categorization is provided in Table 1. Redundancy in some of these measurements was deliberate. For example, one TSI APS 3321 unit was installed in each of two test sections, Test Section 1 (TS1) and Test Section 2 (TS2) with sampling probes at different heights and lateral positions so that no sampling tube was obstructed by a preceding sampling tube. This provides assurance of consistency in sampling and provides a backup data source in case one instrument malfunctions.
The two APS units, the Palas Promo 2000, and the UHSAS were calibrated by their respective manufacturers prior to the validation study and their performance verified in our lab prior to installation at the AATF.
Specifically, to decouple inherent instrument variability from potential spatial sampling differences within the facility, a side-by-side intercomparison of the two APS units was performed in the lab. Using NIST-traceable polystyrene latex (PSL) spheres, the two units demonstrated excellent agreement, showing a percent difference of less than 5 % at 2 and 4 µm sizes. A higher percent difference of approximately 45 % was observed at 1 µm, which is attributed to differences in the instrument age and calibration cycles between the two specific units at the time of the baseline test. To ensure the highest fidelity in isolating individual instrument response from spatial sampling effects, standard operating procedures for future studies at the AATF will include side-by-side baseline comparison to establish a relative calibration matrix.
Droplet Measurement Technologies certifies that their calibration exceeds ISO Standard 21501-1 (International Organization for Standardization, 2009). It is acknowledged that, as is fundamental to all aerosol sizing techniques, measurements of non-ideal aerosols carry inherent uncertainties related to material properties (e.g., density, refractive index) that differ from the spherical calibration aerosol.
Table 1Diagnostic Equipment at AATF. TS1 = Test Section 1, TS2 = Test Section 2, HEPA = HEPA inlet, Ambient = Ambient inlet.
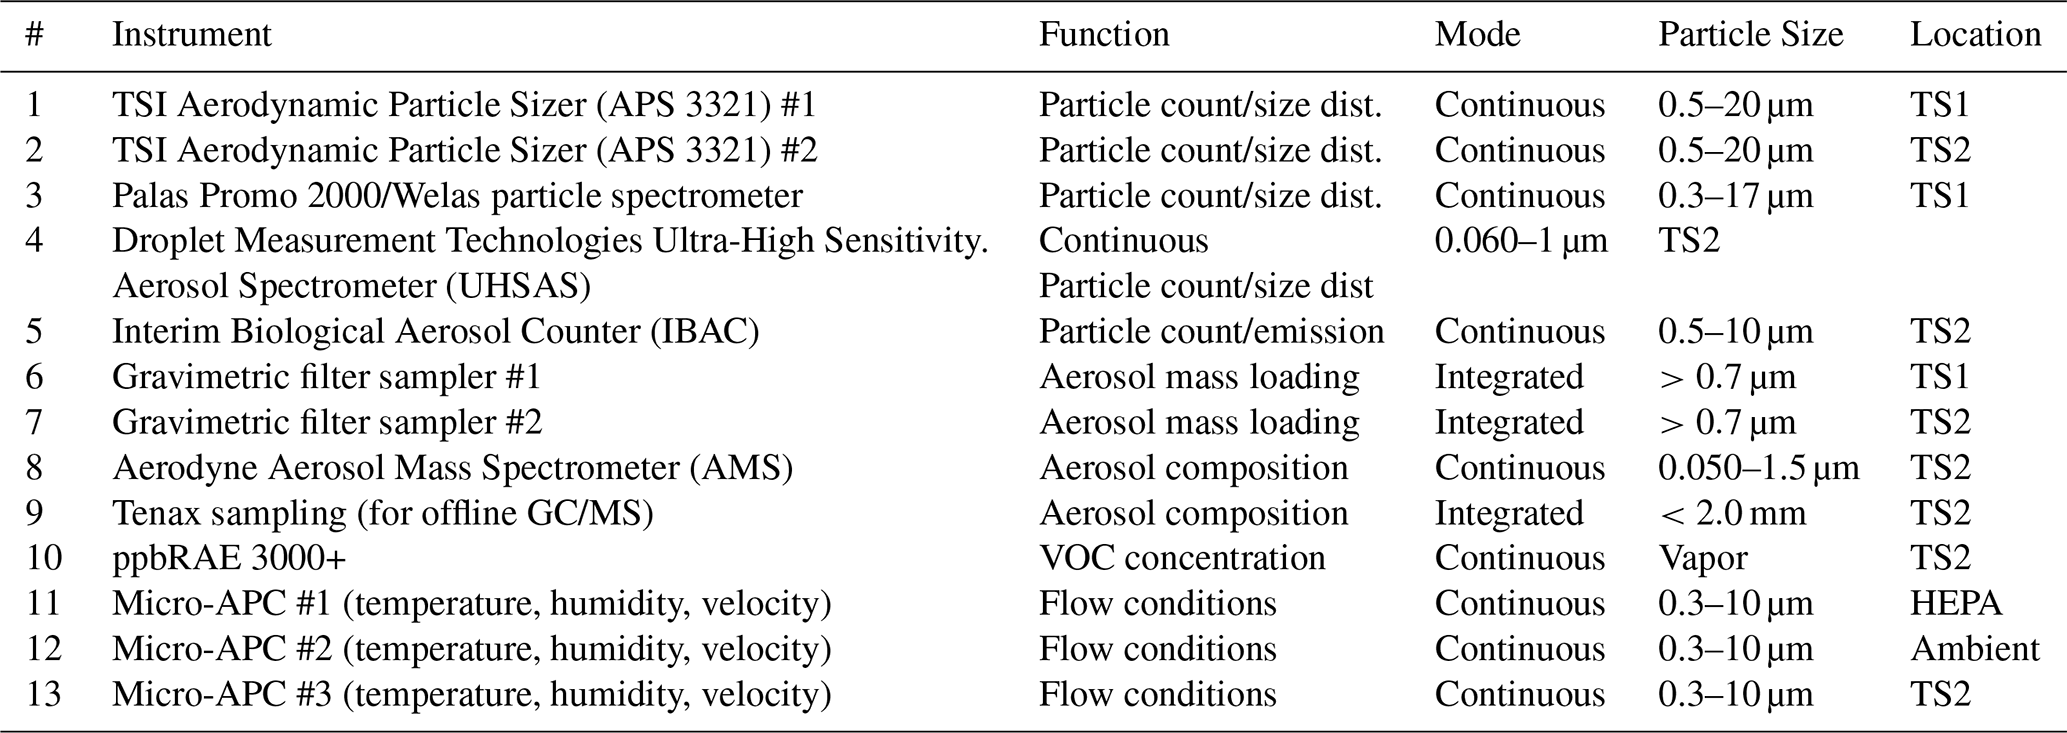
In general, aerosol size distributions are obtained using optical interrogation measurements on individual aerosol particles, but specific methods differ. For example, the APS 3321 and the Palas Promo 2000 with Welas sensor (Palas GmbH, 2025) acquire similar data by counting and sizing individual particles sampled out of the flow on a continuous basis, however, their principles of operation are distinct. The APS measures individual particle velocity (following an accelerating flow) and relates that measurement to aerodynamic drag, while the Promo measures the intensity of white light scattered into a large solid angle, and relates that to an equivalent scattering cross section and the corresponding sphere diameter. Both of these instruments require calibration using aerosols of polystyrene latex spheres (PSL) of known diameter, density, and refractive index to provide a meaningful equivalent spherical size scale. The APS sizes particles in 52 bins from 0.5–20 µm and samples 5 L min−1 of total air with 1 L min−1 being sample flow. (Note that the sampling efficiency of the APS 3321 becomes very low after about 15 µm (Vasilatou et al., 2022).) The Promo samples particles in 128 bins from 0.3–17.5 µm with a total sample flow of 5 L min−1.
Since these types of instruments measure individual particle events, the aerosol particle concentration can be estimated from the known flow rates through these instruments and the total counts for some fixed time interval. Additionally, the data can be displayed as distributions of assigned aerosol equivalent sphere diameter either by number count vs. size or by calculating an equivalent sphere volume and estimating individual particle mass based on the bulk density of the known material. Using these computed values, one can provide a plot of aerosol mass as a function of aerosol size.
Gravimetric filter samplers (Hi-Q RVH-25, HI-Q Environmental Products Company, Inc., 2025) open-faced combination filter paper and cartridge holders and Whatman Grade GF/F borosilicate glass filters, (1825-047) were used to collect the aerosols for a fixed time interval with the filters being weighed before and after collection. A Mettler-Toledo XS205 Dual Range balance (Mettler-Toledo, 2018) with readability to 0.01 mg was used for the mass measurements. A shrouded probe was used to collect these samples. In order to maximize mass on the filter paper, the flow rate was set to 18 L min−1, the maximum rate that still maintained laminar flow in the collection tube. After collection, the weighed mass could then be compared to the estimated masses calculated from the APS and Promo distributions as another measure of ensuring accuracy in sampling and consistency between instruments.
While the APS and Promo sample micron-sized particles, the Ultra High Sensitivity Aerosol Spectrometer (UHSAS, Droplet Measurement Technologies, 2025) samples particles in 100 bins from 60 nm to 1 µm and with a flow rate less than 0.1 L min−1 of air. The IBAC (S3I Engineering, 2025) provides particle count and fluorescence particle count information. The ppbRAE 3000+ (RAE Systems, 2025) monitors the presence and concentration of volatile organic compounds (VOCs) in the AATF. It is most useful when monitoring the concentrations of the organic solvents used to disperse the target chemicals and less useful in determining the mass fraction of high vapor target chemicals that is evaporating enroute.
Three micro-aerosol particle counter (APC) units from Sparkfun Electronics – SCD41 SEN55 (Qwiic) (SparkFun Electronics, 2025) were used to collect temperature, humidity, wind speed, and particle counts in four size bins: PM1, PM2.5, PM4 and PM10. One sensor was placed on each of the inlet arms (filtered and ambient air), and the third was placed at the end of the last test section. These particle counters are unique in that they are a flow-through design where the instrument is placed inside of the AATF itself and no additional sampling probe is necessary.
Aerosol composition was determined from the Aerodyne Aerosol Mass Spectrometer (AMS, Aerodyne Research, Inc., 2025) as well as through an integrated sample collection in a Tenax tube which was post-processed on an Agilent Gas Chromatograph/Mass Spectrometer (GC/MS).
For dissemination from an organic solvent, the ppbRAE 3000+ was used to monitor the vapor concentration of the solvent in the AATF. While this did not provide any information on the desired aerosol, it did assist in determining whether organic vapors were still present at times after dissemination. This was useful for determining purge time between samples.
Instrument data was collected on different computers or on the instruments themselves. External computers were used to stream the data from the two APSes and the UHSAS. The Promo, IBAC, and ppbRAE 3000+ detector recorded data on their internal storage which was later downloaded from the instruments. Time on all networked computers was synchronized every five minutes to a Time Machines TM1000A GPS NTP Network Time Server to ensure all data records were timestamped accurately and could be easily collated during postprocessing. The IBAC and ppbRAE 3000+ were manually synchronized once each day as they had no network capability. Instrument data was typically integrated over a 10 s collection period before being recorded.
2.4 Shrouded Probes
While the turbulent condition of the AATF flow offers benefits as described above, it complicates sampling aerosols out of the main flow. Under laminar flow conditions, all of the flow lines (fluid velocity vectors) are parallel with the axis of the pipe that the fluid is moving through. Consequently, in the absence of external forces (such as gravity) the velocity vectors of particles entrained in the fluid will likewise be parallel with the fluid velocity and the pipe axis. For this circumstance, the best practice for particle sampling is to arrange the sample collection tube inlet to be facing upstream, iso-axial with the main pipe flow, and to adjust the flow rate in the collection tube so that the velocity of the fluid entering it remains the same as the velocity in the main flow of the pipe. This method is known as isokinetic sampling (Dennis et al., 1957). However, if the main flow is turbulent, then local instantaneous fluid velocities are random in both time and position (stochastic.) This means that near the entrance of the collection tube, fluid and the entrained particles in the fluid will have radial velocity components as well as axial velocity components and particles will necessarily come into contact with the collection tube walls. For this reason, even if the flow velocity of the fluid in the collection tube is matched to the mean velocity of the turbulent main flow, potentially significant particle deposition can occur on the wall of the collection tube. Moreover, the deposition rate will be size (or mass) dependent, so that both the number distribution and the mass loading of the collected flow can be significantly altered from the original distributions in the main flow in ways that cannot be accounted for a priori (McFarland et al., 1989; McFarland and Rodgers, 1993; Fearing et al., 2020).
Empirically, a method for particle sampling out of a turbulent flow has been developed to minimize wall deposition and particle size or mass sample biasing (McFarland et al., 1989; McFarland and Rodgers, 1993; Fearing et al., 2020). This method involves manufacturing shrouded probes for sampling to diagnostic instrumentation. The probe designs were published (Fearing et al., 2020) with detailed dimensions for an outlet flow collection tube with a 3.77 cm OD. These designs were copied and scaled down for application to the AATF. An added benefit to this design is that the collection tube flow rate and the main flow velocity are decoupled. For a fixed mean turbulent flow, the collection tube flow can be varied over a wide range without affecting sampling bias by particle size. Experimental studies have verified (Chandra and McFarland, 1995, 1997; Fearing et al., 2020) that both transmission and aspiration ratios of shrouded probes remain close to unity (100 % efficiency) for sampling oleic acid droplets with diameters near 10 µm in highly turbulent wind tunnels. Studies comparing a shrouded probe to standard isokinetic sampling of 10 µm diameter particles determined that isokinetic collection under-sampled by about 50 % compared to shrouded probe sampling (Chandra and McFarland, 1995; Fearing et al., 2020).
Multiple diagnostic instruments needed to be accommodated for aerosol particle sampling out of the AATF, and each instrument has a specific combination of flow rate and sample collection tube inlet diameter. We fabricated a set of shrouded probes standardized to a projected upper limit to the expected flow rates and diameters of collection tubes. A collection tube size of 12.7 mm OD and ID of 11.6 mm was chosen. This corresponds to a scale factor of of the originally published shrouded probe design. An upper limit to the flow rate in the collection tube would be determined by the point at which the flow inside the tube begins to transition from laminar to turbulent, i.e. at Re=2300. This condition results in a maximum collection tube flow rate of about 18 L min−1.
To adapt this standard shrouded probe sampling system to each individual instrument, one can take advantage of the fact that the flow in the collection tube is laminar and use an isokinetic coupling of the flow in the collection tube to the laminar flow of the instrument inlet. Figure 4 illustrates a complete sampling system for an example instrument, the Palas Promo 2000 with a Welas sensor. The governing Navier-Stokes equations provide a parabolic velocity profile with the no-slip boundary conditions of the velocity vector being zero at the tube walls for fully developed flow according to the equation:
where R is the inner radius of the tube and ρ is some radius away from the centerline (Drazin and Riley, 2006). For collection tube and instrument inlet, Vmax is at the center of the two concentric cylinders and zero at the walls of the collection tube just prior to the instrument inlet tube.
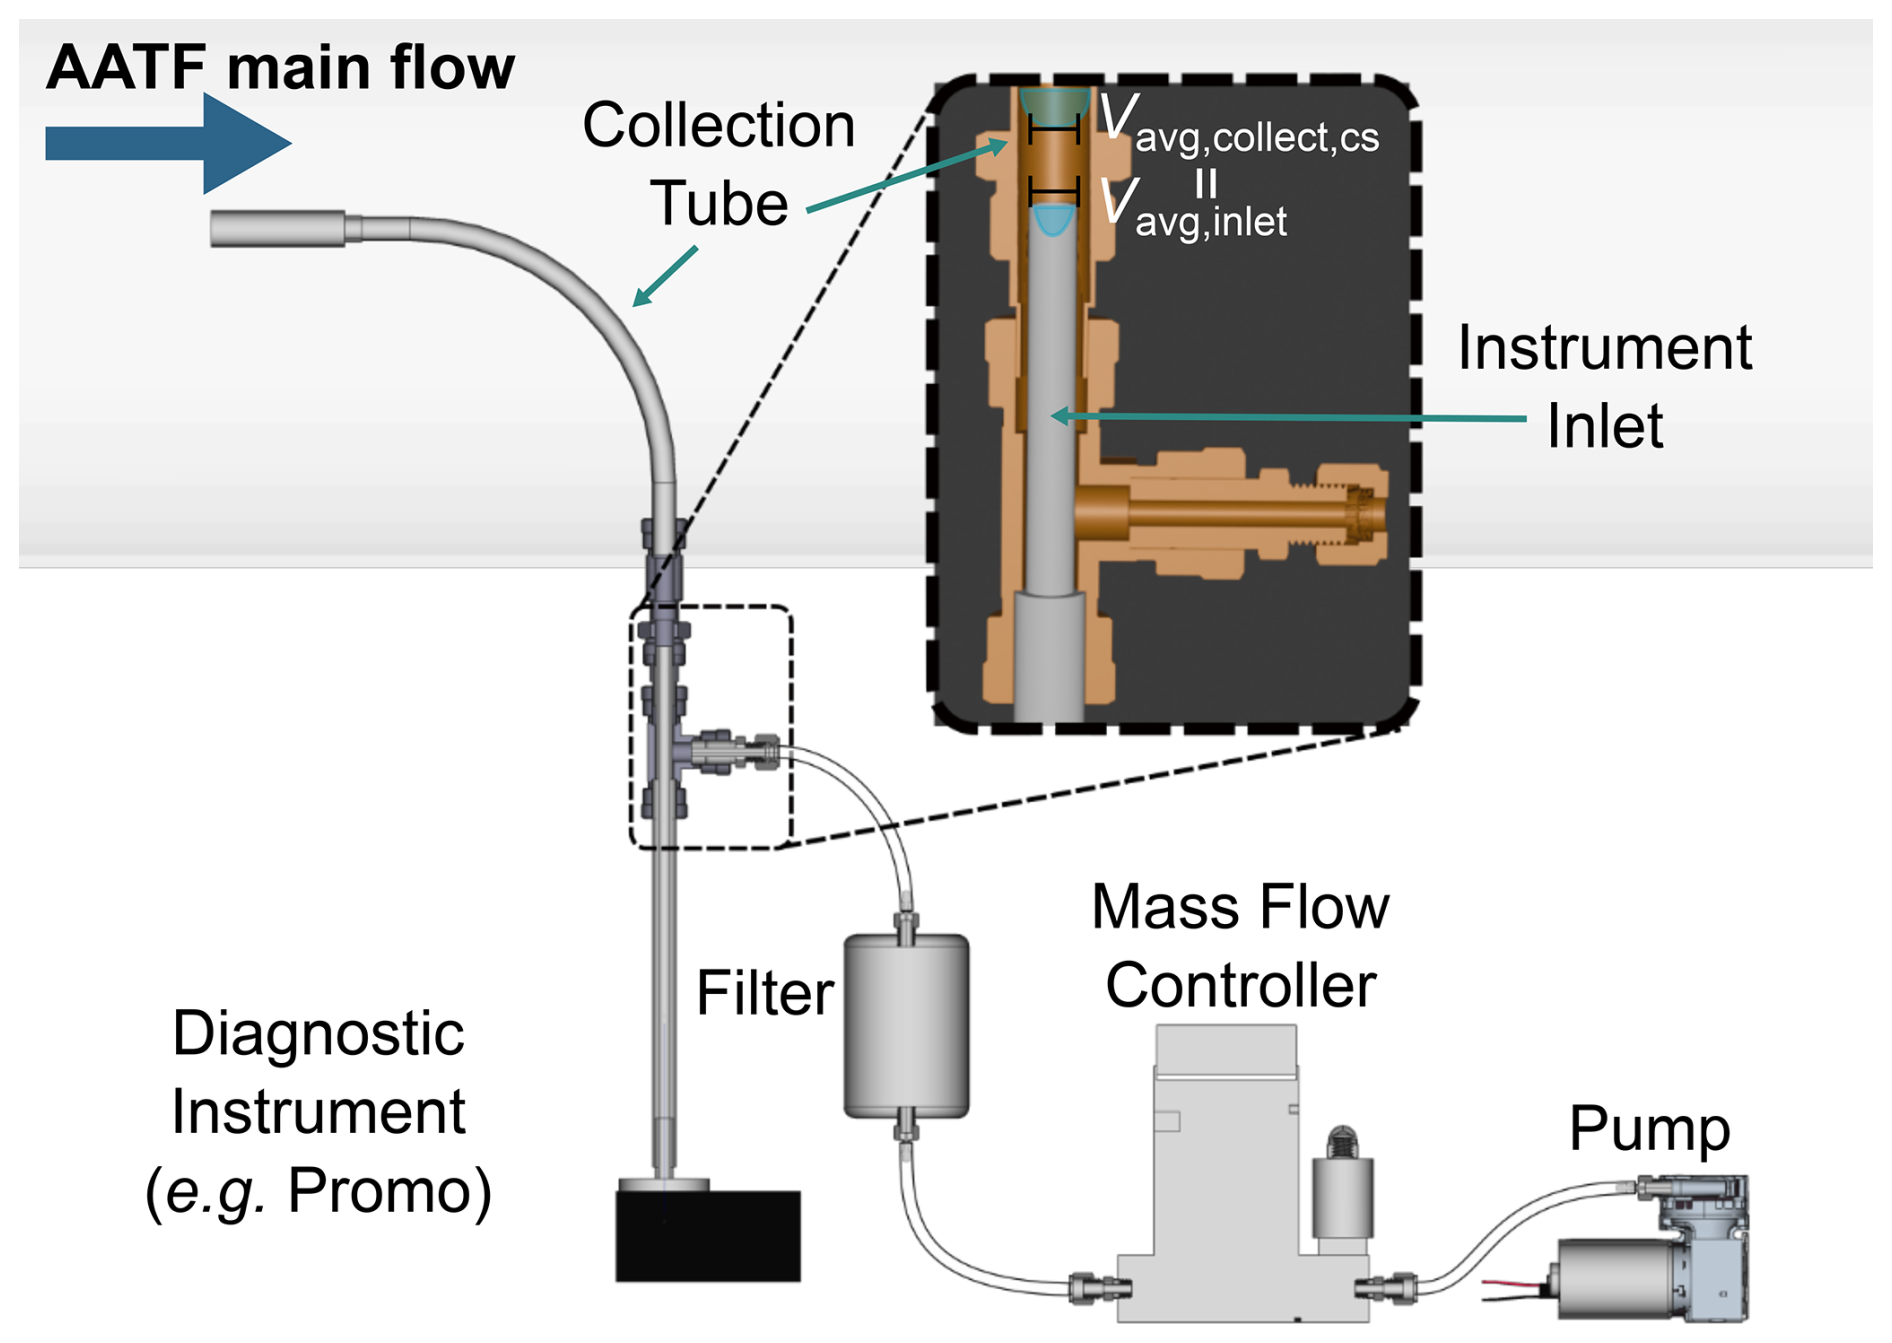
Figure 4A mechanical drawing illustrates the process by which an aerosol sample is drawn from the AATF to a representative instrument (Promo) using a shrouded probe and isokinetic coupling inside the collection tube. The total collection flow is the sum of the Welas flow and the Mass Flow Controller (MFC) flow.
The average velocity in the instrument inlet (Vavg,inlet) and the average velocity in the collection tube in the cross-sectional area that corresponds to the instrument inlet () are equal to preserve flow continuity. In general, integrating the parabolic profile of the flow yields an average velocity of:
where R is the inner radius of the collection tube, and r is the inner radius of an instrument's inlet tube such that r≤R. For the case that r=R, it is easily seen that .
For the example instrument in Fig. 4, the sensor has an inlet with an ID of 6.85 mm and an internally controlled flow rate of 5 L min−1. From these parameters one can calculate that the mean velocity for the Promo inlet tube is m s−1. Since , Eq. (3) can be solved to show m s−1 with r=3.42 mm. Since the maximum velocity is at the centerline, it is also the maximum velocity of the velocity profile for the entire diameter of the collection tube ( mm.) This yields a mean velocity, m s−1. In turn, this means that the flow rate in the collection tube should be 8.68 L min−1. Since the Promo only pulls 5 L min−1, an additional 3.68 L min−1 needs to be pulled through the probe to meet the isokinetic sampling conditions. This flow is made up with a mass flow controller (MFC) which pulls excess flow around the inlet tube of the Promo and exits the collection tube through a tee-fitting downstream of the instrument inlet tube (see inset in Fig. 4). The excess flow is filtered through a HEPA cap filter so as to minimize target material discharge into the room air. All instruments requiring a shrouded probe were coupled in this fashion with the additional flow adjusted for their specific requirements using a dedicated mass flow controller.
In a typical experiment, air flow velocity is maintained at nominally 2 m s−1 which corresponds to a flow rate of about 8.5 m3 min−1 (about 140 L s−1) in the AATF flow tube. Before the first run of the day, HEPA filtered air is run through the flow tube for approximately 30 min to ensure that the tube is free of any undesired particles. During this time, all of the particle counters are turned on and begin collecting data. The counters should consistently report a minimal number of particles, which also serves as a baseline particle count. For the most part, these run continuously, but some collectors such as the Tenax tube and filter paper collectors are only active while a sample is actively injected into the flow tube.
After this startup period, a target chemical can be injected into the airstream, typically for a length of time between 1–60 min. Additionally, either unfiltered ambient air or HEPA/carbon filtered air can be selected for any given sample. Unfiltered air will raise the baseline counts in all of the particle counters since the air is drawn from outdoors straight into the flow tube and outdoor particle counts vary based on a given day's pollen counts, pollution level, or other factors (such as vehicle exhaust, active construction, or a local active fire) occurring at or near the air intake. After a run, particle counts in the various particle counters are allowed to return to their baseline before a new sample is introduced, typically anywhere from 1–15 min. When changing samples, for chemicals that persist in the aerosol generators or when changing from one solvent to another, solvent rinses can be run for 5–15 min at a time to flush out any remaining target materials until the particle counts return to baseline. It is sometimes beneficial to warm the solvent to aid in the removal of the previous target chemical. Multiple rounds of solvent cleaning are sometimes needed. Since many of the generators recycle solution, a new clean container and fresh solvent for each round of cleaning is recommended. At the end of the day, the last solvent rinse is water, after which the generators are turned off and allowed to air dry. HEPA filtered air is run through the flow tube for an additional 10–30 min to aid in drying and to ensure that any remaining particulate material has been removed from the flow tube.
In the validation studies, caffeine (6 g L−1, water), oleic acid (5 g L−1, ethanol), tributyl phosphate (TBP, 8 g L−1, ethanol), and phenanthrene (6 g L−1, ethanol) were generated as aerosol test chemicals with target aerosol mass concentrations of 100 µg m−3 (low), 500 µg m−3 (medium), and 800 µg m−3 (high) in the AATF flow tube. Three trials at each target concentration for each individual chemical were conducted. The results were compared between trials and between instruments.
Each instrument has its own unique size range of particles that it is able to detect (see Table 1), with a strict overlapping range between all instruments being only 0.5–1 µm. This relatively narrow range of particles is not a useful representation of the whole sample, especially given that the median diameter based on mass is typically >1 µm. This makes simultaneous direct comparison between all instruments challenging. While many of the individual particle counting/sizing instruments had separate manufacturer calibrations performed at the beginning of this project, an independent, simultaneous in situ assessment of their instrument response functions using spherical aerosol particles of known diameter was beyond the scope of this work. Consequently, close agreement among all these instruments in terms of absolute numbers of particles was not expected. Nevertheless, significant general agreement among these instruments was obtained for an aerosol size range between 0.6–17 µm. Figure 5 displays overlaid histograms of the average number (upper plot) and mass concentrations (lower plot) of four optical particle counters (an APS in test section 1, an APS in test section 2, the Promo, and the UHSAS) from a single dissemination event of 5 g L−1 oleic acid in ethanol.
The horizontal axis for both plots is the same, a logarithmic scale from 0.060–20.0 µm. (As a reminder, the three instrument types measure different specific particle characteristics and an empirically calibrated, and computed equivalent sphere diameter is reported.) The two main features from these histograms are: the three micron-sized particle counters (the APSes and Promo) are in reasonable agreement, and the counts from those instruments are roughly 4–5 times higher than the submicron-sized particle counter (the UHSAS) in the narrow region of size overlap. While quantitative determination of the absolute instrument response functions for any of these devices is not available, it is likely that for all of these instruments, their response functions will show increased uncertainty and error near the endpoint of their respective size limits. That said, it is interesting that all three of the micron-sized particle counters show maximum levels and an increasing slope for smaller particles near their respective lower size limits, while the UHSAS distribution shows maximum counts near 100 nm with a gradual decline in numbers going toward its upper size limit (1 µm). It is reasonable to speculate that at least part of the explanation of the lower UHSAS counts for particles in the sub-micron size range is due to its very small coupling tube diameter (about 0.05 cm) and flow rates (0.83 cm3 s−1) corresponding to approximately 0.35 m s−1 mean velocity. The consequences of small diameter sampling tubing and low velocity flows is known to bias against larger particles due to wall losses and gravitational settling.
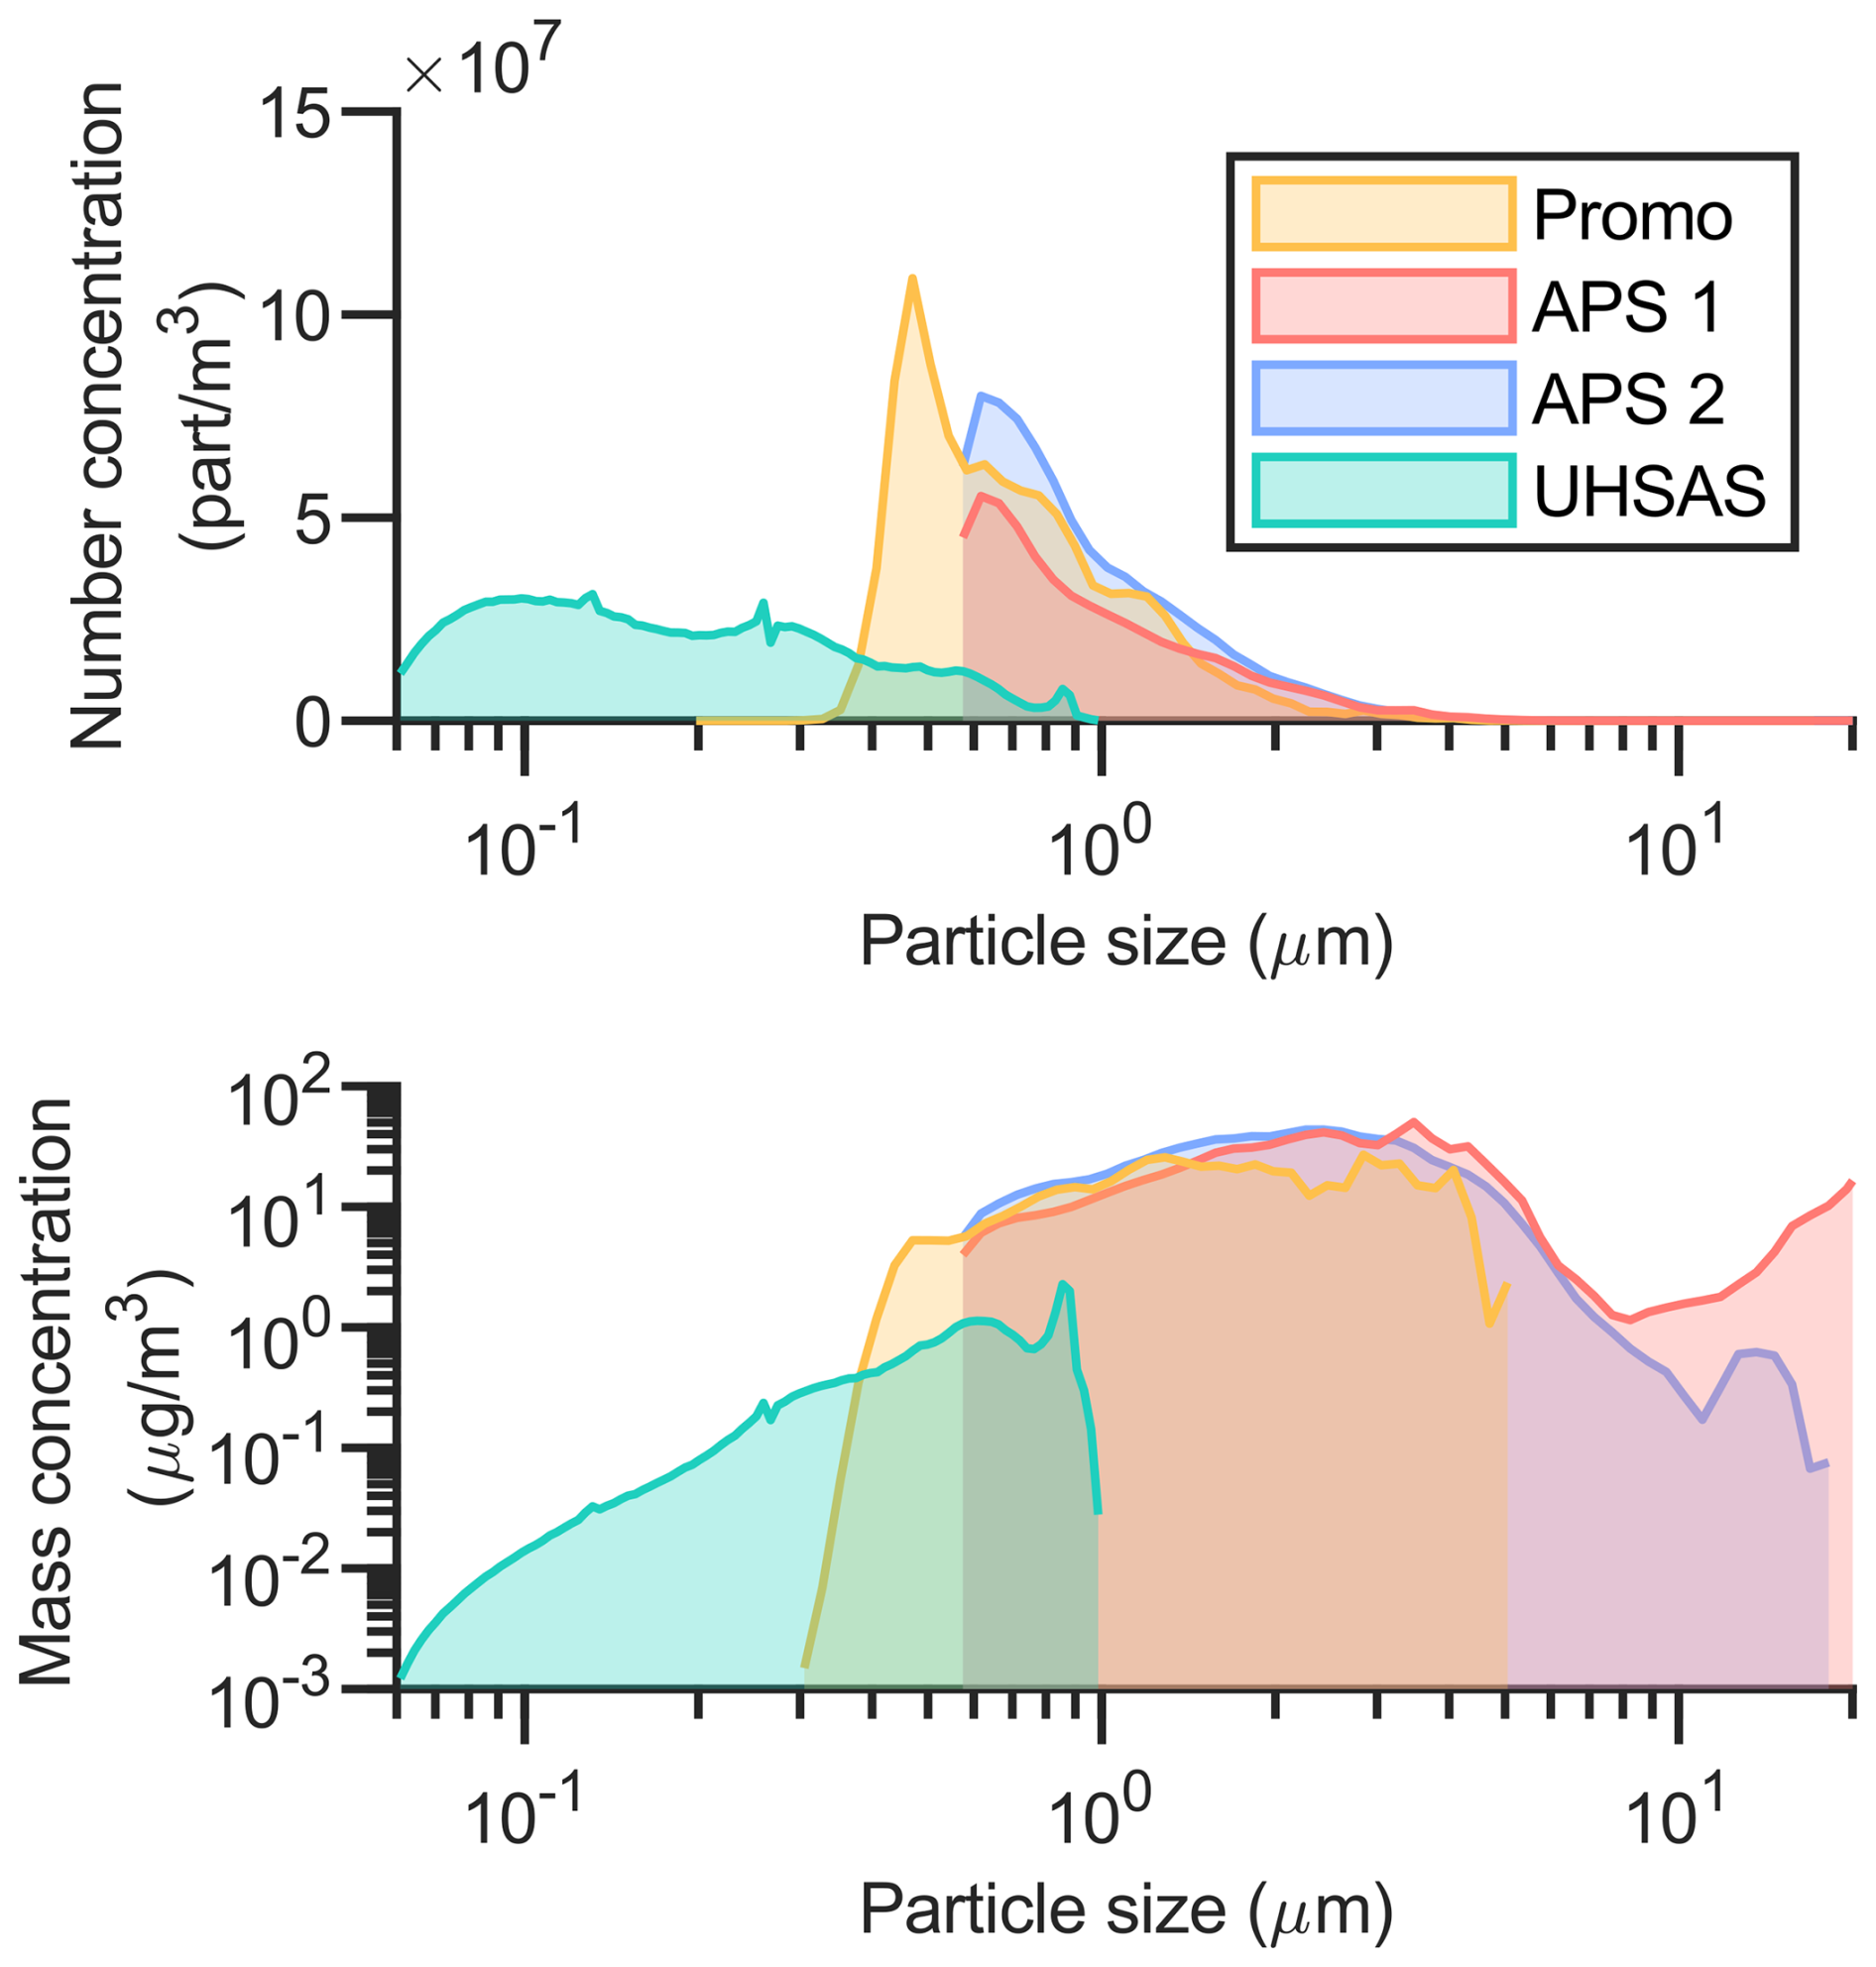
Figure 5Overlaid histograms of all particle counters from dispersing 5 g L−1 oleic acid in ethanol resulting in around a mass concentration of ∼ 500 µg m−3. Only bins in the 0.5–1 µm range are in common among all particle counters. The time-domain data that corresponds to these average histograms is shown as Event 4 in Fig. 6.
To illustrate the stability and control over aerosol particle concentration, the summed bin 10 s time averaged number and mass concentrations of oleic acid are shown in Fig. 6 along a continuous timeline. This shows an example of a validation run at three target concentrations with three repetitions at each concentration. Data in the same format for additional chemicals can be found in the Supplement. In the data presented, all of the particle counters show an oscillation in concentration. This is an artifact of the duty cycle of the aerosol generator and is not reflective of noise from the instruments themselves (see Supplement for further explanation). When analyzing any individual instrument, data for repetitions of the same chemical and target concentration are repeatable, resulting in similar number and mass concentrations. Comparing between instruments, the relative difference in concentrations reported by the instruments is also consistent between trials.
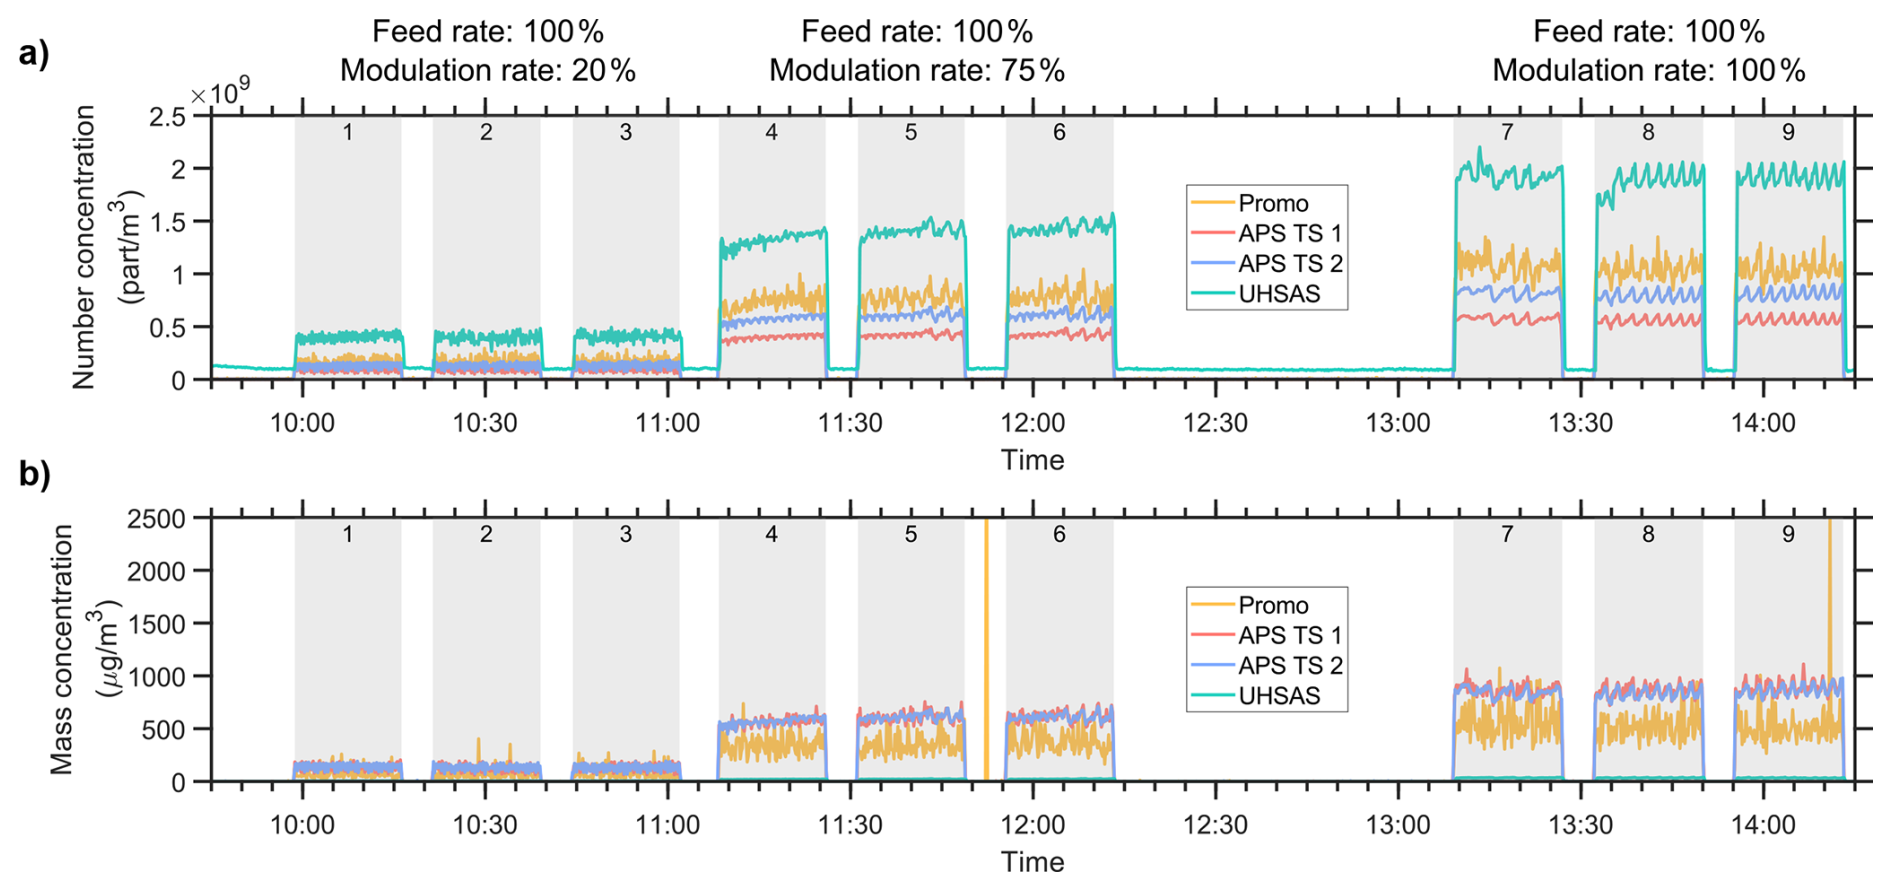
Figure 6The number and mass concentrations for the two APSes, the Promo, and the UHSAS during the dissemination of 5 g L−1 oleic acid in ethanol. Each dissemination event is labeled with a number.
Since each test section is equipped with an APS, comparing these two instruments allows us to evaluate both the even mixing throughout the AATF flow and the general consistency between detectors. As shown in the preceding figures, the number and mass concentrations from the two APS units typically agree well. At times, however, the mass measurements between the two instruments can differ by as much as 20 %. For example, at larger particle sizes, the two APS units sometimes diverge in mass concentration as is the case in Fig. 5, although the number concentration is low at those particle sizes. This difference in mass arises, at least in part, from a small number of particles recorded at the larger size bins. Furthermore, when differences arose between the two APSes in the 10–20 µm range, it was consistently APS 1 that displayed a greater number of counts. This discrepancy would continue until APS 1 was restarted and is possibly due to trapped debris that is released when the pump is power cycled.
Given the verified instrument baseline agreement (described in Sect. 2.3) and the highly turbulent flow regime of the AATF demonstrating uniform spatial distribution, the minor discrepancies in response between the two APS units during facility testing are attributed to inherent inter-unit variability and temporary instrument-level anomalies (such as pump debris), rather than physical stratification or mixing inefficiencies within the flow tube. Despite this, the overall mass concentration is remarkably similar for the two APS units as can be seen in Fig. 6.
The comparison of mass concentration reported by the APS and the Promo was variable. Care was taken, however, to apply the Stokes correction to the aerodynamic particle size reported by the APS instruments in the APS software. The Promo's elastic scattering measurements take into account the index of refraction correction when exporting the data from the instrument. For certain materials the mass reported by the Promo was higher compared to the APS (e.g. for phenanthrene and caffeine, both of which are solids when not in solution) but was lower for other materials (e.g. for oleic acid and tributyl phosphate when not in solution). As the number concentration plots show in Fig. 7a and b, the Promo records a large fraction of fine particles that are smaller than the cut-on for the APS to measure; however, this does not contribute to significant mass as shown in the mass concentration plots on the right of the figure. Focusing on the larger sized particles, there is a higher fraction measured by the Promo for phenanthrene as compared to the APS that leads to a mass distribution skewed to larger particles for the Promo. Due to the large uncertainty, the distribution has high variability in the reported mass. This trend is not observed for oleic acid leading to lower mass reported by the Promo. The physical characteristics, phase, and shape of the aerosol particles could lead to varying optical versus aerodynamic measurements that could contribute to these variations. The liquid target chemicals form spherical aerosols which are well accounted for in both the APS and the Promo while the solid target chemicals form amorphous or crystalline aerosols, which each instrument will interpret differently based on its measurement techniques.
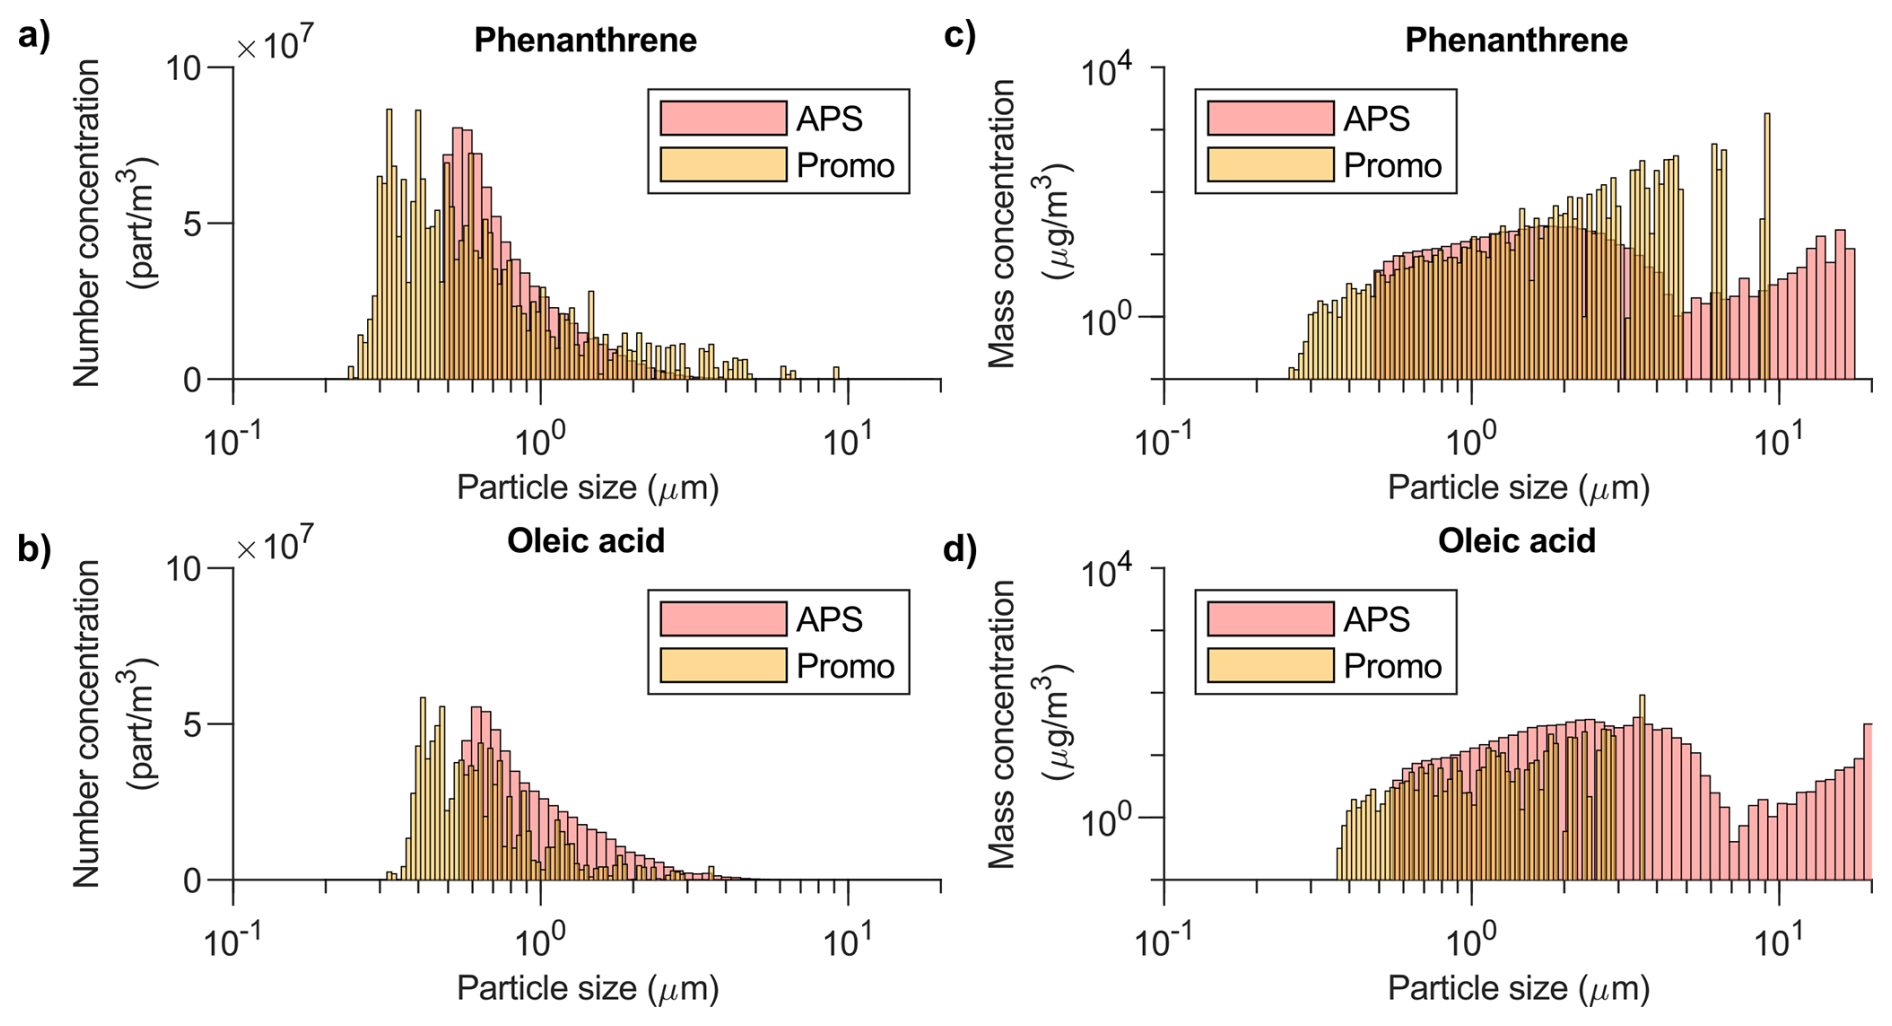
Figure 7The number (a, b) and mass (c, d) size distributions from APS 1 and the Promo for oleic acid and for phenanthrene is compared for the average 10 s interval. The Promo distribution from phenanthrene has a long tail leading to a highly varying mass distribution shifted to larger particles compared to that of the APS. This trend is not observed for oleic acid, leading to the variation of the ratio of masses reported by the two instruments.
The overlap between the APS and UHSAS is very limited, only 0.5–1 µm, and the discrepancy between the instruments is possibly due to reduced aerosol transmission to the UHSAS for these particle sizes. Because the UHSAS primarily samples very small particles, its mass concentration is negligible compared to the APS. Nevertheless, the UHSAS still provides insight on the size fraction of sub-micron particles present in the AATF during aerosol disseminations. This also provides information on the proportion of particles that the AMS is able to detect.
The micro-aerosol particle counter (micro-APC) unit from SparkFun Electronics – SCD41 SEN55 (Qwiic) is a significantly cheaper option to determine PM10 mass concentrations (covering the particle diameters of 0.3–10.0 µm) than the other instruments attached to the AATF. The micro-APC has an upper total mass concentration limit of 1,000 µg cm−3 and makes no corrections for refractive indices, densities, or any other physical property of the aerosol like the other particle counters do. Instead, it is factory calibrated measuring the PM2.5 of a 3 % atomized KCl solution and all subsequent measurements are based on that distribution. Figure 8 shows a typical comparison of concentrations determined through the micro-APC versus typical laboratory equipment for (a) a liquid (i.e. glycerol) and for (b) a solid dissolved in liquid (i.e. caffeine). For the liquid sample, the micro-APC undercounts by about 50 % for mass concentrations below 1000 µg cm−3 and performs poorly with concentrations higher than 1000 µg cm−3 as it is outside the specifications for this instrument. For sampling solid aerosols, the agreement between the micro-APC and the TSI APS units is within the error of the instruments. Not shown in the figure is a caffeine sample at concentrations above 1000 µg cm−3, which again causes the micro-APC to perform poorly. The poor performance above 1000 µg cm−3 is to be expected as such high concentrations are outside of the instrument's specifications. This indicates that a micro-APC can be an affordable instrument for providing PM measurements of moderate solid particles.
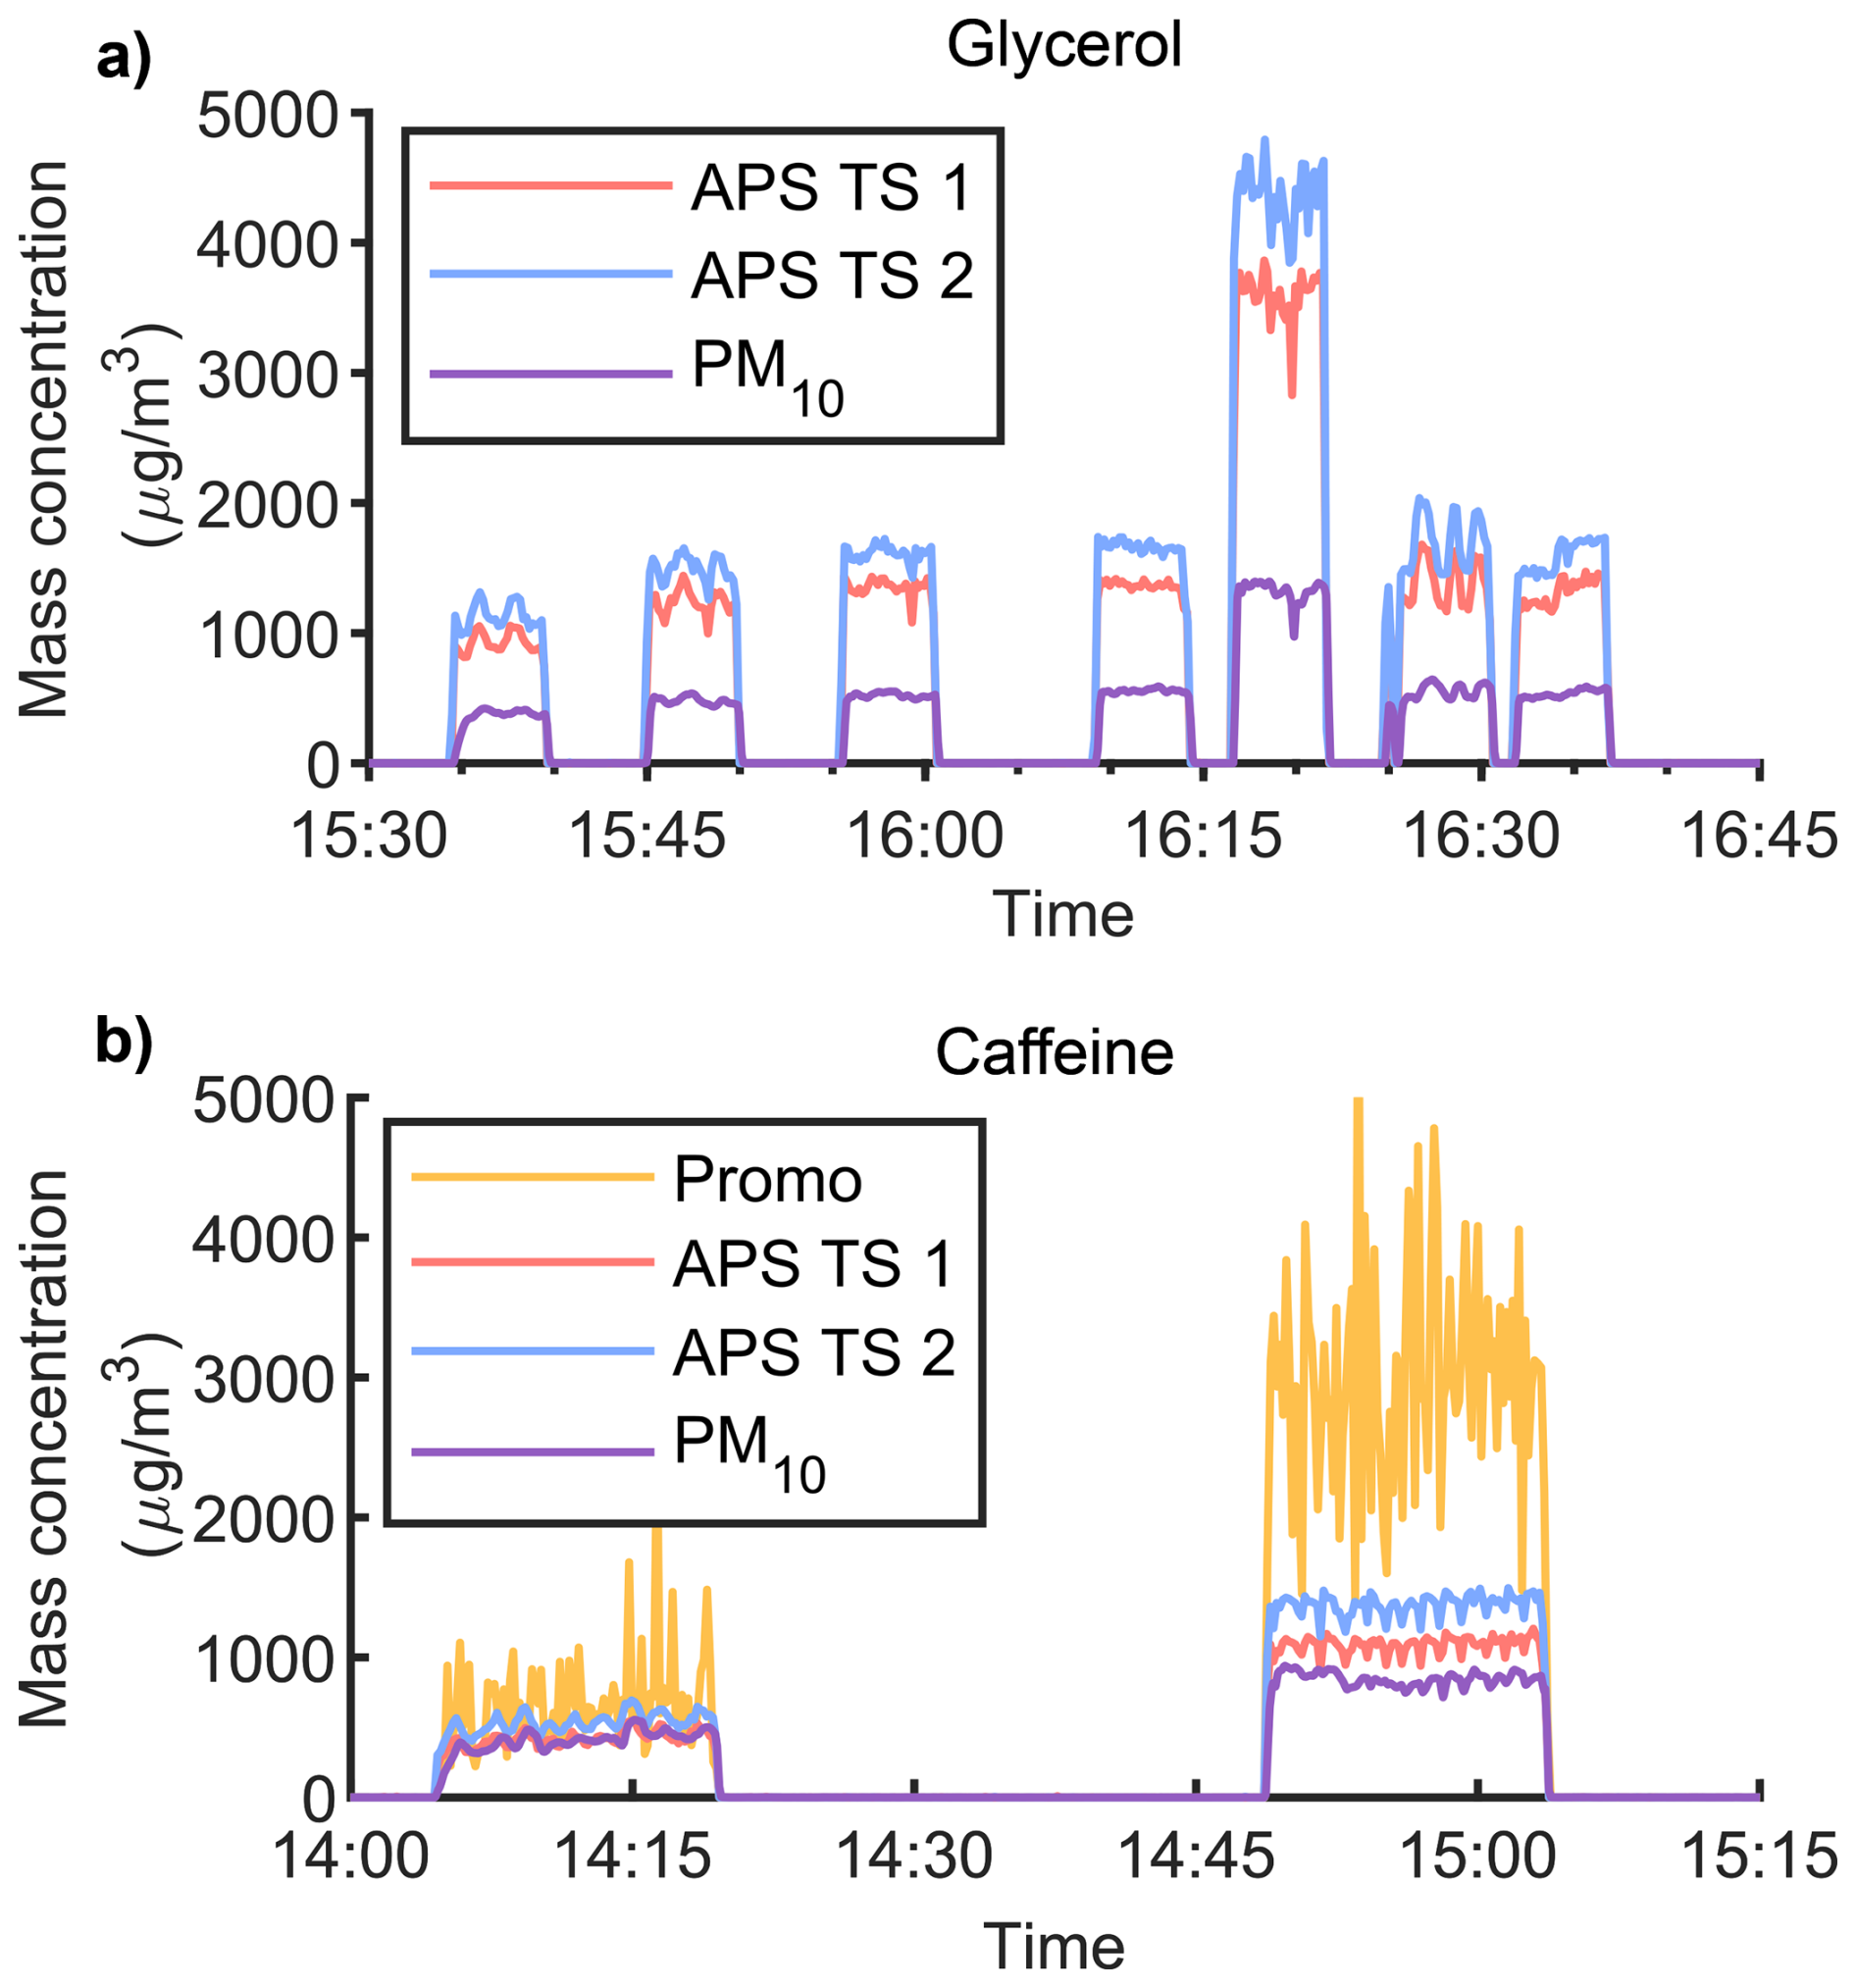
Figure 8Comparison of the micro-APC PM10 to standard laboratory equipment using a (a) liquid sample and a (b) solid sample dissolved in liquid. The micro-APC performs significantly better for solid aerosols. (Promo data is unavailable for the glycerol sample.)
Data from the particle sizers are used in real-time to provide the total aerosol mass delivery during a dissemination event based on an equivalent sphere particle shape and bulk material densities. However, these estimates are necessarily limited by, and to some extent, potentially biased by, the individual instrument response functions. Characterization of the instrument response function versus particle size was beyond the scope of this work. Therefore, a gravimetric measurement capability was added to each of the test sections of the AATF to provide a ground truth capability for the total aerosol mass loading of the AATF flow.
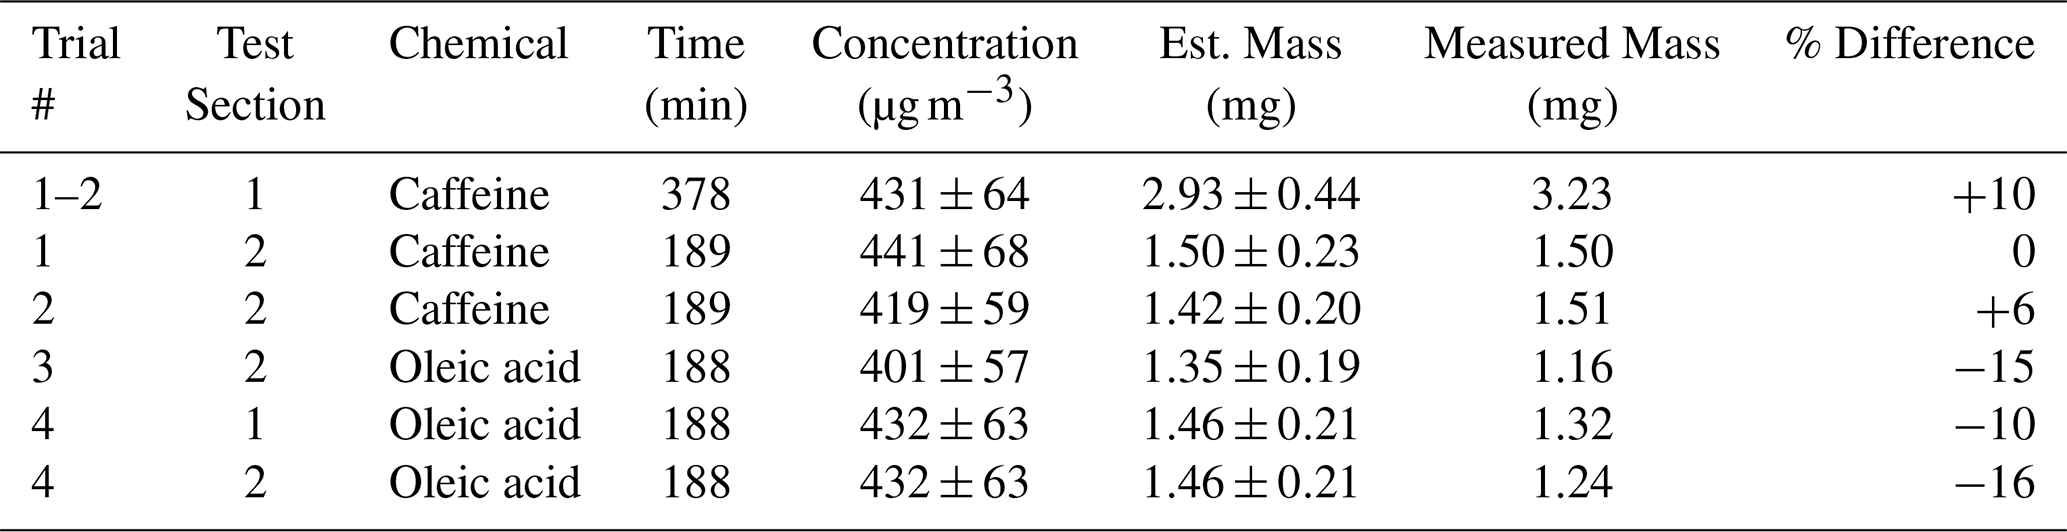
In an effort to get filter data with greater accuracy, long collection measurements were carried out for two chemicals of interest with relatively low vapor pressures: caffeine and oleic acid. For these measurements, the collection times were extended to approximately 3 h to increase the mass collected on the filter paper. For the caffeine sample, one filter was left in for two consecutive 3 h periods. All of the measured values agree with the estimated values to within 20 %, as can be seen in Table 2. A consistent trend was for caffeine to be measured with a mass greater than the estimated values, and for oleic acid to be measured with a mass less than the estimated values. This at first seems counterintuitive since oleic acid has a lower vapor pressure than caffeine. However, a potentially significant difference is that oleic acid is a liquid at STP while caffeine is a solid. It may be possible that oleic acid microdroplets impacting the filter substrate could spread out creating a substantially larger surface area which could result in a greater rate of evaporative loss; this, however, is conjecture. The close agreement between gravimetric data and optical particle counter mass estimates confirms the absence of significant particle concentrations larger than the detection limits of the optical equipment and validates the comprehensive nature of the size distribution measurements. In essence, the aerosol mass agreement suggests that the instrument response functions of the Promo and APS are close to 100 % efficient.
Table 2Long gravimetric analysis trials. Error shown is standard deviation. Estimated sample mass is based on the concentration of sample in the AATF (as reported by the APS) and a flow rate of 18 L min−1 being pulled through the filter.
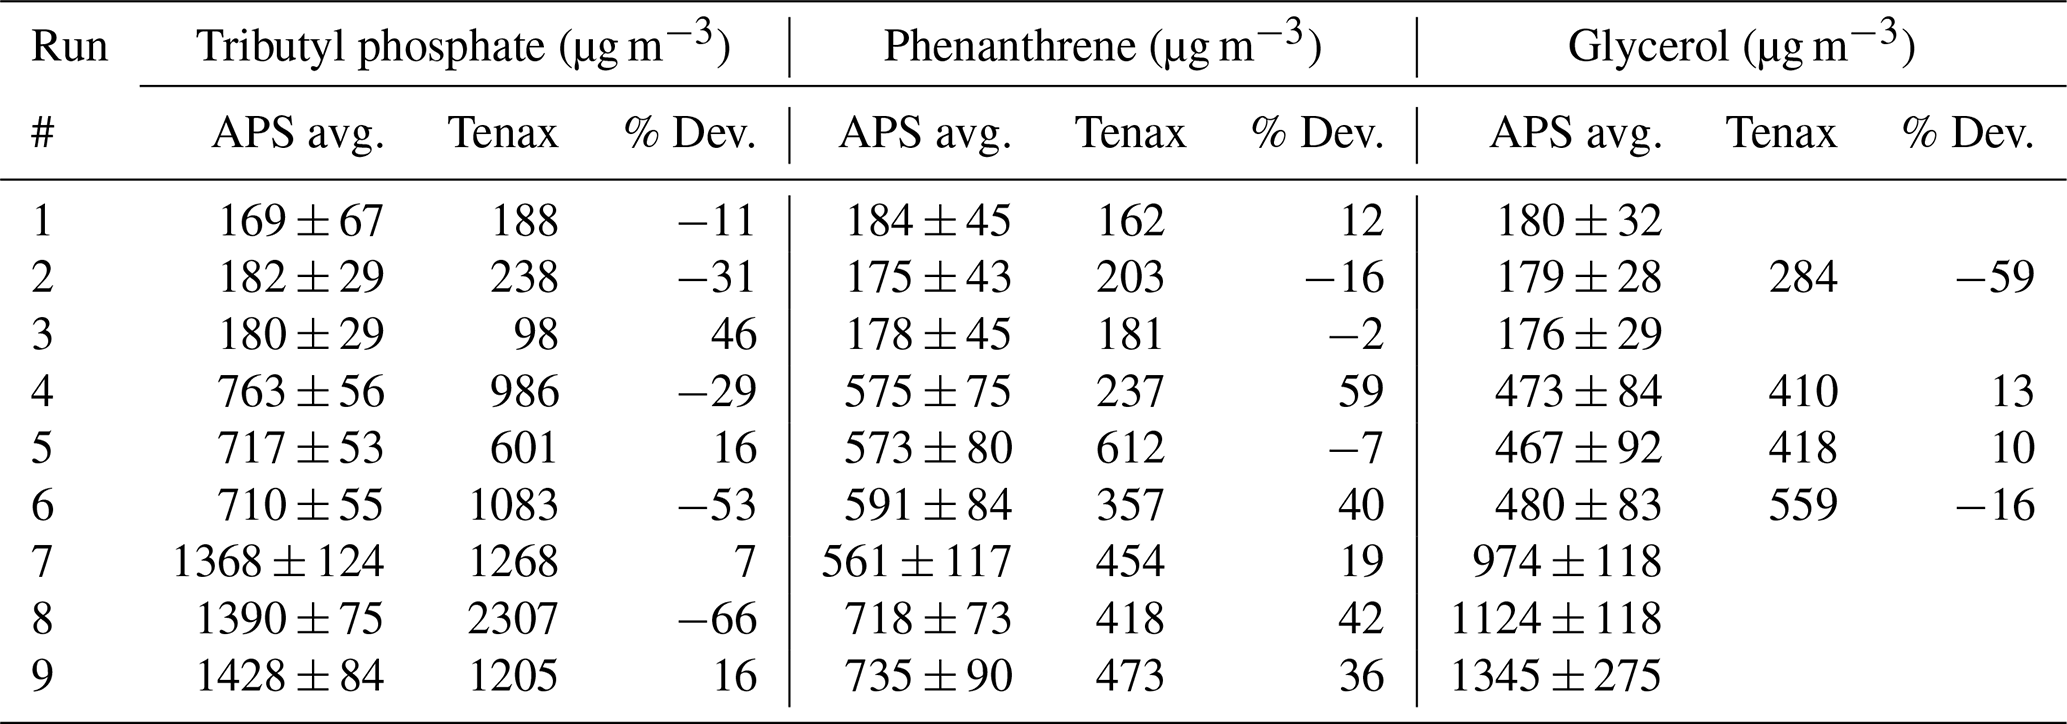
A Tenax tube was collected for each of the validation measurements to provide confirmation of aerosol composition and as a validation of the mass reported by the particle sizers. Each collection was nominally for 15 min. The tubes were analyzed later using GC/MS. Calibration curves for each chemical were generated between 0.05–2.5 or 5 µg, depending on chemical. Masses for tributyl phosphate and phenanthrene were determined using the full mass fragment range while the mass for glycerol was determined using only the peak. The masses of tributyl phosphate, phenanthrene, and glycerol as determined from the Tenax tube are presented in Table 3. The concentration shown is based on the determined mass and the volume of air sampled through the Tenax tube during collection. The uncertainty in the measurement during the 15 min event is reported and ranges from 10 % for high concentrations and just under 30 % for lower concentrations. The percent deviation between the Tenax collection and GC/MS analysis mostly agrees well within the uncertainty in the mass measurement provided by the particle sizers. The Tenax collection shows good agreement for the three trials of medium concentration glycerol which is a low vapor pressure liquid material. Two out of the three replicates fall within 30 % deviation for TBP while phenanthrene had greater variability, generally resulting in a lower mass as determined from the Tenax tube compared to the APS. This is likely a reflection of the fact that higher vapor pressure materials have poorer retention in the Tenax tube. In general, the combination of Tenax tube and GC/MS could yield a reliable verification method, but a higher number of samples could help strengthen this method as a secondary offline confirmation.
Table 3Tenax collection and post GCMS analysis for tributyl phosphate, phenanthrene and glycerol along with the mass concentration measured by the APS.
The Aerodyne Aerosol Mass Spectrometer (AMS) was used as a real time monitor for chemicals being released into the airflow in the AATF. In real-time, this instrument confirmed the presence of the aerosolized chemical of interest based on time-of-flight mass spectroscopy, identifying specific ion fragments of the target chemical in agreement with NIST and AIST databases (National Institute of Standards and Technology, 2023; National Institute of Advanced Industrial Science and Technology, 2025). It also provided a qualitative concentration. The data was post-processed to confirm chemical identification and was time-synchronized to the particle counts and mass loading as recorded by the particle collectors and sizers. The analysis of these data is beyond the scope of this paper and will be presented separately. In the future, the AMS could be used to identify unknown compounds in the ambient air plenum and possibly give quantitative measurements of the chemicals present. The latter presents a challenge since the AMS only detects aerosols smaller than 1.5 µm and would be insensitive to aerosol sources of larger sizes (e.g. dust, pollen, sea salt, etc.)
While conducting studies at the AATF, several observations for best practices were noted. The largest effect was that of humidity for materials disseminated from an aqueous solution. Relative humidity levels at the AATF vary with seasonal weather conditions. Low to medium relative humidity levels allow aerosols generated from aqueous solutions or suspensions to dry before reaching the test sections of the AATF. Elevated relative humidity (above 90 %) prevents complete evaporation of water in the aerosol, resulting in wet aerosols reaching the test sections. Because particle sizers calculate mass based on optical measurements and rely on user-defined refractive indices and densities designed to represent the properties of the dry chemical residue, the presence of residual water significantly impacts data interpretation. Applying the properties of the smaller, dry residue aerosol to the entire wet aerosol particle results in artificially inflated particle sizes, overestimated mass concentrations, and ultimately skewed median diameter distributions. Figure 9 shows an example of this for a caffeine solution disseminated from aqueous solution using the same settings on a day with 80 % humidity and another day with 90 % humidity. All other parameters and solutions are the same. While both histograms show a similar population for particle diameters of up to 1 µm, the day with 90 % humidity has a significant population between 3–20 µm.
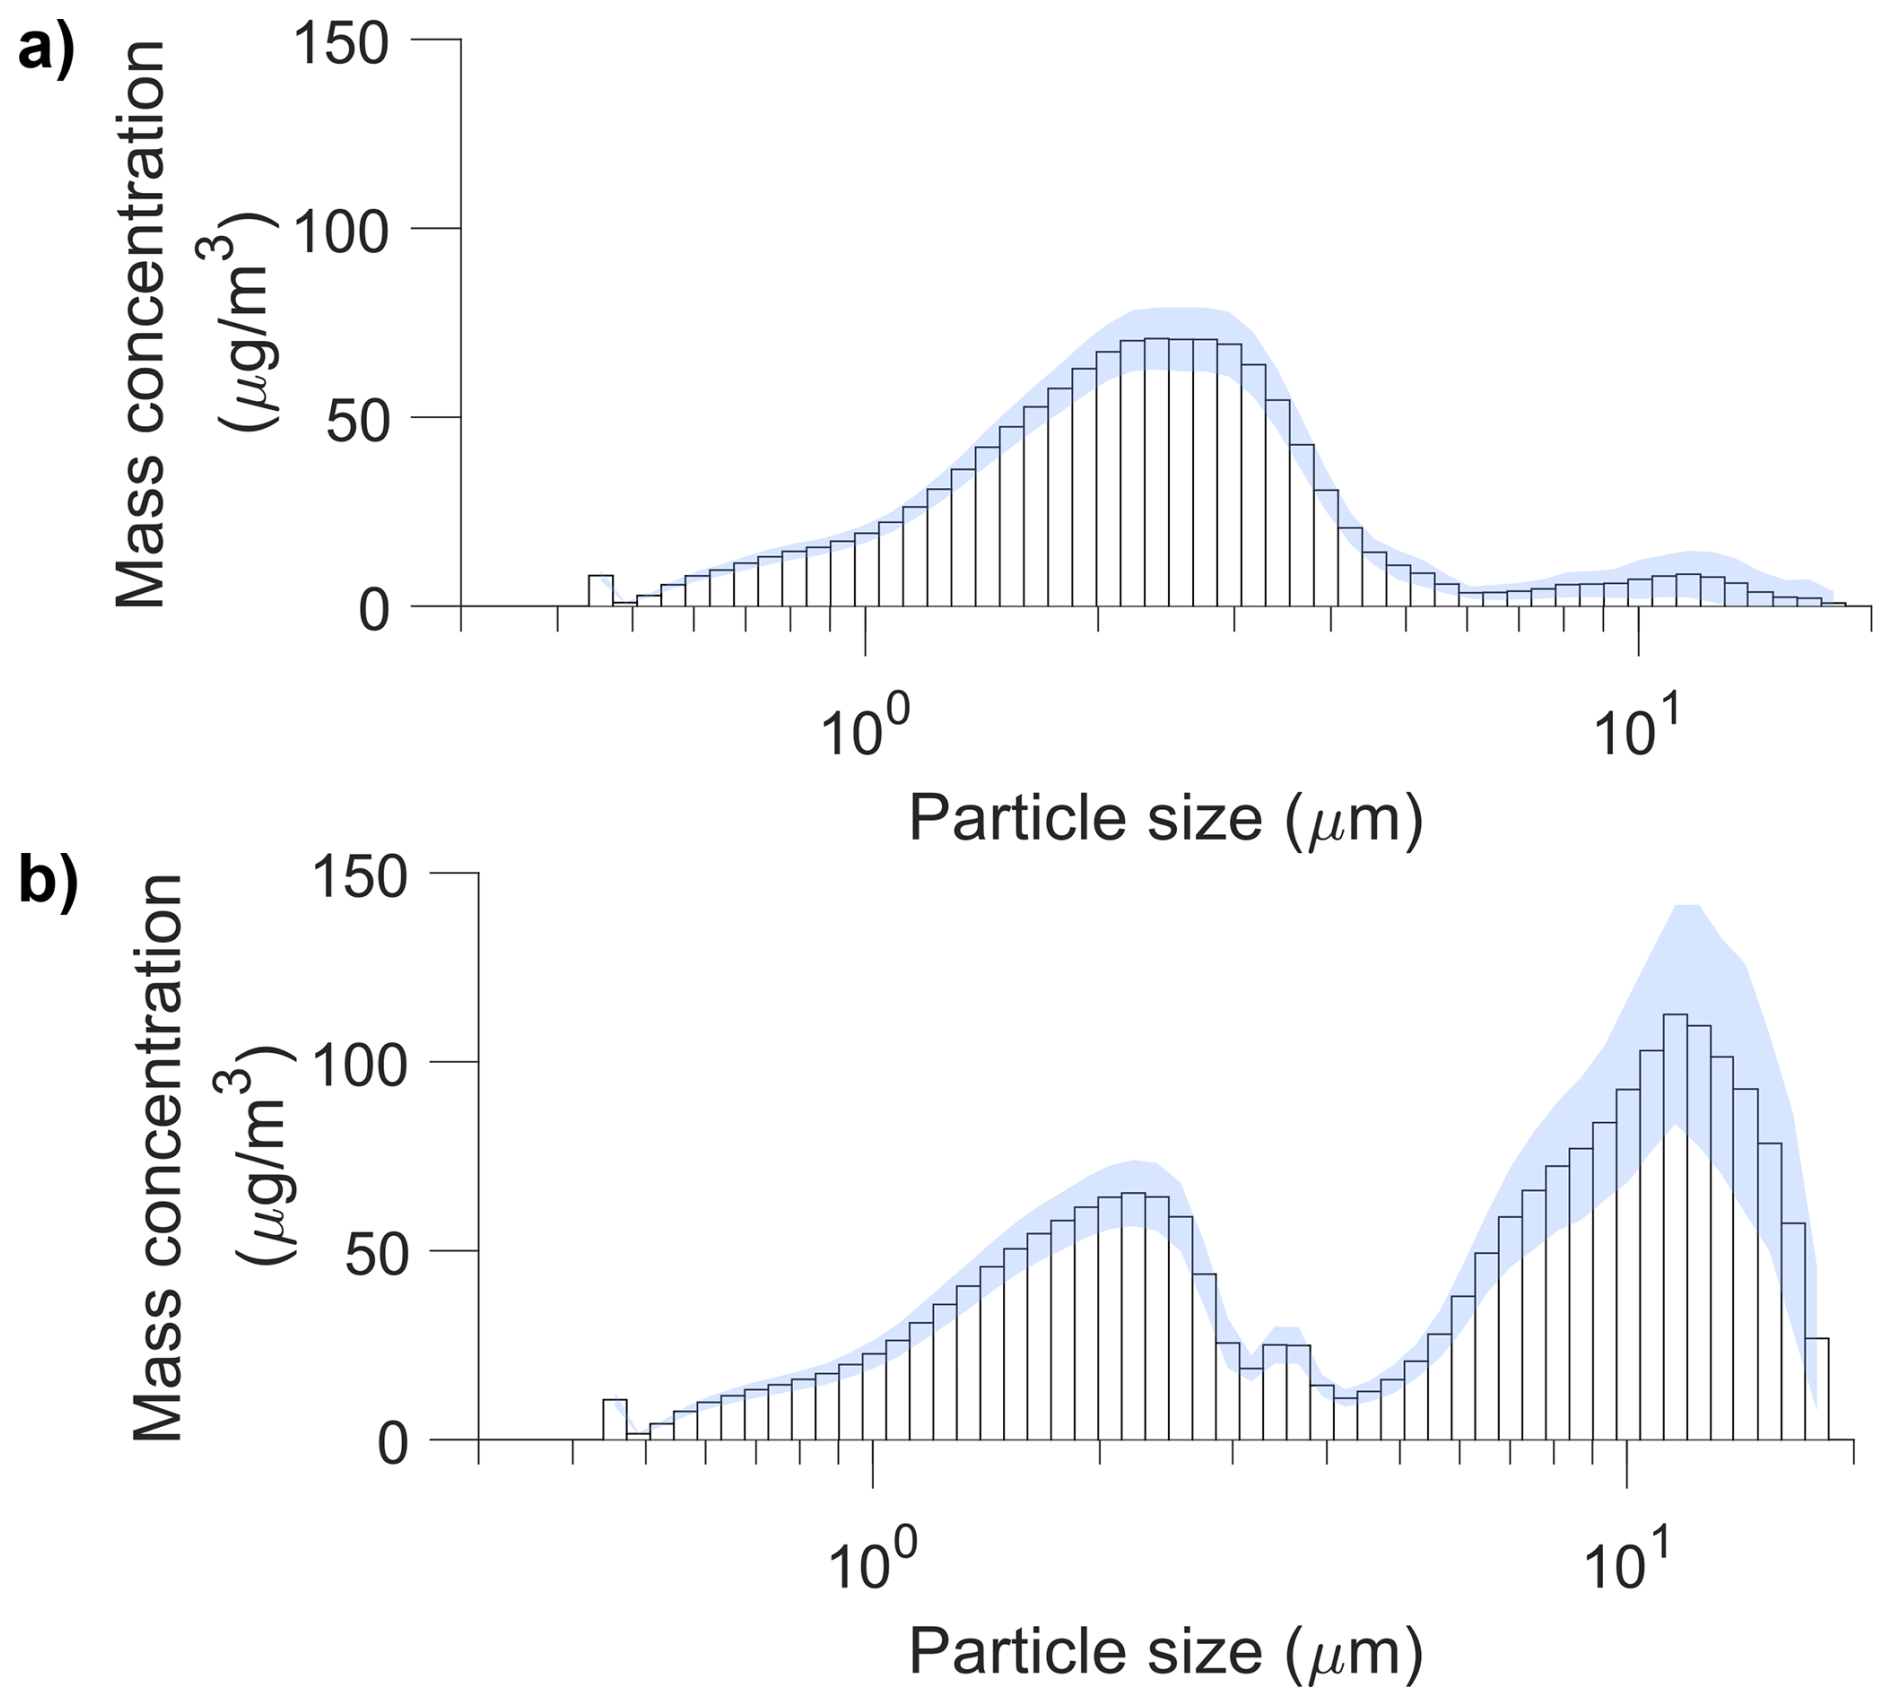
Figure 9Mass distribution (as reported by APS 2) of caffeine dissemination on two different days with relative humidity (a) <80 % and (b) about 90 %. The shaded area represents that standard deviation.
For aerosols generated from other solvents, the humidity has little effect on the evaporation of the solvent since the partial pressure of the solvent in the AATF is usually zero unless a sample is actively being introduced. Therefore, on days with high relative humidity, it is generally desirable to aerosolize using a compatible solvent other than water.
Humidity also impacts the dry powder generator negatively. The pressurized airflow through this generator can cause the metal of the generator to cool down below the dew point, causing water to condense on the generator. This water carries with it the powder and has a tendency to make its way into the pickup tube. For a powder like Arizona test dust, this creates mud in the pickup tube and can fully clog the powder generator until it is manually disassembled and cleaned. Alternatively, a high pressure blast of air can help to dislodge these clogs, but the concentration of the powder in the AATF can reach 10–20 times the normal operating concentration, which could negatively impact the diagnostic equipment.
Unlike liquid generators where the properties of the aerosols depend primarily on the generator and easily controlled properties of the solutions (solvent, concentration, etc.), generating aerosols from a dry powder is dependent upon the less easily controlled properties of the powder. For example, the size distribution of the aerosol is controlled by how finely ground the powder is, the size distribution of the supplied powder, to what degree the powder self-aggregates, and other physical properties. Additionally, the Venturi turntable has a narrow groove in which the sample is loaded. Airflow through the generator suctions the powder from the groove through a pickup tube and into the flow tube. The narrow pickup tube tends to be more easily clogged than the liquid generators, reducing the amount of material that can be disseminated. Other factors that impact the concentration of powder disseminated include: how tightly packed the groove is with material, the density of the material, airflow pressure, the exact placement of the pickup tube in the groove, and how efficiently the groove can be refilled while the turntable rotates. Since these variables are more difficult to control than the liquid aerosol generators, the powder concentration and size distribution is more variable when using this generator.
The size distribution from an Arizona test dust dissemination using the dry generation method and the size distribution from a caffeine dissemination from a liquid generation method is shown in Fig. 10. The size distribution for the dry generation method (Fig. 10b) is clearly significantly broader than the liquid generation as expected.
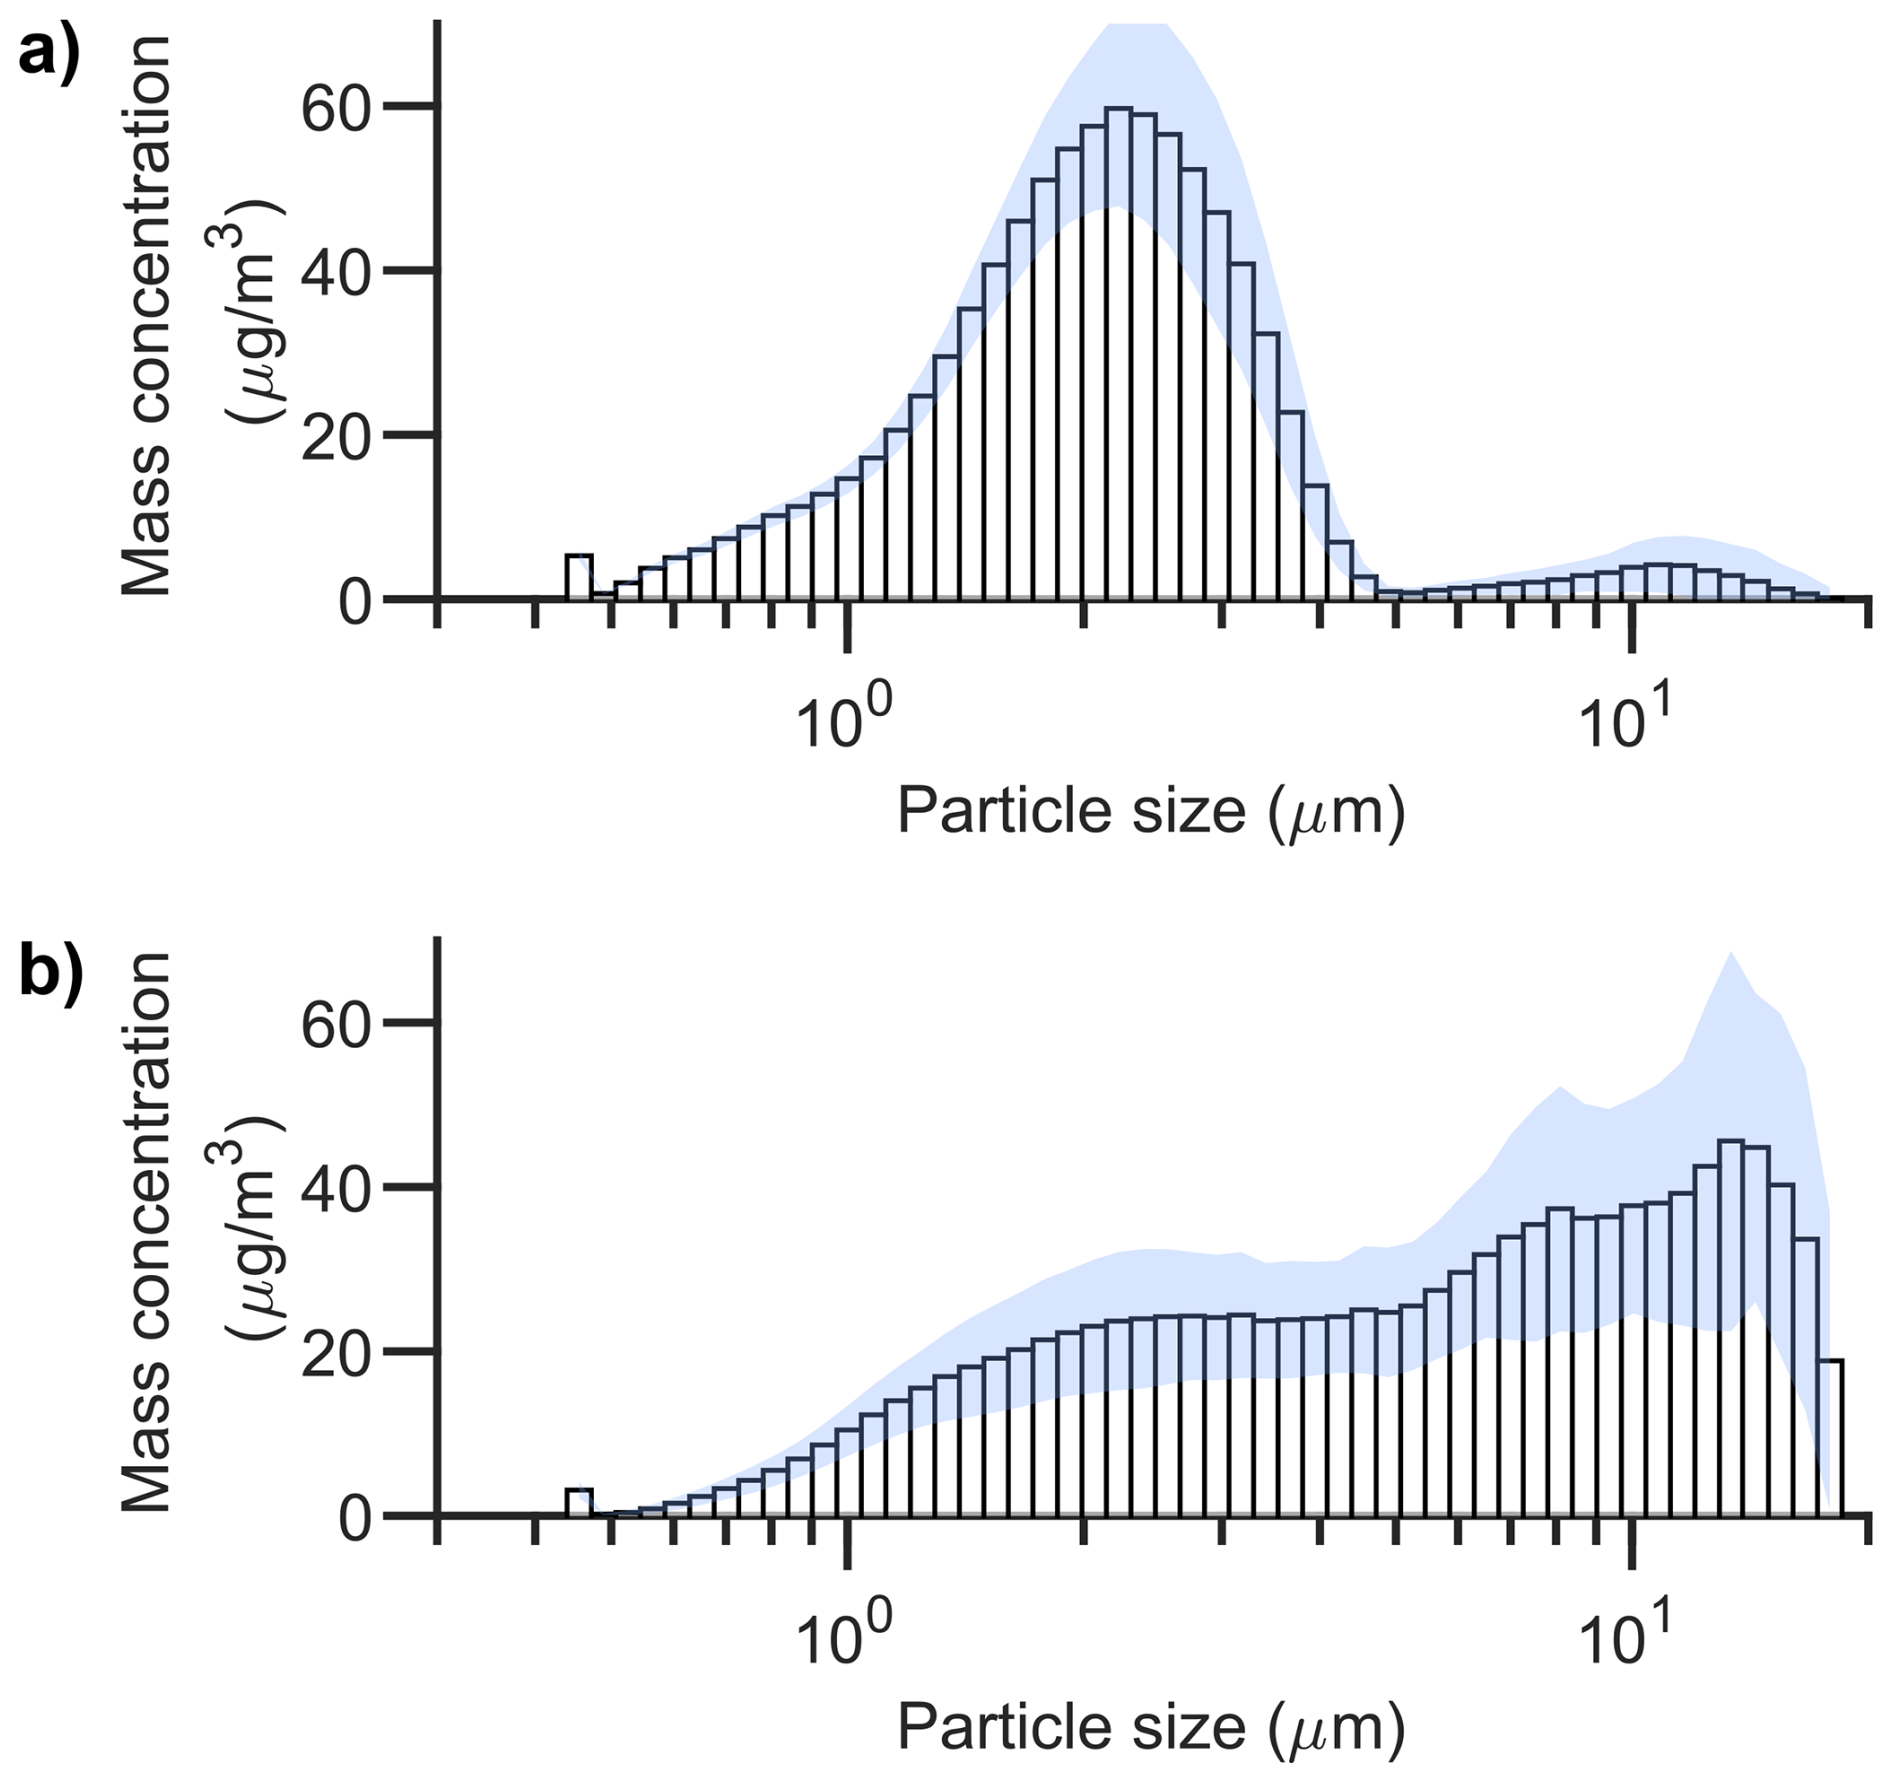
Figure 10Comparison of size distribution (as reported by APS 2) between (a) liquid (Caffeine, 5 g L−1) and (b) dry (Arizona Test Dust) generation methods. The shaded area represents that standard deviation.
The development and validation of the Ambient Air Test Facility (AATF) has successfully demonstrated a robust platform for multi-instrument aerosol characterization under controlled indoor conditions that enables outdoor ambient air testing. The facility achieves excellent aerosol distribution uniformity across the flow cross-section, with relative standard deviations typically below 3.5 % for particle concentrations in the 0.3–5.0 µm size range. The integration of 13 diagnostic instruments across four measurement categories provides comprehensive aerosol characterization capabilities, including real-time particle counting, mass concentration measurements, chemical composition analysis, and flow characterization.
Validation testing using multiple test chemicals (caffeine, oleic acid, phenanthrene, and glycerol) demonstrated the facility's ability to generate reproducible aerosol concentrations across a wide dynamic range (50–3000 µg m−3) and particle size range (50 nm–15 µm). These concentrations and sizes are also relevant to various hazardous materials that could be encountered as potential public health threats in operational environments. Gravimetric analysis confirmed mass concentration accuracy within 20 % of expected values. A key operational insight is the critical importance of humidity control for water-soluble materials. Relative humidity levels below 90 % provided complete water evaporation with essentially dry residue aerosols. The facility's turbulent flow regime (Re=40 000) ensures excellent mixing while maintaining a relatively narrow distribution of velocity variations across the central 85 % of the flow cross sectional area.
The AATF provides a valuable platform for detector validation, sensitivity assessment, and specificity testing under controlled yet realistic conditions. Future planned enhancements include expanded chemical generation capabilities, augmented interferent aerosol generation capabilities including smoke generation and salt water aerosols, and implementation of a routine data quality assurance protocol, such as periodically introducing PSL aerosols, to monitor the long-term stability and performance of the reference instruments. Additional enhancements such as active temperature and humidity control systems would be more difficult to implement. The facility's design principles and validation methodology provide a framework that can be adapted for a wide range of aerosol testing applications.
Code and data are available upon request, pending approval of the Commanding Officer of the US Naval Research Laboratory.
The supplement related to this article is available online at https://doi.org/10.5194/amt-19-4653-2026-supplement.
CS, OA, and PJ were responsible for determining appropriate settings for the aerosolization of chemicals, disseminating the chemicals, and collecting most of the data for the particle counters. LH and MH were responsible for the AMS data collection and analysis. MH and BG collected and analyzed the Tenax samples. JE provided aerosol expertise and guidance. JE and PJ also were responsible for the design and implementation of sampling apparatuses for all AATF instruments. PJ provided MATLAB expertise in automating the processing of data from all instruments. VS managed the project. PJ and VS wrote the manuscript.
The contact author has declared that none of the authors has any competing interests.
Publisher's note: Copernicus Publications remains neutral with regard to jurisdictional claims made in the text, published maps, institutional affiliations, or any other geographical representation in this paper. The authors bear the ultimate responsibility for providing appropriate place names. Views expressed in the text are those of the authors and do not necessarily reflect the views of the publisher.
This research is based upon work supported by the Office of the Director of National Intelligence (ODNI), Intelligence Advanced Research Projects Activity (IARPA) and by the National Research Council. The views and conclusions contained herein are those of the authors and should not be interpreted as necessarily representing the official policies or endorsements, either expressed or implied, of the ODNI, IARPA, or the U.S. Government.
This paper was edited by Johannes Schneider and reviewed by two anonymous referees.
Aerodyne Research, Inc.: High Resolution Time-of-Flight Aerosol Mass Spectrometer, https://aerodyne.com/particle-instruments/ams-acsm/, last access: September 2025. a
Carter, W. P., Cocker, III, D. R., Fitz, D. R., Malkina, I. L., Bumiller, K., Sauer, C. G., Pisano, J. T., Bufalino, C., and Song, C.: A new environmental chamber for evaluation of gas-phase chemical mechanisms and secondary aerosol formation, Atmos. Environ., 39, 7768–7788, https://doi.org/10.1016/j.atmosenv.2005.08.040, 2005. a
Chandra, S. and McFarland, A. R.: Comparison of Aerosol Sampling with Shrouded and Unshrouded Probes, Am. Ind. Hyg. Assoc. J., 56, 459–466, https://doi.org/10.1080/15428119591016872, 1995. a, b
Chandra, S. and McFarland, A. R.: Shrouded Probe Performance: Variable Flow Operation and Effect of Free Stream Turbulence, Aerosol Sci. Technol., 26, 111–126, https://doi.org/10.1080/02786829708965418, 1997. a
CH Technologies (USA), Inc.: Collison Nebulizer, https://chtechusa.com/products_tag_lg_collison-nebulizer.php, last access: September 2025. a
Cocker, D. R., Flagan, R. C., and Seinfeld, J. H.: State-of-the-Art Chamber Facility for Studying Atmospheric Aerosol Chemistry, Environ. Sci. Technol., 35, 2594–2601, https://doi.org/10.1021/es0019169, 2001. a
Dennis, R., Samples, W. R., Anderson, D. M., and Silverman, L.: Isokinetic Sampling Probes, Ind. Eng. Chem., 49, 294–302, https://doi.org/10.1021/ie50566a049, 1957. a
Drazin, P. and Riley, N.: The Navier-Stokes equations: A classification of flows and exact solutions, London Mathematical Society Lecture Note Series, Cambridge University Press, Cambridge, England, ISBN 978-0-521-68162-9, 2006. a
Droplet Measurement Technologies: Ultra-High Sensitivity Aerosol Spectrometer, https://www.dropletmeasurement.com/product/ultra-high-sensitivity-aerosol-spectrometer/, last access: September 2025. a
Fearing, A., Kalbasi-Ashtari, A., Zuniga, A., Pak, H., Haglund, J., Kim, H. Y., and King, M.: Performance of two shrouded probes for the collection of liquid aerosols in a wind tunnel optimized for high air speeds, Aerosol Sci. Technol., 54, 972–982, https://doi.org/10.1080/02786826.2020.1753880, 2020. a, b, c, d, e
Guo, H., Campuzano-Jost, P., Nault, B. A., Day, D. A., Schroder, J. C., Kim, D., Dibb, J. E., Dollner, M., Weinzierl, B., and Jimenez, J. L.: The importance of size ranges in aerosol instrument intercomparisons: a case study for the Atmospheric Tomography Mission, Atmos. Meas. Tech., 14, 3631–3655, https://doi.org/10.5194/amt-14-3631-2021, 2021. a
HI-Q Environmental Products Company, Inc.: RVH-25, https://www.hi-q.net/product/rvh-series/, last access: September 2025. a
Hinds, W. C.: Aerosol Technology: Properties, Behavior, and Measurement of Airborne Particles, Wiley, Hoboken, NJ, 2nd edn., ISBN 0-471-19410-7, 1999. a
Horender, S., Auderset, K., Quincey, P., Seeger, S., Skov, S. N., Dirscherl, K., Smith, T. O. M., Williams, K., Aegerter, C. C., Kalbermatter, D. M., Gaie-Levrel, F., and Vasilatou, K.: Facility for production of ambient-like model aerosols (PALMA) in the laboratory: application in the intercomparison of automated PM monitors with the reference gravimetric method, Atmos. Meas. Tech., 14, 1225–1238, https://doi.org/10.5194/amt-14-1225-2021, 2021. a
IARPA: PICARD–Pursuing Intelligent Complex Aerosols for Rapid Detection, https://www.iarpa.gov/research-programs/picard (last access: September 2025), 2022. a
International Organization for Standardization: Determination of particle size distribution–Single particle light interaction methods, Standard ISO 21501-01:2009, International Organization for Standardization, Geneva, CH, ISO 21501-1:2009, 2009. a
McFarland, A. and Rodgers, J.: Single-point representative sampling with shrouded probes, Los Alamos National Laboratory, LA-12612-MS, UC-902, https://doi.org/10.2172/10184150, 1993. a, b
McFarland, A. R., Ortiz, C. A., Moore, M. E., DeOtte, R. E., and Somasundaram, S.: A shrouded aerosol sampling probe, Environ. Sci. Technol., 23, 1487–1492, https://doi.org/10.1021/es00070a006, 1989. a, b
Mettler-Toledo: Analytical Balance XS205DU, https://www.mt.com/us/en/home/phased_out_products/Laboratory_Weighing_Solutions/Analytical/Excellence/XS_Analytical_Balance/XS205DU.html (last access: September 2025), 2018. a
National Institute of Advanced Industrial Science and Technology: Spectral Database for Organic Compounds SDBS, https://sdbs.db.aist.go.jp/, last access: September 2025. a
National Institute of Standards and Technology: NIST Mass Spectral Libraries, 2023 Edition, https://webbook.nist.gov/ (last access: September 2025), 2023. a
Palas GmbH: Promo® 2000, https://www.palas.de/en/product/promo2000, last access: September 2025. a
Paulsen, D., Dommen, J., Kalberer, M., Prévôt, A. S. H., Richter, R., Sax, M., Steinbacher, M., Weingartner, E., and Baltensperger, U.: Secondary Organic Aerosol Formation by Irradiation of 1,3,5-Trimethylbenzene−NOx−H2O in a New Reaction Chamber for Atmospheric Chemistry and Physics, Environ. Sci. Technol., 39, 2668–2678, https://doi.org/10.1021/es0489137, 2005. a
Peck, A., Handy, R. G., Sleeth, D. K., Schaefer, C., Zhang, Y., Pahler, L. F., Ramsay, J., and Collingwood, S. C.: Aerosol Measurement Degradation in Low-Cost Particle Sensors Using Laboratory Calibration and Field Validation, Toxics, 11, 56, https://doi.org/10.3390/toxics11010056, 2023. a
RAE Systems: RAE Systems ppbRAE 3000+ Portable Handheld VOC Monitor, https://www.rae-gasmonitors.com/xxyy-ppbrae-3000-plus.html, last access: September 2025. a
Ratnesar-Shumate, S., Wagner, M. L., Kerechanin, C., House, G., Brinkley, K. M., Bare, C., Baker, N. A., Quizon, R., Quizon, J., Proescher, A., Van Gieson, E., and Santarpia, J. L.: Improved Method for the Evaluation of Real-Time Biological Aerosol Detection Technologies, Aerosol Sci. Technol., 45, 635–644, https://doi.org/10.1080/02786826.2010.551144, 2011. a
Reist, P. C. and Taylor, L.: Development and operation of an improved turntable dust feeder, Powder Technol., 107, 36–42, https://doi.org/10.1016/s0032-5910(99)00082-0, 2000. a
S3I Engineering: S3I Engineering: S3I Engineering, https://www.s3iengineering.com/, last access: September 2025. a, b
Salama, A.: Velocity Profile Representation for Fully Developed Turbulent Flows in Pipes: A Modified Power Law, Fluids, 6, 369, https://doi.org/10.3390/fluids6100369, 2021. a
Saldana, M., Gallegos, S., Gálvez, E., Castillo, J., Salinas-Rodríguez, E., Cerecedo-Sáenz, E., Hernández-Ávila, J., Navarra, A., and Toro, N.: The Reynolds Number: A Journey from Its Origin to Modern Applications, Fluids, 9, 299, https://doi.org/10.3390/fluids9120299, 2024. a
Sono-Tek Corp.: Ultrasonic Spray Nozzle, https://www.sono-tek.com/, last access: September 2025. a
SparkFun Electronics: SparkFun Indoor Air Quality Combo Sensor – SCD41, SEN55 (Qwiic), https://www.sparkfun.com/sparkfun-indoor-air-quality-combo-sensor-scd41-sen55-qwiic.html, last access: September 2025. a
Sympatec GmbH: VIBRI/L, https://www.sympatec.com/en/particle-measurement/dosing-units/vibri, last access: September 2025. a
Tekceleo: Micronice P&S T45 Aerosol Generator, https://www.tekceleo.com/micronice-ps-t45/, last access: September 2025. a
TSI Incorporated: Aerodynamic Particle Sizer APS 3321, https://tsi.com/products/particle-sizers/supermicron-capable-particle-sizer-spectrometers/aerodynamic-particle-sizer-aps-3321, last access: September 2025. a
U.S. Army Edgewood Chemical Biological Center: 2014 Annual Report, https://api.army.mil/e2/c/downloads/414438.pdf (last access: September 2025), 2014. a
Vasilatou, K., Wälchli, C., Iida, K., Horender, S., Tritscher, T., Hammer, T., Rissler, J., Gaie-Levrel, F., and Auderset, K.: Extending traceability in airborne particle size distribution measurements beyond 10 µm: Counting efficiency and unit-to-unit variability of four aerodynamic particle size spectrometers, Aerosol Sci. Technol., 57, 24–34, https://doi.org/10.1080/02786826.2022.2139659, 2022. a
Wang, X., Liu, T., Bernard, F., Ding, X., Wen, S., Zhang, Y., Zhang, Z., He, Q., Lü, S., Chen, J., Saunders, S., and Yu, J.: Design and characterization of a smog chamber for studying gas-phase chemical mechanisms and aerosol formation, Atmos. Meas. Tech., 7, 301–313, https://doi.org/10.5194/amt-7-301-2014, 2014. a
- Abstract
- Introduction
- Facility Development & Instrument Integration
- Experimental Procedures
- Validation & Data Comparison Between Instruments
- Operational Observations
- Conclusions
- Code and data availability
- Author contributions
- Competing interests
- Disclaimer
- Financial support
- Review statement
- References
- Supplement
- Abstract
- Introduction
- Facility Development & Instrument Integration
- Experimental Procedures
- Validation & Data Comparison Between Instruments
- Operational Observations
- Conclusions
- Code and data availability
- Author contributions
- Competing interests
- Disclaimer
- Financial support
- Review statement
- References
- Supplement