
the Creative Commons Attribution 4.0 License.
the Creative Commons Attribution 4.0 License.
 | 22 Jul 2026
Impact of Sentinel-5 SWIR detector persistence on trace gas retrievals
Mari C. Martinez-Velarte
Jochen Landgraf
Ben Veihelmann
Bernd Sierk
Launched in August 2025, the Sentinel-5 (S5) mission aims to enhance greenhouse gas monitoring by working alongside existing Copernicus satellites, such as the Sentinel-5 Precursor. S5 is equipped with shortwave-infrared (SWIR) grating spectrometers that provide operational daily retrievals of CH4 and CO, while the coverage of the SWIR region also makes S5 measurements sensitive to atmospheric CO2. One particular challenge for S5 is the persistence effect in its SWIR mercury-cadmium-telluride (MCT) detectors, which can introduce scene-dependent radiometric biases when the signal at a detector pixel changes between consecutive readouts, as occurs in scenes with along-track brightness variations.
This study quantifies persistence-induced biases for CH4, CO, and a potential CO2 product from full-physics retrievals, as well as for the proxy ratio, whose relative error is representative of proxy CH4 retrievals, using the operational RemoTeC CH4 retrieval algorithm. We simulate realistic scenes over regions like the Nile Delta, California’s Central Valley, and the Lusatian lignite district, which exhibit the spatial radiance variability relevant for persistence effects. Across these scenes, persistence-induced biases are generally small, with typical amplitudes below 0.12 % for CH4, 0.10 % for CO2, 0.34 % for CO, and 0.06 % for the proxy. However, larger deviations occur in high-contrast scenes, particularly at coasts and land–water transitions, where localized errors can reach up to 1.59 % for CH4, 1.55 % for CO2, 4.01 % for CO, and 0.71 % for the proxy ratio. These values represent a substantial fraction of the performance targets for CO and the proxy, and exceed those for CH4 and CO2. This indicates that, while persistence is not the dominant error source under most conditions, it can still produce non-negligible biases in spatially structured scenes, which may be misinterpreted as localized enhancements. Therefore, such effects should be mitigated, for example through targeted quality control or filtering of affected pixels.
- Article
(5230 KB) - Full-text XML
- BibTeX
- EndNote


Sentinel-5 (S5) was launched in August 2025 aboard MetOp-SG-A1, the first of three MetOp Second Generation (MetOp-SG) A/B satellite pairs intended to deliver over two decades of atmospheric and meteorological observations. The mission serves key applications in air quality, climate, and environmental policy, and ensures the continuity of long-term records within the Copernicus program. It will provide near-daily global coverage of atmospheric composition – including trace gases and aerosols – at a spatial sampling of approximately 7.1 × 7.5 km2 at nadir (Ingmann et al., 2012; Sierk et al., 2018). The mission's core instrument, the Ultraviolet, Visible, Near-infrared, and Short-wave Infrared (UVNS) spectrometer, is a passive grating imaging spectrometer covering seven spectral bands from 270–2385 nm (Irizar et al., 2019). Sentinel-5 overlaps and complements its predecessor, Sentinel-5 Precursor (S5P), enabling cross-calibration and complementary orbit sampling due to their different local overpass times (in the early morning for S5 and in the early afternoon for S5P). Compared with S5P's TROPOMI spectrometer, S5's UVNS instrument offers a broader spectral range while employing a coarser spatial sampling (7.1 × 7.5 km2 vs. 5.5 × 7.0 km2) (Irizar et al., 2019; KNMI, 2022). The extended spectral coverage – including the SWIR-1 band (1590–1675 nm) in addition to SWIR-3 (2305–2385 nm) – enables sensitivity to CO2 and proxy retrievals alongside CH4 and CO observations. This supports advanced trace-gas and aerosol studies relevant to air-quality and climate applications.
The S5 SWIR channels utilize a Lynred Next-Generation Panchromatic (NGP) HgCdTe (MCT) detector with a dedicated readout circuit (ROIC). NGP represents Lynred's successor line to the Saturn-series detectors flown on TROPOMI. It comprises two architectures: the earlier Advanced MCT Array Module (AMAM), used on Sentinel-5, and the more recent Modular Infrared Array Module (MIAM). In the AMAM architecture, the MCT layer is grown on a CdZnTe substrate before it is chemically etched away and coated with an anti-reflective layer (ARL) (Delannoy et al., 2015). This fabrication step introduces charge trapping/de-trapping mechanisms at the MCT/ARL interface, giving rise to detector persistence (also known as memory or lag effect). The delayed release of these charges adds an unwanted current in subsequent frames, producing scene-dependent radiometric deviations. Such deviations become particularly relevant when the incident signal varies between successive readouts, as encountered in scenes with strong along-track brightness variations. To address this issue, Lynred developed the MIAM architecture, which significantly mitigates the trapping/de-trapping effects. This enhanced architecture is employed within the Copernicus CO2M mission (Sierk et al., 2021). However, upgrading the Sentinel-5 detector from AMAM to MIAM was not feasible due to technical and programmatic constraints. Consequently, the Sentinel-5 AMAM detector must contend with persistence arising from both the charge trapping/de-trapping and other memory-related effects – such as those originating from the ROIC – that persist across all NGP architectures.
Accurate mitigation of the AMAM detector's charge-trapping component is required and draws upon heritage from similar missions. In CNES MicroCarb, which also employs the AMAM architecture (Pasternak et al., 2017), the complexity of modeling and correcting persistence effects motivated the adoption of a hardware-based mitigation strategy based on a trap-flooding method (McLeod and Smith, 2016). Building on this foundation, the present effort is focused on characterizing the AMAM detector's charge trapping/de-trapping behavior and quantifying the associated radiometric biases in Level-2 products. This study extends the CNES persistence model – originally developed for preliminary MicroCarb assessments – to achieve this goal. ROIC-induced lag effects are not addressed in the present study.
Using the CNES persistence model, we aim to demonstrate the expected S5 mission performance accounting for persistence-induced errors in the SWIR-1 and SWIR-3 spectral bands. We discuss the errors in the context of the mission science requirements: 1.0 % uncertainty for CH4 retrievals and 4×10¹⁷ molec. cm−2 for CO, which corresponds to 20 % of a typical column of 2×10¹⁸ molec. cm−2 (European Space Agency (ESA), 2020b). Additionally, we consider the performance target of 0.5 % for CO2, which is not an operational data product of S5 but of high scientific relevance. For context, dedicated CO2 missions such as MicroCarb and CO2M adopt more stringent accuracy requirements for XCO2, on the order of 0.1 % or below (European Space Agency (ESA), 2020a, 2024), highlighting the importance of assessing persistence effects on CO2 in the present analysis.
To this end, we perform an simulated-based experiment in which synthetic top-of-atmosphere radiances are generated and perturbed by the persistence signal using the CNES model. Subsequently, CH4, CO, and CO2 are retrieved with RemoTeC algorithm (Butz et al., 2010), which is used for the operational S5 CH4 retrieval. By comparing perturbed and unperturbed (ideal) retrievals, we assess the impact of persistence signal on XCH4, XCO2, and XCO, including the proxy approach. The analysis covers controlled synthetic scenes with a binary albedo transition in flight direction as well as realistic heterogeneous surfaces derived from Sentinel-2A data, representative of diverse land-cover and illumination conditions. Our results show that the persistence effect can introduce notable retrieval biases, particularly over dark or highly variable surfaces such as coastal or water-land interfaces, but that filtering these regions restores accuracy within S5 mission requirements.
The following sections describe the analysis conducted in this study. Section 2 introduces the CNES persistence model and the experiment framework used to assess detector persistence effects. Section 3 presents the outcomes of the persistence simulations, including the analysis of synthetic step-like albedo scenes and realistic cases based on Sentinel-2 albedo data. Finally, Sect. 4 summaries our findings and discusses their implications for the S5 mission.
To assess the impact of the persistence effect arising from trapping/de-trapping, we designed an experiment based on synthetic S5 Earth radiance scenes, as illustrated in Fig. 1. The radiance scenes were generated by a Level-1B (L1B) scene generator for a single observation geometry over a heterogeneous surface albedo using the approach described in Sect. 2.1, yielding L1B spectra of the type shown in Fig. 2. We generated synthetic radiance scenes averaged to 2.36 km in the across-track (ACT) direction, corresponding to the S5 nadir detector sampling, and to 20 m in along-track (ALT), corresponding to the Sentinel-2 resolution. The synthetic radiances approximate detector-level signals at each readout and served as input to the persistence-effect simulation, where the CNES model (Sect. 2.2) simulates the temporal response of the detector to the incoming signal, including persistence effects due to charge trapping and de-trapping (see Appendix A for details). The output of the CNES model – referred to hereafter as “perturbed radiance” – represents the synthetic radiance modified by the persistence effect, and is mapped on the 2.36 × 2.50 km2 ACT/ALT grid cells. The persistence effect is applied exclusively to the SWIR bands, as the NIR band does not exhibit persistence and is therefore not perturbed in this experiment. For S5, L1B data are provided on a 7.1 × 7.5 km2 ACT/ALT grid, resulting from an across-track spatial binning of detector pixels and a temporal co-adding in the along-track direction (both by a factor of 3). Accordingly, the perturbed radiances were then spatially co-added by the same factors in both ACT and ALT directions to map them onto the nominal S5 L1B spatial grid. These radiance scenes were then input to the Level-2 retrieval CH4 algorithm (Sect. 2.3). Finally, Level-2 retrievals derived from radiances with perturbed SWIR inputs were compared with those obtained from unperturbed radiances, and the resulting differences were assessed against the S5 mission product requirements.
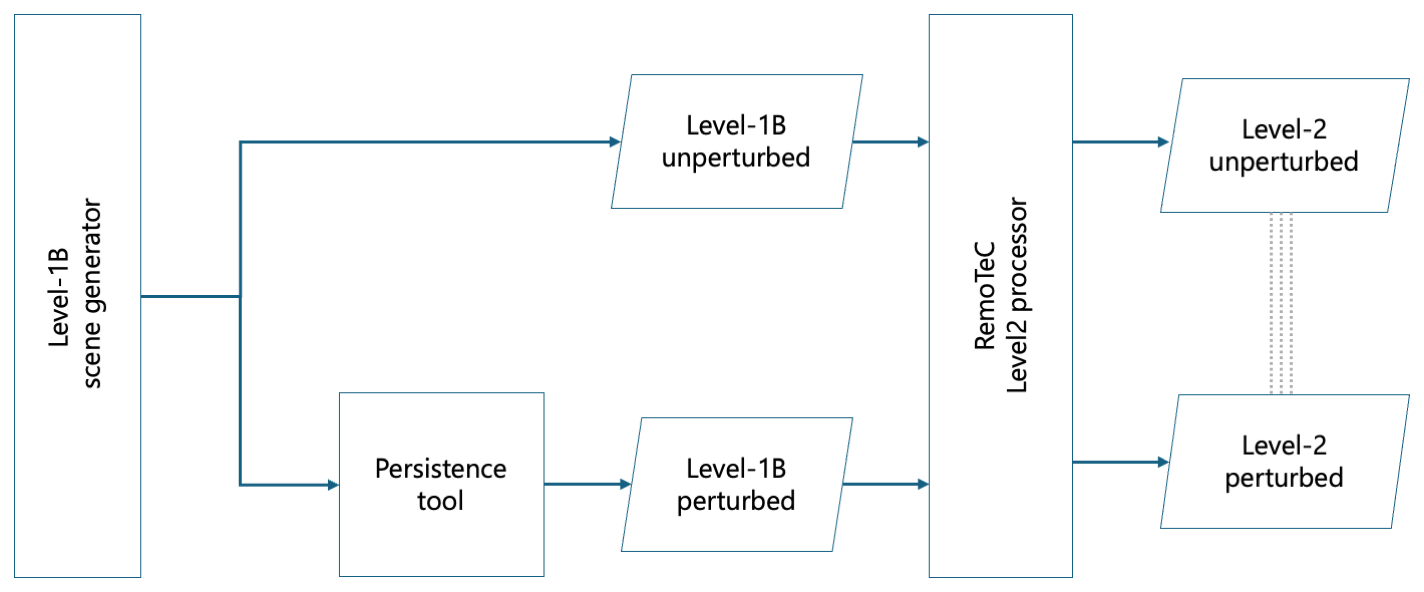
Figure 1Schematic overview of the simulation framework used to assess the impact of persistence perturbations. Synthetic spectra are generated from a common reference scene and propagated through two processing branches: one including persistence perturbations and one without perturbations. The resulting Level-1B spectra are processed independently through the retrieval chain to produce Level-2 products. The comparison between the perturbed and unperturbed Level-2 outputs enables quantification of the impact of persistence effects on the retrieved quantities.
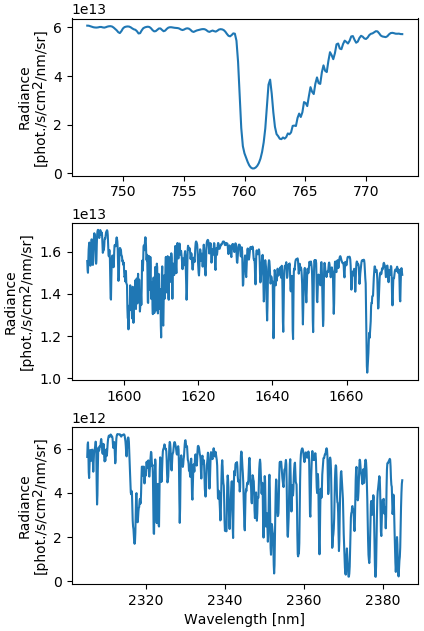
Figure 2Synthetic reference radiance spectra for the NIR, SWIR-1, and SWIR-3 bands (top to bottom), generated with the LINTRAN V2.1 model in RemoTeC using a constant surface albedo of 0.6 (NIR) and 0.4 (SWIR), and convolving high-resolution solar spectra with the S5 instrument response.
2.1 Simulation of Synthetic S5 Earth radiance
We constructed a heterogeneous S5 radiance scene from synthetic radiance spectra over spatially varying surface albedo, designed to represent conditions under which the persistence effect becomes relevant. The synthetic S5 radiance spectra were generated for a single observation geometry using RemoTeC.
2.1.1 Albedo maps
Two types of surface albedo scenes were used: one based on Sentinel-2A albedo data representing real-world surface variability, and another consisting of synthetically generated binary patterns designed to mimic idealized albedo discontinuities. In the synthetic case, the scene features a sharp transition in surface reflectance at its center in the along-track (ALT) direction, simulating a discontinuity from a darker to a brighter surface. This scenario mimics a satellite overpass moving from a low-albedo region into a high-albedo one, and we refer to it as the dark-to-bright-albedo (D2B) case. The reverse configuration, representing a transition from a bright to a dark surface, is also considered and referred to as the bright-to-dark (B2D) case. The specific albedo values used to construct the corresponding radiance fields are introduced in the following section. The discontinuous albedo scenes offer a controlled framework for examining the spatial propagation of persistence-induced perturbations.
We also analyze a more realistic albedo scene constructed from Sentinel-2A surface-albedo imagery using bands 6, 7, 11, and 12 (European Space Agency, 2023). Bands 6 and 7, centered at 740 nm (±14 nm) and 783 nm (±20 nm), respectively, are spectrally averaged to approximate the S5 NIR band. Bands 11 and 12, centered at 1610 nm (±90 nm) and 2190 nm (±180 nm), are used to represent the SWIR-1 and SWIR-3 spectral windows of Sentinel-5, respectively. Despite the small spectral mismatch with the Sentinel-5 bands, the relative spatial variations in surface reflectance are well represented in the available Sentinel-2 bands. Any resulting albedo differences are minor and are not expected to affect the outcomes of this study.
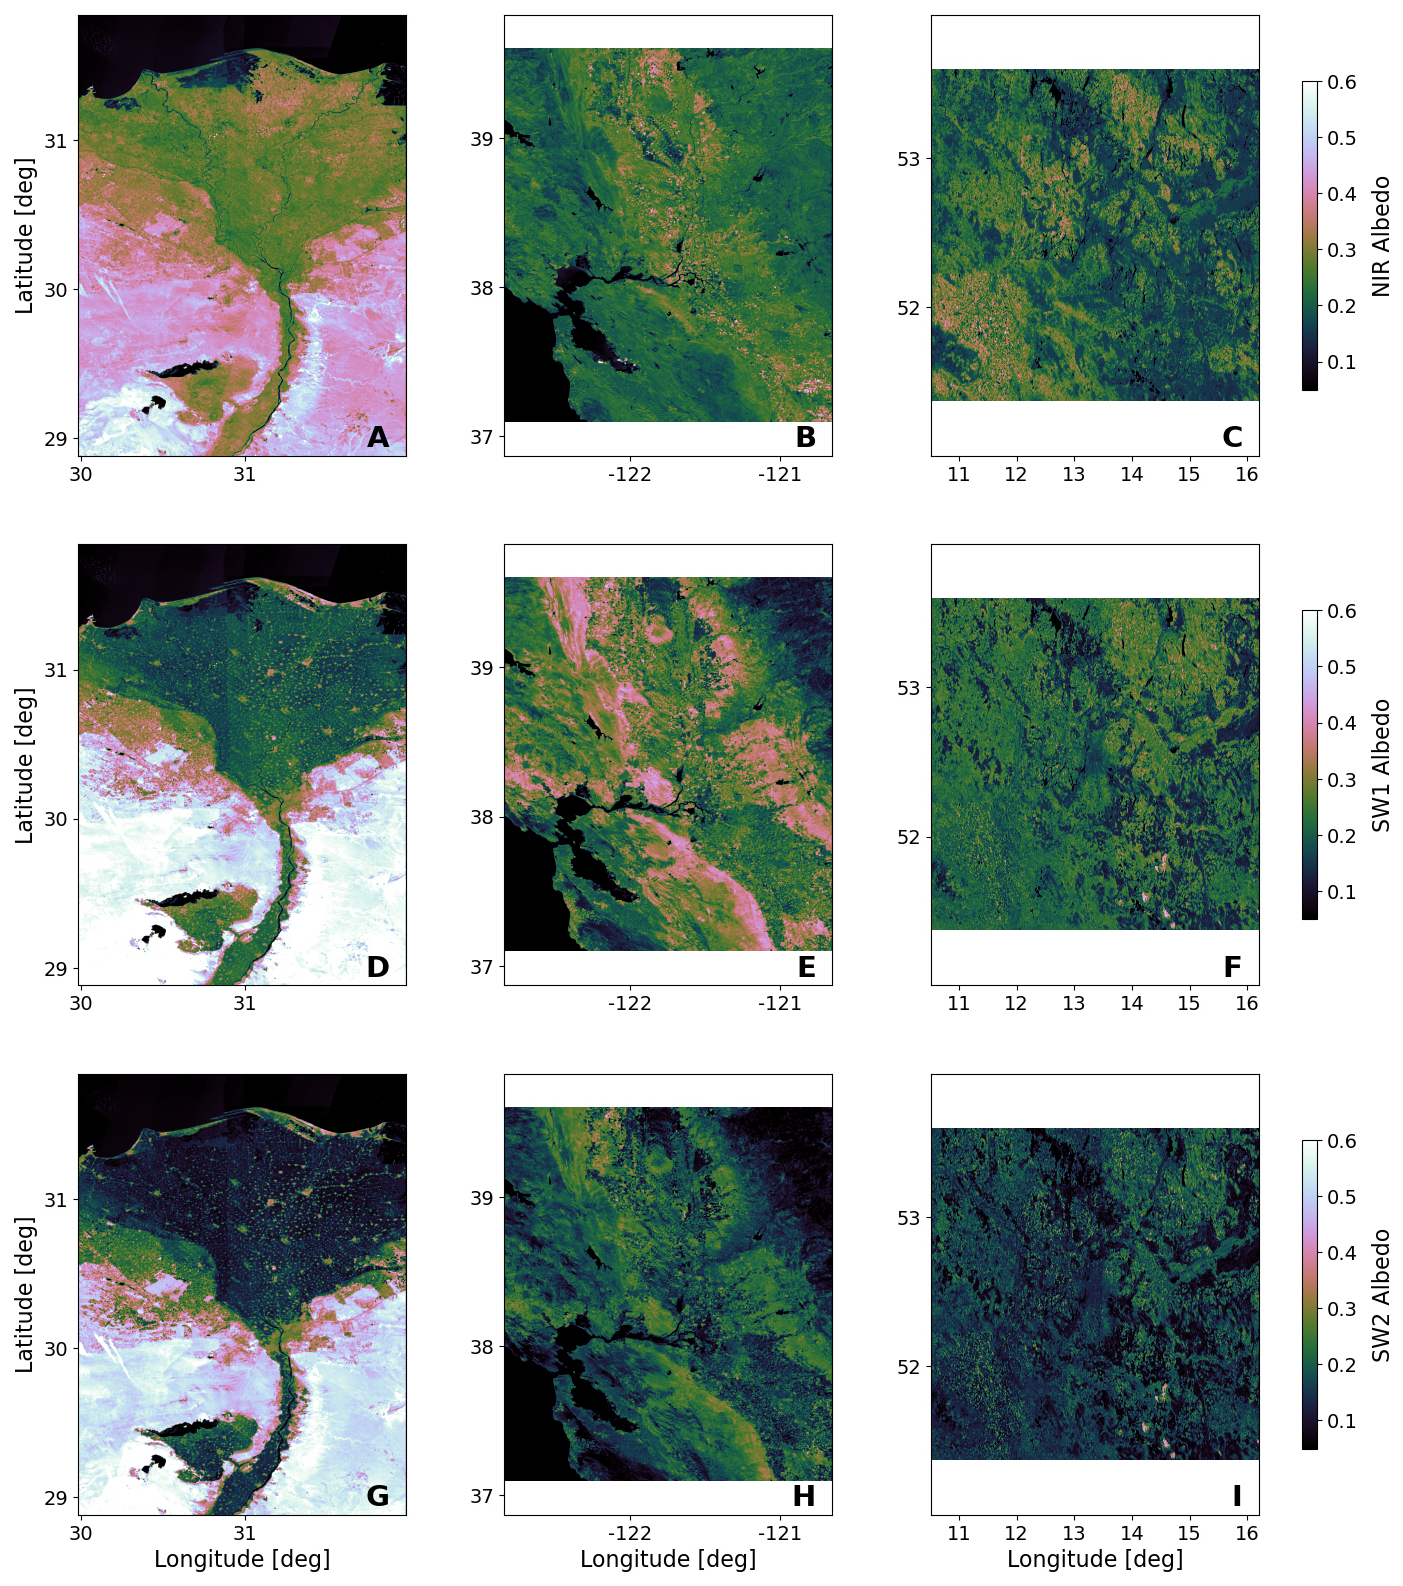
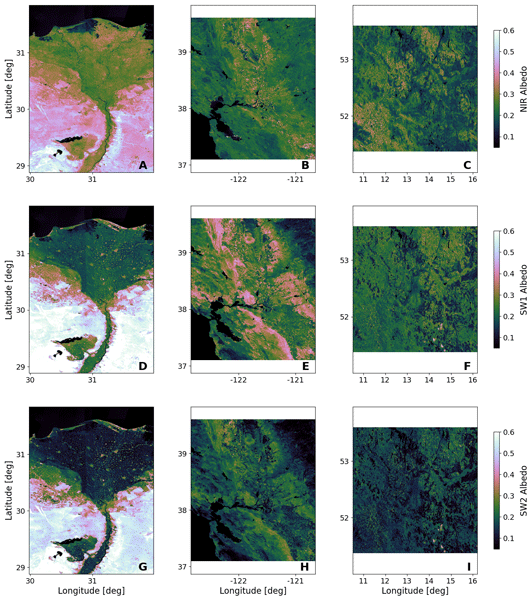
Figure 3Sentinel-2 albedo scenes for the three selected regions – (A, D, G) Nile Delta, (B, E, H) California's Central Valley, and (C, F, I) the Lusatian lignite district in Germany. The panels show data from the Sentinel-2 bands spectrally closer to Sentinel-5 retrieval windows: (A–C) NIR (mean of bands 6 and 7), (D–F) SWIR-1 (band 10), and (G–I) SWIR-3 (band 11).
Three study regions were selected to capture a range of surface heterogeneity and potential trace gas variability: the Nile Delta, California's Central Valley, and the Lusatian lignite district in Eastern Germany. The corresponding Sentinel-2 albedo scenes for these regions are shown in Fig. 3. Selection criteria included surface albedo variability, the presence of strong albedo gradients, and proximity to known or potential sources of trace gas emissions.
2.1.2 Synthetic S5 radiance spectrum
We simulated radiance spectra for a given set of atmospheric conditions, such as profiles of trace gases and aerosols. Molecular absorption is modeled using spectroscopic parameters from the HITRAN database (Rothman et al., 2009), with additional spectroscopic data for methane and related species from Tran et al. (2006) and Scheepmaker et al. (2013). Line-by-line absorption cross-sections are computed for CH4 and the interfering gases CO, CO2, H2O, and O2, consistent with the setup used in the RemoTeC retrieval framework. The atmospheric profiles for trace gases, temperature, and pressure are derived from an ECHAM model simulation, and are kept fixed across all simulations. In order to construct the synthetic S5 radiance spectra, we used a standard model profile for the trace gases. The synthetic spectra include a mild aerosol load with an aerosol optical thickness of 0.1 at 760 nm, represented by a Gaussian vertical distribution centered near the surface (Butz et al., 2010), with aerosol microphysical properties described by a power-law particle size distribution (α=4; Butz et al., 2011) and optical properties taken from lookup tables (Dubovik et al., 2006). Surface albedo is treated as constant within each spectral band (i.e. wavelength-independent), while varying between bands and from pixel to pixel, consistent with the band-averaged reflectance provided by Sentinel-2. The synthetic S5 radiance spectra are generated using the LINTRAN V2.1 forward model implemented in RemoTeC (Schepers et al., 2014) and the simulated line-by-line spectra are convolved with a Gaussian Instrument Spectral Response Function (ISRF), applying a full width at half maximum (FWHM) of 0.4 nm for the NIR band, 0.25 nm for the SWIR-1 and SWIR-3 band, in accordance with S5 instrument specifications. Instrument noise is not explicitly added to the simulated spectra, as the aim is to isolate persistence-induced biases. This simplification neglects signal-dependent noise, which contributes a statistical component to the mission error budget. The magnitude of this component is specified in the mission requirements (European Space Agency (ESA), 2020b).
To avoid time-consuming simulations, we assume a constant solar and viewing geometry over the entire scenes (solar zenith angle of 50°, viewing zenith angle of 0°, and relative azimuth angle of 0°). A lookup table of spectra is generated for albedo range 0.001–0.63 in steps of 0.003 for the NIR, 0.0002–0.76 in steps of 0.0038 for the SWIR-1, and 0.0006–0.7 in steps of 0.0035 for the SWIR-3. For each pixel in the albedo scene, the corresponding spectra is obtained by selecting from the LUT the entry with the closest albedo value.
2.2 The Persistence Effect Simulator
To quantify the persistence effect, the French Space Agency CNES has developed a model to simulate the effect of charge trapping/de-trapping on the MicroCarb measurements (Jouglet et al., personal communication, 2025). Although the model was originally developed for MicroCarb, it can be adapted to represent the behavior of the S5 SWIR detectors, which employ the same underlying detector architecture. The tool models the time-dependent detector response to the input radiance scene and produces a modified radiance spectrum that includes the persistence perturbations.
To assess the persistence effect in Sentinel-2 albedo scenes, we begin by determining the temporal variation of radiances illuminating the instrument. With the Sentinel-2 pixel size in the along-track (ALT) direction, and the satellite's ground speed, we assign a timestamp to each extracted spectrum as described in Sect. 2.1.2. Subsequently, we estimate the detector's current and integrate it along the track over the S5 dwell time. We then calculate the spectrum perturbation by electron trapping current based on the available trap capacity, while the de-trapping current is characterized by an exponential release of charge over time. The persistence effect is quantified by the difference between the trapping and de-trapping currents relative to the unperturbed signal. Consequently, the perturbed radiance scene is initially computed on the S5 detector pixel grid and subsequently, radiances are aggregated onto the S5 co-added pixel grid, which is 7.1 × 7.5 km2. Further details of the persistence model are elaborated in Appendix A. The resulting spectra are subsequently utilized as input for the RemoTeC retrieval algorithm. Since a different detector is employed, the persistence effect does not impact the NIR band, limiting the computation of the persistence current to the SWIR-1 and SWIR-3 bands.
The co-adding of data when going from the detector grid to the L1B spatial grid can influence the quantification of the persistence-effect-induced bias. This becomes clear when studying the synthetic albedo test cases, where the position of the albedo discontinuity relative to the co-added grid can significantly affect the magnitude of the persistence bias. Section 3.1 examines the sensitivity of the retrieval to this alignment by estimating the errors introduced by shifting the albedo discontinuity with respect to the S5 co-added grid.
2.3 Retrieval of CH4, CO2, and CO
The perturbed Earth radiance spectra serve as input to the RemoTeC algorithm, the retrieval code used for the operational Sentinel-5 CH4 product, which is also used to infer CO2 and CO trace gases. RemoTeC employs a scattering/non-scattering radiative transfer model to invert the measured spectra and retrieve atmospheric composition. It simulates radiance spectra which are iteratively fitted to observations using a non-linear least-squares optimization, minimizing the difference between simulated and measured spectra (Butz et al., 2010; Schepers et al., 2014).
Aerosol and cirrus scattering represent major challenges for methane retrieval from space-based backscatter measurements in the SWIR range. Retrieval strategies either estimate methane concentrations simultaneously with scattering parameters (full-physics retrieval) or use a proxy approach relying on the ratio, assuming that scattering effects largely cancel in the ratio and that the background CO2 field is homogeneous and accurately known from, for example, model data (Schepers et al., 2012).
For our study, we configured the full-physics retrievals (Butz et al., 2011, 2012) to utilize reflectance measurements in the SWIR-1 and SWIR-3 bands (1590–1675 and 2305–2385 nm, respectively). Additionally, the NIR band (745–773 nm) is used to constrain atmospheric scattering properties. Since the SWIR-1 band is sensitive to CO2 and H2O absorption, and SWIR-3 is sensitive to CO and H2O, the total column of these interfering absorbers is also retrieved alongside CH4 and the surface albedo. Although the operational S5 CO product is based on a different retrieval scheme (SICOR), RemoTeC provides equivalent results within the constraints of this study and, therefore, our CO impact estimates are representative of the operational retrieval.
The proxy retrieval infers the CH4 proxy product using radiance measurements in the SWIR-1 band under the assumption of a non-scattering atmosphere. The product is defined by
where [CO2] and [CH4] are retrieved ignoring atmospheric scattering and is the dry air column mixing ratio of CO2 simulated by a model (Frankenberg et al., 2006). Here, the aerosol induced error in [CO2] and [CH4] are very similar and cancel out to a large extent in the ratio in Eq. (1). The persistence error affecting the proxy product originates from errors in the retrieved CH4 and CO2 columns entering Eq. (1). Since the proxy XCH4 is directly proportional to the ratio , the relative error in this ratio propagates one-to-one into the relative error of the proxy CH4 product. Therefore, in the following, we quantify persistence effects for the proxy retrieval in terms of the relative error in the ratio.
In summary, we define two retrieval configurations used throughout this work:
-
Case Proxy: a non-scattering retrieval using SWIR-1, retrieving XCH4, XCO2, and H2O.
-
Case FP: a full-physics scattering retrieval using NIR, SWIR-1, and SWIR-3, retrieving XCH4, XCO2, XCO, and H2O.
In the proxy retrieval, the output is further used to compute the ratio directly from the SWIR-1 band, leveraging its concurrent sensitivity to both gases.
Each retrieval case is run under two conditions: an ideal scenario using the unperturbed (ideal) radiance scene, and a perturbed scenario that incorporates the persistence effect. The impact of the persistence effect on the retrievals is quantified using the persistence bias, which we define in relative terms as:
where Xperturbed and Xideal refer to the mean retrieved total columns of the specific trace gas for the perturbed and the ideal case, respectively. The same albedo parameterization as in the forward simulations is adopted in the retrieval. For trace gasses and, where applicable, aerosols, the a priori setting is set equal to the true state used to generate the synthetic spectra, and no explicit a priori uncertainties are imposed. This configuration provides a consistent reference case, so that the dominant differences between perturbed and unperturbed retrievals can be attributed to the persistence effect.
3.1 The Binary Albedo Case
We start to quantify the persistence bias using synthetic scenes featuring an abrupt, across-track albedo transition – from albedo A1 to A2 – located at the center of each scene, with otherwise uniform albedo. This configuration causes the S5 push-broom instrument to experience a rapid temporal change in radiance as it crosses the discontinuity. For each scene, the same albedo values A1 and A2 are used in both the SWIR-1 and SWIR-3 bands, while the NIR albedo is set to 1.5 times the corresponding SWIR albedo. This factor was selected to approximate the typical NIR-to-SWIR reflectance ratio found in common land-cover types. Because the maximum magnitude of the persistence bias is expected to depend on both the absolute albedo value and the albedo contrast (A2−A1), we evaluated the simulations across a grid of (A1, A2) combinations covering the full range of tested albedos. The results confirm that the persistence-induced bias is negligible in regions of constant albedo, providing a basic sanity check of the model under spatially homogeneous illumination. At the albedo discontinuity, however, pronounced persistence biases occur and persist for several pixels downstream along the track. The persistence length, defined by the distance from the albedo discontinuity to a bias of 0.1 %, extends over approximately 1–2 pixels for CH4 and CO2, 1–5 pixels for CO, and 1 pixel for the proxy ratio. The largest bias typically appears in the first pixel immediately following the transition, with the effect decaying rapidly in subsequent pixels.
Figure 4 illustrates the dependence of the maximum persistence bias on A2 for different A1 values, for CH4, CO2, CO and the proxy ratio. All four quantities exhibit similar qualitative behavior. In each case, the largest absolute persistence bias occurs for bright-to-dark (B2D) transitions, with the strongest perturbations found at the lowest A2 values and the largest albedo contrasts. For the most extreme simulated configuration – (A1, A2) = (0.55, 0.05) – the persistence bias reaches −1.74 % for CH4, −1.32 % for CO2, −5.45 % for CO, and −0.64 % for the proxy. For a given fixed albedo A1, the persistence bias grows rapidly with increasing albedo contrast in B2D transition scenes but tends to saturate in dark-to-bright (D2B) scenes once the transition exceeds roughly 0.4, with the bias sign reversing from negative to positive.
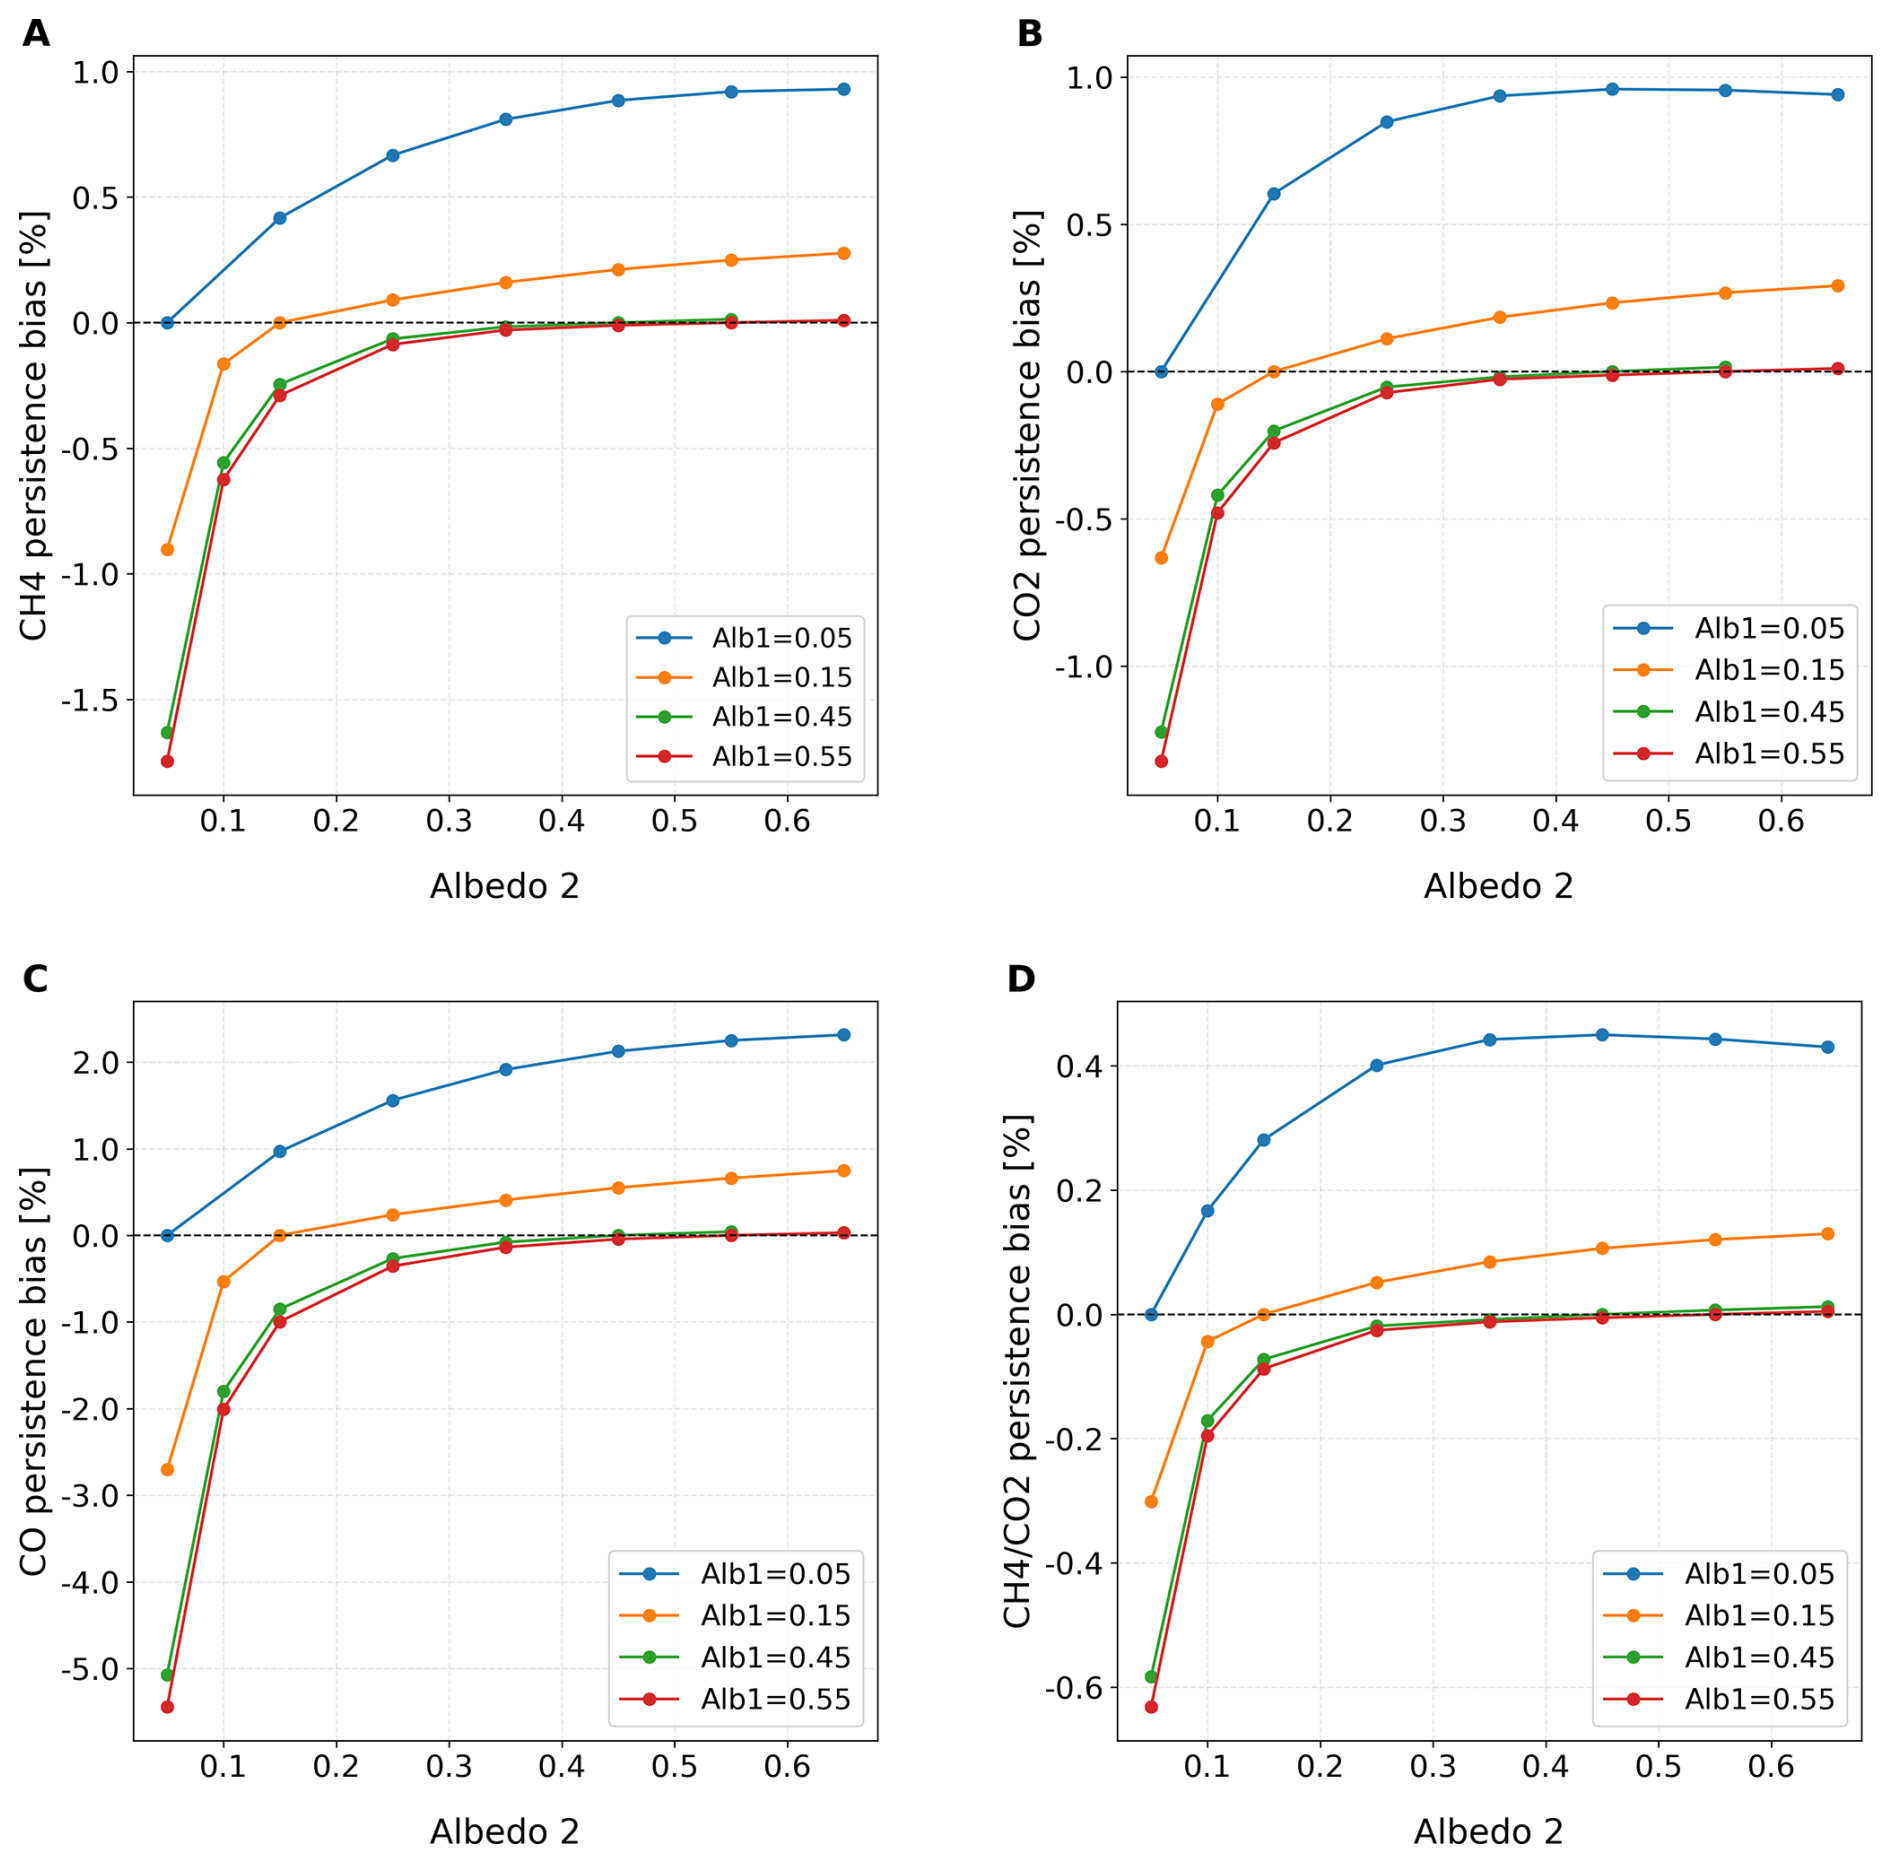
Figure 4Results for the binary albedo scene with a discontinuity in surface albedo, transitioning from albedo 1 to albedo 2. Panels (A)–(D) show the dependence of the persistence bias on albedo for CH4, CO2, CO, and the proxy retrievals, respectively. Albedo 1 and albedo 2 denote the two albedo values defining the discontinuity. Identical values are used for both SWIR bands, while the NIR albedo is set to 1.5 times the SWIR albedo.
The non-zero bias in the proxy ratio further indicates that persistence-induced perturbations differ between the spectral regions used for CH4 and CO2 retrievals, and therefore do not fully cancel in the ratio.
The magnitude of the persistence effect is also sensitive to the timing of the detector readout relative to the albedo transition, and hence the S5 spatial sampling grid. This sensitivity arises from the along-track integration of the detector signal: when a sharp albedo transition occurs within the integration, the signal accumulates both unperturbed and perturbed radiances. As a result, the net persistence perturbation depends on the sub-pixel position of the albedo transition. This dependence is reflected in the range of persistence biases obtained for different transition positions. For CH4, biases might range from 0.30 % to 0.85 % in D2B and −1.56 % to −0.50 % in B2D. The proxy ratio bias exhibits ranges from 0.13 % to 0.45 % in D2B and from −0.58 % to −0.15 % in B2D (Fig. B1). For both CH4 and the proxy, these variations are significant in the context of the 1.0 % performance target. For the simulations presented in Fig. 4, the discontinuity was placed to yield the maximum persistence bias, providing an upper bound for the expected perturbation.
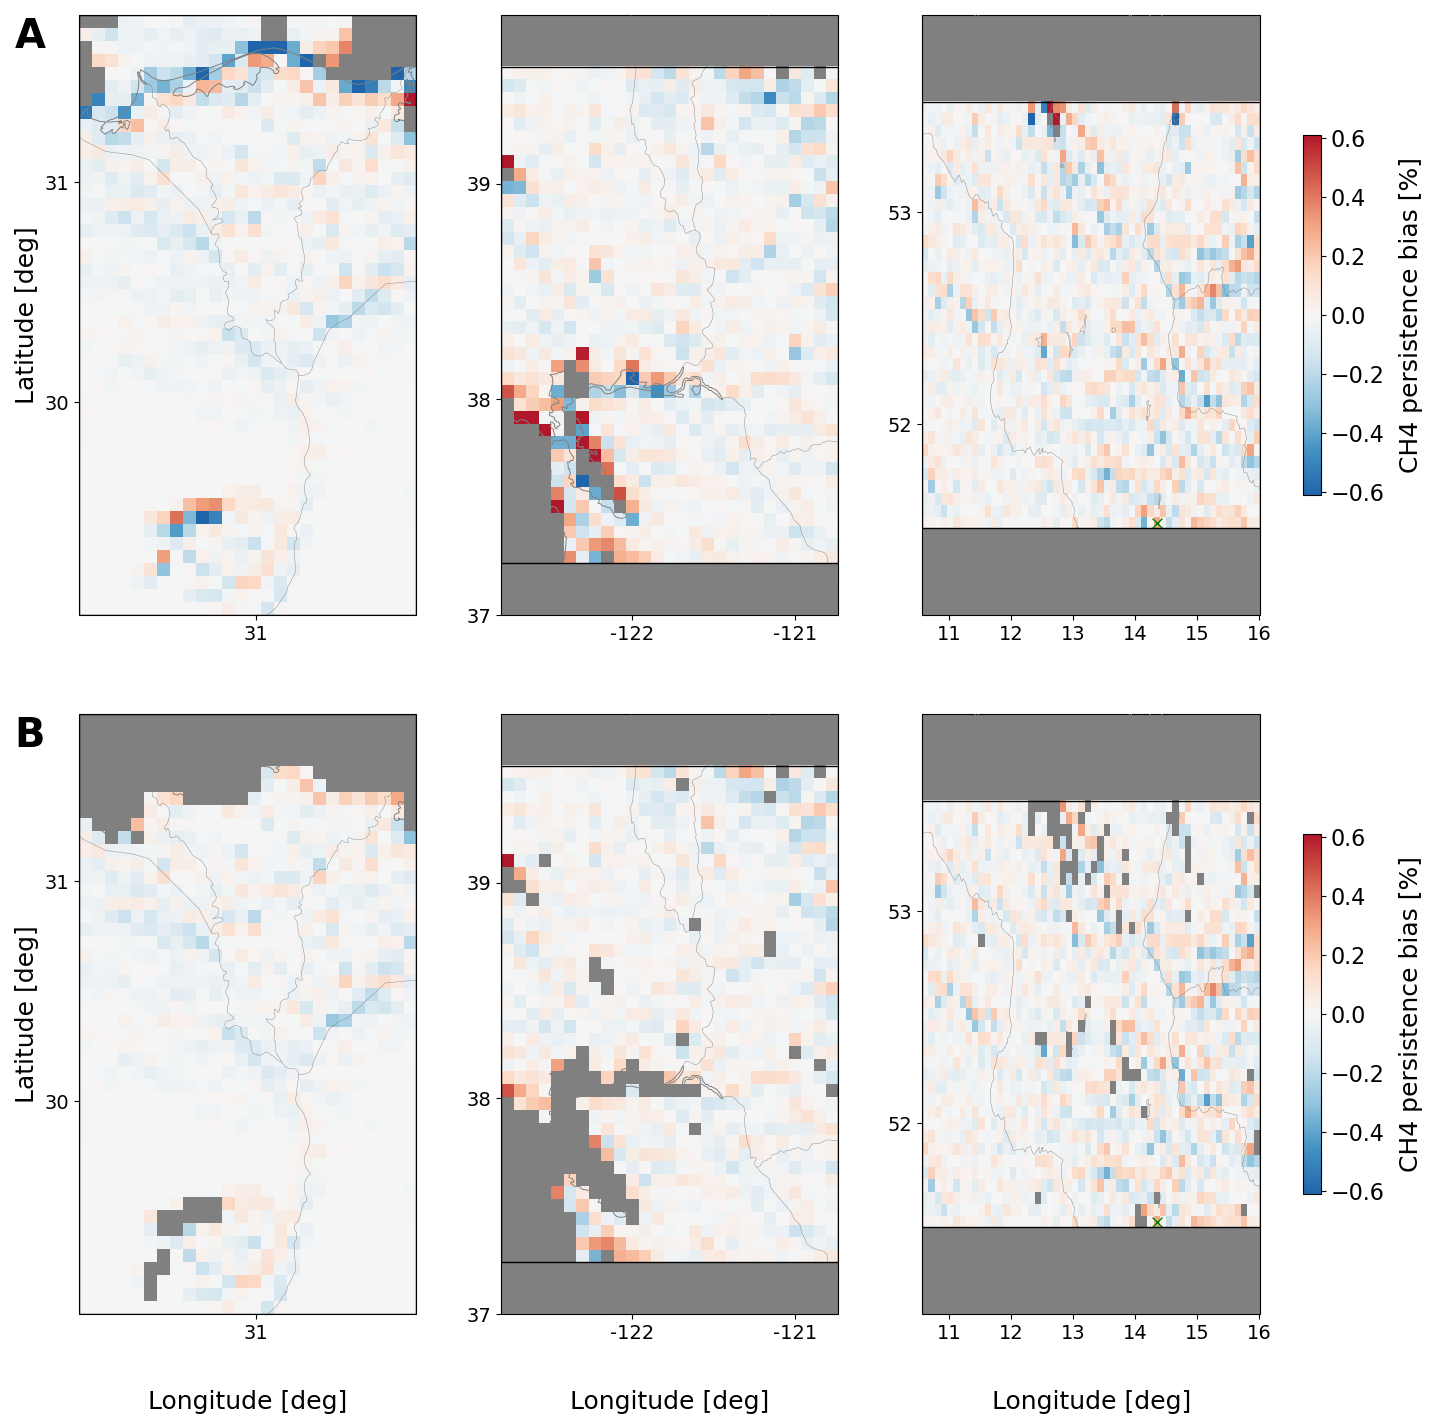
Figure 5Panels (A) and (B) show CH4 relative persistence bias maps from the full-physics (scattering) retrieval after applying an albedo threshold filter of 0.05, according to the instrument sensitivity threshold; panel (B) additionally applies a water-land mask. From left to right, the scenes correspond to the Nile Delta, California's Central Valley, and the Lusatian lignite district in Germany. Coastlines, rivers, and lakes are overlaid using Cartopy's built-in Natural Earth features for contextual reference.
3.2 S2-Albedo Cases
Here we present the results of the simulated persistence perturbations over three spatially heterogeneous regions: the Nile Delta, California's Central Valley, and the Lusatian district in Eastern Germany. For these simulations, scene surface reflectances were derived from Sentinel-2 albedo data, as described in Sect. 2.1.2. To account for sensor limitations, pixels below the effective reflectance sensitivity limit (albedo <0.05) were removed from the statistical evaluation, although they were retained in the persistence perturbation simulations to preserve their influence on the scene. We assess the spatial variability of the resulting persistence bias for each scene, its dependence on surface albedo, and the effect of simple filtering strategies on the overall bias statistics. The selected regions are not intended to be globally representative, but rather to span a range of surface albedo conditions and contrasts; the results should therefore be interpreted as indicative of local effects rather than global statistics.
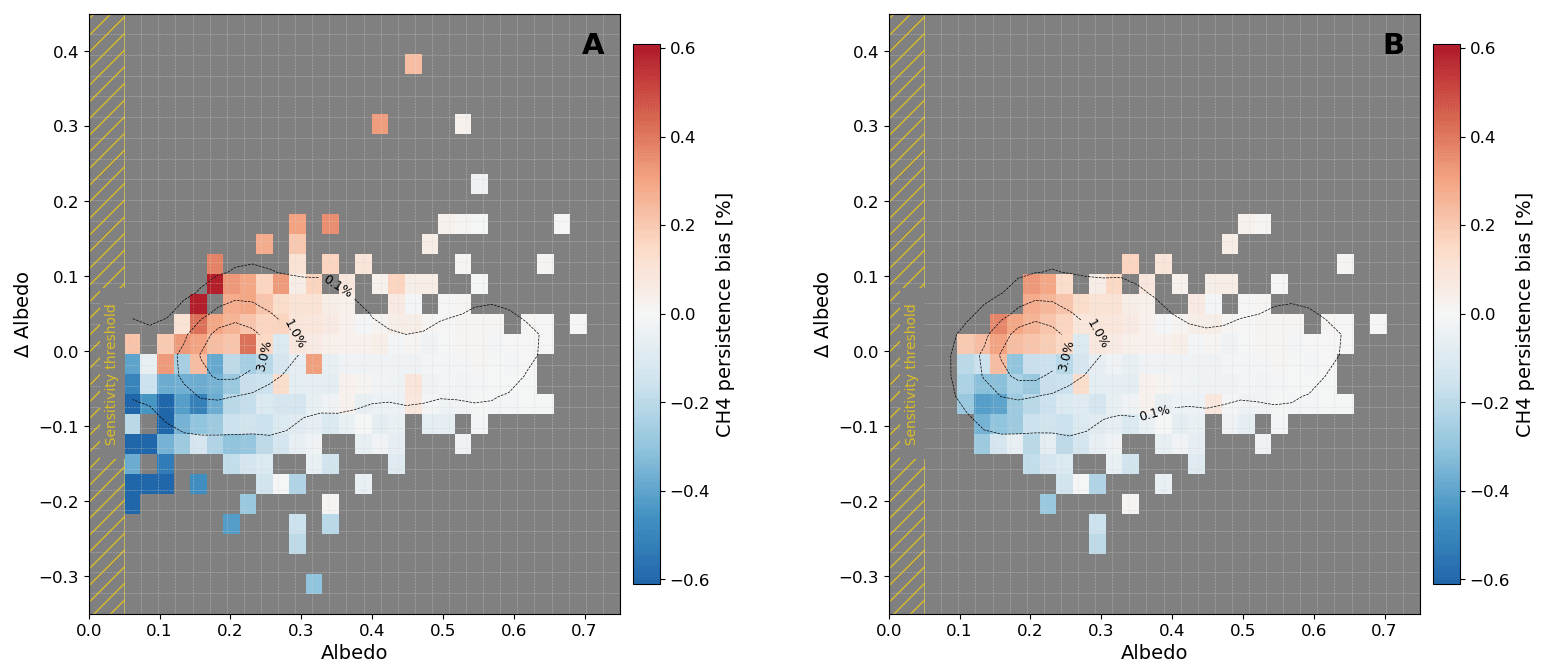
Figure 6Panel (A) shows the heatmap of the CH4 relative persistence bias with respect to the SWIR-1 albedo and the corresponding ΔSWIR-1 albedo, after applying an albedo threshold filter of 0.05 consistent with the instrument sensitivity threshold; panel (B) additionally applies a water-land mask. Here, ΔSWIR-1 albedo denotes the difference between the SWIR-1 albedo of a given pixel and that of the preceding pixel along the flight direction. Color indicates the maximum persistence bias in CH4 across the three combined Sentinel-2 scenes. The gold-shaded region (albedo <0.05) marks the sensitivity threshold of the UVNS spectrometer, where retrieval reliability is reduced. The dotted lines denote the contour plots showing the distribution density of data points within the same (Albedo, Δ Albedo) parameter space.
Figure 5a presents the relative persistence CH4 bias maps for each study region; while the corresponding maps for CO2, CO, and the proxy ratio are shown in Appendix B2 (Fig. B2). The spatial patterns reveal that the persistence effect varies strongly with surface heterogeneity. The Nile Delta exhibits pronounced albedo contrasts arising from its diverse land use: dark irrigated croplands and water bodies interspersed with brighter urban areas and desert fringes. In California's Central Valley, the mix of orchards, croplands, fallow fields, wetlands, and urban zones produces strong spatial heterogeneity, with croplands typically showing high NIR and lower SWIR reflectance, dry soils and built areas appearing brighter across bands, and built areas showing moderate reflectance. In contrast, the Lusatian district – dominated by open-pit lignite mines, reclaimed soils, and artificial lakes – shows uniformly lower albedo in the NIR and SWIR, consistent with the prevalence of dark mineral and moist surfaces. These differences in surface type and reflectance are directly reflected in the pixel-level persistence variability and bias statistics. Overall, we find a variability ranging from 0.11 % to 0.15 % for CH4, from 0.08 % to 0.12 % for CO2, from 0.29 % to 0.40 % for CO, and from 0.03 % to 0.06 % for the proxy ratio. These variations constitute only a small portion of the respective uncertainty budgets (1.0 % for CH4 and the proxy, 0.5 % for CO2, and 0.20 % for CO). Mean biases remain negligible – below 0.02 % for CH4 and CO2, 0.07 % for CO, and −0.008 % for the proxy ratio – confirming that the persistence effect mainly introduces spatial variability rather than a systematic offset. This variability is closely linked to surface reflectance, with lower-albedo surfaces across all spectral bands exhibiting stronger persistence variability, a pattern consistently observed in the Nile Delta, Central Valley, and Lusatian region. Figure 6 quantifies this relationship, showing the dependence of persistence bias on both the absolute SWIR-1 albedo and the pixel-to-pixel albedo gradient (ΔA), using data aggregated from the three regions. The ΔA is defined as the difference between each pixel’s albedo and that of the preceding pixel along the along-track direction, consistent with the results in Sect. 3.1, which showed that persistence signal primarily affects the first pixel following an albedo transition. The dotted contour lines indicate the density distribution of data points in the (albedo, ΔA) space, showing that the largest persistence-induced biases occur in relatively sparsely populated regions of the parameter space. While most pixels cluster around albedo values of around 0.2 and ΔA between ± 0.05, the largest persistence-induced biases occur for albedo values below 0.2 and for moderate gradients between approximately −0.15 and 0.1. This behavior reflects enhanced detector persistence over darker surfaces, where reduced reflected radiance enhances the relative impact of persistence signal contributions. A similar relationship is observed for CO2, CO, and the proxy ratio (see Appendix B2, Fig. B4).
Although this variability and overall bias are small, large localized outliers are observed in the three regions, typically located near strong albedo gradients such as coastlines, lakes, or other water-land boundaries. In the Nile Delta, extreme values reach up to −1.23 % for CH4, −1.02 % for CO2, −3.52 % for CO, and −0.70 % for the proxy ratio. These are primarily found along the northern coast, marking the transition between land and the Mediterranean Sea, and around the Faiyum Oasis near Lake Moeris. In California's Central Valley, peak biases occur near the San Francisco Bay–Delta system and around Clear Lake, reaching up to 1.59 % for CH4, 1.55 % for CO2, 4.01 % for CO, and 0.71 % for the proxy ratio. The Lusatian lignite district exhibits only a few outliers in its northwestern part, over the Mecklenburg Lake District, with maximum biases of 1.07 %, 1.28 %, 1.99 %, and 0.61 % for CH4, CO2, CO, and the proxy ratio, respectively. Overall, these outliers represent a substantial fraction of the mission uncertainty budget for CO and the proxy, while exceeding the corresponding targets for CH4 and CO2, indicating the need to identify and flag such pixels in operational processing.
Table 1Statistical overview of persistence-induced retrieval biases before and after applying the land/water mask. Mean, standard deviation, and maximum persistence biases (in %) are shown for each trace gas across the three Sentinel-2 albedo scenes: the Nile Delta, California's Central Valley, and the Lusatian lignite district in Germany. (Top) Statistics after applying an albedo threshold filter of 0.05; (bottom) statistics after additionally applying a land/water mask. The last row reports the percentage of pixels removed by the land/water filter for each scene; values correspond to the full-physics retrievals, with differences for the proxy retrieval below 1 %.
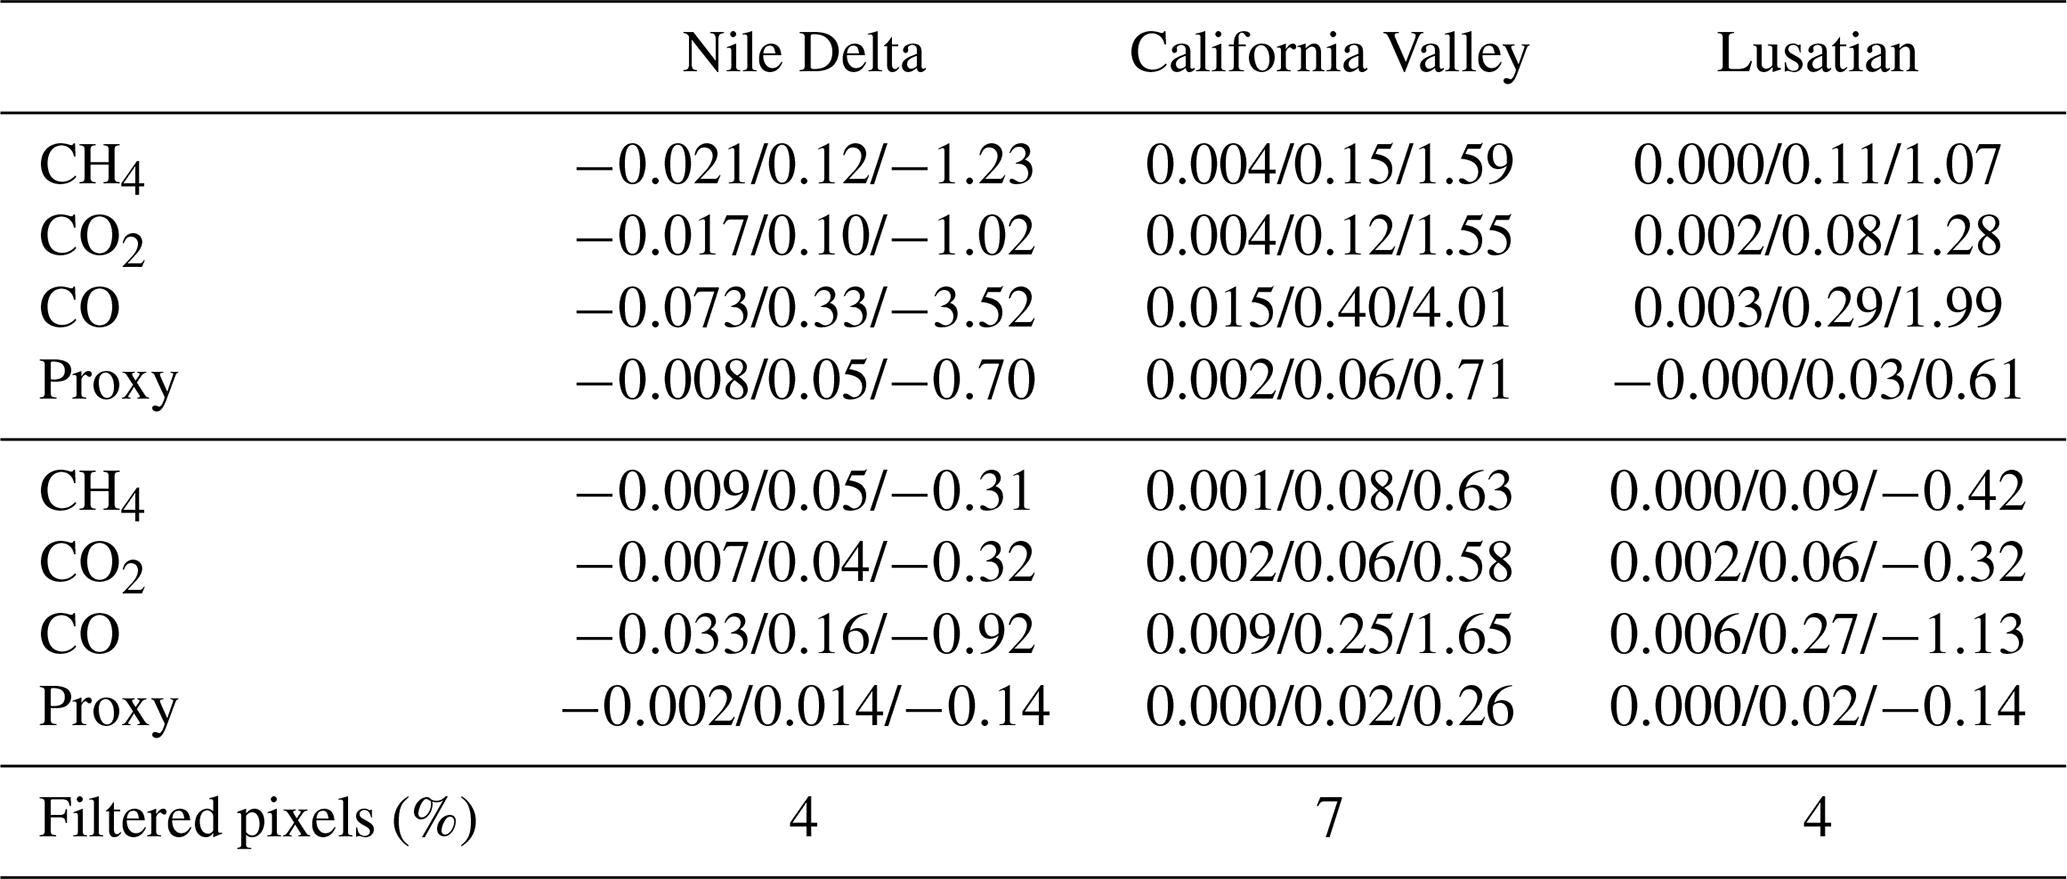
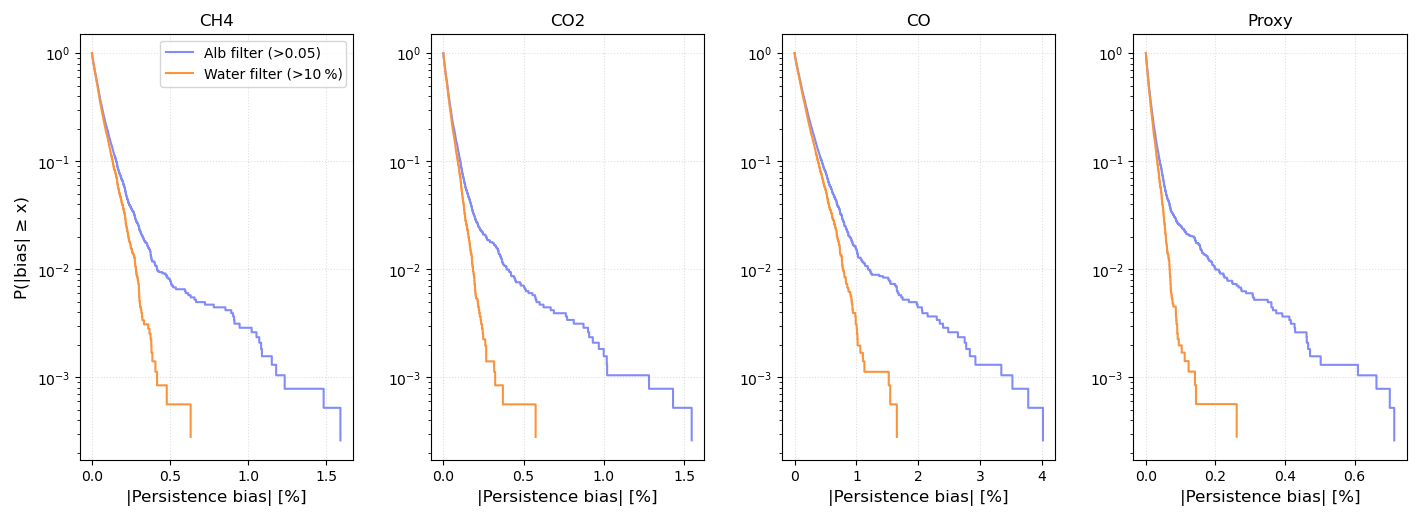
Figure 7Each panel shows the complementary cumulative distribution function (CCDF) of the absolute persistence bias for CH4, CO2, CO, and for the proxy ratio, combining data from the three Sentinel-2 scenes (the Nile Delta, California's Central Valley, and the Lusatian lignite district in Germany). Blue lines correspond to retrievals filtered with an albedo threshold of 0.05, consistent with the instrument sensitivity limit, while orange lines additionally include the water-land mask. The CCDFs represent the fraction of retrievals with an absolute bias exceeding a given threshold, allowing a direct comparison of the error-distribution tails for the two filter configurations.
To mitigate this issue, we applied an a posteriori land-fraction filter to remove pixels partially or fully over water. The land–water mask was derived from the MODIS Water Mask product (MOD44W, version 5; Carroll et al., 2009), accessed via Google Earth Engine. The dataset was exported at a spatial resolution of 500 m and subsequently regridded onto the S5 detector footprint to maintain spatial consistency with the simulated observations. Pixels containing at least 10 % water coverage were excluded from the analysis. The impact of this filtering is illustrated in Fig. 5b and Table 1; the corresponding maps for CO2, CO, and the proxy ratio are shown in Appendix B2 (Fig. B3). The filtered maps show that most large outliers are effectively removed, while both mean and standard deviation of the persistence bias decrease across all regions. The complementary cumulative distributions in Fig. 7 further highlight this improvement: the maximum absolute persistence bias is reduced from 1.59 % to 0.63 % for CH4, 1.55 % to 0.58 % for CO2, 4.01 % to 1.65 % for CO, and 0.71 % to 0.26 % for the proxy ratio. These results demonstrate that a simple a posteriori filtering approach, based on land–water fraction, can effectively mitigate the impact of the persistence effect by removing pixels most susceptible to large biases near sharp albedo contrasts. After applying this filter, the remaining biases fall below mission performance requirements for the operational S5 products CH4 and CO, as well as for the proxy ratio, confirming the robustness of the mitigation strategy. For CO2, a few isolated pixels still exhibit residual biases slightly above the performance target, suggesting that a refined or gas-specific filtering criterion could further improve its performance. At the same time, observations over water (e.g. sunglint) remain important and may also be affected by persistence, requiring optimized filtering strategies to retain such data while removing the most problematic pixels.
This study quantified the impact of detector persistence on Sentinel-5 CH4, CO2, and CO full-physics retrievals, as well as on CH4 proxy retrievals based on the ratio, under realistic surface conditions. The persistence effect – caused by charge trapping and de-trapping in the SWIR detector – was simulated to assess its propagation into Level-2 trace-gas products. Persistence-induced biases are most pronounced in high-contrast scenes, such as lakes, coastal zones, and mixed land–water pixels. Overall, the biases remain small at scene level, with typical amplitudes below 0.12 % for CH4, 0.10 % for CO2, 0.34 % for CO, and 0.06 % for the proxy ratio. Larger deviations occur in spatially structured regions, where localized errors can reach up to 1.59 % for CH4, 1.55 % for CO2, 4 % for CO, and 0.71 % for the proxy ratio. While these effects represent a noticeable contribution to the error budget in such conditions – particularly for CO and, to a lesser extent, for the proxy – they do not dominate the overall error budget under typical observing conditions. Nevertheless, their spatial correlation with surface contrast may introduce patterns that could be misinterpreted as localized enhancements, highlighting the importance of targeted mitigation strategies such as filtering of affected high-contrast pixels in operational processing. The presence of residual biases in the proxy product also indicates that persistence effects do not fully cancel between the CH4 and CO2 retrievals.
The identified persistence-induced biases have important implications for greenhouse-gas retrievals and their downstream use. Uncorrected artifacts may propagate into concentration estimates and flux inversions, affect atmospheric models and data assimilation systems, and reduce consistency between satellite records. They could also bias inter-mission comparisons and long-term trend analyses if persistent scene-dependent effects remain unaccounted for. It is therefore crucial to develop effective mitigation strategies to ensure the reliability of future Sentinel-5 greenhouse-gas products.
To explore practical mitigation options, we tested a simple a posteriori approach based on a land–water mask to evaluate the potential of scene-dependent filtering in reducing persistence-induced artifacts. This approach removed the largest outliers near strong albedo transitions, reducing maximum absolute persistence biases to below the mission performance thresholds for CH4 and CO, and the proxy ratio, and to near target levels for CO2. While such masking is effective in limiting the largest persistence-induced artifacts, it may also reduce data coverage in regions of interest such as coastal areas. In practice, this trade-off can be managed through quality indicators, allowing users to balance data coverage and accuracy depending on their application.
Several limitations apply to the present modeling framework. It represents only the trapping/de-trapping processes in the photodiode and omits ROIC-related persistence, which may also contribute to the memory effect, potentially leading to an overall underestimation. The temporal evolution of trapped charge was tuned to laboratory measurements from a MCT detector representative of the S5 SWIR arrays, but trap properties can vary between detectors and evolve over the mission lifetime due to cumulative radiation damage. Despite these uncertainties, the model provides a useful first-order estimate of the Level-2 impact of the memory effect and its dependence on surface albedo.
Future work should validate these findings with in-orbit Sentinel-5 observations and independent reference datasets such as airborne and ground-based campaigns over high-contrast surfaces. Comparisons with other satellite missions (e.g. Sentinel-5P/TROPOMI) will help assess inter-mission consistency and constrain residual biases. Further refinement of the physical modeling of charge trapping and release could improve the representation of photodiode-related persistence, while the ROIC-level effects should be characterized separately and, where possible, corrected through dedicated Level-1 processing strategies such as those explored for CO2M (Gaucel et al., 2023, 2025). For the trapping/de-trapping component, operational or hardware measures – such as trap flooding sequences implemented in the MicroCarb mission – could be evaluated to mitigate persistence at the detector level. Incorporating persistence diagnostics or quality flags into Level-1 processing would further enhance product reliability. These findings provide essential input for assessing the radiometric performance of Sentinel-5 and ensure the traceability and consistency of greenhouse-gas records across current and future missions.
The persistence model was originally developed by detector experts at CNES for preliminary MicroCarb studies (Jouglet et al., personal communication, 2025). For completeness, we provide here a conceptual overview of the model formulation.
We start with the radiance field convolved with the spectral and ACT instrument response and sampled on ACT detector grid, . The position xACT indicates the ground position as sampled by the detector, whereas yALT is the spatial coordinate in-flight direction. For the Sentinel-2 albedo map, the data is sampled each 20 m in both directions. Taking the ground speed of the satellite into account, this spatial sampling can be translated into a temporal sampling of the incoming signal.
The unperturbed signal, i.e. the signal not affected by persistence, is converted to a current as measured by the detector,
with the instrument gain
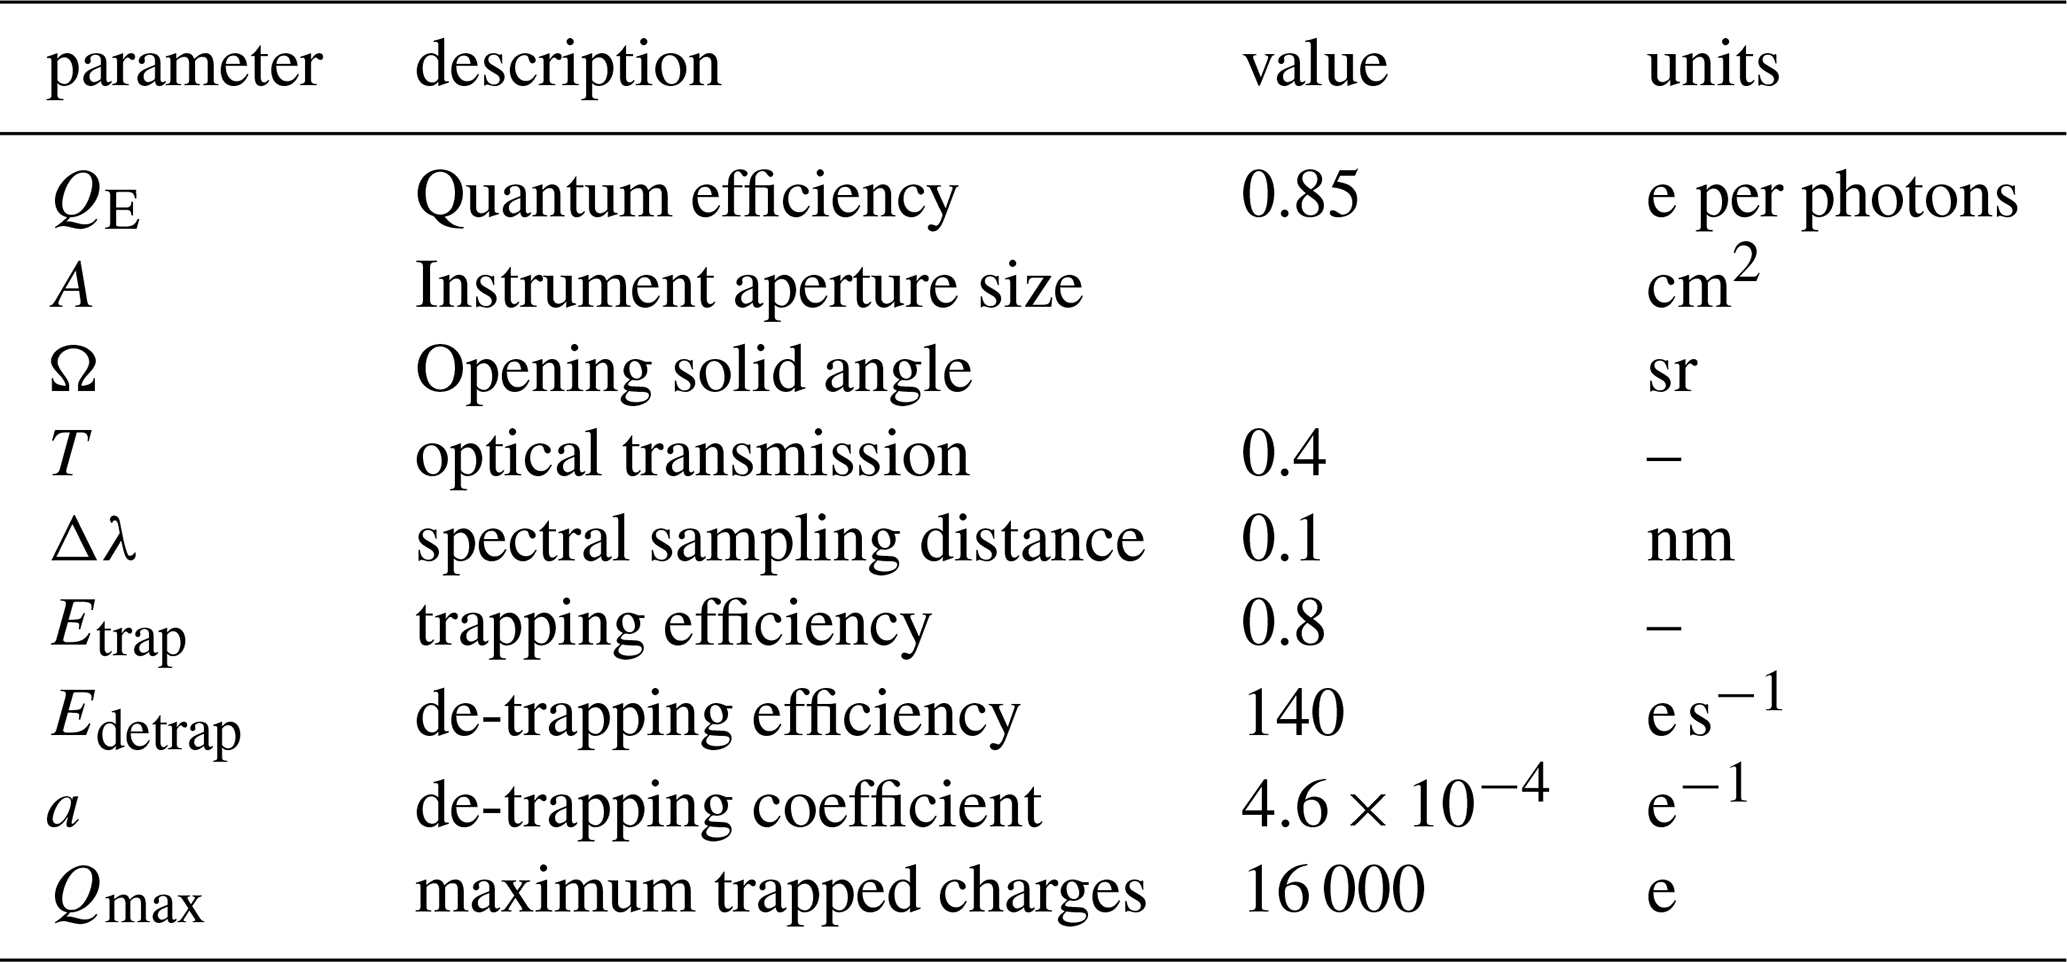
here, QE is the quantum efficiency describing the efficiency of the photon-to-electron conversion, A is the aperture size, Ω is the solid angle subtended the system's entrance pupil, T the optical transmission of the instrument and Δλ the spectral sampling of the spectrum.The Sentinel 5 specific numbers are summarized in Table A1.
The trapping-detrapping effect is characterized by corresponding currents in the detector. Assuming that at a time t Q(t) charges are trapped by the detector material, the trapping current is proportional to the current Idet and the relative difference of Q(t) with respect to a maximum Qmax, i.e.
with an efficiency factor Etrap. The detrapping current follows an exponential dependence on the number of trapped photons,
with empirical constants Edetrap and a. Finally, the incremental change in the trapped charges is given by
This equation system is integrated over time using Idet(t) and .
Having derived trapping and detrapping current, the persistence perturbed current is
and the measured signal is proportional to the integral
where tdwell is the dwell time of the observation. The proportionality is given by the gain Ginst times the dwell time tdwell.
Table A1Parameters of the persistence model as derived by CNES for the S5 and MicroCarb detector (Jouglet et al., personal communication) and specifying the S5 SWIR spectrometer.
B1 Synthetic Albedo Cases
Figure B1 shows how the magnitude of the persistence bias varies with the position of the albedo transition within the S5 detector footprint. These results complement the discussion in Sect. 3.1, which highlights the sensitivity of the effect to sub-pixel scene geometry.
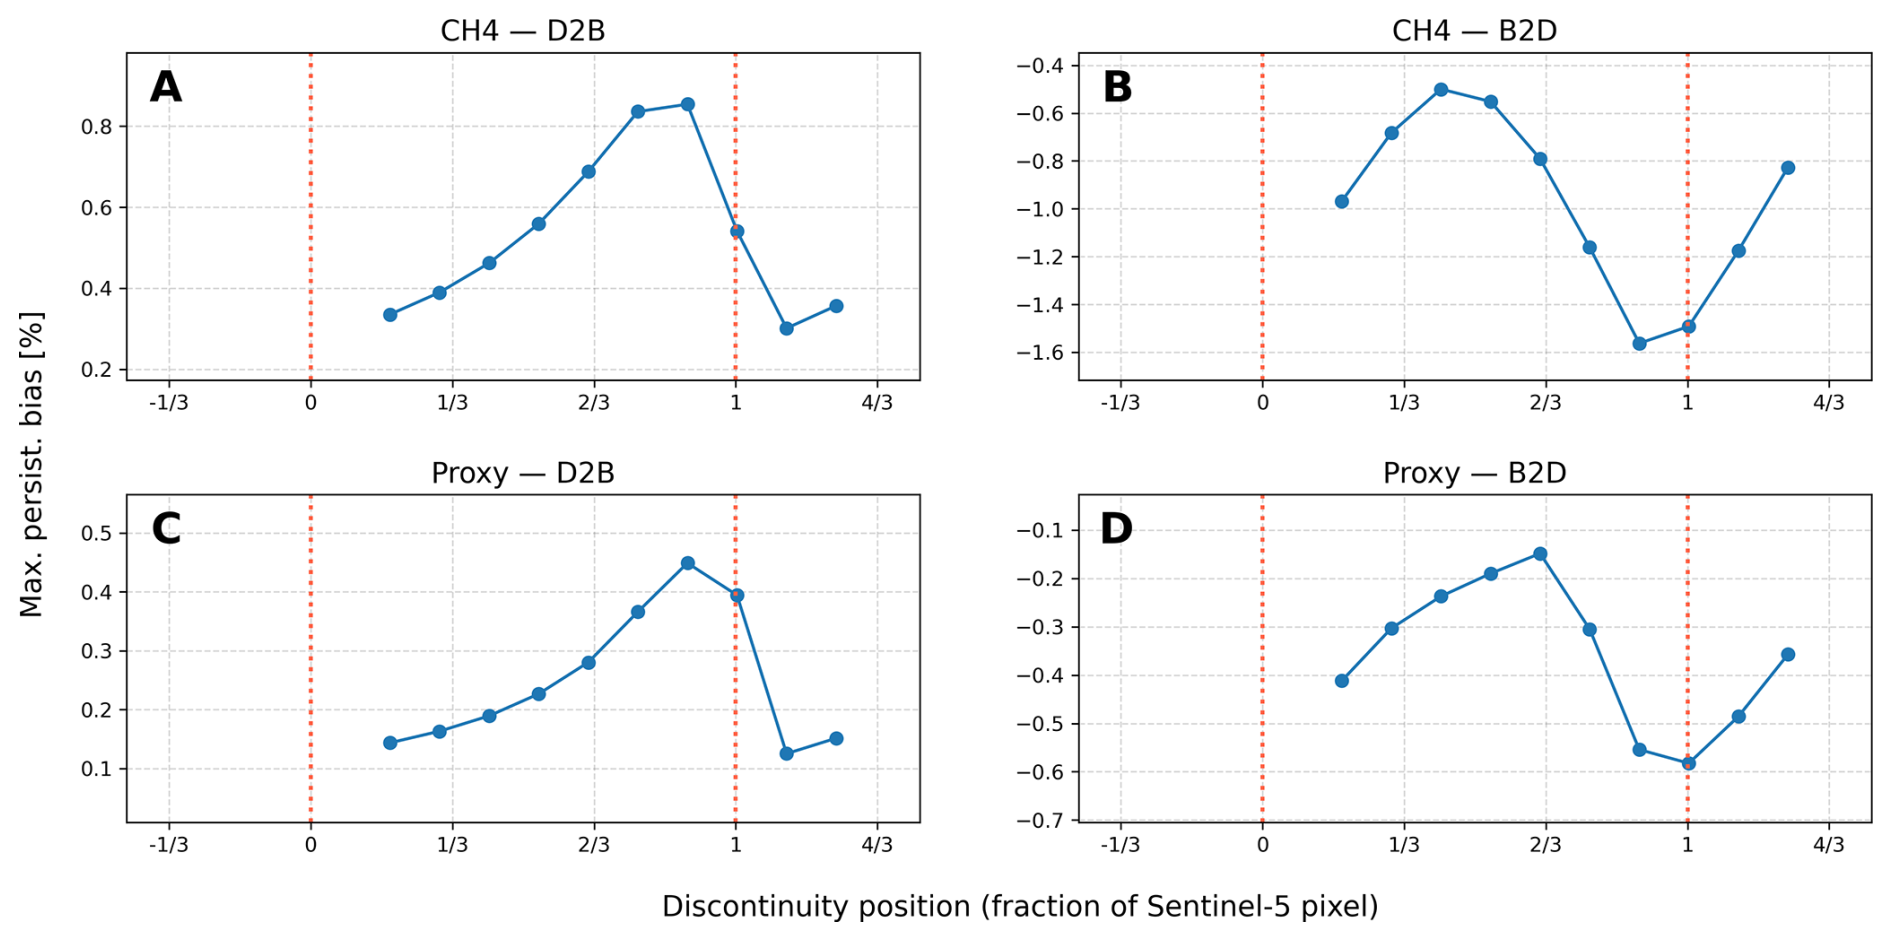
Figure B1Panels (A) and (B) show the maximum persistence-induced CH4 bias for the full-physics (scattering) retrieval as a function of the normalized position of the albedo discontinuity within the Sentinel-5 pixel, (0 = pixel start, 1 = pixel end). Panels (C) and (D) show the corresponding bias for the proxy (non-scattering) retrieval. Panels (A) and (C) refer to the dark-to-bright (D2B) albedo scenes; and panels (B) and (D), to the bright-to-dark (B2D) albedo scenes. Two dotted red lines mark the Sentinel-5 pixel boundaries.
B2 Sentinel-2 Albedo Scenes
Figures B2 and B3 show the persistence-induced bias maps for CO2, CO, and the proxy ratio over the three study regions, before and after applying the land–water mask, respectively. Figure B4 presents the corresponding albedo-based heatmaps combining data from all regions. These figures complement Figs. 5 and 6 in Sect. 3.2, which focus on CH4 data, and extend the analysis to the other retrieved gases.
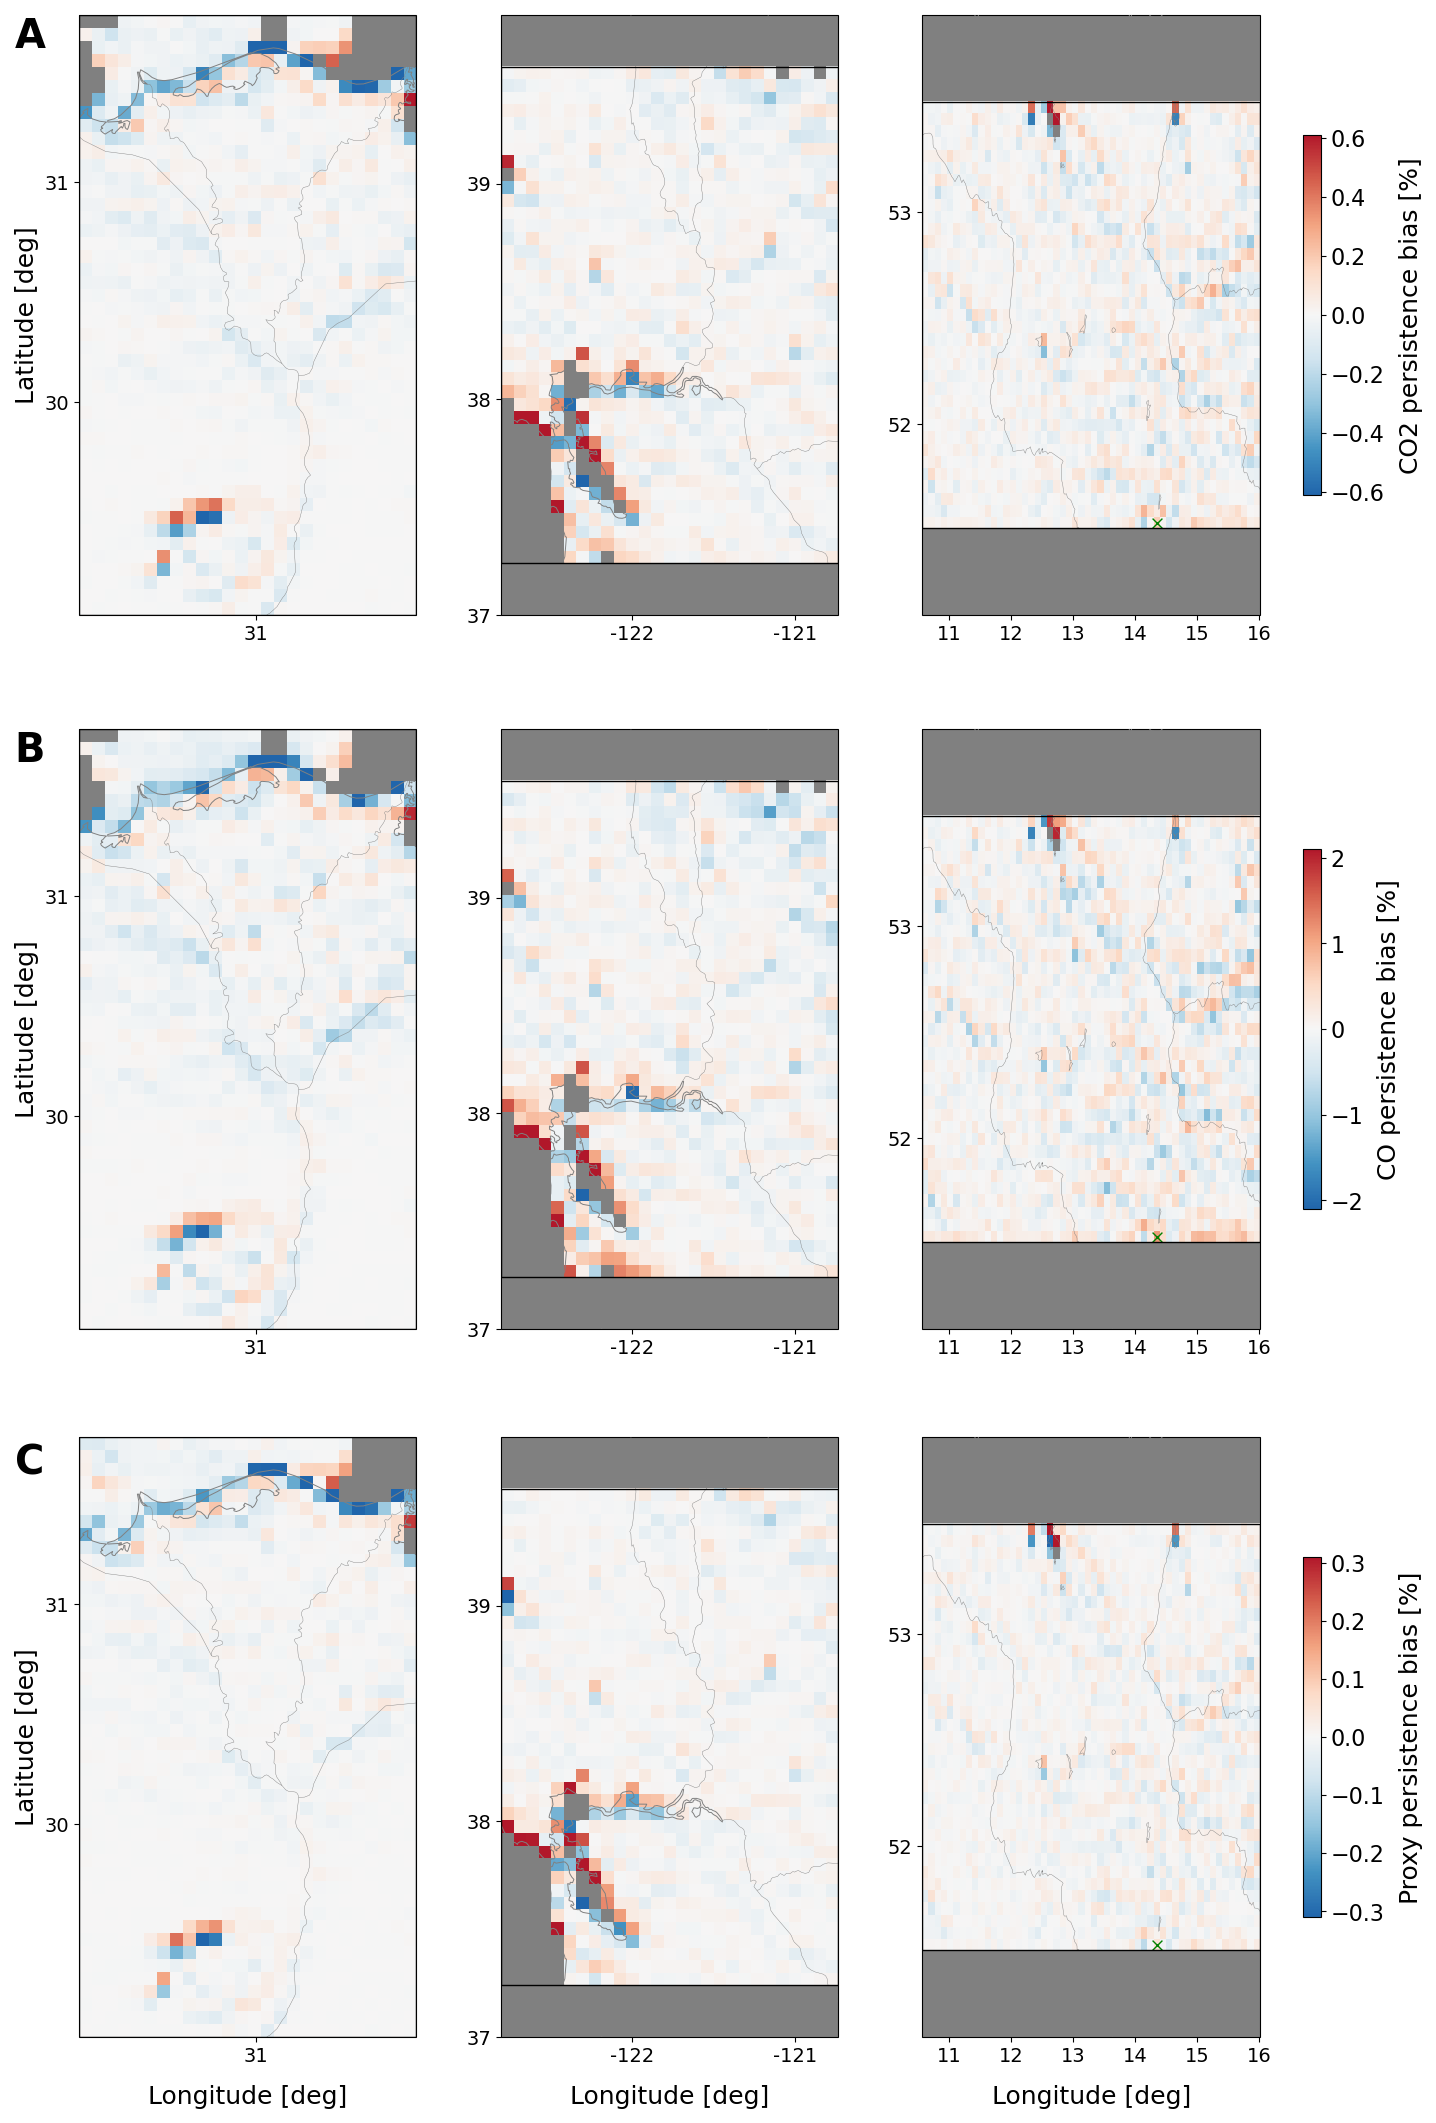
Figure B2Spatial patterns of relative persistence bias for albedo threshold filtering equal to 0.05. Panels (A) and (B) show persistence bias maps for CO2 and CO from the full-physics (scattering) retrievals, while plots in panel (C) presents the ratio from the proxy (non-scattering) retrieval. The maps correspond, from left to right, to scenes over the Nile Delta, California's Central Valley, and the Lusatian lignite district in Germany. Coastlines, rivers, and lakes are overlaid using Cartopy’s built-in Natural Earth features for contextual reference.
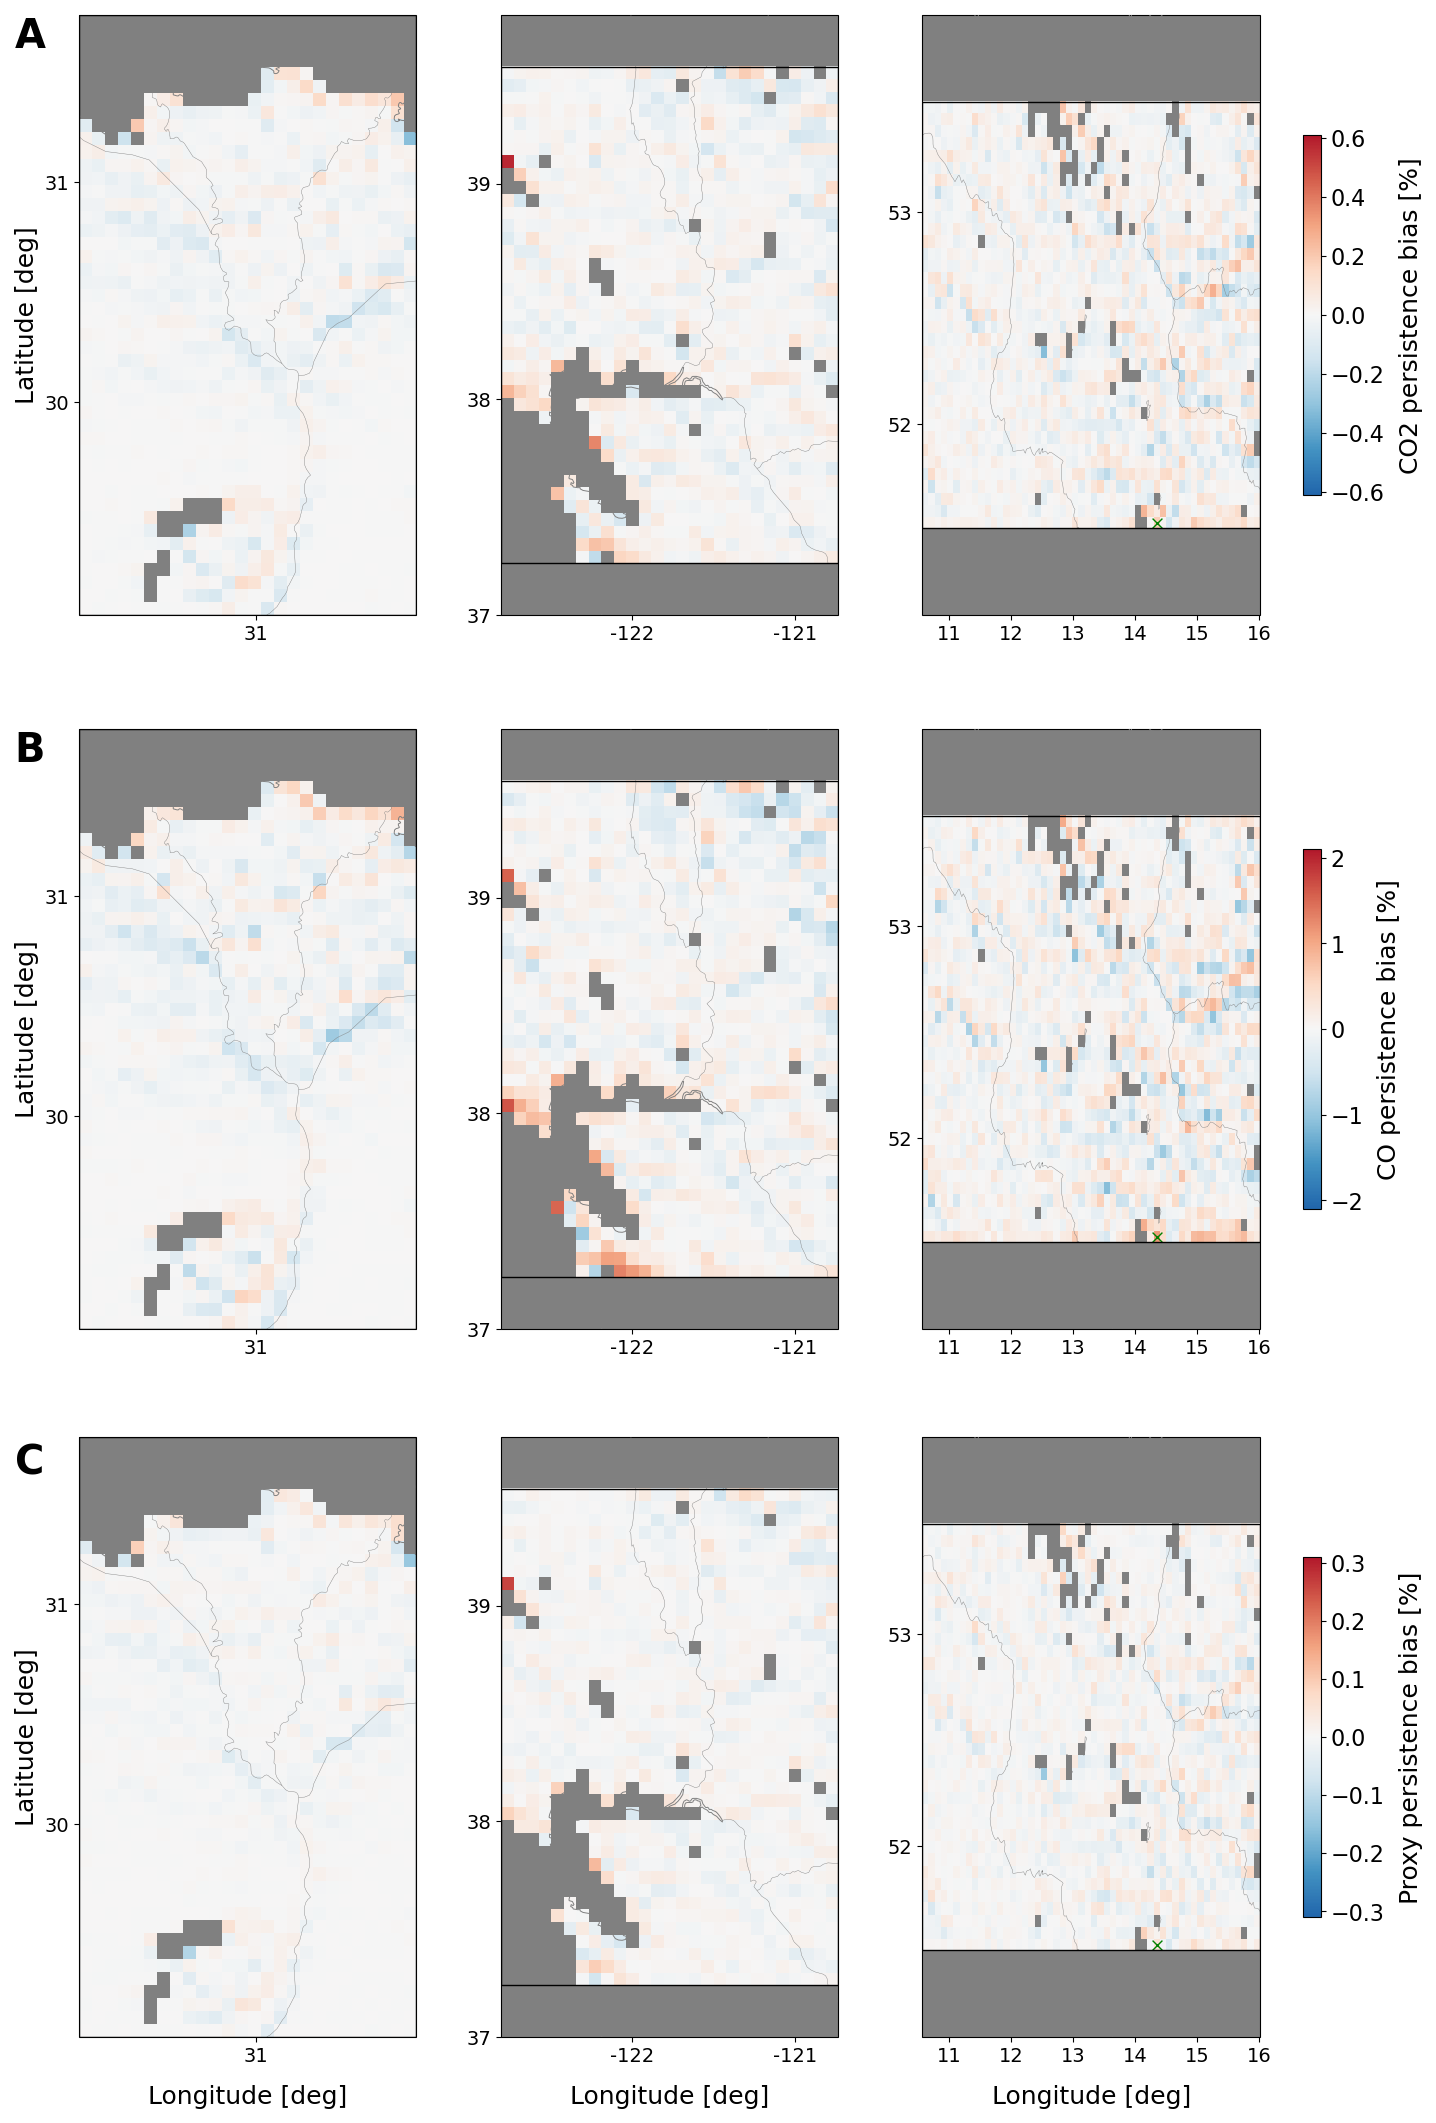
Figure B3Spatial patterns of relative persistence bias for albedo threshold filtering equal to 0.05 and the water-land mask. Panels (A) and (B) show persistence bias maps for CO2 and CO from the full-physics (scattering) retrievals, while plots in panel (C) presents the ratio from the proxy (non-scattering) retrieval. The maps correspond, from left to right, to scenes over the Nile Delta, California's Central Valley, and the Lusatian lignite district in Germany. Coastlines, rivers, and lakes are overlaid using Cartopy's built-in Natural Earth features for contextual reference.
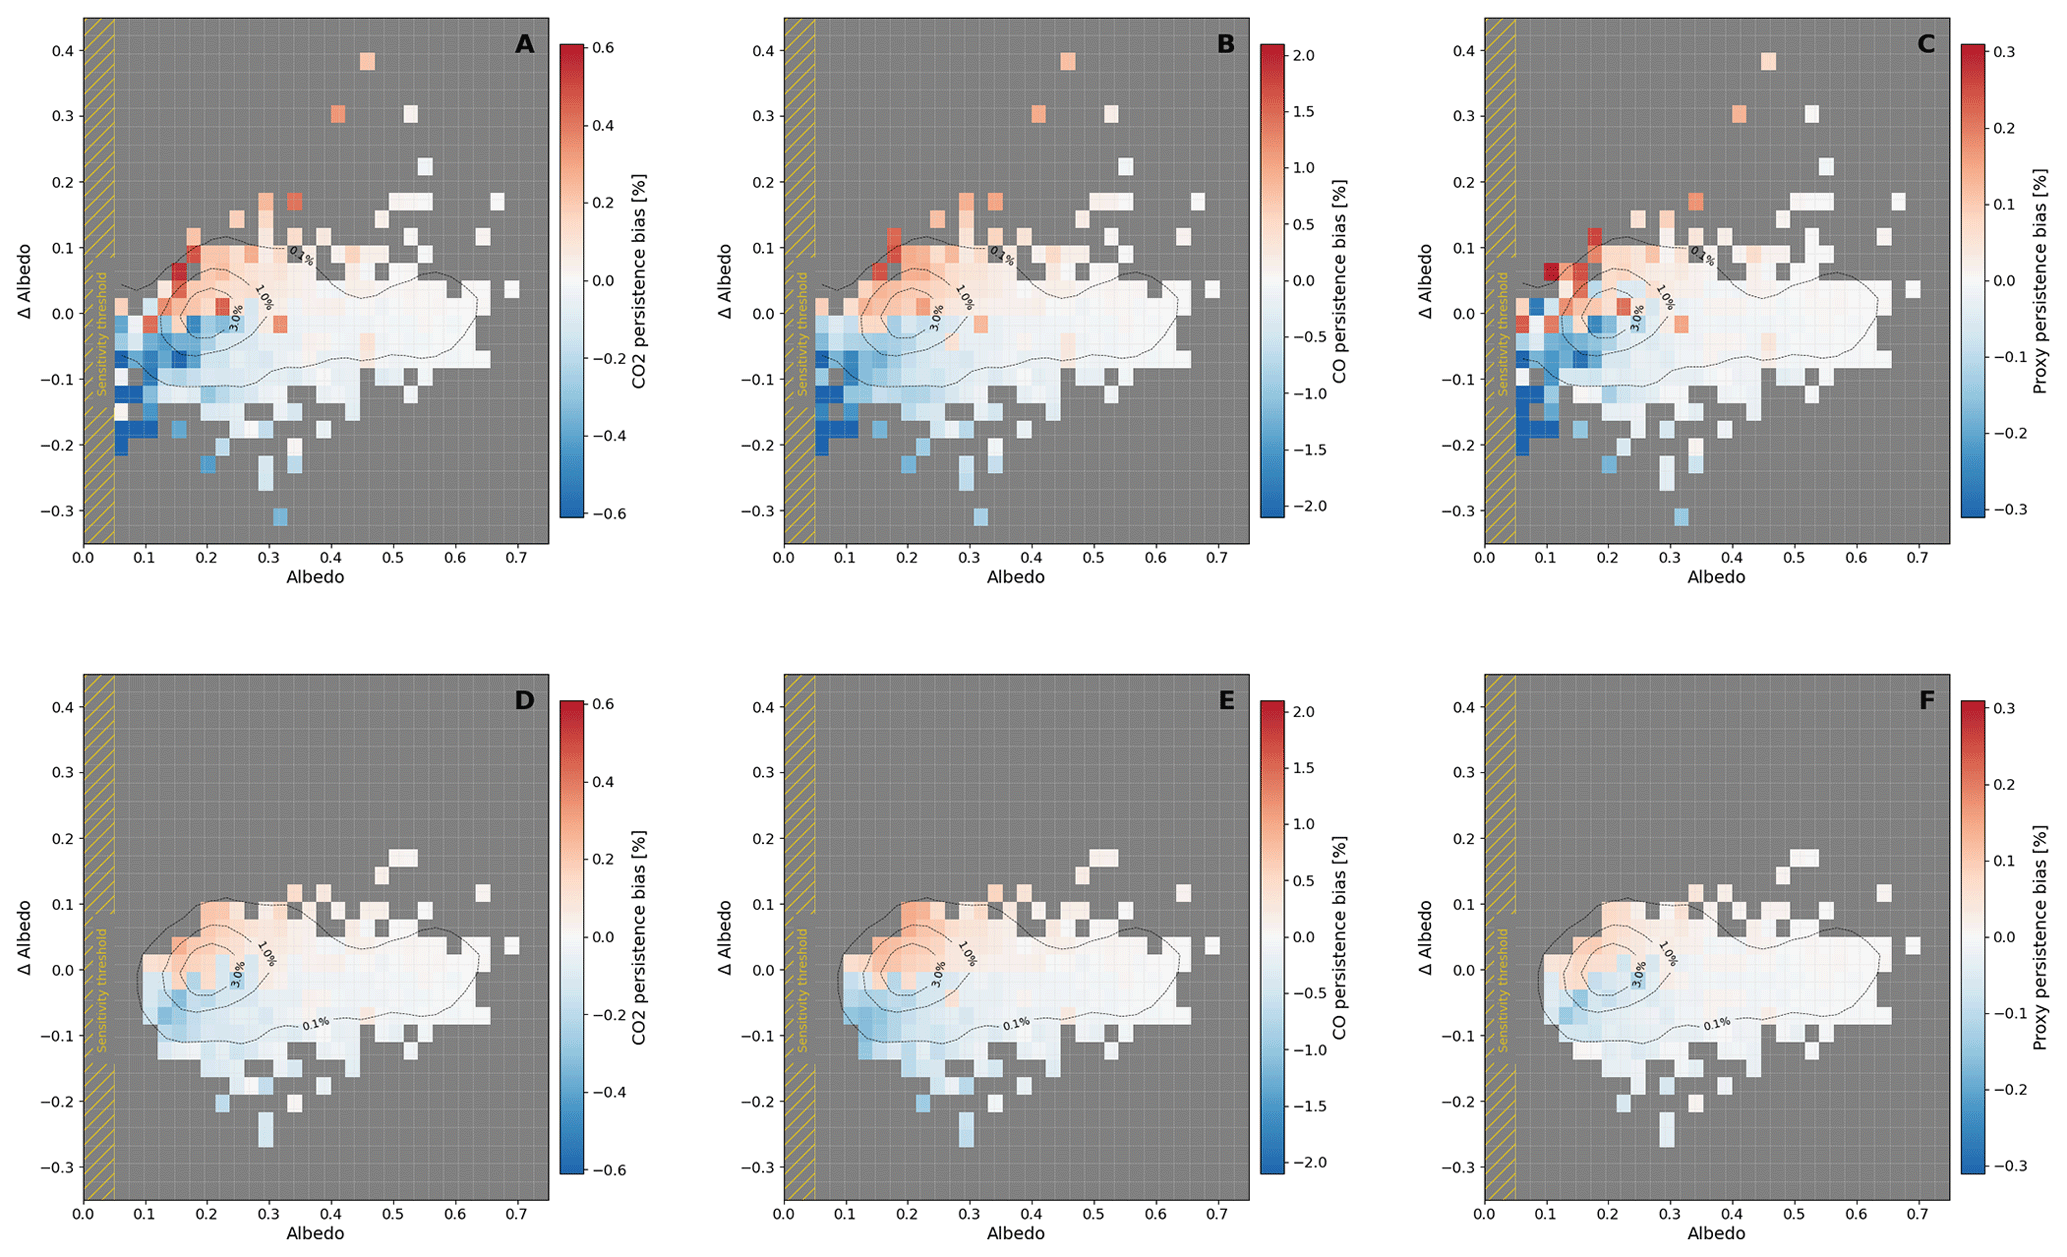
Figure B4Panels (A)–(C) show heatmaps of the relative persistence bias with respect to SWIR-1 albedo and the corresponding ΔSWIR-1 albedo, after applying an albedo threshold filter of 0.05 consistent with the instrument sensitivity threshold; panels (C)–(E) additionally applies a water-land mask. Panels (A)–(D) and (B)–(E) corresponds to CO2 and CO from the full-physics retrievals respectively, while panels (C)–(F) presents the ratio from the proxy retrieval. ΔSWIR-1 albedo denotes the difference between the SWIR-1 albedo of a given pixel and that of the preceding pixel along the flight direction. Color indicates the corresponding maximum persistence bias across the three combined Sentinel-2 scenes. The gold-shaded region (albedo < 0.05) marks the sensitivity threshold of the UVNS spectrometer, where retrieval reliability is reduced. The dotted lines denote the contour plots showing the distribution density of data points within the same (Albedo, ΔAlbedo) parameter space.
The persistence-model formulation used in this study is described in Appendix A. The parameter values used for the persistence model can be provided upon request.
The processed data underlying the figures and tables are available from Zenodo at https://doi.org/10.5281/zenodo.21236361 (Martinez Velarte et al., 2026). The Sentinel-2 L2A data used to generate the albedo fields for the scene simulations are publicly available from the Copernicus/ESA data archive and are not redistributed here; the product IDs, acquisition dates, and scene bounding boxes are listed in the README file of the Zenodo record. The land–water mask was derived from the MODIS Water Mask product (MOD44W, version 5; Carroll et al., 2009), accessed via Google Earth Engine, and is included in the processed available datasets where relevant.
MCMV, TB and JL provided the RemoTeC algorithm and performed the data analysis. BV developed and provided the persistence simulation tool. MCMV wrote the original draft. All authors contributed to the discussion of the results and to the review and editing of the manuscript.
The contact author has declared that none of the authors has any competing interests.
Publisher's note: Copernicus Publications remains neutral with regard to jurisdictional claims made in the text, published maps, institutional affiliations, or any other geographical representation in this paper. The authors bear the ultimate responsibility for providing appropriate place names. Views expressed in the text are those of the authors and do not necessarily reflect the views of the publisher.
CNES model derived for preliminary MicroCarb studies (Jouglet et al., personal communication, 2025).
This paper was edited by Andrew Sayer and reviewed by three anonymous referees.
Butz, A., Hasekamp, O. P., Frankenberg, C., Vidot, J., and Aben, I.: CH4 retrievals from space-based solar backscatter measurements: Performance evaluation against simulated aerosol and cirrus loaded scenes, J. Geophys. Res.-Atmos., 115, https://doi.org/10.1029/2010JD014514, 2010. a, b, c
Butz, A., Guerlet, S., Hasekamp, O., Schepers, D., Galli, A., Aben, I., Frankenberg, C., Hartmann, J.-M., Tran, H., Kuze, A., Keppel-Aleks, G., Toon, G., Wunch, D., Wennberg, P., Deutscher, N., Griffith, D., Macatangay, R., Messerschmidt, J., Notholt, J., and Warneke, T.: Toward accurate CO2 and CH4 observations from GOSAT, Geophys. Res. Lett., 38, https://doi.org/10.1029/2011GL047888, 2011. a, b
Butz, A., Galli, A., Hasekamp, O., Landgraf, J., Tol, P., and Aben, E.: TROPOMI aboard Sentinel-5 Precursor: Prospective performance of CH4 retrievals for aerosol and cirrus loaded atmospheres, Remote Sens. Environ., 120, 267–276, https://doi.org/10.1016/j.rse.2011.05.030, 2012. a
Carroll, M., Townshend, J., DiMiceli, C., Noojipady, P., and Sohlberg, R.: A new global raster water mask at 250 m resolution, Int. J. Digital Earth, 2, 291–308, https://doi.org/10.1080/17538940902951401, 2009. a, b
Delannoy, A., Fièque, B., Chorier, P., and Riuné, C.: NGP: a new large format infrared detector for observation, hyperspectral and spectroscopic space missions in VISIR, SWIR and MWIR wavebands, in: Sensors, Systems, and Next-Generation Satellites XIX, edited by: Meynart, R., Neeck, S. P., and Shimoda, H., vol. 9639, p. 96390R, International Society for Optics and Photonics, SPIE, https://doi.org/10.1117/12.2197239, 2015. a
Dubovik, O., Sinyuk, A., Lapyonok, T., Holben, B. N., Mishchenko, M., Yang, P., Eck, T. F., Volten, H., Muñoz, O., Veihelmann, B., van der Zande, W. J., Leon, J.-F., Sorokin, M., and Slutsker, I.: Application of spheroid models to account for aerosol particle nonsphericity in remote sensing of desert dust, J. Geophys. Res.-Atmos., 111, https://doi.org/10.1029/2005JD006619, 2006. a
European Space Agency: Sentinel-2 Level 1 Algorithm Theoretical Baseline Document (ATBD), Tech. Rep. S2-PDGS-MPC-ATBD-L1, European Space Agency (ESA), https://sentiwiki.copernicus.eu/web/s2-documents, last access: 22 May 2025, 2023. a
European Space Agency (ESA): Copernicus CO2 Monitoring Mission Requirements Document (CO2M MRD), Tech. Rep. Issue 3.0, European Space Agency, https://esamultimedia.esa.int/docs/EarthObservation/CO2M_MRD_v3.0_20201001_Issued.pdf (last access: 15 June 2026), 2020a. a
European Space Agency (ESA): Sentinel-5: ESA's Polar-orbiting Atmospheric Composition Mission in Support of Copernicus Services, Esa sp-1336, ESA Communications, Noordwijk, The Netherlands, https://www.esa.int/About_Us/ESA_Publications/SP-1336_Sentinel-5_ESA_s_Polar-orbiting_Atmospheric_Composition_Mission_in_Support_of_Copernicus_Services (last access: 15 June 2026), 2020b. a, b
European Space Agency (ESA): MicroCarb Mission Summary, Tech. rep., European Space Agency, https://database.eohandbook.com/database/missionsummary.aspx?missionID=858 (last access: 15 June 2026), 2024. a
Frankenberg, C., Meirink, J. F., Bergamaschi, P., Goede, A. P. H., Heimann, M., Körner, S., Platt, U., van Weele, M., and Wagner, T.: Satellite chartography of atmospheric methane from SCIAMACHY on board ENVISAT: Analysis of the years 2003 and 2004, J. Geophys. Res.-Atmos., 111, https://doi.org/10.1029/2005JD006235, 2006. a
Gaucel, J.-M., Lefebure, A., Gaucher, A., Bouchage, G., and Sanson, E.: Remanence characterization of NGP detector in SWIR bands, in: International Conference on Space Optics – ICSO 2022, edited by: Minoglou, K., Karafolas, N., and Cugny, B., vol. 12777, p. 127772E, International Society for Optics and Photonics, SPIE, https://doi.org/10.1117/12.2689982, 2023. a
Gaucel, J.-M., Sierk, B., Glandus, L., Foulon, H., and Soman, M.: Persistance characterization and modeling for CO2M mission, in: International Conference on Space Optics – ICSO 2024, edited by: Bernard, F., Karafolas, N., Kubik, P., and Minoglou, K., vol. 13699, p. 136993W, International Society for Optics and Photonics, SPIE, https://doi.org/10.1117/12.3075197, 2025. a
Ingmann, P., Veihelmann, B., Langen, J., Lamarre, D., Stark, H., and Courrèges-Lacoste, G. B.: Requirements for the GMES Atmosphere Service and ESA's implementation concept: Sentinels-4/-5 and -5p, Remote Sens. Environ., 120, 58–69, https://doi.org/10.1016/j.rse.2012.01.023, 2012. a
Irizar, J., Melf, M., Bartsch, P., Koehler, J., Weiss, S., Greinacher, R., Erdmann, M., Kirschner, V., Albinana, A. P., and Martin, D.: Sentinel-5/UVNS, in: International Conference on Space Optics – ICSO 2018, edited by: Sodnik, Z., Karafolas, N., and Cugny, B., vol. 11180, p. 1118004, International Society for Optics and Photonics, SPIE, https://doi.org/10.1117/12.2535923, 2019. a, b
KNMI: TROPOMI Level 1B ATBD: SWIR Detector and Onboard Calibration, Tech. rep., Royal Netherlands Meteorological Institute (KNMI), https://sentinels.copernicus.eu/documents/247904/2476257/Sentinel-5P-TROPOMI-Level-1B-ATBD.pdf/223f9b91-495d-42d0-9136-47488fc430cd (last access: 15 June 2026), 2022. a
Martinez Velarte, M. C., Landgraf, J., Veihelmann, B., Sierk, B., and Borsdorff, T.: Dataset for Martinez-Velarte et al., 2026: Impact of Sentinel-5 SWIR Detector Persistence on Trace Gas Retrievals [Data set]. In Atmospheric Measurement Techniques (AMT) (Version 1.0), Zenodo [data set], https://doi.org/10.5281/zenodo.21236361, 2026. a
McLeod, B. A. and Smith, R.: Mitigation of H2RG persistence with image illumination, in: High Energy, Optical, and Infrared Detectors for Astronomy VII, edited by: Holland, A. D. and Beletic, J., vol. 9915, p. 99150G, International Society for Optics and Photonics, SPIE, https://doi.org/10.1117/12.2233083, 2016. a
Pasternak, F., Bernard, P., Georges, L., and Pascal, V.: The microcarb instrument, in: International Conference on Space Optics – ICSO 2016, edited by: Cugny, B., Karafolas, N., and Sodnik, Z., vol. 10562, p. 105621P, International Society for Optics and Photonics, SPIE, https://doi.org/10.1117/12.2296225, 2017. a
Rothman, L., Gordon, I., Barbe, A., Benner, D., Bernath, P., Birk, M., Boudon, V., Brown, L., Campargue, A., Champion, J.-P., Chance, K., Coudert, L., Dana, V., Devi, V., Fally, S., Flaud, J.-M., Gamache, R., Goldman, A., Jacquemart, D., Kleiner, I., Lacome, N., Lafferty, W., Mandin, J.-Y., Massie, S., Mikhailenko, S., Miller, C., Moazzen-Ahmadi, N., Naumenko, O., Nikitin, A., Orphal, J., Perevalov, V., Perrin, A., Predoi-Cross, A., Rinsland, C., Rotger, M., Šimečková, M., Smith, M., Sung, K., Tashkun, S., Tennyson, J., Toth, R., Vandaele, A., and Vander Auwera, J.: The HITRAN 2008 molecular spectroscopic database, J. Quant. Spectrosc. Ra., 110, 533–572, https://doi.org/10.1016/j.jqsrt.2009.02.013, 2009. a
Scheepmaker, R. A., Frankenberg, C., Galli, A., Butz, A., Schrijver, H., Deutscher, N. M., Wunch, D., Warneke, T., Fally, S., and Aben, I.: Improved water vapour spectroscopy in the 4174–4300 cm−1 region and its impact on SCIAMACHY HDO/H2O measurements, Atmos. Meas. Tech., 6, 879–894, https://doi.org/10.5194/amt-6-879-2013, 2013. a
Schepers, D., Guerlet, S., Butz, A., Landgraf, J., Frankenberg, C., Hasekamp, O., Blavier, J.-F., Deutscher, N., Griffith, D., Hase, F., Kyro, E., Morino, I., Scherlock, V., Sussmann, R., and Aben, E.: Methane retrievals from Greenhouse Gases Observing Satellite (GOSAT) shortwave infrared measurements: Performance comparison of proxy and physics retrieval algorithms, J. Geophys. Res.-Atmos., 117, https://doi.org/10.1029/2012JD017549, 2012. a
Schepers, D., aan de Brugh, J., Hahne, P., Butz, A., Hasekamp, O., and Landgraf, J.: LINTRAN v2.0: A linearised vector radiative transfer model for efficient simulation of satellite-born nadir-viewing reflection measurements of cloudy atmospheres, J. Quant. Spectrosc. Ra., 149, 347–359, https://doi.org/10.1016/j.jqsrt.2014.08.019, 2014. a, b
Sierk, B., Bezy, J.-L., Caron, J., Meynard, R., Veihelmann, B., and Ingmann, P.: The GMES Sentinel-5 mission for operational atmospheric monitoring: status and developments, in: International Conference on Space Optics – ICSO 2012, edited by: Cugny, B., Armandillo, E., and Karafolas, N., vol. 10564, p. 1056434, International Society for Optics and Photonics, SPIE, https://doi.org/10.1117/12.2309276, 2018. a
Sierk, B., Fernandez, V., Bézy, J.-L., Meijer, Y., Durand, Y., Courrèges-Lacoste, G. B., Pachot, C., Löscher, A., Nett, H., Minoglou, K., Boucher, L., Windpassinger, R., Pasquet, A., Serre, D., and te Hennepe, F.: The Copernicus CO2M mission for monitoring anthropogenic carbon dioxide emissions from space, in: International Conference on Space Optics – ICSO 2020, edited by: Cugny, B., Sodnik, Z., and Karafolas, N., vol. 11852, p. 118523M, International Society for Optics and Photonics, SPIE, https://doi.org/10.1117/12.2599613, 2021. a
Tran, H., Flaud, P.-M., Gabard, T., Hase, F., von Clarmann, T., Camy-Peyret, C., Payan, S., and Hartmann, J.-M.: Model, software and database for line-mixing effects in the ν3 and ν4 bands of CH4 and tests using laboratory and planetary measurements – I: N2 (and air) broadenings and the earth atmosphere, J. Quant. Spectrosc. Ra., 101, 284–305, https://doi.org/10.1016/j.jqsrt.2005.11.020, 2006. a