
the Creative Commons Attribution 4.0 License.
the Creative Commons Attribution 4.0 License.
 | 23 Jul 2026
An integrated synchronous online analyzer for gaseous and particulate reactive oxygen species (ROS): development, characterization and field observations
Yihui Wang
Huan Song
Huabin Dong
Shiyi Chen
An integrated online analyzer was developed for in situ, synchronous quantification of gaseous and particulate reactive oxygen species (ROS), with concentrations reported as H2O2 equivalents. Gaseous ROS (ROSg) are absorbed by a glass spiral absorption tube, whereas particulate ROS (ROSp) are collected at ambient temperature using a rotating wet annular denuder (WAD) for gas removal followed by a spray growth collection chamber. The collected solutions are analyzed using a fluorescence probe method, and the resulting fluorescent signal is recorded using a compact LED-PMT module (470/520 nm) and LabVIEW-based acquisition. The system achieved high stability (RSD 0.37 % over 10 h), fast tracking (7 min response), good reproducibility (RSD 0.57 %, n = 10), and robust linearity (y≈0.1x, R2 = 0.99) with detection limits of 0.07 ppbv (ROSg) and 0.007 µg m−3 (ROSp) expressed as H2O2 equivalents. Field deployment in Beijing across four seasons revealed pronounced seasonal, diurnal, and pollution-regime dependence. ROSg and ROSp were highest in spring, while autumn exhibited the lowest levels despite severe PM2.5 pollution. During humid autumn haze, enhanced aerosol water and secondary inorganic accumulation coincided with only modest ROSg growth and constrained ROSp, indicating rapid multiphase turnover and efficient condensed-phase loss. In contrast, ozone-driven pollution in spring and summer strengthened photochemical production and gas-particle coupling, increasing ROS in both phases. Both ROSg and ROSp declined coherently during pollution clean-up, linking ROS variability to coupled changes in oxidation, partitioning, and removal.
- Article
(7151 KB) - Full-text XML
-
Supplement
(1114 KB) - BibTeX
- EndNote


With the rapid acceleration of industrialization and urbanization, atmospheric pollution has become more complex and increasingly region-specific. Primary pollutants such as volatile organic compounds (VOCs), nitrogen oxides (NOx), and sulfur dioxide (SO2) are transformed through photochemical reactions and aerosol formation processes, thereby driving severe secondary pollution episodes (Liu et al., 2021). In China, this phenomenon is particularly evident, as secondary inorganic and organic aerosols often dominate fine particulate matter (PM2.5), accounting for 40 %–60 % of its total mass (Ying et al., 2024). Although PM2.5 levels have been substantially reduced in recent years by stringent emission control measures, surface ozone (O3) pollution has increased, emerging as a major challenge for air quality improvement (Guo et al., 2024). This shift reflects fundamental changes in the atmospheric oxidation capacity (AOC), which governs pollutant transformation, lifetime, and fate and thus plays a pivotal role in atmospheric chemistry and climate (Wang et al., 2023c).
Reactive oxygen species (ROS) are key carriers and indicators of AOC. Through complex radical chain reactions, ROS regulate the degradation of primary pollutants and the formation of secondary species, thereby shaping atmospheric self-cleaning capacity (Huang et al., 2016). ROS encompass a wide spectrum of oxidants, including radicals such as hydroxyl (•OH), hydroperoxyl (HO2•), superoxide (), and organic peroxy radicals (RO2•), as well as non-radical oxidants such as hydrogen peroxide (H2O2), organic hydroperoxides (e.g., methyl hydroperoxide, ethyl hydroperoxide, and peracetic acid) and singlet oxygen (1O2) (Lushchak and Lushchak, 2021). Their lifetimes range from microseconds to several days, with redox potentials between 1.3 and 2.8 V, resulting in phase-dependent chemical behaviors (Venkatachari and Hopke, 2008). In the gaseous phase, ROS such as •OH and HO2• are short-lived yet remain central to photochemical oxidation. In the particulate phase, relatively stable peroxides such as H2O2 and organic peroxides can be adsorbed onto or embedded within PM2.5 (Shiraiwa and Pöschl, 2021). These particles can reach the lungs, triggering endogenous ROS generation and oxidative stress, with potential health impacts (Venkatachari et al., 2007). Aqueous-phase ROS in cloud, fog, and rain droplets are produced via dissolution of gaseous species such as H2O2 and in situ photochemical reactions, driving multiphase oxidation and influencing AOC (Simões et al., 2021).
The formation and loss of atmospheric ROS are governed by interconnected processes across gaseous, particulate, and aqueous media. Gaseous ROS are primarily produced via O3 and HONO photolysis, alkene ozonolysis, and radical interconversion reactions (Olaguer et al., 2009). In the particulate phase, transition-metal-catalyzed Fenton and Fenton-like reactions involving and serve as major sources of •OH and (Charrier and Anastasio, 2012). Aqueous ROS are generated largely by self-reaction and ionization of HO2• and its conjugate base in cloud water; the resulting H2O2 is an important oxidant for sulfur oxidation (Ervens et al., 2003). Conversely, ROS are depleted by reactions with NOx and VOCs, photolysis, dry and wet deposition, and heterogeneous uptake on aerosol and surface films (George et al., 2013).
ROS not only initiate and propagate oxidation reactions, accelerating VOCs and NOx degradation and promoting O3 formation (Lelieveld et al., 2008; Stone et al., 2012), but also contribute to sulfate, nitrate, and secondary organic aerosol (SOA) formation through heterogeneous and multiphase reactions (Wang et al., 2014; Li et al., 2018). Moreover, ROS-mediated oxidation can enhance aerosol hygroscopicity and aging, thereby altering cloud condensation nuclei (CCN) activity and radiative properties (Scott et al., 2014). Excessive ROS exposure also induces oxidative stress in biological systems, damaging proteins, lipids, and DNA and increasing risks of respiratory and cardiovascular diseases (Xie et al., 2023; Bates et al., 2015). Therefore, understanding ROS generation, transformation, and impacts is essential for elucidating atmospheric oxidation mechanisms and informing air quality management and climate mitigation strategies.
Accurate measurement of these species is therefore essential, yet remains methodologically challenging. Sampling techniques are phase-dependent: gaseous ROS are commonly sampled using cold trapping (Sakugawa and Kaplan, 1987; Hellpointner and Gäb, 1989; Campos and Kok, 1996), coil scrubbing (Lee et al., 1990; Lazrus et al., 1986), and membrane diffusion denuders (Huang et al., 2016; Allegrini et al., 1987), which enable efficient capture through low-temperature condensation, gas-liquid mass transfer, or selective permeation. In contrast, particulate ROS are typically collected using elution (Hung and Wang, 2001), spray capture (King and Weber, 2013; Zhou et al., 2018; Fuller et al., 2014), and steam condensation (Venkatachari and Hopke, 2008; Liu et al., 2023; Dong et al., 2012; Wu et al., 2022). These techniques employ aerosol mechanics such as vortexing or condensational growth into droplets for subsequent collection. For detection, fluorescence-based methods (e.g., DCFH-DA) are widely used due to their high sensitivity and real-time monitoring capabilities (Zhao and Hopke, 2012; King and Weber, 2013), though they may be susceptible to matrix interferences. Chemiluminescence (Yu and Zhao, 2021; Lakey et al., 2016; Zhang et al., 2018) and spectrophotometry (Jambunathan, 2010; Yang et al., 2020; Bielski et al., 1980) offer high sensitivity and ease of use but can be constrained in complex atmospheric matrices. More selective techniques like electron paramagnetic resonance (EPR) (D'Errico et al., 2018; Mrakic-Sposta et al., 2012) and laser-induced fluorescence (LIF) (Fuchs et al., 2008; Zhang et al., 2025; Murakami et al., 2007) provide high sensitivity for specific ROS but are difficult to implement in field-deployable systems due to environmental susceptibility and specialized instrumentation requirements.
Despite significant advances, current atmospheric ROS measurement techniques continue to face several limitations. Gaseous ROS are often collected using rotating wet diffusion tubes, in which slow liquid renewal and signal averaging limit time resolution and hinder capture of transient variability. Particulate ROS sampling often relies on high-temperature vapor collection or prolonged mist capture, both of which can promote thermal decomposition or analyte loss. Moreover, fluorescence-based detection systems remain bulky and difficult to integrate, and synchronous online measurements of gaseous and particulate ROS are rarely available, hindering investigation of interphase interactions.
In this study, an atmospheric ROS online analyzer was developed and constructed as an integrated system for in situ quantification of gaseous and particulate ROS by coupling mild wet-chemical sampling with DCFH-based fluorescence detection. Instrument performance was systematically assessed and optimized via calibration and interference evaluation. The validated system was then deployed for field measurements in Beijing, enabling characterization of phase-dependent ROS levels and interphase coupling under contrasting pollution conditions and providing new constraints on atmospheric oxidation capacity and implications for precursor control strategies.
2.1 Chemical reagents
2',7'-Dichlorodihydrofluorescein diacetate (DCFH-DA, ≥97 %) was purchased from Aladdin, and horseradish peroxidase (HRP, ≥200 units mg−1) was obtained from MREDA. Potassium dihydrogen phosphate (KH2PO4, 99.5 %), dipotassium hydrogen phosphate trihydrate (K2HPO4⋅3H2O, 99.0 %), sodium hydroxide (NaOH, 97.0 %), ethanol (CH3CH2OH, 99.8 %), and hydrogen peroxide (H2O2, 1000 µg mL−1) were purchased from Macklin. All chemicals were of analytical grade, and deionized (DI) water was used for solution preparation. The phosphate buffer solution (PBS, pH 7.0) was prepared by mixing KH2PO4 and K2HPO4⋅3H2O in DI water at appropriate ratios. To obtain the fluorescent reaction solution, DCFH-DA was dissolved in ethanol, hydrolyzed with NaOH for 30 min in the dark, and subsequently diluted with PBS to yield 10 µmol L−1 2',7'-dichlorodihydrofluorescein (DCFH). For the enzyme reaction solution, HRP was dissolved in PBS to a final activity of 2 units mL−1. All reagents were stored at low temperature and protected from light.
2.2 Instrument principle
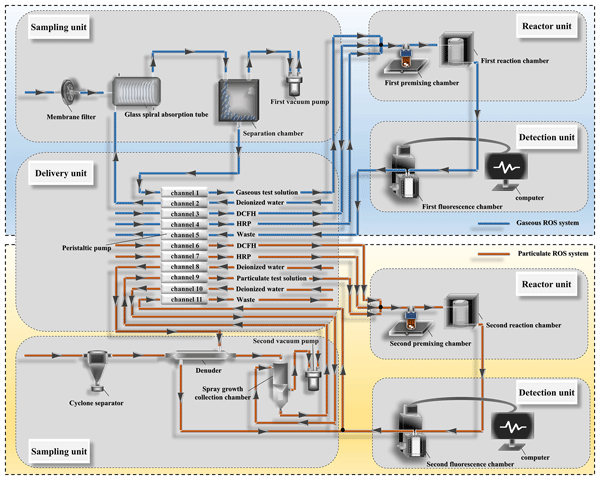
In this study, an online analyzer was developed to simultaneously quantify ROSg and ROSp using wet-chemical collection coupled with a fluorescence-probe assay. The instrument features two parallel systems, each composed of integrated sampling, delivery, reactor, and detection units, for real-time, in situ monitoring of both phases (Fig. 1). For ROSg, ambient air was first passed through a membrane filter to remove particles; the gaseous fraction was then absorbed into solution using a glass spiral absorption tube, followed by a gas-liquid separation chamber. The collected solution was mixed with the fluorescent probe and enzyme reagent in a premixing chamber and was subsequently derivatized at constant temperature in a reaction chamber prior to fluorescence detection. For ROSp, PM2.5 was size-selected using a cyclone, and residual ROSg was removed by a rotating wet annular denuder (WAD). The remaining particles were collected in a spray growth collection chamber and transferred to the liquid phase for analysis, after which the same derivatization and detection steps as in the gaseous system were applied. A WAD was not used as a single-step phase separator because its large liquid holdup volume would lower the solution renewal rate and sensitivity, thereby degrading temporal resolution and smoothing short-term concentration variability.
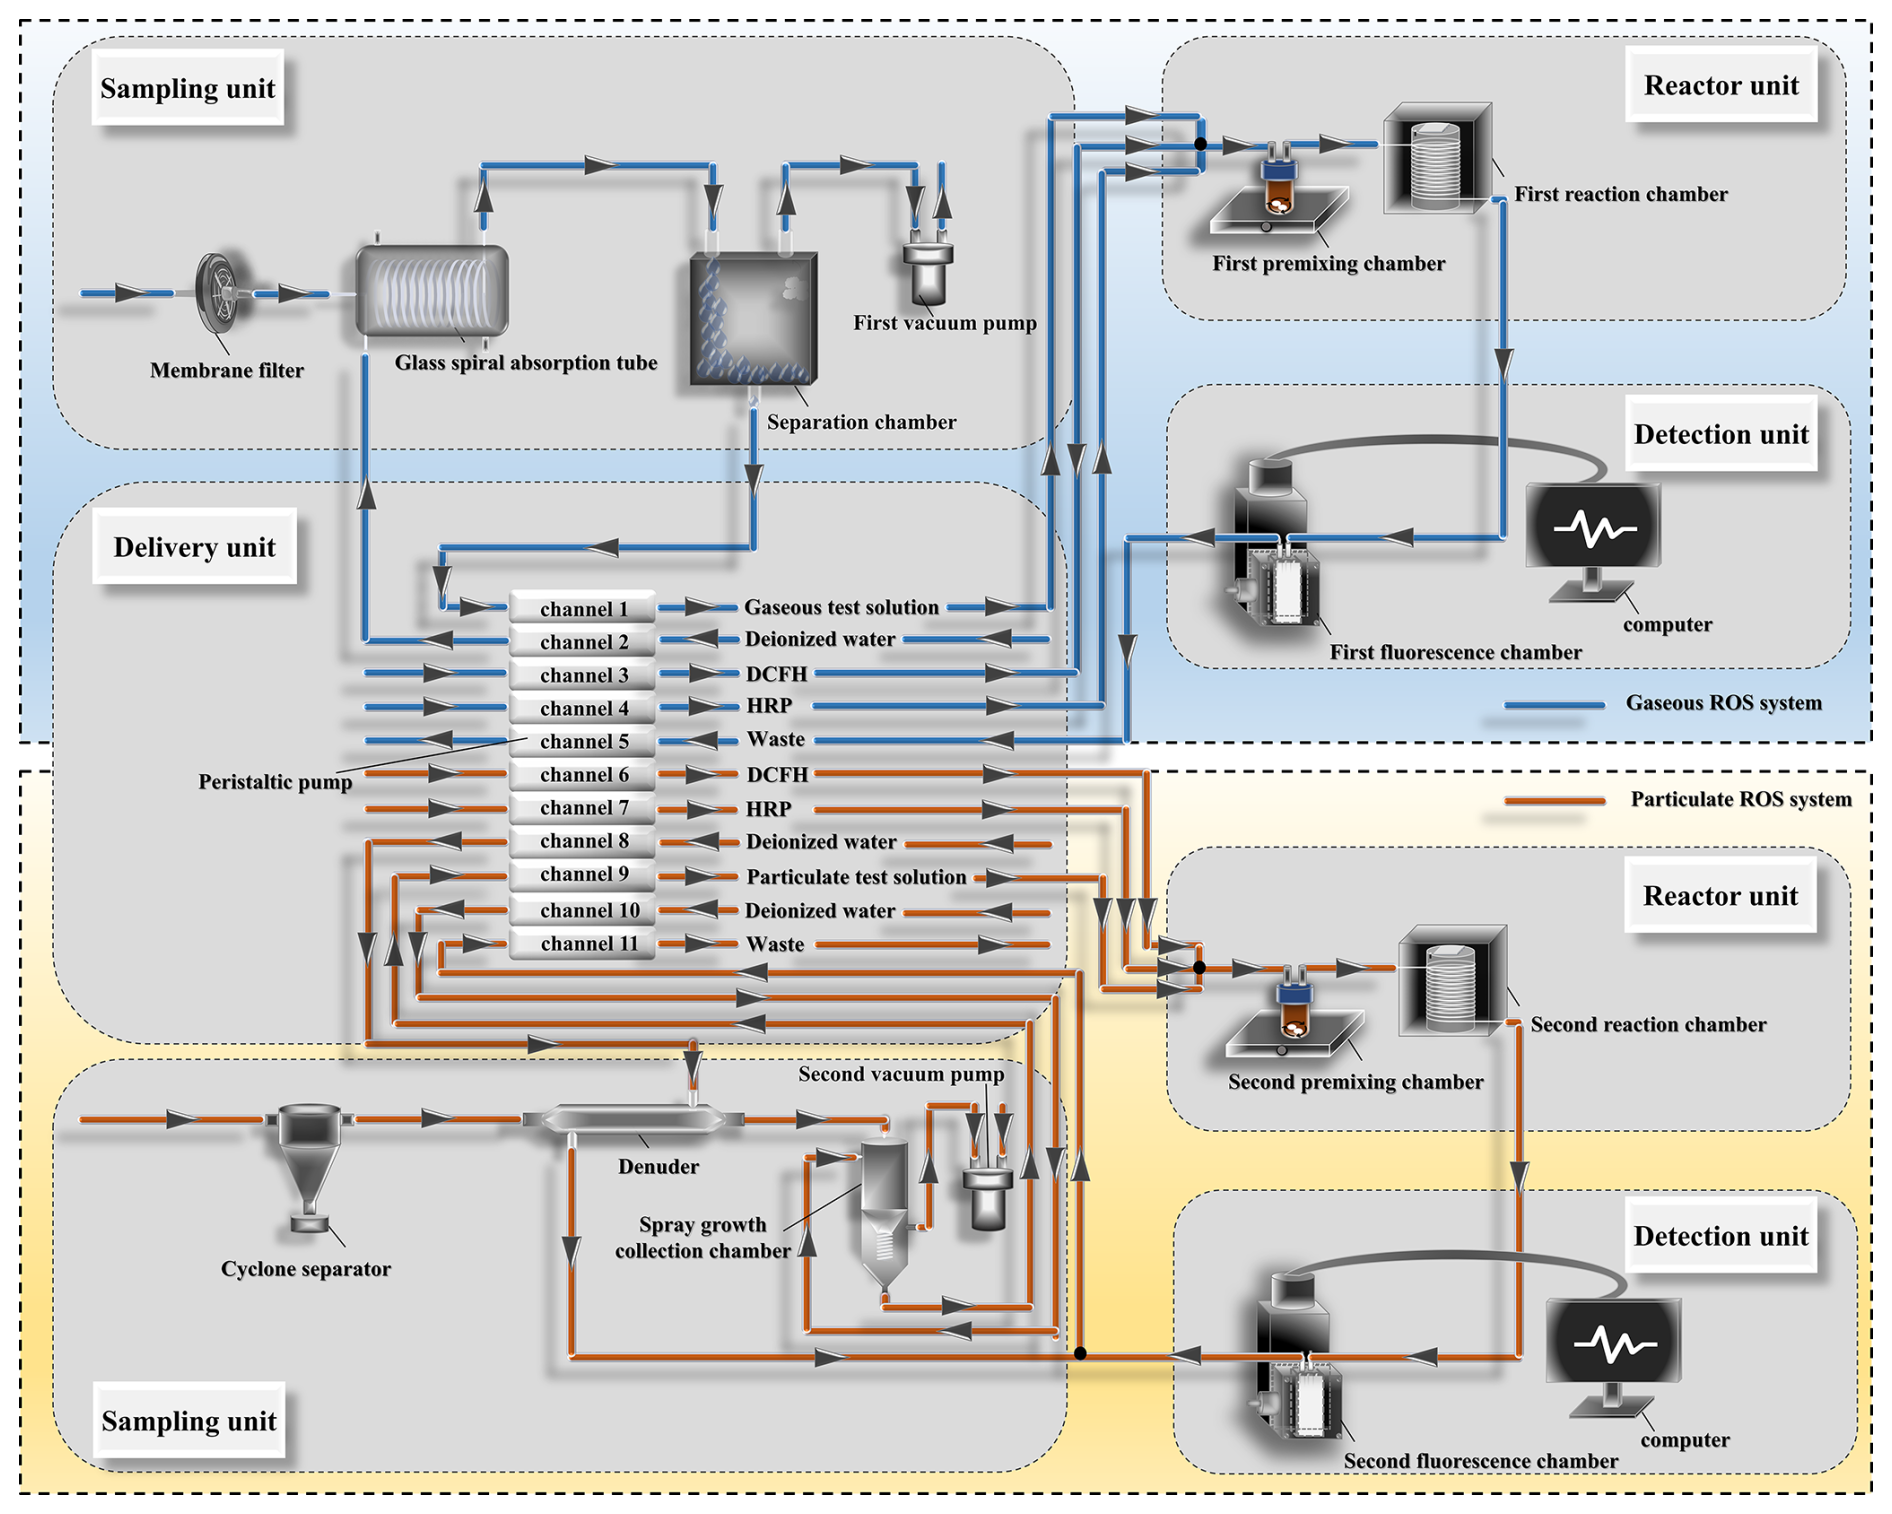
The core principle of ROS quantification relies on the HRP-catalyzed oxidation of DCFH by ROS. As illustrated in Fig. 2, ROSg and ROSp samples were first mixed with HRP. HRP was oxidized by ROS to form the active intermediate compound I (HRP-I). This intermediate then oxidized two DCFH molecules with weak native fluorescence to the highly fluorescent product DCF. Upon excitation at 470 nm, DCF emits fluorescence at 520 nm, and the signal intensity was proportional to the ROS concentration in the sample. Thus, ROSg and ROSp were quantified from the measured fluorescence signal. It should be noted that the DCFH-HRP assay is not equally sensitive to all ROS species. Previous characterization of DCFH-based atmospheric ROS measurements showed that peracetic acid produced a response close to that of H2O2, whereas sterically hindered organic peroxides, such as tert-butyl hydroperoxide, benzoyl peroxide, lauroyl peroxide, and 2-butanone peroxide, exhibited much lower relative sensitivities (Zhou et al., 2018). Therefore, the measured signal represents an operationally defined fraction of water-soluble, DCFH-reactive oxidants expressed as H2O2 equivalents, rather than the total abundance of all atmospheric ROS. Consequently, ROS species with low DCFH-HRP reactivity or limited aqueous stability may contribute less efficiently to the fluorescence signal, resulting in species-dependent response biases.
2.3 Instrument operation
The instrument operates via three integrated stages: sample collection, chemical derivatization, and optical detection. ROS in gas and particle phases are separately captured using wet absorption and spray growth collection chamber, then mixed online with DCFH and HRP to generate fluorescent products, enabling real-time, simultaneous measurement through a compact LED-PMT detection module.
2.3.1 Sample collection process
System flow is controlled by a peristaltic pump (Fig. 1), and the flow rates and specific functions of each tubing line are summarized in Table S1 in the Supplement. For ROSg, ambient air is first passed through a membrane filter to remove ROSp using the first vacuum pump (1 L min−1), and is then introduced into a glass spiral absorption tube; its construction is shown in Fig. S1 in the Supplement. The tube comprises an inner glass spiral coil (2 mm i.d., 70 cm effective length) encased in an outer cylindrical glass shell (50 mm diameter, 100 mm height), with circulating-water inlets and outlets. In parallel, the absorbent is delivered at 1.0 mL min−1 through a secondary line and introduced vertically at the same end of the tube. Surface tension maintains a stable liquid film along the inner wall of the spiral absorber, ensuring continuous gas-liquid contact for ROSg uptake. Under the present geometry and flow conditions, the internal coil volume was approximately 2.2 mL, corresponding to an estimated gas-liquid contact time of ∼0.13 s. Because the absorbent flow rate was negligible relative to the gas flow rate, this estimate was governed primarily by the gas residence time within the spiral coil. A similar glass coil operated at 2 L min−1 (gas) and 0.42 mL min−1 (liquid) was reported to achieve a 99.8 % collection efficiency for H2O2, supporting the adequacy of this configuration (Lazrus et al., 1986). The resulting solution is separated from the gas phase and delivered via channel 1 of the peristaltic pump to the first premixing chamber.
For ROSp, ambient air is first size-selected by a cyclone driven by the second vacuum pump (16.7 L min−1) and then directed to a rotating WAD, where DI water serves as the absorbent solution. As the sample air enters the laminar inlet, ROSg and ROSp diffuse at different rates according to their molecular diffusivities, enabling selective uptake of ROSg by the liquid film. Experimental evaluations showed that the rotating WAD achieved > 98 % removal efficiency for low-diffusivity gases such as SO2 at concentrations below 200 µg m−3 (Dong et al., 2012). Consequently, ROSp pass through the system unaffected and are transported into the spray growth collection chamber (Fig. S2). Meanwhile, the absorbent solution is introduced perpendicularly via channel 10 of the peristaltic pump, and is accelerated through a nozzle by the Venturi effect to form a fine mist, providing ∼ 0.3 s of growth time for aerosol particles. The high-speed airflow carries the particles to the chamber exit, achieving an 81.72 % collection efficiency. The collected ROS solution is delivered to the second premixing chamber via channel 9 of the peristaltic pump, while the remaining gas is vented. Compared with conventional methods that rely on vapor introduction and cooling to promote particle growth, the ambient-temperature spray collection used in this study reduces thermally induced ROS decomposition. This temperature-moderated, water-based collection minimizes artifacts associated with steam-driven condensational sampling and preserves redox-labile ROSp more effectively (Eftekhari et al., 2021). Rapid transfer into the aqueous phase also helps retain short-lived peroxide-like components that are prone to decomposition during high-temperature sampling or offline handling (King and Weber, 2013).
2.3.2 Chemical derivatization process
During the reaction process, the gaseous or particulate derivatization solution is delivered through channels 3, 4, 6, and 7 of the peristaltic pump, synchronized precisely with the solution-transport system. These flows are combined into a single stream using a three-way mixer and then are merged with the ROSg or ROSp analyte in a premixing chamber before entering the reaction chamber. Inside the reaction chamber (Fig. S3), which is maintained at pH 7.0 and 40 °C, the ROSg or ROSp sample is derivatized with DCFH in the presence of HRP, generating the fluorescent product used for quantitative ROS determination.
2.3.3 Optical detection process
The fluorescent solution containing ROSg or ROSp is pumped continuously through a flow cell housed in the fluorescence detection chamber (Fig. S4). A stable LED light source adjacent to the flow cell provides excitation at 470 nm, which is absorbed by the sample to induce emission at 520 nm. The emitted fluorescence is reflected by a planar mirror and then is passed through a 520 nm optical filter to suppress stray and scattered light before reaching the photomultiplier tube (PMT). At the PMT cathode, the optical signal is converted into a weak electrical current and is processed by an amplifier circuit for current-to-voltage (I/V) conversion. The resulting voltage signal is transmitted to the host computer via a data acquisition card (DAQ) and is recorded in real time using a self-developed LabVIEW program for stable, high-precision acquisition.
2.4 Instrument calibration
Calibration procedures were conducted using high-purity N2 at flow rates exceeding sampling conditions to ensure system stability. A series of H2O2 standard solutions and blank controls were introduced into the reaction chamber, and real-time signals were recorded via LabVIEW. The fluorescence response typically reached equilibrium within 10 min, after which data were collected for an additional 10 min to obtain steady-state averages. All measured ROS concentrations are expressed as H2O2 equivalents and should therefore be regarded as operationally defined ROS responses rather than absolute or molecule-specific quantification of total atmospheric ROS.
The concentrations of ROSg and ROSp in the sampling solutions were determined from voltage signals acquired in real-time using a LabVIEW program, following the relationship between fluorescence intensity and concentration:
where Ia is the measured fluorescence signal intensity, I0 is the baseline intensity, and CROS is the concentration of ROS in the sampling solution (µg H2O2 L−1). The coefficient K was derived from the fluorescence intensities corresponding to standard H2O2 solutions. A blank-corrected through-origin working curve was used for quantification; the blank signal was subtracted from the measured fluorescence signal prior to concentration calculation, thereby defining zero ROS concentration as zero net fluorescence response.
The atmospheric concentration of ROSg was calculated as:
where (µg m−3) is the ROSg concentration, FI is the absorption liquid flow rate in the glass spiral absorber (1.0 mL min−1), Fg is the gas sample flow rate (1.0 L min−1), and γg is the collection efficiency of the glass spiral absorber for ROSg. As the collection efficiency exceeded 99 %, sampling losses were considered negligible.
The mass concentration was further converted to volumetric mixing ratios (ppbv) using:
where Vm is the molar volume at standard conditions (22.4 L mol−1), M is the molecular weight of H2O2 (34 g mol−1), T0 and P0 are the standard temperature (273.15 K) and pressure (101.325 kPa), T and P are the ambient temperature and pressure during measurements.
The atmospheric concentration of ROSp was calculated as:
where (µg m−3) is the ROSp concentration, F0 is the collection liquid flow rate in the spray growth collection chamber (1.0 mL min−1), Fg is the aerosol sampling flow rate (16.7 L min−1), and γp is the collection efficiency of the spray growth collection chamber. The value of γp was determined from recovery experiments based on three fractions: the chamber-collected liquid (Mcol), the wall-rinse solution obtained by washing the chamber and associated tubing to recover deposited material (Mwall), and the downstream backup filter-rinse solution used to quantify particle breakthrough (Mfilter). For each fraction, the fluorescence response was measured under the same DCFH-HRP detection conditions and converted to an H2O2-equivalent amount using the corresponding calibration curve. The collection efficiency was defined as:
The recovery experiment was conducted in triplicate under actual ambient aerosol sampling conditions. The mean recovered fractions were 81.72 % in the chamber-collected liquid, 9.46 % in the wall-rinse solution, and 8.80 % on the downstream backup filter. The wall-rinse and backup-filter fractions were used to evaluate wall deposition and particle breakthrough, respectively. Since only the chamber-collected liquid was directly delivered to the second premixing chamber during routine online operation, γp=81.72 % was used as the effective online collection efficiency for ROSp quantification in Eq. (4). This value represents an operational mean collection efficiency for the present field deployment. Potential variations associated with particle loading, hygroscopic growth, aerosol chemical composition, and long-term operation should be further evaluated in future applications.
3.1 Parameter optimization
To enhance detection performance, systematic optimization of key parameters was conducted. This included reagent concentrations (DCFH and HRP), reaction temperature, and PMT/LED settings. Orthogonal experiments and systematic testing were performed to determine the optimal combination that maximizes fluorescence sensitivity, stability, and signal-to-noise ratio for reliable ROS quantification.
3.1.1 Reaction solution concentration
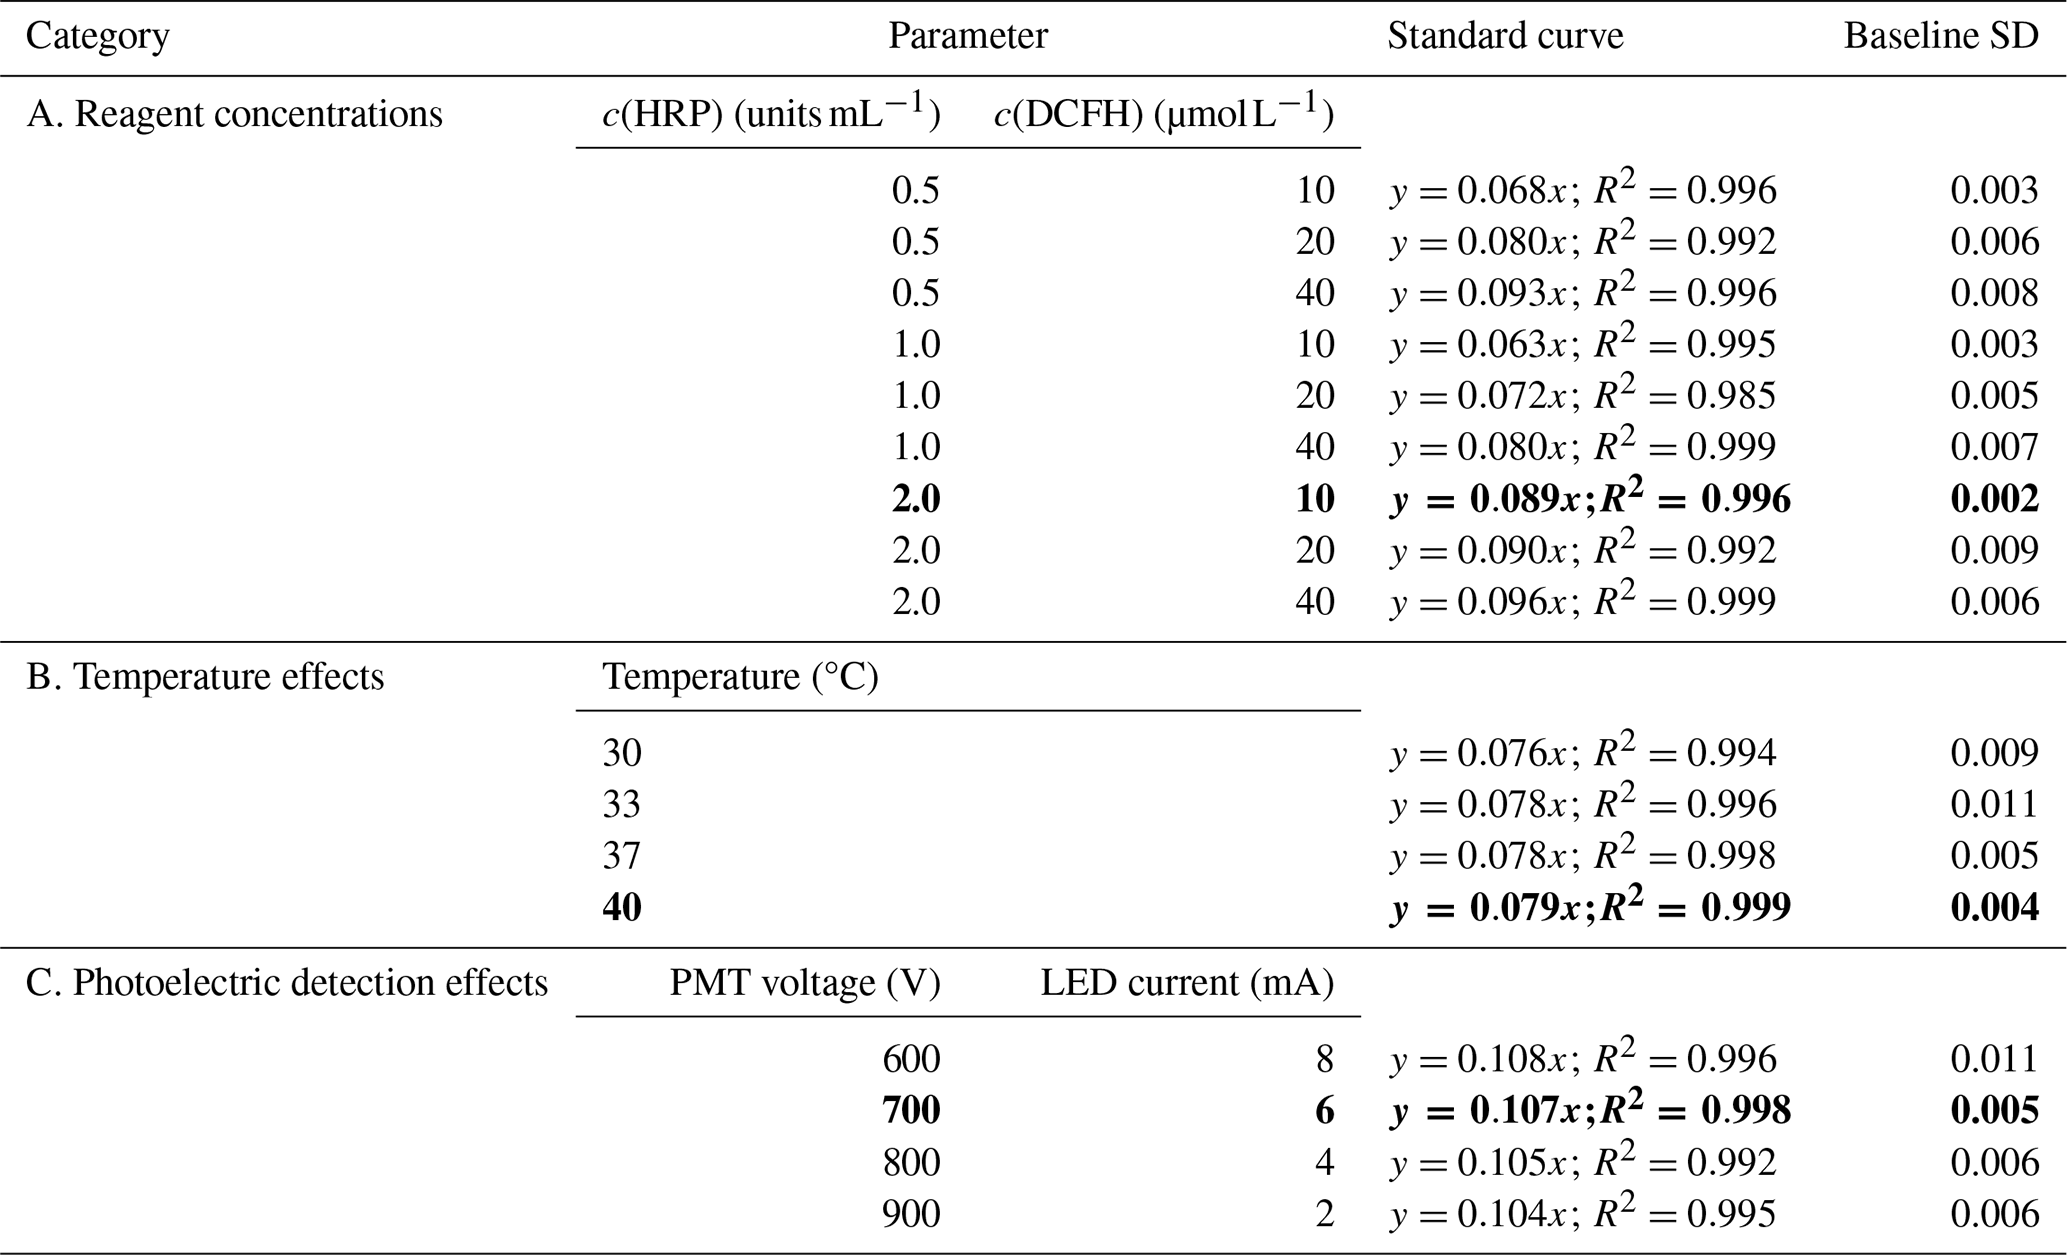
In the online detection of ROSg and ROSp, DCFH served as the fluorescent probe, while its oxidation product DCF exhibited fluorescence intensity positively correlated with ROS concentration. The derivatization reaction was catalyzed by HRP, thereby accelerating DCFH oxidation. To optimize reagent concentrations, an orthogonal experimental design was implemented with DCFH levels of 10.0, 20.0, and 40.0 µmol L−1 and HRP levels of 0.5, 1.0, and 2.0 units mL−1. Calibration curve slopes and baseline standard deviations (SD) were evaluated to quantify fluorescence sensitivity and measurement stability.
Results showed that increasing DCFH concentration enhanced fluorescence intensity by raising the abundance of reactive molecules (Table 1). However, excessively high DCFH concentrations led to higher background noise. For HRP, fluorescence intensity decreased at first but increased at higher concentrations. At 0.5–1.0 units mL−1, DCFH was efficiently oxidized to DCF, whereas side reactions likely produced weakly fluorescent species, thereby reducing the net signal. When HRP was increased further to 1.0–2.0 units mL−1, the catalytic rate was enhanced, leading to increased DCF formation. Considering both signal intensity and stability, the optimal reagent composition was identified as 10.0 µmol L−1 DCFH and 2.0 units mL−1 HRP.
Table 1Optimization of DCFH-HRP fluorescence detection conditions. Values in bold indicate the selected optimal operating conditions used in the subsequent experiments.
3.1.2 Reaction temperature
In practical applications, the usable activity window of HRP is constrained by its thermal stability. Previous studies have shown that HRP remains stable between 15 and 40 °C, whereas higher temperatures can cause irreversible denaturation (Ivanova et al., 2022; Abdulaal et al., 2020). In addition, the fluorescence quantum yield of DCF shows a linear temperature dependence with a coefficient of −0.3 % °C−1 (Birks, 1976). Consequently, temperature fluctuations may counteract signal gains from faster enzymatic kinetics, resulting in nonlinear net responses. To identify suitable operating conditions, temperature-gradient experiments were conducted from 30 to 40 °C, within the favorable activity range of HRP. Calibration-curve slopes and baseline SD were analyzed to assess fluorescence response and measurement stability across temperatures.
As summarized in Table 1, the calibration-curve slopes varied only slightly (0.076–0.079), with R2 values consistently above 0.99, indicating that HRP retained stable catalytic activity across the tested temperature range. In contrast, baseline SD decreased overall at higher temperatures and reached the lowest value at 40 °C. This trend may be attributed to faster molecular transport at higher temperatures, which enhances mixing and mass transfer and thereby reduces short-term signal fluctuations. Considering reaction completeness, measurement stability, and enzyme activity, 40 °C was selected as the optimal reaction temperature.
3.1.3 PMT high voltage and LED current
In the fluorescence detection system, the PMT high voltage directly determines signal gain. If the gain is set too low, weak fluorescence signals may remain undetected, whereas excessive gain can lead to signal over-amplification and increased noise. Likewise, the LED current controls excitation intensity, and deviations from the optimum can destabilize illumination, compromising signal reproducibility. Therefore, the combination of PMT high voltage and LED current was optimized to improve instrument sensitivity and the signal-to-noise ratio. To evaluate system stability, four PMT-voltage/LED-current combinations were tested; calibration-curve slope was used to represent response magnitude, and baseline fluctuations were quantified for each setting.
The evaluation results (Table 1) indicate that combination B (700 V–6 mA) provided the highest stability, with a baseline SD of 0.005, which was substantially lower than that of the other configurations. Combinations C (800 V–4 mA) and D (900 V–2 mA) showed slightly higher baseline SDs of 0.006, suggesting that higher PMT voltage can increase sensitivity but may also introduce additional noise. Combination A (600 V–8 mA) yielded the largest baseline SD (0.011), likely because the higher LED current increased device temperature and worsened long-term emission uniformity. Considering measurement stability and instrument longevity, combination B (700 V–6 mA) was selected as the optimal photodetector setting.
3.2 Performance assessment
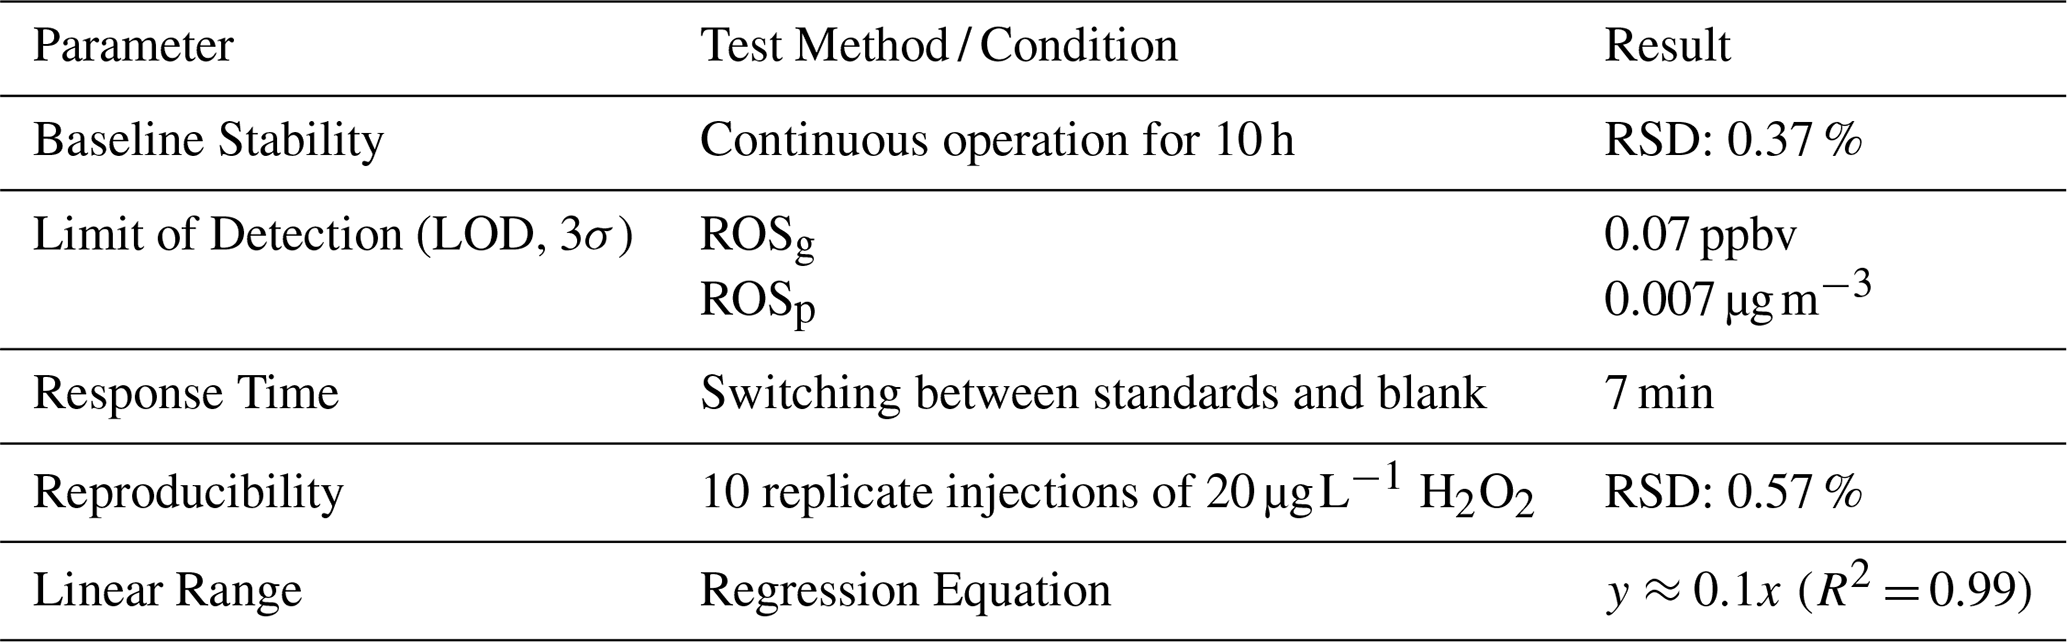
To ensure accurate and reliable quantification of atmospheric ROS in both gas and particle phases, a comprehensive performance assessment was conducted (Table 2). This included tests of baseline stability, detection limits, reproducibility, sensitivity, response time, and linear working range. These evaluations confirm the instrument's suitability for long-term field deployment under complex atmospheric conditions.
Table 2Performance specifications of the atmospheric ROS online analyzer.
3.2.1 Baseline stability and Detection limit
Baseline stability was evaluated by continuously recording the fluorescence signal of blank reagent for 10 h to quantify drift and assess long-term operational stability. Laboratory-grade DI water contains a steady-state background H2O2 concentration of up to ∼60 nmol L−1 due to equilibrium with dissolved oxygen, generating an inherent background fluorescence that defines the instrumental baseline when DI water is used as the sample. As shown in Fig. 3a, the signal remained within 0.927–0.953 V, corresponding to a total variation of 0.026 V. The SD and RSD were 0.0035 V and 0.37 %, respectively, indicating stable baseline behavior during uninterrupted operation.
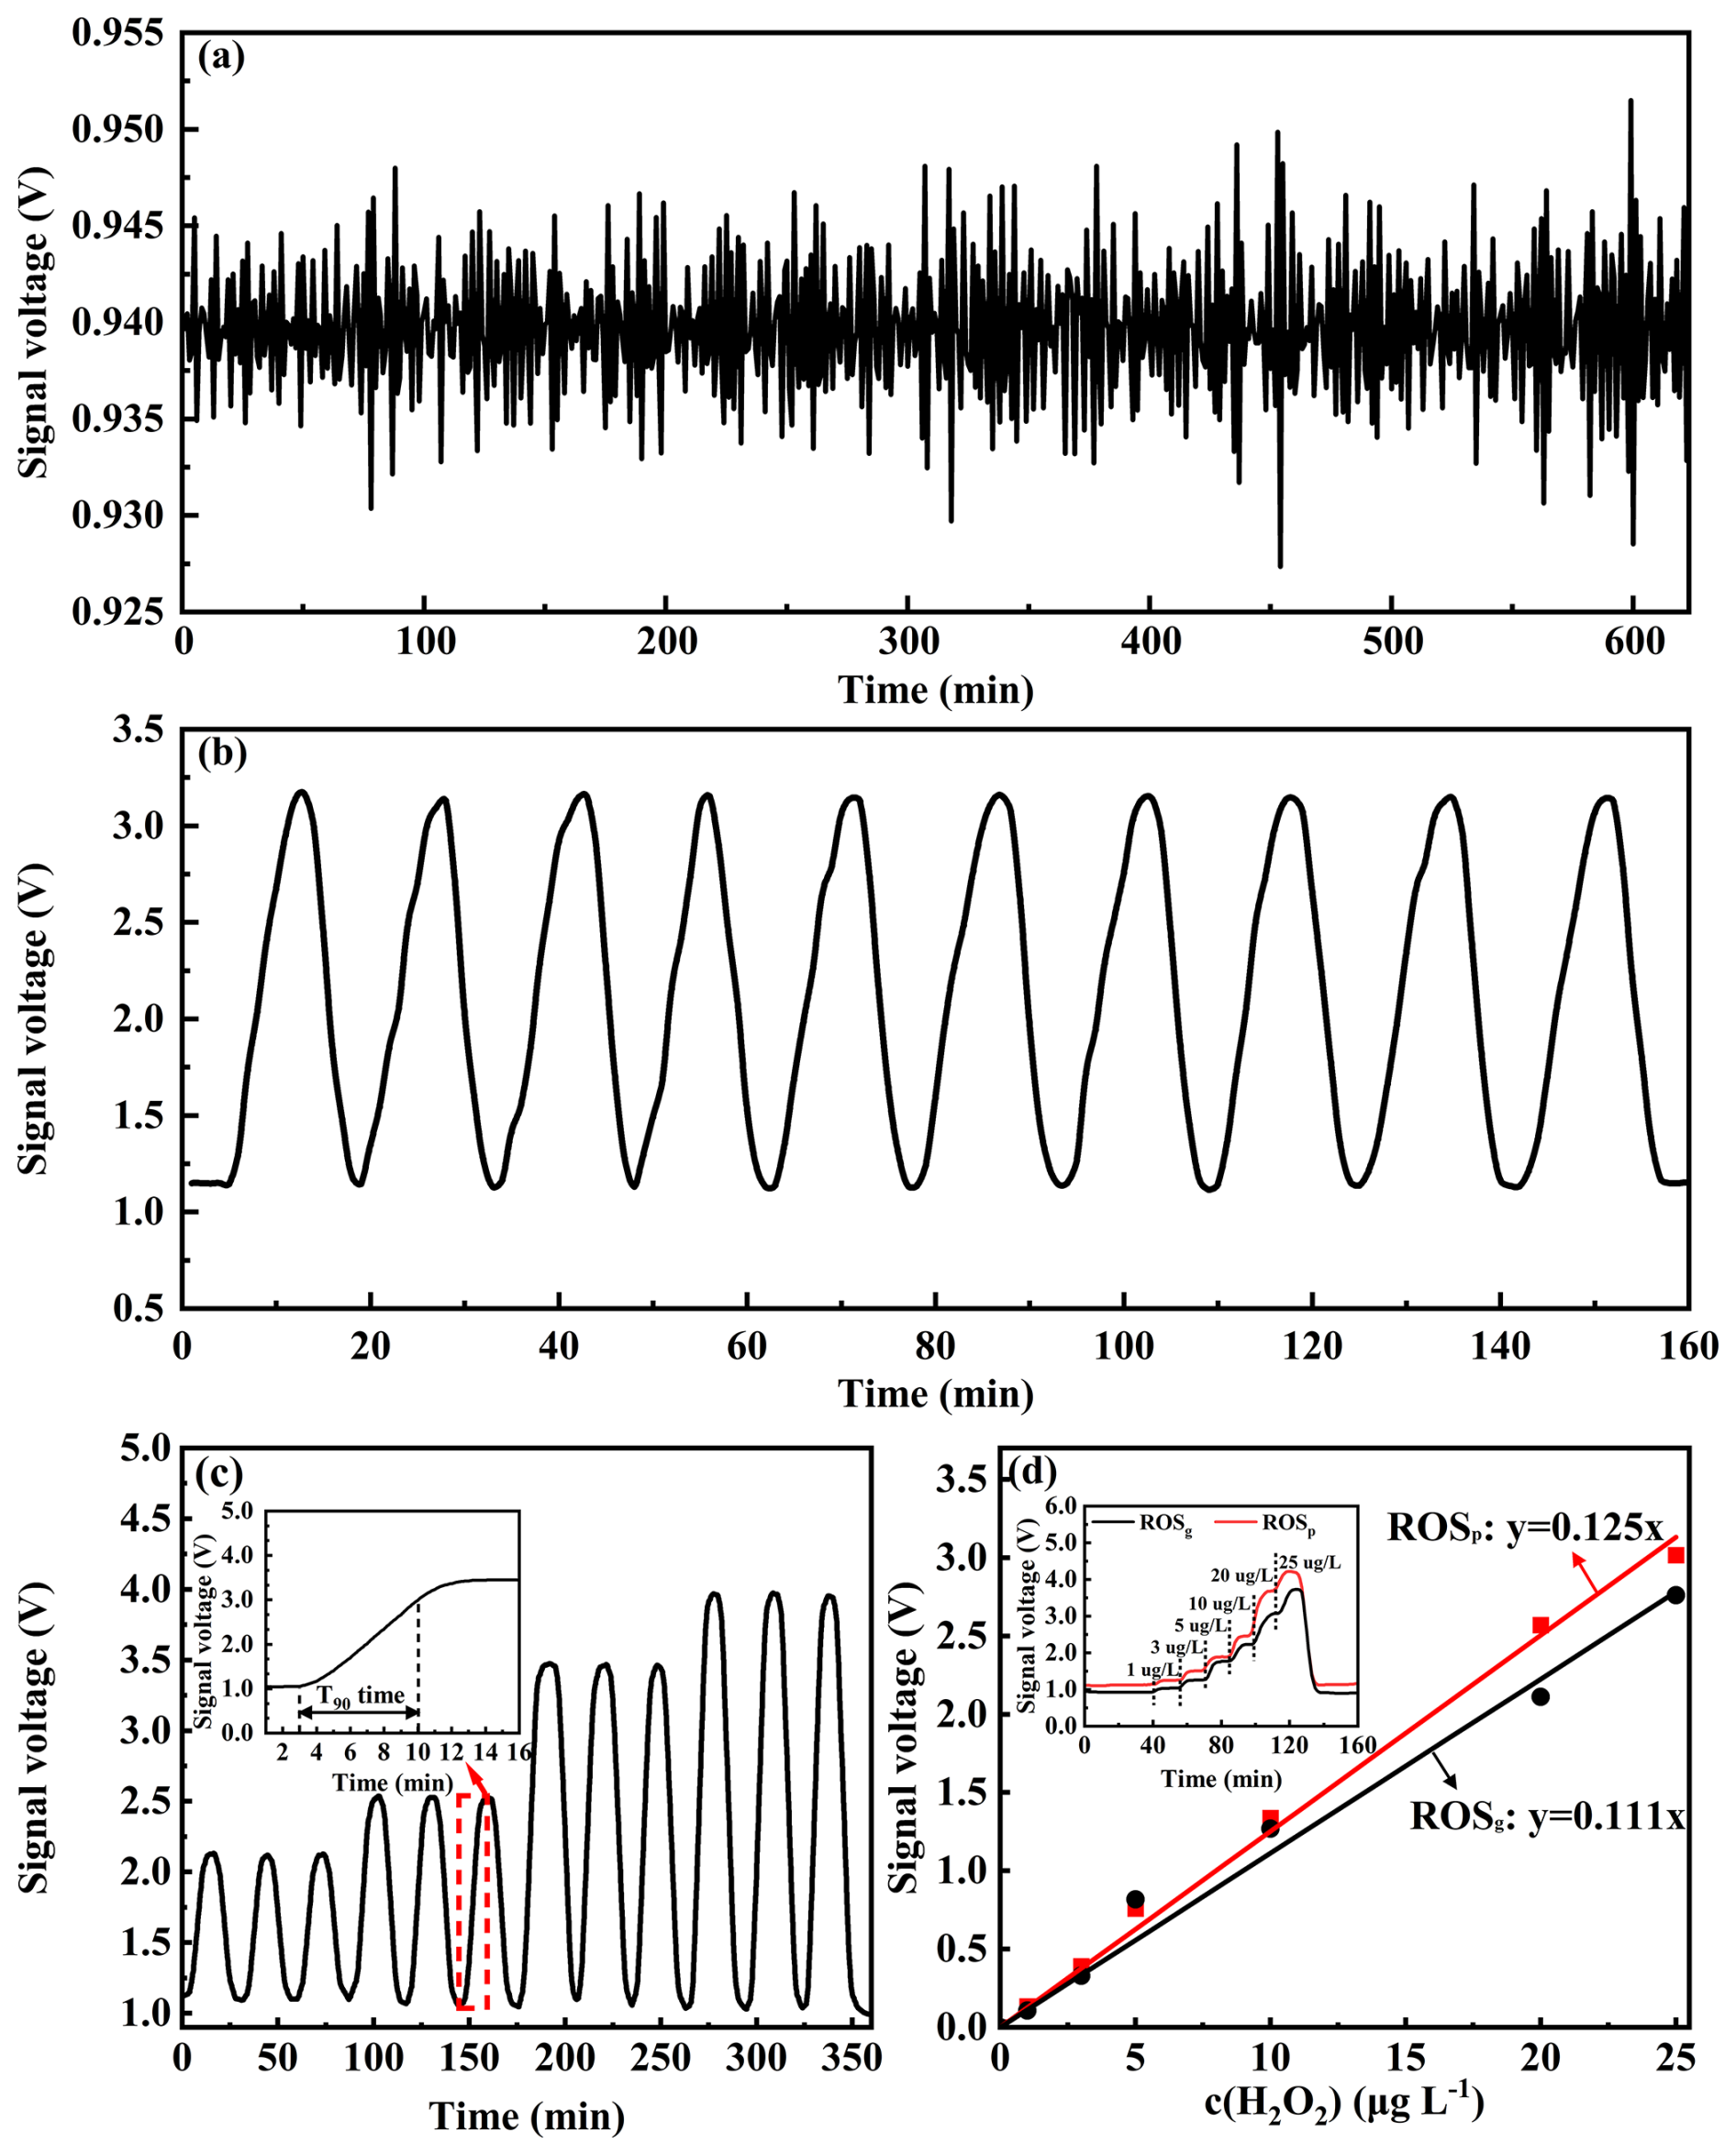
Figure 3Performance evaluation of the atmospheric ROS online analyzer: (a) baseline stability, (b) reproducibility, (c) sensitivity, and (d) linear working range.
Baseline control is essential because reagent auto-oxidation can bias low-level ROS measurements. Dissolved oxygen promotes self-oxidation within the DCFH-HRP system, and DCFH is susceptible to photo-induced oxidation. These effects were minimized using a fully light-shielded flow path and nitrogen protection of the reagent. In addition, peristaltic tubing wear can induce gradual flow attenuation and mixing-ratio changes, leading to baseline offset; thus, routine flow calibration and periodic tubing replacement are required.
The detection limit was derived using the 3σ criterion based on baseline noise, yielding 0.07 ppbv for ROSg and 0.007 µg m−3 for ROSp. These limits enable reliable quantification under low-background conditions and during routine ambient monitoring.
3.2.2 Reproducibility
Reproducibility was quantified using a 20 µg L−1 H2O2 standard measured repeatedly over 10 cycles. Standard solution and blank water were alternated to determine sample and background signals within each 16 min cycle, resulting in a total test duration of 160 min. As shown in Fig. 3b, the mean peak-to-valley signal difference was 2.025 V with an RSD of 0.57 %. The concentration confidence interval, expressed as three times the SD, was (20.0 ± 0.34) µg L−1, confirming consistent instrument response over prolonged operation and across repeated reaction cycles.
3.2.3 Sensitivity and response time
Sensitivity was evaluated by alternating 10 min injections of H2O2 standard solution and 10 min injections of blank DI water to simulate rapid ambient variability. Standards of 1.0, 3.0, 5.0, 10.0, 20.0, and 25.0 µg L−1 correspond to ROSg of 0.58, 1.73, 2.88, 5.76, 11.52, and 14.41 ppbv, and ROSp of 0.07, 0.20, 0.33, 0.66, 1.33, and 1.66 µg m−3. Each level was tested in triplicate. The response time (T90), defined as the time required to reach 90 % of the final signal change, was consistently 7 min for both signal increases and decreases (Fig. 3c), demonstrating rapid tracking of concentration transitions across the tested range.
3.2.4 Linear working range
The linear working range was determined by simultaneous injection and switching tests in the gas and particle phase channels using the same H2O2 standards (1.0–25.0 µg L−1). Regression analysis showed a strong linear relationship between the baseline-corrected fluorescence response and standard concentration. A through-origin working curve was used for quantification, with y≈0.1x and R2 = 0.99 (Fig. 3d). The two channels exhibited nearly identical response behavior, calibration slopes, and response times, indicating strong inter-channel agreement and stable system matching. The RSD at each concentration point was below 1 %, supporting robust quantitative performance within the tested range. The atmospheric-equivalent calibration range was 0.58–14.41 ppbv for ROSg and 0.07–1.66 µg m−3 for ROSp. Together with the stable blank behavior and low detection limits, this calibration provides the quantitative basis for subsequent ambient measurements, while measurements near the lower calibration boundary are interpreted with appropriate consideration of blank-related uncertainty.
3.2.5 Performance comparison
Table 3 summarizes the evolution of representative DCFH/HRP-based online atmospheric ROS analyzers in terms of target phase, sampling strategy, response time, detection limit, reagent use, and major constraints. The semi-continuous method of King and Weber (2013) enabled online ROS measurements with a 10.5 min cycle, but ROSp was obtained by subtracting ROSg from total ROS, making the result sensitive to uncertainty propagation when particle-phase signals were near the detection limit. Huang et al. (2016) developed the GAC-ROS system for simultaneous ROSg and ROSp measurements; however, the relatively complex gas/aerosol collection and liquid-handling configuration limited further simplification and integration for field deployment. OPROSI reported by Wragg et al. (2016) improved portability and achieved a time resolution of ≤12 min, but it targeted ROSp only and therefore could not resolve synchronous ROSp variations. Zhou et al. (2018) achieved an approximately 8 min fluorescence response and improved reagent handling and interference characterization, yet the system remained particle-focused and showed notable sensitivity variability. Liu et al. (2023) reduced offline sampling losses and provided online ROSp monitoring with a 20 min resolution, but ROSp was still calculated from alternating total and gas-phase measurements.
Table 3Technical comparison of representative DCFH/HRP-based online atmospheric ROS analyzers.
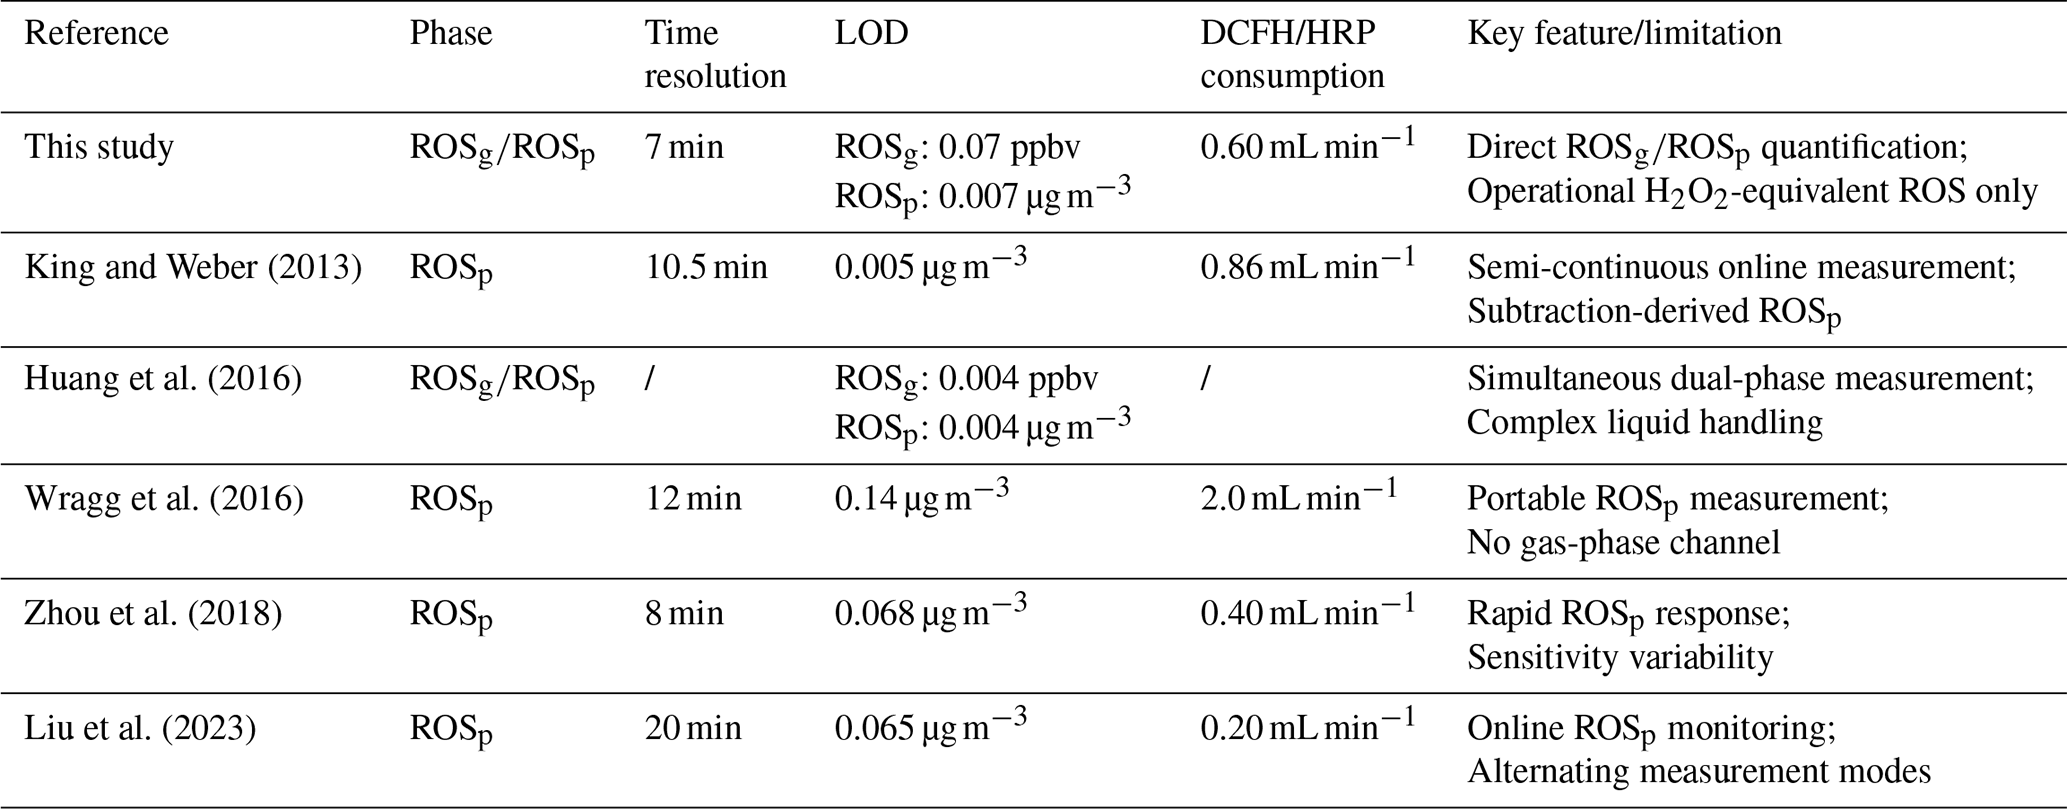
The present analyzer was developed to improve phase resolution, response speed, and operational integration simultaneously. By coupling a low-holdup glass spiral absorber for ROSg with a separate WAD-assisted, ambient-temperature spray growth collector for ROSp, the system directly quantifies both phases without difference-based calculation. This design reduces uncertainty propagation, improves the ability to capture rapid gas-particle variations, and minimizes potential collection losses of labile particulate ROS. Together with compact LED-PMT fluorescence detection, the analyzer achieved a 7 min response time, low detection limits for both phases, and stable long-term operation, demonstrating its suitability for synchronized field measurements of atmospheric ROS. As with other DCFH/HRP-based systems, the reported concentrations should be interpreted as operational H2O2-equivalent ROS rather than molecule-specific ROS.
3.3 Interference assessment
Potential interferences in the DCFH-HRP assay may arise from direct probe oxidation, aqueous consumption of H2O2, or side reactions affecting DCF formation. For oxidizing gases, previous studies have shown that O3 interference is generally weak under ambient-relevant conditions. The dissolved O3 level estimated at ∼40 ppbv is insufficient to produce measurable DCFH-based artifacts, and laboratory tests at 60–80 ppbv O3 showed negligible responses (Huang et al., 2016; King and Weber, 2013). Field evaluations further indicated that even 100 ppbv O3 produced a maximum H2O2 quantification error below 0.03 ppbv, whereas positive artifacts became important only under extremely elevated O3 levels up to several hundred ppbv due to secondary oxidant formation (Lazrus et al., 1986; Montesinos et al., 2015). Since the O3 levels observed in the present campaign were within the ambient-relevant range evaluated in these studies, O3-related interference was considered a minor positive artifact in the gas-phase channel.
Reducing gases and soluble transition metals were more directly relevant to potential negative biases in the present DCFH-HRP configuration. NO has been reported to cause only weak H2O2 loss, whereas SO2 can suppress H2O2 detection through aqueous S(IV) chemistry with strong dependence on concentration and pH (Hua et al., 2008; Lazrus et al., 1986; Komazaki et al., 2001). Fe2+ can also consume H2O2 through Fenton-type reactions, while Fe3+ shows limited interference under comparable conditions (Kolthoff and Medalia, 1949; Zhou et al., 2018). Therefore, direct laboratory tests were conducted for SO2, NO, Fe2+, and their mixtures under the same reaction conditions as the analyzer. The interference tests used a 3 µg L−1 H2O2 standard as the reference solution, and the H2O2-only solution was used as the control. The tested atmospheric-equivalent levels included 0.5, 1, 10, and 25 ppbv for SO2; 10, 25, 50, and 100 ppbv for NO; and 20, 80, 160, and 400 ng m−3 for Fe2+. Two mixed conditions were further examined: Mix1, an environmentally representative mixed condition composed of 1 ppbv SO2, 25 ppbv NO, and 80 ng m−3 Fe2+, and Mix2, a high-level sensitivity condition composed of 10 ppbv SO2, 100 ppbv NO, and 160 ng m−3 Fe2+. As shown in Fig. 4, NO produced negligible interference across the tested range, with biases from −1.02 % to 0.04 %. SO2 showed a clear concentration-dependent negative effect. The biases were minor at 0.5 and 1 ppbv SO2 (−0.20 % and −0.23 %) but increased to −10.00 % and −29.97 % at 10 and 25 ppbv SO2, respectively, consistent with H2O2 consumption by dissolved S(IV). Formaldehyde was not used in the present flow configuration; therefore, SO2-related effects were retained as a potential negative interference rather than assumed to be chemically suppressed.
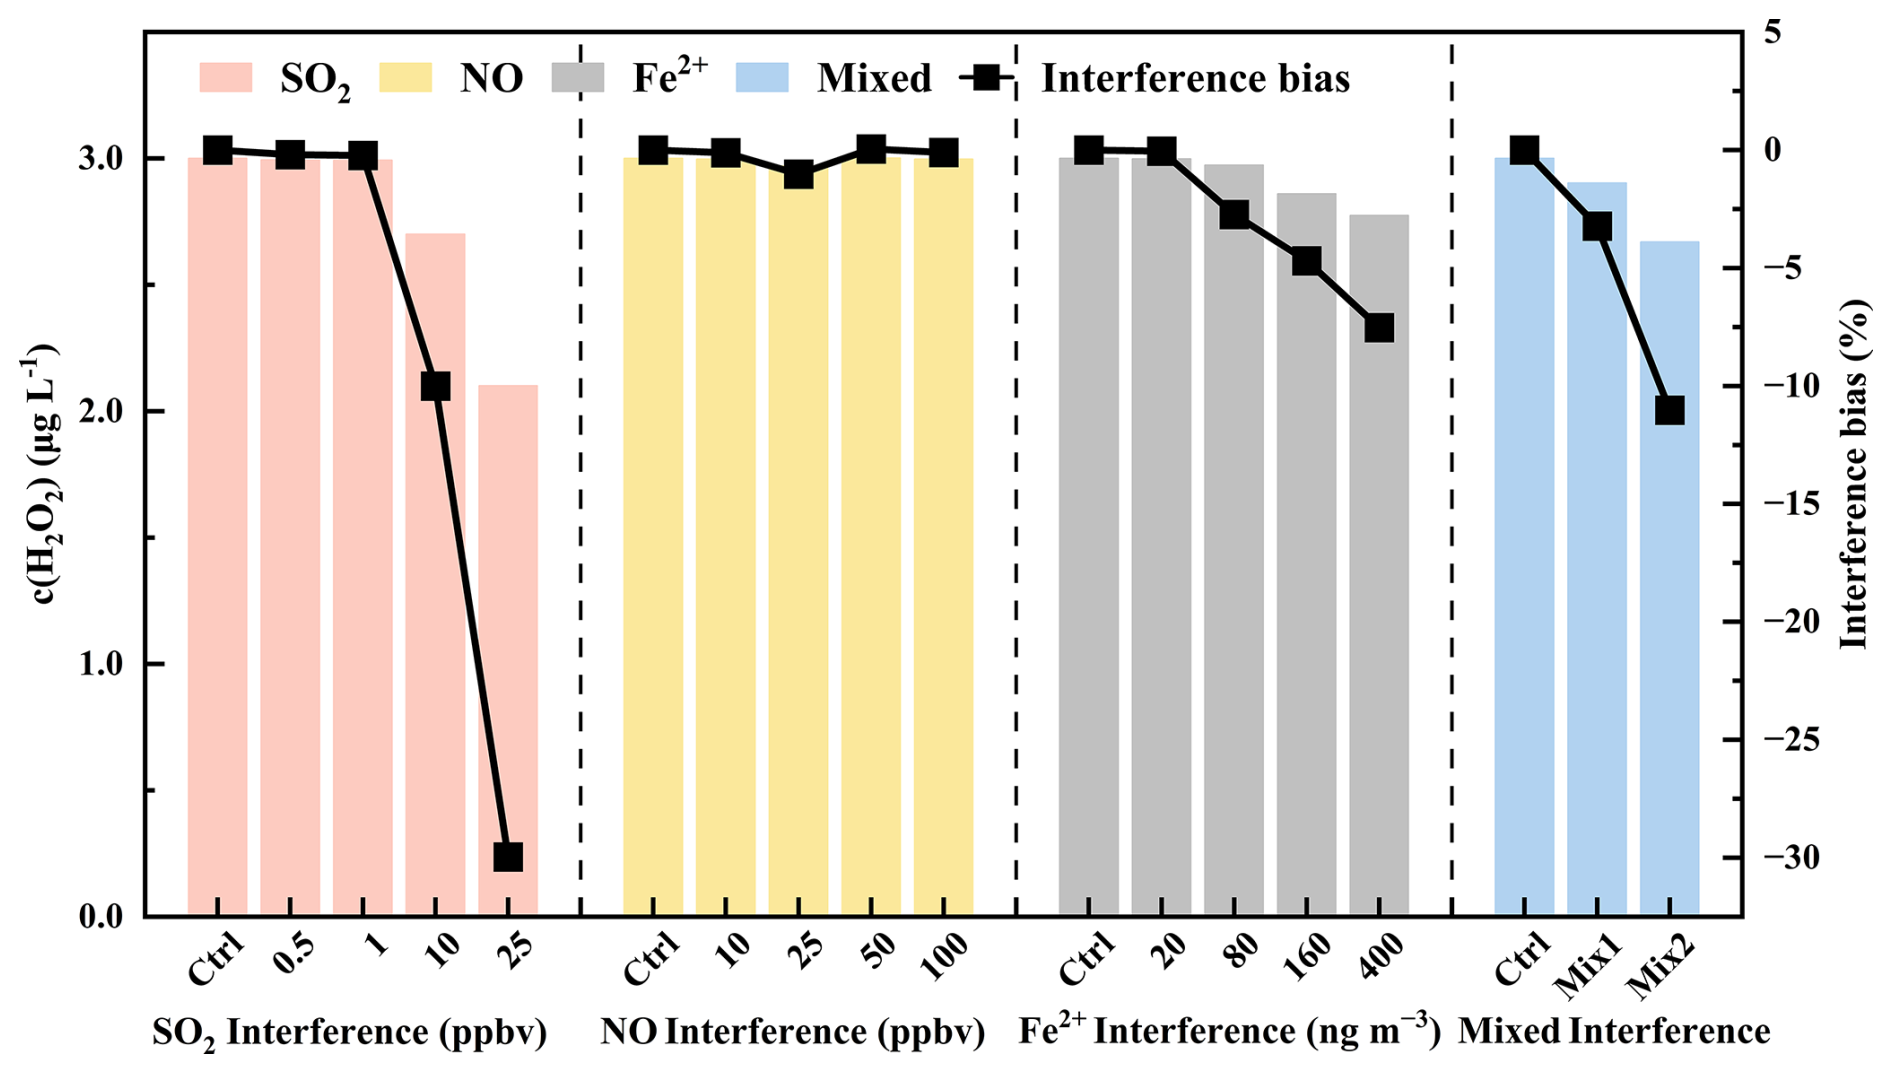
Figure 4Effects of SO2, NO, Fe2+, and mixed interferents on the DCFH-HRP response to 3 µg L−1 H2O2. SO2 and NO levels are given in ppbv, and Fe2+ levels in ng m−3. Mix1 contains 1 ppbv SO2, 25 ppbv NO, and 80 ng m−3 Fe2+, while Mix2 contains 10 ppbv SO2, 100 ppbv NO, and 160 ng m−3 Fe2+. Bars indicate measured H2O2-equivalent concentrations, and black squares indicate interference bias relative to the control.
Fe2+ also caused a systematic negative bias, increasing from −0.05 % at 20 ng m−3 to −2.73 %, −4.69 %, and −7.53 % at 80, 160, and 400 ng m−3, respectively. This trend agrees with Fe(II)-driven Fenton-type H2O2 consumption. The mixed-interferent tests provided a direct estimate of total interference under coexisting soluble species. The total bias was −3.23 % for Mix1 and −11.03 % for Mix2, indicating that the combined effect was mainly negative and governed by SO2 and Fe2+, without evidence of additional synergistic amplification.
Based on the calibration conversion used in this study, the Mix1 bias corresponds to an atmospheric-scale uncertainty of approximately −0.056 ppbv for ROSg and −0.006 µg m−3 for ROSp, which is below the instrumental detection limits. The Mix2 bias corresponds to approximately −0.19 ppbv for ROSg and −0.022 µg m−3 for ROSp and represents a conservative high-level sensitivity scenario. Therefore, the quantified interference was unlikely to affect the seasonal pattern or pollution-regime interpretation of the present field observations, although high-SO2 or Fe-rich environments may lead to underestimation of ROS and should be further evaluated in future applications.
4.1 Observation methods
Field observations of ROSg and ROSp were conducted at the Peking University Computing Center in Haidian District, northwestern Beijing, China (39.99° N, 116.31° E). The site is located in the Zhongguancun area, a densely populated urban district characterized by intensive educational, commercial, residential, and traffic activities. It is therefore affected by mixed urban emissions, including vehicle exhaust, residential and commercial activities, and regional transport from surrounding areas of the North China Plain. These features provide a complex urban atmospheric environment for evaluating the field applicability of the analyzer under seasonally varying photochemical and particulate pollution conditions. The field campaign covered four seasons: autumn (29 October–15 November 2024), winter (10–31 December 2024), spring (24 April–15 May 2025), and summer (13 June–5 July 2025).
In addition to ROS measurements, routine atmospheric pollutants were continuously monitored in real time. O3 was monitored using a Model 49i ozone analyzer (Thermo Fisher Scientific, USA), while NOx and SO2 were measured with Model 42i and Model 43i-TLE analyzers, respectively (Thermo Fisher Scientific, USA). PM2.5 mass concentration was determined using a TH-2000Z1 monitor (Tianhong, China). Photolysis frequencies, including j(O1D), j(HONO), and j(H2O2), were derived from actinic flux spectra recorded over 280–650 nm using a UF-CCD spectroradiometer (MetCon, Germany) followed by spectral inversion. HONO, NH3, and HNO3 were quantified using a gas aerosol collector-ion chromatography (GAC-IC) system (Peking University, China). VOCs were measured by ZF-PKU-VOC1007 system (Pengyu Changya, China), and non-refractory components in submicron aerosol particles were characterized by ToF-ACSM (Aerodyne Research, USA).
Observation days were classified as polluted days when the daily maximum 8 h average O3 concentration exceeded 160 µg m−3, corresponding to a mixing ratio of ∼80 ppbv, or when the 24 h average concentration of PM2.5 and PM10 exceeded 75 and 150 µg m−3, respectively. Days that did not meet any of these criteria were defined as clean days.
4.2 Overall variations of ROS and associated atmospheric species
Figure 5 presents the seasonal and pollution-dependent variations of ROS and associated atmospheric species, and the corresponding seasonal statistics under clean days (CDs) and polluted days (PDs) are summarized in Table S2. Notably, ROSg and ROSpexhibited a consistent seasonal pattern, with maximum values in spring (2.28 ppbv and 0.50 µg m−3, respectively) and minimum values in autumn (1.03 ppbv and 0.17 µg m−3, respectively). The lowest seasonal mean concentrations were within the verified linear response range of the instrument, which covered the corresponding atmospheric-equivalent levels of the field observations. These values also exceeded the corresponding 3σ detection limits by factors of approximately 15 and 24 for ROSg and ROSp, respectively, confirming that the seasonal-average signals were analytically resolved rather than artifacts of instrumental blank noise or short-term instrumental drift. A broader comparison with previous field observations is provided in Fig. 6 and Table S3.
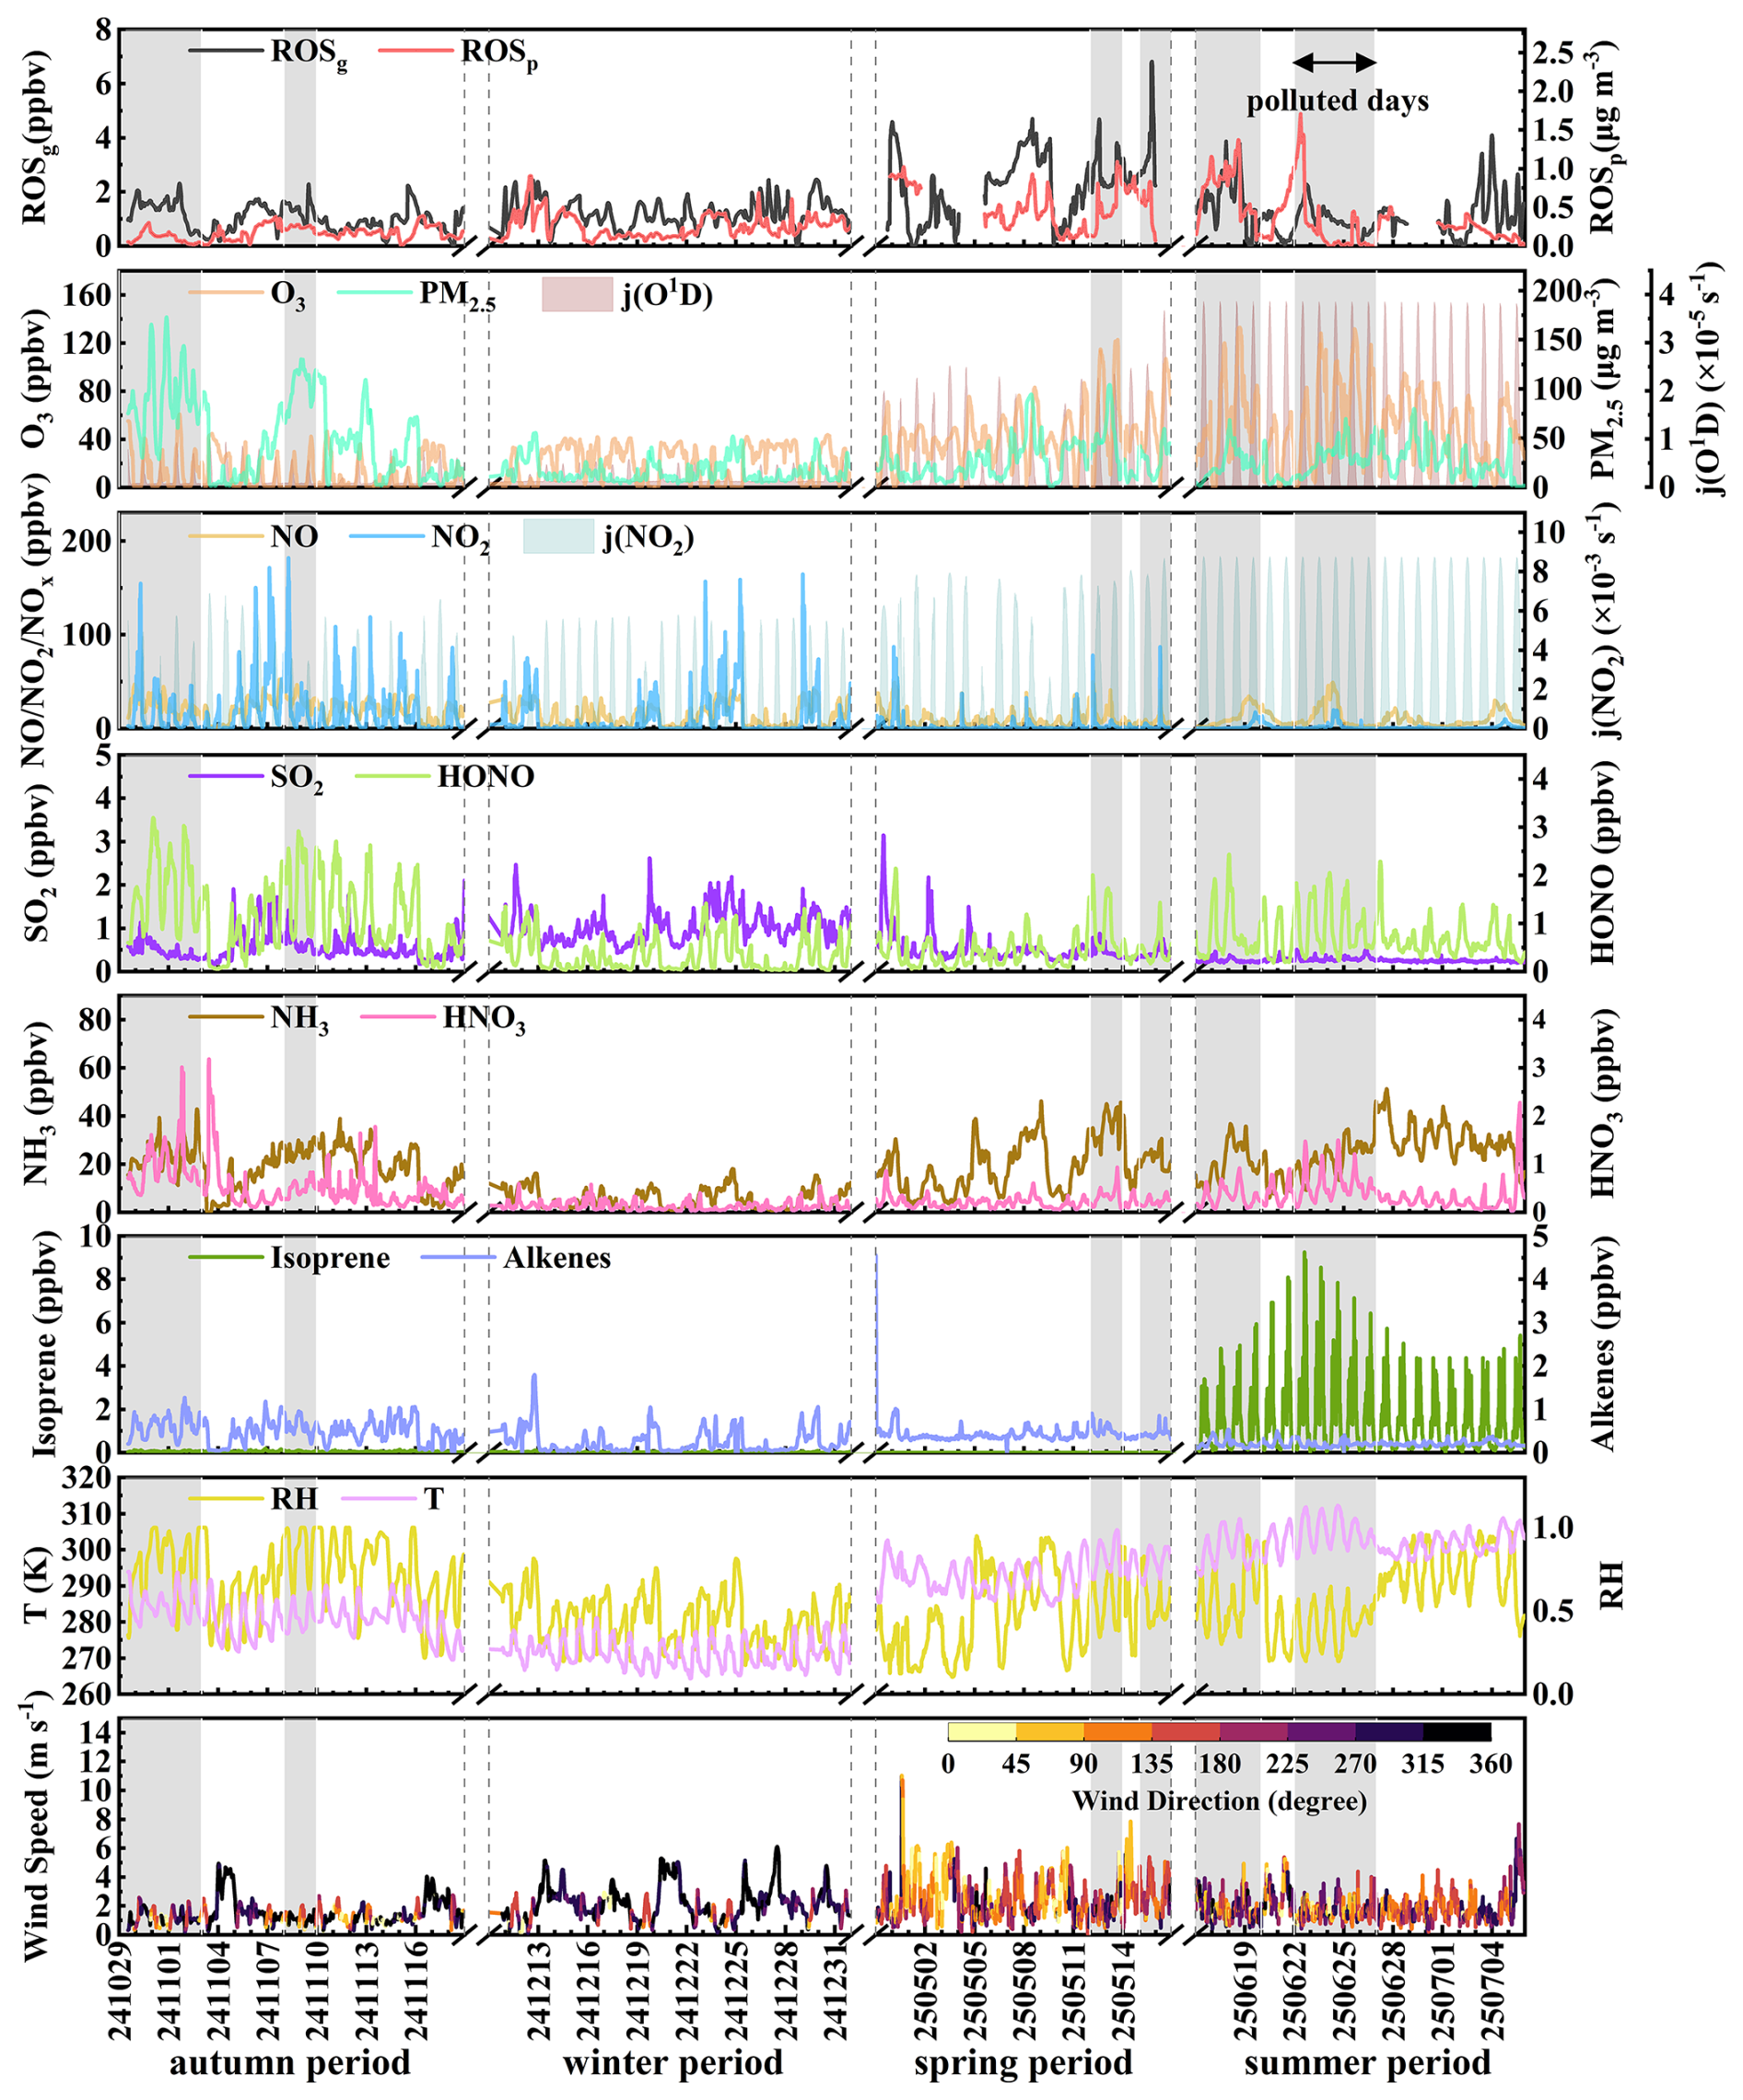
Figure 5Temporal variations of ROS and related atmospheric constituents during the observation period.
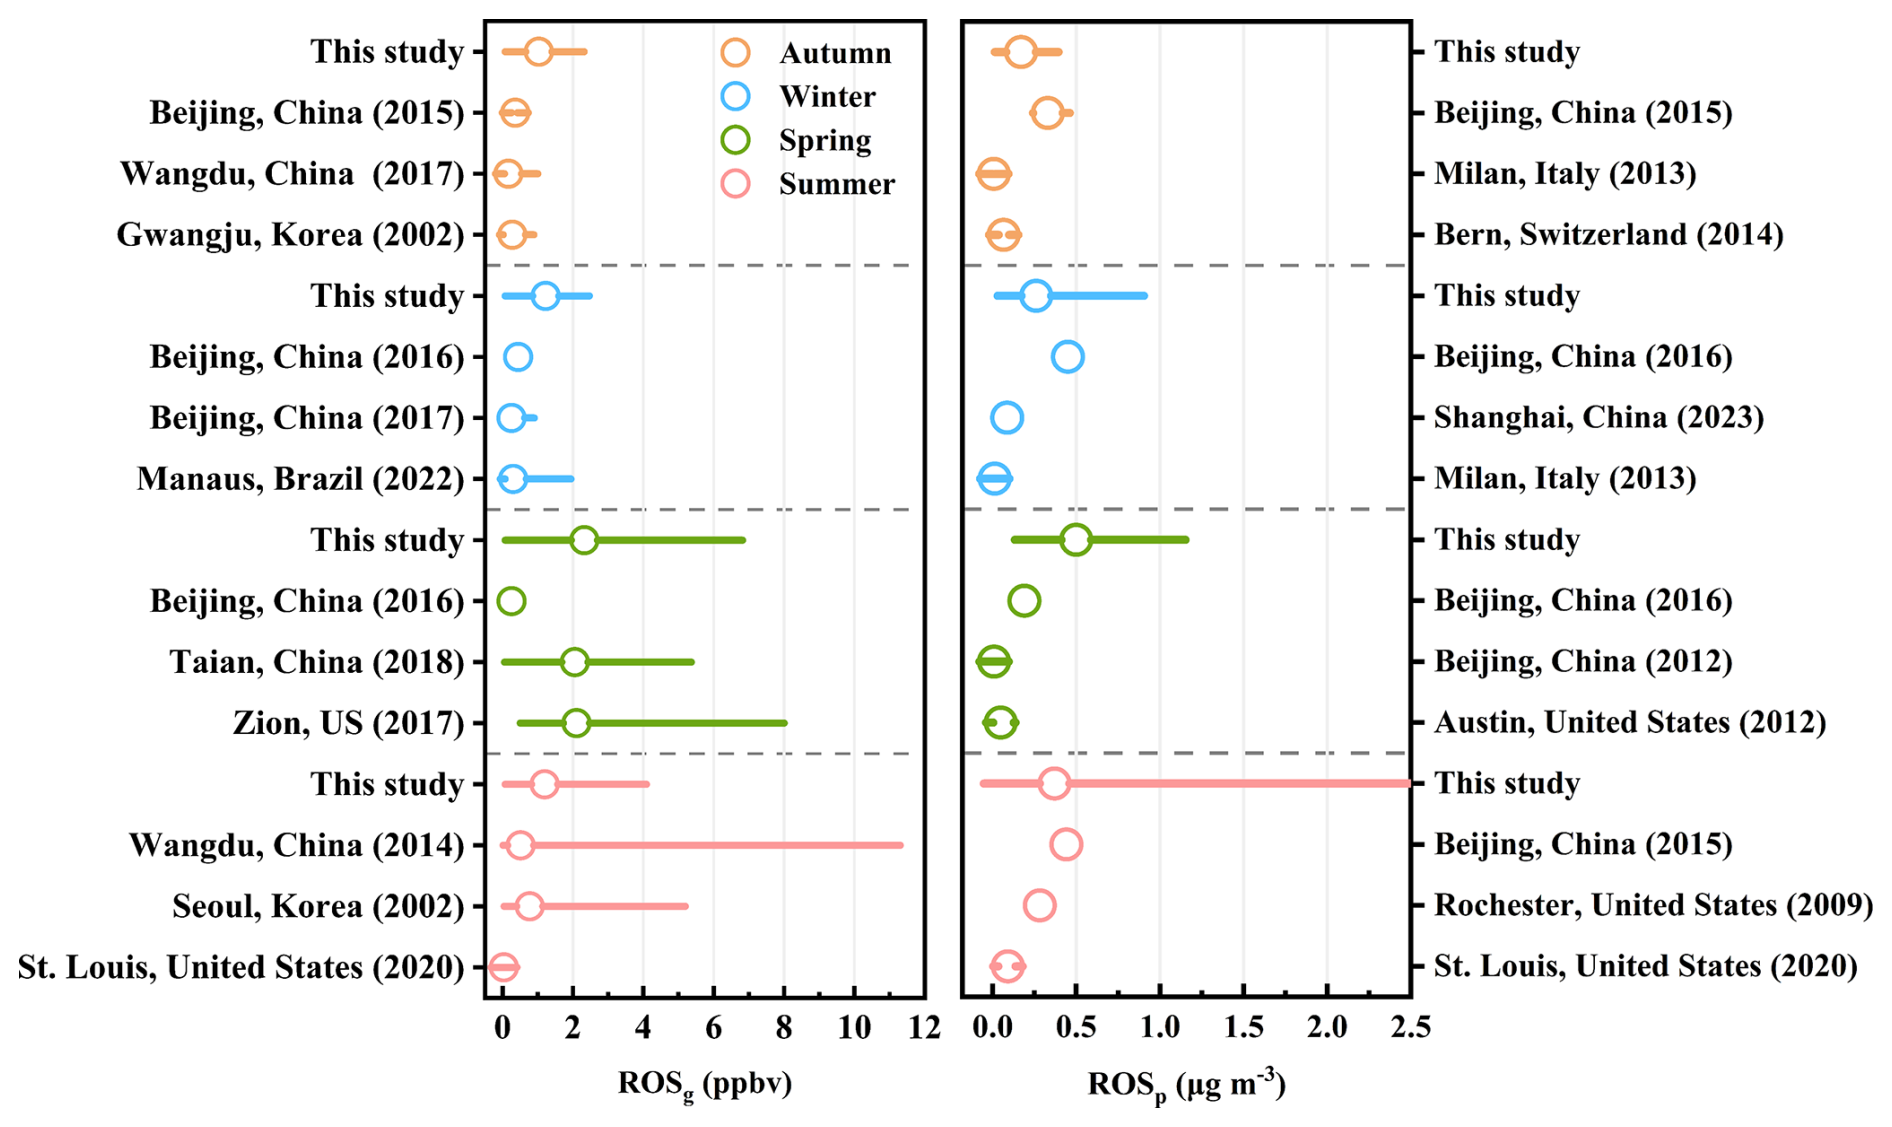
Figure 6Comparison of seasonal mean ROSg and ROSp concentrations observed in this study with those reported in previous field observations from different regions. Circles denote mean values, and horizontal lines denote the corresponding concentration ranges. All concentrations are expressed as H2O2 equivalents; literature data were converted to ppbv for ROSg and µg m−3 for ROSp where applicable. Detailed data sources are summarized in Table S3.
As summarized there, reported atmospheric ROS levels span a wide range across regions and seasons, although part of the gas-phase dataset used for comparison is derived from measurements of gaseous H2O2 alone. Within this observational context, the ROSg levels measured in this study are generally at the upper end of previously reported urban observations, whereas ROSp falls within the range of earlier measurements and remains at a moderate level relative to the most elevated reported values. Specifically, the seasonal-mean ROSg (1.03–2.28 ppbv) exceeds most reported values for urban Beijing and several other Asian sites, while remaining comparable to observations at photochemically active continental locations. In contrast, the seasonal-mean ROSp (0.17–0.50 µg m−3) is broadly comparable to previous urban measurements, but lower than the highest values reported for highly oxidized particulate environments. Overall, these comparisons indicate that the present observations were characterized by relatively elevated ROSg but moderate ROSp, highlighting a distinct phase-dependent distribution of atmospheric oxidative burden in urban Beijing.
In autumn, pollution was primarily characterized by PM2.5 accumulation under humid and weakly dispersive conditions. Compared with clean days, polluted days exhibited a near threefold increase in PM2.5 (94.88 vs. 33.45 µg m−3), accompanied by higher RH (78 % vs. 67 %) and lower wind speed (1.19 vs. 1.68 m s−1) (Table S2). These meteorological features favor pollutant accumulation and enhance multiphase processing, consistent with the elevated ROSg from 0.89 ppbv on CDs to 1.34 ppbv on PDs. By contrast, ROSp showed no corresponding increase (0.18 vs. 0.15 µg m−3), suggesting that particle-phase oxidative activity in autumn was not directly proportional to PM2.5 mass, but was instead constrained by the competing effects of ROS formation and depletion under humid, stagnant conditions (Campbell et al., 2021).
During winter, ROSg (1.22 ppbv) and ROSp (0.26 µg m−3) exceeded autumn despite weak photolysis, consistent with the seasonally highest SO2 and strengthened combustion-related emissions. Enhanced residential coal burning for heating can increase primary oxidant inputs and elevate the fractions of black carbon and redox-active metals in PM2.5. These components promote secondary inorganic production and provide abundant reactive surface area and condensed-phase microenvironments that facilitate heterogeneous and multiphase processing, thereby sustaining ROSp and indirectly supporting ROSg via gas-particle partitioning and multiphase recycling even under weak winter radiation (An et al., 2019; Song et al., 2024).
In spring, ROSg increased from 2.10 ppbv on CDs to 3.02 ppbv on PDs, accompanied by higher O3 (60.60–104.74 ppbv) and j(O1D) (– s−1), indicating an O3-driven photochemical regime. This seasonal maximum contrasts with previous rural Beijing observations, where spring ROS was lower than winter ROS under relatively clean, haze-free spring conditions, which limited haze-related precursor accumulation and radical formation (Huang et al., 2016). In the present urban observations, stronger spring photolysis and elevated O3 instead favored gas-phase ROS production, explaining why spring ROS exceeded winter levels. ROSp remained comparably high on CDs and PDs (0.50 µg m−3), suggesting that, once photochemistry was sufficiently active, particle oxidative activity could be sustained despite lower aerosol loading through continued production and uptake of peroxides and other semi-volatile oxidants and in-particle transformation pathways (Huang et al., 2016; Zhou et al., 2019).
Summer featured the strongest photochemical environment, with O3 approaching 80.35 ppbv and j(O1D) reaching about s−1. ROSg increased modestly from 1.04 to 1.29 ppbv from CDs to PDs, while ROSp showed a pronounced enhancement (0.27–0.46 µg m−3). High temperatures (∼302 K) enhance biogenic isoprene abundance (1.45 ppbv) and accelerate its oxidation kinetics, leading to increased ROx production (Wennberg et al., 2018). Meanwhile, isoprene-driven SOA formation supplies peroxide-rich and low-volatility products to particles, boosting ROSp concentration and yielding a larger ROSp response than ROSg (Zhou et al., 2019; Enami, 2021; Kroll et al., 2006).
4.3 Diurnal patterns of ROS under clean and polluted conditions
Across all seasons, the diurnal evolution of ROS reflected the combined influence of photochemical intensity, precursor availability, and boundary-layer dynamics, with clear contrasts between gas-phase and particle-phase behavior under clean (Fig. 7) and polluted conditions (Fig. 8). Overall, ROSg was primarily regulated by daytime photochemical production and nighttime regeneration, whereas ROSp integrated the cumulative effects of gas-particle partitioning of oxidized products and multiphase oxidation, leading to distinct phase-dependent diurnal responses. Figure 9 summarizes the covariation between ROS and key atmospheric species, with correlations of classified as weak associations.
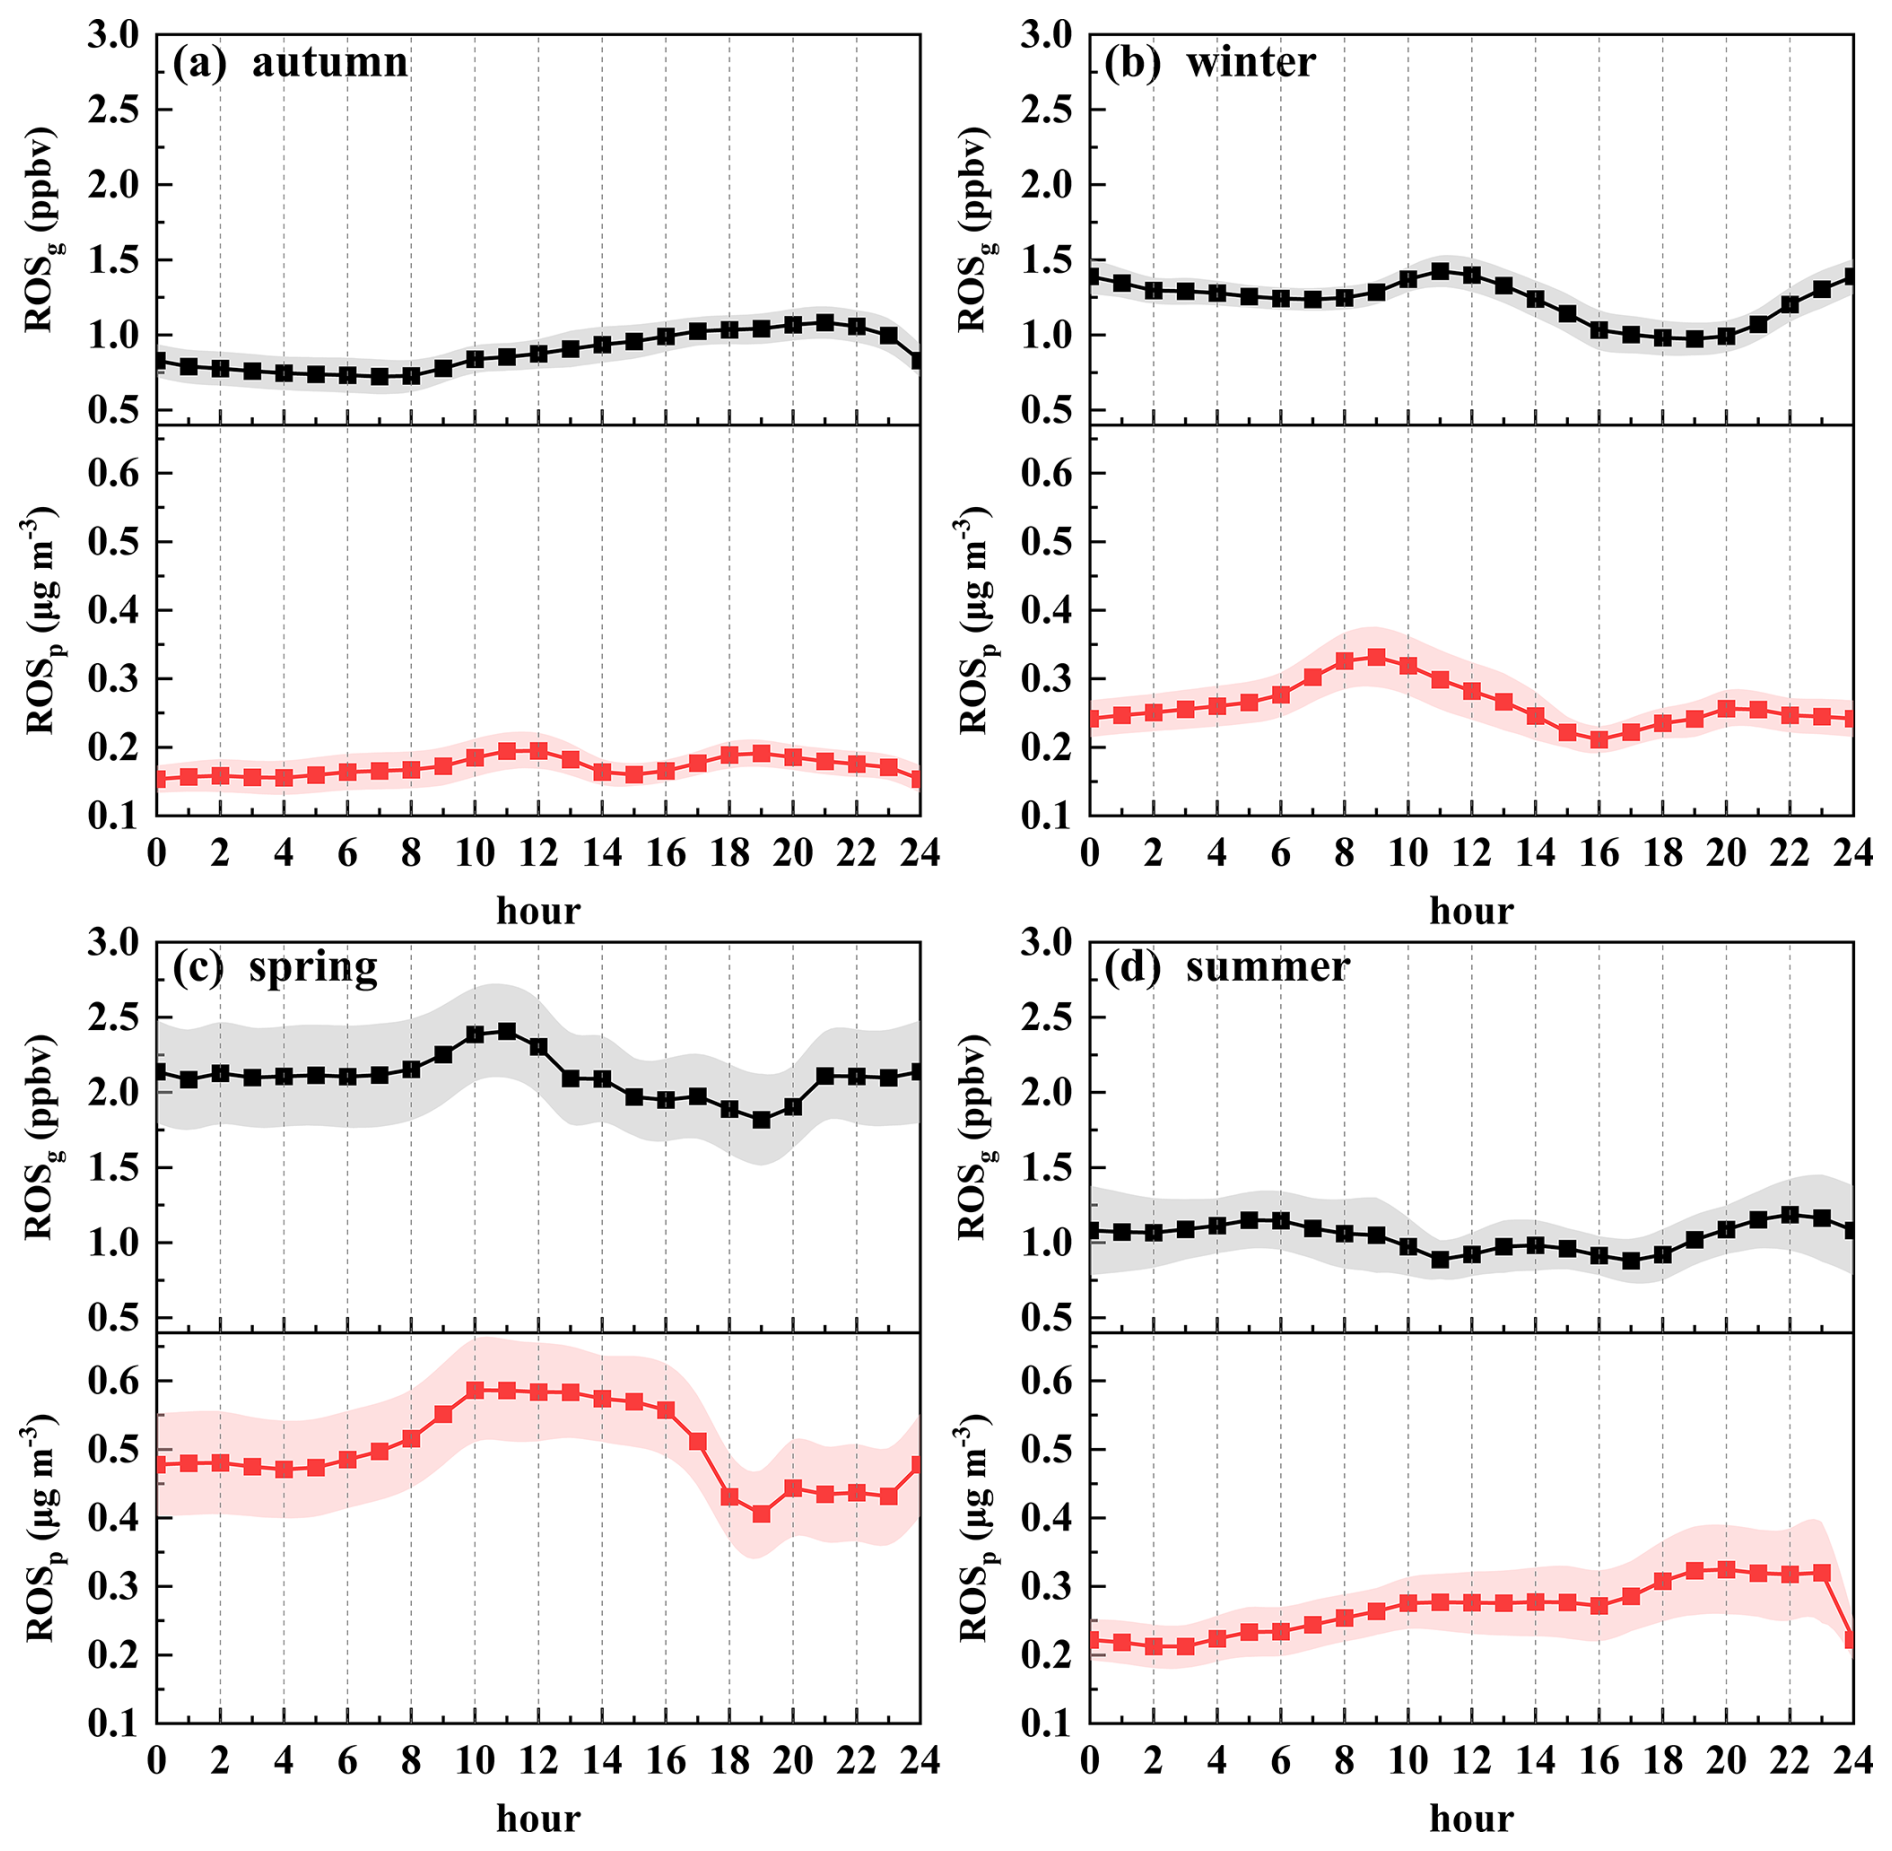
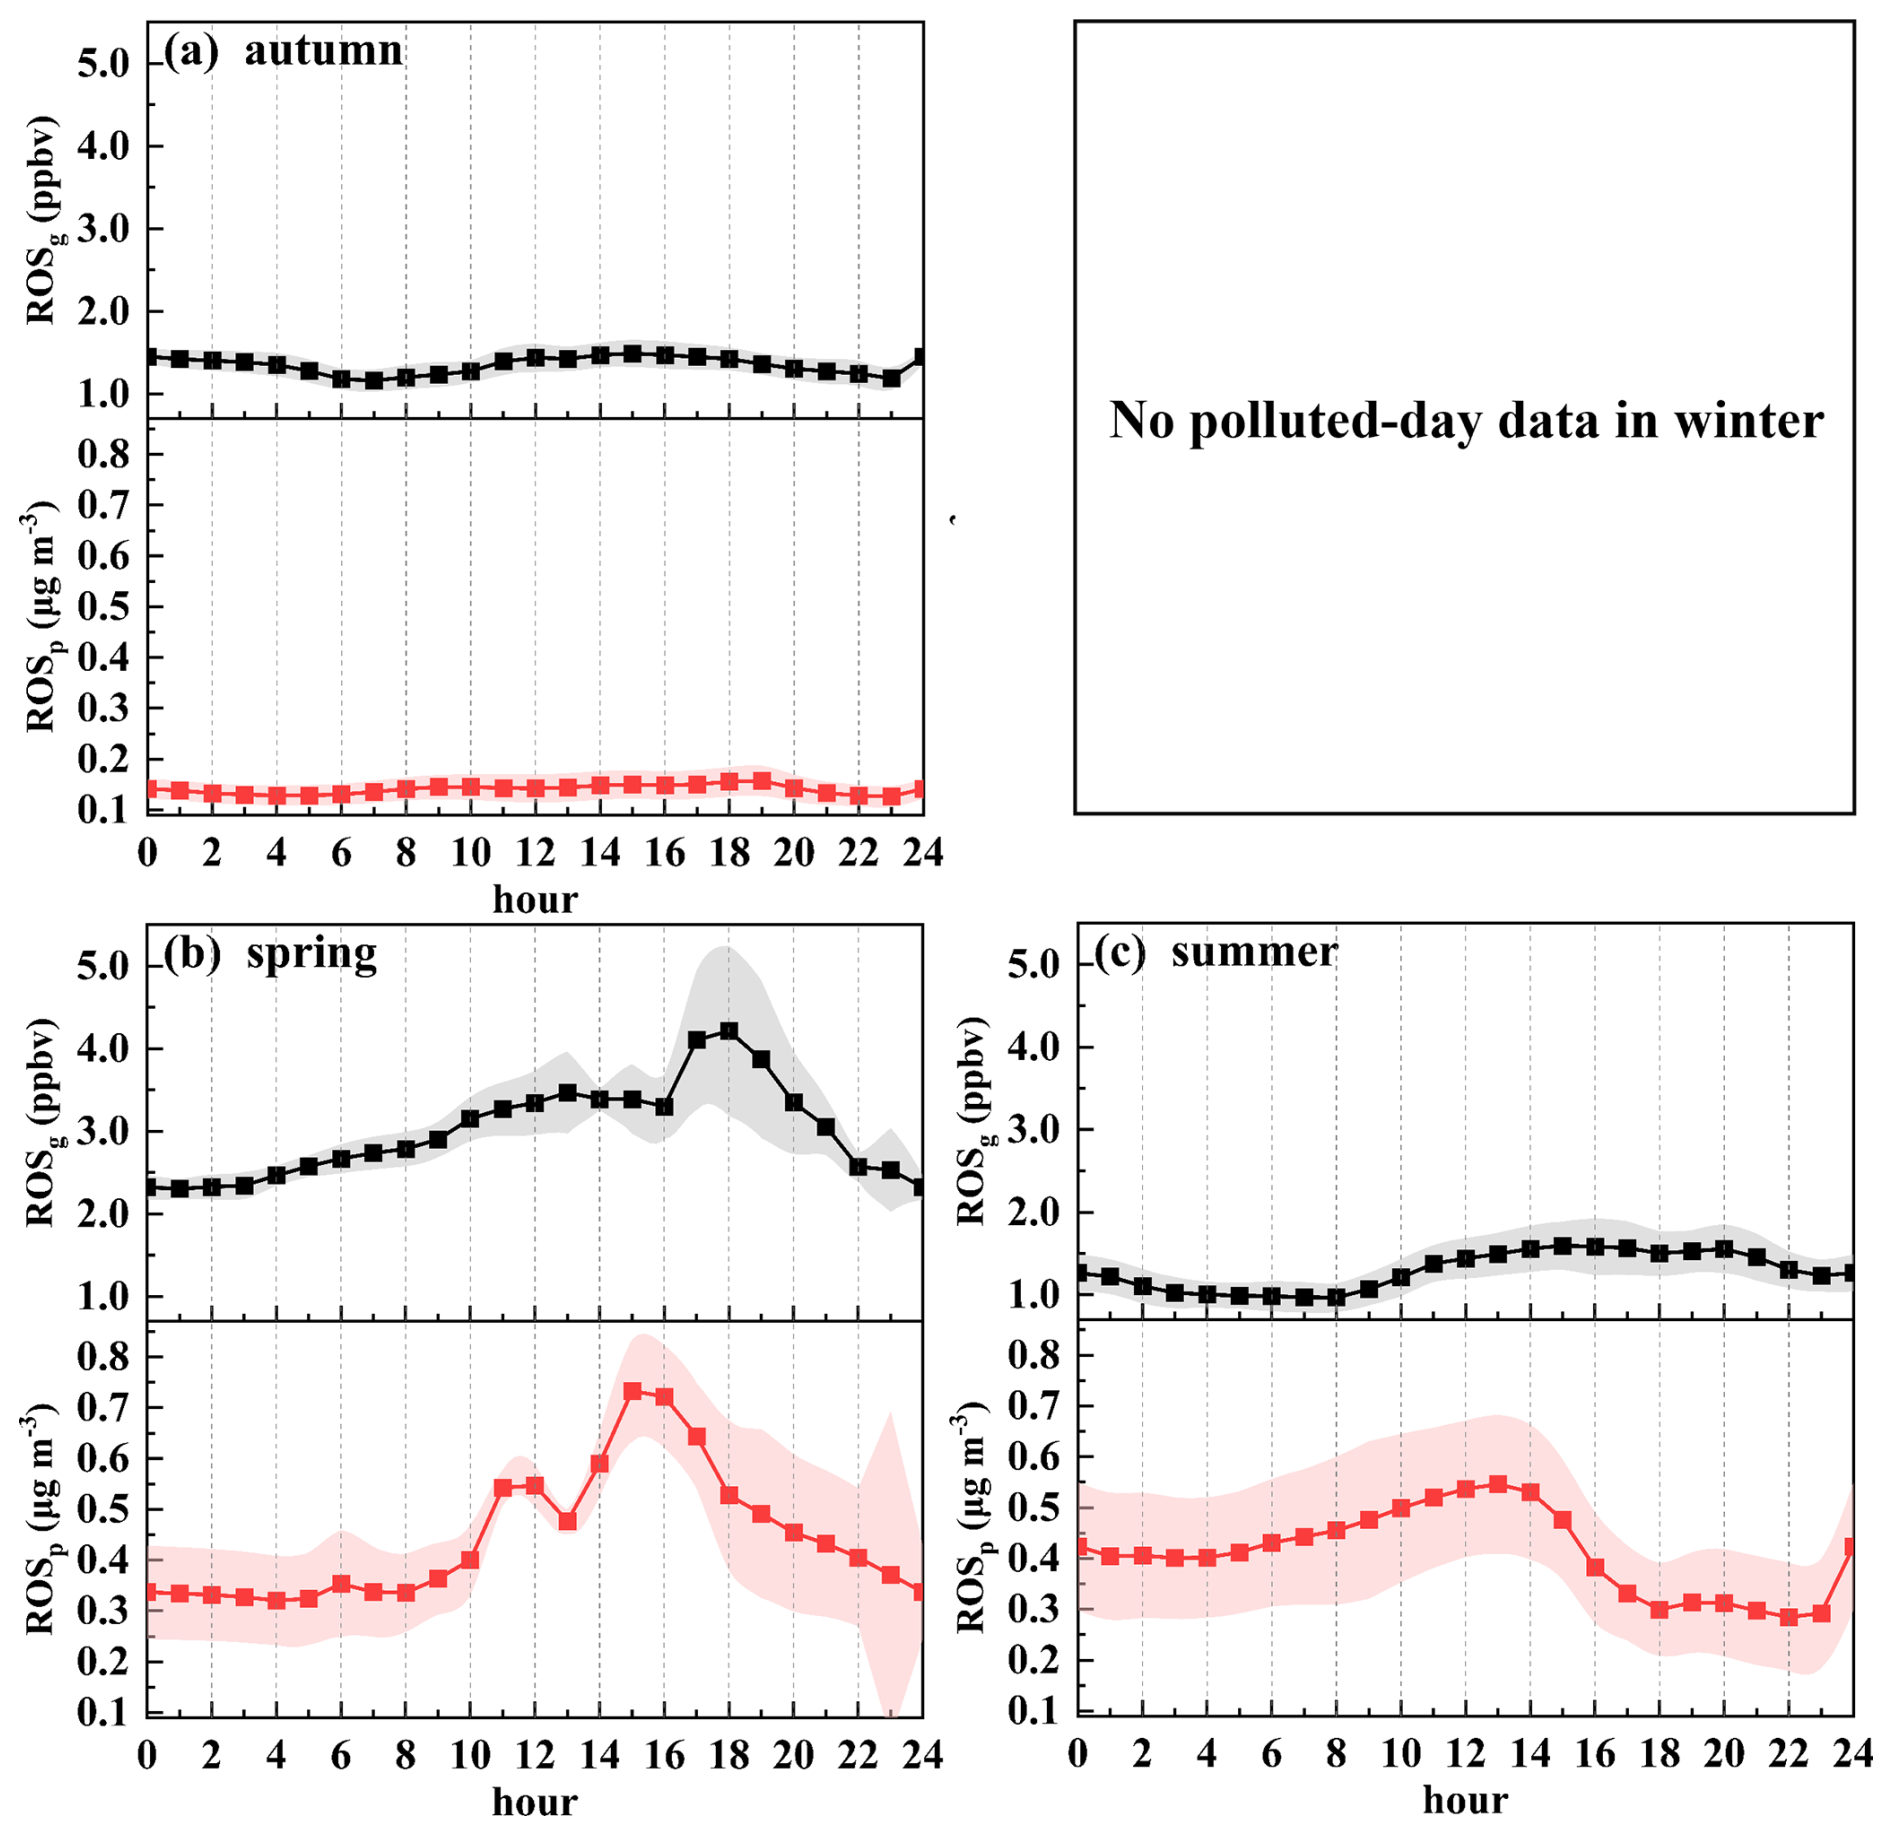
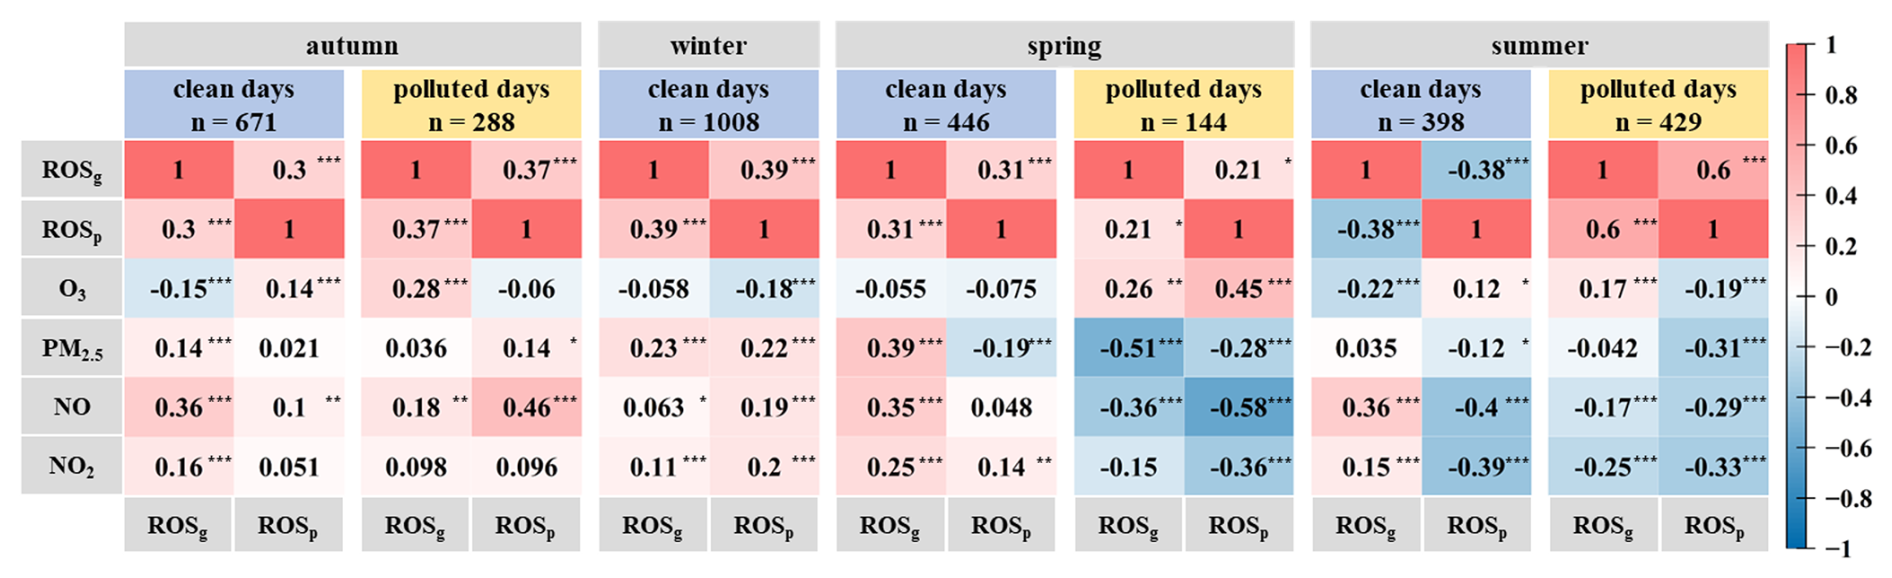
Figure 9Seasonal correlations of ROSg and ROSp with key atmospheric species under clean and polluted conditions in each season. The numbers above each seasonal panel denote the number of valid paired observations after removal of missing values. Asterisks denote statistical significance: ∗ p<0.05, p<0.01, and p<0.001; no asterisk indicates p≥0.05. Correlations with are classified as weak associations.
From late morning to early afternoon (08:00–15:00 local time (LT)), photochemical processes dominated ROS evolution. ROSg increased markedly with rising O3 and photolysis activity, reflecting rapid expansion of the daytime oxidative pool involving HOx-ROx radicals and peroxides (Stone et al., 2012; Nosaka and Nosaka, 2017; Liu et al., 2023). Under clean conditions, ROSg and ROSp exhibited distinct responses, particularly in autumn (Fig. 7a). ROSg showed only a weak negative association with O3 in clean autumn air () (Fig. 9), indicating that O3 alone did not explain ROSg variability. The deviation between ROSg and O3 is consistent with additional influences from titration and precursor limitation in relatively clean air masses. Meanwhile, reactions between O3 and alkenes may generate Criegee intermediates, promoting SOA formation and secondary ROS production (Chen et al., 2011; Yao et al., 2014). In contrast, ROSp generally peaked earlier than ROSg and showed a strong positive association with NO under clean autumn conditions (r=0.60) (Fig. 9), indicating close coupling with fresh NOx-influenced air masses. Under polluted conditions, daytime ROSp was more clearly decoupled from bulk particle loading. In polluted autumn (Fig. 8a), ROSp was only weakly associated with PM2.5 (r=0.28), indicating that bulk particle mass alone could not account for ROSp variability. This pattern points to a stronger influence of aerosol composition and secondary processing than by total particle mass, consistent with previous studies (Liu et al., 2023; Zhou et al., 2019; Huang et al., 2016). At the same time, the positive association between ROSp and NO weakened relative to clean conditions (r=0.46) (Fig. 9), indicating a reduced influence of fresh emissions and a greater contribution from secondary formation processes.
During the late afternoon and early evening (15:00–20:00 LT), seasonal contrasts became more pronounced. In spring polluted conditions (Fig. 8b), ROSg continued to increase until late afternoon, whereas ROSp declined after its midday maximum. In summer, ROSg generally peaked later in the day, whereas ROSp peaked earlier under polluted conditions (Fig. 8c) but remained relatively stable under clean conditions (Fig. 7d). Under clean summer conditions (Fig. 9), ROSp showed moderate negative correlations with NO () and NO2 (), indicating suppression of ROSp accumulation by fresh NOx, while ROSg was positively correlated with NO (r=0.36) and negatively correlated with O3 (), reflecting competition between titration and photochemical regeneration (Zhou et al., 2019; He et al., 2022). In autumn, the delayed ROSg maxima relative to O3, together with a weak positive association with PM2.5 under polluted conditions (r=0.28) (Fig. 9), indicate that ROSg variability was not controlled by photochemistry alone. Gas-particle coupling, boundary-layer evolution, and O3-alkene reactions may have jointly contributed to sustaining oxidative capacity after peak photochemistry (Wang et al., 2023b). In winter, declining ROSg and weakly rebounding ROSp in the evening, together with a weak positive association between ROSp and PM2.5 (r=0.22) (Fig. 9), are consistent with an increasing contribution from heterogeneous and multiphase processes as photochemical activity wanes (Xue et al., 2022).
From evening through early morning (20:00–08:00 LT), boundary-layer stabilization favored nocturnal accumulation and phase repartitioning, while oxidant production was increasingly regulated by nighttime chemistry and post-sunrise reactivation. In autumn polluted conditions (Fig. 8a), ROSp typically reached an early-evening maximum and then remained elevated, whereas ROSg declined after dusk but rebounded toward midnight; this nocturnal increase is plausibly linked to NO3-driven oxidation, peroxide decomposition, and ozonolysis of alkenes, which can sustain nighttime radical recycling and replenish the gas-phase oxidative pool (Venkatachari and Hopke, 2008). Under clean winter and spring conditions (Fig. 7b and c), ROSg showed weak nocturnal variability, while ROSp generally decreased in colder seasons but persisted or increased in summer despite weak PM2.5 dependence (r=0.12) (Fig. 9), suggesting that bulk particle loading was not the primary driver of ROSp variability. This behavior is compatible with continued multiphase ROS formation and aerosol aging under weak nocturnal photochemical forcing (Brown and Stutz, 2012; Wang et al., 2023a). After midnight, ROSg in autumn continued to decrease toward sunrise under both clean (Fig. 7a) and polluted conditions (Fig. 8a), and under clean conditions it tracked NO (r=0.36) (Fig. 9), implying precursor-driven background control under weak radiation (King and Weber, 2013; Nan et al., 2017). Under clean winter conditions, ROSg showed limited variability and only weak associations with NO and NO2 (r=0.06–0.11), while ROSp also exhibited a weak positive association with PM2.5 (r=0.22) (Fig. 9). Together with the nocturnal persistence of ROSp, this pattern is consistent with a contribution from heterogeneous and aqueous-phase oxidation (Liu et al., 2023; Campbell et al., 2021). In spring and summer, ROSg more frequently rebounded or increased in the early morning, particularly under polluted conditions, suggesting enhanced oxidative activity after sunrise.
4.4 Variations of ROS during typical pollution episodes
Based on the time series (Fig. 10) and clustered back trajectories (Fig. S5), the three representative episodes can be classified into two contrasting ROS regimes: an aerosol water-driven multiphase regime in autumn and photochemically driven oxidation regimes in spring and summer. Across all episodes, ROSg generally increased during pollution development, whereas ROSp showed episode-dependent behavior. Aerosol liquid water content (ALWC) and particle pH estimated by ISORROPIA-II provide a consistent thermodynamic framework for interpreting the coupled evolution of aerosol water, acidity, and semi-volatile partitioning (Fountoukis and Nenes, 2007). The HYSPLIT back trajectories further suggest seasonally distinct transport patterns that modulated precursor supply and ventilation efficiency, thereby influencing ROS formation and removal (Stein et al., 2015; Draxler and Hess, 1998, 1997).
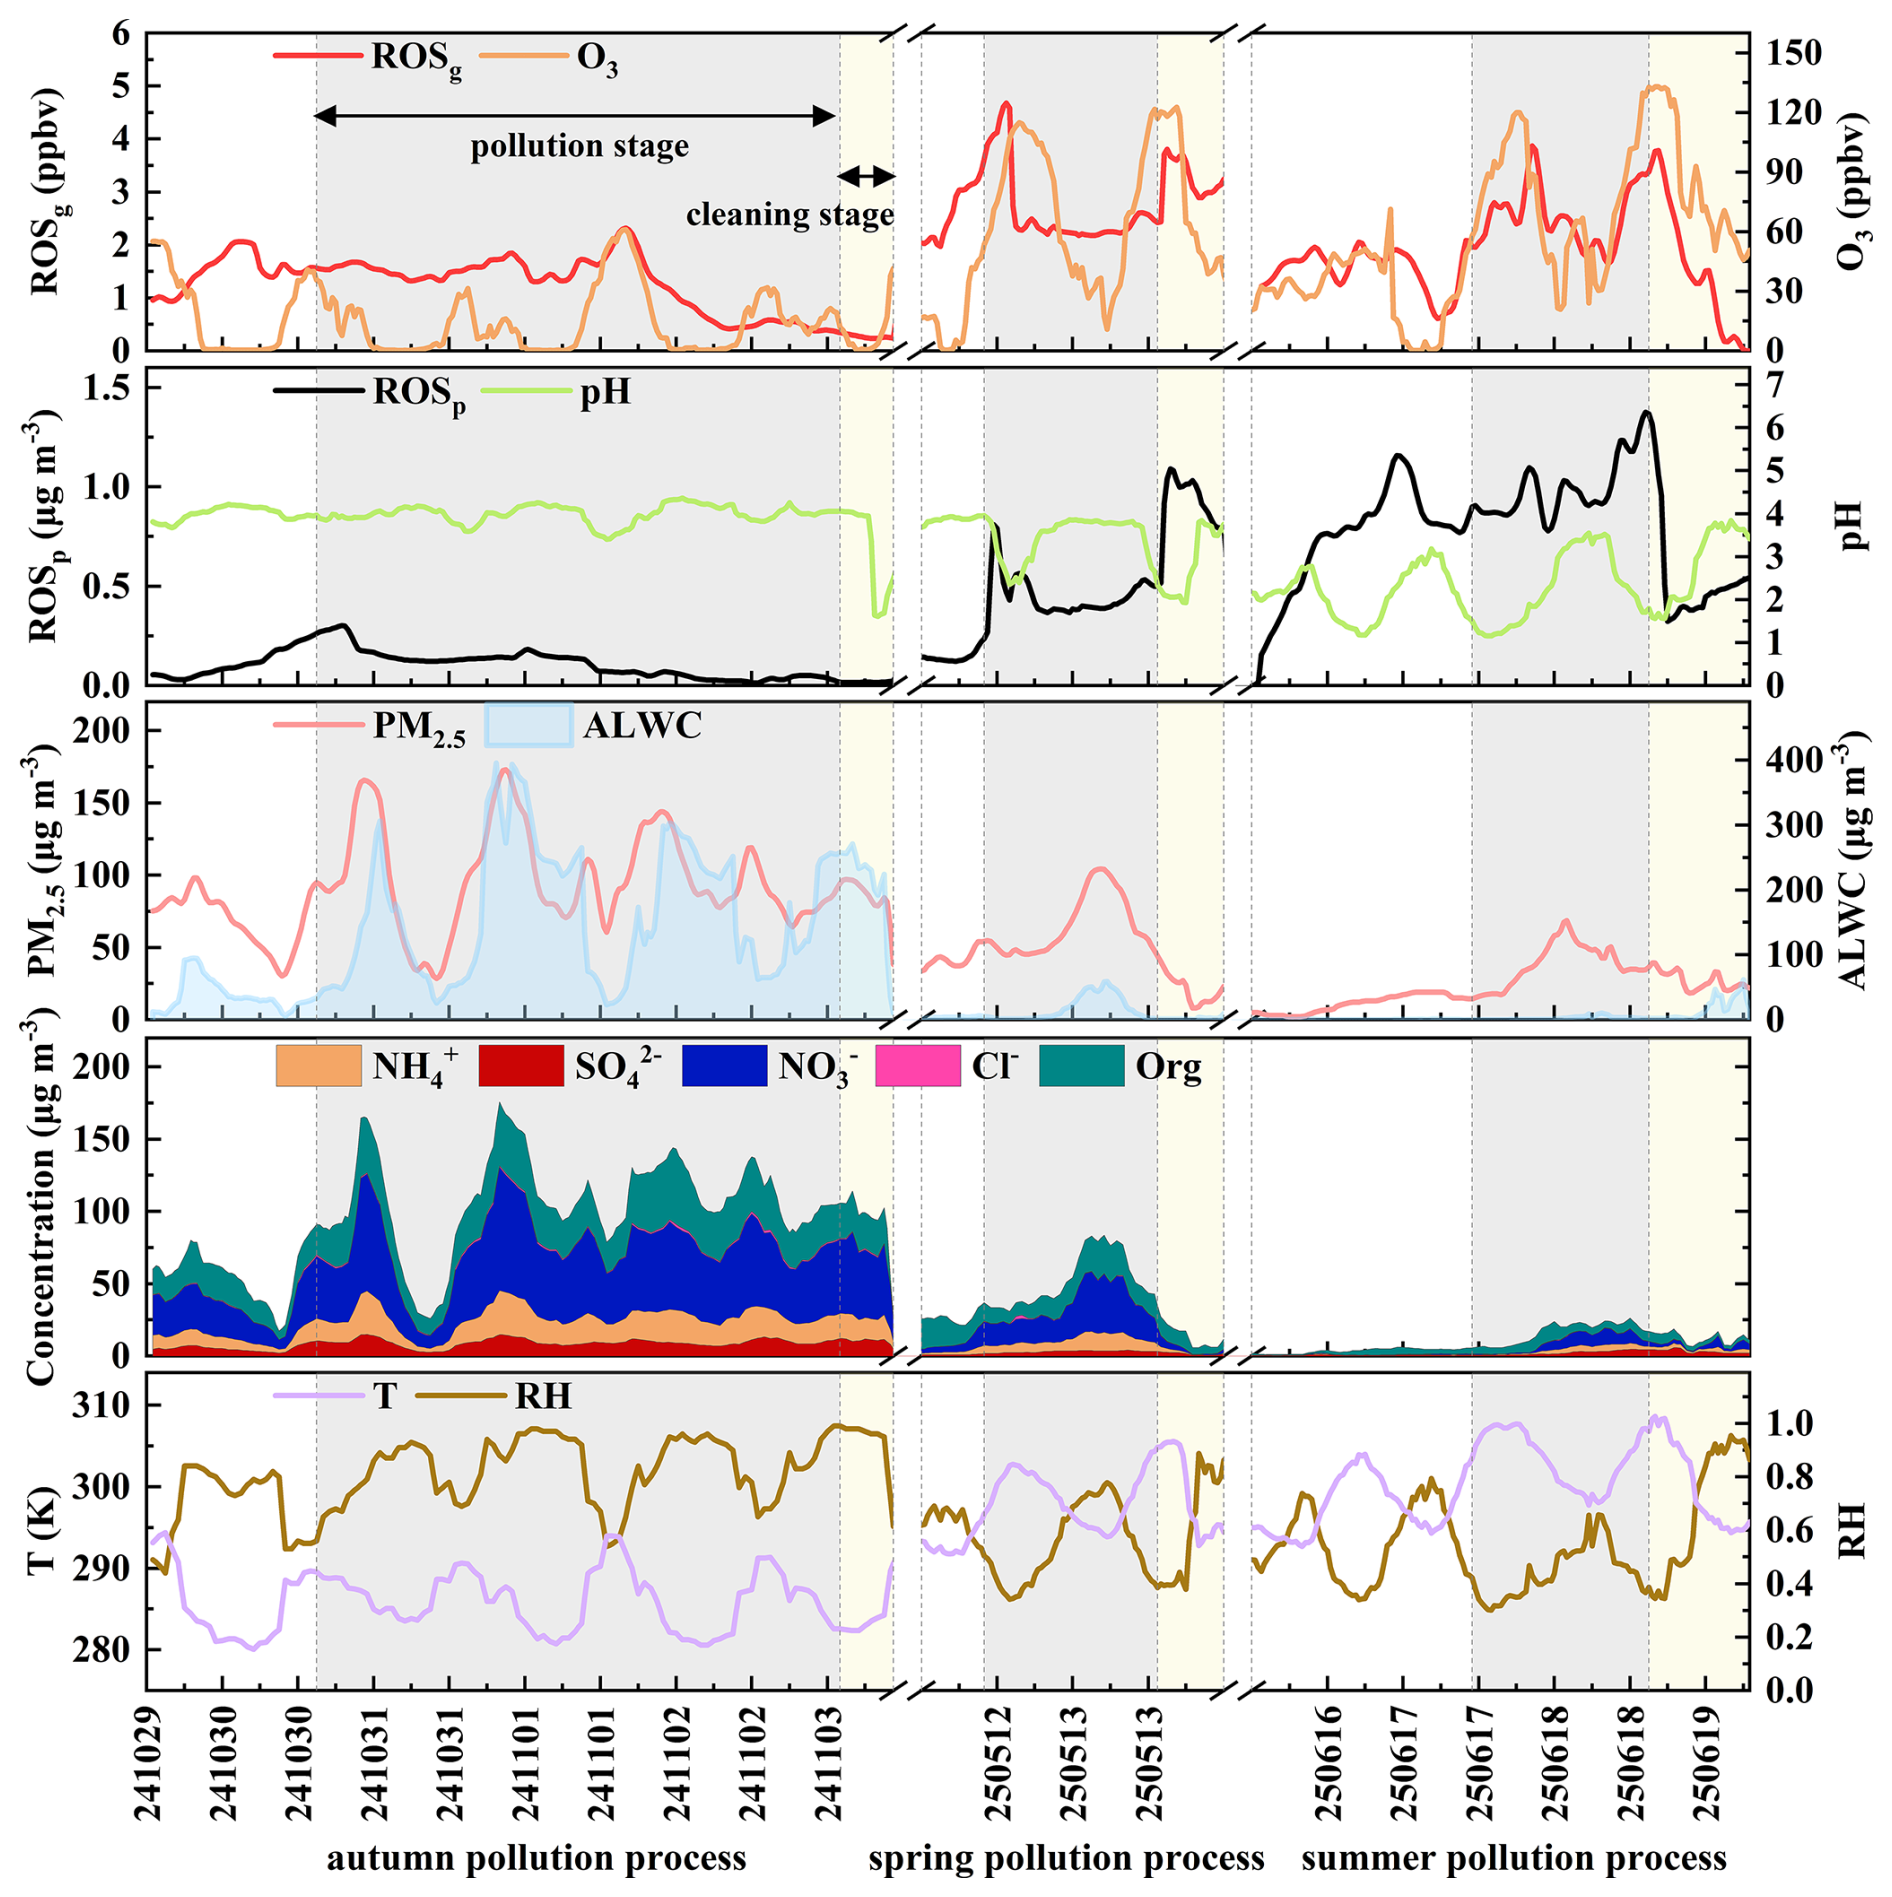
The autumn episode was characterized by PM2.5-dominated pollution, with the highest ALWC and the strongest coupling of PM2.5 with aerosol water and secondary inorganic aerosols, especially nitrate (Fig. 10). During this period, ROSg increased modestly from 0.89 to 1.34 ppbv, whereas ROSp slightly decreased from 0.18 to 0.15 µg m−3, and both remained lower than in spring and summer (Table S2). This indicates that the event was governed mainly by hygroscopic growth and nitrate accumulation, rather than by strong oxidative ROS production. High RH and ALWC favor heterogeneous N2O5 hydrolysis and HNO3 partitioning, promoting rapid nitrate build-up and aerosol mass enhancement (Liu et al., 2020; Zang et al., 2022). However, weak autumn photochemistry and efficient radical termination under high- conditions likely limited peroxide formation and suppressed ROSg accumulation (Tan et al., 2018; Ye et al., 2025). Meanwhile, elevated aerosol water may also accelerate multiphase peroxide loss and organic peroxide decomposition, preventing ROSp from increasing despite substantial particle growth (Xuan et al., 2020). Thus, autumn represents a high-mass but weakly oxidative regime, where nitrate-water amplification outweighed ROS production. Trajectory clustering indicates that polluted days were dominated by westerly air masses (∼41 %), with additional southerly (∼28 %) and easterly (∼16 %) influence (Fig. S5a), consistent with regionally confined transport and limited ventilation over the Beijing-Hebei region. During the clean-up stage, the airflow shifted toward more ventilated northerly (∼43 %) and southwesterly (∼24 %) pathways (Fig. S5b), favoring pollutant dispersion and the decline of ROS.
The spring pollution episode was an O3-dominated event, with mean O3 reaching 104.74 ppbv, while ALWC and secondary inorganic aerosol levels were lower than in autumn (Fig. 10). In contrast to autumn, ROSg increased markedly from 2.10 to 3.02 ppbv, whereas ROSp remained relatively stable at about 0.50 µg m−3 (Table S2). This pattern indicates that spring pollution was controlled mainly by intensified gas-phase photochemistry rather than aerosol aqueous processing. High-O3 conditions generally reflect strong atmospheric oxidation capacity, sustained by O3 photolysis, HONO photolysis, and active HOx cycling, all of which favor the formation of peroxides and other ROSg (Tan et al., 2019; Ye et al., 2025). The limited change in ROSp indicates that ROSp was less sensitive to oxidant abundance alone and more constrained by aerosol composition and SOA aging processes (Zhou et al., 2019). Therefore, spring can be interpreted as a photochemically active gas-phase oxidation regime, characterized by efficient ROSg production but only moderate ROSp enhancement. Spring trajectories were dominated by southerly to southeasterly transport (∼81 %), with minor northeasterly (∼9 %) and westerly (∼8 %) contributions (Fig. S5c), indicating persistent precursor import from the North China Plain. During the clean-up stage, the contribution of northwesterly and northerly inflow increased (∼24 % and ∼23 %), while the southern sector decreased to ∼28 % (Fig. S5d), consistent with weaker precursor supply, stronger ventilation, and the coherent decline of O3 and ROS.
Summer showed the clearest decoupling between aerosol mass and ROS behavior (Fig. 10). Although PM2.5 varied only slightly (23.5–27.5 µg m−3), and both ALWC and secondary inorganic ions were the lowest of the three seasons, ROSp increased substantially from 0.27 to 0.46 µg m−3, whereas ROSg rose only slightly from 1.04 to 1.29 ppbv (Table S2). This pattern suggests that summertime ROS chemistry was controlled mainly by photochemical aging of organic aerosol rather than by bulk particle loading. Strong radiation and high temperature enhance VOCs oxidation and O3 formation, promoting the generation of more oxidized organic aerosol that can sustain elevated ROSp even under relatively low PM and inorganic ion levels (Zhou et al., 2019; Zhu et al., 2020). More acidic summer aerosols may further facilitate acid-catalyzed SOA processing and associated ROSp formation (Wei et al., 2022). In addition, intense solar radiation can activate photo-initiated heterogeneous pathways that further enhance particle oxidative activity. Laboratory studies have demonstrated that visible-light irradiation of soot microstructures can directly generate ROS on particle surfaces, providing an additional photochemical source of ROSp in strongly illuminated environments (Zhu et al., 2021). By contrast, the modest increase in ROSg indicates rapid turnover rather than substantial accumulation of ROSg in summer. With strong photochemistry and relatively low PM2.5, oxidation was manifested more in efficient O3 production and continued aerosol aging than in a pronounced enhancement of ROSg. In this sense, summer represents an O3-rich and organic-oxidation-dominated regime, where aerosol composition, together with enhanced acidity, rather than aerosol mass, played the key role in determining ROSp. Trajectory clusters show that polluted days were dominated by northerly transport (Fig. S5e), suggesting the influence of photochemically aged, O3-enriched air masses under weak NO titration. During the clean-up stage, southeasterly inflow became dominant, led by a maritime branch (∼32 %) and additional southeast pathways (∼23 %) (Fig. S5f), providing cleaner ventilation and driving the rapid decline of O3 and ROS.
This study developed an integrated online analyzer for synchronous quantification of ROSg and ROSp, reported as H2O2-equivalent concentrations. It employs phase-resolved, mild wet-chemical sampling: ROSg is absorbed via a glass spiral absorption tube, while ROSp is collected after gas stripping by a rotating wet denuder, using an ambient-temperature spray growth collection chamber to prevent thermal decomposition. The analysis is performed via online mixing with DCFH and HRP reagents, where HRP catalyzes ROS oxidation of DCFH to fluorescent DCF. Fluorescence intensity (470/520 nm) is measured by a compact LED-PMT module, with data acquired in real-time via a LabVIEW system. The instrument achieved high stability (RSD 0.37 % over 10 h), rapid response (T90=7 min), low detection limits (0.07 ppbv for ROSg; 0.007 µg m−3 for ROSp), robust linearity (y≈0.1x, R2 = 0.99), and good reproducibility (RSD 0.57 %, n = 10).
Four-season observations in Beijing showed that ROS variability was strongly controlled by pollution regime and photochemical intensity. Seasonal mean ROSg and ROSp both peaked in spring and were lowest in autumn. In humid, PM2.5-dominated autumn haze, high aerosol water and secondary inorganic accumulation were accompanied by only limited ROS enhancement, implying that condensed-phase turnover and loss restricted net ROSp buildup. By contrast, O3-driven spring and summer pollution promoted stronger photochemistry, tighter gas-particle coupling, and concurrent increases in ROSg and ROSp, with summer showing especially strong particle-phase enhancement. The coherent decline of both phases during clean-up stages further indicates that ROS provides a sensitive indicator of coupled changes in oxidant production, partitioning, transport, and removal.
These findings demonstrate the capability of the analyzer to resolve phase-dependent ROS variability under contrasting urban pollution regimes, while their interpretation should remain within the operational scope of the method. Specifically, the DCFH-HRP assay reports H2O2-equivalent ROS with species-dependent responses, rather than molecule-specific or total atmospheric ROS. Direct interference tests showed that NO caused negligible bias, whereas elevated SO2 and Fe2+ could introduce negative interferences. The environmentally representative mixed-interferent condition produced only a small bias close to or below the instrumental detection limits, indicating that the quantified interference was unlikely to affect the field interpretation. Nevertheless, high-SO2 or Fe-rich environments may lead to ROS underestimation and should be further evaluated. In addition, the ROSp collection efficiency was determined from triplicate recovery experiments under actual ambient aerosol sampling conditions; its potential dependence on particle loading, hygroscopic growth, aerosol chemical composition, and extended field operation should be further evaluated in future applications.
Data related to this article are available online at https://doi.org/10.5281/zenodo.20660538 (Wang, 2026).
The supplement related to this article is available online at https://doi.org/10.5194/amt-19-4721-2026-supplement.
Yihui Wang: development of the ROS analyzer, conceptualization, formal analysis, investigation, methodology, writing (original draft preparation), writing (review and editing); Huan Song: formal analysis, investigation, methodology; Huabin Dong: investigation, methodology; Shiyi Chen: investigation, methodology; Linghan Zeng: conceptualization, investigation, methodology, writing (review and editing); Keding Lu: conceptualization, funding acquisition, project administration, writing (review and editing).
At least one of the (co-)authors is a member of the editorial board of Atmospheric Measurement Techniques. The peer-review process was guided by an independent editor, and the authors also have no other competing interests to declare.
Publisher's note: Copernicus Publications remains neutral with regard to jurisdictional claims made in the text, published maps, institutional affiliations, or any other geographical representation in this paper. The authors bear the ultimate responsibility for providing appropriate place names. Views expressed in the text are those of the authors and do not necessarily reflect the views of the publisher.
The authors thank the Ensembled Experiments of Atmospheric Oxidation Capacity in the Troposphere (EXACT) observation team for their support during the field campaign, especially Zhaofeng Tan, Yuanjun Gong, and Xuefei Ma for their assistance with field observations and data collection.
This research has been supported by the National Natural Science Foundation of China (grant nos. 22325601, 42475110, and 22406003).
This paper was edited by Bin Yuan and reviewed by two anonymous referees.
Abdulaal, W. H., Almulaiky, Y. Q., and El-Shishtawy, R. M.: Encapsulation of HRP enzyme onto a magnetic Fe3O4 Np–PMMA film via casting with sustainable biocatalytic activity, Catalysts, 10, 181, https://doi.org/10.3390/catal10020181, 2020.
Allegrini, I., De Santis, F., Di Palo, V., Febo, A., Perrino, C., Possanzini, M., and Liberti, A.: Annular denuder method for sampling reactive gases and aerosols in the atmosphere, Sci. Total Environ., 67, 1–16, https://doi.org/10.1016/0048-9697(87)90062-3, 1987.
An, Z., Huang, R.-J., Zhang, R., Tie, X., Li, G., Cao, J., Zhou, W., Shi, Z., Han, Y., and Gu, Z.: Severe haze in northern China: A synergy of anthropogenic emissions and atmospheric processes, P. Natl. Acad. Sci. USA, 116, 8657–8666, https://doi.org/10.1073/pnas.1900125116, 2019.
Bates, J. T., Weber, R. J., Abrams, J., Verma, V., Fang, T., Klein, M., Strickland, M. J., Sarnat, S. E., Chang, H. H., and Mulholland, J. A.: Reactive oxygen species generation linked to sources of atmospheric particulate matter and cardiorespiratory effects, Environ. Sci. Technol., 49, 13605–13612, https://doi.org/10.1021/acs.est.5b02967, 2015.
Bielski, B. H., Shiue, G. G., and Bajuk, S.: Reduction of nitro blue tetrazolium by and radicals, J. Phys. Chem., 84, 830–833, https://doi.org/10.1021/j100445a006, 1980.
Birks, J.: Fluorescence quantum yield measurements, J. Res. NBS A Phys. Ch., 80, 389, https://doi.org/10.6028/jres.080A.038, 1976.
Brown, S. S. and Stutz, J.: Nighttime radical observations and chemistry, Chem. Soc. Rev., 41, 6405–6447, https://doi.org/10.1039/C2CS35181A, 2012.
Campbell, S. J., Wolfer, K., Utinger, B., Westwood, J., Zhang, Z.-H., Bukowiecki, N., Steimer, S. S., Vu, T. V., Xu, J., Straw, N., Thomson, S., Elzein, A., Sun, Y., Liu, D., Li, L., Fu, P., Lewis, A. C., Harrison, R. M., Bloss, W. J., Loh, M., Miller, M. R., Shi, Z., and Kalberer, M.: Atmospheric conditions and composition that influence PM2.5 oxidative potential in Beijing, China, Atmos. Chem. Phys., 21, 5549–5573, https://doi.org/10.5194/acp-21-5549-2021, 2021.
Campos, T. L. and Kok, G. L.: Evaluation of Horibe traps for cryogenic collection of hydrogen peroxide and methyl hydroperoxide, Atmos. Environ., 30, 2575–2582, https://doi.org/10.1016/1352-2310(95)00446-7, 1996.
Charrier, J. G. and Anastasio, C.: On dithiothreitol (DTT) as a measure of oxidative potential for ambient particles: evidence for the importance of soluble transition metals, Atmos. Chem. Phys., 12, 9321–9333, https://doi.org/10.5194/acp-12-9321-2012, 2012.
Chen, X., Hopke, P. K., and Carter, W. P.: Secondary organic aerosol from ozonolysis of biogenic volatile organic compounds: chamber studies of particle and reactive oxygen species formation, Environ. Sci. Technol., 45, 276–282, https://doi.org/10.1021/es102166c, 2011.
D'Errico, G., Vitiello, G., De Tommaso, G., Abdel-Gawad, F. K., Brundo, M. V., Ferrante, M., De Maio, A., Trocchia, S., Bianchi, A. R., and Ciarcia, G.: Electron Spin Resonance (ESR) for the study of Reactive Oxygen Species (ROS) on the isolated frog skin (Pelophylax bergeri): A non-invasive method for environmental monitoring, Environ. Res., 165, 11–18, https://doi.org/10.1016/j.envres.2018.03.044, 2018.
Dong, H.-B., Zeng, L.-M., Hu, M., Wu, Y.-S., Zhang, Y.-H., Slanina, J., Zheng, M., Wang, Z.-F., and Jansen, R.: Technical Note: The application of an improved gas and aerosol collector for ambient air pollutants in China, Atmos. Chem. Phys., 12, 10519–10533, https://doi.org/10.5194/acp-12-10519-2012, 2012.
Draxler, R. R. and Hess, G. D.: Description of the HYSPLIT4 modeling system, NOAA Technical Memorandum ERL ARL-224, Air Resources Laboratory, National Oceanic and Atmospheric Administration, Silver Spring, Maryland, USA, 27 pp., https://repository.library.noaa.gov/view/noaa/31133 (last access: 21 July 2026), 1997.
Draxler, R. R. and Hess, G.: An overview of the HYSPLIT_4 modelling system for trajectories, Aust. Meteorol. Mag., 47, 295–308, https://doi.org/10.1071/ES98032, 1998.
Eftekhari, A., Fortenberry, C. F., Williams, B. J., Walker, M. J., Dang, A., Pfaff, A., Ercal, N., and Morrison, G. C.: Continuous measurement of reactive oxygen species inside and outside of a residential house during summer, Indoor Air, 31, 1199–1216, https://doi.org/10.1111/ina.12789, 2021.
Enami, S.: Fates of organic hydroperoxides in atmospheric condensed phases, J. Phys. Chem. A, 125, 4513–4523, https://doi.org/10.1021/acs.jpca.1c01513, 2021.
Ervens, B., Herckes, P., Feingold, G., Lee, T., Collett, J., and Kreidenweis, S.: On the drop-size dependence of organic acid and formaldehyde concentrations in fog, J. Atmos. Chem., 46, 239–269, https://doi.org/10.1023/A:1026393805907, 2003.
Fountoukis, C. and Nenes, A.: ISORROPIA II: a computationally efficient thermodynamic equilibrium model for K+–Ca2+–Mg2+––Na+–––Cl−–H2O aerosols, Atmos. Chem. Phys., 7, 4639–4659, https://doi.org/10.5194/acp-7-4639-2007, 2007.
Fuchs, H., Holland, F., and Hofzumahaus, A.: Measurement of tropospheric RO2 and HO2 radicals by a laser-induced fluorescence instrument, Rev. Sci. Instrum., 79, 084104, https://doi.org/10.1063/1.2968712, 2008.
Fuller, S., Wragg, F., Nutter, J., and Kalberer, M.: Comparison of on-line and off-line methods to quantify reactive oxygen species (ROS) in atmospheric aerosols, Atmos. Environ., 92, 97–103, https://doi.org/10.1016/j.atmosenv.2014.04.006, 2014.
George, I., Matthews, P., Whalley, L., Brooks, B., Goddard, A., Baeza-Romero, M., and Heard, D.: Measurements of uptake coefficients for heterogeneous loss of HO2 onto submicron inorganic salt aerosols, Phys. Chem. Chem. Phys., 15, 12829–12845, https://doi.org/10.1039/C3CP51831K, 2013.
Guo, X., Gong, D., Li, J., Mo, X., Ding, X., Chen, J., Chen, X., Li, X., He, Y., and Wang, L.: Comprehensive measurement of carbonyls in Lhasa, Tibetan Plateau: Implications for strong atmospheric oxidation capacity, Sci. Total Environ., 948, 174626, https://doi.org/10.1016/j.scitotenv.2024.174626, 2024.
He, C., Lu, X., Wang, H., Wang, H., Li, Y., He, G., He, Y., Wang, Y., Zhang, Y., Liu, Y., Fan, Q., and Fan, S.: The unexpected high frequency of nocturnal surface ozone enhancement events over China: characteristics and mechanisms, Atmos. Chem. Phys., 22, 15243–15261, https://doi.org/10.5194/acp-22-15243-2022, 2022.
Hellpointner, E. and Gäb, S.: Detection of methyl, hydroxymethyl and hydroxyethyl hydroperoxides in air and precipitation, Nature, 337, 631–634, https://doi.org/10.1038/337631a0, 1989.
Hua, W., Chen, Z. M., Jie, C. Y., Kondo, Y., Hofzumahaus, A., Takegawa, N., Chang, C. C., Lu, K. D., Miyazaki, Y., Kita, K., Wang, H. L., Zhang, Y. H., and Hu, M.: Atmospheric hydrogen peroxide and organic hydroperoxides during PRIDE-PRD'06, China: their concentration, formation mechanism and contribution to secondary aerosols, Atmos. Chem. Phys., 8, 6755–6773, https://doi.org/10.5194/acp-8-6755-2008, 2008.
Huang, W., Zhang, Y., Zhang, Y., Zeng, L., Dong, H., Huo, P., Fang, D., and Schauer, J. J.: Development of an automated sampling-analysis system for simultaneous measurement of reactive oxygen species (ROS) in gas and particle phases: GAC-ROS, Atmos. Environ., 134, 18–26, https://doi.org/10.1016/j.atmosenv.2016.03.038, 2016.
Hung, H. F. and Wang, C. S.: Experimental determination of reactive oxygen species in Taipei aerosols, J. Aerosol Sci., 32, 1201–1211, https://doi.org/10.1016/S0021-8502(01)00051-9, 2001.
Ivanova, I. A., Ershova, M. O., Shumov, I. D., Valueva, A. A., Ivanov, Y. D., and Pleshakova, T. O.: Atomic Force Microscopy Study of the Temperature and Storage Duration Dependencies of Horseradish Peroxidase Oligomeric State, Biomedicines, 10, 2645, https://doi.org/10.3390/biomedicines10102645, 2022.
Jambunathan, N.: Determination and detection of reactive oxygen species (ROS), lipid peroxidation, and electrolyte leakage in plants, in: Plant Stress Tolerance: Methods and Protocols, 291–297, https://doi.org/10.1007/978-1-60761-702-0_18, 2010.
King, L. E. and Weber, R. J.: Development and testing of an online method to measure ambient fine particulate reactive oxygen species (ROS) based on the 2',7'-dichlorofluorescin (DCFH) assay, Atmos. Meas. Tech., 6, 1647–1658, https://doi.org/10.5194/amt-6-1647-2013, 2013.
Kolthoff, I. M. and Medalia, A. I.: The reaction between ferrous iron and peroxides. I. Reaction with hydrogen peroxide in the absence of oxygen, J. Am. Chem. Soc., 71, 3777–3783, https://doi.org/10.1021/ja01179a057, 1949.
Komazaki, Y., Inoue, T., and Tanaka, S.: Automated measurement system for H2O2 in the atmosphere by diffusion scrubber sampling and HPLC analysis of Ti (IV)-PAR-H2O2 complex, Analyst, 126, 587–593, https://doi.org/10.1039/B008134P, 2001.
Kroll, J. H., Ng, N. L., Murphy, S. M., Flagan, R. C., and Seinfeld, J. H.: Secondary organic aerosol formation from isoprene photooxidation, Environ. Sci. Technol., 40, 1869–1877, https://doi.org/10.1021/es0524301, 2006.
Lakey, P. S., Berkemeier, T., Tong, H., Arangio, A. M., Lucas, K., Pöschl, U., and Shiraiwa, M.: Chemical exposure-response relationship between air pollutants and reactive oxygen species in the human respiratory tract, Sci. Rep.-UK, 6, 32916, https://doi.org/10.1038/srep32916, 2016.
Lazrus, A. L., Kok, G. L., Lind, J. A., Gitlin, S. N., Heikes, B. G., and Shetter, R. E.: Automated fluorometric method for hydrogen peroxide in air, Anal. Chem., 58, 594–597, https://doi.org/10.1021/ac00294a024, 1986.
Lee, J. H., Tang, I. N., and Weinstein-Lloyd, J. B.: A non-enzymatic method for the determination of hydrogen peroxide in atmospheric samples, Anal. Chem., 62, 2381–2384, https://doi.org/10.1021/ac00220a022, 1990.
Lelieveld, J. A., Butler, T. M., Crowley, J. N., Dillon, T. J., Fischer, H., Ganzeveld, L., Harder, H., Lawrence, M. G., Martinez, M., and Taraborrelli, D.: Atmospheric oxidation capacity sustained by a tropical forest, Nature, 452, 737–740, https://doi.org/10.1038/nature06870, 2008.
Li, H., Zhang, Q., Zheng, B., Chen, C., Wu, N., Guo, H., Zhang, Y., Zheng, Y., Li, X., and He, K.: Nitrate-driven urban haze pollution during summertime over the North China Plain, Atmos. Chem. Phys., 18, 5293–5306, https://doi.org/10.5194/acp-18-5293-2018, 2018.
Liu, P., Ye, C., Xue, C., Zhang, C., Mu, Y., and Sun, X.: Formation mechanisms of atmospheric nitrate and sulfate during the winter haze pollution periods in Beijing: gas-phase, heterogeneous and aqueous-phase chemistry, Atmos. Chem. Phys., 20, 4153–4165, https://doi.org/10.5194/acp-20-4153-2020, 2020.
Liu, Y., Tang, X., Zhang, Z., Li, L., and Chen, J.: Development and Field Testing of an Online Monitoring System for Atmospheric Particle-Bound Reactive Oxygen Species (ROS), Atmosphere-Basel, 14, 924, https://doi.org/10.3390/atmos14060924, 2023.
Liu, Z., Wang, Y., Hu, B., Lu, K., Tang, G., Ji, D., Yang, X., Gao, W., Xie, Y., and Liu, J.: Elucidating the quantitative characterization of atmospheric oxidation capacity in Beijing, China, Sci. Total Environ., 771, 145306, https://doi.org/10.1016/j.scitotenv.2021.145306, 2021.
Lushchak, V. I. and Lushchak, O.: Interplay between reactive oxygen and nitrogen species in living organisms, Chem.-Biol. Interact., 349, 109680, https://doi.org/10.1016/j.cbi.2021.109680, 2021.
Montesinos, V. N., Sleiman, M., Cohn, S., Litter, M. I., and Destaillats, H.: Detection and quantification of reactive oxygen species (ROS) in indoor air, Talanta, 138, 20–27, https://doi.org/10.1016/j.talanta.2015.02.015, 2015.
Mrakic-Sposta, S., Gussoni, M., Montorsi, M., Porcelli, S., and Vezzoli, A.: Assessment of a standardized ROS production profile in humans by electron paramagnetic resonance, Oxid. Med. Cell. Longev., 2012, 973927, https://doi.org/10.1155/2012/973927, 2012.
Murakami, Y., Endo, K., Ohta, I., Nosaka, A. Y., and Nosaka, Y.: Can OH radicals diffuse from the UV-irradiated photocatalytic TiO2 surfaces? Laser-induced-fluorescence study, J. Phys. Chem. C, 111, 11339–11346, https://doi.org/10.1021/jp0722049, 2007.
Nan, J., Wang, S., Guo, Y., Xiang, Y., and Zhou, B.: Study on the daytime OH radical and implication for its relationship with fine particles over megacity of Shanghai, China, Atmos. Environ., 154, 167–178, https://doi.org/10.1016/j.atmosenv.2017.01.046, 2017.
Nosaka, Y. and Nosaka, A. Y.: Generation and detection of reactive oxygen species in photocatalysis, Chem. Rev., 117, 11302–11336, https://doi.org/10.1021/acs.chemrev.7b00161, 2017.
Olaguer, E. P., Rappenglück, B., Lefer, B., Stutz, J., Dibb, J., Griffin, R., Brune, W. H., Shauck, M., Buhr, M., and Jeffries, H.: Deciphering the role of radical precursors during the Second Texas Air Quality Study, JAPCA J. Air Waste Ma., 59, 1258–1277, https://doi.org/10.3155/1047-3289.59.11.1258, 2009.
Sakugawa, H. and Kaplan, I. R.: Atmospheric H2O2 measurement: comparison of cold trap method with impinger bubbling method, Atmos. Environ., 21, 1791–1798, https://doi.org/10.1016/0004-6981(87)90119-3, 1987.
Scott, C. E., Rap, A., Spracklen, D. V., Forster, P. M., Carslaw, K. S., Mann, G. W., Pringle, K. J., Kivekäs, N., Kulmala, M., Lihavainen, H., and Tunved, P.: The direct and indirect radiative effects of biogenic secondary organic aerosol, Atmos. Chem. Phys., 14, 447–470, https://doi.org/10.5194/acp-14-447-2014, 2014.
Shiraiwa, M. and Pöschl, U.: Mass accommodation and gas–particle partitioning in secondary organic aerosols: dependence on diffusivity, volatility, particle-phase reactions, and penetration depth, Atmos. Chem. Phys., 21, 1565–1580, https://doi.org/10.5194/acp-21-1565-2021, 2021.
Simões, E. F., Almeida, A. S., Duarte, A. C., and Duarte, R. M.: Assessing reactive oxygen and nitrogen species in atmospheric and aquatic environments: Analytical challenges and opportunities, TrAC-Trend. Anal. Chem., 135, 116149, https://doi.org/10.1016/j.trac.2020.116149, 2021.
Song, L., Yin, S., Bi, S., Yang, J., Wang, X., Bi, X., Zhang, Y., Wu, J., Dai, Q., and Feng, Y.: More evidence on primary sulfate emission from residential coal combustion in northern China: Insights from the size-segregated chemical profile, morphology, and sulfur isotope, Atmos. Environ., 326, 120467, https://doi.org/10.1016/j.atmosenv.2024.120467, 2024.
Stein, A. F., Draxler, R. R., Rolph, G. D., Stunder, B. J., Cohen, M. D., and Ngan, F.: NOAA's HYSPLIT atmospheric transport and dispersion modeling system, B. Am. Meteorol. Soc., 96, 2059–2077, https://doi.org/10.1175/BAMS-D-14-00110.1, 2015.
Stone, D., Whalley, L. K., and Heard, D. E.: Tropospheric OH and HO2 radicals: field measurements and model comparisons, Chem. Soc. Rev., 41, 6348–6404, https://doi.org/10.1039/C2CS35140D, 2012.
Tan, Z., Rohrer, F., Lu, K., Ma, X., Bohn, B., Broch, S., Dong, H., Fuchs, H., Gkatzelis, G. I., Hofzumahaus, A., Holland, F., Li, X., Liu, Y., Liu, Y., Novelli, A., Shao, M., Wang, H., Wu, Y., Zeng, L., Hu, M., Kiendler-Scharr, A., Wahner, A., and Zhang, Y.: Wintertime photochemistry in Beijing: observations of ROx radical concentrations in the North China Plain during the BEST-ONE campaign, Atmos. Chem. Phys., 18, 12391–12411, https://doi.org/10.5194/acp-18-12391-2018, 2018.
Tan, Z., Lu, K., Jiang, M., Su, R., Wang, H., Lou, S., Fu, Q., Zhai, C., Tan, Q., Yue, D., Chen, D., Wang, Z., Xie, S., Zeng, L., and Zhang, Y.: Daytime atmospheric oxidation capacity in four Chinese megacities during the photochemically polluted season: a case study based on box model simulation, Atmos. Chem. Phys., 19, 3493–3513, https://doi.org/10.5194/acp-19-3493-2019, 2019.
Venkatachari, P. and Hopke, P. K.: Development and laboratory testing of an automated monitor for the measurement of atmospheric particle-bound reactive oxygen species (ROS), Aerosol Sci. Tech., 42, 629–635, https://doi.org/10.1080/02786820802227345, 2008.
Venkatachari, P., Hopke, P. K., Brune, W. H., Ren, X., Lesher, R., Mao, J., and Mitchell, M.: Characterization of wintertime reactive oxygen species concentrations in Flushing, New York, Aerosol Sci. Tech., 41, 97–111, https://doi.org/10.1080/02786820601116004, 2007.
Wang, D., Yang, X., Lu, H., Li, D., Xu, H., Luo, Y., Sun, J., Ho, S. S. H., and Shen, Z.: Oxidative potential of atmospheric brown carbon in six Chinese megacities: Seasonal variation and source apportionment, Atmos. Environ., 309, 119909, https://doi.org/10.1016/j.atmosenv.2023.119909, 2023a.
Wang, Y.: An Integrated Synchronous Online Analyzer for Gaseous and Particulate Reactive Oxygen Species (ROS): Development, Characterization and Field Observations, Version v2, Zenodo [data set], https://doi.org/10.5281/zenodo.20660538, 2026.
Wang, Y., Zhang, Q., Jiang, J., Zhou, W., Wang, B., He, K., Duan, F., Zhang, Q., Philip, S., and Xie, Y.: Enhanced sulfate formation during China's severe winter haze episode in January 2013 missing from current models, J. Geophys. Res.-Atmos., 119, 10425–10440, https://doi.org/10.1002/2013JD021426, 2014.
Wang, Y., Bagya Ramesh, C., Giangrande, S. E., Fast, J., Gong, X., Zhang, J., Tolga Odabasi, A., Oliveira, M. V. B., Matthews, A., Mei, F., Shilling, J. E., Tomlinson, J., Wang, D., and Wang, J.: Examining the vertical heterogeneity of aerosols over the Southern Great Plains, Atmos. Chem. Phys., 23, 15671–15691, https://doi.org/10.5194/acp-23-15671-2023, 2023b.
Wang, Y., Jin, X., Liu, Z., Wang, G., Tang, G., Lu, K., Hu, B., Wang, S., Li, G., and An, X.: Progress in quantitative research on the relationship between atmospheric oxidation and air quality, J. Environ. Sci., 123, 350–366, https://doi.org/10.1016/j.jes.2022.06.029, 2023c.
Wei, J., Fang, T., and Shiraiwa, M.: Effects of acidity on reactive oxygen species formation from secondary organic aerosols, ACS Environmental Au, 2, 336–345, https://doi.org/10.1021/acsenvironau.2c00018, 2022.
Wennberg, P. O., Bates, K. H., Crounse, J. D., Dodson, L. G., McVay, R. C., Mertens, L. A., Nguyen, T. B., Praske, E., Schwantes, R. H., and Smarte, M. D.: Gas-phase reactions of isoprene and its major oxidation products, Chem. Rev., 118, 3337–3390, https://doi.org/10.1021/acs.chemrev.7b00439, 2018.
Wragg, F. P. H., Fuller, S. J., Freshwater, R., Green, D. C., Kelly, F. J., and Kalberer, M.: An automated online instrument to quantify aerosol-bound reactive oxygen species (ROS) for ambient measurement and health-relevant aerosol studies, Atmos. Meas. Tech., 9, 4891–4900, https://doi.org/10.5194/amt-9-4891-2016, 2016.
Wu, J., Yang, C., Zhang, C., Cao, F., Wu, A., and Zhang, Y.: Development, characterization, and application of an improved online reactive oxygen species analyzer based on the Monitor for AeRosols and Gases in ambient Air (MARGA), Atmos. Meas. Tech., 15, 2623–2633, https://doi.org/10.5194/amt-15-2623-2022, 2022.
Xie, Z. H., He, C. S., Pei, D. N., Dong, Y., Yang, S. R., Xiong, Z. K., Zhou, P., Pan, Z. C., Yao, G., and Lai, B.: Review of characteristics, generation pathways and detection methods of singlet oxygen generated in advanced oxidation processes (AOPs), Chem. Eng. J., 468, 143778, https://doi.org/10.1016/j.cej.2023.143778, 2023.
Xuan, X., Chen, Z., Gong, Y., Shen, H., and Chen, S.: Partitioning of hydrogen peroxide in gas-liquid and gas-aerosol phases, Atmos. Chem. Phys., 20, 5513–5526, https://doi.org/10.5194/acp-20-5513-2020, 2020.
Xue, C., Ye, C., Kleffmann, J., Zhang, W., He, X., Liu, P., Zhang, C., Zhao, X., Liu, C., Ma, Z., Liu, J., Wang, J., Lu, K., Catoire, V., Mellouki, A., and Mu, Y.: Atmospheric measurements at Mt. Tai – Part II: HONO budget and radical (ROx + NO3) chemistry in the lower boundary layer, Atmos. Chem. Phys., 22, 1035–1057, https://doi.org/10.5194/acp-22-1035-2022, 2022.
Yang, J., Cao, Y., and Zhang, N.: Spectrophotometric method for superoxide anion radical detection in a visible light (400–780 nm) system, Spectrochim. Acta A, 239, 118556, https://doi.org/10.1016/j.saa.2020.118556, 2020.
Yao, L., Ma, Y., Wang, L., Zheng, J., Khalizov, A., Chen, M., Zhou, Y., Qi, L., and Cui, F.: Role of stabilized Criegee Intermediate in secondary organic aerosol formation from the ozonolysis of α-cedrene, Atmos. Environ., 94, 448–457, https://doi.org/10.1016/j.atmosenv.2014.05.063, 2014.
Ye, C., Liu, P., Xue, C., Zhang, C., Ma, Z., Liu, C., Liu, J., Lu, K., Mu, Y., and Zhang, Y.: Understanding summertime H2O2 chemistry in the North China Plain through observations and modeling studies, Atmos. Chem. Phys., 25, 6991–7005, https://doi.org/10.5194/acp-25-6991-2025, 2025.
Ying, N., Tang, Y., Wang, D., Fan, J., Zhao, Z., Xue, Z., and Liu, Y.: Detecting atmospheric oxidation in the PM2.5 and ozone multilayer complex network, Environ. Res. Lett., 19, 104072, https://doi.org/10.1088/1748-9326/ad7869, 2024.
Yu, W. and Zhao, L.: Chemiluminescence detection of reactive oxygen species generation and potential environmental applications, TrAC-Trend. Anal. Chem., 136, 116197, https://doi.org/10.1016/j.trac.2021.116197, 2021.
Zang, H., Zhao, Y., Huo, J., Zhao, Q., Fu, Q., Duan, Y., Shao, J., Huang, C., An, J., Xue, L., Li, Z., Li, C., and Xiao, H.: High atmospheric oxidation capacity drives wintertime nitrate pollution in the eastern Yangtze River Delta of China, Atmos. Chem. Phys., 22, 4355–4374, https://doi.org/10.5194/acp-22-4355-2022, 2022.
Zhang, G., Hu, R., Xie, P., Cai, H., Shen, C., Guo, J., Hu, C., and Liu, X.: Improved laser-induced fluorescent instrument for online peroxy radical measurement: Consistency in high-sensitivity for detection, Sensor. Actuat. B-Chem., 424, 136774, https://doi.org/10.1016/j.snb.2024.136774, 2025.
Zhang, Y., Dai, M., and Yuan, Z.: Methods for the detection of reactive oxygen species, Anal. Methods-UK, 10, 4625–4638, https://doi.org/10.1039/C8AY01339J, 2018.
Zhao, J. and Hopke, P. K.: Concentration of reactive oxygen species (ROS) in mainstream and sidestream cigarette smoke, Aerosol Sci. Tech., 46, 191–197, https://doi.org/10.1080/02786826.2011.617795, 2012.
Zhou, J., Bruns, E. A., Zotter, P., Stefenelli, G., Prévôt, A. S. H., Baltensperger, U., El-Haddad, I., and Dommen, J.: Development, characterization and first deployment of an improved online reactive oxygen species analyzer, Atmos. Meas. Tech., 11, 65–80, https://doi.org/10.5194/amt-11-65-2018, 2018.
Zhou, J., Elser, M., Huang, R.-J., Krapf, M., Fröhlich, R., Bhattu, D., Stefenelli, G., Zotter, P., Bruns, E. A., Pieber, S. M., Ni, H., Wang, Q., Wang, Y., Zhou, Y., Chen, C., Xiao, M., Slowik, J. G., Brown, S., Cassagnes, L.-E., Daellenbach, K. R., Nussbaumer, T., Geiser, M., Prévôt, A. S. H., El-Haddad, I., Cao, J., Baltensperger, U., and Dommen, J.: Predominance of secondary organic aerosol to particle-bound reactive oxygen species activity in fine ambient aerosol, Atmos. Chem. Phys., 19, 14703–14720, https://doi.org/10.5194/acp-19-14703-2019, 2019.
Zhu, J., Wang, S., Wang, H., Jing, S., Lou, S., Saiz-Lopez, A., and Zhou, B.: Observationally constrained modeling of atmospheric oxidation capacity and photochemical reactivity in Shanghai, China, Atmos. Chem. Phys., 20, 1217–1232, https://doi.org/10.5194/acp-20-1217-2020, 2020.
Zhu, J., Shang, J., and Zhu, T.: A new understanding of the microstructure of soot particles: The reduced graphene oxide-like skeleton and its visible-light driven formation of reactive oxygen species, Environ. Pollut., 270, 116079, https://doi.org/10.1016/j.envpol.2020.116079, 2021.