
the Creative Commons Attribution 4.0 License.
the Creative Commons Attribution 4.0 License.
 | 24 Jul 2026
Real-time pollen dynamics and automated detection: novel insights from Wrocław (Poland) 2024–2025
Małgorzata Werner
Małgorzata Malkiewicz
Karol Bubel
Accurate monitoring and forecasting of airborne pollen are essential for public health and allergy management. This study evaluated a neural network model for real-time pollen monitoring using locally collected data in Wrocław, Poland (2024–2025) with the Swisens Poleno Jupiter detector. The retrained model, based on local data, outperformed the reference model trained on Swiss datasets and validated against a Hirst-type pollen trap. The coefficient of determination (R2) remained high (∼ 0.8) especially for Alnus, Betula and Quercus, while the root mean square error (RMSE) was lower, particularly at low and medium concentrations, showing improved sensitivity, real-time detection and better representation of seasonal and diurnal dynamics. Hourly analyses revealed distinct taxon-specific diurnal patterns in pollen release. Temperature and relative humidity were the main drivers of variability, while wind speed influenced all taxa except Pinus. Hourly pollen concentrations were positively correlated with planetary boundary layer height, especially for Betula and Alnus, highlighting the role of atmospheric mixing in pollen dispersion. Wind direction, particularly from southern and southeastern sectors, modulated local transport, reflecting land cover effects. Correlations with meteorological variables varied by month and flowering stage. Validation against Hirst-type data confirmed that the locally retrained model accurately captures taxon-specific pollen dynamics, demonstrating its effectiveness for real-time allergen monitoring and improving the reliability of allergy risk assessments.
- Article
(4613 KB) - Full-text XML
-
Supplement
(509 KB) - BibTeX
- EndNote


Pollen is one of the leading causes of allergic diseases worldwide (World Allergy Organization, 2013), affecting an estimated 15 %–40 % of the European population (Rojo et al., 2024). The prevalence of allergic rhinitis and other pollen-related conditions continues to increase globally (Adams-Groom et al., 2022; Beggs et al., 2023; D'Amato et al., 2007). The severity of allergic responses depends on several factors, including pollen concentration, species-specific sensitization thresholds and individual susceptibility (Rapiejko et al., 2007; Rodríguez-Rajo et al., 2010).
In recent decades, climate change has become a key factor influencing the dynamics of pollen production and dispersion (Anderegg et al., 2021; Lake et al., 2017). Rising temperatures and elevated atmospheric CO2 levels contribute to increased pollen production and cause earlier, longer and more intense pollen seasons for many allergenic taxa. As a result, exposure periods are becoming more variable and less predictable, with the timing of peak pollen concentrations often shifting from year to year, which complicates forecasts of allergy risk (Pacheco et al., 2021; Paudel et al., 2021; Tomczyk et al., 2025; Ziska et al., 2019).
Given these shifts, continuous and precise monitoring of airborne pollen has become crucial for understanding exposure patterns and supporting public health management, allergy forecasting and early-warning systems (Grewling et al., 2023; Maya-Manzano et al., 2023). Pollen monitoring networks were initially established to support allergy diagnosis and treatment but are now also used to study climate change impacts, track invasive species and monitor airborne biological particles (Galán et al., 2014)
Most monitoring sites still rely on manual sampling methods, such as the Hirst-type pollen trap (Hirst, 1952), which, despite being standardized and quality-controlled through aerobiological networks (BSI Standards Limited, 2015), have several limitations. These include delays of 1–9 d before data are available, low temporal resolution and uncertainties related to airflow variations, counting methodology, adhesives and observer differences (Adamov et al., 2024; Triviño et al., 2023). However, Hirst-type traps remain the reference against which other pollen and fungal spore detection methods are evaluated (Tummon et al., 2024). At the same time, the development and validation of low-cost sensors are essential for expanding monitoring networks, as they can help identify optimal locations for the subsequent deployment of automatic samplers and improve overall spatial coverage.
In recent years, technological advances have enabled real-time detection of pollen and other bioaerosols, using diverse approaches and instruments (Buters et al., 2024; Maya-Manzano et al., 2023). These systems allow continuous monitoring, higher temporal resolution and improved responsiveness for public health and research applications. The rapid evolution of these technologies is transforming pollen monitoring, providing critical real-time information for allergy management, climate studies and environmental research (Sauvageat et al., 2020). One of the devices is the Swisens Poleno Jupiter, an instrument designed for real-time bioaerosol monitoring, capable of detecting and identifying airborne particles such as pollen. It combines digital holography with fluorescence measurements, providing detailed information on both the morphology and composition of particles to support the development of automatic pollen detection systems (Erb et al., 2025). The recent studies higlight that automatic pollen detection, even with machine learning, has not achieved full accuracy or maturity and further work is needed to generalize such models across more pollen species and conditions. They emphasize that significant improvements in algoritms, training data and validations strategies are still required before automated pollen identification can match expert human analysis (Farooq et al., 2025; Gimenez et al., 2024; Shamrat et al., 2024). The reference pollen database provided with the Swisens Poleno System comprises 14 taxonomic classes and an additional class for water droplets. It was originally developed based on data collected at the site where the detector was built in Switzerland, without adaptation to new locations. In this study, the reference database used in the Swisens Poleno Jupiter system was further developed through extension and refinement in order to improve detection performance.
For this purpose, during the pollination seasons, local pollen samples were collected and used to retrain the neural network model. The new data enabled the incorporation of fluorescence measurements, whereas the initial model was based solely on holography prior to retraining. We hypothesised that the retrained model would provide more accurate and timely predictions of airborne pollen concentrations compared to models trained exclusively on foreign datasets, as well as improved performance due to the addition of fluorescence data. The study describes the measurement campaigns carried out as part of the development of automatic pollen detection methods. To date, there are no studies explicitly emphasizing the importance of retraining neural network models using locally collected pollen datasets that reflect real environmental conditions. Secondly, we analysed the similarities and differences in the diurnal concentration patterns of five pollen taxa – Alnus (alder), Betula (birch), Fraxinus (ash), Pinus (pine) and Quercus (oak). These tree genera are known for their allergenic potential, particularly Alnus and Betula from the Betulaceae family (Biedermann et al., 2019). Owing to their high pollen productivity, airborne concentrations of these taxa can fluctuate substantially (Malkiewicz et al., 2016). We hypothesised that diurnal variability would show comparable patterns among taxa with similar pollen release mechanisms, while differing among taxa with distinct phenological or aerodynamic characteristics. Additionally, the availability of high-resolution hourly data enabled us to assess the influence of meteorological conditions on short-term variability in pollen concentrations. We used standard meteorological parameters, including temperature, relative humidity, precipitation, wind and sunshine duration, to obtain a comprehensive understanding of the factors influencing pollen concentrations. However, in order to obtain a broad view of the factors influencing pollen concentrations, we also included the planetary boundary layer height among the analysed parameters. Although frequently mentioned in aerobiology, its influence on hourly pollen variability derived from automatic measurements has rarely been investigated compared to standard local meteorological drivers, with the first attempt in this direction made by Chappuis et al. (2020).
This study provides two years analysis of diurnal airborne pollen dynamics using data from an automatic real-time monitoring system. It is the first to employ the Swisens Poleno Jupiter detector for continuous, high-resolution assessment of diurnal variability across multiple pollen seasons. In contrast to previous studies based on traditional Hirst-type volumetric traps (Clot, 2001; Käpylä, 1984; Kasprzyk et al., 2001; Ščevková et al., 2015), this approach allows for a more detailed and consistent evaluation of hourly fluctuations and interannual trends in pollen concentrations.

Figure 1Location of the Swisens Poleno Jupiter detector in Wrocław, Poland (red dot); the inset shows the location of Poland within Europe. The European map is based on Natural Earth data, while the city map uses data from OpenStreetMap contributors (OpenStreetMap)
2.1 Automatic detection
2.1.1 Location and time frame
The Swisens Poleno Jupiter detector is installed in Wrocław (southwestern Poland), on the roof of the Department of Climatology and Atmosphere Protection, University of Wrocław, at an elevation of 20 m above ground level, with no other high-rise structures in the immediate surroundings (Fig. 1). The instrument is co-located with a standard Hirst-type volumetric trap, allowing for direct comparison between automatic and manual monitoring methods. The measurements cover the periods of 2024 and 2025, encompassing two complete pollen seasons.
2.1.2 Description of the detector
The Swisens Poleno Jupiter (Swisens AG) is an airflow cytometer designed for real-time analysis of individual particles ranging from 0.5 to 300 µm, operating at a sampling flow rate of 40 L min−1. As particles pass through the instrument, they are concentrated within the measurement chamber, where two orthogonally positioned lasers detect each particle, providing estimates of size and velocity based on light scattering. Once detected, the particle is captured by two greyscale holographic cameras positioned at 90° angles to each other and perpendicular to the airflow. The holographic images are reconstructed numerically to a resolution of 200×200 pixels, with each pixel representing 0.595×0.595 µm in the physical domain. These images enable precise characterization of particle morphology. Immediately after imaging, laser-induced fluorescence (LIF) is measured. Particles are sequentially excited by three laser sources (280, 365 and 405 nm) and the resulting fluorescence is recorded across five spectral channels (333–381, 411–459, 465–501, 539–585 and 658–694 nm), hereafter referred to by their central wavelengths: 357, 435, 483, 562 and 676 nm. Fluorescence emission is captured by silicon photomultipliers (SiPMs), producing up to 15 intensity measurements per particle. Due to saturation and single-photon excitation effects, the effective number of usable fluorescence channels is 13. The fluorescence data undergo additional preprocessing to enhance usability and robustness. In this work, analysis focuses on particle morphology (from holographic images) and chemical composition (from fluorescence intensities). The instrument also performs polarized-scattered-light measurements, which are not used here (Erb et al., 2024, 2025; Sauvageat et al., 2020).
2.1.3 Model architecture
The pollen classification model was based on a customised convolutional neural network architecture specifically optimised for processing greyscale images generated by the SwisensPoleno digital holography module. Unlike standard pre-trained architectures such as VGG16, which are primarily designed for RGB image recognition tasks, the applied network was adapted to the characteristics of monochromatic holographic data, reducing unnecessary model complexity and improving compatibility with the input format. The model processed two orthogonal pollen images separately before combining the extracted features through fully connected layers. Additionally, fluorescence measurements could be incorporated through a dedicated network branch, enabling classifications both with and without fluorescence input (Crouzy et al., 2025; Erb et al., 2025; Sauvageat et al., 2020).
Non-biological particles were removed prior to classification using a deterministic morphological filter described by Sauvageat et al. (2020). Water droplet training datasets were created from operational measurements collected during fog and rain events and manually cleaned to remove artefacts such as aggregates and debris. The model was trained entirely from scratch without the use of pre-trained neural networks. As emphasised by Erb et al. (2025), reliable pollen classification requires training datasets that reflect the full variability of each pollen taxon, including samples collected from different plants, locations, and meteorological conditions. This underlines the importance of the present study. The detailed network architecture is available on GitHub (MeteoSwiss Biometeorology Team, 2025).
2.1.4 Measurement campaigns
The measurement campaigns were designed to collect high-quality reference data for retraining and validating the automatic pollen detection model. A total of five taxa- Alnus, Betula, Fraxinus, Quercus and Pinus – were included in the experiments, with the number of campaigns, recorded events, measurement duration and amount of pollen adjusted to the availability and characteristics of each species (see Table 1). The total number of recorded events ranged from 3622 for Fraxinus to 7233 for Betula, with measurement durations between 19 and 68 min and pollen quantities from 0.5 to 1.25 mL.
Each campaign consisted of a series of controlled laboratory experiments aimed at introducing locally collected pollen into the automatic detector under standardized conditions. The main goal was to extend the pollen database with accurately identified local taxa and to ensure the consistency and reliability of data used for model development.
The campaigns were carried out using the Swisens Poleno Atomizer, a device that enables controlled aerosolization of pollen grains directly from a test tube into the Swisens Poleno Jupiter detector. Swisens Atomizer delivers the particles directly to the Swisens Poleno detector under controlled conditions. This system disperses selected particles at a stable rate by combining vibration and airflow. The vibration frequency, amplitude and blower speed can be precisely adjusted. The Swisens Atomizer is positioned directly above the SwisensPoleno Jupiter so that the sampled air contains the target pollen particles. This setup allows simultaneous measurement and labeling of all collected data with the corresponding particle type (Erb et al., 2025). The entire process is managed via an integrated computer system, which provides feedback on instrument performance and enables data recording when the conditions are optimal.
Each campaign followed a structured workflow:
-
Pollen preparation – Inflorescences of Alnus, Betula, Fraxinus, Quercus and Pinus were collected during their natural pollination periods and processed to obtain clean pollen grains. It is important to monitor meteorological conditions and collect catkins when they open naturally (during sunny weather and temperatures above 10 °C) or to collect inflorescences and let them open in warm, dry conditions.
-
Measurement phase – The Atomizer introduced the pollen into the detector, with continuous monitoring to ensure high-quality data.
-
Data validation and selection – Collected signals were reviewed to remove artifacts or non-pollen particles.
-
Dataset compilation – Verified data were organized using Swisens Data Explorer software, forming the basis for neural network retraining.
-
Model retraining and testing – The new model was trained on a subset of the dataset and evaluated on an independent portion to assess detection performance.
The campaigns were repeated for each taxon to ensure representative coverage of the dominant allergenic species in the region. Each dataset contained thousands of individual particle measurements, reflecting both the natural variability of pollen availability and the specific conditions of each measurement session.

For reliable particle identification, input data must contain only the target pollen type. Environmental samples often include unwanted particles such as dust, other pollen, or plant debris, necessitating a data cleaning step. Using the SwisensDataExplorer tool, expert annotators manually removed non-target particles, producing “clean” datasets for training. Typical exclusions included double particles, irregular shapes and out-of-range sizes, while blurred images were retained to preserve natural variability. Although manual cleaning is subjective and not an absolute ground truth, it ensures that essential particle characteristics are maintained. These cleaned datasets were then used to retrain a neural network and provide a new detection model.
2.2 Station surroundings
A buffer of 2.5 km around the monitoring station was selected to characterize the local vegetation potentially contributing to airborne pollen concentrations. This distance was chosen to ensure the inclusion of the main surrounding tree stands, particularly Park Szczytnicki to the north and the Odra River corridor to the south, which represent the most important local sources of tree pollen. The choice is further supported by studies indicating that local pollen emissions can influence concentrations at distances of approximately 1 km or more (Sofiev et al., 2013). Within this buffer, the analyzed tree species are predominantly distributed to the north and south of the monitoring station. The northern area, corresponding to Park Szczytnicki, is mainly dominated by Quercus, Pinus, and Betula. In contrast, the southern sector, located near the Odra River, contains the highest density of trees, particularly Fraxinus and Quercus, with additional occurrences of Betula and Alnus along the riverbanks. The western and eastern directions are sparsely vegetated, containing only isolated individual trees rather than larger clusters.
2.3 Hirst trap measurements
For validation purposes, airborne pollen samples were collected using a volumetric 7 d Hirst-type trap (Hirst, 1952), co-located with the Swisens Poleno detector at the same height on the roof of the Institute of Climatology and Atmospheric Protection. The Hirst trap continuously draws in air and pollen grains, along with other particles, adhere to a prepared sticky tape. After one week, the tape is replaced and laboratory slides are prepared, from which pollen grains are counted following European standards (Galán et al., 2014), i.e., from four continuous horizontal bands. These Hirst-type measurements served as reference data to validate the results obtained from the Swisens Poleno instrument and the neural network model.
2.4 Meteorological data
Meteorological data were obtained from automatic measurements at the Department of Climatology and Atmospheric Protection, where the detector and Hirst pollen trap are located. The dataset includes mean hourly records of temperature at 2 m (°C), wind speed (m s1) and direction (°) at 10 m, relative humidity at 2 m (%), sum of precipitation (mm) and sunshine duration (h). Additionally, the WRF model was used to determine the hourly variability of planetary boundary layer (PBL) height (m); however, only data for 2024 are presented, as simulations for the current year are still ongoing.
2.5 Method of analysis
2.5.1 Evaluation of the old and new model results
The pollen season was determined separately for both the automatic real-time detector (Swisens Poleno Jupiter) and the reference Hirst-type sampler using the 90 % method (Nilsson and Persson, 1981). The start of the pollen season was defined as the day when the cumulative pollen count exceeded 5 % of the annual total and the end as the day when it surpassed 95 %. These season limits were then applied consistently for validation of the automatic measurements and for the subsequent statistical and diurnal variability analyses.
To evaluate temporal consistency, daily concentrations from two consecutive pollen seasons were compared for both the old and new automatic models (hereafter referred to as “old” and “new”, respectively) against Hirst reference data. The baseline model was originally developed by MeteoSwiss and trained on datasets obtained from the MeteoSwiss pollen monitoring network in Switzerland. The official GitHub repository provides access to the old model – MCH 2022 model (MeteoSwiss Biometeorology Team, 2025). The current model (new) was retrained using locally collected pollen data from Wrocław, Poland, for the same taxa, with the aim of improving predictive performance under local environmental conditions. While the old model relied solely on holographic images, the new model incorporates both holography and fluorescence spectral information. Crouzy et al. (2025) demonstrated that including additional information improves detection performance; however, studies on the use of locally collected pollen to improve model performance for specific taxa remain scarce.
Agreement between the automatic method and the Hirst was quantified using the coefficient of determination (R2) and the root mean square error (RMSE). R2 assessed the proportion of variance explained, while RMSE provided an absolute measure of average daily deviation.
For evaluation by exposure level, hourly concentrations were binned into four classes (low, medium, high, very high). Thresholds were defined individually per taxon based on observed distributions. As an example, Betula (birch) classes were:
-
Low: ≤30 pollen grains m−3
-
Medium: 31–80 pollen grains m−3
-
High: 81–150 pollen grains m−3
-
Very high: >150 pollen grains m−3
(Analogous taxon-specific thresholds were applied for Alnus, Fraxinus, Pinus and Quercus.)
Model outputs (old vs. new) were evaluated for each taxon and concentration class using contingency and skill metrics computed from counts of True Positives (TP), False Positives (FP) and False Negatives (FN). Derived metrics included: Probability of Detection (POD = TP/(TP+FN)), False Alarm Ratio (FAR = FP/(TP+FP)), Critical Success Index (CSI = TP/(TP+FP+FN)) and Success Rate (SR = (TP+TN)/total, where TN is True Negatives). These metrics were reported separately for each taxon and concentration level to characterize model behavior across exposure ranges.
2.5.2 Diurnal variability of pollen concentrations
Hourly concentrations from the Swisens Poleno Jupiter (new model) were analyzed to characterize diurnal patterns for each taxon. All timestamps were recorded in Coordinated Universal Time (UTC). Differences in hourly distributions between the two seasons were quantified and visualized to identify peak exposure hours.
2.5.3 Diurnal variability of meteorological parameters and pollen data
Finally, an overall correlation matrix was constructed to assess the relationships between hourly meteorological variables (temperature, wind speed and direction, relative humidity, precipitation and sunshine duration) and pollen concentrations obtained from the Swisens Poleno Jupiter (new model). Subsequently, for each taxon, Spearman rank correlations were calculated between pollen concentration and each meteorological variable separately for each month within the respective flowering season, in order to capture the seasonal and hourly variability of these relationships. Previous research has shown that meteorological conditions strongly influence airborne pollen concentrations (Dąbrowska-Zapart et al., 2020; Kluska et al., 2020; Malkiewicz et al., 2016; Tomczyk et al., 2025), justifying the use of correlation analyses to assess their effect on hourly pollen variability. Statistical significance was assessed at three levels (p<0.05, p<0.01 and p<0.001) and correlation magnitudes and significance patterns were reported and mapped to hourly contexts.
The hourly planetary boundary layer (PBL) height was determined using the WRF numerical meteorological model, with model setup and parameterizations following Skamarock et al. (2021). Spearman's rank correlations were then calculated between PBL height and pollen concentrations to assess how boundary layer dynamics influence short-term variations in airborne pollen levels. Correlations for all variables were adjusted for multiple comparisons using the Bonferroni correction to account for the large number of observations.
A wind-rose analysis was performed using concurrent hourly wind direction and speed records to identify prevailing wind sectors associated with the highest pollen concentrations. These wind sector concentration patterns were compared spatially with land-cover/land-use maps (see Fig. 2) to infer potential source areas and directional contributions to measured pollen loads. Figure 2 was created based on detailed tree distribution maps developed by Grabska-Szwagrzyk et al. (2024), who classified 16 dominant tree species and genera across Poland using time series of Sentinel-2 imagery.

Figure 2Station surroundings based on data from Grabska-Szwagrzyk et al. (2024); map prepared by the author.

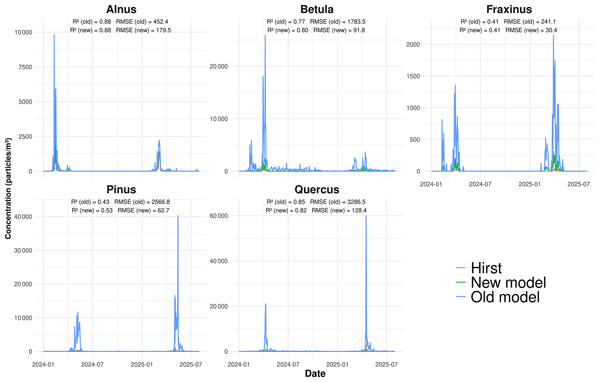
Figure 3Daily pollen concentrations from old and new ML models compared with Hirst reference data.
3.1 Pollen concentrations from the Swisens Poleno Jupiter and Hirst
This presents a comparison between the machine learning model trained on Swiss pollen data (old model) and the newly retrained model using local taxa (new model) against Hirst measurements, highlighting differences in predicted concentrations, temporal patterns and deviations from observed values (Figs. 3–5).
For Alnus and Betula, both models capture the main seasonal peaks well, with Alnus showing a pronounced early spring maximum. The new model closely follows the Hirst observations in both shape and timing of peaks, while the old model tends to overestimate concentrations. For Alnus, both models achieve the same R2=0.88, but the new model shows a much lower RMSE (179.5 vs. 452.4, for old and new model respectively – here and thereafter), indicating improved accuracy. Similarly, for Betula, the new model slightly improves the determination coefficient (R2=0.80 vs. 0.77) and reduces RMSE substantially (91.8 vs. 1783.5).
For Fraxinus, concentrations remain relatively low, with both models capturing the timing of peaks. The new model performs markedly better, maintaining the same R2=0.41 but achieving a much lower RMSE (30.4 vs. 241.1), reflecting greater precision in reproducing small variations.
In the case of Pinus, the new model better reproduces both low and moderate concentration periods, while the old model significantly overestimates peak magnitudes. This improvement is confirmed by a higher R2 (0.53 vs. 0.43) and a significantly reduced RMSE (62.7 vs. 2566.8).
For Quercus, a distinct late spring peak is observed. Both models correctly identify the timing of high pollen events, but the new model more accurately represents the peak structure and intensity, with a slightly lower R2 (0.82 vs. 0.85) and a drastically smaller RMSE (128.4 vs. 3286.5), highlighting a much-improved fit to observed concentrations.

3.2 Comparison of Models – Pollen Season Duration
This examines how each model predicts the start and end of the pollen season, analyzing differences in season length and timing in comparison with observed data. For Alnus, both years show that the new model reproduces the Hirst-derived start dates well, whereas the end dates are captured less accurately (2024: 7 February–27 March vs. 8–23 February; 2025: 18 February–4 April vs. 26 February–10 March), while the old model predicts a longer season (until the end of March or mid-April).
For Betula, the old model largely overestimates the pollen season duration (2024: 13 February–4 September; 2025: 25 February–12 June), while the new model (2024: 18 February–13 April; 2025: 27 February–2 May) better captures the Hirst timing (2024: 28 March–9 April; 2025: 4–17 April).
For Fraxinus, both models identify the onset of the season earlier than Hirst in 2024 (10 February–13 April vs. 23 March–8 April), but the new model better reproduces the duration. A similar pattern appears in 2025, where the new model (28 February–20 April) aligns with Hirst (26 March–15 April) more accurately than the old model, which extends the season.
For Pinus, both models capture the general spring timing, but the new model aligns more closely with observations (2024: 18 April–17 May vs. 15 April–16 May; 2025: 2–23 May vs. 1–14 May), while the old model slightly underestimates the duration.
For Quercus, the new model accurately reproduces the observed periods (2024: 5–16 April vs. 5–29 April; 2025: 15–29 April vs. 14–26 April), whereas the old model significantly extends the season (2024: 28 March–29 August; 2025: 5 April–12 May), indicating overprediction of long-term pollen presence.

Figure 5Performance of automatic ML models compared with Hirst reference data, shown as a performance diagram. The diagram is based on daily data from the 2024–2025 pollen season. The metrics include success ratio (SR), probability of detection (POD), false alarm ratio (FAR), and critical success index (CSI).
3.3 Comparison of Models – Performance Diagram
Model performance is evaluated using metrics such as accuracy, precision, recall and F1-score. Performance diagrams and statistical analyses are provided to illustrate model strengths and weaknesses.
Detection of Alnus pollen remained challenging for both models at medium and high concentrations, resulting in low POD (<0.25) and success ratios below 0.2. The new model shows noticeable improvement at low concentrations (POD ≈0.75, SR ≈0.7), indicating better sensitivity to early pollen occurrence, while both models perform perfectly at very high concentrations (POD ≈1.0, SR ≈1.0), confirming reliability during peak events.
For Betula, the new model clearly outperforms the old one at low concentrations (POD ≈0.9 vs. 0.6; SR ≈0.8 vs. 0.6), while maintaining similar performance at higher levels (POD ≈1.0, SR ≈1.0). Detection at medium levels remains limited for both models, though the new model achieves higher accuracy and fewer false alarms overall.
For Fraxinus, improvements are mainly visible at medium and high concentrations (old model: POD ≈0.1, SR ≈0.1; new model: medium 0.3, 0.3 and high 0.5, 0.5), reflecting better seasonal detection capability. Very high concentrations are successfully detected by both models (POD ≈1.0, SR ≈1.0), while at low concentrations the new model shows moderate improvement over the old model.
In the case of Pinus, the new model achieves strong detection performance at low concentrations (POD ≈0.95, SR ≈0.9), outperforming the old model (POD ≈0.7, SR ≈0.6). Both models detect very high concentrations perfectly (POD ≈1.0, SR ≈1.0), though detection at medium and high levels remains less reliable.
For Quercus, the new model substantially improves detection at low concentrations (POD ≈0.97, SR ≈0.9), outperforming the old model. Detection at medium concentrations remains very low (POD ≈0.1, SR ≈0.1), while at high concentrations the new model performs better than the old one. Very high concentrations are better detected by the old model.

3.4 Hourly Concentration Patterns over Two Years
Hourly Swisens Poleno Jupiter (the new model) pollen concentration profiles for two consecutive years are presented, showing diurnal trends, seasonal variations and year-to-year differences (Fig. 6).
For Alnus, the highest contributions to the seasonal pollen load were consistently observed during the late afternoon hours, specifically between 16:00 and 18:00. In 2024, hourly contributions for 16:00, 17:00 and 18:00 reached 9.5 %, 8 % and 5 % of the total seasonal load, while in 2025 they were slightly lower but still substantial, at 7.5 %, 7 % and 5 %, respectively. This pattern reflects a typical daily trend, with the lowest pollen concentrations in the morning, higher levels around midday and a peak in the late afternoon, highlighting this period as critical for Alnus pollen dispersal and its overall impact on seasonal exposure. Betula displayed a distinct temporal pattern, with peak pollen concentrations occurring in the evening between 20:00 and 00:00, as well as in the morning between 06:00 and 10:00. During these periods, hourly contributions ranged from 4 % to 5 % of the seasonal total, indicating that both morning and evening represent windows of elevated Betula pollen concentrations, with potential implications for allergy sufferers during these times.
For Fraxinus, pollen concentrations gradually increased in the morning, reaching a peak around midday (11:00–14:00), with hourly contributions ranging from 5 % to 6 %. Additional moderate peaks were observed in the late morning, early afternoon and evening, reflecting a more extended period of pollen availability compared to Alnus and Betula. This pattern suggests that Fraxinus contributes to sustained exposure throughout the central part of the day.
Pinus exhibited pronounced morning and midday peaks, with the highest hourly contribution reaching 10 % at 10:00 in 2025. Overall, pollen levels remained consistently elevated throughout the day, ranging from 3 % to 6 %, with the lowest values observed between 03:00 and 05:00. This extended period of substantial emission reflects both high variability and prolonged daytime dispersal, making Pinus a major contributor to airborne pollen over a broad temporal window.
Quercus exhibited a bimodal pattern of pollen concentrations, with morning peaks occurring between 06:00 and 09:00 and a second, more pronounced peak in the evening between 18:00 and 00:00. Hourly contributions during these periods reached up to 8 % of the seasonal load, indicating that both early morning and evening represent critical windows for Quercus pollen exposure.

Figure 7Spearman correlation matrix between meteorological variables and pollen concentrations. The correlation matrix is based on daily pollen season data (2024–2025) and corresponding meteorological data for the same period. Abbreviations: hum – relative humidity, rain – precipitation sum, sun – sunshine duration, temp – air temperature at 2 m, wind – wind speed.
3.5 Meteorological Parameters and Pollen Concentrations
The Spearman correlation matrix (Fig. 7) provides an overview of the associations between hourly meteorological parameters and pollen concentrations for multiple tree taxa, thereby identifying the principal drivers of pollen variability and informing their predictive potential.
In the case of Alnus, pollen concentration showed a clear negative correlation with relative humidity (, p<0.001) and temperature (, p<0.001). In contrast, the influence of wind and sunshine duration was relatively weak (ρ=0.08 and 0.02, respectively).
Betula exhibited the strongest negative correlation with relative humidity (, p<0.001), whereas the effect of temperature was minimal (, ns) and solar radiation showed a moderately positive effect (ρ=0.14, p<0.001).
For Fraxinus, pollen concentration correlated moderately positively with sunshine duration (ρ=0.07, p<0.001) and wind (ρ=0.08, p<0.001), while humidity (, p<0.001) and temperature (, p<0.001) had weaker negative effects.
Pinus showed the highest positive correlations with sunshine duration (ρ=0.15, p<0.001) and temperature (ρ=0.14, p<0.001), whereas humidity had a slight negative influence (, p<0.001) and wind was nearly neutral (ρ=0.01, ns).
In the case of Quercus, pollen exhibited a moderate positive relationship with temperature (ρ=0.09, p<0.001) and weaker positive correlations with sunshine duration (ρ=0.11, p<0.001) and wind (ρ=0.04, p<0.001), while humidity showed a slight negative effect (, p<0.001).
The following analysis (Tables S1–S5 in the Supplement) focuses on the hourly correlations between these variables, highlighting how their relationships change throughout the day.
For Alnus (Table S1), the Spearman results indicate a clear diurnal/seasonal pattern. The air temperature, in the pollen seson, shows a strong positive correlation with pollen counts, particularly during midday-afternoon. Relative humidity is negatively correlated with pollen counts. The signal is the strongest in March, in early morning hours (around 08:00) and night/late-evening (19:00–21:00). When comparing February and March, temperature emerges as the dominant driver in February, while in March humidity is the meteorological variable most consistently associated with pollen concentrations.
For Betula (Table S2), Spearman correlations revealed strong positive associations between pollen concentrations and air temperature, particularly during daytime hours, with peak correlations reaching r≈0.65–0.70 (p<0.01). Relative humidity was consistently negatively correlated ( to −0.60, p<0.05–0.01), while sunshine duration showed moderate positive effects in the morning. Rainfall effects were mostly non-significant. Seasonal differences indicated that in March, temperature and humidity effects were concentrated during the day, whereas in April, their influence extended more evenly into the evening and night, with wind becoming a more important factor.
For Fraxinus (Table S3), air temperature positively influenced pollen concentrations, with correlations reaching r≈0.60–0.68 (p<0.01), particularly during daytime hours in March and during the afternoon, evening and night in April. Relative humidity showed a negative relationship ( to −0.55, p<0.05–0.01), especially in the early and late hours of March and during the night in April. Sunshine duration, rainfall and wind effects were generally non-significant.
For Pinus (Table S4), temperature effects were weaker compared to other taxa, showing moderate negative correlations during early morning and late-night hours in May ( to −0.40, p<0.05). Relative humidity consistently exhibited strong negative correlations ( to −0.65, p<0.01), particularly in May, while sunshine duration showed occasional positive associations during the afternoon. Wind and rainfall effects were negligible.
For Quercus (Table S5), pollen concentrations showed strong positive correlations with air temperature throughout the entire day in April (r≈0.60–0.72, p<0.01), while other meteorological factors had no significant influence.
Table 2Spearman's correlations between hourly pollen concentrations and PBL height in Wrocław (2024–2025).


Spearman's rank correlations between hourly pollen concentrations and planetary boundary layer (PBL) height were positive for all taxa, indicating that higher PBL heights are generally associated with increased pollen concentrations. The strongest correlations were observed for Betula and Alnus, while Pinus showed the weakest relationship. All correlations were statistically significant (p<0.001), indicating a consistent link between boundary layer dynamics and short-term variations in pollen concentrations and highlighting the role of atmospheric mixing in pollen dispersion across different taxa.
The relationship between pollen concentrations and and wind direction is presented in Fig. 8. For Alnus, Betula and Fraxinus the highest pollen concentrations are from the southern sector, which contributes about 25 %. High contributions (20 %–25 %) to total count is from the SE for Betula and Fraxinus and W for Alnus. The results are significantly different for Pinus and Quercus. Pinus pollen showed a clear west-east transport pattern, with the highest contributions from western (36.1 %) and eastern (21 %) winds, while Quercus pollen was mainly associated with southeastern (44.4 %) and southern (27.8 %) winds. Northern winds contributed minimally (<5 %) to the dispersal of all taxa, with the lowest influence from NW, N and NE directions.
Erb et al. (2025) discussed how to design measurement campaigns and mentioned that local data collection is essential for accurate model calibration. Our study confirms that the newly developed model, trained on locally collected pollen data, outperforms the model retrained on data from a different region. However, it is important to note that the new model was also trained using fluorescence information, which could improve detection efficiency (Crouzy et al., 2025). The performance of the old model, which is based solely on holography, may vary over time depending on the presence of false signals, i.e. particles resembling specific pollen taxa, which can occur in the atmosphere and potentially interfere with the classification. New model more accurately capturing both the seasonal timing and the daily variability. In contrast, the previous model tends to overestimate concentration magnitudes and fails to represent temporal variations with sufficient precision.
The enhanced detection efficiency observed in this study aligns with the study of Maya-Manzano et al. (2023) for Munich (southern Germany), who reported comparable R2 values for Quercus and higher values for Fraxinus, although lower for Betula. Their work also highlighted the weaker correspondence between real-time monitoring devices and Hirst-type measurements, underscoring the ongoing challenges in reconciling automated and traditional methods. While Hirst-type traps remain the gold standard in aerobiology, they have inherent limitations, such as low temporal resolution and dependence on manual counting. This raises important considerations when comparing real-time data with Hirst measurements (Tummon et al., 2024).
In our work, the locally trained model consistently outperformed the reference model, particularly at low and medium pollen concentrations, showing enhanced sensitivity and overall predictive accuracy. Both models achieved similar performance at high concentrations, indicating reliable detection under extreme pollen loads. This indicates that if the primary goal is to issue warnings for high pollen levels, models retrained using data from other regions may still perform adequately. However, the improved sensitivity of the locally retrained model at lower concentrations is particularly important for operational air-quality monitoring and early warning systems, as it allows for more timely identification of pollen events relevant to public health. Similar challenges related to underestimation at low concentrations were also reported by Tummon et al. (2024), further supporting the need for region-specific model retraining.
This study provides a detailed description of the measurement campaign and its methodology. The lowest amount of pollen was collected from Fraxinus, which was influenced by the low number of training events and consequently, Fraxinus exhibited the lowest R2 among all taxa. This underscores the importance of properly extracting sufficient amounts of pollen from catkins. Pinus also showed a relatively low R2 compared to Alnus, Betula and Quercus, which is likely due to interference from morphologically similar pollen grains, such as spruce or larch (Szczepanek et al., 2017). Therefore, one possible solution could be to aggregate data within the Pinaceae group.
Analysis of hourly pollen percentages revealed distinct diurnal patterns consistent with daily meteorological rhythms, as also reported by Chappuis et al. (2020). Alnus peaked in the late afternoon (16:00–18:00) as the first major pollen-releasing taxon of the season. Betula and Quercus exhibited bimodal patterns, with morning and evening peaks. In contrast, Fraxinus and Pinus maintained relatively high pollen concentrations throughout the day. These results align with previous observations in Europe, including Ščevková et al. (2015) and Toth et al. (2011), who noted daytime peaks for Fraxinus, Alnus, Corylus and Pinus, as well as afternoon and night-time peaks for Betula and Cupressaceae-Taxaceae. Similar bimodal patterns have been reported by Dąbrowska-Zapart et al. (2020).
Our findings regarding evening peaks suggest that nocturnal maxima are influenced not only by local pollen release but also by the secondary deposition of previously emitted or transported pollen (Grewling et al., 2016; Ščevková et al., 2015). For instance, Betula and Fraxinus produce small pollen grains with low settling velocities, making them prone to long-distance transport and prolonged suspension within the atmospheric boundary layer. During daytime heating, thermal convection lifts pollen grains to higher altitudes; once convection weakens in the evening, these particles gradually descend, resulting in elevated nighttime concentrations (Clot, 2001; Kasprzyk et al., 2001; Käpylä, 1984).
The local urban effects may also enhance nocturnal concentrations. The heating of anthropogenic surfaces (e.g., buildings and roads) during the day and subsequent nighttime radiative cooling can modify near-surface circulation, promoting weak turbulence and the resuspension of previously settled pollen grains. Such mechanisms may partly explain the persistence of elevated evening levels, particularly under calm and dry conditions. Given the low gravitational settling velocity of these taxa, deposition from the boundary layer (∼ 1 km) may take more than 24 h (Ščevková et al., 2015), further supporting the hypothesis that the observed evening and nocturnal peaks reflect both delayed sedimentation and localized resuspension.
Night-time increases were also noted in Kluska et al. (2020), who reported that low relative humidity and calm winds favor elevated concentrations of Betula, Pinus and Poaceae pollen at night. Resuspension of previously settled pollen appears to play a minor role in our dataset, as evening conditions, characterized by higher humidity, lower temperatures and moderate wind speeds, were generally unfavorable for significant re-entrainment, which is consistent with findings of Ščevková et al. (2015).
Meteorological factors were key drivers of hourly pollen variability. Our findings confirm the well-known pattern of increased pollen concentrations during warm and sunny days and decreased concentrations under high humidity or rainy conditions (Malkiewicz et al., 2016; Ščevková et al., 2015; Tomczyk et al., 2025; Ziska et al., 2019). However, rainfall was not always statistically significant, highlighting the complex nature of its influence on pollen concentrations, as some studies even report increases in concentrations after precipitation events (Kluska et al., 2020). The effect varies with rainfall intensity and type, as precipitation processes are associated with pollen wash-out. Kluska et al. (2020) showed that under low-intensity rainfall (<1.0–2.5 mm h−1), no decreases and even slight increases in pollen concentrations can occur. Interestingly, early-season pollen, such as that from Alnus, showed no significant correlation with sunlight and even a negative association with temperature. This contrasts with the findings of Borycka and Kasprzyk (2018), who reported that Betula did not exhibit significant correlations with meteorological variables, while Alnus showed strong relationships. In the present study, Fraxinus and Betula also displayed different patterns, with no consistent correlation with temperature, whereas later-season trees, such as Pinus and Quercus, exhibited positive associations with temperature. Wind was generally an important factor influencing pollen dispersal and increasing concentrations; however, this was not observed for Pinus. This is likely related to the morphological features of Pinus pollen, which has air sacs that enhance its dispersal, combined with the high pollen output of the species, making wind less critical for effective transport (Szczepanek et al., 2017).
Early-spring taxa, Alnus and Betula, displayed strong positive correlations with air temperature and negative correlations with relative humidity, particularly between 12:00 and 18:00, when concentrations typically increased. This pattern supports the hypothesis that warm and dry afternoon conditions promote pollen release, consistent with observations by Dąbrowska-Zapart et al. (2020) and Kluska et al. (2020), who also found that high temperature and solar radiation act as primary triggers of emission. For Betula, the most pronounced temperature effect occurred in the late afternoon and evening (14:00–22:00), coinciding with the timing of observed concentration peaks. However, it differs between months, which suggests that the phase of pollen release is likely correlated with meteorological conditions, so the early part of the pollination period in March shows different sensitivity compared to April. It is also well known that for early-flowering plant taxa, the timing of the pollen season can vary considerably from year to year (Malkiewicz et al., 2016). Interestingly, sunshine duration showed a relationship with both taxa only in March, mainly during the morning hours. Many studies emphasize the importance of temperature for the development of inflorescences; however, it is possible that pollen emission and flower opening are primarily triggered by sunshine duration. Favorable thermal conditions may then mainly support continued emission and the persistence of pollen in the air, which could explain the increased association during later hours (Malkiewicz et al., 2016; Nowosad et al., 2018; Picornell et al., 2019; Werner et al., 2021). Among all taxa, only Betula exhibited a correlation with wind around midday in April. Wind was previously identified as an important factor by Puc et al. (2015) and Puc (2006), whereas Tomczyk et al. (2025) reported that wind does not play a significant role. Nevertheless, it should be noted that their findings were based on daily data, while the present analysis is conducted on an hourly scale.
Fraxinus exhibited a similar dependence on temperature and sunshine duration, with maximum correlations observed between 10:00 and 16:00. It is also evident that the daily pattern differs between months: in March, temperature was the most important factor during the day and evening, while relative humidity showed higher correlation in the evening and night. In April, temperature played a key role in the morning, evening and night, whereas relative humidity showed the highest correlation at night. Kubik-Komar et al. (2018) also identified Fraxinus as a taxon whose pollen concentration is particularly related to temperature, noting that the timing of the season may vary depending on meteorological conditions during the first part of the year. Therefore, the observed correlations may also differ between months, depending on the prevailing weather conditions.
Pinus showed negative correlations with temperature (morning and night) and with humidity (except in the morning), which is opposite to the results presented in the overall analysis (Fig. 7), where early-pollinating taxa showed negative correlations with temperature and Pinus showed positive correlations. This highlights the complex nature of the relationship between pollen concentration and meteorological conditions. It should be underlined that the aerodynamic properties of Pinus pollen allow it to remain airborne for a long time, which may explain the lack of correlation with current meteorological conditions, as this pollen could have been released earlier (Szczepanek et al., 2017).
Quercus, which flowers later in the season, was linked to temperature throughout the day, exhibiting a bimodal pollen release pattern with peaks in the morning (06:00–09:00) and evening (18:00–22:00), likely reflecting local meteorological control. Interestingly, temperature appeared to be important throughout the entire day only in April, probably because approximately 75 % of the seasonal pollen amount occurs during the first two weeks of the season, as noted by Grewling et al. (2014).
The positive and statistically significant correlations between planetary boundary layer height and hourly pollen concentrations suggest that atmospheric mixing plays an important role in the short-term variability of pollen levels, as confirmed by Andújar-Maqueda et al. (2025). Stronger correlations observed for Betula and Alnus compared to Pinus may reflect differences in pollen release patterns and dispersal mechanisms. In particular, Pinus pollen, due to its aerodynamic shape and morphology, may be dispersed through mechanisms less directly linked to planetary boundary layer height. This is supported by the lack of a significant correlation with wind speed, suggesting that other factors, such as local turbulence or canopy-level processes, could play a more important role in its short-term variability. It is reflected in planetary boundary layer (PBL) processes, where studies suggest that katabatic flows can enhance pollen concentrations at night, while daytime convective turbulence promotes dispersion, contributing to variability near the surface. More generally, differences between pollen types arise from interacting factors such as source distribution, meteorological conditions, PBL structure, pollen properties, flowering phenology, and other environmental influences (Andújar-Maqueda et al., 2025).
Wind direction was significantly associated with hourly pollen levels. The highest concentrations were typically linked to airflows from vegetated areas upwind of the monitoring site. This finding is consistent with Dąbrowska-Zapart et al. (2020), who also demonstrated that wind direction significantly influences short-term (hourly) variations in pollen and spore concentrations.
Overall, our results highlight the need to consider taxon-specific diurnal patterns, meteorological drivers and local environmental context when interpreting pollen measurements and developing predictive models. The combination of high temporal resolution monitoring and incorporation of local taxa into model training substantially improves the ability to capture real-time pollen fluctuations, peak exposure periods and species-specific variability, which are critical for accurate forecasting and public health applications.
Our results showed that retraining the neural network model with locally collected pollen data improves predictive accuracy for Alnus, Betula, Fraxinus, Pinus and Quercus, especially at low and medium pollen concentrations, compared to models trained on data from other regions. The retrained model correlates more closely with Hirst measurements in terms of the start and end of the season, as well as the concentration levels and can provide valuable information for pollen information system or pollen forecasting.
Based on two years of automatic pollen concentration measurements, we present diurnal pollen variability, which exhibits distinct patterns depending on the taxon. People with allergies should avoid pollen peak hours. These are:
-
Alnus: late afternoon peak (16:00–18:00)
-
Betula: evening peak (18:00–22:00)
-
Fraxinus: midday peak (12:00–13:00), additional moderate afternoon peaks
-
Pinus: high levels throughout the day, morning and midday peaks (10:00)
-
Quercus: bimodal pattern – morning (06:00–09:00) and evening (18:00–22:00) peaks
Temperature and low relative humidity are the main drivers of pollen release, while sunshine duration enhances emission for Fraxinus, Pinus and Quercus. Hourly analyses reveal that the strength of correlations between pollen concentrations and meteorological factors varies throughout the day and depends on the phase of the flowering season or month.
The planetary boundary layer height has only a limited direct influence on hourly pollen concentration variability, with particularly lower correlations observed for Pinus.
Wind direction affects pollen dispersal, with southern and southeastern winds contributing most, highlighting the influence of local land cover and the surroundings of the monitoring station.
The training datasets are available at: https://doi.org/10.34616/DMTZAB (Tomczyk et al., 2026).
The supplement related to this article is available online at https://doi.org/10.5194/amt-19-4779-2026-supplement.
ST: Conceptualization, Methodology, Investigation, Formal analysis, Writing – Original Draft, Writing – review and editing, Visualization.
MW: Conceptualization, Supervision, Funding acquisition, Writing – Review & Editing, Investigation.
MM: Supervision, Writing – Review & Editing, Investigation.
KB: Writing – Review & Editing, Investigation.
The contact author has declared that none of the authors has any competing interests.
Publisher's note: Copernicus Publications remains neutral with regard to jurisdictional claims made in the text, published maps, institutional affiliations, or any other geographical representation in this paper. The authors bear the ultimate responsibility for providing appropriate place names. Views expressed in the text are those of the authors and do not necessarily reflect the views of the publisher.
The calculation of PBL height using WRF was carried out at the Wrocław Centre for Networking and Supercomputing (http://www.wcss.wroc.pl, last access: 1 July 2026), Grant No. 170.
This research has been supported by the Narodowe Centrum Nauki (grant no. 2023/51/B/ST10/01361) and the Narodowe Centrum Nauki (grant no. UMO2024/53/N/ST10/01341).
This paper was edited by Marloes Penning de Vries and reviewed by Ellen-Wien Augustijn and Benoît Crouzy.
Adamov, S., Lemonis, N., Clot, B., Crouzy, B., Gehrig, R., Graber, M. J., Sallin, C., and Tummon, F.: On the measurement uncertainty of Hirst-type volumetric pollen and spore samplers, Aerobiologia, 40, 77–91, https://doi.org/10.1007/s10453-021-09724-5, 2024.
Adams-Groom, B., Selby, K., Derrett, S., Frisk, C. A., Pashley, C. H., Satchwell, J., King, D., McKenzie, G., and Neilson, R.: Pollen season trends as markers of climate change impact: Betula, Quercus and Poaceae, Sci. Total Environ., 831, 154882, https://doi.org/10.1016/j.scitotenv.2022.154882, 2022.
Anderegg, W. R. L., Abatzoglou, J. T., Anderegg, L. D. L., Bielory, L., Kinney, P. L., and Ziska, L.: Anthropogenic climate change is worsening North American pollen seasons, P. Natl. Acad. Sci. USA, 118, e2013284118, https://doi.org/10.1073/pnas.2013284118, 2021.
Andújar-Maqueda, J., Ortiz-Amezcua, P., Cariñanos, P., Abril-Gago, J., De Linares, C., de Arruda Moreira, G., Bravo-Aranda, J. A., Granados-Muñoz, M. J., Alados-Arboledas, L., and Guerrero-Rascado, J. L.: The role of atmospheric boundary layer wind and turbulence on surface pollen levels, Agr. Forest Meteorol., 371, 110584, https://doi.org/10.1016/j.agrformet.2025.110584, 2025.
Beggs, P. J., Clot, B., Sofiev, M., and Johnston, F. H.: Climate change, airborne allergens, and three translational mitigation approaches, eBioMedicine, 93, 104478, https://doi.org/10.1016/j.ebiom.2023.104478, 2023.
Biedermann, T., Winther, L., Till, S. J., Panzner, P., Knulst, A., and Valovirta, E.: Birch pollen allergy in Europe, Allergy, 74, 1237–1248, https://doi.org/10.1111/all.13758, 2019.
Borycka, K. and Kasprzyk, I.: Hourly pattern of allergenic alder and birch pollen concentrations in the air: Spatial differentiation and the effect of meteorological conditions, Atmos. Environ., 182, 179–192, https://doi.org/10.1016/j.atmosenv.2018.03.048, 2018.
BSI Standards Limited: PD CEN/TS 16868:2015, Ambient air, Sampling and analysis of airborne pollen grains and fungal spores for allergy networks, Volumetric Hirst method, 2015.
Buters, J., Clot, B., Galán, C., Gehrig, R., Gilge, S., Hentges, F., O'Connor, D., Sikoparija, B., Skjoth, C., Tummon, F., Adams-Groom, B., Antunes, C. M., Bruffaerts, N., Çelenk, S., Crouzy, B., Guillaud, G., Hajkova, L., Kofol Seliger, A., Oliver, G., Ribeiro, H., Rodinkova, V., Saarto, A., Sauliene, I., Sozinova, O., and Stjepanovic, B.: Automatic detection of airborne pollen: An overview, Aerobiologia, 40, 13–37, https://doi.org/10.1007/s10453-022-09750-x, 2024.
Chappuis, C., Tummon, F., Clot, B., Konzelmann, T., Calpini, B., and Crouzy, B.: Automatic pollen monitoring: first insights from hourly data, Aerobiologia, 36, 159–170, https://doi.org/10.1007/s10453-019-09619-6, 2020.
Clot, B.: Airborne birch pollen in Neuchâtel (Switzerland): Onset, peak and daily patterns, Aerobiologia, 17, 25–29, https://doi.org/10.1023/A:1007652220568, 2001.
Crouzy, B., Meurville, M. P., Clot, B., Erb, S., Lbadaoui-Darvas, M., Tummon, F., and Lieberherr, G.: Operational pollen classification using digital holography and fluorescence, Aerobiologia, 41, 841–846, https://doi.org/10.1007/s10453-025-09882-w, 2025.
D'Amato, G., Cecchi, L., Bonini, S., Nunes, C., Annesi-Maesano, I., Behrendt, H., Liccardi, G., Popov, T., and Van Cauwenberge, P.: Allergenic pollen and pollen allergy in Europe, Allergy, 62, 976–990, https://doi.org/10.1111/j.1398-9995.2007.01393.x, 2007.
Dąbrowska-Zapart, K., and Niedźwiedź, T.: Height and hourly variations in the concentration of airborne pollen grains and fungal spores in Sosnowiec (Poland), Alergoprofil, 16, 21–23, https://doi.org/10.24292/01.AP.161120220, 2020.
Erb, S., Graf, E., Zeder, Y., Lionetti, S., Berne, A., Clot, B., Lieberherr, G., Tummon, F., Wullschleger, P., and Crouzy, B.: Real-time pollen identification using holographic imaging and fluorescence measurements, Atmos. Meas. Tech., 17, 441–451, https://doi.org/10.5194/amt-17-441-2024, 2024.
Erb, S., Berne, A., Clot, B., Lbadaoui-Darvas, M., Lieberherr, G.-D., Meurville, M. P., Tummon, F., and Crouzy, B.: Pollen holographic images and light-induced fluorescence measurements at the species level, Sci. Data, 12, 786, https://doi.org/10.1038/s41597-025-05139-w, 2025.
Farooq, Q., Oteros, J., and Galán, C.: Advancing in the pollen frontier: A comprehensive evaluation and meta-analysis of automatic pollen monitoring systems, Aerobiologia, 41, 527–546, https://doi.org/10.1007/s10453-025-09865-x, 2025.
Galán, C., Smith, M., Thibaudon, M., Frenguelli, G., Oteros, J., Gehrig, R., Berger, U., Clot, B., Brandao, R., and EAS QC Working Group: Pollen monitoring: Minimum requirements and reproducibility of analysis, Aerobiologia, 30, 385–395, https://doi.org/10.1007/s10453-014-9335-5, 2014.
Gimenez, B., Joannin, S., Pasquet, J., Beaufort, L., Gally, Y., de Garidel-Thoron, T., Combourieu-Nebout, N., Bouby, L., Canal, S., Ivorra, S., Limier, B., Terral, J.-F., Devaux, C., and Peyron, O.: A user-friendly method to get automated pollen analysis from environmental samples, New Phytol., 243, 797–810, https://doi.org/10.1111/nph.19857, 2024.
Grabska-Szwagrzyk, E., Tiede, D., Sudmanns, M., and Kozak, J.: Map of forest tree species for Poland based on Sentinel-2 data, Earth Syst. Sci. Data, 16, 2877–2891, https://doi.org/10.5194/essd-16-2877-2024, 2024.
Grewling, Ł., Jackowiak, B., and Smith, M.: Variations in Quercus sp. pollen seasons (1996–2011) in Poznań, Poland, in relation to meteorological parameters, Aerobiologia, 30, 149–159, https://doi.org/10.1007/s10453-013-9313-3, 2014.
Grewling, Ł., Bogawski, P., and Smith, M.: Pollen nightmare: Elevated airborne pollen levels at night, Aerobiologia, 32, 725–728, https://doi.org/10.1007/s10453-016-9441-7, 2016.
Grewling, Ł., Ribeiro, H., Antunes, C., Apangu, G. P., Çelenk, S., Costa, A., Eguiluz-Gracia, I., Galveias, A., Gonzalez Roldan, N., Lika, M., Magyar, D., Martinez-Bracero, M., Ørby, P., O'Connor, D., Marchã Penha, A., Pereira, S., Pérez-Badia, R., Rodinkova, V., Xhetani, M., Šaulienė, I., and Skjøth, C. A.: Outdoor airborne allergens: Characterization, behavior and monitoring in Europe, Sci. Total Environ., 905, 167042, https://doi.org/10.1016/j.scitotenv.2023.167042, 2023.
Hirst, J. M.: An automatic volumetric spore trap, Ann. Appl. Biol., 39, 257–265, https://doi.org/10.1111/j.1744-7348.1952.tb00904.x, 1952.
Kasprzyk, I., Harmata, K., Myszkowska, D., Stach, A., and Stępalska, D.: Diurnal variation of chosen airborne pollen at five sites in Poland, Aerobiologia, 17, 327–345, https://doi.org/10.1023/A:1013078627196, 2001.
Kluska, K., Piotrowicz, K., and Kasprzyk, I.: The impact of rainfall on the diurnal patterns of atmospheric pollen concentrations, Agr. Forest Meteorol., 291, 108042, https://doi.org/10.1016/j.agrformet.2020.108042, 2020.
Kubik-Komar, A., Piotrowska-Weryszko, K., Weryszko-Chmielewska, E., and Kaszewski, B. M.: Analysis of Fraxinus pollen seasons and forecast models based on meteorological factors, Ann. Agr. Env. Med., 25, 285–291, https://doi.org/10.26444/aaem/80909, 2018.
Käpylä, M.: Diurnal variation of tree pollen in the air in Finland, Grana, 23, 167–176, https://doi.org/10.1080/00173138409427712, 1984.
Lake, I. R., Jones, N. R., Agnew, M., Goodess, C. M., Giorgi, F., Hamaoui-Laguel, L., Semenov, M. A., Solomon, F., Storkey, J., Vautard, R., and Epstein, M. M.: Climate change and future pollen allergy in Europe, Environ. Health Persp., 125, 385–391, https://doi.org/10.1289/EHP173, 2017.
Malkiewicz, M., Drzeniecka-Osiadacz, A., and Krynicka, J.: The dynamics of the Corylus, Alnus, and Betula pollen seasons in the context of climate change (SW Poland), Sci. Total Environ., 573, 740–750, https://doi.org/10.1016/j.scitotenv.2016.08.103, 2016.
Maya-Manzano, J. M., Tummon, F., Abt, R., Allan, N., Bunderson, L., Clot, B., Crouzy, B., Daunys, G., Erb, S., Gonzalez-Alonso, M., Graf, E., Grewling, Ł., Haus, J., Kadantsev, E., Kawashima, S., Martinez-Bracero, M., Matavulj, P., Mills, S., Niederberger, E., Lieberherr, G., and Buters, J.: Towards European automatic bioaerosol monitoring: Comparison of 9 automatic pollen observational instruments with classic Hirst-type traps, Sci. Total Environ., 866, 161220, https://doi.org/10.1016/j.scitotenv.2022.161220, 2023.
MeteoSwiss Biometeorology Team: SwissPollen models, GitHub, https://github.com/MeteoSwiss/swisspollen-models (last access: 20 June 2026), 2025.
Nilsson, S. and Persson, S.: Tree pollen spectra in the Stockholm region (Sweden), 1973–1980, Grana, 20, 179–182, https://doi.org/10.1080/00173138109427661, 1981.
Nowosad, J., Stach, A., Kasprzyk, I., Chłopek, K., Dąbrowska-Zapart, K., Grewling, Ł., Latałowa, M., Pędziszewska, A., Majkowska-Wojciechowska, B., Myszkowska, D., Piotrowska-Weryszko, K., Weryszko-Chmielewska, E., Puc, M., Rapiejko, P., and Stosik, T.: Statistical techniques for modeling of Corylus, Alnus, and Betula pollen concentration in the air, Aerobiologia, 34, 301–313, https://doi.org/10.1007/s10453-018-9514-x, 2018.
Pacheco, S. E., Guidos-Fogelbach, G., Annesi-Maesano, I., Pawankar, R., D'Amato, G., Latour-Staffeld, P., Urrutia-Pereira, M., Kesic, M. J., Hernandez, M. L., and American Academy of Allergy, Asthma & Immunology Environmental Exposures and Respiratory Health Committee: Climate change and global issues in allergy and immunology, J. Allergy Clin. Immun., 148, 1366–1377, https://doi.org/10.1016/j.jaci.2021.10.011, 2021.
Paudel, B., Chu, T., Chen, M., Sampath, V., Prunicki, M., and Nadeau, K. C.: Increased duration of pollen and mold exposure are linked to climate change, Sci. Rep., 11, 12816, https://doi.org/10.1038/s41598-021-92178-z, 2021.
Picornell, A., Buters, J., Rojo, J., Traidl-Hoffmann, C., Damialis, A., Menzel, A., Bergmann, K. C., Werchan, M., Schmidt-Weber, C., and Oteros, J.: Predicting the start, peak and end of the Betula pollen season in Bavaria, Germany, Sci. Total Environ., 690, 1299–1309, https://doi.org/10.1016/j.scitotenv.2019.06.485, 2019.
Puc, M., Wolski, T., Camacho, I. C., Myszkowska, D., Kasprzyk, I., Grewling, Ł., Nowak, M., Weryszko-Chmielewska, E., Piotrowska-Weryszko, K., Chłopek, K., Dąbrowska-Zapart, K., Majkowska-Wojciechowska, B., Balwierz, Z., Malkiewicz, M., Grinn-Gofroń, A., Stacewicz, A., Kruczek, A., and Borycka, K.: Fluctuation of birch (Betula L.) pollen seasons in Poland, Acta Agrobot., 68, https://doi.org/10.5586/aa.2015.041, 2015.
Puc, M.: Birch pollen grains in the air of Szczecin in 2000–2004, Acta Agrobot., 59, https://doi.org/10.5586/aa.2006.034, 2006.
Rapiejko, P., Stankiewicz, W., and Szczygielski, K., Jurkiewicz, D.: Threshold pollen concentration required to trigger allergic symptoms, Otolaryngologia Polska, 61, 591–594, https://doi.org/10.1016/S0030-6657(07)70491-2, 2007.
Rodríguez-Rajo, F. J., Fdez-Sevilla, D., Stach, A., and Jato, V.: Assessment between pollen seasons in areas with different urbanization level related to local vegetation sources and differences in allergen exposure, Aerobiologia, 26, 1–14, https://doi.org/10.1007/s10453-009-9138-2, 2010.
Rojo, J., Cervigón, P., Ferencova, Z., Cascón, Á., Galán Díaz, J., Romero-Morte, J., Sabariego, S., Torres, M., and Montserrat Gutiérrez-Bustillo, A.: Assessment of environmental risk areas based on airborne pollen patterns as a response to land use and land cover distribution, Environ. Pollut., 344, 123385, https://doi.org/10.1016/j.envpol.2024.123385, 2024.
Sauvageat, E., Zeder, Y., Auderset, K., Calpini, B., Clot, B., Crouzy, B., Konzelmann, T., Lieberherr, G., Tummon, F., and Vasilatou, K.: Real-time pollen monitoring using digital holography, Atmos. Meas. Tech., 13, 1539–1550, https://doi.org/10.5194/amt-13-1539-2020, 2020.
Shamrat, F. M. J., Idris, M. Y. I., Zhou, X., Khalid, M., Sharmin, S., Sharmind, Z., Ahmed, K., and Moni, M. A.: PollenNet: A novel architecture for high precision pollen grain classification through deep learning and explainable AI, Heliyon, 10, e38596, https://doi.org/10.1016/j.heliyon.2024.e38596, 2024.
Skamarock, W. C., Klemp, J. B., Dudhia, J., Gill, D. O., Liu, Z., Berner, J., Wang, W., Powers, J. G., Duda, M. G., Barker, D. M., and Huang, X.-Y.: A description of the Advanced Research WRF Model Version 4.3. NCAR/TN-556+STR, Boulder, Colorado, USA, https://doi.org/10.5065/1dfh-6p97, 2021.
Sofiev, M., Bergmann, K. C., Siljamo, P., Belmonte, J., Gehrig, R., Izquierdo, R., Smith, M., and Dahl, Å.: Airborne Pollen Transport, in: Allergenic Pollen, edited by: Sofiev, M. and Bergmann, K. C., Springer, Dordrecht, 127–159, https://doi.org/10.1007/978-94-007-4881-1_5, 2013.
Szczepanek, K., Myszkowska, D., Worobiec, E., Piotrowicz, K., Ziemianin, M., and Bielec-Bąkowska, Z.: The long-range transport of Pinaceae pollen: An example in Kraków (southern Poland), Aerobiologia, 33, 109–125, https://doi.org/10.1007/s10453-016-9454-2, 2017.
Ščevková, J., Dušička, J., Mičieta, K., and Somorčík, J.: Diurnal variation in airborne pollen concentration of six allergenic tree taxa and its relationship with meteorological parameters, Aerobiologia, 31, 457–468, https://doi.org/10.1007/s10453-015-9379-1, 2015.
Tomczyk, S., Werner, M., Malkiewicz, M., Bosiacka, B., Grewling, Ł., Grinn-Gofroń, A., Kasprzyk, I., Kluska, K., Majkowska-Wojciechowska, B., Myszkowska, D., Puc, M., Rapiejko, P., and Ziemianin, M.: Influence of meteorological conditions and climate on pollen season of the early-flowering woody taxa in Poland, Central Europe, Int. J. Biometeorol., 69, 2781–2793, https://doi.org/10.1007/s00484-025-02995-4, 2025.
Tomczyk, S., Werner, M., and Malkiewicz, M.: Swisens Poleno Jupiter training datasets, V1, Uniwersytet Wrocławski [data set], https://doi.org/10.34616/DMTZAB, 2026.
Toth, I., Peternel, R., Srnec, L., and Vojniković, B.: Diurnal variation in airborne pollen concentrations of the selected taxa in Zagreb, Croatia, Collegium Antropologicum, 35, 43–50, 2011.
Triviño, M. M., Maya-Manzano, J. M., Tummon, F., Clot, B., Grewling, Ł., Schmidt-Weber, C., and Buters, J.: Variability between Hirst-type pollen traps is reduced by resistance-free flow adjustment, Aerobiologia, 39, 257–273, https://doi.org/10.1007/s10453-023-09790-x, 2023.
Tummon, F., Adamov, S., Clot, B., Crouzy, B., Gysel-Beer, M., Kawashima, S., Lieberherr, G., Manzano, J., Markey, E., Moallemi, A., and O'Connor, D.: A first evaluation of multiple automatic pollen monitors run in paralel, Aerobiologia, 40, 93–108, https://doi.org/10.1007/s10453-021-09729-0, 2024
Werner, M., Guzikowski, J., Kryza, M., Malkiewicz, M., Bilińska, D., Skjøth, C. A., Rapiejko, P., Chłopek, K., Dąbrowska-Zapart, K., Lipiec, A., Jurkiewicz, D., Kalinowska, E., Majkowska-Wojciechowska, B., Myszkowska, D., Piotrowska-Weryszko, K., Puc, M., Rapiejko, A., Siergiejko, G., Weryszko-Chmielewska, E., Wieczorkiewicz, A., and Ziemianin, M.: Extension of WRF-Chem for birch pollen modelling – a case study for Poland, Int. J. Biometeorol., 65, 513–526, https://doi.org/10.1007/s00484-020-02045-1, 2021.
World Allergy Organization: WAO White Book on Allergy: Update 2013, Milwaukee, WI: World Allergy Organization, ISBN 9780615929156, 2013.
Ziska, L. H., Makra, L., Harry, S. K., Bruffaerts, N., Hendrickx, M., Coates, F., Saarto, A., Thibaudon, M., Oliver, G., Damialis, A., Charalampopoulos, A., Vokou, D., Heiđmarsson, S., Guđjohnsen, E., Bonini, M., Oh, J.-W., Sullivan, K., Ford, L., Brooks, G. D., Myszkowska, D., and Crimmins, A. R.: Temperature-related changes in airborne allergenic pollen abundance and seasonality across the Northern Hemisphere: A retrospective data analysis, Lancet Planetary Health, 3, 124–131, https://doi.org/10.1016/S2542-5196(19)30015-4, 2019.