
the Creative Commons Attribution 4.0 License.
the Creative Commons Attribution 4.0 License.
 | 28 Jul 2026
A small-footprint Cavity Ring-Down Spectroscopy instrument for in situ measurements of NO3 and N2O5
Gunther N. T. E. Türk

Simone T. Andersen
Patrick Dewald
Jan Schuladen
Jos Lelieveld
We present a new, small-footprint instrument for point measurements of NO3 and N2O5. Both molecules play an important role in nocturnal atmospheric chemistry, impacting the NOx-budget and the oxidation of biogenic volatile organic compounds. NO3 and N2O5 are often present at concentrations of a few parts per trillion by volume (pptv) and their measurements in remote locations requires instrumentation that is easily transported and lightweight, but maintains high sensitivity and accuracy. We have constructed a relatively compact and light instrument for Cavity Ring-Down Spectroscopy (CRDS) with the dimensions (width × depth × height) of 55 cm × 55 cm × 150 cm and a weight of 50 kg that uses two independent cavities to quantify the mixing ratio of NO3 using an inlet at room temperature and the sum of NO3 + N2O5 via a thermal dissociation inlet. Under laboratory conditions, limits of detection (1σ Allan deviation at 1 s integration) for the NO3 and (NO3 + N2O5) channel are < 1 and < 2 pptv, respectively. This improves to about 0.1 and 0.2 pptv for 3 min integration. The total measurement uncertainty for NO3 is 9.8 % and ≥ 11.5 % for N2O5, depending on the NO3-to-N2O5 ratio.
In this publication, we present design details of the instrument, discuss its performance in a controlled environment as well as during a field campaign. Additionally, we present measurements of transmission losses for NO3 across different filter types and methods to reduce filter reactivity and allow reusability after a cleaning procedure.
- Article
(2923 KB) - Full-text XML
-
Supplement
(963 KB) - BibTeX
- EndNote


The nitrate radical (NO3) and dinitrogen pentoxide (N2O5) are important trace gases for nocturnal chemistry (Wayne et al., 1991). NO3 serves as a key nighttime initiator of nocturnal oxidation and, through its reactions with biogenic trace gases, plays an important role in linking anthropogenic and biogenic emissions (Ng et al., 2017). Originating predominantly from combustion-related anthropogenic sources, nitrogen oxides (NOx = NO + NO2) can be oxidized by ozone (O3) resulting in the formation of NO3 via Reactions (R1) and (R2).
NO3 is photolabile and reacts rapidly with NO (Reaction R3) so that NO3 mixing ratios exceed a few pptv (parts per trillion by volume) only at nighttime (Brown et al., 2003). The major nocturnal losses of NO3 are reaction with unsaturated (often biogenic) hydrocarbons like monoterpenes (Reaction R4), especially in forested regions (Atkinson and Arey, 2003). As the lifetime of NO at night is short (owing to reaction with O3) it contributes to NO3 nocturnal losses only when locally emitted from either combustion sources or soil (Pilegaard, 2013).
The organic nitrate products from Reaction (R4) at nighttime can contribute to secondary organic aerosol, be lost via dry deposition or hydrolysis to HNO3 or be photolysed the next day (Ng et al., 2017). The termolecular association reaction of NO3 with NO2 generates N2O5 (Reaction R5), which, through its thermal decomposition (Reaction R6), exists in thermal equilibrium with NO3 and NO2. In the boundary layer of temperate regions, all three constituents can coexist in detectable amounts.
The thermal equilibrium is described by the equilibrium constant with the respective rate coefficients ki associated with reaction (Ri). N2O5 can undergo heterogeneous hydrolysis to form aqueous HNO3 on particles, which can then be removed from the atmosphere by wet or dry deposition. NO3 and N2O5 can thus be considered intermediates in NOx loss at night and thereby reduce the rate of production of O3 the following day (Finlayson-Pitts and Pitts, 2000). Understanding their behaviour is necessary to improve our understanding of chemistry within the nocturnal boundary layer.
NO3 has a strong absorption feature at ∼ 662 nm which has been used to detect NO3 using Differential Optical Absorption Spectroscopy (DOAS) over long path lengths using natural light sources such as moon-light (Noxon et al., 1978; Smith and Solomon, 1990; Wagner et al., 2000), scattered sunlight (Aliwell and Jones, 1998; Allan et al., 2002; von Friedeburg et al., 2002; Geyer et al., 2003) and artificial light sources for “active” DOAS measurements of NO3 close to ground level over path lengths of a few km (Platt et al., 1980; Geyer et al., 2001; Smith et al., 1995; Carslaw et al., 1997; Stutz et al., 2004). Note that DOAS instruments do not detect N2O5.
The availability of highly reflective cavity mirrors and cheap laser diodes has recently resulted in a great increase in the deployment of optical resonator (“cavity”) instruments in which two highly reflective mirrors are used to generate effective absorption path lengths of several tens of kilometres (Mazurenka et al., 2005; Berden et al., 2000). Broadband cavity enhanced absorption spectroscopy (BBCEAS, see e.g. Fiedler et al.. 2003) and cavity ring-down spectroscopy (CRDS, see e.g. Brown and Stutz, 2012) typically attain very low limits of detection (Dorn et al., 2013) and have become the most common methods for measuring NO3. The detection of N2O5 (via cavity spectroscopy or laser induced fluorescence) is achieved via its conversion (in a “thermal dissociation inlet”) to NO3 so that the sum of both ambient NO3 and thermally dissociated N2O5 is measured (Brown et al., 2001; Ayers et al., 2005; Schuster et al., 2009; Matsumoto et al., 2005). Similar to absorption spectroscopy methods based on the Lambert–Beer law, CEAS and CRDS require “zero” measurements without absorbing gaseous species (i.e., NO3), which can be achieved by flowing synthetic air through the instrument or the addition of NO to the inlet, which converts NO3 to NO2 (Reaction R3).
During field campaigns, compact and transportable instruments offer significant advantages, especially for remote (Ayers and Simpson, 2006), elevated (Brown et al., 2007), or airborne measurements (Dubé et al., 2006). Our present instrument for measurement of NO3 (Sobanski et al., 2016a) is a five-channel CRDS with a large footprint (1.3 m × 0.6 m) with a weight of > 100 kg. The large size and weight of this instrument has thus far precluded its deployment outside of our measurement container and measurement of vertical profiles e.g. using a tower-elevator. In addition, while our two previous instruments have successfully measured NO3 and N2O5 (Schuster et al., 2009; Crowley et al., 2011; Sobanski et al., 2016b), they have suffered from drift (presumably caused by thermal and mechanical stress impacting the optical alignment), complete loss of alignment during transport, and involved complex procedures to remove and clean the cavity mirrors, which, under campaign conditions often lead to extended down-periods in which no data were acquired. In addition, a combination of a weak source term for NO3 (i.e. low O3 and/or NO2 mixing ratios) and its high reactivity of NO3 (e.g. in forested environments) has often led to mixing ratios of NO3 that are below the limit of detection (LOD) of many instruments that impairs assessment of its role as an oxidant in such environments. While this problem has been partially resolved by this group's measurement of NO3-reactivity (Liebmann et al., 2017; Liebmann et al., 2019; Dewald et al., 2026), obtaining closure through measurement of NO3, its production rate and its reactivity have been limited by the LOD of NO3 instruments. Our aim in developing the small-footprint instrument described here was to resolve/improve on these issues and problems and enable its deployment in e.g. tower-elevators or small-aircraft. In the following, we describe the operational principles, its design and the results from laboratory characterization measurements as well as its performance during field campaigns.
CRDS is a direct absorption measurement technique with high sensitivity. CRDS requires a light source, a high-finesse cavity and a detector that records the intensity of transmitted light exiting the cavity. To determine the mixing ratio of NO3 ([NO3]), the exponential decay of the measured light intensity, also called “ring-down”, is recorded after switching off the light source. The corresponding time constant τ (“ring-down time constant”) depends on the mirror reflectivity and the distance between the mirrors and is reduced in the presence of an absorber within the cavity. The mixing ratio of NO3 can be calculated by Eq. (1).
Here, τ is measured in the presence of NO3 and τ0 (> τ) in the absence of NO3 which is typically achieved by the addition of NO to titrate NO3 via Reaction (R3). Furthermore, c denotes the speed of light, σ is the effective absorption cross-section of NO3 for the laser emission spectrum and RL (≥ 1) is the ratio between the mirror distance and the actual absorption path length inside the cavity. For most instruments RL is greater than 1, because a flow of clean air is used to protect the mirrors from contamination (see Sect. 3.2). The sensitivity of this method depends on the minimal detectable difference in ring-down times and the theoretical limit of detection (LOD) is given by Eq. (2).
This highlights the importance of precise τ measurements with very low variation and therefore requires stable mirror alignment. In practice, the LOD has to be determined for a certain measurement period and is affected by e.g. temperature drifts (hence thermal insulation of the cavities) and changes in air mass composition (e.g. water content) which are the reason for zero measurements every few minutes.
For this instrument, both cavities are defined by two concave mirrors (1 m focal length, R > 0.99998 at 662 nm, FiveNine Optics) separated by a distance (d) of about 74 cm, which results in an effective absorption pathlength of approximately 37 km (). The planar outer face of the mirrors is anti-reflection coated to minimize initial losses of laser intensity. For this instrument, typical ring-down times range from 140 to 170 µs, which is comparable to those from similarly designed instruments operating at near-ambient pressure (Sobanski et al., 2016a; Dubé et al., 2006; Ayers et al., 2005; Brown et al., 2002b). The ring-down times depend strongly on the adjustment and the cleanliness of the mirrors. A new mirror mount design is presented in the following section, while for cleaning the mirrors, we found that using ESD-free First Contact polymer solution (Photonic Cleaning Technologies) is more reliable in restoring high reflectivity than the standard application of acetone or isopropanol, especially under field conditions.
2.1 Instrument design
Our 2CH-CRDS instrument is installed in an aluminium profile rack (∼ 55 cm × 55 cm × 150 cm), weighs approximately 50 kg and uses two almost identical channels (where the term “channel” means cavity plus associated inlets) to measure NO3 as well as NO3 + N2O5 after thermal dissociation (TD) of N2O5. In order to avoid transfer of mechanical stress from the rack to the cavities, the mirror mounts (see below) were attached to the aluminium rack via rubber buffers (60 Shore A, 189-3264, RS PRO) supporting the upper end of each cavity only. To mitigate the rotational force created by the weight of the “hanging” cavity the lower mirror mount is gently pressed against a rubber covered aluminium plate.
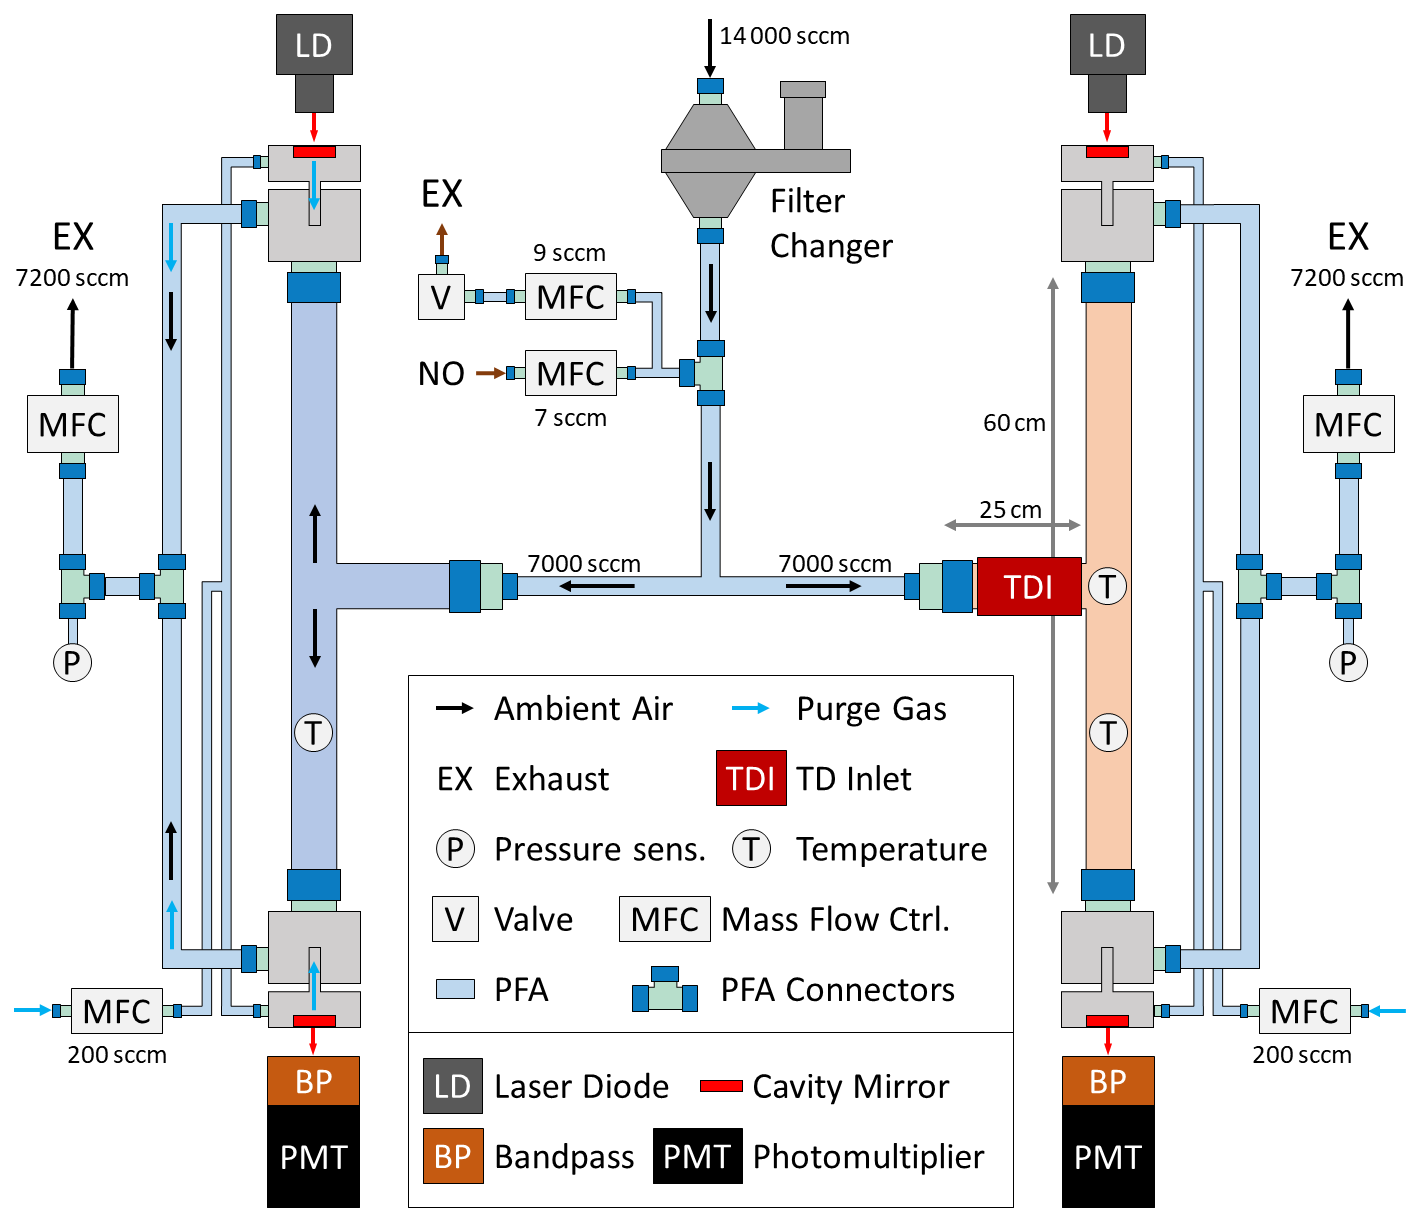
Figure 1A schematic drawing of the 2CH-CRDS instrument. Ambient air is sampled through an automatic filter changer, after which NO can be added for zero measurement. The left-hand cavity measures NO3 at room temperature. Sampled air in the right-hand channel passes a TD inlet set to 443 K, ensuring the thermal dissociation of N2O5 to measure the sum of NO3 + N2O5 at 373 K. The walls of the filter changer and the T-shaped glass tubing are FEP-coated, while every other surface is made from PFA. The cavity mirrors are protected with purge gas, while their chambers are made from anodized aluminium. Two separate laser diodes are used to record ring-down traces with photomultipliers after the transition of bandpass filters.
The instrument is illustrated in Fig. 1. Both channels are vertically aligned and accessible from the front of the instrument for adjusting the cavity mirrors. The cavities are insulated with custom-made heating/insulation sleeves (HORST GmbH) that match the T-shape geometry (arm lengths of 2×30 cm and 1×25 cm) of the glass tubing ( in. outer diameter, 9 mm inner diameter). While the shorter arm is used as an entrance, the longer arms define most of the absorption path length. The inner walls are coated with Teflon (FEPD-121, Chemours) to reduce wall losses of NO3 (more details will be given in Sect. 3.6).
With the left-hand cavity, we detect NO3 at room temperature. In the channel on the right-hand side, the absorption path is maintained at 105 °C (outer glass wall temperature) and samples via a 20 cm long TD inlet held is at 170 °C. All temperature read-and-control units (diraView and Quantrol series, Jumo GmbH) are operated with standard PT1000 sensors (RS PRO) attached to the outside of the glass but within the thermal insulation. While the sensor for the TD inlet is located directly at its center, both cavity temperatures are measured at the midpoint of the length of one of the longer arms. For the heated channel, we use an additional sensor at the T-shape intersection. As the cavities are heavily insulated and about 20 cm apart, there is no significant transfer of heat from the “hot” cavity to the “cold” one.
The rear side of the instrument houses a laboratory power supply, mass flow controllers (MFCs), an automatic filter changer and all electronics required for data acquisition.
2.2 Air flow
The flow of air through the instrument is depicted by black arrows in Fig. 1. Regulated flows through the instrument are exhausted into a vacuum manifold when the instrument is operated in our measurement container or into an external membrane pump (MD 4 T, Vacuubrand) during laboratory operation. Alternatively, the instrument can use a small, in-rack membrane pump (MD 1 VARIO-SP, Vacuubrand). Unless otherwise stated, we use in. PFA tubing and PFA fittings (Swagelok) for all connections. Air enters the instrument via an automatic filter changer and PTFE filters (details in Sect. 3.5), which prevent particles from contaminating the instrument. We use the same filter changer device that was presented by Sobanski et al. (2016a) (which operates similar to that described by Dubé et al., 2006) and renewed the FEP coating on the inner walls. The device uses a three-station rotary turret plate: by successive rotation of this plate by 120° a new filter is inserted from a supply stack, then used within the sampled air and finally ejected. During filter changes, the sample air flow is interrupted to prevent contamination.
Directly underneath the filter changer, NO for zero measurements (titration of NO3, Reaction R3) is added via a T-piece. Similar to Schuster et al. (2009), we use two MFCs (IQF-200C, Bronkhorst GmbH) and in. PFA tubing to reduce the switching time between ambient and zero measurements. The first MFC continuously flows 7 standard (STP) cubic centimetres per minute (sccm) of NO (200 ppmv (parts per million by volume) in N2, Air Liquide) while the second MFC (set to 9 sccm) is connected to a solenoid valve and an exhaust system. During zero measurements, the solenoid valve is closed and NO is added to the sampled ambient air. Opening the valve directs the NO (plus 2 sccm of sampled air) to the exhaust, allowing NO3 and N2O5 to be measured. This setup results in a switching time of ∼ 2 s (depending on the flow of sampled air) and zero measurements are performed every 3 min for 10–15 s.
Following the NO addition point, the sampled ambient air is split into both channels, each regulated by a MFC (FG-201CV, Bronkhorst) set to 7200 sccm. The major contribution of this total flow is 7000 sccm sampled air, which again splits into two directions, with flows of 3500 sccm towards each cavity mirror. The cavity mirrors are protected against contamination by a 200 sccm “counter” flow of purge gas (light-blue arrows, clean dry air, IQF-200C, Bronkhorst GmbH), which mixes with the sampled air in the “pre-exhaust chamber” and is exhausted together as total flow. For each channel, the cavity pressure (typically 900–950 mbar) is measured using a piezo-resistive manometer (IQP-500C, Bronkhorst GmbH). Operating at these “normal” conditions, the total residence times within the instrument (filter changer exit until exhausted) are 0.43 s for the NO3 channel and 0.34 s for the heated cavity.
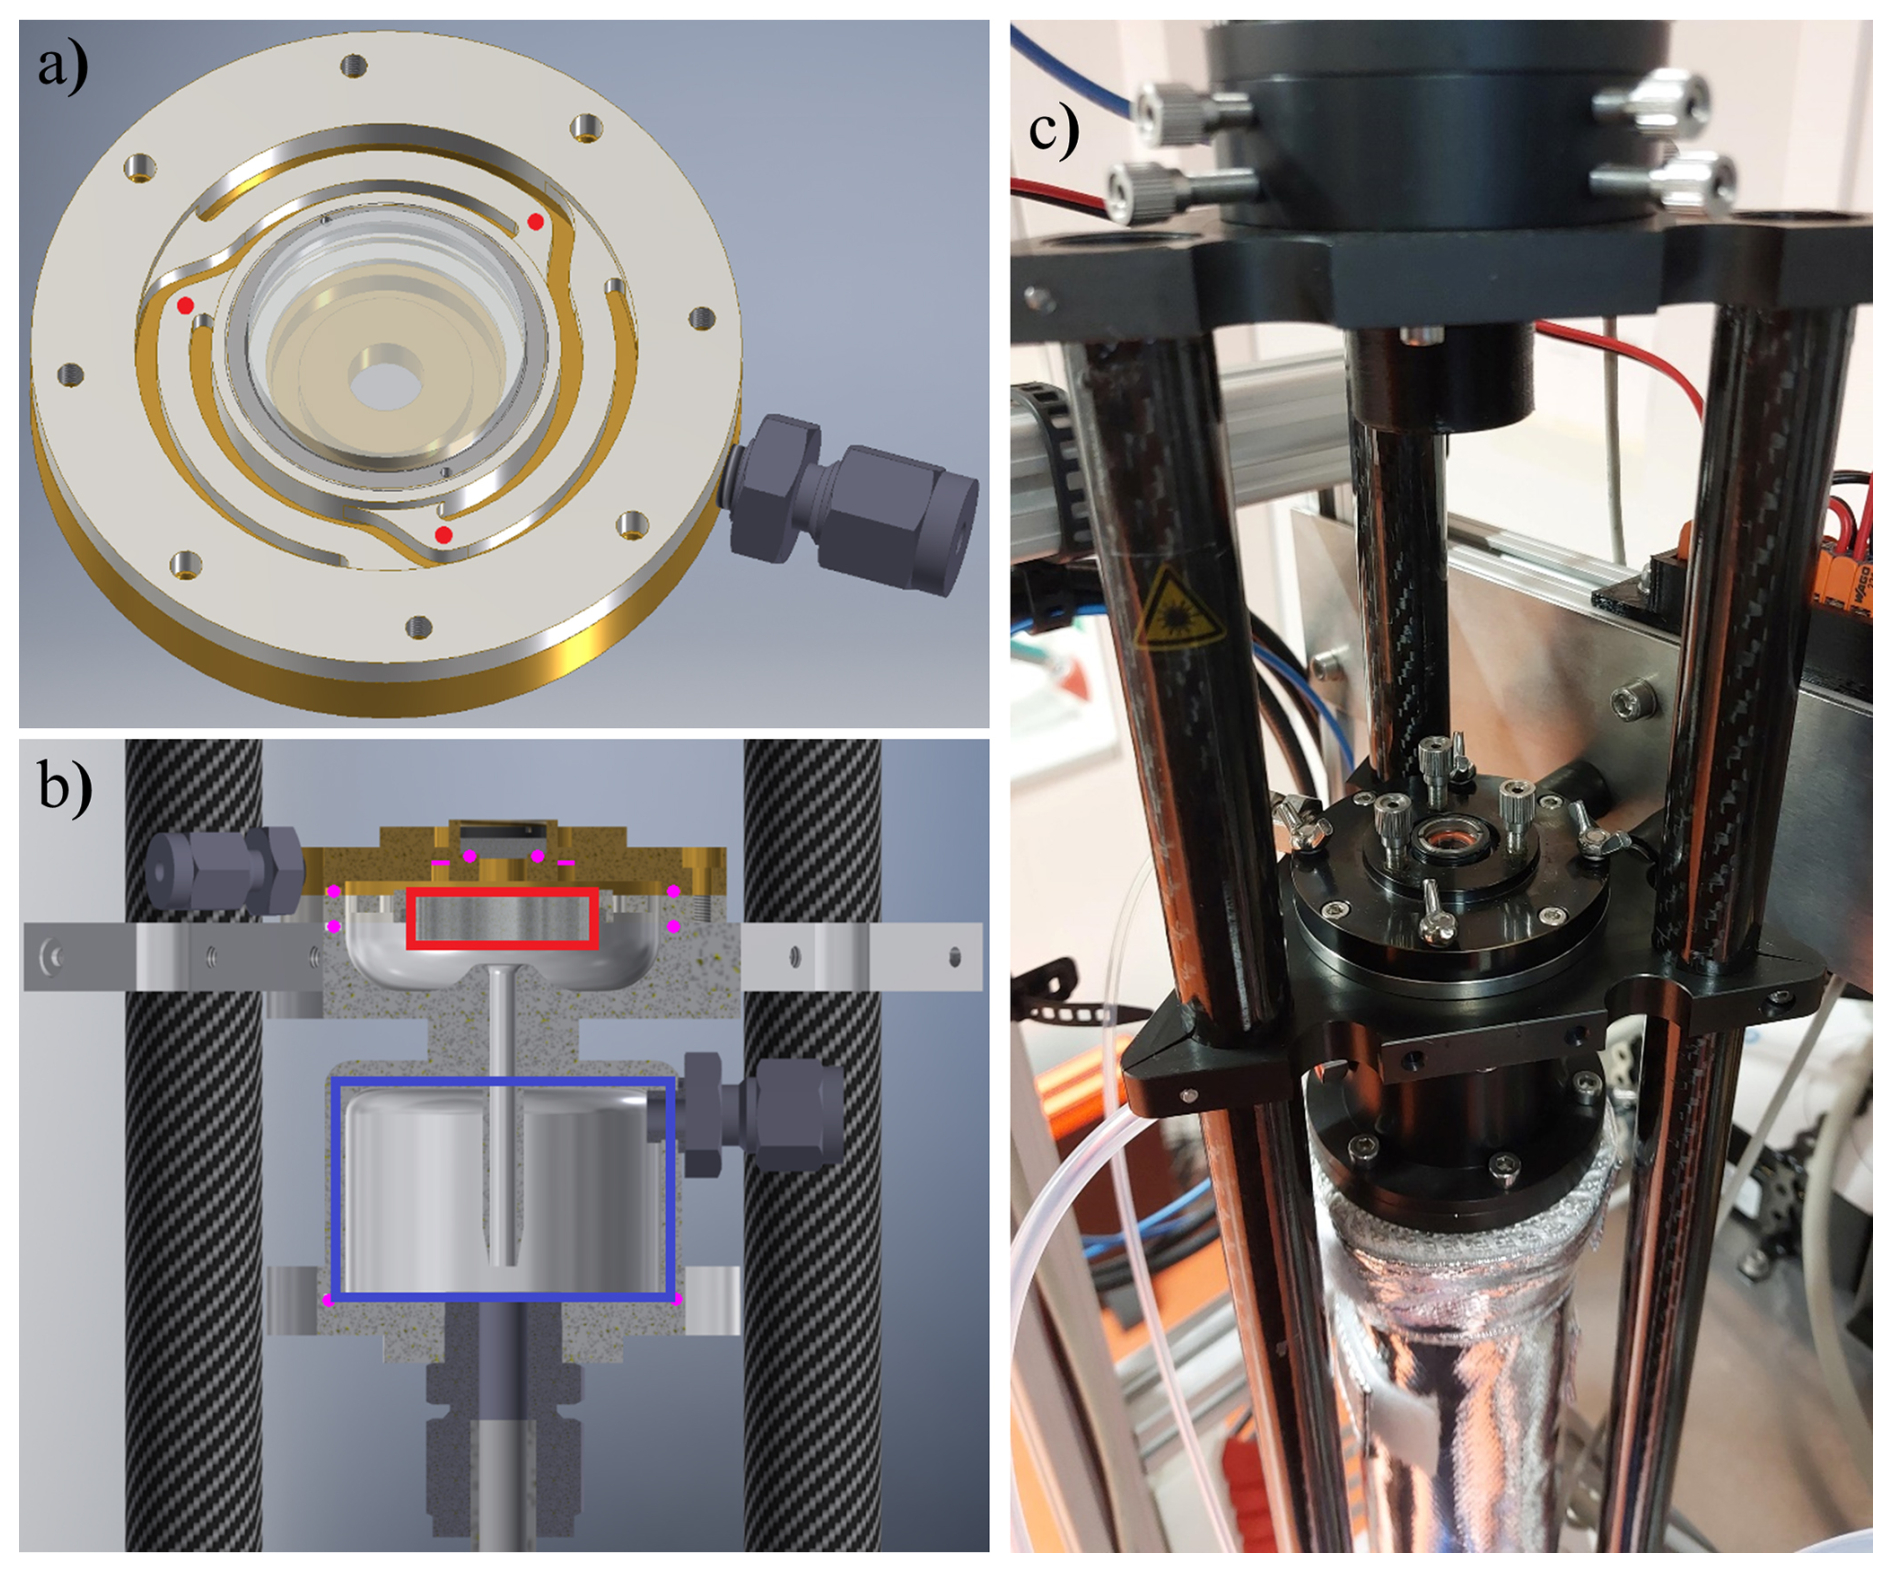
Figure 2(a) Technical drawing of the newly designed mirror mount. Three fine adjustment screws control the tilt of the mirror by applying pressure from behind at the locations indicated by red dots. (b) A semi-half section of the mirror mounting assembly shows the completely sealed mirror (red border) within a separated chamber, which is flushed with purge gas/clean air. As depicted in Fig. 1, the purge gas is then injected into the pre-exhaust chamber (indigo border) while sampled air enters from below. The mixed air then exits through the PFA connector on the right. Additionally, O-rings (magenta indicators) are shown to highlight critical seals like the fine adjustment screws and the window. (c) A photo of the mirror mount assembly within the instrument shows the screws for mirror adjustment and wing screws for easy removal when cleaning is required. Triangle-shaped adapter plates are used to mount the individual optical elements, while carbon fibre-reinforced polymer tubes create the main frame of each channel.
2.3 Mirror mounting system
The mirror mounting system is illustrated in Fig. 2. Each cavity mirror is installed in a custom-made titanium mirror mount and secured with a silicone O-ring plus retaining ring. Titanium was chosen because of its mechanical properties and low thermal expansion coefficient. The tilt adjustment of each mirror is achieved by three fine adjustment screws (M4AS series, Thorlabs) that apply pressure at the locations highlighted with red dots in Fig. 2a. The use of long arms to connect the inner mirror-securing ring with the outer sealing part means that applying pressure induces bending of the arm and allows the mirror to tilt. The flexural modulus of the material enables the mirror to return to its original position when the pressure is reduced (i.e., the screw is retracted). Different metals such as stainless steel or spring steel and different arm thicknesses can achieve similar results, but poor adjustability (too high rigidity) and irreversible deformation (elastic limit exceeded) are design challenges. To maximize the stiffness of the mirror mount, the arm thickness needs to be as high as possible. Our solution was to use a thickness of 2.5 mm which was milled from a 4 mm solid titanium disk. This design offers an optimal balance between easy adjustment and very stable positioning, which is critical for long-term cavity stability during field campaigns.
Figure 2b shows the mirror mount after its installation according to the schematic in Fig. 1. The mirror (red border) is secured in a separate chamber, which is continuously purged with clean air that enters the pre-exhaust chamber (indigo border, 46 mm inner-diameter) after traversing a 42 mm long, 4 mm inner-diameter metal tube. The diameter of the tube is sufficient to guide the laser beam through, but small enough to generate a high flow velocity of ∼ 13 cm s−1 compared to the sample air (3.5 cm s−1) within the pre-exhaust chamber that prevents back diffusion. After mixing, ambient and zero-air are exhausted as previously described. In this system, even the planar side of the mirrors is within the purged volume as a window (WG10530-A, Thorlabs) prevents direct contact with ambient air and reduces the impact of changes in ambient pressure on mirror alignment. The window and all metallic components are sealed to the outside using silicone O-rings (magenta circles/lines in Fig. 2b), which are recessed into designated grooves.
Figure 2c shows a photo of the combined mirror mount assembly within the instrument. In the centre, the laser enters through the aforementioned window, while the adjacent fine adjustment screws set the mirror alignment and four wing screws are used to easily disconnect the mirror mount for cleaning. When reinstalling, only very minor adjustments are required to optimize the ring-down signal. At the top, the laser mount and 4 out of 8 of its fine-adjustment screws are shown. While the upper screws are used to adjust the position of the collimation lens relative to the laser diode, the lower ones are used to adjust the position of the laser mount for slight (< 1 mm) off-axis alignment to avoid back reflections into the laser diode, which can perturb the laser emission spectrum.
In order to decrease thermal expansion related effects, each cavity uses three carbon-fibre reinforced polymer (CFRP) tubes (1 m in length, 20 mm outer diameter, 1 mm wall thickness) mounted on custom-made, triangle-shaped, aluminium adapter plates to stabilise the relative positions of the mirrors. This system is almost unaffected by vibrations or shocks and even after strong impacts during container shipment only minor adjustments were required for optimal alignment.
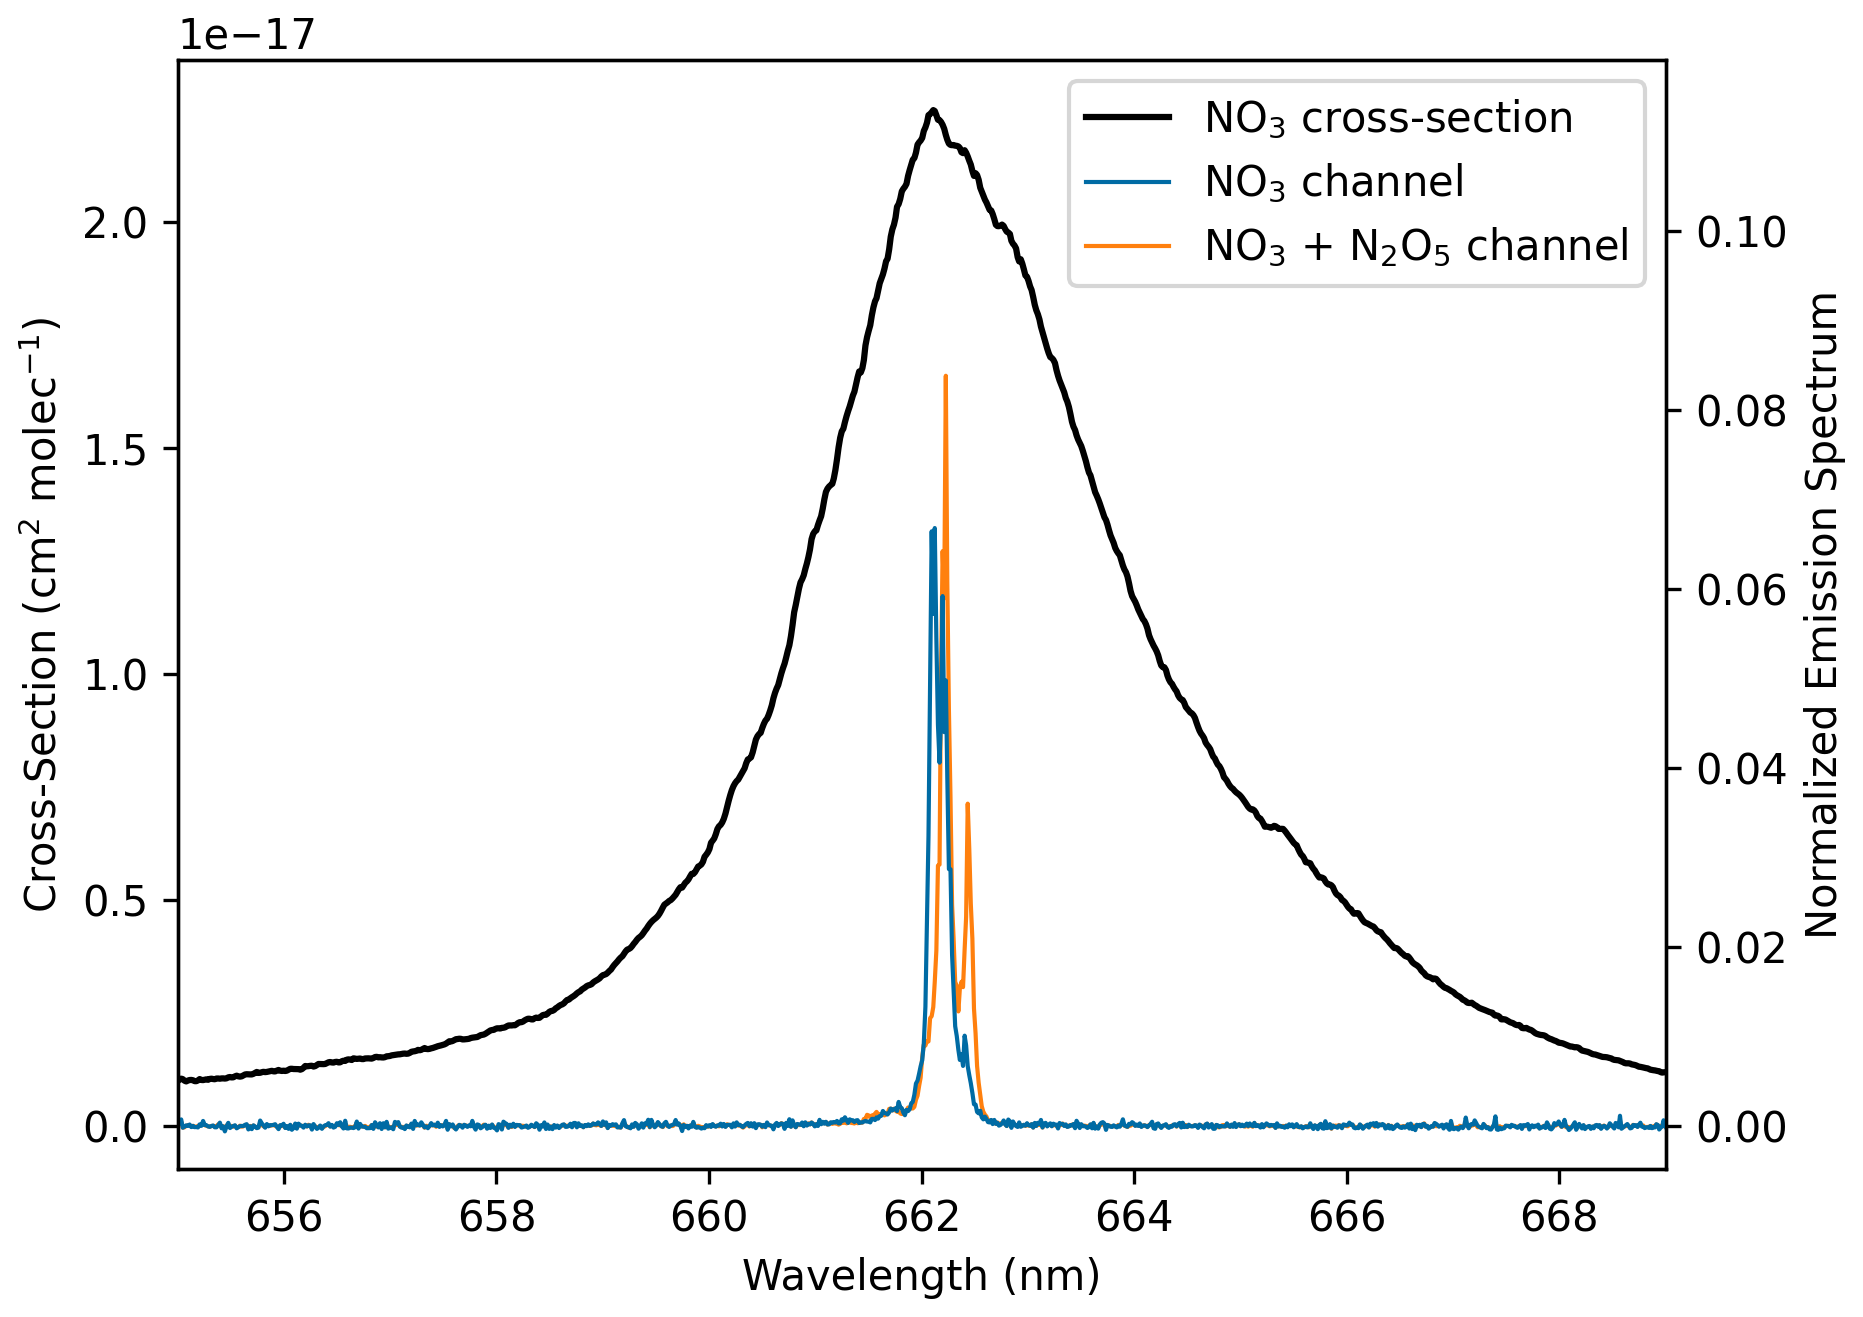
Figure 3The laser emission spectra for both channels (orange and blue) normalized to unit area. The NO3 absorption cross-sections (black) as reported by Orphal et al. (2003) at room temperature and rescaled to the recommended value by IUPAC Task Group on Atmospheric Chemical Kinetic Data Evaluation (2026).
2.4 Laser optics and emission spectra
Two laser diodes (HL6545MG mounted in LDM21, Thorlabs) equipped with collimators (C610TME-A, Thorlabs) and optical isolators (IO-3D-660-VLP, Thorlabs) provide light at ∼ 662 nm for the cavities. Even with optical isolators in place, back-reflection from the first cavity mirror into the laser diode resulted in random changes in transmitted laser intensity and/or variations to the emission spectrum. Both caused additional noise to the ring-downs and therefore we avoid perfect on-axis alignment with this instrument. The central emission wavelength is matched to the peak absorption cross-section ( 662 nm) of NO3 by heating the laser diodes to 38–40 °C (TTC001 temperature controller, Thorlabs), as shown in Fig. 3. The square-wave modulated laser current (Sect. 2.5) is driven by a control board (MLDEVAL with MLD203CHB, Thorlabs) and results in an average optical power output of 8 mW (at 25 % duty cycle) after the optical isolator.
The laser diode emission is recorded using a compact spectrometer (630–684 nm, HR4000, OceanOptics). Its spectral resolution (∼ 0.06 nm) was determined by calculating the full width at half maximum (FWHM) of seven spectral lines of neon from a low-pressure “Pen-Ray” lamp. We use an optical Y-fibre (BFY50HS02, Thorlabs) in front of the optical isolators to collect a fraction of the light intensity at the edge of the laser. This enables us to monitor the output of both diodes simultaneously while individual emission spectra can be acquired by turning off the other laser. During normal operation, this process takes less than 2 s and is automated using a programmable USB-hub (EX-1596HMVS, EXSYS) which supplies power to the laser current drivers. By regularly recording the laser diode spectra (usually once per hour during field deployment), we can account for changes in the overlap of the laser emission and the NO3 absorption cross-section, discussed in Sect. 3.2.
At the other end of the cavity, transmitted light is detected by a photomultiplier tube (H10492-012, Hamamatsu) screened by an optical bandpass filter (10 nm FWHM at 660 nm, 86–089, Edmund Optics) and located in a custom-designed housing to minimize stray light.
2.5 Signal processing and data acquisition
For data acquisition, signal generation and initial visualization, we use a PXIe-1082 embedded computer including a PXIe-8840 Quad-Core processing unit manufactured by National Instruments (NI). The instrument's system control has been programmed in LabVIEW and is based on the “Modular Multiple-Loop Application Framework” described in “The LabVIEW Style Book” (Blume, 2007).
In the same computer chassis, a PXIe-5413 function card is used to generate the modulation signal for the laser current drivers. We use a square-wave function (625 Hz, 25 % duty cycle) at a sample rate of 2 MS s−1. Data acquisition is performed by a PXI-6132 card (with a TB-2709 adapter for SMB connectors) running at the same sampling rate and is triggered by the rising edge of the modulation signal. Additionally, we use an external oscilloscope (TBS1104, Tektronix) to visualize the signals during alignment and operation.
For each recorded ring-down, we reject the initial 5 µs after switching off the laser and use the following 600 µs for fitting. We pre-average 125 individual ring-down traces to smoothen the signal and reduce computational load. Subsequently, we use the “linear regression of the sum” (LRS; Everest and Atkinson, 2008) algorithm to calculate the ring-down constant as used for similar instruments (Sobanski et al., 2016a; Wagner et al., 2011). Afterwards, we use the average of five τ measurements to report 1 s data. We did not see a significant difference in the sensitivity of the instrument for different batch sizes of pre-averages.
The uncertainty of NO3 and N2O5 measurements is associated with a number of parameters and applied correction factors, including the effective absorption cross-section (σ), the ratio between the mirror distance and the actual absorption path length (RL) and transmission factors which consider the loss of NO3 in different parts of the instrument, such as the particle filters or cavity walls. While σ and RL can be determined without measuring NO3, the transmission factors require the generation of NO3 and N2O5. In this section, we describe our preferred method of generating NO3, present our results of the instruments characterisation including its limit of detection, as well as provide new insights into the NO3 transmission of PTFE filters. Concluding, we summarize all factors that contribute to the total measurement uncertainty.
3.1 Generation of NO3 and N2O5
For most measurements we generated NO3 and (mainly) N2O5 via the oxidation of NO with O3 (Reactions R1, R2, and R5) in a cylindrical, FEP-coated glass vessel (approx. 3 L volume, 60 cm length). As shown in Fig. S1 in the Supplement, 30–100 sccm of NO (1 ppmv) and 300–400 sccm of clean air (purified with CAP series, different manufacturers) with > 15 ppmv of O3 flowed into one end of the reactor where the mixture resided for more than 6 min in which time all NO was converted to either NO2, NO3 or N2O5. O3 was generated by passing the clean air flow over a partially masked, 2 in. low-pressure mercury “Pen-Ray” lamp (10 mA, 78-2046-2, Jelight). After exiting the reactor, the N2O5 could optionally be thermally dissociated into NO3 (and NO2) by passage through a heated PFA segment (35 cm, 130 °C) directly before being diluted by about 17 slm (standard litres per minute) of clean air. The 17 slm were then sampled by both the 2CH-CRDS instrument and an ozone monitor (Model 205, 2B Technologies). We also used a 1 m3 environmental chamber into which N2O5 was flowed by passing clean air over N2O5 crystals held at about 200 K. This way both N2O5 and NO3 in equilibrium were generated along with NO2. Alternatively, to generate NO3 in the absence of N2O5, the photolysis of ceric ammonium nitrate was used (Lambe et al., 2023). The chamber sources were found to have disadvantages including less stable mixing ratios over long time periods (when using N2O5 crystals) and the formation of high levels of water and HNO3 when using the ceric ammonium nitrate source.
3.2 Determination of σ and RL
To derive NO3 mixing ratios according to Eq. (1), we need measurements of σ and RL. The effective absorption cross-section σ is calculated by the convolution of the emission spectra for each laser diode and the absorption spectrum of NO3. We use the temperature-dependent cross-sections reported by Orphal et al. (2003) and rescale the value at λmax to the IUPAC recommendation (IUPAC, 2026), which is 2.25 × 10⁻¹⁷ at 298 K, see Fig. 3. The convoluted effective absorption cross-sections strongly depend on the gas temperature, with values of σ(25 °C) = 2.15 × 10⁻¹⁷ and σ(100 °C) = 1.55 × 10⁻¹⁷ . As the laser diodes are temperature-stabilised, the effective cross-sections generally change by less than 5% over a period of several weeks. We estimate the uncertainty in the effective cross-sections to be 5 % and 8 % for the NO3 and (NO3 + N2O5) channel, respectively.
In order to determine RL, we conducted experiments using ozone which absorbs at 662 nm albeit with a cross-section that is a factor ∼ 10 000 smaller than that of NO3 at 298 K and 1 atm so that 10 ppbv (parts per billion by volume) of ozone is detected as ∼ 1 pptv NO3-equivalent. For this experiment, about 7.3 ppmv of O3 was produced by flowing 17 slm of clean air over a 7 in. mercury “Pen-Ray” lamp (10 mA, 78-2046-7, Jelight) and directed to the instrument. RL was then determined by comparing the signal when O3 was (1) present in both the purge gas flow and the cavity flow (i.e. absorption took place over the total mirror distance) or (2) was present only in the cavity flow (i.e. absorption took place over the actual absorption path length). This way RL was determined to be 1.11 ± 0.02 for the NO3 channel and 1.13 ± 0.06 for the (NO3 + N2O5) channel. Both values are very similar to the geometric ratio of approximately 1.12 (= 74 cm/66 cm).
3.3 NO3 titration and the impact of NO + O3
Accurate determination of NO3 mixing ratios requires the complete removal of NO3 during zero measurements. The fractional removal of NO3 depends on the rate coefficient for the reaction between NO and NO3 (k3 = 2.6 × 10⁻¹¹ at 298 K; IUPAC, 2026), the amount of added NO and the reaction time. With typical NO concentrations of about 100 ppbv, more than 99.996 % of the NO3 is removed within the ∼ 0.16 s reaction time available before the flow enters the cavity associated with the unheated channel. For the heated inlet of the (NO3 + N2O5) channel, the NO3 formed by thermal dissociation of N2O5 has less time to react with NO, which partially results from the time taken for N2O5 to dissociate and partially from the larger linear velocity in this part of the tubing. In order to fully dissociate the N2O5 we found that a temperature of 170 °C was required. Setting the temperature in the thermal dissociation inlet to this level also resulted in a homogeneous temperature along the absorption path within the cavity (which was kept at 100 °C). At these NO concentrations and temperatures, we need to correct our NO3 + N2O5 measurements by a factor of 1.01 ± 0.01 in the heated channel. This accounts for a very small fraction of NO3 that is formed “late” from N2O5 dissociation and has insufficient time for reaction with NO during a titration cycle. While this small correction introduces a minor systematic uncertainty, it reduces the impact of cavity wall losses, which would increase for lower flow rates, see Sect. 3.6.
This discrepancy could be decreased by increasing the amount of NO added, but this would subsequently increase the production of NO2 via ambient O3 (Reaction R1) and affects NO3 measurements, since NO2 and O3 absorb (albeit weakly) at 662 nm. With a 662 nm cross-section of ∼ 4 × 10⁻²¹ for NO2 at 294 K (Vandaele et al., 2002), its absorption cross-section is about twice that of O3 at the same wavelength (∼ 2 × 10⁻²¹ for O3 at 293 K; Voigt et al., 2001). Using the rate coefficient for the reaction of NO with O3 of k1(298 K) = 1.9 × 10⁻¹⁴ (IUPAC, 2026) and taking an O3 level of 100 ppbv we calculate that about 2 ppbv of the O3 would have been converted into NO2. Given the relative 662 nm cross sections of NO3, O3 and NO2, this means that the loss of O3 results in a negative offset of about −0.2 pptv NO3-equivalent, whereas the NO2 formed results in a positive offset of +0.4 pptv NO3-equivalent. This results in an overestimation of the zero signal by up to +0.2 pptv for which corrections must be applied to the [NO3] measurements. Even through the correction is small, when deploying the instrument in the field we therefore always make O3 measurements in parallel.
In the heated (NO3 + N2O5) channel, the rate coefficient for the reaction between NO and O3 increases (by a factor of about three) to k1(373 K) = 5.6 × 10⁻¹⁴ . Accounting for the shorter residence time and lower air density, about 3.5 ppbv of NO2 are formed which corresponds to an overestimation of up to 0.35 pptv when assuming temperature-independent absorption cross-sections for NO2 and O3 at 662 nm.
Concluding, the major advantages of adding NO during zero measurements are rapid switching times, targeted removal of NO3 and the negligible dilution of the sampled air (7 in 14 000 = 0.05 %). Compared to other methods that sample/use clean air, we prevent changes in ambient concentration and therefore the absorption of other molecules like O3, NO2 and water vapour remains constant. Especially, a correction of [H2O] would introduce a high uncertainty since its absorption spectrum exhibits sharp features at 662 nm (Schuster et al., 2009; Coheur et al., 2002) and its concentration can vary rather quickly during field measurements and greatly between ambient and zero-air measurements.
3.4 Limit of detection – Allan Deviation
Like most CRDS instruments, the major factor influencing the LOD is the random variation (white noise) of the ring-down time, which depends on the adjustment of the cavity mirrors and changes of ambient conditions like pressure and temperature. For both channels, the ideal LOD was determined from an Allan Deviation analysis over the respective zero signal. The Allan Deviation is obtained as the square root of the Allan Variance, which is calculated as the averaged squared difference between consecutive pairs of time-averaged (zero) measurements over a given integration time. Here, we use the Overlapping Allan Deviation (oadev by AllanTools.py version 2024.4) to evaluate about 6 h of nighttime data and under ideal laboratory conditions (stable temperatures, sampling particle-free clean air).
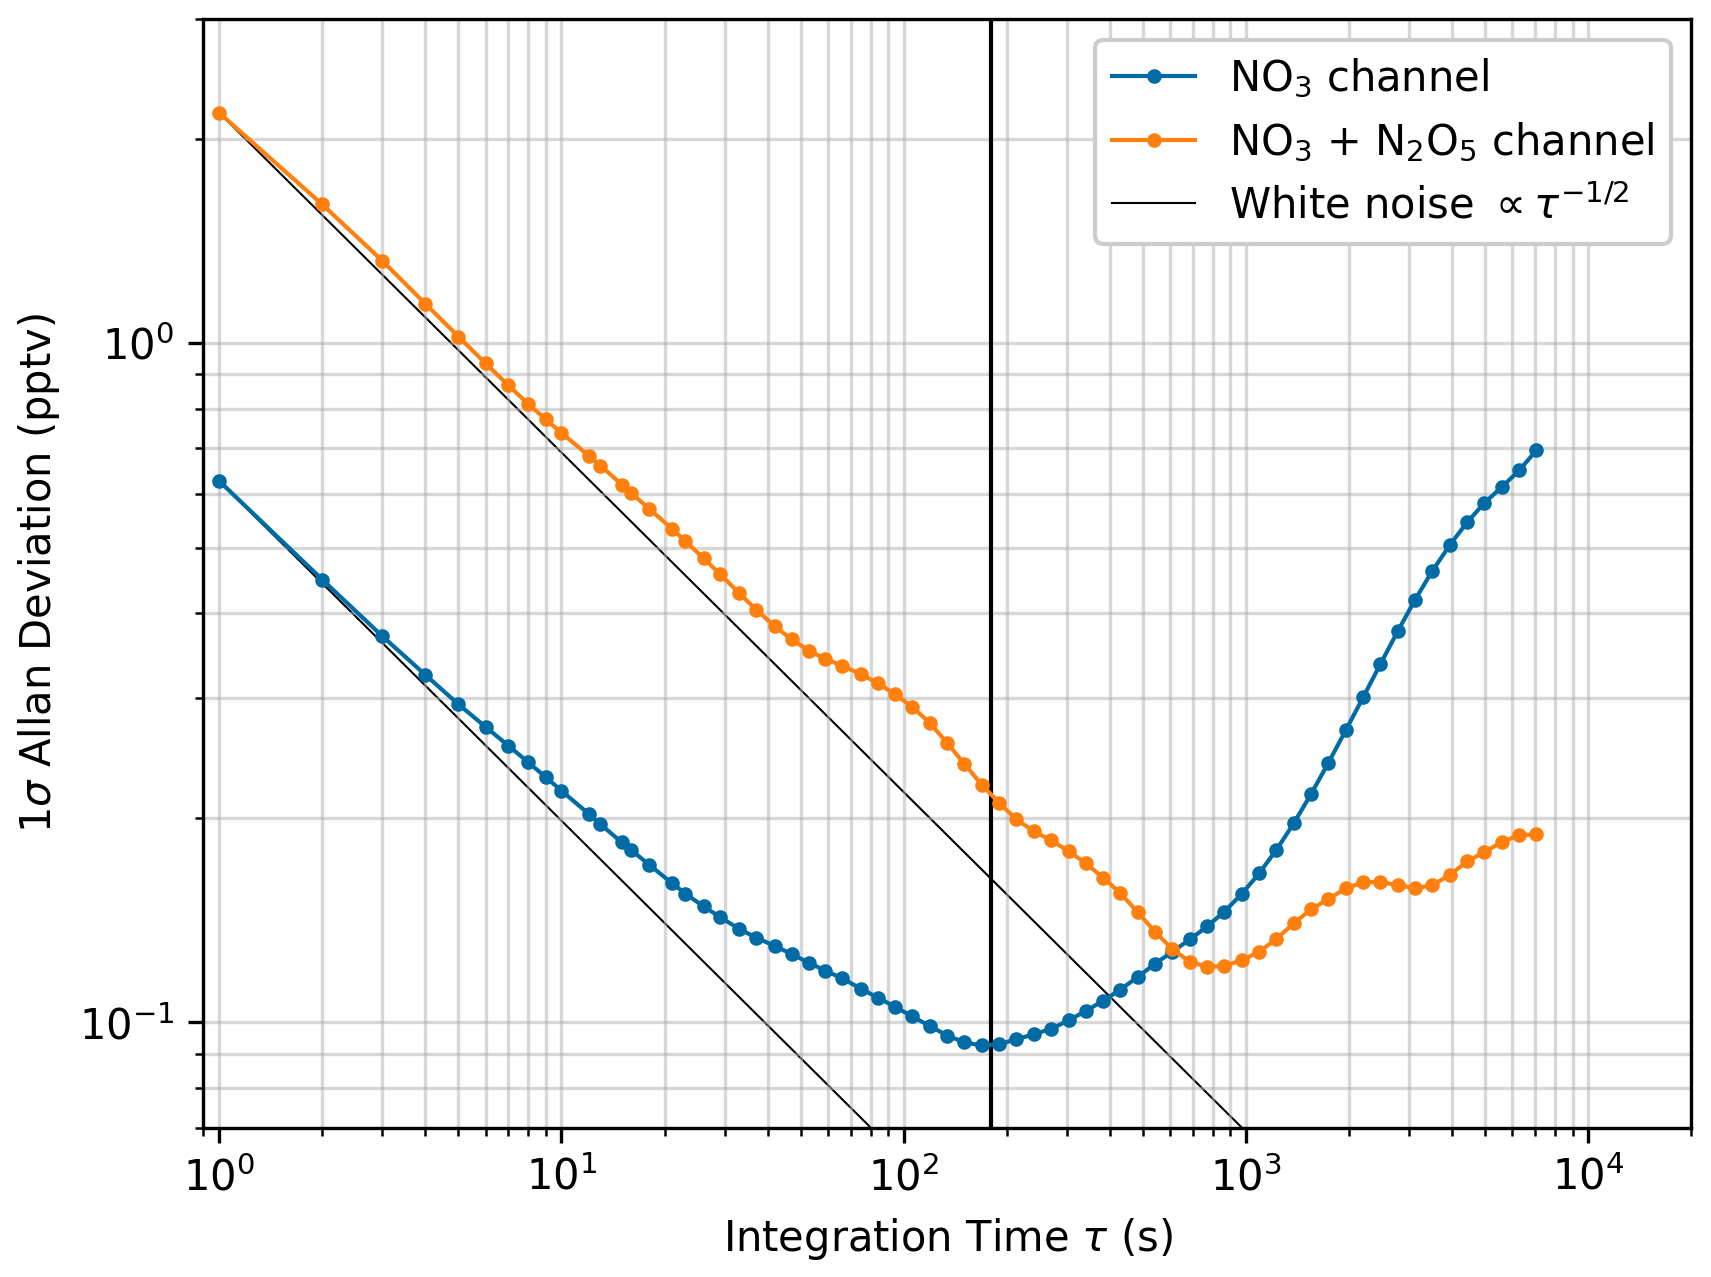
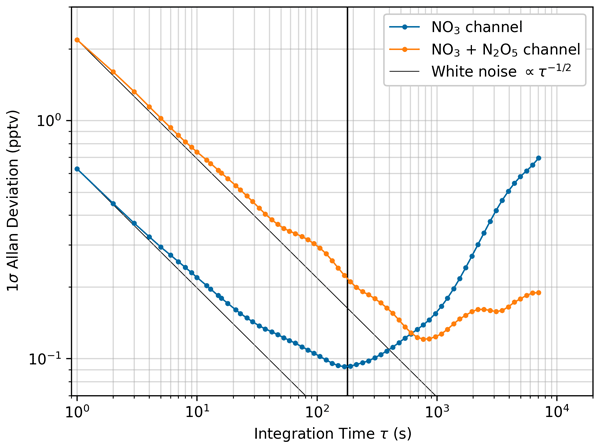
Figure 4Allan Deviation plots for both cavities based on 1 s data. The integration time of 3 min is indicated by the black vertical line. Thin diagonal lines represent the white noise ideal behaviour. The data were recorded while measuring clean air over a period of 6 h at night under laboratory conditions.
Figure 4 shows the 1σ Allan Deviation for both channels for integration times up to 2 h. For short integration times, both channels show the typical decrease related to the declining impact of white noise. Compared to the ideal white noise reduction (thin diagonal lines), the observed decrease is shallower indicating the presence of an additional noise source. With increasing integration time, the Allan Deviation begins to rise again, which is associated with drift effects. This results in a minimum, which can be interpreted as the best integration time for our instrument and is understood as the best achievable LOD of each channel.
The NO3 channel (blue) has a LOD of less than 1 pptv at 1 s integration time. For the (NO3 + N2O5) channel (orange), this increases to about 2 pptv (1 s). The lowest deviation is achieved at integration times of about 3 and 12 min, when the LOD of the NO3 channel is ∼ 0.1 pptv and that of the (NO3 + N2O5) channel < 0.2 pptv, respectively. Based on this, we determined the ideal time between zero measurements to be 3 min to minimize the influence of drifts while still being frequent enough to capture atmospheric variability.
During field measurements, we determine the LOD (for a certain period of time) as the maximum of either 2σ of all zero data points (“white noise”) or 2σ of all absolute differences between consecutive zero measurements (“drift”). This holds for 1 s resolution, but is divided by the when resampling to a different resolution if the white noise is dominating. Here, n denotes the number of zero data point that are within the resampling interval on average (e.g., n = when resampling to 1 min resolution since 8 zero data points are recorded every 3 min). Typical values range from 1–2 pptv for the NO3 channel and 3–5 pptv for the (NO3 + N2O5) channel and are dominated by white noise from zero measurements.
3.5 NO3 transmission of PTFE filters
As previously mentioned, CRDS-based measurements of ambient NO3 are usually operated with inlet filters to prevent spurious signals due to particle scattering and to reduce contamination of the cavity mirrors. Several CRDS instruments that measure NO3 have used R2PJ047 PTFE membrane filters by Pall Corporation (2 µm pore size, 25 µm thickness and 47 mm in diameter). These filters have been shown to have good transmission for NO3 and previous studies have reported clean filter transmission factors in the ranges of 86 ± 5 % (Brown et al., 2002b), 90 ± 3 % (Crowley et al., 2010) and 93 ± 2 % (Dubé et al., 2006). As these filters are no longer produced, we have explored alternative products from Merck Millipore (PM2547050, 40 µm thickness) and Cytiva Whatman (7592-104, 40 µm thickness), where the PTFE membrane is supported by a polypropylene ring of similar width. Operating at normal conditions and a sample flow of 14 slm, Pall filters cause a pressure drop of about 10 mbar compared to an empty filter holder; those from Merck and Cytiva show a pressure drop of approximately 20 mbar.
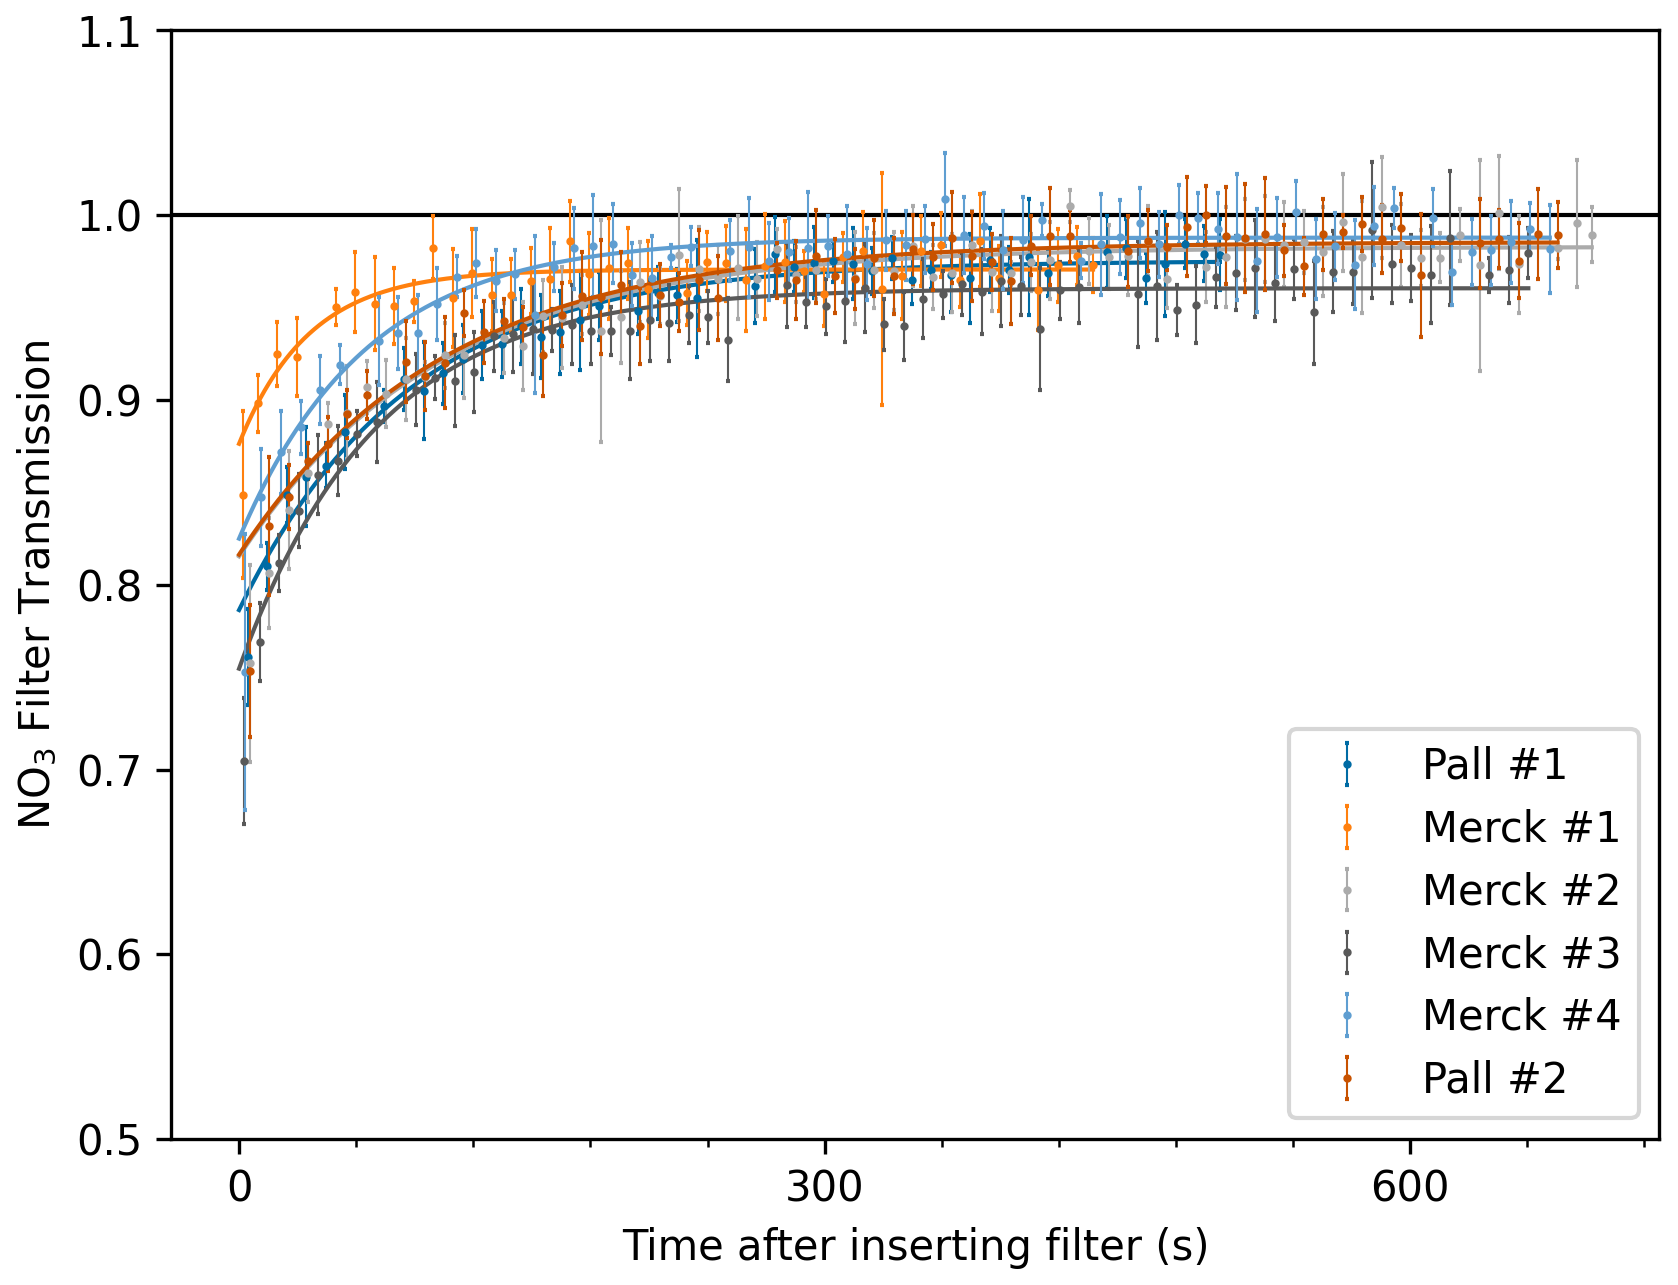
Figure 5NO3 transmission measurements for different PTFE filters. The error bars are the statistical uncertainty (2σ) based on averaging for 10 s. Equation (3) was used to derive the maximum transmission. An overview of all Tmax can be seen in Table S1, and a similar comparison with filters from Cytiva is shown in Fig. S2.
We measured the transmission of NO3 for different batches of unused filters using the NO + O3 flow tube source which produced about 500 ppbv of O3 and more than 100 pptv of NO3 after the dilution. The fractional transmission of NO3 was determined by measuring its mixing ratio after passage through an empty custom-made filter holder (FEP-coated aluminium, wire bail lid system with silicone O-ring seal) or through the same filter holder equipped with a filter. This type of filter holder has a more reliable closing mechanism than commercial PFA inline filter holders with a screw lock. Figure 5 shows the time dependent NO3 transmission through the Pall and Merck filters. The initial NO3 transmission of the filters is variable and ranges from 0.7 to 0.9, which is similar to measurements shown by Brown et al. (2002b) where the initial transmission ranged from 0.6 to 0.8. Continuous exposure to NO3 and O3 increases the filter transmission to its maximum within 5 to 10 min. The same behaviour was observed during the comparison between Pall and Cytiva filters, see Fig. S2. We approximate this exponentially increasing behaviour by Eq. (3) to determine the asymptotic maximum transmission factor Tmax.
where t is the exposure time, k is a coefficient that defines the time-constant for “cleaning” the filter and A is used to adjust the amplitude of the exponential contribution. An overview of the comparison of unused filters is presented in Table S1 in the Supplement and shows that all tested filters achieve a maximum NO3 transmission of about 98 % with a 2σ variation of all determined Tmax values of ± 4 %. Additional details of the procedure and results for different filters are presented in Sect. S1 in the Supplement. Our experiments indicate that initially reactive PTFE filters can be made passive for NO3 by sufficient exposure to NO3 and O3. As the loss of NO3 to filters can be associated with the presence of unsaturated hydrocarbons adsorbed to the filter (Tang et al., 2010), we explored the potential to re-use filters that had become reactive towards NO3 during exposure to ambient air. As O3 is known to react with olefins (Cox et al., 2020), we determined the NO3 transmission of filters that had been exposed to high concentrations of O3 (100 sccm of more than 5 % O3 in O2) for a few minutes. For these experiments, O3 was generated using a commercial, electrical discharge ozone generator (COM-CD-HF4, Anseros) supplied with oxygen 5.0 at 1 bar. Using this method, we were able to fully restore the transmission of previously aged and reactive filters, see Fig. S3.
Our results indicate that fresh filters are more reactive to NO3 than those that have been treated with O3. Therefore, during operation in the field, the stack of filters (held in the automatic filter changer) is flushed continuously by 500 sccm of dry, clean air containing about 15 ppmv of O3 prior to use. Using this setup the NO3 transmission for fresh (or freshly passivated) filters from Pall and Merck is 98 ± 4 % while for untreated PTFE filters a value of 90 ± 5 % is appropriate and consistent with that reported by Brown et al. (2002b) and Crowley et al. (2010). Filters by Cytiva were not tested during field measurements, only in the laboratory.
Note that while such procedures can optimize the initial transmission of the filters for NO3, contamination and loss of transmission during sampling of ambient air will occur at different rates depending on, e.g. particle concentrations and composition. Under polluted conditions, this may imply that filter changes every 30 min are necessary, whereas every 2 h may be adequate for more remote locations. When using the automatic filter changer (see Sect. 2.2), an additional NO3 transmission factor must be considered. This was determined by the ratio of measured [NO3] when passed through the filter changer or through a PFA bypass with negligible NO3 loss (Schuster et al., 2009). Under normal operating conditions (14 slm sampled at about 920 mbar), six switching intervals (each about 5 min of data) were used to determine the average NO3 transmission (80 ± 5 %) through the filter changer. This value was subsequently verified by another measurement with ten intervals (each 6 min) more than a year later.
Table 1Overview of channel specific characteristics and uncertainties which significantly influence the TMU.
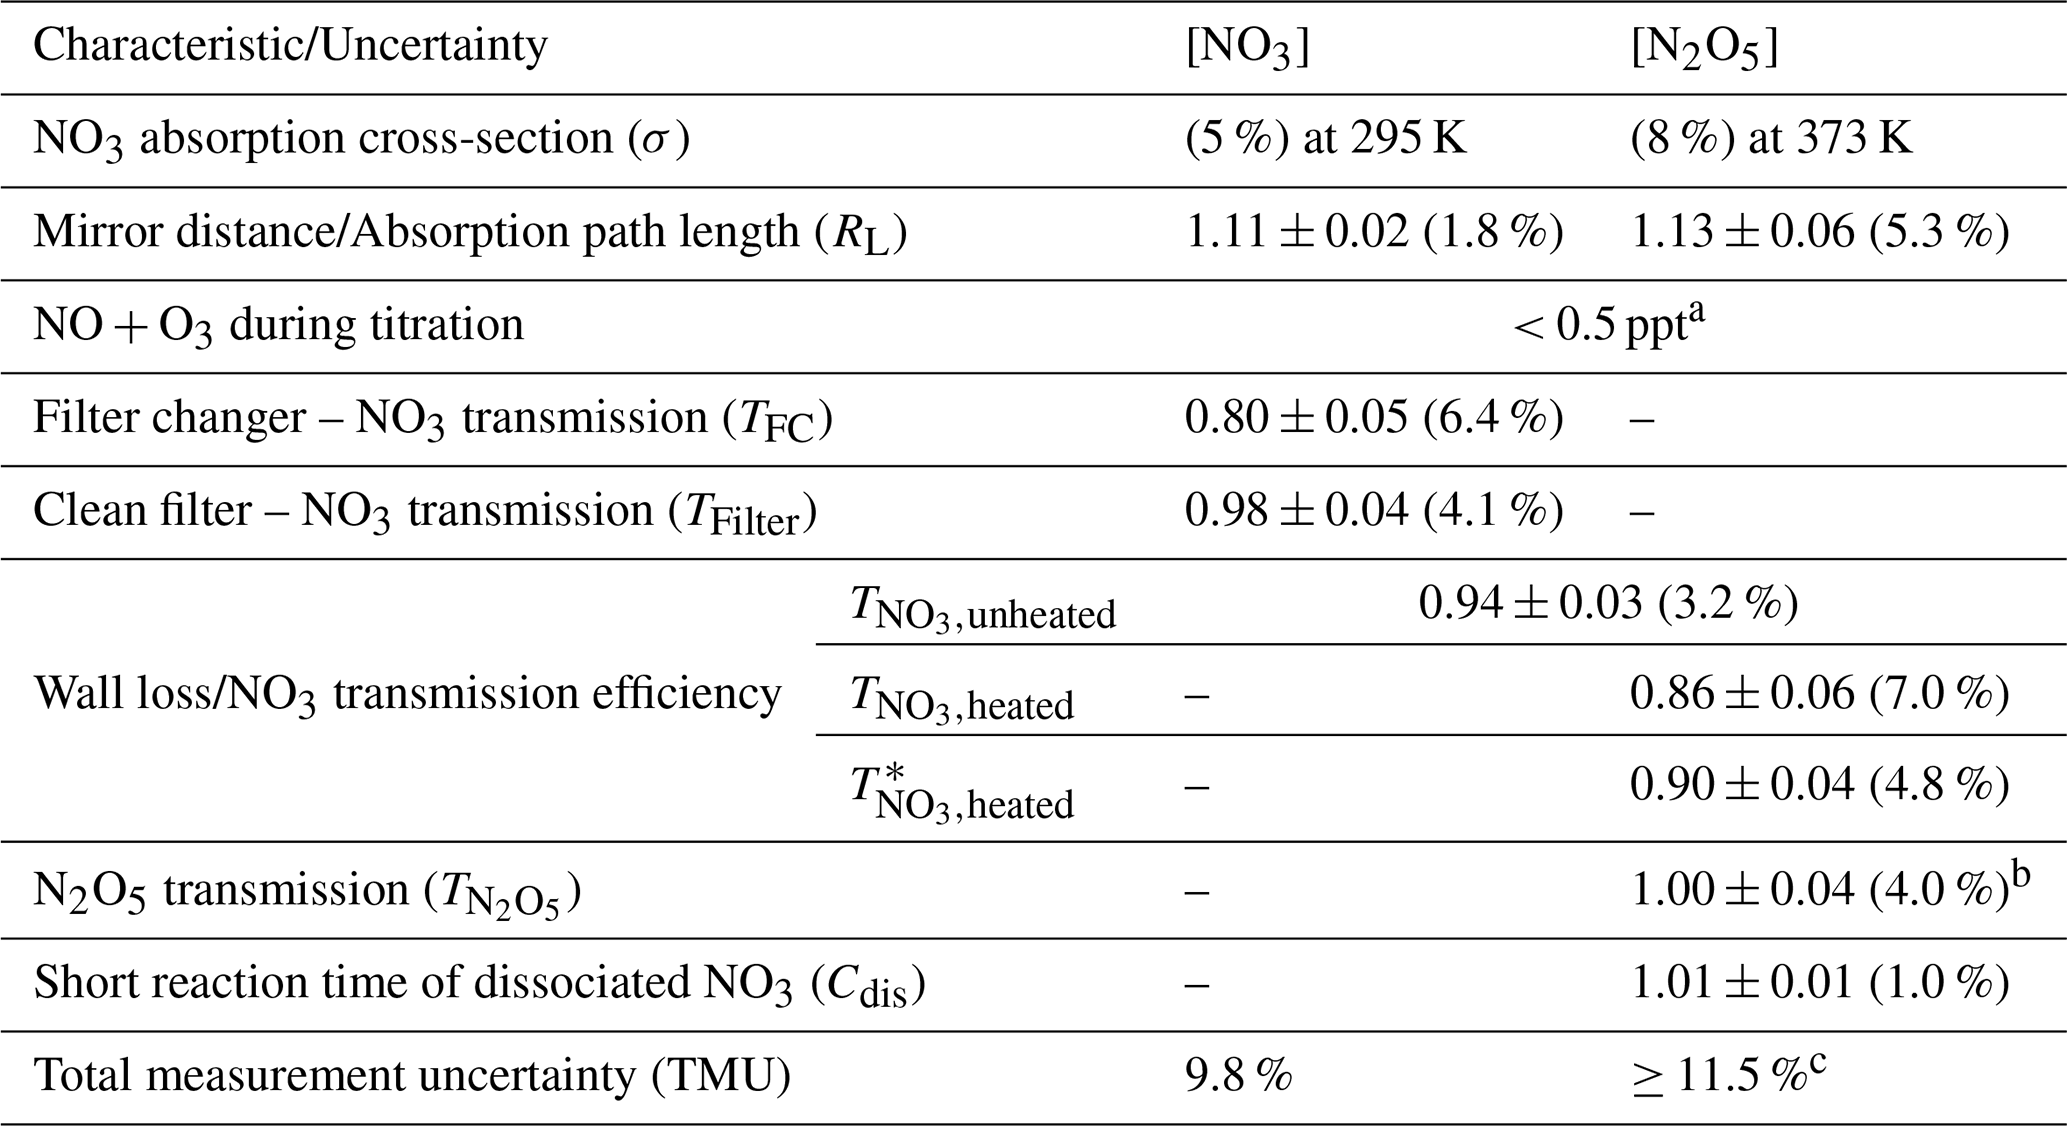
Notes: The percentage values in brackets represent the relative uncertainties of each contributing factor. a See conditions in Sect. 3.3. b Value taken from Schuster et al. (2009). c This value holds for low ambient temperatures when mixing ratios of NO3 are very low compared to N2O5 and increases with the ratio of , see Fig. S4.
3.6 Losses of NO3 on the cavity walls
The fractional loss of NO3 to the cavity walls can be a major correction factor for CRDS instruments and depends on the residence time in the cavity and on the material from which the cavity is made. Common materials are PFA tubing (Wagner et al., 2011; Fuchs et al., 2008) or cavities made from glass or metal that are either coated with a halocarbon wax (Dubé et al., 2006; Brown et al., 2002b) or FEP (Sobanski et al., 2016a; Schuster et al., 2009).
In order to reduce NO3 losses, our glass cavities are coated with FEP and operated at short residence times (i.e. high flow rates), as described in Sect. 2.2. As the loss of NO3 is a first-order process, we quantify the wall loss rate constant (kWall) by varying the residence time in each channel and observing the relative change in the NO3 signal. To avoid changes in either the NO3 concentration or its loss in inlet lines, the total flow (i.e. to both cavities) is kept constant during these experiments and the filter is bypassed. Figure 6 shows the expected exponential decrease in NO3 with increasing residence time. The residence times were calculated from the flow rates and are shorter in the heated inlet/cavity due to the increase in linear velocity at high temperatures. In the heated channel, measurements below flow rates of 5000 sccm were excluded due to increased noise in the ring-down signal, presumably caused by changing the temperature of the mirror mounts away from that experienced during the prior optical alignment. This is reproducible and a similar effect was already observed by Sobanski et al. (2016a).
Each data point in Fig. 6 represents an average of 3 min. The values of kWall obtained are 0.15 ± 0.06 s−1 for the NO3 channel and 0.45 ± 0.20 s−1 for the (NO3 + N2O5) channel. The more rapid loss of NO3 in the hot cavity may be related to increased collision rates of NO3 with the surface. Under normal operating conditions (7 slm each channel), the residence times are 0.43 s in the NO3 channel and 0.34 s in the (NO3 + N2O5) channel, which translate to wall loss factors of 0.94 ± 0.03 and 0.86 ± 0.06, respectively. These values are very similar to other instruments that reported losses in the range of 5 % to 15 % (Dubé et al., 2006; Schuster et al., 2009; Sobanski et al., 2016a; Brown et al., 2002b).
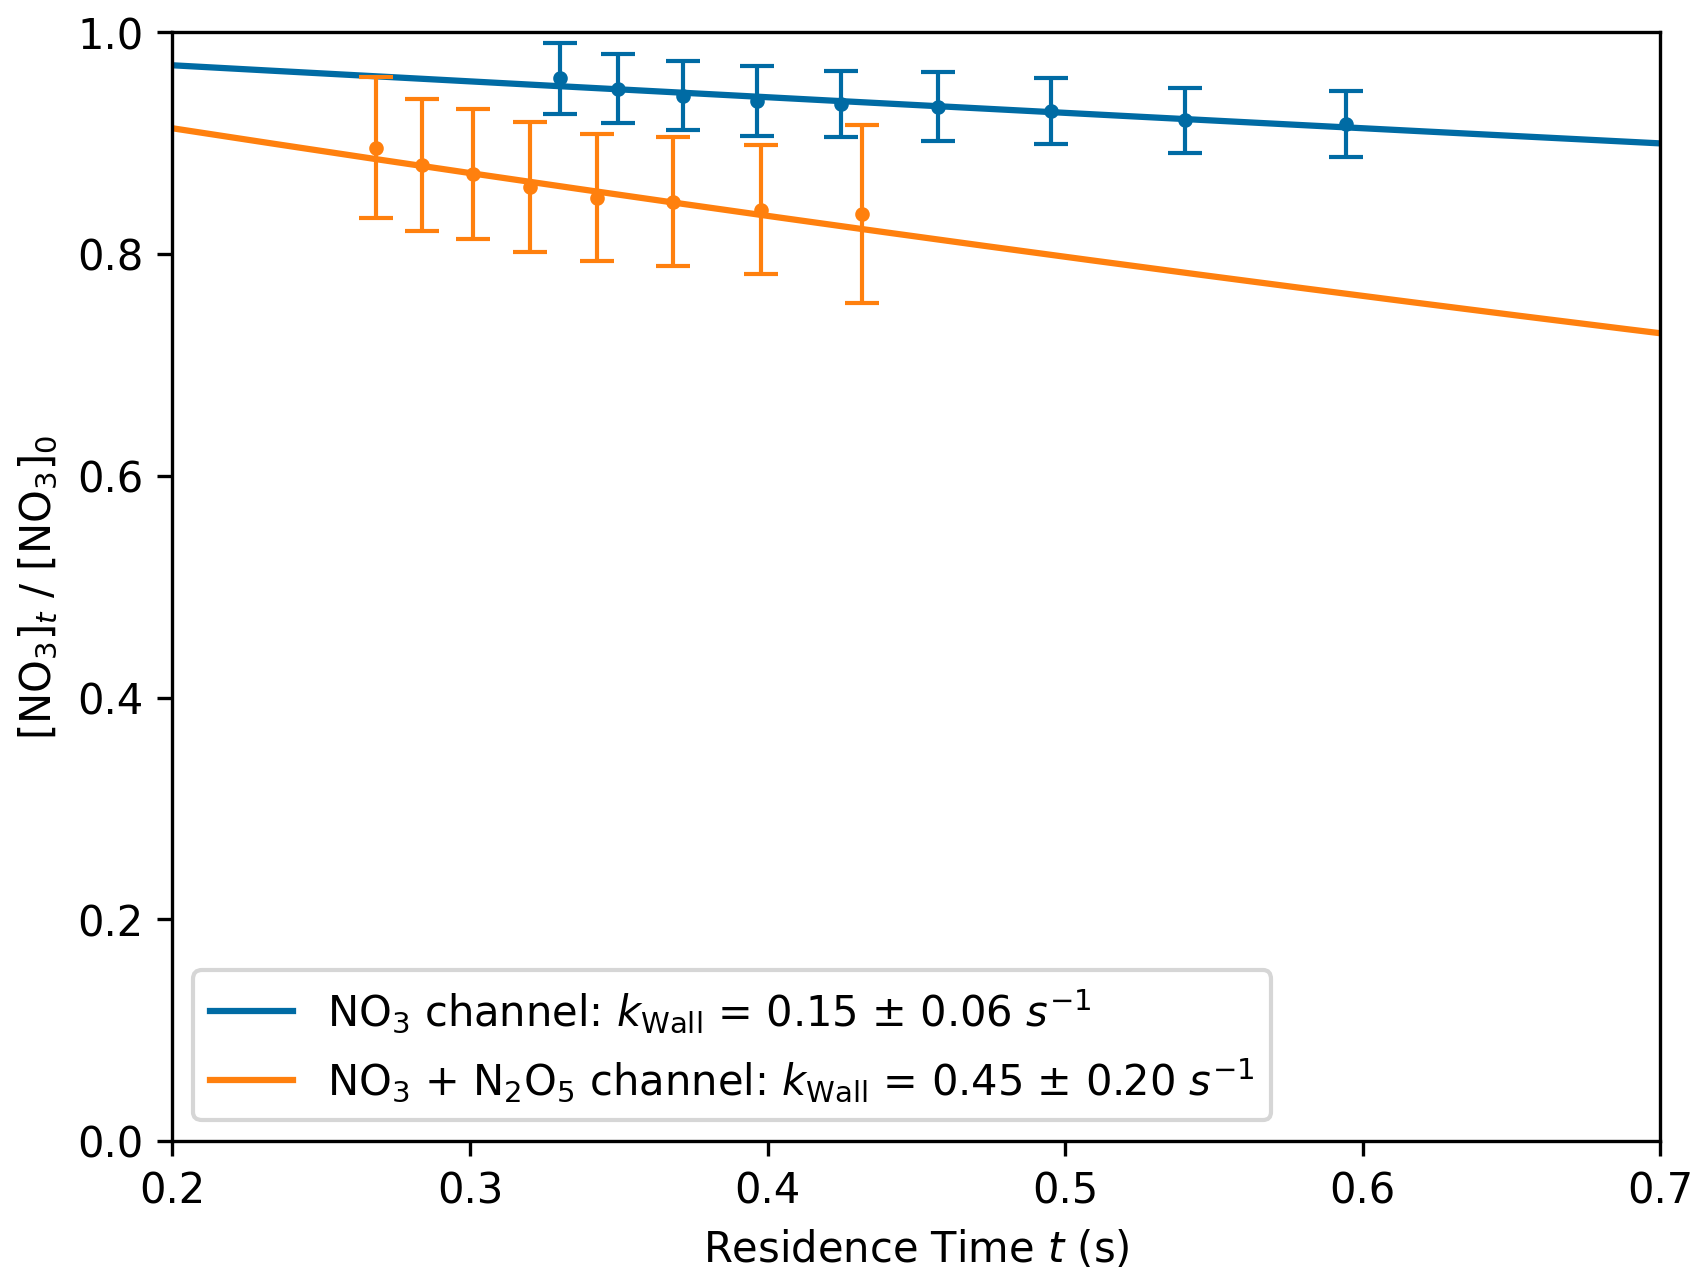
Figure 6Determination of wall loss rates (kWall) by variation of the residence times (t) for both channels. The measured values are based on the average and two standard deviations of 3 min of data, normalized to the initial value of a mono-exponential fit. The flow ranges were 5000–9000 sccm (NO3 channel) and 5500–9000 sccm (NO3 + N2O5 channel).
3.7 Calculation of ambient mixing ratios and total measurement uncertainty
The true ambient NO3 mixing ratios can be derived from Eq. (4) which considers the transmission factors originating from the filter changer (TFC), filters (TFilter) and wall loss of NO3 () for the unheated cavity. The complete overview of all cavity specific values is presented in Table 2.
Note that is determined by Eq. (1). To derive the expression for true ambient [N2O5], we start with an expression for [NO3+N2O5]meas which is corrected by a minor factor due to the short reaction time of newly dissociated NO3 with NO (Cdis), see Sect. 3.3.
Here, we applied the respective transmission factors to [NO3] and [N2O5]. Please note that there is a different NO3 transmission factor for the heated cavity () and slightly higher transmission () for newly formed NO3 after the dissociation of N2O5, which was derived by the corresponding wall loss rate and the residence time purely within the absorption path of the cavity (about 0.24 s). The loss of N2O5 in transmission through filters and inert PFA tubing () has been shown to be negligible (Schuster et al., 2009; Brown et al., 2002b) but is listed for completeness. By rearranging Eq. (5) and inserting Eq. (4), we derive an expression for the true ambient N2O5 which depends on the measurements of both cavities and is similar to the one shown by Fuchs et al. (2008):
The total measurement uncertainty (TMU) includes contributions from the absorption cross-section of NO3, the ratio between mirror distance and absorption path length as well as the aforementioned NO3 transmission factors. The overview of all uncertainties is listed in Table 2. Based on this, we determine the TMU as propagated relative uncertainty and estimate 9.8 % for the measurements of [NO3] in the unheated cavity. Due to the subtraction within Eq. (5), this method becomes slightly more complicated for N2O5 and can be most easily derived by redefining the individual terms:
- I.
x≡[N2O5]
- II.
- III.
- IV.
- V.
Table 2Comparison of NO3 and/or N2O5 instruments that use optical cavities and are designed for field deployment.
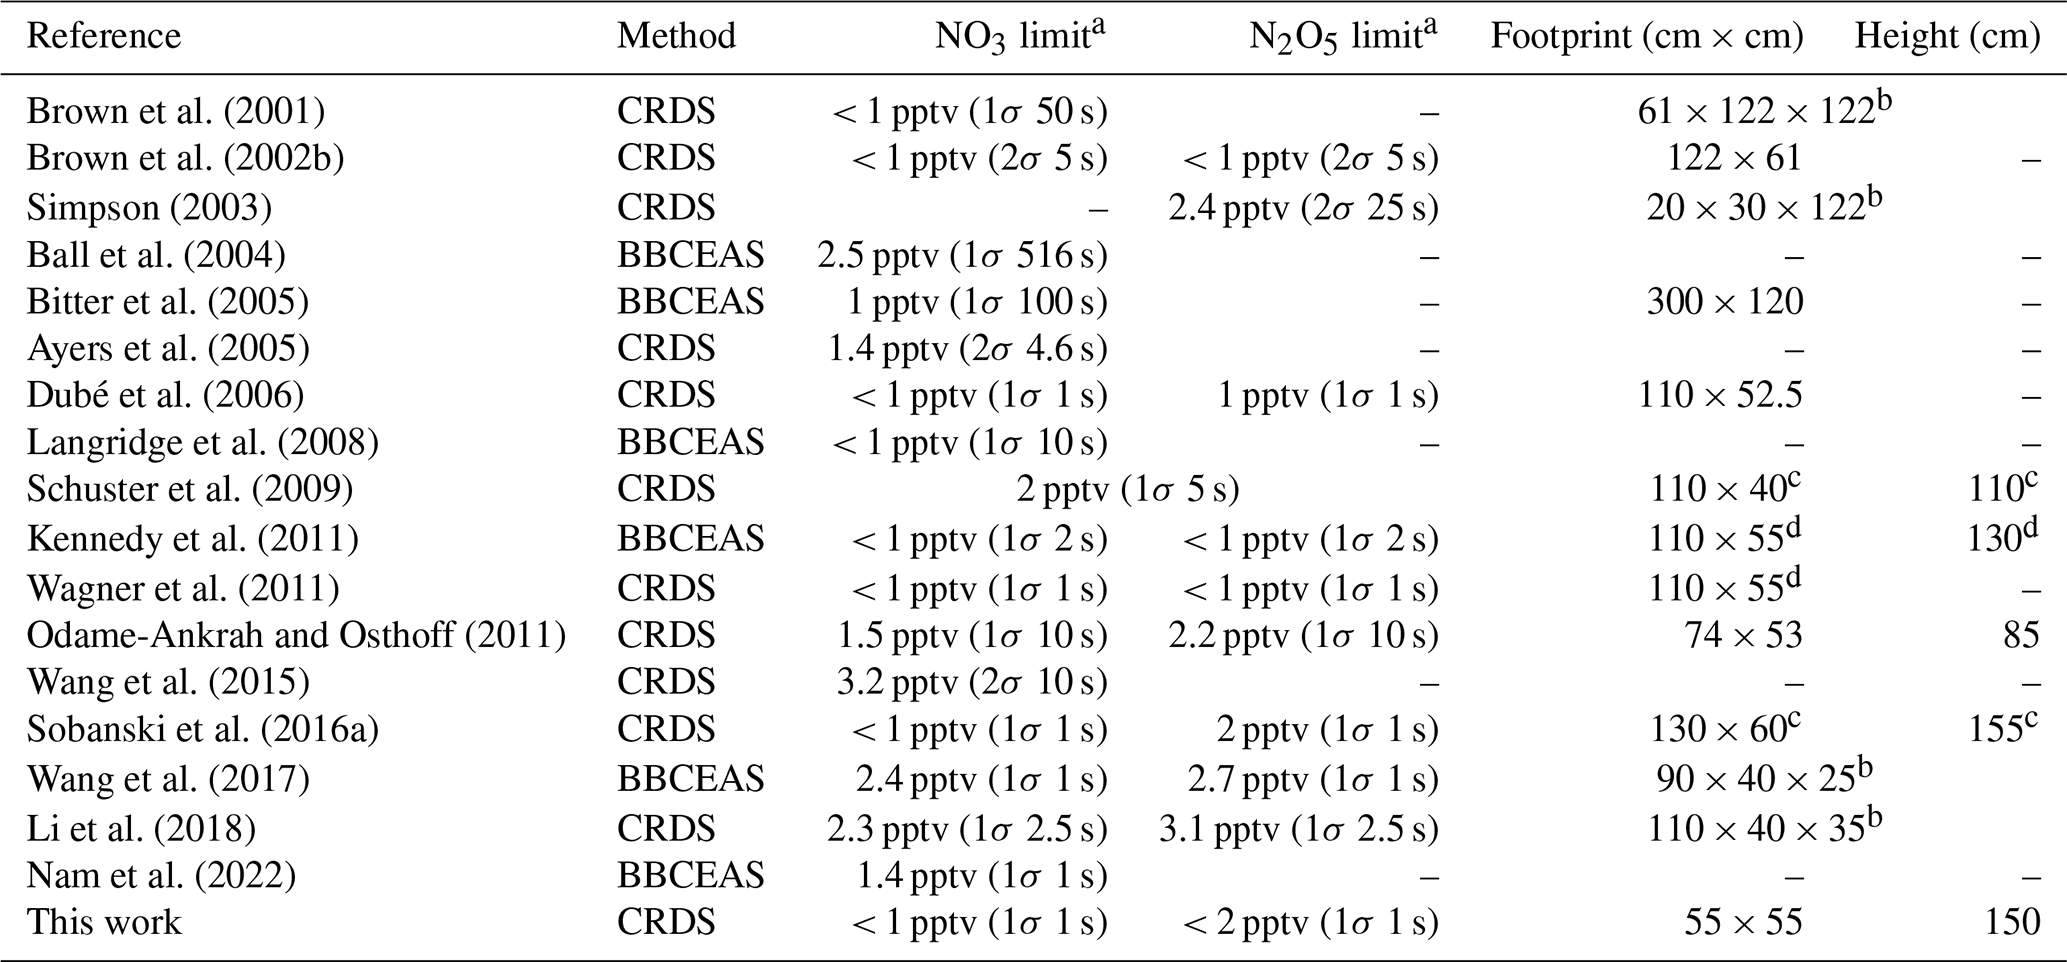
Notes: a LOD or precision (typically reported for BBCEAS). b Stated as reported, but the optical path is likely horizontally aligned, which increases the footprint. c Value based on personal communication. d Value based on visual estimation.
We derive the relative uncertainty (written in parenthesis) of by:
In the last step, we defined (with a>0) which represents the ratio between (b) the proportion of NO3 detected in the heated cavity over (a) the corrected sum of NO3 + N2O5. Furthermore, we derive the relative uncertainty of [N2O5] = which can be written as:
This depends only on the relative uncertainties of a, b and c which depend on the presented (and propagated) uncertainties of this instrument as well as r. A more intuitive understanding of r can be gained by its relation to ambient [NO2] and the equilibrium constant (Keq) that together with the NO2 concentration and the temperature defines the ratio (IUPAC, 2026; Burkholder et al., 2020; Osthoff et al., 2007). Since r is defined by NO3 and N2O5 measured (and corrected) in the heated cavity, we can rewrite:
With c and describing the combined transmission factors of the respective molecules within the heated channel. Concluding, we can estimate the TMU of the heated channel based on an additional ambient [NO2] measurement and well-known constants for the thermal equilibrium as well as the transmission factors of this instrument.
The lowest uncertainty of x = [N2O5] is reported when r→0 (e.g. ambient temperature < 0 °C and [NO2] > 2 ppbv results in r < 3 %) and yields 11.5 % while we estimate about 22.3 % for r=0.5 (i.e. [NO3] = [N2O5]). A graphic of this estimate is shown in Fig. S4 and highlights the case for r→1 (i.e. very low [N2O5]) when the subtraction introduces uncertainties greater than 100 %. Please note that the (atmospheric) variability of and [NO3+N2O5]meas does not contribute to the TMU estimation but uncertainties of σ and RL for both cavities are included.
Another potential uncertainty is the thermal dissociation of N2O5 to NO3 during transit through the filter changer and cavities, and becomes important when sampling cold air into a warm container/instrument (Schuster et al., 2009). Assuming an equilibrium of NO3 and N2O5 at 1 ppbv of NO2 and no additional loss or production, an immediate increase from 0 to 25 °C causes the dissociation of about 1 % of N2O5 in 0.25 s, which is the residence time from the filter changer entrance to the cavity entrance. This increases to about 2 % until the exit of the cavity (after 0.55 s) and has to be corrected when there is a significant temperature difference compared to ambient conditions.
3.8 Comparison with field-deployable cavity enhanced instruments for NO3
During the last few decades, several instruments using cavity-enhanced absorption spectroscopy have been developed for ambient measurement of NO3 (and N2O5). Table 2 lists those instruments that have been described in the literature which were designed or used for field-deployment. The table includes instrumental parameters such as LOD (for both NO3 and N2O5) and the footprint, where this information is available.
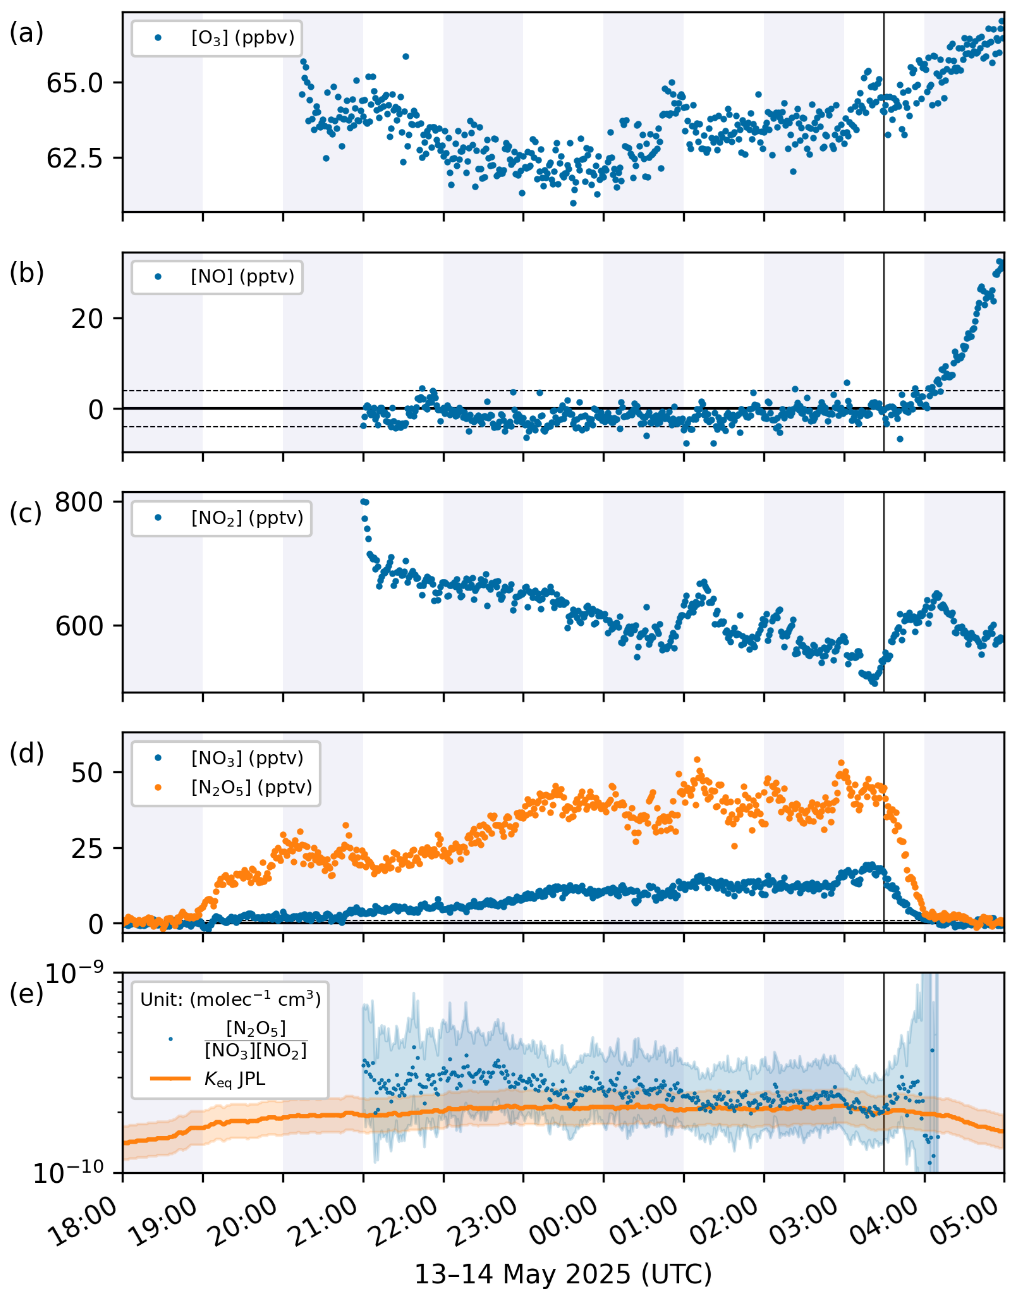
Figure 7Nighttime data from a field campaign in May 2025 at Kleiner Feldberg, Germany. Sunset was at 19:00 UTC while sunrise occurred at 03:30 UTC (vertical black line). (a) Ozone was detected by a commercial UV-absorption instrument, while (b) NO and (c) NO2 were measured by the CLD instrument. Panel (d) presents measurements of NO3 and N2O5 by our new 2CH-CRDS instrument, while (e) shows the equilibrium constant Keq (including uncertainty) based on the measurements of NO2, NO3 and N2O5 in comparison to the recommended value by JPL (Burkholder et al., 2020), which depends on ambient temperature.
While some of the first instruments, e.g. Brown et al. (2001), used large pulsed lasers and were mounted on optical tables, the availability of laser diodes has reduced the cost and size requirements. The most commonly deployed modern detection methods are BBCEAS and CRDS, the best of which (Brown et al., 2001, 2002a; Dubé et al., 2006; Wagner et al., 2011; Sobanski et al., 2016a) achieve < 1 pptv limits of detection within 1 s of integration time, as does the present instrument. Note that all of these are CRDS instruments, with BBCEAS-based methods having slightly poorer LODs. The two features of the present instrument that set it aside from most others is the small footprint and ease of mirror-adjustment/cleaning and optical stability.
The vertical alignment of the cavities in our system result in the smallest footprint among those instruments that achieve sub-pptv performance at 1 s integration time. Compared to our present instrument (Sobanski et al., 2016a), and previous versions (Schuster et al., 2009) we have greatly reduced the footprint (factor > 2) and weight (factor 2), which together allow easier transport and enhances the possibility of measurements in confined spaces such as tower-elevators. While it is not possible to compare the “ease of optical adjustment” and optimization of ring-down times with instruments that do not stem from our group, the mirror-tilting mechanism in our latest instrument and its (lack of) response to e.g. mechanical and thermal stress is superior to the use of commercial optical mounts (Sobanski et al., 2016a) as is the ease of mirror removal, cleaning and replacement. These attributes make deployment of the present instrument in confined spaces and non-laboratory environments easier to achieve than our previous setups.
The performance of this 2CH-CRDS instrument under field conditions is illustrated by data from a recent field campaign, which took place in May 2025 at the Taunus Observatory at the summit of Kleiner Feldberg (825 m above sea level), Germany. The instrument was located in a modified sea container and sampled from a high-volume flow inlet (about 30 cm in diameter, centerline velocity of 20 m s−1) from 5 m above ground. In combination with an additional bypass flow (∼ 25 000 sccm through 2 m of in. PFA tubing) the residence time within the container inlet is estimated to be about 0.4 s.
At the same inlet, a commercial ozone monitor (Model 205, 2B Technologies, LOD 2 ppb, uncertainty 5 %) monitored the mixing ratios of O3 and a chemiluminescence detection (CLD) instrument measured NO and NO2 (LOD 4 pptv for NO and 5 pptv for NO2, total uncertainty 5 %) (Nussbaumer et al., 2021). Ambient temperature was recorded by a small weather station (DNT000008, dnt) which was mounted at the same height as the inlet about 2.5 m horizontally distant, and compared to the measurements of the German Meteorological Service (DWD, station ID 2601) located about 15 m to the east and only 2 m above the ground.
In Fig. 7, we present our measurements from 13–14 May, which was at the beginning of the campaign during a dry and stable period (see Fig. S5 for meteorological data). During this night, the ambient temperature decreased from 12 to 10 °C while relative humidity was about 50 % to 55 %. Wind speeds decreased from 5 to 2 m s−1 and gradually changed from North-East to South-East. O3 was consistently between 61 and 65 ppbv with a brief increase shortly before 01:00 UTC. Due to a calibration, NO and NO2 measurements only started at 21:00 UTC. Until sunrise at ∼ 03:30 UTC (vertical black line), [NO] remained below LOD since its lifetime is less than 1 min at [O3] > 60 ppbv and ambient temperatures above 10 °C. NO was observed after dawn when its production via the photolysis of NO3 and NO2 occurred. [NO2] decreased from 750 to 500 pptv at the end of the night. Again, at about 01:00 UTC, an increase by ∼ 100 pptv for approx. 20 min was observed as well as smaller fluctuations thereafter, indicating changes in air mass composition.
This night, the 2CH-CRDS operated at a LOD of 1 pptv for NO3 and 3 pptv for the (NO3 + N2O5) channel at 1 min integration time, which is determined by the variability of zero measurements and drift effects. Both NO3 and N2O5 increased quasi-continuously from sunset until dawn, with NO3 mixing ratios reaching 20 pptv shortly before sunrise, before rapidly decreasing due to photolysis. The maximum N2O5 mixing ratio (∼ 40 pptv) was also observed at the end of the night. Maxima in the N2O5 mixing ratio were correlated with NO2 mixing ratios, indicating that the variability was driven (at least partially) by an increase in the NO3 production term. In Fig. 7e, we show temperature-dependent equilibrium constants based on the JPL (Jet Propulsion Laboratory) recommended values and associated uncertainties (Burkholder et al., 2020) alongside the calculated values based on our measurements using Keq = × [NO2]). We calculated the upper and lower limits by considering the LODs for each measurement and their uncertainties presented earlier.
Based on Crowley et al. (2010), the time to relax to equilibrium (τeq = (k5 × [NO2] + k6)−1 with corresponding reaction rates; IUPAC, 2026) was about 150 s over the course of this night, which is sufficiently short to expect NO3 and N2O5 to remain in thermal equilibrium. During the latter hours of the night (after 01:00 UTC), the measured Keq is in good agreement with the recommended value. Before 23:00 UTC, when [NO3] remained mostly below 5 pptv, our calculated values of Keq are higher (by a factor of about 1.4) than expected but still agree within the combined uncertainty.
The discrepancy in Keq before 23:00 UTC could also be associated with uncertainty in the ambient temperature used in the calculation. This could result from measurement uncertainty (e.g. insufficiently precise calibration of the temperature sensor) or from the air mass having recently experienced a different temperature (i.e. due to vertical gradients in temperature) than measured at the inlet. Changing the temperature by 1 °C would result in values of Keq that would encompass most of the measured values. In addition, a very local sink of NO3 or N2O5 or a loss of either on the inlet material (e.g. via accumulation of reactive aerosol) could also preclude calculation of the correct value of Keq as previously reported (Crowley et al., 2011).
In summary, while several factors contribute to the non-perfect agreement in Keq derived either from our measurements of NO2, NO3, N2O5 and temperature or from the recommended, temperature-dependent parameterisation, both agree within the combined uncertainties.
We have developed and characterized a new 2CH-CRDS instrument to quantify the mixing ratio of NO3 and N2O5 of ambient air. The instrument's compact size and relatively low weight (while maintaining a low LOD) allow for measurements at remote locations where transport and installation space are limited. Under laboratory conditions, we achieved LODs of about 0.1 pptv for the NO3 channel and 0.2 pptv for the (NO3 + N2O5) channel (1σ Allan deviation at 3 min integration time). Under field conditions LODs are more typically 1 and 3 pptv (2σ variations of zero measurements at 1 min resolution), respectively.
We estimated the total measurement uncertainty for [NO3] to be 9.8 % and presented an equation to determine the TMU for [N2O5] depending on the ratio of ambient NO3 and N2O5, which can also be derived by the equilibrium constant and ambient [NO2]. As a lower limit, we estimate 11.5 % ([NO2] > 2 ppbv, T < 0 °C) which increases to about 22.3 % for [NO3] ≈ [N2O5].
Extensive testing of filters from Merck Millipore (PM2547050) and Cytiva Whatman (7592-104) proved them to be viable alternatives to the discontinued PTFE filters from Pall (R2PJ047). Both Merck and Cytiva filters (but also filters from Pall) showed an initial NO3 transmission of about 80 %, which could be increased to > 98 % after 5–10 min of exposure to NO3 and O3. Exposure of filters, while stacked in our automatic filter changer, to a stream of O3 (500 sccm of about 20 ppmv) in clean air results in > 98 % transmission of NO3 directly after each filter change. In addition, we showed that the transmission of NO3 through used filters can be optimised by treatment with large concentrations of O3, thus enabling their reuse while reducing waste and costs. The instrument has produced field measurements of NO3 and N2O5, which (in combination with measurements of NO2) agree within their uncertainty with equilibrium calculations based on the recommended equilibrium coefficients.
Data underlying the figures in this publication has been made available on the Max Planck repository (EDMOND) and can be accessed under the following DOI: https://doi.org/10.17617/3.IJ3TSR (Türk, 2026).
The supplement related to this article is available online at https://doi.org/10.5194/amt-19-4815-2026-supplement.
Conceptualization: GT, JS, JC. Data Curation: GT, SA, PD. Formal Analysis: GT. Funding Acquisition: JL, JC. Investigation: GT, SA, PD, JS, JC. Methodology: GT, JC. Project Administration: JL, JC. Resources: GT, JS, JL, JC. Software: GT. Supervision: JL, JC. Validation: GT. Visualization: GT. Writing – original draft: GT, JC. Writing – review and editing: GT, SA, PD, JS, JL, JC.
The contact author has declared that none of the authors has any competing interests.
Publisher's note: Copernicus Publications remains neutral with regard to jurisdictional claims made in the text, published maps, institutional affiliations, or any other geographical representation in this paper. The authors bear the ultimate responsibility for providing appropriate place names. Views expressed in the text are those of the authors and do not necessarily reflect the views of the publisher.
Simone T. Andersen thanks the Alexander von Humboldt foundation for funding her stay at the MPIC. We thank the following: Uwe Parchatka (MPIC) and Marcel Zauner-Wieczorek (Goethe University Frankfurt) for their support throughout the campaign at Kleiner Feldberg; Chemours for providing a sample of the FEPD-121 solution used to coat the cavity glass walls; Merck Millipore and Cytiva Whatman for providing each a sample of PFTE filters for our transmission measurements. This work was supported by the “Max Planck Graduate Center” (MPGC) with the Johannes Gutenberg University of Mainz.
The article processing charges for this open-access publication were covered by the Max Planck Society.
This paper was edited by Anna Novelli and reviewed by two anonymous referees.
Aliwell, S. R. and Jones, R. L.: Measurements of tropospheric NO3 at midlatitude, J. Geophys. Res.-Atmos., 103, 5719–5727, 1998.
Allan, B. J., Plane, J. M. C., Coe, H., and Shillito, J.: Observations of NO3 concentration profiles in the troposphere, J. Geophys. Res.-Atmos., 107, 4588, https://doi.org/10.1029/2002jd002112, 2002.
Atkinson, R. and Arey, J.: Atmospheric degradation of volatile organic compounds, Chem. Rev., 103, 4605–4638, https://doi.org/10.1021/cr0206420, 2003.
Ayers, J. D. and Simpson, W. R.: Measurements of N2O5 near Fairbanks, Alaska, J. Geophys. Res.-Atmos., 111, 2006.
Ayers, J. D., Apodaca, R. L., Simpson, W. R., and Baer, D. S.: Off-axis cavity ringdown spectroscopy: application to atmospheric nitrate radical detection, Appl. Optics, 44, 7239–7242, 2005.
Ball, S. M., Langridge, J. M., and Jones, R. L.: Broadband cavity enhanced absorption spectroscopy using light emitting diodes, Chem. Phys. Lett., 398, 68–74, https://doi.org/10.1016/j.cplett.2004.08.144, 2004.
Berden, G., Peeters, R., and Meijer, G.: Cavity ring-down spectroscopy: Experimental schemes and applications, Int. Rev. Phys. Chem., 19, 565–607, 2000.
Bitter, M., Ball, S. M., Povey, I. M., and Jones, R. L.: A broadband cavity ringdown spectrometer for in-situ measurements of atmospheric trace gases, Atmos. Chem. Phys., 5, 2547–2560, https://doi.org/10.5194/acp-5-2547-2005, 2005.
Blume, P. A.: The LabVIEW Style Book, Prentice Hall, ISBN 13:9780131458352, 2007.
Brown, S. S. and Stutz, J.: Nighttime radical observations and chemistry, Chem. Soc. Rev., 41, 6405–6447, 2012.
Brown, S. S., Stark, H., Ciciora, S. J., and Ravishankara, A. R.: In-situ measurement of atmospheric NO3 and N2O5 via cavity ring-down spectroscopy, Geophys. Res. Lett., 28, 3227–3230, 2001.
Brown, S. S., Stark, H., and Ravishankara, A. R.: Cavity ring-down spectroscopy for atmospheric trace gas detection: application to the nitrate radical (NO3), Appl. Phys. B-Lasers O., 75, 173–182, 2002a.
Brown, S. S., Stark, H., Ciciora, S. J., McLaughlin, R. J., and Ravishankara, A. R.: Simultaneous in situ detection of atmospheric NO3 and N2O5 via cavity ring-down spectroscopy, Rev. Sci. Instrum., 73, 3291–3301, 2002b.
Brown, S. S., Stark, H., Ryerson, T. B., Williams, E. J., Nicks, D. K., Trainer, M., Fehsenfeld, F. C., and Ravishankara, A. R.: Nitrogen oxides in the nocturnal boundary layer: Simultaneous in situ measurements of NO3, N2O5, NO2, NO, and O3, J. Geophys. Res.-Atmos., 108, 4299, https://doi.org/10.1029/2002JD002917, 2003.
Brown, S. S., Dubé, W. P., Osthoff, H. D., Wolfe, D. E., Angevine, W. M., and Ravishankara, A. R.: High resolution vertical distributions of NO3 and N2O5 through the nocturnal boundary layer, Atmos. Chem. Phys., 7, 139–149, https://doi.org/10.5194/acp-7-139-2007, 2007.
Burkholder, J. B., Sander, S. P., Abbatt, J., Barker, J. R., Cappa, C., Crounse, J. D., Dibble, T. S., Huie, R. E., Kolb, C. E., Kurylo, M. J., Orkin, V. L., Percival, C. J., Wilmouth, D. M., and Wine, P. H.: Chemical Kinetics and Photochemical Data for Use in Atmospheric Studies, Evaluation No. 19, JPL Publication 19-5, Jet Propulsion Laboratory, Pasadena, https://science.jpl.nasa.gov/documents/1487/NASA-JPL_Evaluation_19-5.pdf (last access: 22 July 2026), 2020.
Carslaw, N., Plane, J. M. C., Coe, H., and Cuevas, E.: Observations of the nitrate radical in the free troposphere at Izana de Tenerife, J. Geophys. Res.-Atmos., 102, 10613–10622, https://doi.org/10.1029/96JD03512, 1997.
Coheur, P. F., Fally, S., Carleer, M., Clerbaux, C., Colin, R., Jenouvrier, A., Merienne, M. F., Hermans, C., and Vandaele, A. C.: New water vapor line parameters in the 26000–13000 cm−1 region, J. Quant. Spectrosc. Ra., 74, 493–510, https://doi.org/10.1016/s0022-4073(01)00269-2, 2002.
Cox, R. A., Ammann, M., Crowley, J. N., Herrmann, H., Jenkin, M. E., McNeill, V. F., Mellouki, A., Troe, J., and Wallington, T. J.: Evaluated kinetic and photochemical data for atmospheric chemistry: Volume VII – Criegee intermediates, Atmos. Chem. Phys., 20, 13497–13519, https://doi.org/10.5194/acp-20-13497-2020, 2020.
Crowley, J. N., Schuster, G., Pouvesle, N., Parchatka, U., Fischer, H., Bonn, B., Bingemer, H., and Lelieveld, J.: Nocturnal nitrogen oxides at a rural mountain-site in south-western Germany, Atmos. Chem. Phys., 10, 2795–2812, https://doi.org/10.5194/acp-10-2795-2010, 2010.
Crowley, J. N., Thieser, J., Tang, M. J., Schuster, G., Bozem, H., Beygi, Z. H., Fischer, H., Diesch, J.-M., Drewnick, F., Borrmann, S., Song, W., Yassaa, N., Williams, J., Pöhler, D., Platt, U., and Lelieveld, J.: Variable lifetimes and loss mechanisms for NO3 and N2O5 during the DOMINO campaign: contrasts between marine, urban and continental air, Atmos. Chem. Phys., 11, 10853–10870, https://doi.org/10.5194/acp-11-10853-2011, 2011.
Dewald, P., Andersen, S. T., Türk, G. N. T. E., Wüst, L., Nelson, C., Schuladen, J., Ehn, M., Petäjä, T., Ylivinkka, I., Ahonen, L. R., Fischer, H., Lelieveld, J., and Crowley, J. N.: Vertical profiles of NO3 reactivity within the surface layer of a boreal forest, Environ. Sci.-Atmos., 6, 551–564, https://doi.org/10.1039/D5EA00153F, 2026.
Dorn, H.-P., Apodaca, R. L., Ball, S. M., Brauers, T., Brown, S. S., Crowley, J. N., Dubé, W. P., Fuchs, H., Häseler, R., Heitmann, U., Jones, R. L., Kiendler-Scharr, A., Labazan, I., Langridge, J. M., Meinen, J., Mentel, T. F., Platt, U., Pöhler, D., Rohrer, F., Ruth, A. A., Schlosser, E., Schuster, G., Shillings, A. J. L., Simpson, W. R., Thieser, J., Tillmann, R., Varma, R., Venables, D. S., and Wahner, A.: Intercomparison of NO3 radical detection instruments in the atmosphere simulation chamber SAPHIR, Atmos. Meas. Tech., 6, 1111–1140, https://doi.org/10.5194/amt-6-1111-2013, 2013.
Dubé, W. P., Brown, S. S., Osthoff, H. D., Nunley, M. R., Ciciora, S. J., Paris, M. W., McLaughlin, R. J., and Ravishankara, A. R.: Aircraft instrument for simultaneous, in situ measurement of NO3 and N2O5 via pulsed cavity ring-down spectroscopy, Rev. Sci. Instrum., 77, https://doi.org/10.1063/1.2176058, 2006.
Everest, M. A. and Atkinson, D. B.: Discrete sums for the rapid determination of exponential decay constants, Rev. Sci. Instrum., 79, https://doi.org/10.1063/1.2839918, 2008.
Fiedler, S. E., Hese, A., and Ruth, A. A.: Incoherent broad-band cavity-enhanced absorption spectroscopy, Chem. Phys. Lett., 371, 284–294, https://doi.org/10.1016/S0009-2614(03)00263-X, 2003.
Finlayson-Pitts, B. J. and Pitts, J. N.: Chemistry of the upper and lower atmosphere, Academic Press, San Diego, ISBN 13:9780122570605, https://doi.org/10.1016/B978-0-12-257060-5.X5000-X, 2000.
Fuchs, H., Dube, W. P., Cicioira, S. J., and Brown, S. S.: Determination of inlet transmission and conversion efficiencies for in situ measurements of the nocturnal nitrogen oxides, NO3, N2O5 and NO2, via pulsed cavity ring-down spectroscopy, Anal. Chem., 80, 6010–6017, 2008.
Geyer, A., Ackermann, R., Dubois, R., Lohrmann, B., Muller, T., and Platt, U.: Long-term observation of nitrate radicals in the continental boundary layer near Berlin, Atmos. Environ., 35, 3619–3631, https://doi.org/10.1016/S1352-2310(00)00549-5, 2001.
Geyer, A., Alicke, B., Ackermann, R., Martinez, M., Harder, H., Brune, W., di Carlo, P., Williams, E., Jobson, T., Hall, S., Shetter, R., and Stutz, J.: Direct observations of daytime NO3: Implications for urban boundary layer chemistry, J. Geophys. Res.-Atmos., 108, https://doi.org/10.1029/2002JD002967, 2003.
IUPAC – Task Group on Atmospheric Chemical Kinetic Data Evaluation (Ammann, M., Cox, R. A., Crowley, J. N., Herrmann, H., Jenkin, M. E., McNeill, V. F., Mellouki, A., Rossi, M. J., Troe, J., and Wallington, T. J.): https://iupac.aeris-data.fr/ (last access: 4 May 2026), 2026.
Kennedy, O. J., Ouyang, B., Langridge, J. M., Daniels, M. J. S., Bauguitte, S., Freshwater, R., McLeod, M. W., Ironmonger, C., Sendall, J., Norris, O., Nightingale, R., Ball, S. M., and Jones, R. L.: An aircraft based three channel broadband cavity enhanced absorption spectrometer for simultaneous measurements of NO3, N2O5 and NO2, Atmos. Meas. Tech., 4, 1759–1776, https://doi.org/10.5194/amt-4-1759-2011, 2011.
Lambe, A. T., Bai, B., Takeuchi, M., Orwat, N., Zimmerman, P. M., Alton, M. W., Ng, N. L., Freedman, A., Claflin, M. S., Gentner, D. R., Worsnop, D. R., and Liu, P.: Technical note: Gas-phase nitrate radical generation via irradiation of aerated ceric ammonium nitrate mixtures, Atmos. Chem. Phys., 23, 13869–13882, https://doi.org/10.5194/acp-23-13869-2023, 2023.
Langridge, J. M., Ball, S. M., Shillings, A. J. L., and Jones, R. L.: A broadband absorption spectrometer using light emitting diodes for ultrasensitive, in situ trace gas detection, Rev. Sci. Instrum., 79, 123110, https://doi.org/10.1063/1.3046282, 2008.
Li, Z., Hu, R., Xie, P., Chen, H., Wu, S., Wang, F., Wang, Y., Ling, L., Liu, J., and Liu, W.: Development of a portable cavity ring down spectroscopy instrument for simultaneous, in situ measurement of NO3 and N2O5, Opt. Express, 26, A433–A449, https://doi.org/10.1364/OE.26.00A433, 2018.
Liebmann, J., Sobanski, N., Schuladen, J., Karu, E., Hellén, H., Hakola, H., Zha, Q., Ehn, M., Riva, M., Heikkinen, L., Williams, J., Fischer, H., Lelieveld, J., and Crowley, J. N.: Alkyl nitrates in the boreal forest: formation via the NO3−, OH- and O3-induced oxidation of biogenic volatile organic compounds and ambient lifetimes, Atmos. Chem. Phys., 19, 10391–10403, https://doi.org/10.5194/acp-19-10391-2019, 2019.
Liebmann, J. M., Schuster, G., Schuladen, J. B., Sobanski, N., Lelieveld, J., and Crowley, J. N.: Measurement of ambient NO3 reactivity: design, characterization and first deployment of a new instrument, Atmos. Meas. Tech., 10, 1241–1258, https://doi.org/10.5194/amt-10-1241-2017, 2017.
Matsumoto, J., Imai, H., Kosugi, N., and Kaji, Y.: In situ measurement of N2O5 in the urban atmosphere by thermal decomposition/laser-induced fluorescence technique, Atmos. Environ., 39, 6802–6811, 2005.
Mazurenka, M., Orr-Ewing, A. J., Peverall, R., and Ritchie, G. A. D.: Cavity ring-down and cavity enhanced spectroscopy using diode lasers, Annu. Rep. Prog. Chem., Sect. C, 101, 100–142, 2005.
Nam, W., Cho, C., Perdigones, B., Rhee, T. S., and Min, K.-E.: Development of a broadband cavity-enhanced absorption spectrometer for simultaneous measurements of ambient NO3, NO2, and H2O, Atmos. Meas. Tech., 15, 4473–4487, https://doi.org/10.5194/amt-15-4473-2022, 2022.
Ng, N. L., Brown, S. S., Archibald, A. T., Atlas, E., Cohen, R. C., Crowley, J. N., Day, D. A., Donahue, N. M., Fry, J. L., Fuchs, H., Griffin, R. J., Guzman, M. I., Herrmann, H., Hodzic, A., Iinuma, Y., Jimenez, J. L., Kiendler-Scharr, A., Lee, B. H., Luecken, D. J., Mao, J., McLaren, R., Mutzel, A., Osthoff, H. D., Ouyang, B., Picquet-Varrault, B., Platt, U., Pye, H. O. T., Rudich, Y., Schwantes, R. H., Shiraiwa, M., Stutz, J., Thornton, J. A., Tilgner, A., Williams, B. J., and Zaveri, R. A.: Nitrate radicals and biogenic volatile organic compounds: oxidation, mechanisms, and organic aerosol, Atmos. Chem. Phys., 17, 2103–2162, https://doi.org/10.5194/acp-17-2103-2017, 2017.
Noxon, J. F., Norton, R. B., and Henderson, W. R.: Observation of Atmospheric NO3, Geophys. Res. Lett., 5, 675–678, 1978.
Nussbaumer, C. M., Parchatka, U., Tadic, I., Bohn, B., Marno, D., Martinez, M., Rohloff, R., Harder, H., Kluge, F., Pfeilsticker, K., Obersteiner, F., Zöger, M., Doerich, R., Crowley, J. N., Lelieveld, J., and Fischer, H.: Modification of a conventional photolytic converter for improving aircraft measurements of NO2 via chemiluminescence, Atmos. Meas. Tech., 14, 6759–6776, https://doi.org/10.5194/amt-14-6759-2021, 2021.
Odame-Ankrah, C. A. and Osthoff, H. D.: A Compact Diode Laser Cavity Ring-Down Spectrometer for Atmospheric Measurements of NO3 and N2O5 with Automated Zeroing and Calibration, Appl. Spectrosc., 65, 1260–1268, https://doi.org/10.1366/11-06384, 2011.
Orphal, J., Fellows, C. E., and Flaud, P. M.: The visible absorption spectrum of NO3 measured by high-resolution Fourier transform spectroscopy, J. Geophys. Res.-Atmos., 108, 4077, https://doi.org/10.1029/2002JD002489, 2003.
Osthoff, H. D., Pilling, M. J., Ravishankara, A. R., and Brown, S. S.: Temperature dependence of the NO3 absorption cross-section above 298 K and determination of the equilibrium constant for NO3 + NO2 ↔ N2O5 at atmospherically relevant conditions, Phys. Chem. Chem. Phys., 9, 5785–5793, https://doi.org/10.1039/b709193a, 2007.
Pilegaard, K.: Processes regulating nitric oxide emissions from soils, Philos. T. R. Soc. B, 368, 20130126, https://doi.org/10.1098/rstb.2013.0126, 2013.
Platt, U., Perner, D., Winer, A. M., Harris, G. W., and Pitts Jr., J. N.: Detection of NO3 in the polluted troposphere by differential optical absorption, Geophys. Res. Lett., 7, 89–92, 1980.
Schuster, G., Labazan, I., and Crowley, J. N.: A cavity ring down/cavity enhanced absorption device for measurement of ambient NO3 and N2O5, Atmos. Meas. Tech., 2, 1–13, https://doi.org/10.5194/amt-2-1-2009, 2009.
Simpson, W. R.: Continuous wave cavity ring-down spectroscopy applied to in situ detection of dinitrogen pentoxide (N2O5), Rev. Sci. Instrum., 74, 3442–3452, 2003.
Smith, J. P. and Solomon, S.: Atmospheric NO3 3. Sunrise Disappearance and the Stratospheric Profile, J. Geophys. Res.-Atmos., 95, 13819–13827, 1990.
Smith, N., Plane, J. M. C., Nien, C. F., and Solomon, P. A.: Nighttime Radical Chemistry in the San-Joaquin Valley, Atmos. Environ., 29, 2887–2897, 1995.
Sobanski, N., Schuladen, J., Schuster, G., Lelieveld, J., and Crowley, J. N.: A five-channel cavity ring-down spectrometer for the detection of NO2, NO3, N2O5, total peroxy nitrates and total alkyl nitrates, Atmos. Meas. Tech., 9, 5103–5118, https://doi.org/10.5194/amt-9-5103-2016, 2016a.
Sobanski, N., Tang, M. J., Thieser, J., Schuster, G., Pöhler, D., Fischer, H., Song, W., Sauvage, C., Williams, J., Fachinger, J., Berkes, F., Hoor, P., Platt, U., Lelieveld, J., and Crowley, J. N.: Chemical and meteorological influences on the lifetime of NO3 at a semi-rural mountain site during PARADE, Atmos. Chem. Phys., 16, 4867–4883, https://doi.org/10.5194/acp-16-4867-2016, 2016b.
Stutz, J., Alicke, B., Ackermann, R., Geyer, A., White, A., and Williams, E.: Vertical profiles of NO3, N2O5, O3, and NOx in the nocturnal boundary layer: 1. Observations during the Texas Air Quality Study 2000 J. Geophys. Res.-Atmos., 109, D12306, https://doi.org/10.1029/2003JD004209, 2004.
Tang, M. J., Thieser, J., Schuster, G., and Crowley, J. N.: Uptake of NO3 and N2O5 to Saharan dust, ambient urban aerosol and soot: a relative rate study, Atmos. Chem. Phys., 10, 2965–2974, https://doi.org/10.5194/acp-10-2965-2010, 2010.
Türk, G. N. T. E.: AMT 2CH-CRDS NO3/N2O5 data, Version V1, Edmond [data set], https://doi.org/10.17617/3.IJ3TSR, 2026.
Vandaele, A. C., Hermans, C., Fally, S., Carleer, M., Colin, R., Merienne, M. F., Jenouvrier, A., and Coquart, B.: High-resolution Fourier transform measurement of the NO2 visible and near-infrared absorption cross sections: Temperature and pressure effects, J. Geophys. Res.-Atmos., 107, 4348, https://doi.org/10.1029/2001JD000971, 2002.
Voigt, S., Orphal, J., Bogumil, K., and Burrows, J. P.: The temperature dependence (203–293 K) of the absorption cross sections of O3 in the 230–850 nm region measured by Fourier-transform spectroscopy, J. Photoch. Photobio. A, 143, 1–9, 2001.
von Friedeburg, C., Wagner, T., Geyer, A., Kaiser, N., Vogel, B., Vogel, H., and Platt, U.: Derivation of tropospheric NO3 profiles using off-axis differential optical absorption spectroscopy measurements during sunrise and comparison with simulations, J. Geophys. Res.-Atmos., 107, https://doi.org/10.1029/2001JD000481, 2002.
Wagner, N. L., Dubé, W. P., Washenfelder, R. A., Young, C. J., Pollack, I. B., Ryerson, T. B., and Brown, S. S.: Diode laser-based cavity ring-down instrument for NO3, N2O5, NO, NO2 and O3 from aircraft, Atmos. Meas. Tech., 4, 1227–1240, https://doi.org/10.5194/amt-4-1227-2011, 2011.
Wagner, T., Otten, C., Pfeilsticker, K., Pundt, I., and Platt, U.: DOAS moonlight observation of atmospheric NO3 in the Arctic winter, Geophys. Res. Lett., 27, 3441–3444, https://doi.org/10.1029/1999GL011153, 2000.
Wang, D., Hu, R., Xie, P., Liu, J., Liu, W., Qin, M., Ling, L., Zeng, Y., Chen, H., Xing, X., Zhu, G., Wu, J., Duan, J., Lu, X., and Shen, L.: Diode laser cavity ring-down spectroscopy for in situ measurement of NO3 radical in ambient air, J. Quant. Spectrosc. Ra., 166, 23–29, https://doi.org/10.1016/j.jqsrt.2015.07.005, 2015.
Wang, H., Chen, J., and Lu, K.: Development of a portable cavity-enhanced absorption spectrometer for the measurement of ambient NO3 and N2O5: experimental setup, lab characterizations, and field applications in a polluted urban environment, Atmos. Meas. Tech., 10, 1465–1479, https://doi.org/10.5194/amt-10-1465-2017, 2017.
Wayne, R. P., Barnes, I., Biggs, P., Burrows, J. P., Canosa-Mas, C. E., Hjorth, J., Le Bras, G., Moortgat, G. K., Perner, D., Poulet, G., Restelli, G., and Sidebottom, H.: The nitrate radical: Physics, chemistry, and the atmosphere, Atmos. Environ. A-Gen., 25A, 1–206, 1991.