
the Creative Commons Attribution 4.0 License.
the Creative Commons Attribution 4.0 License.
 | 18 Aug 2026
Curve fitting algorithm for multimodal particle size distributions – a theoretical basis
Christopher N. Rapp

Gerardo Carrillo-Cardenas
Tareq Hussein
Sining Niu
Yue Zhang
Fred J. Brechtel
A. Gannet Hallar
Daniel J. Cziczo
Here we detail an open-source curve fitting algorithm for multimodal particle size distributions (MPSDs) and evaluate it against a ten-year dataset of ambient particle size distribution (PSD) measurements collected at Storm Peak Laboratory, a remote mountainous research site. This algorithm is grounded in traditional aerosol statistics and assumes measured particle distributions are the sum of several lognormal PSDs. It is designed to be free of any predefined mode templates or mode number constraints. For a MPSD measurement, the total number concentration (Ni), geometric standard deviation (σg), and geometric mean diameter () of each mode is estimated using a Levenberg–Marquardt nonlinear least-squares algorithm. These fitted modes are then iteratively subtracted from the measured PSD until convergence and/or accuracy thresholds are met. Rigorous evaluation of ambient aerosol data reveals a tri-modal distribution is a poor assumption for Storm Peak Laboratory, particularly during new particle formation events. Four or more modes were necessary for 55.7 % of data associated with new particle formation. Furthermore, the algorithm was used to characterize complex laboratory PSDs where size selected ammonium sulfate aerosol was coated in oxidized biogenic secondary organic matter. The multimodal algorithm with a tri-modal setting exhibited strong agreement with existing MPSD fitting models but with significantly improved computational time. In summary, this algorithm provides an effective method to analyze PSD datasets for in situ laboratory and ambient measurements. To improve accessibility of this algorithm to the broader aerosol research community, we also include supplemental functions to format datasets from common mobility particle size spectrometers.
- Article
(2120 KB) - Full-text XML
-
Supplement
(2426 KB) - BibTeX
- EndNote


Atmospheric aerosols directly interact with Earth's climate by absorbing or scattering solar radiation, modulating the global radiative balance (Myhre et al., 2013). Furthermore, aerosol are critical to cloud formation by serving as cloud condensation nuclei (CCN) or ice nucleating particles (INPs) (Lohmann and Feichter, 2005). Aerosol-cloud interactions or indirect climate effects are commonly summarized as modifications to cloud properties such as cloud albedo or lifetime (Albrecht, 1989; Lohmann, 2007; Twomey, 1974; Twomey et al., 1984). Combined, these direct and indirect effects constitute the largest uncertainty in estimates of global radiation budgets (Myhre et al., 2013). Beyond climatic effects, atmospheric aerosol (or colloquially particulate matter (PM) in the scope of air quality) can be a significant air pollutant with adverse health effects. Aerosols have been demonstrated to negatively affect cardiopulmonary health, with fine particulate matter (PM2.5) constituting an elevated risk (Pope and Dockery, 2006). The magnitude of health effects due to atmospheric aerosol is an area of active research and the following properties are typically the foci of studies: size, concentration, and composition (Fuzzi et al., 2015). Indeed, these properties have also shown to disproportionally influence the climatic effects of aerosol described above (Myhre et al., 2013).
Properties critical to studies measuring both the climatic and health impacts of atmospheric aerosol are size, concentration and composition. As such, measurements of the particle size distributions (PSDs) of aerosol are fundamental to understanding atmospheric aerosol. A common trait of PSDs is a multimodal distribution, indicative of a variety of atmospheric processes such as primary emission (e.g., mechanical generation such as dust or sea spray) or secondary formation (e.g., new particle formation from gas-phase). Analysis and parameterization of these modes is of particular interest to infer aerosol formation processes and composition.
Multimodal parameterizations of PSDs are determined using manual, semi-automated, or automated methods. Manual or semi-automated methods require some form of user control and interpretation to provide initial guesses of parameters (Mäkelä et al., 2000). While this manual control can be advantageous for particularly complex PSDs, it becomes a barrier when analyzing long-term multi-year datasets. Automated algorithms are available in both commercial (DistFit™, Chimera Technologies) and non-commercial form (Hussein et al., 2005; Taylor et al., 2014). The algorithm designed by (Hussein et al., 2005) has seen frequent implementation (also known as DO-FIT) in analyzing long-term datasets from ambient research sites (Franco et al., 2022; Herrmann et al., 2015; Ondráček et al., 2009). Among the automated algorithms, simultaneous fitting or solving for all modes is performed and typically limited to three or less modes in the sub-micrometer range (i.e. nucleation, Aitken, and accumulation). Furthermore, a recent evaluation of the DO-FIT model for multiple ambient settings determined high correlation with observed PSDs; however, tended to overestimate total number concentration by about 9 % (Zhu and Wang, 2024). While the methodology for the non-commercial methods is thoroughly described to allow replication, the technical skill necessary to replicate the algorithm may present a barrier for use by the broader aerosol research community.
This article presents an open-source, automated algorithm for parameterizing and fitting particle size distributions (PSDs) based on their theoretical descriptions, with an emphasis on ease of use. In contrast to existing methods where multiple aerosol modes are fitted simultaneously, this algorithm differs by using an iterative subtractive approach for fitting PSDs. To our knowledge, such an automated iterative subtraction technique has not previously been explicitly implemented in the aerosol sciences, although it has proven successful in characterizing geological sediment size distributions (Weltje and Prins, 2007). Another advantage of the technique presented is freedom from predefined mode templates or assumptions of maximum number of modes.
The algorithm was validated and developed with complex laboratory measurements containing six or more modes where size selected ammonium sulfate particles were coated in oxidized biogenic secondary organic matter. To evaluate performance for ambient aerosol distributions, the algorithm was used to characterize ten-years of 10 min averaged particle size distribution measurements from Storm Peak Laboratory (SPL), a remote mountainous research observatory in Steamboat Springs, Colorado (Hallar et al., 2025). Performance metrics for the multimodal classification of this dataset are described. Furthermore, the validity of a tri-modal distribution for SPL was tested, particularly during new particle formation (NPF) events (Gordon et al., 2017) which frequently occur at SPL (Hallar et al., 2011; Hirshorn et al., 2022). Lastly, we compared the multimodal algorithm with the existing DO-FIT model for ambient PSDs. In summary, the presented algorithm offers a robust, automated, and assumption-free approach for resolving complex multimodal aerosol particle size distributions across diverse experimental and observational datasets.
2.1 Laboratory Aerosol Generation and Measurement
Complex aerosol distributions consisting of a mixture of self-nucleated SOA from oxidized gas-phase precursors and monodisperse sulfate salts were used to develop this algorithm. Briefly, ammonium sulfate (AS, 99 %, A4915; Sigma-Aldrich) and bisulfate (ABS, 99.99 %, 455 849; Sigma-Aldrich) were atomized (Model 3076; TSI Inc., Shoreview, MN 3077) at a flow rate of 0.9 L min−1 and dried using a Nafion™ dryer (Model MD-700-6S-3, PermaPure, Lakewood, NJ). Dried particles with an electrical mobility diameter of 300 nm were selected using a differential mobility analyzer (DMA, Model 3081A; TSI Inc., Shoreview, MN) with a 10:1 sheath-to-sample flow ratio. Particles were then sampled into a potential aerosol mass oxidation flow reactor (PAM-OFR, Aerodyne Research Inc., Billerica, MA) where gas-phase limonene (97 %, 183 164; Sigma-Aldrich) or α-pinene (99 %, 274 399; Sigma-Aldrich) was oxidized by producing both organic coatings on the sulfate particles and self-nucleated SOA. Following the PAM-OFR, O3 was removed by an ozone denuder and aerosol were further dried by a desiccant dryer and Nafion™ dryer in series (Model MD-700-12S-3, PermaPure, Lakewood, NJ).
Particle size distributions (PSDs) were measured using a scanning electrical mobility sizer (SEMS, Model 2002; Brechtel Manufacturing Inc., Hayward, CA) also operating at a minimum 10 : 1 sheath-to-sample flow ratio. Sampling intervals were varied depending on aerosol generation stage to balance resolution and temporal variations; self-nucleation testing of SOA using a PAM oxidation flow reactor (30 s), monodisperse sulfate seed sampling (60 s), or coating evaluation (120 s).
For each experiment, 362 scans were obtained on average with coating evaluation scans representing a majority. A total of 16 554 SEMS scans were obtained and used to develop the curve fitting algorithm (Sect. 2.4–2.7).
2.2 Ambient Aerosol Measurement
Ambient particle size distribution measurements at SPL from 14 October 2010–24 October 2020 were used in evaluating the algorithm. PSD measurements were obtained using a scanning mobility particle sizer (SMPS, Model 3936; TSI Inc., Shoreview, MN 3077) and condensation particle counter (CPC, Model 3010; TSI Inc., Shoreview, MN 3077) at a time resolution of 5 min. To mitigate instrument and ambient noise, the data was averaged to 10 min intervals for algorithm development and evaluation on ambient data. For comparison purposes with the DO-FIT model, the high-resolution data (∼100 bins) was reduced to 32 bins and kept at a 5 min interval. Data was quality controlled to the standards set for level 1 data of the European Monitoring and Evaluation Programme (EBAS) database including multiple charge and diffusion corrections. Both visual and statistical NPF classifications for this time period were retrieved from a previous study (Hirshorn et al., 2022). Detailed specifications of the aerosol instrumentation, inlet, and site details of SPL are beyond the scope of this paper and are described elsewhere (Hallar et al., 2011, 2025; Petersen et al., 2019).
2.3 Theory
Atmospheric aerosol size distributions are commonly described as the sum of multiple lognormal PSDs. Assuming each mode is lognormally distributed and the PSD can be fully described by the summation of j lognormal distributions, a continuous multimodal PSD (MPSD) can be fully defined by Eq. (1) (Seinfeld and Pandis, 2016)
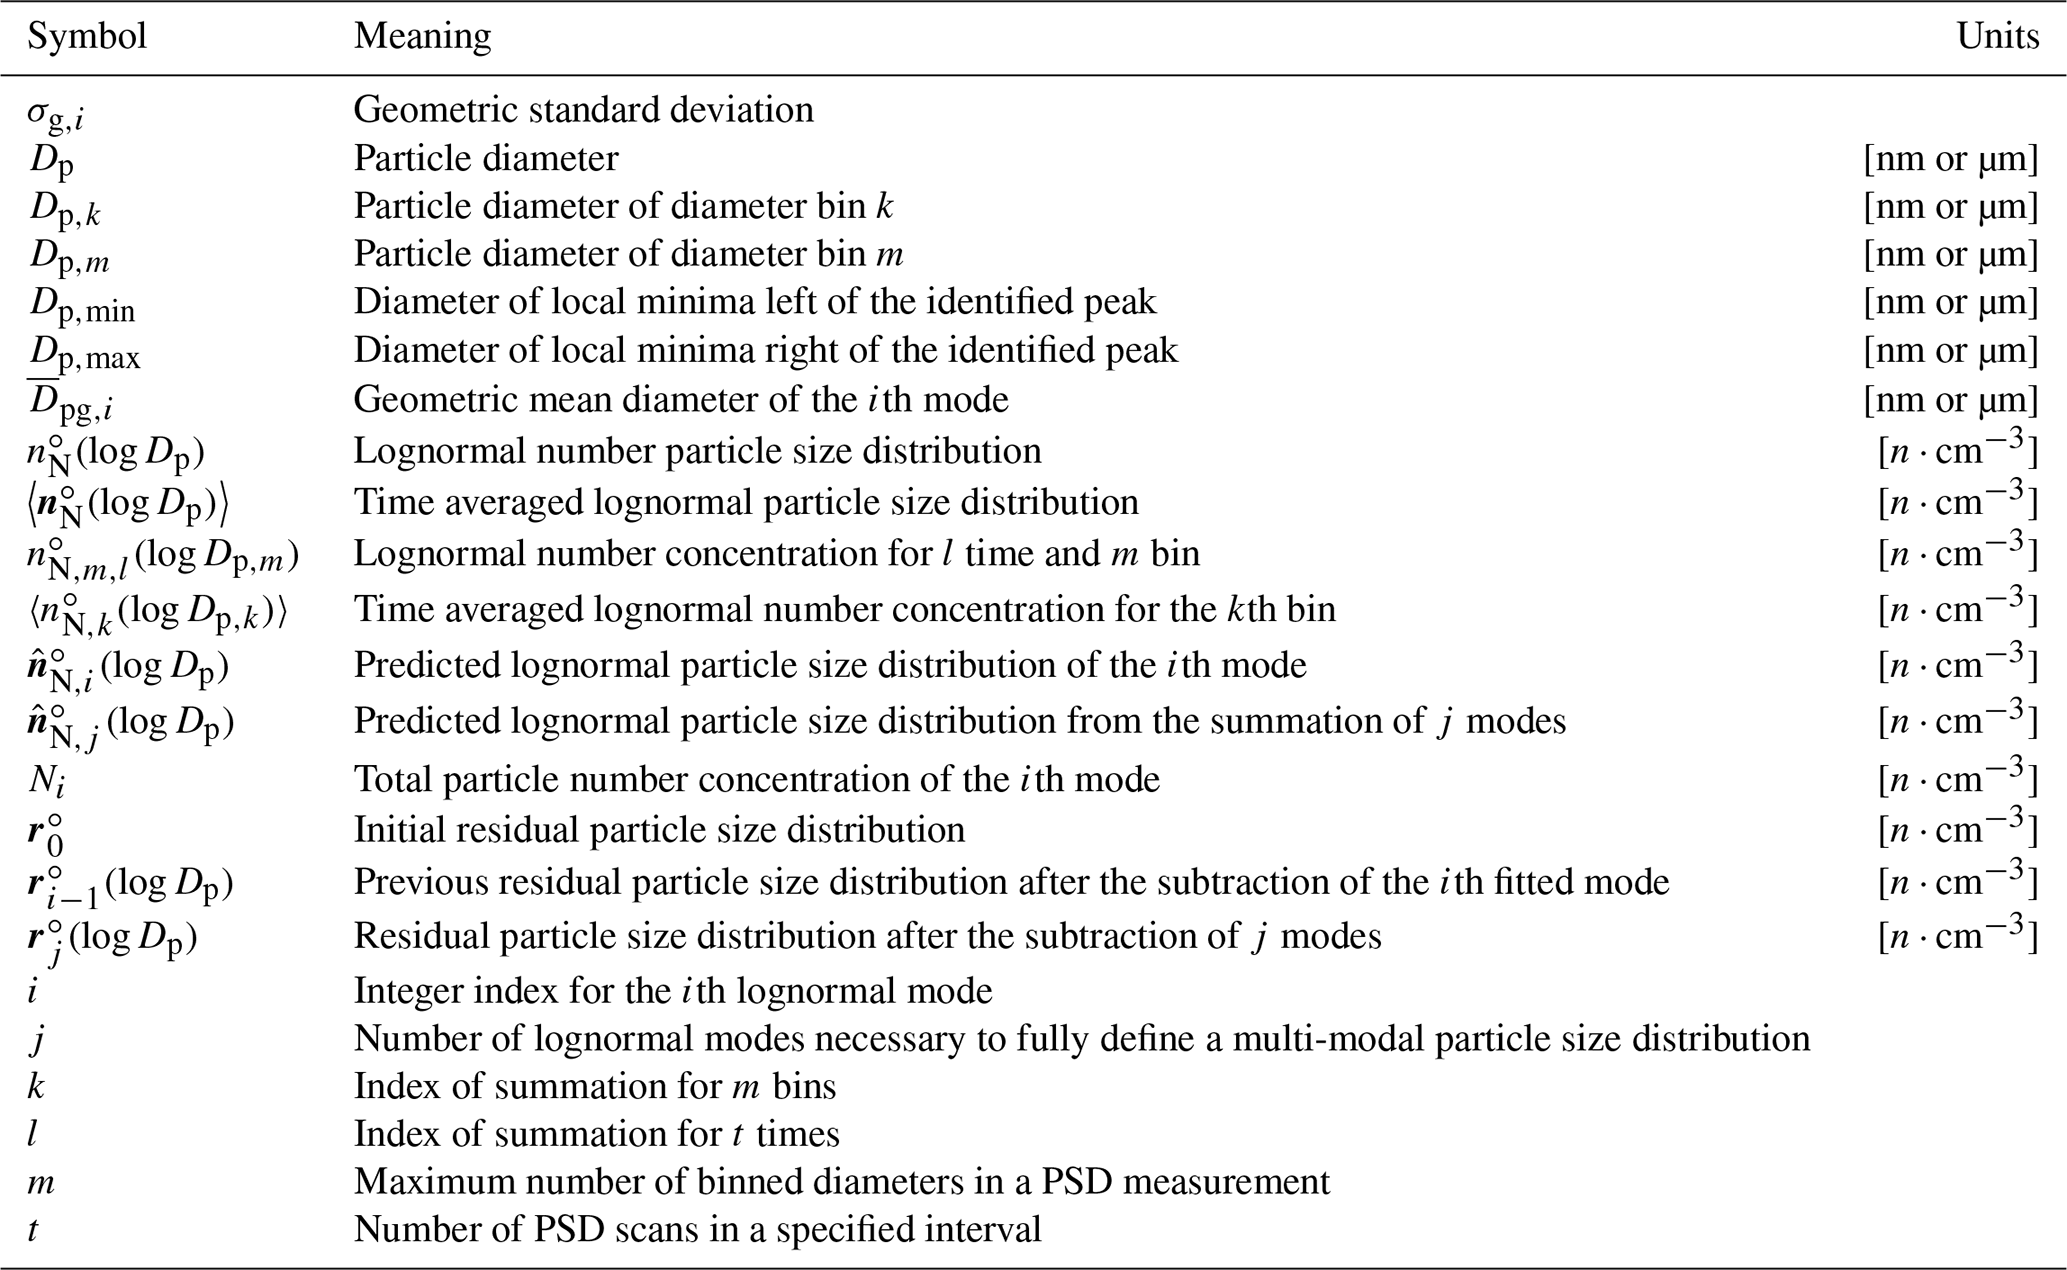
where Ni is the total number concentration, σg,i is the geometric standard deviation, is the geometric mean diameter of the ith mode. Here, log is shorthand for the base 10 logarithm. A full description of the derivation of this equation and its parameters can be found elsewhere (Hinds and Zhu, 2022; Seinfeld and Pandis, 2016). Notation used throughout this article will be consistent with the notation used by Seinfeld and Pandis, 2016, with noted minor modifications made for indices such as j instead of n to represent each lognormal distribution (see Table 3).
2.4 Pre-Processing
Depending on the aerosol process of interest, the desired temporal resolution may differ. For example, a lower temporal resolution (e.g. 30 min averaging) is sufficient to characterize aerosol produced by stable laboratory generation. In this application, time averaging the PSD is beneficial in reducing variance caused by instrument noise. Conversely, the analysis of new particle formation requires a higher resolution to observe processes that can occur at or below an instrument measurement frequency (e.g. 2 min SMPS scan) and no time averaging is more appropriate. To accommodate a range of desired temporal resolutions, interval averaging is performed in minutes. Given a time resolved lognormal PSD with m binned diameter ranges () and t samples, the time averaged lognormal PSD, (Eq. 2), becomes a 1×m matrix
where denotes the log-normalized number concentration for l time and m bin. Similarly, we obtain the time averaged differential particle number concentration 〈nN(Dp)dDp〉 by first multiplying by dlog Dp and similarly applying Eq. (2).
2.5 Peak Parameterization
Multi-modal peak identification was performed using the findpeaks function from the Practical Numerical Mathematical Functions (pracma) R package (Borchers, 2011). For mode identification, the recommended minimum distance between peaks must be equal to or greater than 5 bins and are sorted by peak magnitude (local maximum number concentration) for each retrieval. To account for noise, findpeaks was applied to a smoothed cubic spline of the residuals for more robust peak identification. For each mode, lower Dp,min and upper Dp,max bounds of the identified peak mode diameter Dp,i are retrieved. For the purposes of initializing the curve fitting algorithm (see Sect. 2.6) it was assumed that . The mode total number concentration Ni from the lower and upper diameters was calculated by the summation in Eq. (3)
For instances in which the predicted total concentration of an adjacent mode was overestimated, Ni may become negative at which case the subsequent peak is selected for fitting until the maximum number of iterations is reached. The mode specific geometric standard deviations σg,i used to initialize fitting were determined by Eq. (4)
Similarly to the procedure used in calculating Ni, controls to prevent negative values from appearing within Eq. (4) were implemented where negative concentrations of are temporarily set to 0. If calculations of σg,i failed, the subsequent peak is tried for fitting until the maximum number of iterations is reached.
2.6 Curve Fitting
Using the parameters described above, each mode was fitted to a lognormal size distribution (Eq. 5) using the nlsLM function, a Levenberg–Marquardt nonlinear least-squares algorithm (LM-NLS) from the (minpack.lm) R package (Elzhov et al., 2022). A thorough description of LM-NLS is provided by (Moré, 1978). For completeness, the functional notation of a predicted lognormal PSD using LM-NLS is given by Eq. (5). Discretized values of Dp are modifiable depending on the size range of interest but must have the same resolution of the reported resolution in the data file (typically 10−2 nm) to match actual and predicted binned concentrations. The LM-NLS algorithm outperformed standard non-linear least squares functions (e.g., Gauss-Newton Algorithm or GNA) for this application and avoided minimization problems arising from poor starting conditions, something commonly encountered using generic GNA-NLS methods. Poor mode fits are automatically rejected if any of the lognormal parameters exceed or meet the significance threshold p=0.05.
Each fitted mode is then iteratively subtracted from the previous residual . For the i=1 iteration, we define the initial residual distribution as . The residual PSD after the assignment of j modes is then defined by Eq. (6)
This is performed until any of the following conditions are met: fraction of variance unexplained (FVU) of is less than or equal to the FVU tolerance (Eq. 7), the maximum number of iterations has been reached, or the maximum number of modes allowed is reached. The second condition is utilized to prevent an “infinite loop” from occurring while the third is used to prevent overfitting. In cases where the estimated peak is much higher than the identified peak (1.5 times larger), the residuals are set to 0 to identify the next peak. While this will bias the FVU within the iterative loop, it is recalculated when evaluating the final model. Note the FVU can equivalently be defined as the square of the correlation coefficient of measured to predicted particle concentration subtracted from 1.
Upon completion, the theoretical continuous MPSD (Eq. 1) can be approximated as the following summation of j fitted modes.
2.7 Evaluation
Determining the accuracy or “goodness-of-fit” of the sum of j modes predicted by the LM-NLS algorithm is based on residual error analysis. The statistical metrics used to evaluate the model are the min-max normalized RMSE (NRMSE, see Eq. 9) and FVU of the fitted MPSD and actual data (Eq. 7), where k is an index of summation for matched m binned concentrations
For size-selected measurements, normalizing to the concentration range reduces the bias high concentration peaks (particularly relevant for monodisperse particle selection or nucleation particles) contribute to the RMSE. A successful MPSD fitting is considered when NRMSE<0.05 (5 %) and FVU<0.05 (5 %) by default, but are modifiable thresholds depending on the desired accuracy for a specific application. For the ambient SPL measurements presented, FVU and NRMSE thresholds were changed from the default 5 %–10 % to account for higher ambient noise. Examples and description of algorithm outputs are included in the Supplement.
3.1 Laboratory Measurements
Measurements of the generated PSDs predictably exhibited a multimodal structure due to multiply charged particles, singly charged aggregates (i.e. doublets), and/or self-nucleation of SOA (see Figs. 1 and 2). Both multiply charged and singly charged aggregates were identified as expected as DMA-selected particles were passed through a charge neutralizer before entering the SEMS. The most prominent mode was the size selected inorganic sulfate mode with a mean particle diameter (Dp) of 300 nm (∼310 nm when coated in an oxidized organic layer). A nucleation and Aitken mode were also frequently observed corresponding to nucleation and subsequent agglomeration. For a modified experiment where inorganic sulfate particles with a mean particle diameter (Dp) of 150 nm were selected, singly charged aggregates up to singly-charged quadruplets were effectively characterized along with doubly and triply charged singlets (see Fig. 1).
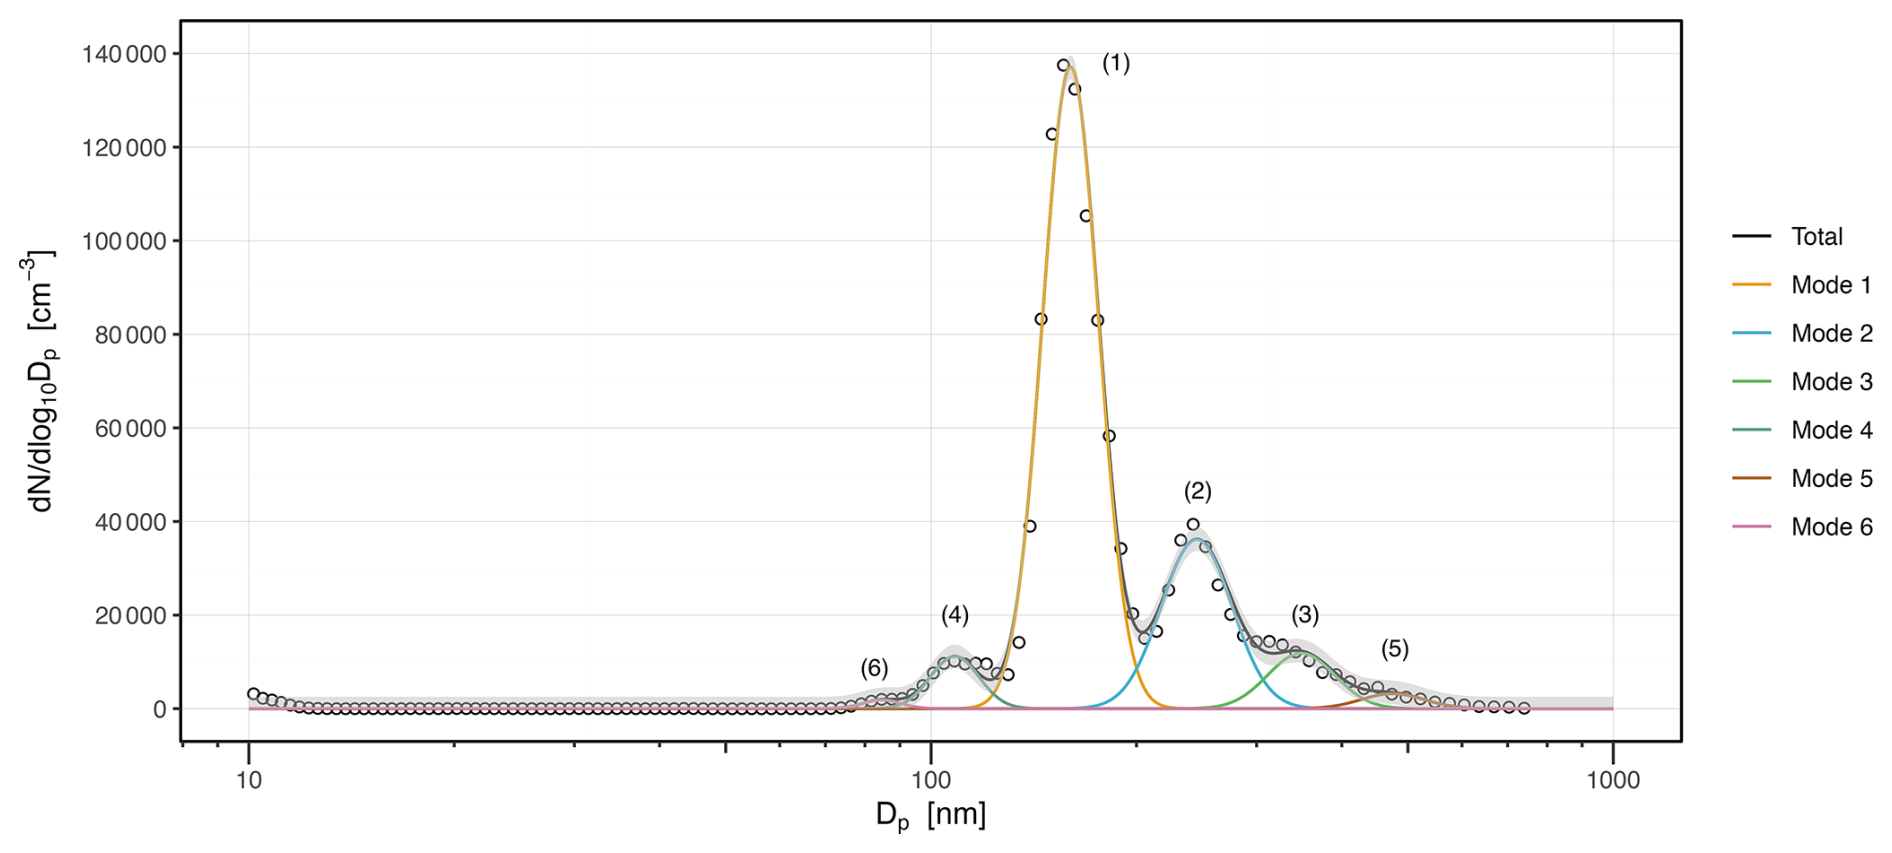
Figure 1Example of a successful multimodal curve fitting for a SEMS measurement of DMA-selected AS (Dp=150 nm) particles. Lognormal parameters for identified modes are listed in Table 1. Shaded gray region represents a NRMSE of 0.02 with a corresponding total particle uncertainty (RMSE) of 2537 [].
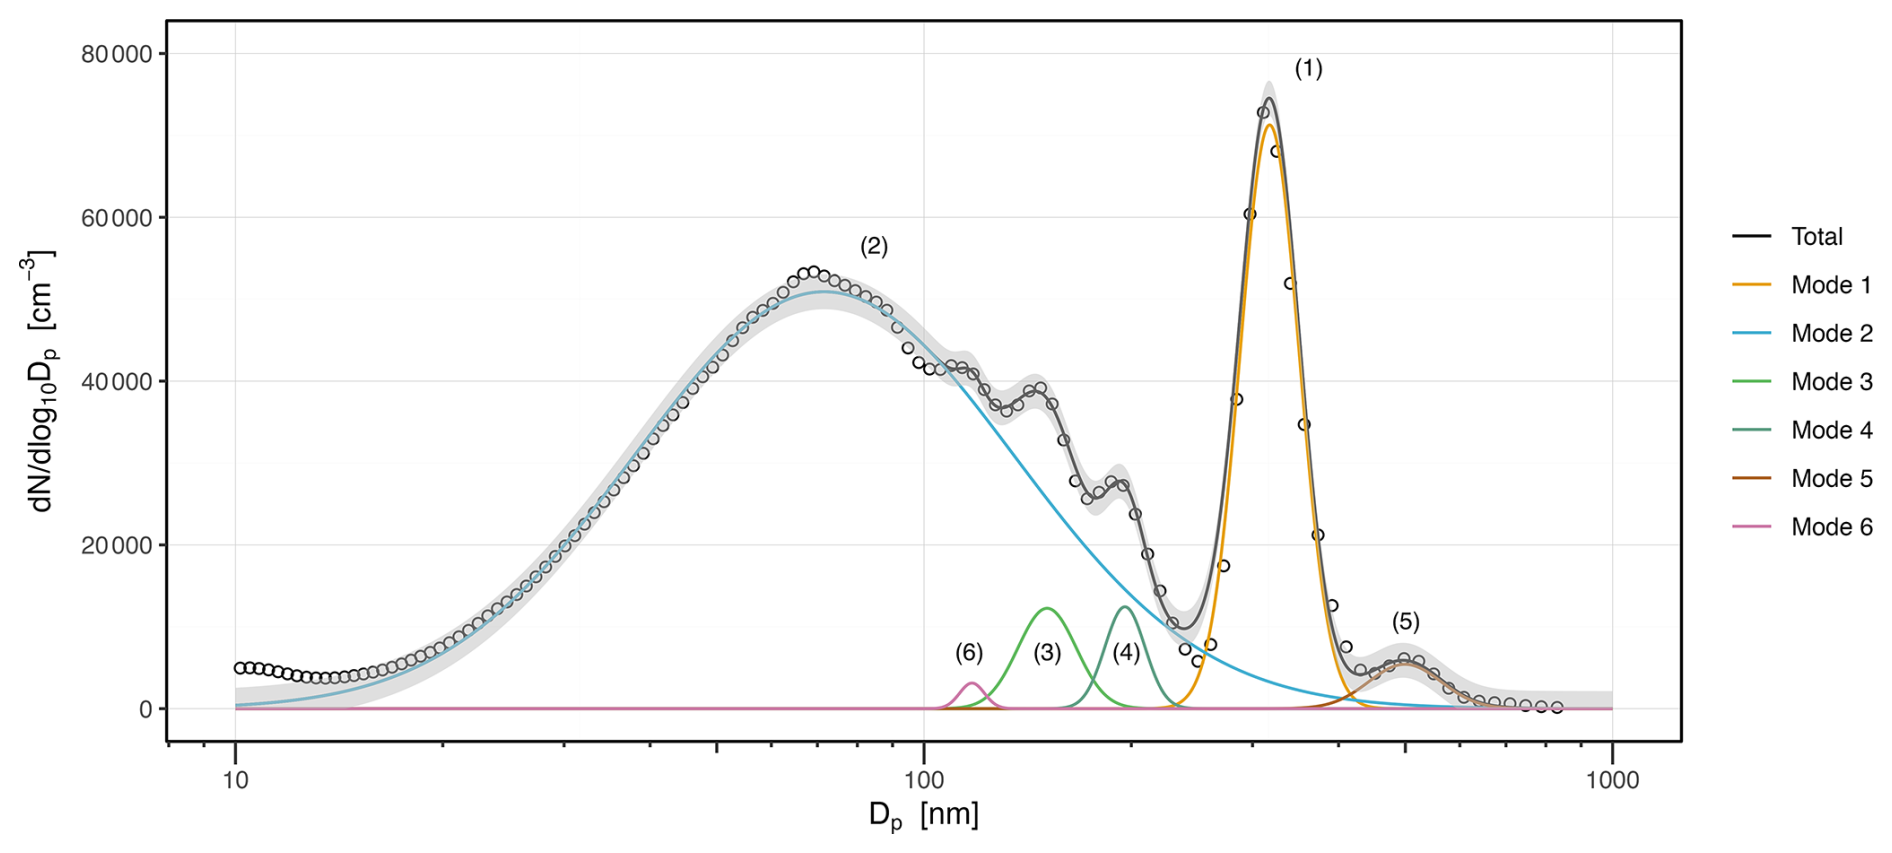
Figure 2Example of a successful curve fitting of a MPSD for size selected AS (Dp=300 nm) and α-pinene derived SOA aerosol. Lognormal parameters for identified modes are listed in Table 1. Shaded gray region represents a NRMSE of 0.03 with a corresponding total particle uncertainty (RMSE) of 2132 [].
3.2 Ambient Measurements – SPL
The algorithm successfully characterized 59.4 % of the 208 060 10 min averaged scans at the accuracy thresholds of 0.1 (10 %) FVU and NRMSE. Under higher particle concentration conditions (e.g., ), the percentage of successful fittings increases to 68.8 %. For these accuracy thresholds, the mean measured to predicted particle ratio was 0.991 and overall underpredicted concentrations by 0.899 %. This corresponded to a coefficient of determination (R2) of 0.999 when a simple linear regression was applied. The algorithm's ability to estimate total number concentration on a scan-by-scan basis is illustrated in Fig. 3. When all fittings are considered, including those below the thresholds defined above, the coefficient of determination (R2) of measured to predicted particle concentrations is 0.847.
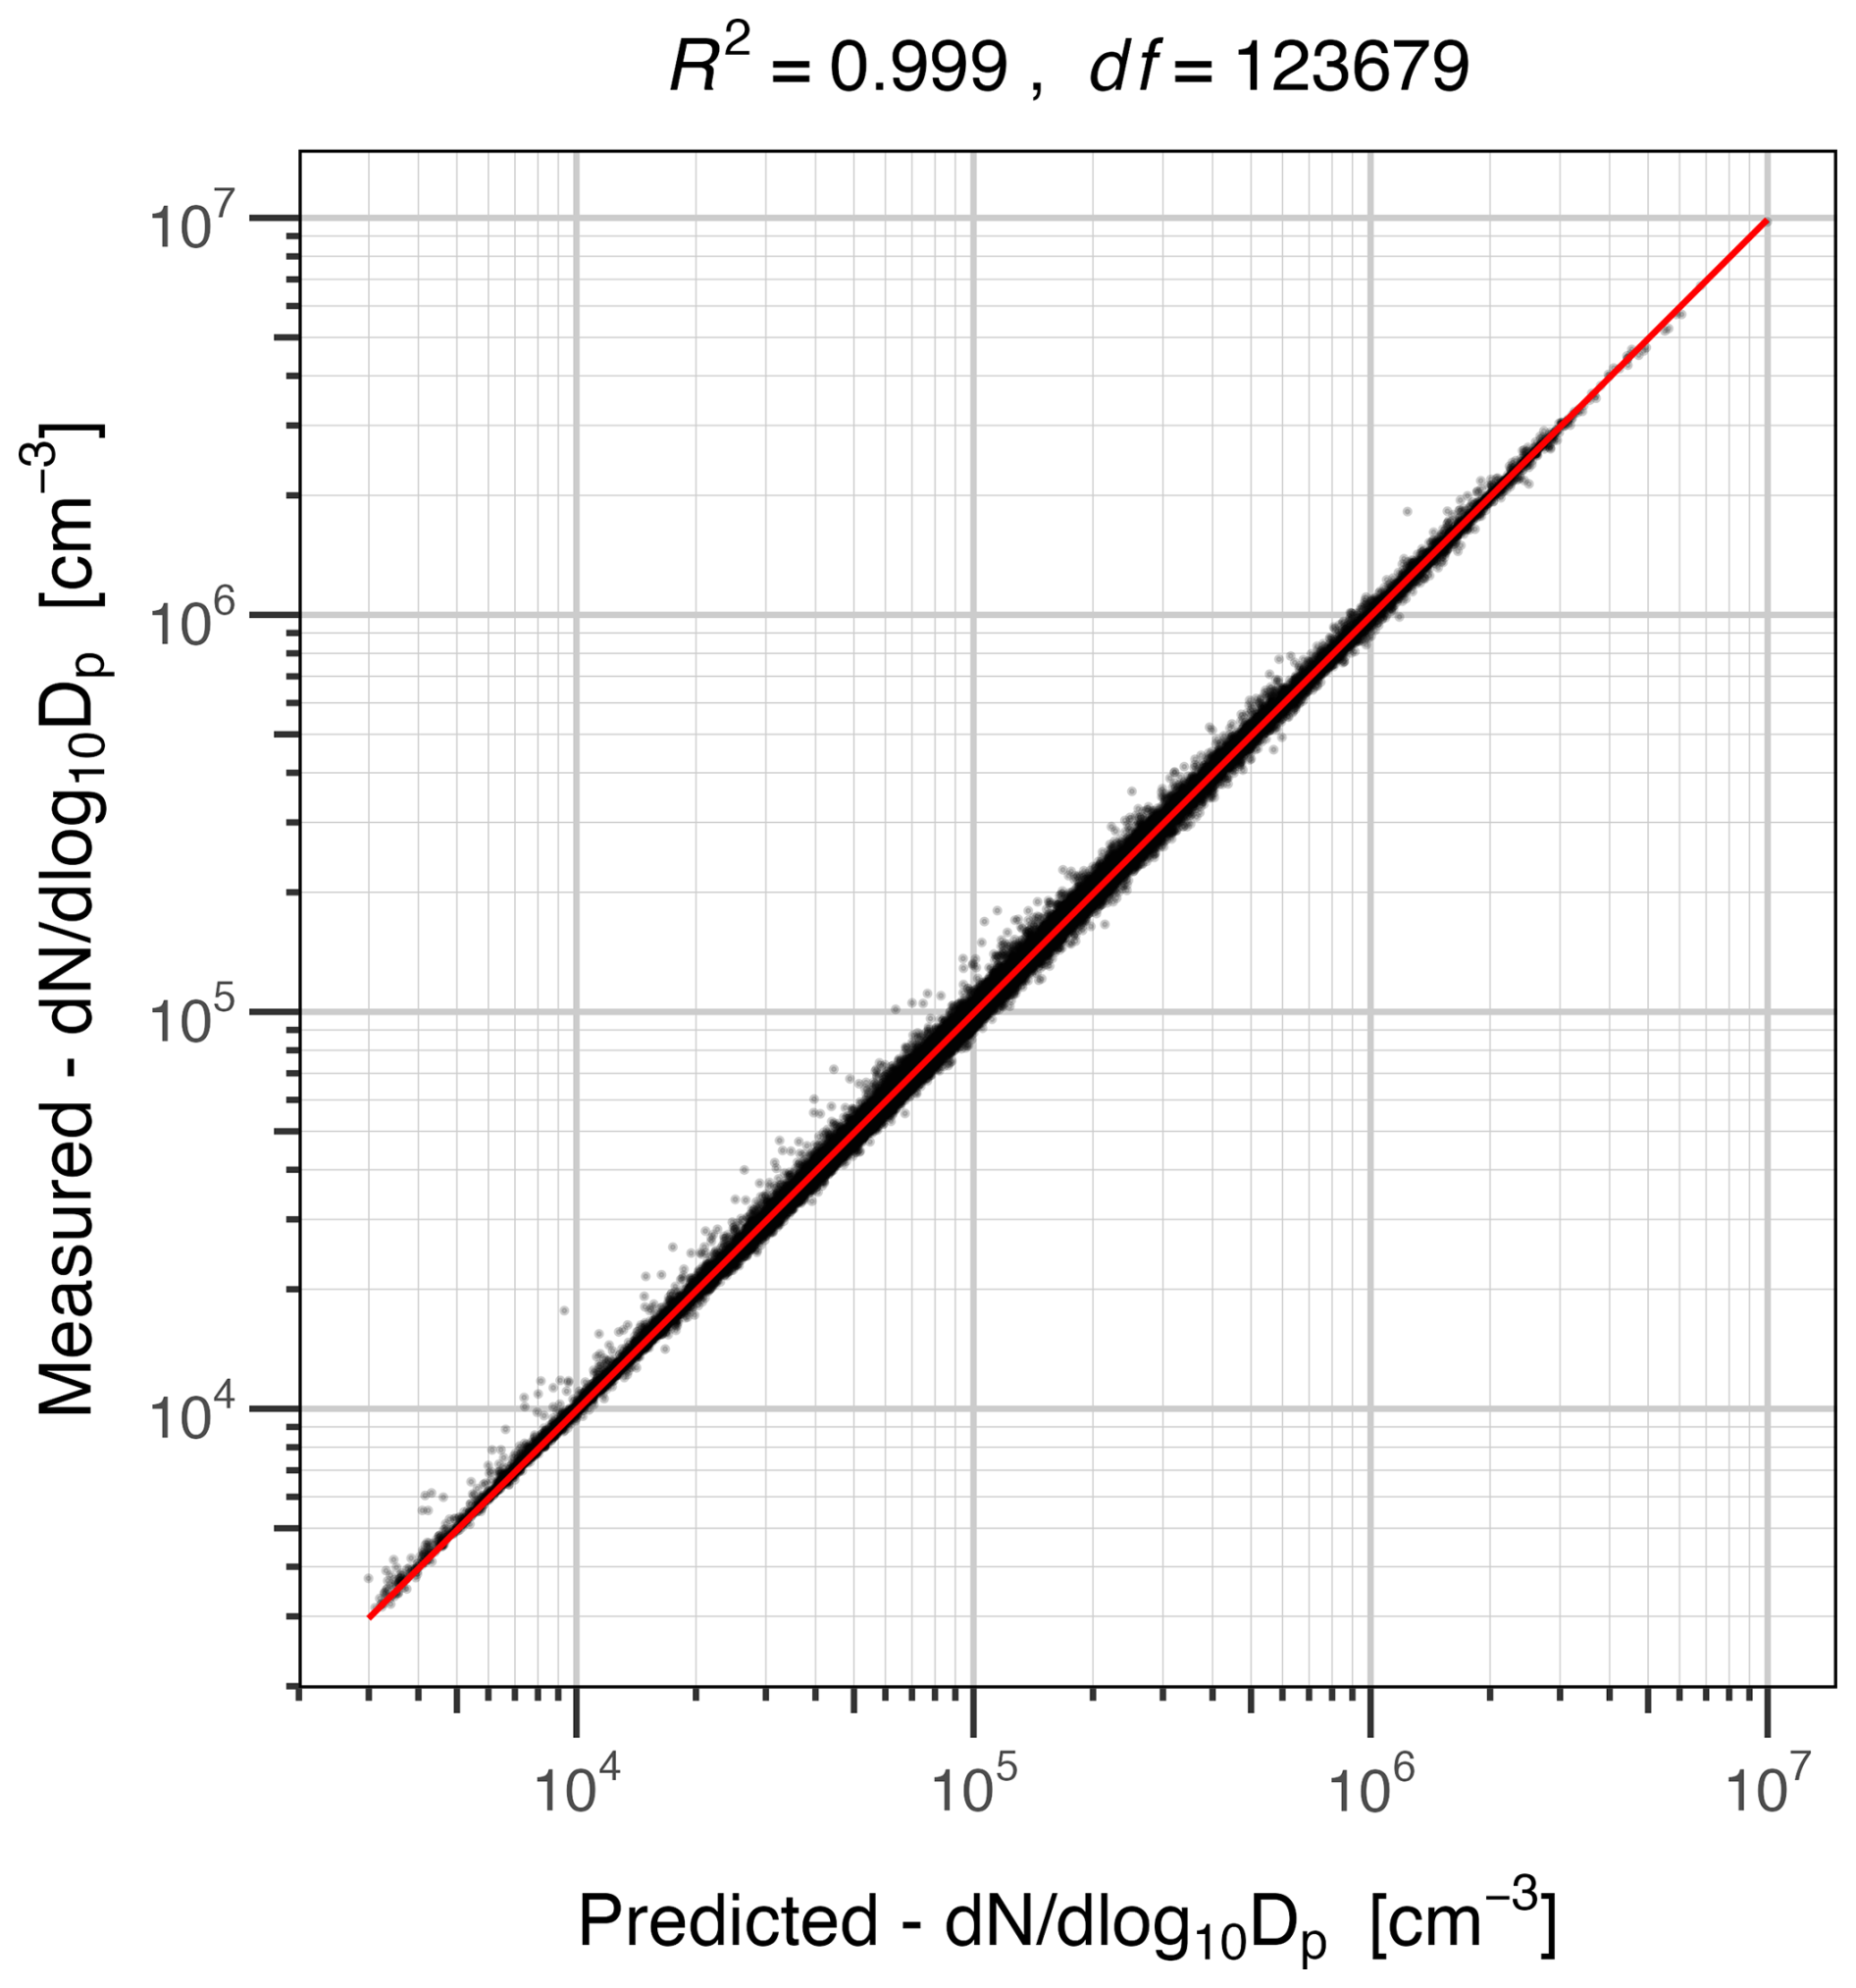
Figure 3Measured concentration vs. predicted concentration dN/dlogDp for fittings above the accuracy thresholds of 0.1 (10 %) FVU and NRMSE. Black dots represent prediction ratios for individual 10 min averaged scans at SPL from 14 January 2010–24 October 2020. The red line is the simple linear regression of the predicted and measured particle concentration with coefficient of determination and degrees of freedom (df) listed in the title.
Both the mean and median number of modes necessary to explain 90 % of the variance for all SPL measurements was 4±2 modes, where the error is standard deviations rounded to the nearest mode. Examples of measurement fittings where more than 4 modes were necessary for both low and high particle concentrations are given by Figs. 4 and 5 respectively. In the case of low particle concentrations, five modes were necessary to explain 92 % of particle concentrations. Six modes were needed for the high concentration case (e.g., visually identified NPF event with strong nucleation mode) where 99.57 % of all particles were predicted. Extending beyond these two examples, 37.8 % of all successful fittings required 5 or more modes.
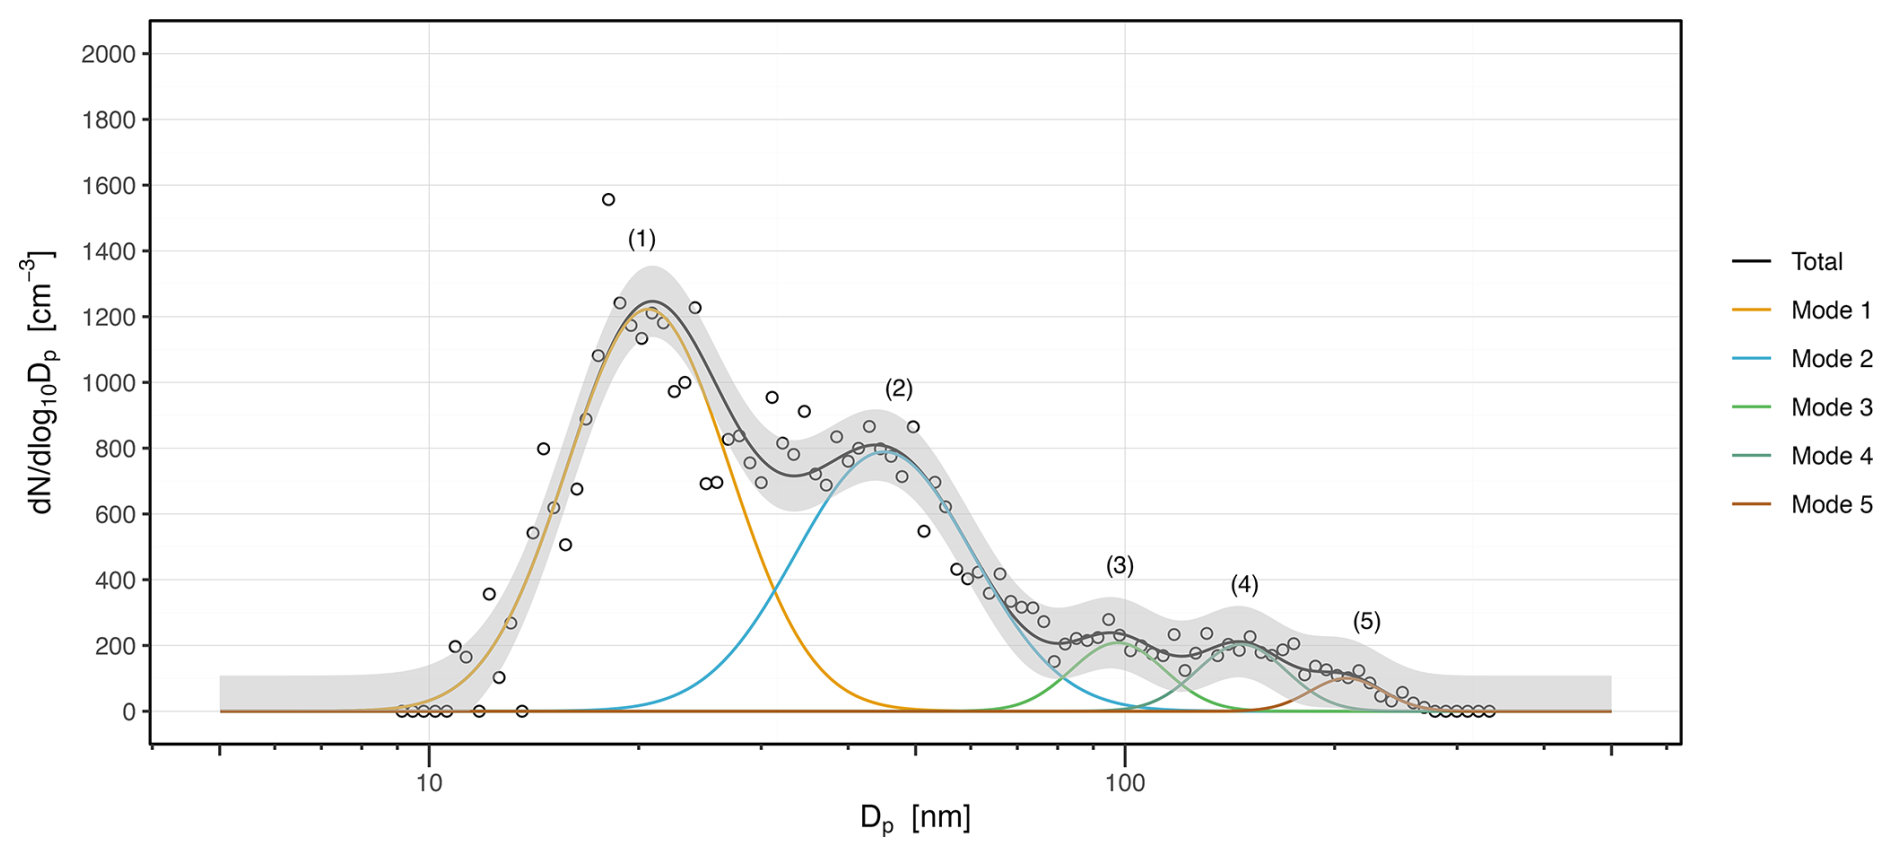
Figure 4Example of a successful curve fitting of a MPSD at SPL (22 January 2022 11:18:40 UTC) for non-NPF conditions. Lognormal parameters for identified modes are listed in Table 1. Shaded gray region represents a NRMSE of 0.07 with a corresponding total particle uncertainty (RMSE) of 108 [].
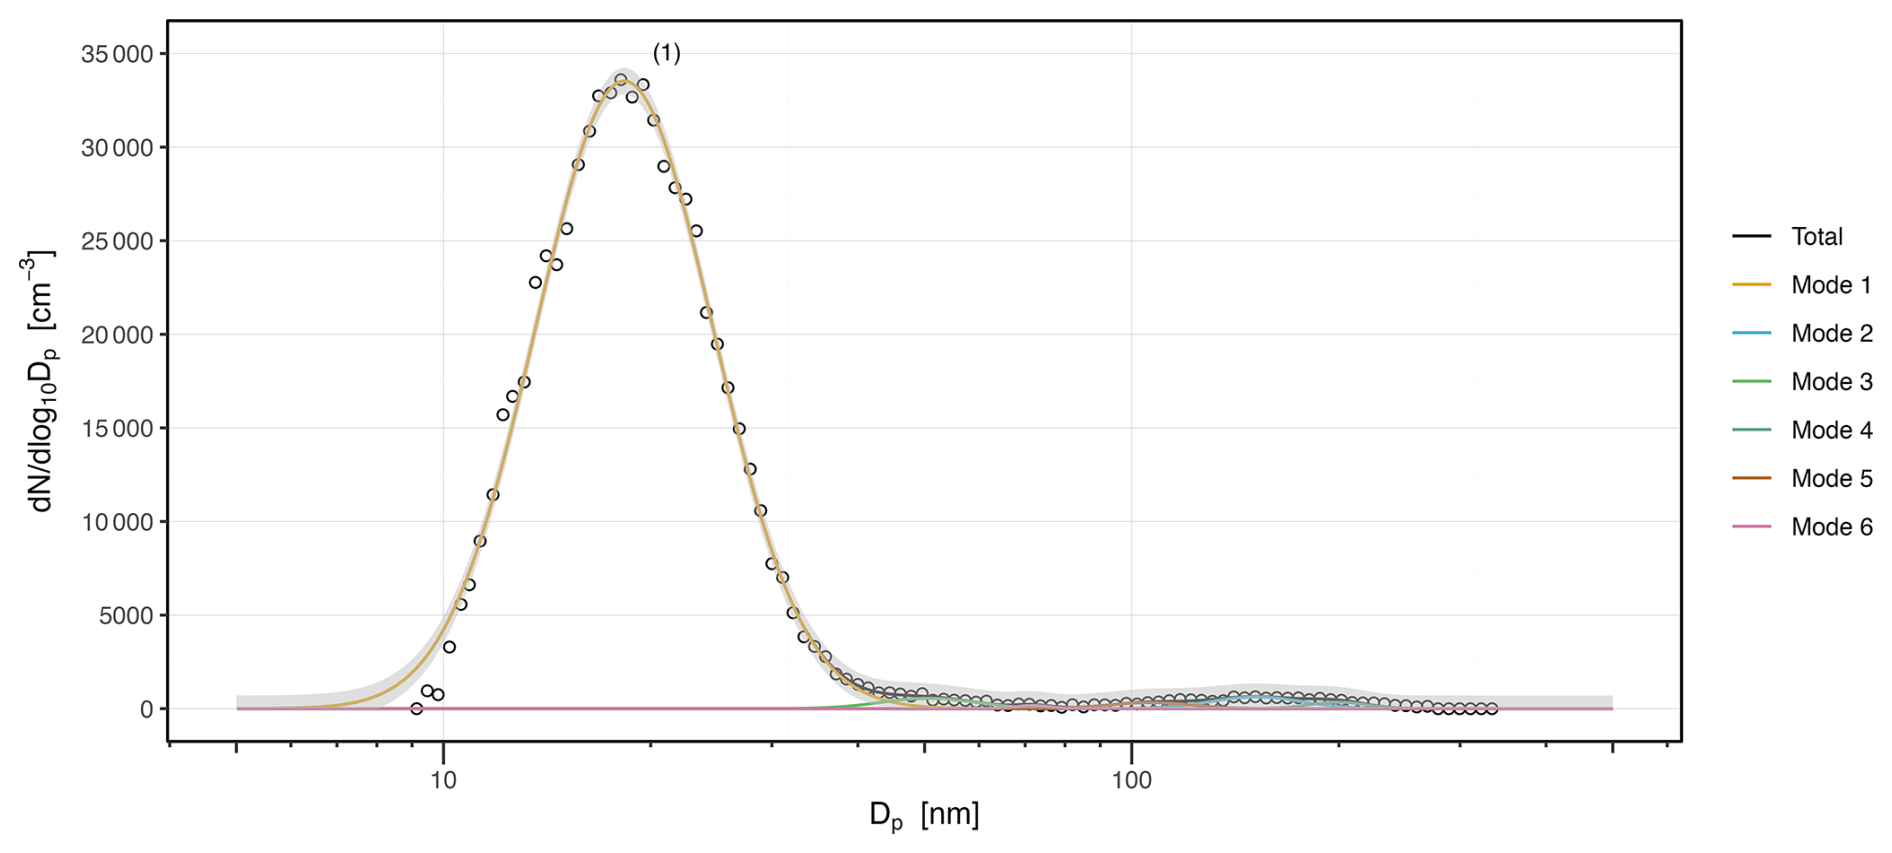
Figure 5Example of a successful curve fitting of a MPSD at SPL (30 April 2022 18:08:40 UTC) for the beginning of a NPF event. Lognormal parameters for identified modes are listed in Table 1 and modes 2–6 are not labeled due to low concentration compared to mode 1. Shaded gray region represents a NRMSE of 0.02 with a corresponding total particle uncertainty (RMSE) of 704 [].
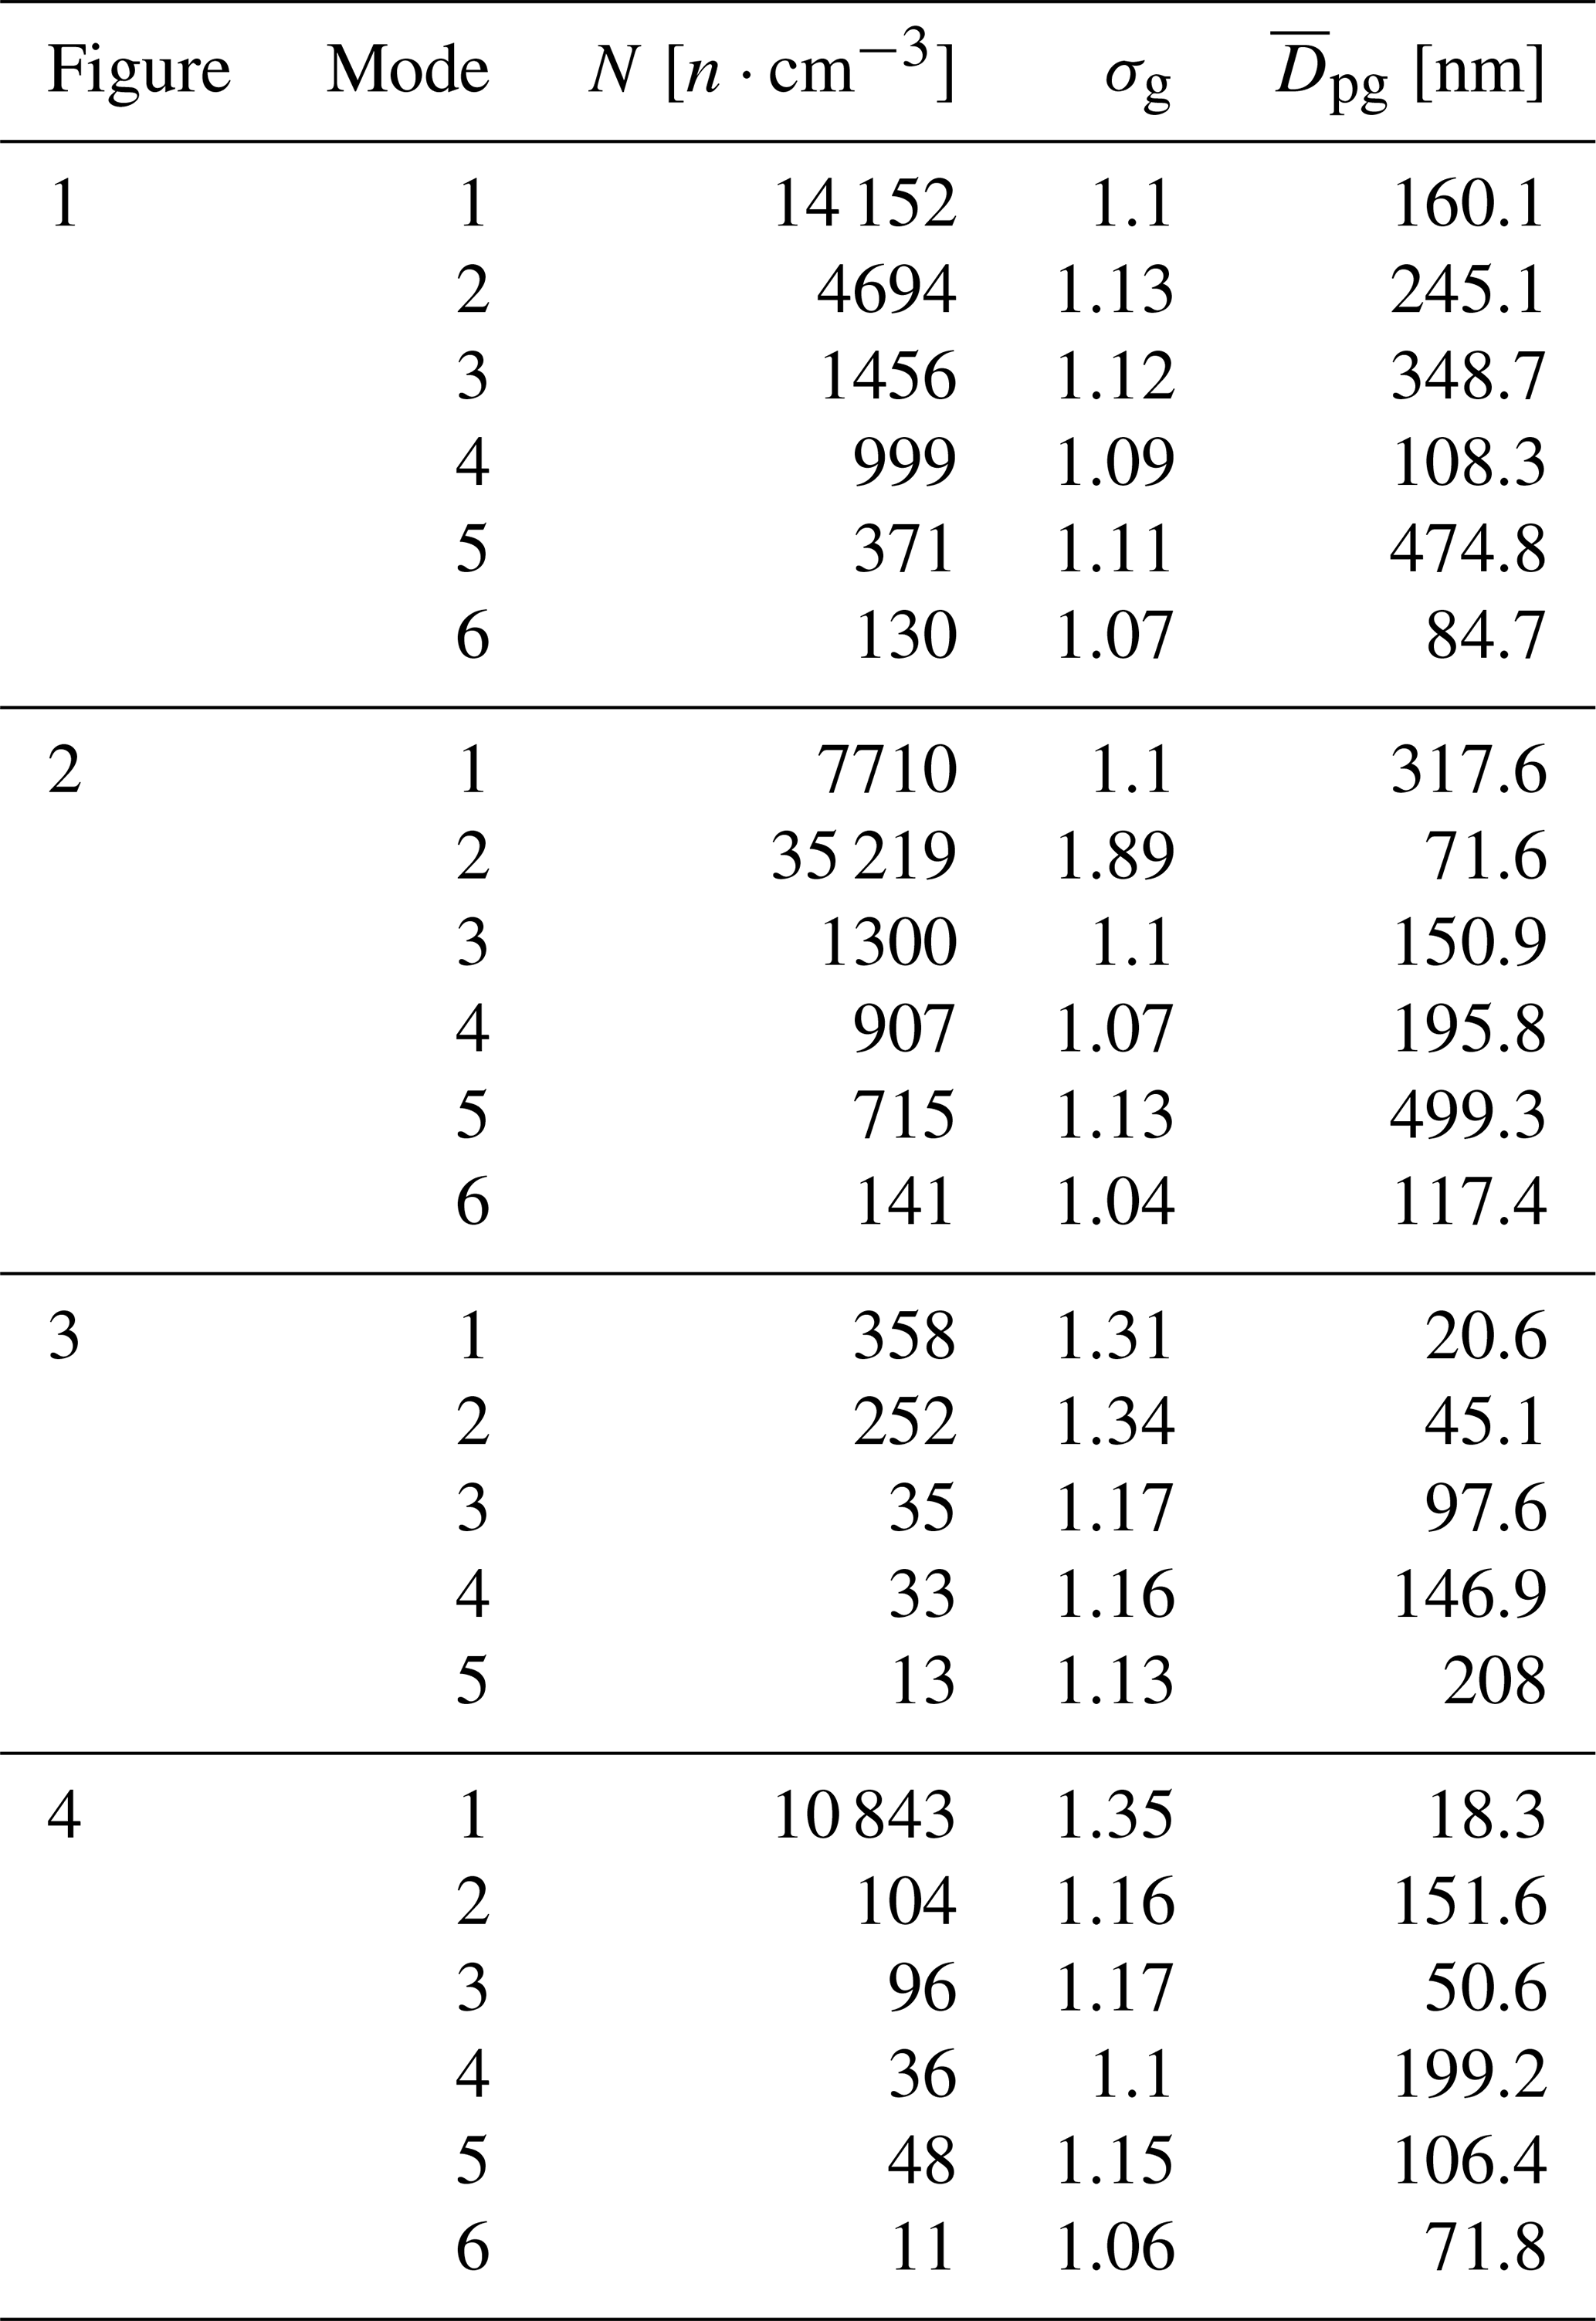
Table 1A summary of the lognormal parameters specific to the modes in Figs. 1–4.
3.3 Evaluation of the Tri-Modal Assumption for NPF at SPL
For the time period spanning from 15 January 2010–22 October 2020, NPF events were visually classified on 372 d according to the methods described in (Hirshorn et al., 2022). The remainder were classed as non-NPF and consisted of either undefined or non-event days. Multimodal analysis was performed using the algorithm presented with fittings deemed successful if they met the following accuracy conditions: 90 % or more measured particles predicted and a NRMSE of 0.10 or lower attained. The relative frequency of modes necessary to fit each 10 min scan for both NPF and non-NPF event days are summarized in Fig. 6. For visually classified NPF days, 4+ modes are required to explain 55.7 % of scans. This requirement of higher order modes becomes more pronounced if using the statistical Gaussian NPF classification detailed by (Hirshorn et al., 2022). This method provides specific start and end times where active nucleation and growth are calculated. For this subset of data, both the mean and median number of modes necessary to explain 90 % of particle concentration increases to 5±2 modes where the error is standard deviations rounded to the nearest mode. Furthermore, 73.2 % of scans associated to statistically identified NPF required four or more modes. For all non-NPF PSDs, only 27.7 % of fits were tri-modal (Fig. 6). Regardless of the NPF classification method utilized, a tri-modal assumption fails to explain more than half of NPF events at SPL.
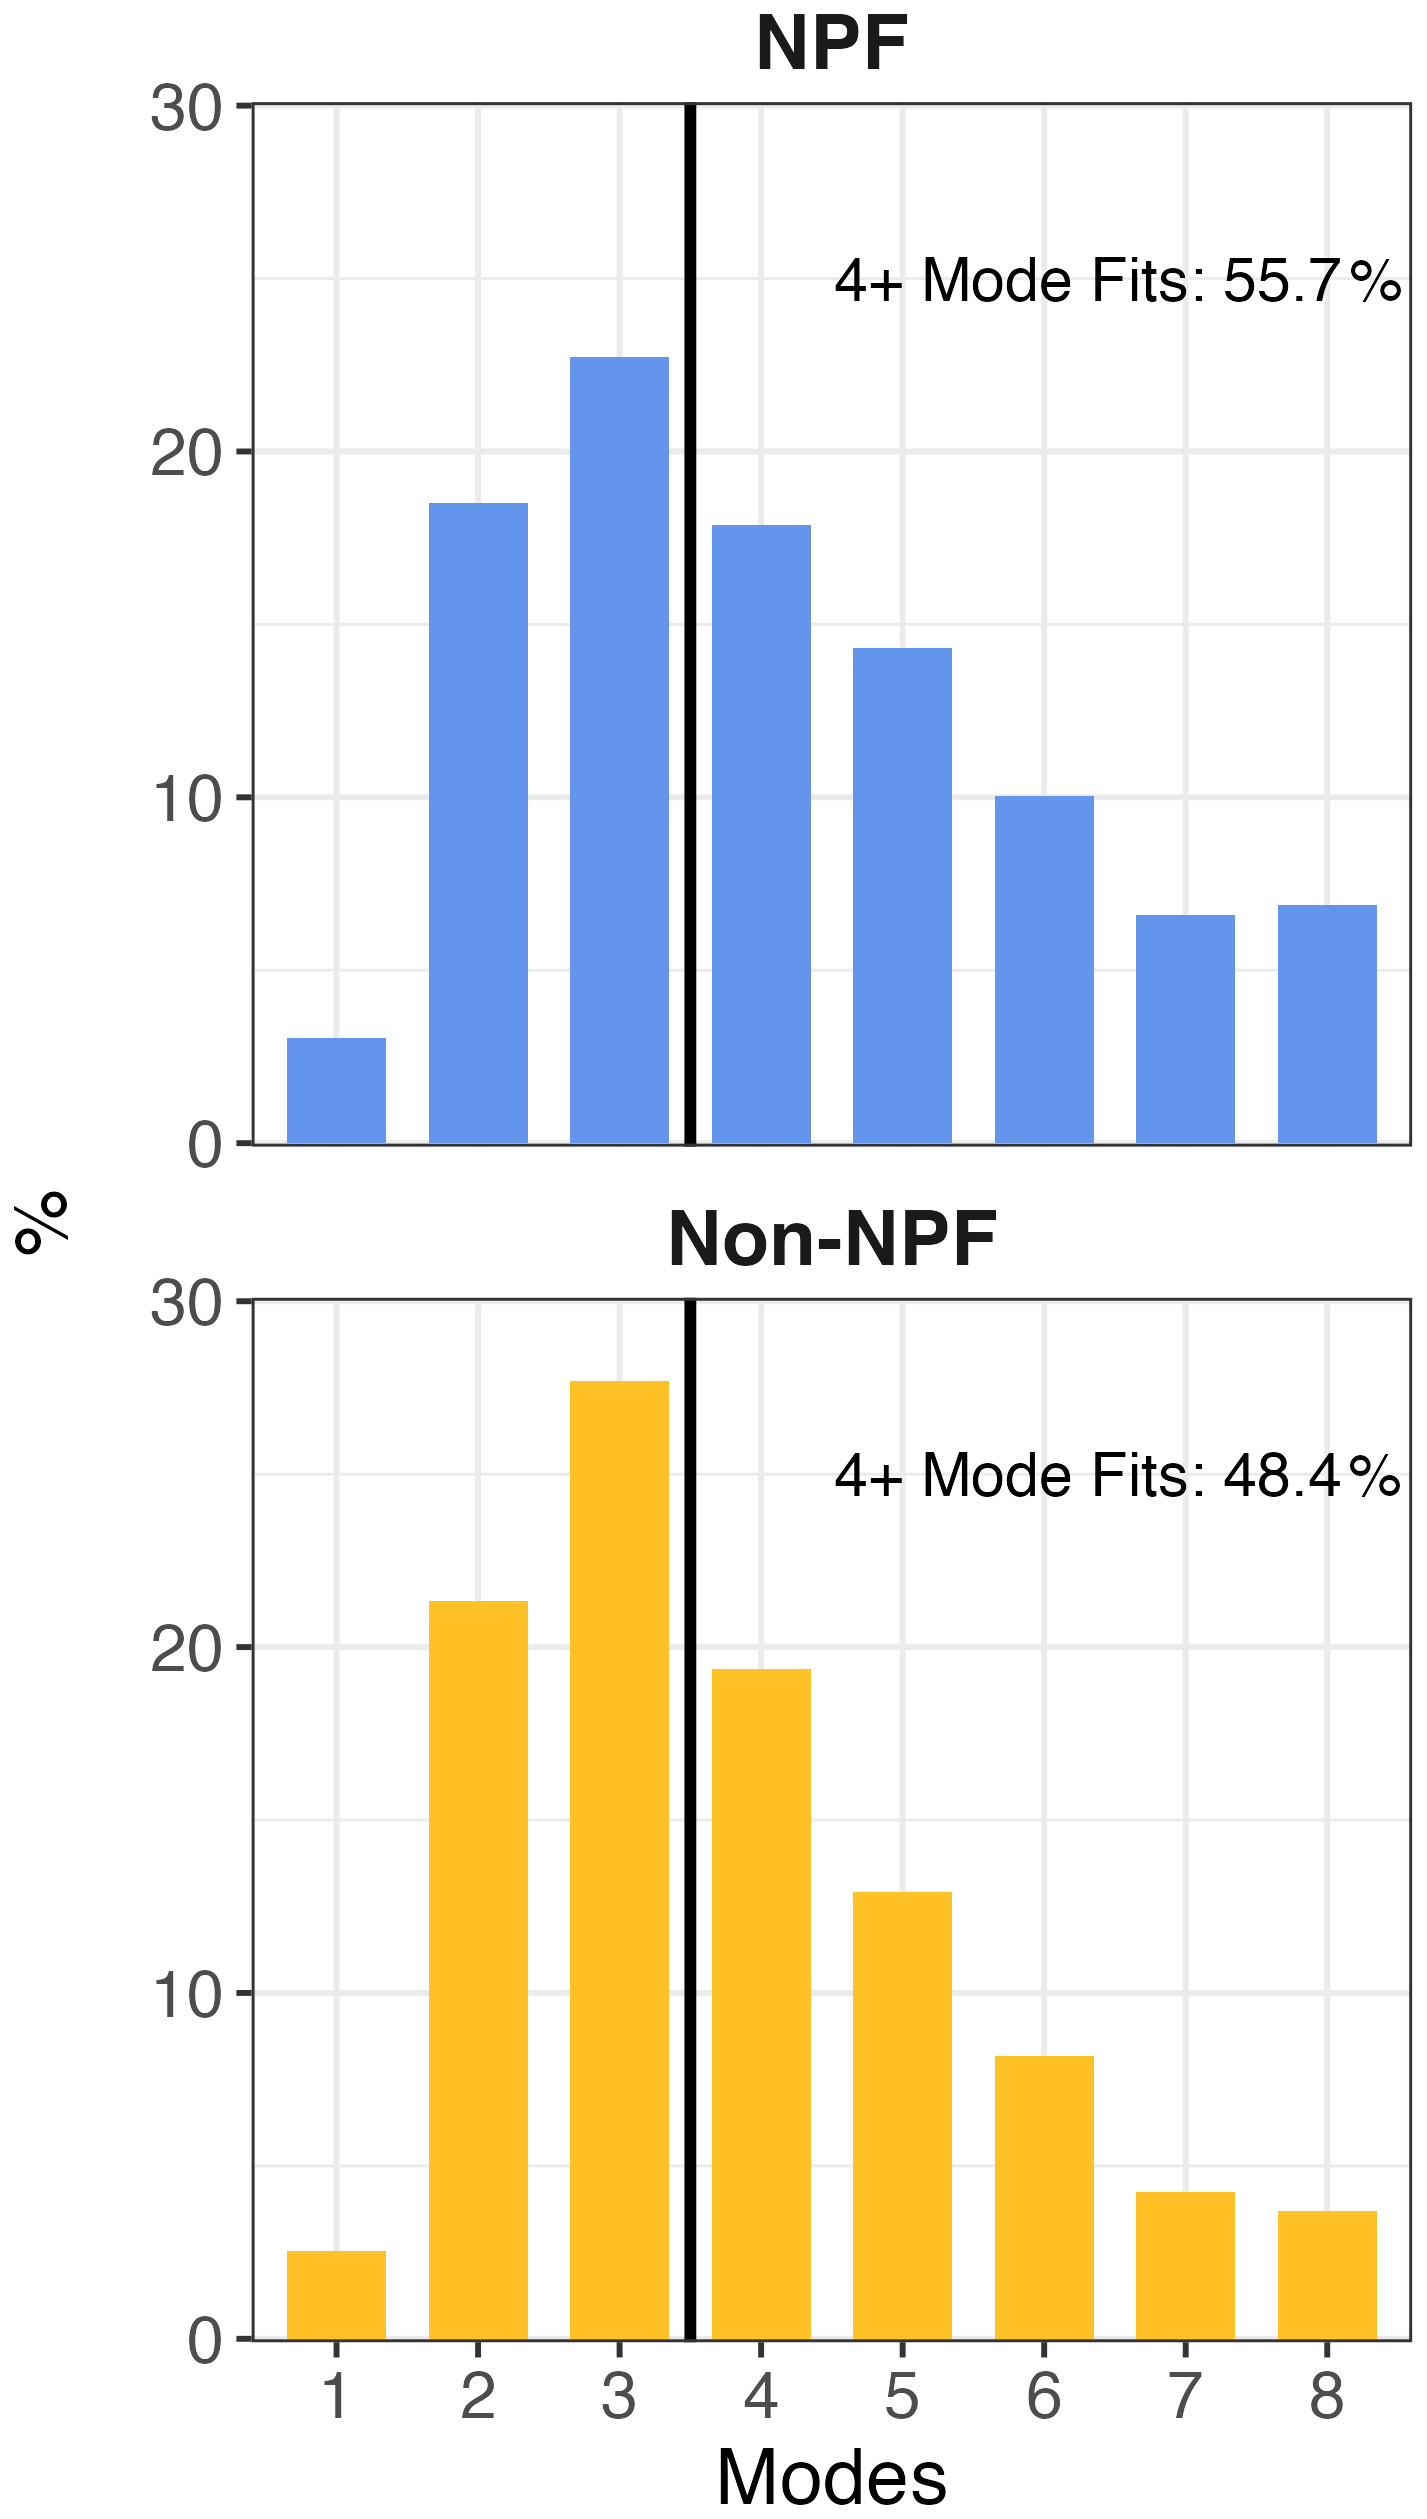
Figure 6Relative frequency of modes (%) necessary to successfully fit a PSD (NRMSE≤10 % and FVU≤10 %) on days where NPF was visually classified (top) or days where NPF was confirmed to not have occurred (bottom). Annotations indicate the percentage of data associated with 4 or more modes.
3.4 Comparison to the DO-FIT model
To robustly compare the multimodal algorithm against an established fitting technique, we performed a comparison with the DO-FIT model which has been extensively used in characterizing PSD measurements (Hussein et al., 2005; Zhu and Wang, 2024). Both multimodal and DO-FIT were allowed to fit a maximum of three modes. In the case of DO-FIT, mode identification was based on pre-existing parameter schemes based on ambient measurements (Hussein et al., 2005). Both models were run (or rerun in the case of multimodal) on a 5 min time resolution dataset of SPL data (15 January 2010–22 October 2020) at a lower bin resolution scheme (32 bins) to reduce computational cost. In total, 411 775 scans were examined.
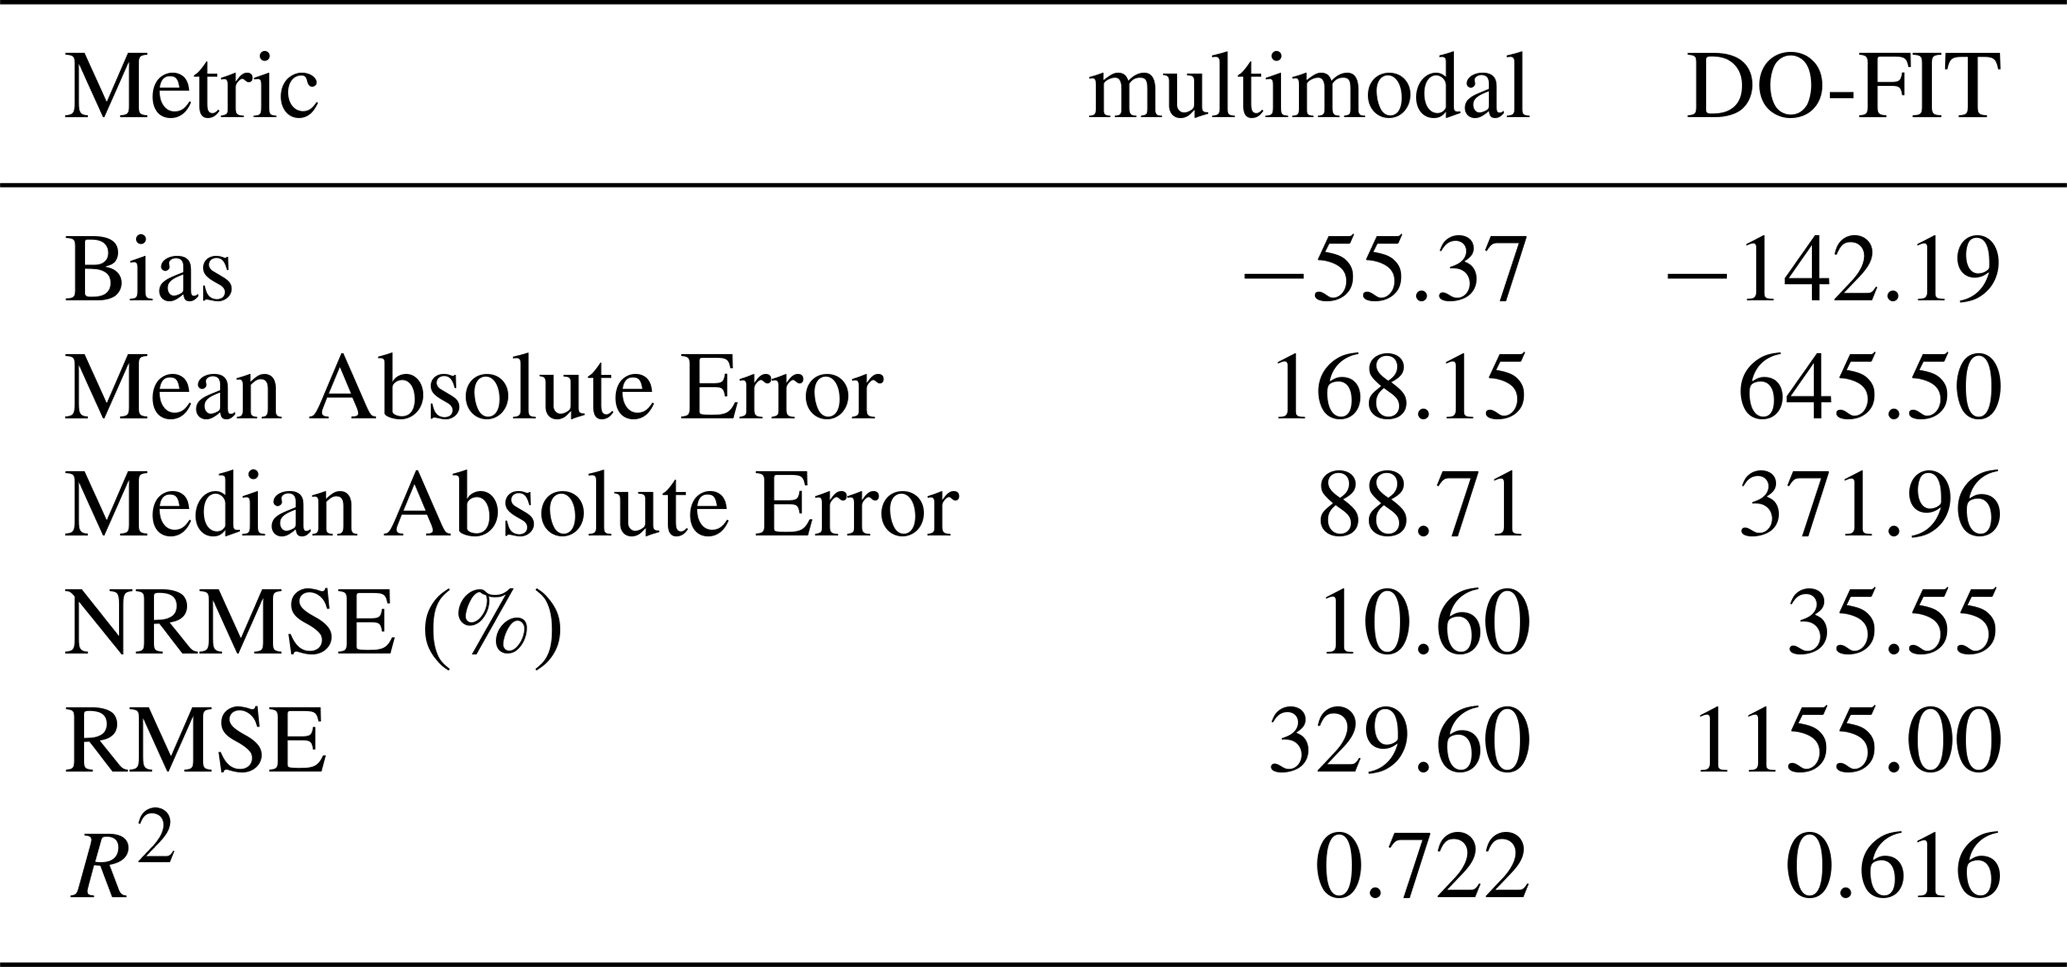
First, we note that the multimodal algorithm was significantly faster than the DO-FIT model, requiring 7.5 and 7784.13 single-threaded CPU hours, respectively. Model fitting failure, defined here as either automatic self-termination or inability to fit measured data, was comparable between methods with multimodal and DO-FIT accounting for 9.96 % and 5.86 %, respectively. Overall fitting accuracy metrics are summarized in Table 2, where values containing mean values were trimmed such that extreme values in the upper and lower 5 % were removed to account for computational outliers.
Table 2Model comparison metrics. All metrics are reported in units of [], except for NRMSE and R2 which are dimensionless.
To summarize model fitting in lognormal parameter spaces, the probability distribution of each model P(N,Dpg) was estimated with a normalized kernel density estimate (KDE) using the Modern Applied Statistics with S R package (Venables et al., 2002). The resulting estimates are shown in Fig. 7. In both cases, the accumulation mode is most distinct, with agreement in location and density between both. Primary differences were observed in the nucleation and Aitken regions, where multimodal was most likely to assign modes between 20 and 70 nm for N between 102 and 104 cm−3.
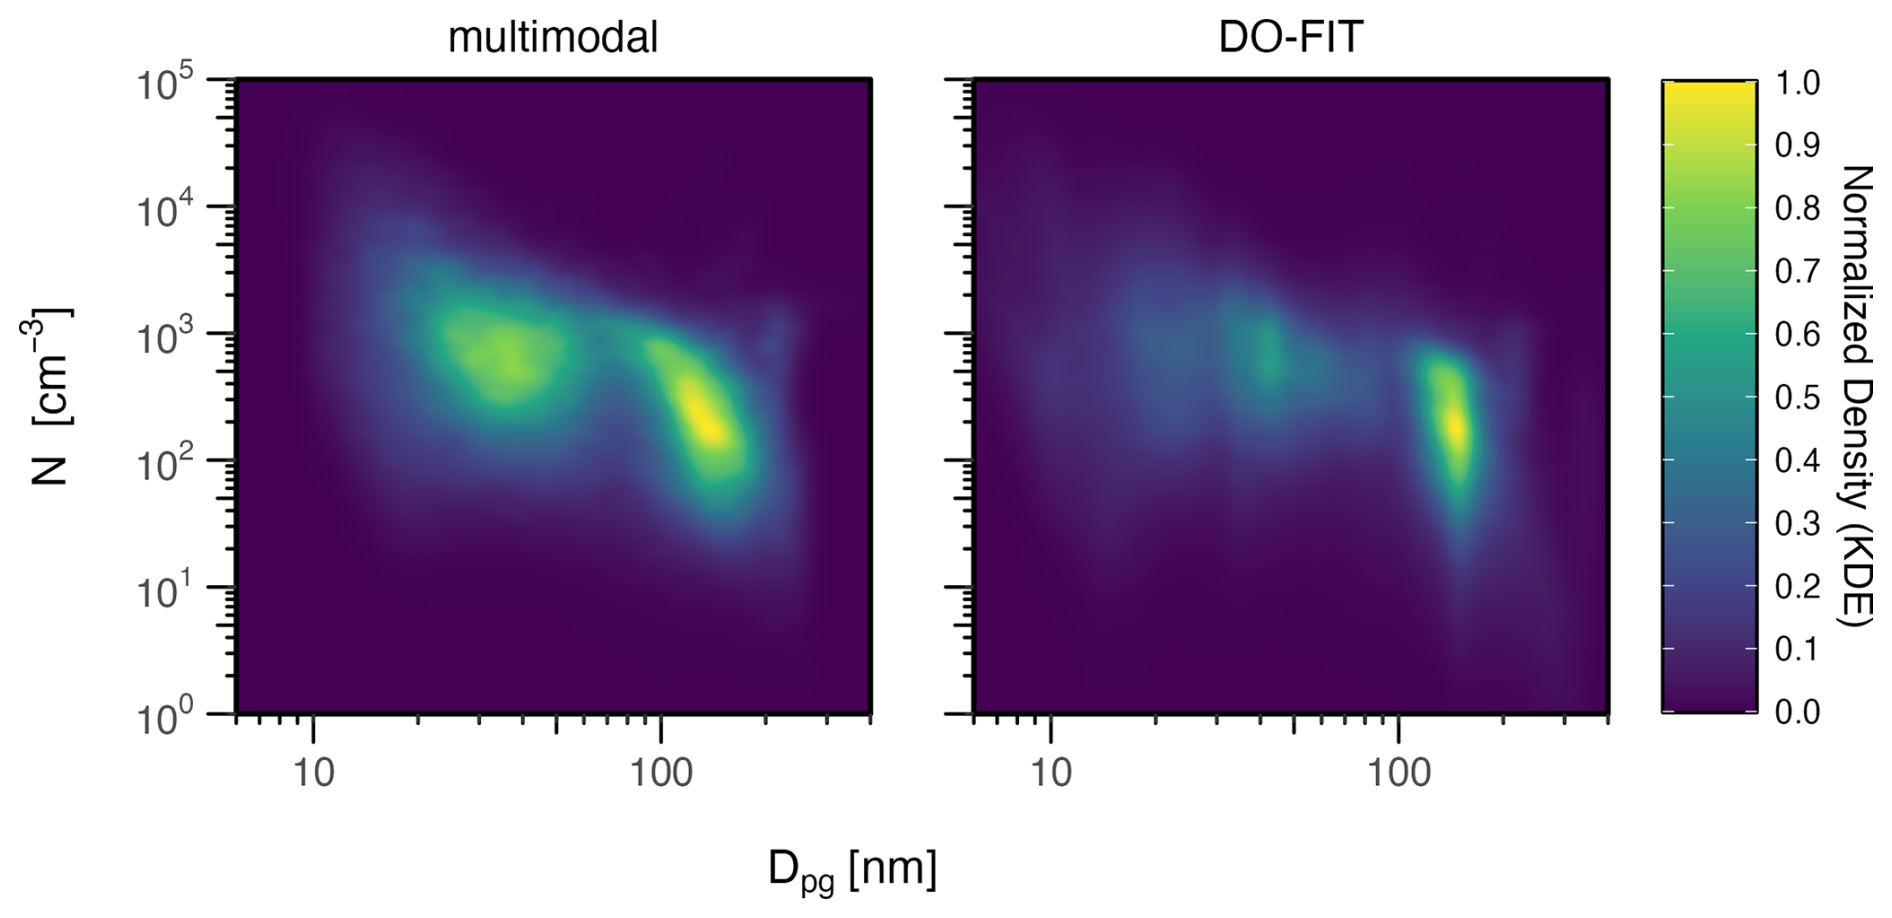
Figure 7KDE estimate of the probability distribution of each lognormal fitting algorithm (as labelled) as a function of N and Dpg. Saturated regions of each panel indicate regions where the model is most likely to assign modes for the ambient PSDs collected at SPL from 15 January 2010–22 October 2020.
Residuals for each model were compared across the full reduced dataset to examine the relationship between model prediction error and aerosol regimes (i.e. within Dp and N space). Data was pre-binned by existing diameters and further grouped by log-spaced bins of N. Given over or underprediction in aerosol models can result in predicted particle concentrations spanning several orders of magnitude, we represent the magnitude and direction of predictive error using the log bias ratio (Eq. 10):
In Fig. 8, the mean of the log bias ratio across all scans is shown with computational errors removed (i.e. extreme non-physical values ±5 %). For both models, underprediction of the SPL dataset was most frequent. Overprediction was observed only for high aerosol loadings. At low concentrations (i.e. N less than 102 cm−3) DO-FIT outperformed multimodal where automated peak identification is difficult. DO-FIT also outperformed multimodal for both sub 20 nm bins () and data between 100 and 200 nm irrespective of N. For all other regions, multimodal generally outperformed DO-FIT.
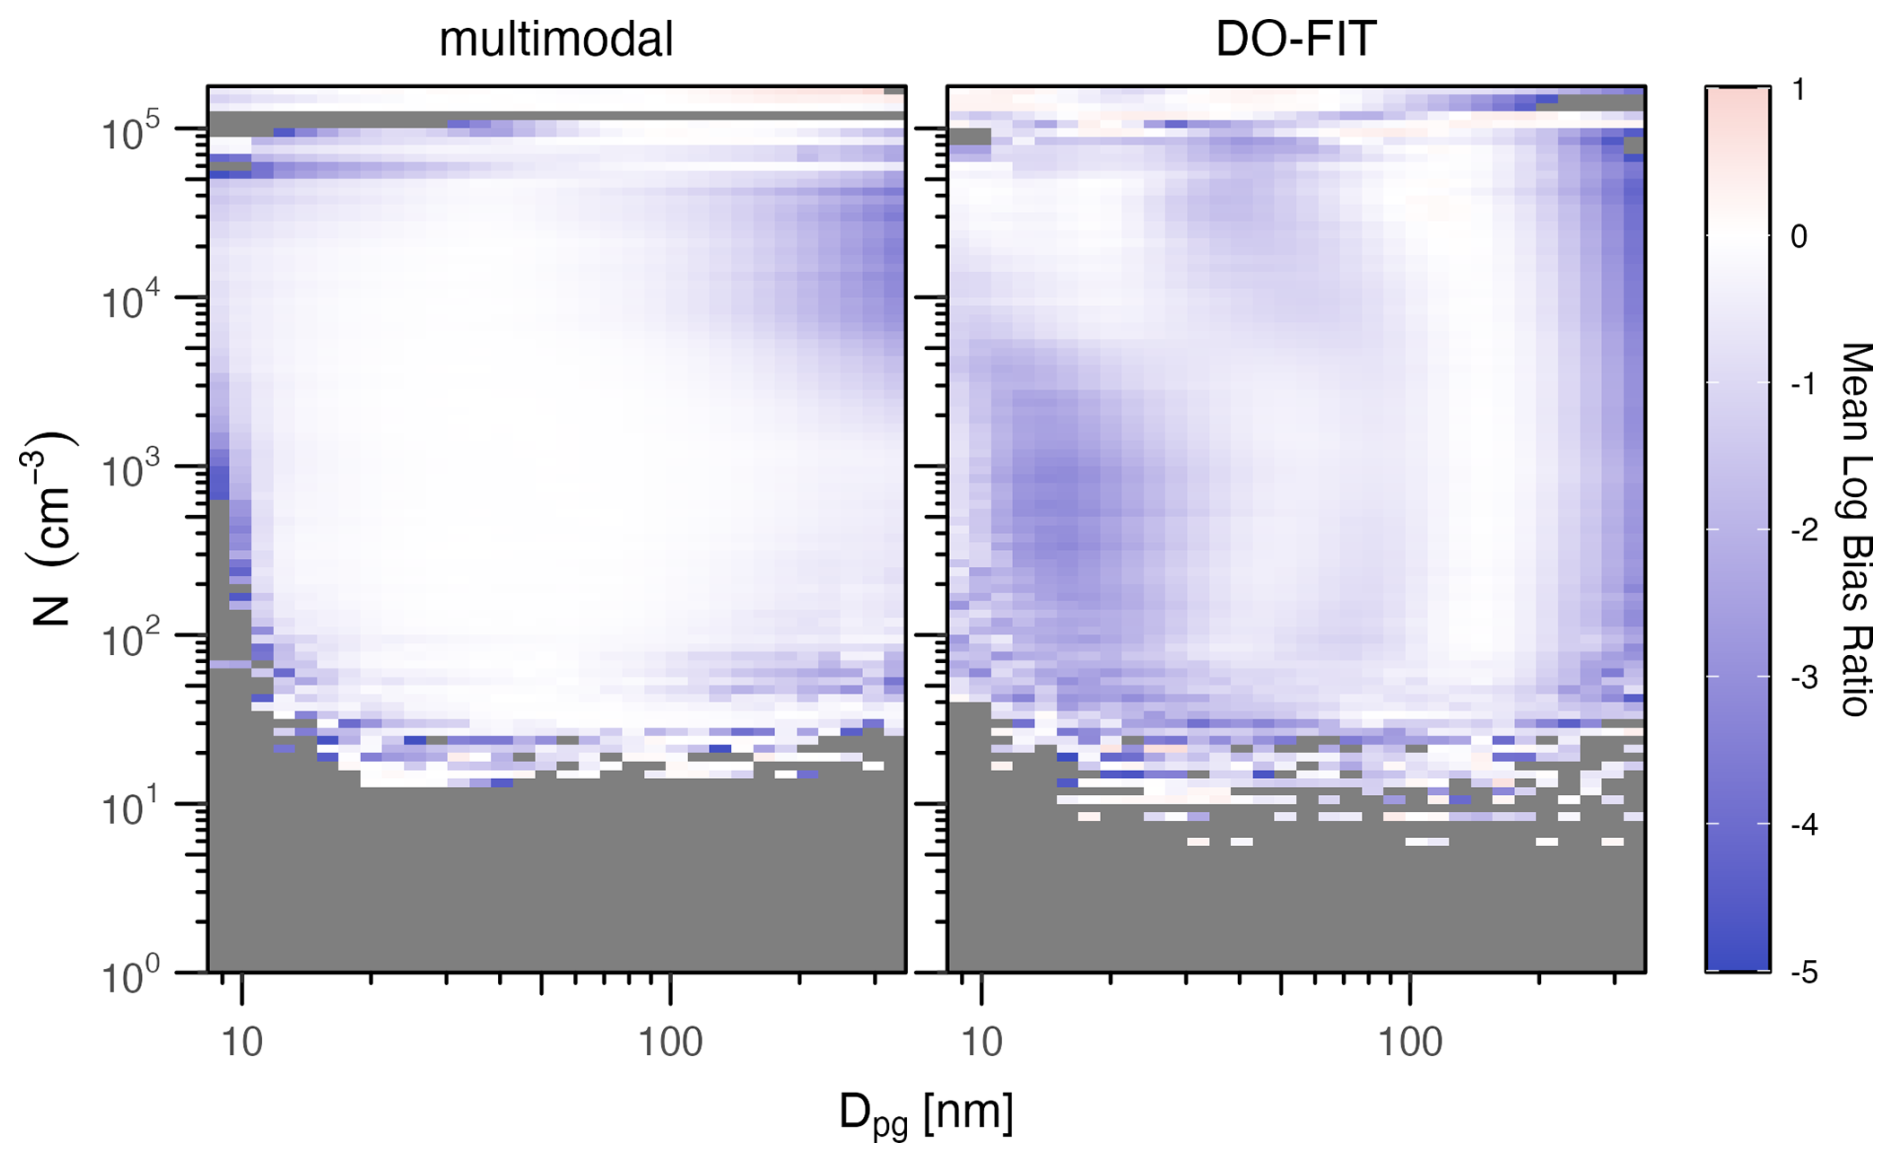
Figure 8Contour map of the magnitude in prediction error of the multimodal (left) and DO-FIT (right) PSD fitting algorithms. Red indicates overprediction whereas blue indicates underprediction, with the magnitude of error given in log scale (i.e. a value of −2 indicates the model underpredicts in this PSD region by 100×). Gray fill indicates regions where fitting failed.
4.1 Tri-Modal Assumption
Two to three modes are generally sufficient to characterize ambient PSDs for a variety of environments (Franco et al., 2022; Herrmann et al., 2015; Hussein et al., 2005; Mäkelä et al., 2000; Zhu and Wang, 2024). As such, existing commercial algorithms such as DistFit™ (Chimera Technologies) are designed to use a maximum of three modes when fully automated. Similarly, existing non-commercial algorithms assume (or merge smaller modes) to achieve at most a trimodal distribution (Hussein et al., 2005; Mäkelä et al., 2000; Zhu and Wang, 2024). For the algorithm developed by (Hussein et al., 2005), modes are assigned by iterating lognormal parameters (Ni,σg, and ) in a predefined range. In contrast, the algorithm we developed does not have any assumptions on mode parameters and is only limited by user-defined arguments for maximum allowed modes and accuracy tolerances. After iteratively subtracting modes in order of decreasing concentration, the algorithm will continue to assign modes unless desired tolerance is achieved or maximum modes are reached. This flexibility proved invaluable when evaluating both the laboratory measurements at Purdue University and ambient measurements at SPL. Existing algorithms with limited mode numbers would not have been able to characterize complex laboratory measurements (e.g. DMA size-selected) such as those presented here where a minimum of six modes is present. Furthermore, the assumption of a tri-modal distribution was inadequate for PSD data at SPL from 2010–2020, particularly during NPF events. For statistically classified NPF, ∼75 % of PSDs required four or more modes to explain 90 % of all particle variance. When considering all fittings at the same accuracy, 4±2 modes were required.
4.2 Accuracy
Evaluation of the algorithm against SPL data revealed that the algorithm is highly effective in fitting ambient PSDs. When considering multimodal fittings without any accuracy thresholds for ten years of SPL PSD data, the model exhibited high predictive skill (R2=0.847) for total predicted vs. measured particle concentration. When applying more selective accuracy thresholds to filter poor/failed fittings, the algorithm's predictive skill increased at the expense of a lower number of available fittings. Using the accuracy thresholds NRMSE≤10 % and FVU≤10 %, the algorithm slightly underestimated total particle concentration at SPL by 0.9 % on average. Zhu and Wang, 2024, determined the multi-lognormal particle distribution using 3 or less modes overpredicted concentrations by 9 % when examining hourly data from eight diverse research sites across Europe with a high correlation of observed and fitted results (R2>0.75). If we consider the results of Zhu and Wang, 2024 for Puy de Dôme only (which is most similar to SPL among the research sites they examined), a bi- or tri-modal distribution was accurate in fitting nucleation mode particles but performed very poorly otherwise (R2<0.12). In comparison to the DO-FIT model for a reduced dataset on SPL, we show when similarly limited to a tri-modal assumption, the multimodal algorithm achieved higher correlation with measured data (R2=0.722 vs. R2=0.616). Our results show using higher order modes for a similarly mountainous forested region was highly accurate.
4.3 Limitations
For the laboratory lognormal PSDs used to develop this algorithm, scans with total number concentrations exceeding or with unstable sheath flows (high standard deviation from set flow) were removed. Inclusion of these scans resulted in large overpredictions in concentration for all modes. An inherent limitation of any curve fitting procedure is the requirement that a local maximum is identified. For measured nucleation modes, the lower bound is typically the peak diameter with the lower tail outside the effective measurement range of instruments. Thus, the model will fail to curve-fit nucleation modes with a mode at or below the lower end of the measurement range. Low concentrations additionally preclude peak identification, preventing curve fitting (Fig. 8). Failure to identify edge cases of multiply charged particles or aggregates (ex. highest charged singlet or largest aggregate particle) were also encountered if a FVU tolerance of 0.01 (1 %) or higher was selected. Failure of edge cases is best summarized in Fig. 8. In the example presented in Fig. 2, a 0.1 % tolerance was used so all multiply charged particles and agglomerates were accounted for, emphasizing the strength of user-adjustable tolerance thresholds.
Significance testing of each parameter of the fitted lognormal PSD retrieved from the LM-NLS algorithm was successful (p≤0.05) with model runs containing parameters above this threshold automatically removed. We strongly caution however that MPSDs with ∼7 or more fitted modes will result in residual modes with low degrees of freedom e.g., significance testing is not an appropriate measure for goodness-of-fit. However, even with the increased statistical power for the sum of j modes, we found significance testing using either parametric or non-parametric testing to be a poor metric in evaluating the performance of the multimodal curve fitting algorithm in fitting a MPSD and recommend using the combination of the FVU and NRMSE.
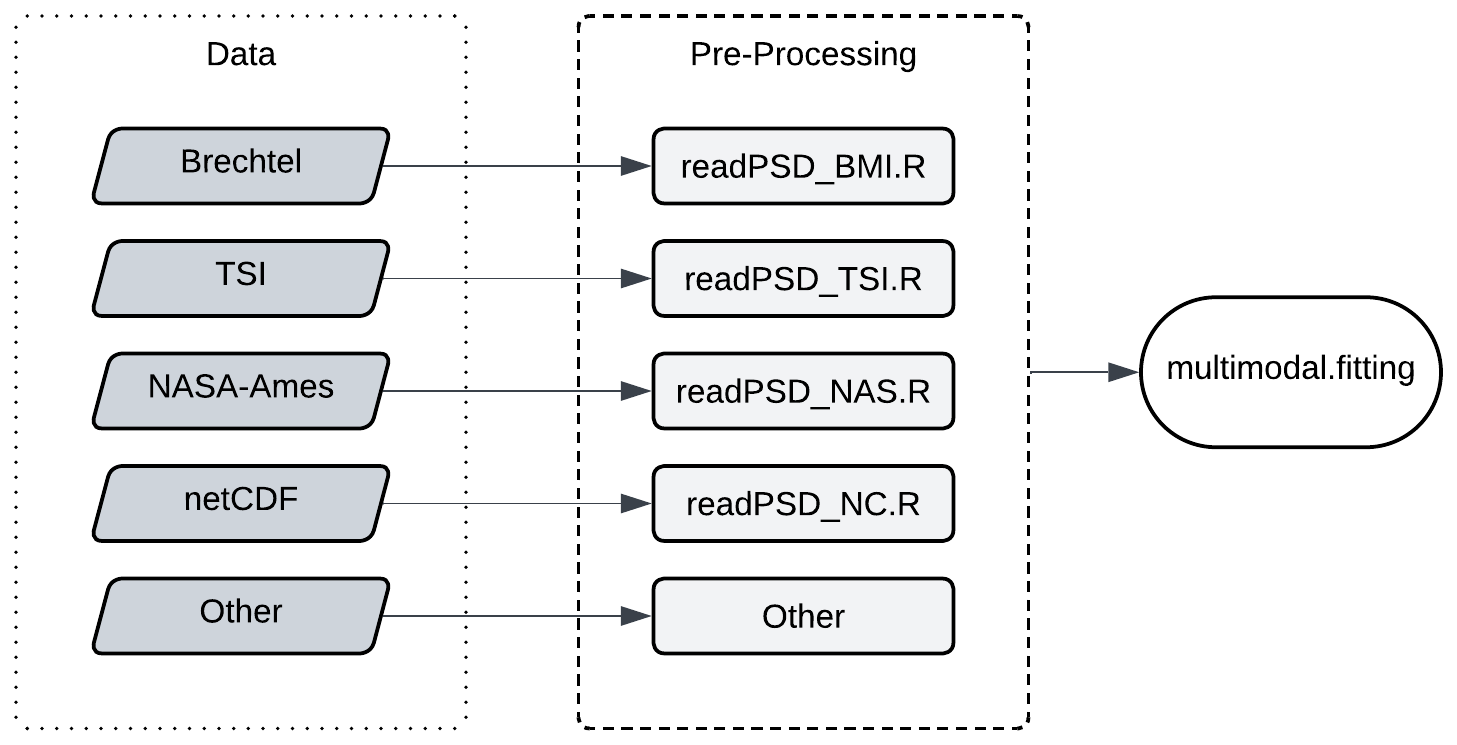
Figure 9Flowchart summarizing the data formatting process to apply the methods described here to a variety of datasets.
4.4 Applications
This multimodal curve fitting algorithm is open-source and available to the aerosol research community as a documented multi-argument R function. Both an actively maintained version and original copy (as submitted) are publicly accessible in addition to an example file describing the process in formatting datasets for analysis and applying the multimodal R function (see Supplement). This algorithm is not specific to any instrument or file format but must contain binned log-normalized concentration data (ideally corrected for any particle losses) with numeric names corresponding to the diameter range (e.g., 10.16 nm) listed in the data file. An assumption of this algorithm is that the data to be analyzed has been corrected for instrument errors and has been quality controlled. It is assumed the data can be pre-processed according to the procedure described in Sect. 2.4. To assist in this step, four supplemental functions are provided to pre-process TSI or Brechtel measurement data (instrument software version dependent). Furthermore, both the NASA-Ames (level 1 and 2) and netCDF standardized formats are accepted (see Fig. 9). Other instrument files or formats not listed can additionally be included upon request.
This multimodal curve fitting algorithm provides a method to estimate and parameterize MPSDs using familiar theory foundational to aerosol statistics. As MPSDs are assumed to be the summation of j modes, the algorithm iteratively subtracts modes in order of maximum concentration until user-defined accuracy and convergence tolerances are achieved. The algorithm is not limited by predefined ranges of lognormal parameters or number of modes and was designed for analyzing both laboratory and ambient PSD measurements. In particular, the freedom from predefined mode templates was invaluable for characterizing ten-years of ambient PSDs measured at SPL. The commonly assumed tri-modal distribution for ambient aerosol particles was adequate for only 27.7 % of non-NPF data analyzed where 48.4 % of data required 4 or more modes. During periods of statistically defined NPF this assumption became increasingly unreliable, where approximately 75 % of PSDs required four or more modes to explain 90 % of particle variance with a mean/median of 5±2 modes. A tri-modal limited run of the multimodal algorithm showed similar agreement with the DO-FIT algorithm but achieved higher performance metrics (Table 2). We note that these improved metrics can be attributed to the purely mathematical nature of multimodal whereas DO-FIT is arguably more grounded by decades of MPSD observations. We believe this research tool can be utilized by the aerosol research community to analyze aerosol size distributions and more critically, improve our understanding of the size-specific effects aerosol have on air quality and climate.
Maintained R codes for the multimodal curve fitting algorithm and data pre-processing are available on GitHub https://github.com/christopher-rapp/multimodal (last access: 29 July 2026), with original code used in this publication available on Zenodo (https://doi.org/10.5281/zenodo.21536399, Rapp, 2026). Datasets used in preparing this manuscript are also available on Zenodo (https://doi.org/10.5281/zenodo.21266817, Rapp et al., 2026).
The supplement related to this article is available online at https://doi.org/10.5194/amt-19-5373-2026-supplement.
CNR prepared the manuscript with contributions from all co-authors. GC-C visually classified NPF events at SPL. CNR performed data analysis and programming. CNR and TH performed model comparison. CNR, SN, YZ, and DJC designed laboratory experiments. CNR and SN performed experiments. CNR, AGH, FJB, and DJC contributed to project conceptualization. DJC, AGH, and YZ acquired funding for the project.
Fred J. Brechtel is CEO and owner of Brechtel Manufacturing Incorporated.
Publisher's note: Copernicus Publications remains neutral with regard to jurisdictional claims made in the text, published maps, institutional affiliations, or any other geographical representation in this paper. The authors bear the ultimate responsibility for providing appropriate place names. Views expressed in the text are those of the authors and do not necessarily reflect the views of the publisher.
Many have provided extensive technical support over the years for Storm Peak Laboratory's SMPS instrumentation and data management. A special acknowledgement goes to Dan Gilchrist, Maria Garcia, Gerardo Carrillo-Cardenas, Ty Atkins, Megan Ostlie, and Joe Messina for all their technical assistance. Storm Peak Laboratory is a permittee of the Medicine-Bow Routt National Forests and is an equal opportunity service provider and employer. Finally, the operations of Storm Peak Laboratory would not be possible without the support of the Steamboat Ski and Resort Corporation for logistical assistance and in-kind donations. We also would like to acknowledge Will Schenk for assistance in aerosol generation.
This research has been supported by the National Science Foundation (grant nos. 2131369, 2131371, and 2443817) and National Oceanic and Atmospheric Administration (grant no. NA23OAR4310300). Storm Peak Laboratory is supported by the National Science Foundation (grant no. 2113201) under the Community Instruments and Facilities (CIF) program.
This paper was edited by Wiebke Frey and reviewed by three anonymous referees.
Albrecht, B. A.: Aerosols, Cloud Microphysics, and Fractional Cloudiness, Science, 245, 1227–1230, https://doi.org/10.1126/science.245.4923.1227, 1989.
Borchers, H. W.: pracma: practical numerical math functions, CRAN, 2.4.4, https://doi.org/10.32614/CRAN.package.pracma, 2011.
Elzhov, T. V., Mullen, K. M., Spiess, A.-N., and Bolker, B.: minpack.lm: R interface to the levenberg-marquardt nonlinear least-squares algorithm found in MINPACK, plus support for bounds, CRAN, https://doi.org/10.32614/CRAN.package.minpack.lm, 2022.
Franco, M. A., Ditas, F., Kremper, L. A., Machado, L. A. T., Andreae, M. O., Araújo, A., Barbosa, H. M. J., de Brito, J. F., Carbone, S., Holanda, B. A., Morais, F. G., Nascimento, J. P., Pöhlker, M. L., Rizzo, L. V., Sá, M., Saturno, J., Walter, D., Wolff, S., Pöschl, U., Artaxo, P., and Pöhlker, C.: Occurrence and growth of sub-50 nm aerosol particles in the Amazonian boundary layer, Atmos. Chem. Phys., 22, 3469–3492, https://doi.org/10.5194/acp-22-3469-2022, 2022.
Fuzzi, S., Baltensperger, U., Carslaw, K., Decesari, S., Denier van der Gon, H., Facchini, M. C., Fowler, D., Koren, I., Langford, B., Lohmann, U., Nemitz, E., Pandis, S., Riipinen, I., Rudich, Y., Schaap, M., Slowik, J. G., Spracklen, D. V., Vignati, E., Wild, M., Williams, M., and Gilardoni, S.: Particulate matter, air quality and climate: lessons learned and future needs, Atmos. Chem. Phys., 15, 8217–8299, https://doi.org/10.5194/acp-15-8217-2015, 2015.
Gordon, H., Kirkby, J., Baltensperger, U., Bianchi, F., Breitenlechner, M., Curtius, J., Dias, A., Dommen, J., Donahue, N. M., Dunne, E. M., Duplissy, J., Ehrhart, S., Flagan, R. C., Frege, C., Fuchs, C., Hansel, A., Hoyle, C. R., Kulmala, M., Kürten, A., Lehtipalo, K., Makhmutov, V., Molteni, U., Rissanen, M. P., Stozkhov, Y., Tröstl, J., Tsagkogeorgas, G., Wagner, R., Williamson, C., Wimmer, D., Winkler, P. M., Yan, C., and Carslaw, K. S.: Causes and importance of new particle formation in the present-day and preindustrial atmospheres, J. Geophys. Res.-Atmos., 122, 8739–8760, https://doi.org/10.1002/2017JD026844, 2017.
Hallar, A. G., Lowenthal, D. H., Chirokova, G., Borys, R. D., and Wiedinmyer, C.: Persistent daily new particle formation at a mountain-top location, Atmos. Environ., 45, 4111–4115, https://doi.org/10.1016/j.atmosenv.2011.04.044, 2011.
Hallar, A. G., McCubbin, I. B., Borys, R., Lowenthal, D. H., Wetzel, M., Hindman, E., Brooks, S. D., Steenburgh, W. J., Gratz, L., Hoch, S., Stephens, B., Horel, J. D., Molotch, N. P., Mace, G. G., Bailey, A., Pettersen, C., Andrews, E., Cziczo, D. J., and Garcia, M.: Storm Peak Laboratory: A Research and Training Facility for the Atmospheric Sciences, B. Am. Meteorol. Soc., 106, E1130–E1148, https://doi.org/10.1175/BAMS-D-24-0043.1, 2025.
Herrmann, E., Weingartner, E., Henne, S., Vuilleumier, L., Bukowiecki, N., Steinbacher, M., Conen, F., Collaud Coen, M., Hammer, E., Jurányi, Z., Baltensperger, U., and Gysel, M.: Analysis of long-term aerosol size distribution data from jungfraujoch with emphasis on free tropospheric conditions, cloud influence, and air mass transport, J. Geophys. Res.-Atmos., 120, 9459–9480, https://doi.org/10.1002/2015JD023660, 2015.
Hinds, W. C. and Zhu, Y.: Aerosol technology: properties, behavior, and measurement of airborne particles, 3rd edn., Wiley, Hoboken, NJ, 1 pp., ISBN 978-1-119-49404-1, 2022.
Hirshorn, N. S., Zuromski, L. M., Rapp, C., McCubbin, I., Carrillo-Cardenas, G., Yu, F., and Hallar, A. G.: Seasonal significance of new particle formation impacts on cloud condensation nuclei at a mountaintop location, Atmos. Chem. Phys., 22, 15909–15924, https://doi.org/10.5194/acp-22-15909-2022, 2022.
Hussein, T., Dal Maso, M., Petäjä, T., Koponen, I. K., Paatero, P., Aalto, P. P., Hämeri, K., and Kulmala, M.: Evaluation of an automatic algorithm for fitting the particle number size distributions, Boreal Environ. Res., 10, 337, https://doi.org/10.60910/gkzd-jt7v, 2005.
Lohmann, U.: Aerosol Effects on Clouds and Climate, Space Sci. Rev., 125, 129–137, https://doi.org/10.1007/s11214-006-9051-8, 2007.
Lohmann, U. and Feichter, J.: Global indirect aerosol effects: a review, Atmos. Chem. Phys., 5, 715–737, https://doi.org/10.5194/acp-5-715-2005, 2005.
Mäkelä, J. M., Koponen, I. K., Aalto, P., and Kulmala, M.: One-year data of submicron size modes of tropospheric background aerosol in southern Finland, J. Aerosol Sci., 31, 595–611, https://doi.org/10.1016/S0021-8502(99)00545-5, 2000.
Moré, J. J.: The Levenberg–Marquardt algorithm: Implementation and theory, in: Numerical Analysis, vol. 630, edited by: Watson, G. A., Springer, Berlin, Heidelberg, 105–116, https://doi.org/10.1007/BFb0067700, 1978.
Myhre, G., Shindell, D., Bréon, F.-M., Collins, W., Fuglestvedt, J., Huang, J., Koch, D., Lamarque, J.-F., Lee, D., Mendoza, B., Nakajima, T., Robock, A., Stephens, G., Takemura, T., and Zhang, H.: Anthropogenic and natural radiative forcing, in: Climate Change 2013: The Physical Science Basis. Contribution of Working Group I to the Fifth Assessment Report of the Intergovernmental Panel on Climate Change, edited by: Stocker, T. F., Qin, D., Plattner, G.-K., Tignor, M., Allen, S. K., Doschung, J., Nauels, A., Xia, Y., Bex, V., and Midgley, P. M., Cambridge University Press, Cambridge, United Kingdom and New York, NY, USA, 659–740, https://doi.org/10.1017/CBO9781107415324.018, 2013.
Ondráček, J., Ždímal, V., Smolík, J., and Lazaridis, M.: A Merging Algorithm for Aerosol Size Distribution from Multiple Instruments, Water Air Soil Poll., 199, 219–233, https://doi.org/10.1007/s11270-008-9873-y, 2009.
Petersen, R. C., Hallar, A. G., McCubbin, I. B., Ogren, J. A., Andrews, E., Lowenthal, D., Gorder, R., Purcell, R., Sleeth, D., and Novosselov, I.: Numerical, wind-tunnel, and atmospheric evaluation of a turbulent ground-based inlet sampling system, Aerosol Sci. Tech., 53, 712–727, https://doi.org/10.1080/02786826.2019.1602718, 2019.
Pope, C. A. and Dockery, D. W.: Health Effects of Fine Particulate Air Pollution: Lines that Connect, J. Air Waste Manage., 56, 709–742, https://doi.org/10.1080/10473289.2006.10464485, 2006.
Rapp, C.: multimodal.R, Zenodo [code], https://doi.org/10.5281/zenodo.21536399, 2026.
Rapp, C., Carrillo-Cardenas, G., Hussein, T., Niu, S., Zhang, Y., Brechtel, F., Hallar, A. G., and Cziczo, D. J.: Repository for “curve fitting algorithm for multimodal particle size distributions – a theoretical basis” (V4), Zenodo [data set], https://doi.org/10.5281/zenodo.21266817, 2026.
Seinfeld, J. H. and Pandis, S. N.: Atmospheric chemistry and physics: from air pollution to climate change, 3rd edn., John Wiley & Sons, Inc, Hoboken, New Jersey, 1120 pp., ISBN 978-1-118-94740-1, 2016.
Taylor, M., Kazadzis, S., and Gerasopoulos, E.: Multi-modal analysis of aerosol robotic network size distributions for remote sensing applications: dominant aerosol type cases, Atmos. Meas. Tech., 7, 839–858, https://doi.org/10.5194/amt-7-839-2014, 2014.
Twomey, S.: Pollution and the planetary albedo, Atmos. Environ. (1967), 8, 1251–1256, https://doi.org/10.1016/0004-6981(74)90004-3, 1974.
Twomey, S. A., Piepgrass, M., and Wolfe, T. L.: An assessment of the impact of pollution on global cloud albedo, Tellus B, 36B, 356–366, https://doi.org/10.1111/j.1600-0889.1984.tb00254.x, 1984.
Venables, W. N., Ripley, B. D., and Venables, W. N.: Modern applied statistics with S, 4th edn., Springer, New York, 495 pp., ISBN 978-0-387-95457-8, 2002.
Weltje, G. J. and Prins, M. A.: Genetically meaningful decomposition of grain-size distributions, Sediment. Geol., 202, 409–424, https://doi.org/10.1016/j.sedgeo.2007.03.007, 2007.
Zhu, K. and Wang, L.: A comprehensive study on the validation and application of multi-lognormal distribution models for atmospheric particles, Atmos. Environ., 338, 120813, https://doi.org/10.1016/j.atmosenv.2024.120813, 2024.