
the Creative Commons Attribution 4.0 License.
the Creative Commons Attribution 4.0 License.
 | 26 Aug 2026
Sensitivity of bi-spectral retrievals to the fixed effective variance assumption in ship tracks
Alice Cicirello
Edward Gryspeerdt
Ship tracks, bright lines in clouds formed by ship exhaust, serve as “natural laboratories” for investigating aerosol-cloud interactions, one of the largest sources of uncertainty in the human forcing of the climate. Observing ship tracks has been used to help constrain the effect of anthropogenic aerosols on cloud brightness, amount and water content. The validity of these constraints relies, in part, on the accuracy of satellite retrieval algorithms used to measure cloud properties. A known source of uncertainty in these algorithms is the representation of the droplet size distribution. Standard bi-spectral retrievals (e.g. MODIS) rely on a fixed effective variance (veff) for the modified gamma distribution used to model cloud droplet dispersion. The introduction of aerosols into clean, marine clouds produces not only smaller droplets but also a narrower size distribution, contradicting this fixed assumption. This study presents a controlled, synthetic retrieval experiment that isolates the sensitivity of cloud property retrievals, and the derived aerosol-cloud interaction metrics, to this single assumption. This study uses idealised ship tracks as the test case because they provide the strongest realistic contrast between the assumed and true distribution widths. The results produced indicate that neglecting the narrowing of the droplet size distribution causes retrieved effective radius (re) to differ systematically between clean and polluted regimes. The polluted branch is overestimated relative to the near-unbiased clean branch by approximately 2.3 %–3.4 %, depending on the assumed retrieval baseline. Optical depth (τ) is virtually unaffected in either regime. LWP is retrieved with little bias in either regime, so the clean-to-polluted LWP contrast is largely preserved. Nd shows the opposite problem. The apparent clean-to-polluted increase in Nd is overstated by 22 %–23 % under both operational assumptions. This discrepancy is driven by the inverse dependence of Nd on the spectral width parameter k, inflating the droplet count in narrow polluted distributions while underestimating it in broader clean ones. If the aerosol-driven narrowing of the droplet size distribution assumed here is representative of real ship tracks, this contrast inflation could exaggerate the apparent susceptibility of clouds to aerosols, contributing to an overstatement of the Twomey effect in observation-based estimates reliant on data from ship tracks. Under the same conditions, satellite-based monitoring of climate intervention efforts, such as marine cloud brightening, could similarly overestimate their efficacy.
- Article
(5073 KB) - Full-text XML
- BibTeX
- EndNote


Aerosols influence cloud radiative properties through an instantaneous microphysical change followed by a series of time-dependent adjustments. The primary instantaneous effect occurs as aerosols act as cloud condensation nuclei (CCN), increasing the droplet number concentration (Nd). For a constant liquid water path (LWP), this shift toward more numerous, smaller droplets increases the cloud's total surface area, thereby enhancing its optical depth (τ) and albedo (Twomey, 1974). Beyond this initial response, several rapid adjustments further modify the clouds' microphysical state. A key mechanism is precipitation suppression, where smaller droplets inhibit collision-coalescence, potentially increasing both LWP and cloud lifetime (Albrecht, 1989). However, the initial Twomey cooling is often offset by rapid cloud adjustments. For example, altered microphysics can accelerate the entrainment of dry air into the cloud top, which may enhance evaporation and lead to a subsequent decrease in LWP (Wood, 2007; Ackerman et al., 2004; Bretherton et al., 2007). Furthermore, light-absorbing aerosols like black carbon can introduce a semi-direct effect, heating the surrounding air and further inducing cloud dissipation (Koch and Del Genio, 2010). While these specific responses counteract the initial brightening, the overall contribution of aerosol-cloud interactions induces a net cooling effect, the magnitude of which is poorly constrained (Glassmeier et al., 2021; Chun et al., 2023; Christensen et al., 2022).
Ship tracks serve as an observational laboratory for disentangling these competing cloud adjustments. By providing a localised aerosol perturbation against a clear control case of unpolluted cloud, ship tracks allow the isolation of these microphysical processes from the background meteorological conditions. Constraining the magnitude of this aerosol-induced cooling is essential not only for greater accuracy in radiative forcing estimates but also for ascertaining the feasibility of climate engineering techniques such as MCB (Feingold et al., 2024). While the instantaneous Twomey effect is well documented in observational studies (Noone et al., 2000a, b), the subsequent LWP response is significantly less constrained (Chen et al., 2012; Gryspeerdt et al., 2021). This uncertainty arises because the net LWP signal is often weak (Toll et al., 2019; Tippett et al., 2024) and highly dependent on both the local meteorology (Goren et al., 2025; Zhang and Feingold, 2023) and the evolving timescales of the perturbation (Gryspeerdt et al., 2021).
To date, observational studies of ship tracks have primarily utilised satellite remote sensing data from instruments such as the Moderate Resolution Imaging Spectroradiometer (MODIS). MODIS uses a multi-spectral imager that collects reflectance data at multiple relevant wavelengths in the visible and infra-red. For this study, bi-spectral retrievals using the MODIS wavelength bands in the visible-near infrared and shortwave infrared are examined (King et al., 1997). These are sensitive to cloud optical thickness (τ) and droplet effective radius (re), respectively, but not entirely independent (Nakajima and King, 1990). As the cloud property retrieval algorithms are typically under-constrained, they use a variety of simplifying assumptions about the cloud microphysical properties. One of these is the assumption of a globally fixed width of the cloud droplet size distribution, or effective variance (veff) (King et al., 1997). The effective variance is a measure of the diversity of droplet sizes, and its value is fundamentally altered by the aerosol perturbation in a ship track. In the clean background cloud, the process of droplets colliding and merging to form drizzle creates a broad distribution of sizes, resulting in a high veff (typically 0.10–0.15). The introduction of ship-emitted aerosols narrows this distribution as the water in the cloud spreads to form smaller, uniform droplets around the aerosols (Martin et al., 1994), reducing the veff to as little as 0.05; this is further supported by the more recent aircraft-derived k-Nd relationship of Lebsock and Witte (2023), discussed further in Sect. 2.3. This discrepancy is a recognised retrieval bias (Liu et al., 2008), as the relationship between reflectance and re is a function of veff (Nakajima and King, 1990). It has also been hypothesised by Gryspeerdt et al. (2021) that this is the cause of the apparent instantaneous LWP response to ship aerosol, but this has yet to be properly quantified. While the sensitivity of retrieved cloud properties to the assumed droplet size distribution is established in the retrieval literature, this study quantifies the resulting bias specifically for the clean-to-polluted contrast characteristic of ship tracks, where the fixed-variance assumption is particularly likely to break down, and propagates it through to its consequences for Nd and derived susceptibility metrics, characterises its dependence on viewing geometry, and tests its robustness to the assumed strength of the underlying k-Nd coupling. Susceptibility metrics of this kind underpin observational constraints on the radiative forcing from aerosol-cloud interactions (RFaci). Biases in them therefore propagate directly into RFaci uncertainty.
Here, a synthetic retrieval framework designed to quantify this effect is presented, bounding the limits of the fixed effective variance assumption across core optical and microphysical cloud products. By forward-modelling top-of-atmosphere radiances for synthetic ship track scenes and inverting them using standard operational logic, the retrieval bias caused solely by the fixed veff assumption is isolated from all other components of the operational retrieval chain. The goal is the clean-to-polluted contrast that ship-track studies rely on, not absolute retrieval accuracy in either regime alone. The errors introduced into direct measurements of effective radius and optical depth are first quantified, before examining how these errors propagate into derived liquid water path and droplet number concentrations. Finally, the importance of mitigating these biases is discussed in the context of accurately interpreting cloud susceptibility and assessing the feasibility of marine cloud brightening.
2.1 The Modified Gamma Distribution
Satellite retrievals approximate the microphysics of clouds by relying on an assumed droplet size distribution. The droplet size distribution is typically described by a modified gamma distribution defined by Hansen and Travis (1974), and is given by:
where n(r) is the number of droplets of radius r and A is a normalisation constant. This distribution is characterised by two parameters: effective radius (re) and the effective variance (veff). Physically, re is defined as the area-weighted mean radius of the droplet population:
whereas veff is a dimensionless parameter representing the variance of the droplet size distribution normalised by :
where G is the total geometric cross-sectional area per unit volume. While re is explicitly retrieved from short-wavelength infrared reflectance, veff must be assumed (Martin et al., 1994), with this study setting this at a constant value veff=0.10 to align with the operational assumption employed by the MODIS Collection 6 retrieval algorithm for liquid clouds. This fixed assumption introduces a systematic bias, as the veff of a cloud varies significantly with aerosol loading (Martin et al., 1994), entrainment (Lim and Hoffmann, 2026), and precipitation onset (Miles et al., 2000). This is especially problematic when retrieving polluted clouds, as the relationship between the radiative properties and Nd is dependent on the dispersion parameter, k, which relates the volume mean radius (rv) to re (Martin et al., 1994):
As veff reduces, k increases, ultimately approaching unity. From Eq. (4) it is clear that by fixing veff, k is also essentially fixed. This has implications for deriving Nd, typically calculated via the adiabatic assumption (Grosvenor et al., 2018):
Here H=500 m is the fixed geometric cloud thickness, used consistently in both cloud generation and Nd derivation to convert LWP to mean liquid water content (LWC = LWP). If the true k of polluted clouds exceeds the assumed k in Eq. (5), the retrieval will systematically overestimate Nd. In contrast, LWP is relatively insensitive to the veff assumption. LWP is formulated as (Stephens, 1978)
and is thus linearly dependent on re and optical depth (τ) only. Therefore, LWP is only affected by secondary biases through re, and not directly biased by the veff assumption. As such, it is expected that LWP will be retrieved more robustly. Under the adiabatic assumption, Eqs. (5) and (6) are mutually consistent: substituting Eq. (6) into Eq. (5) recovers . As a sensitivity comparison, the legacy pre-Collection 6 assumption of veff=0.13 is also evaluated throughout this study.
2.2 Retrieval Principle
The retrieval of τ and re is commonly performed using the bi-spectral reflectance method set out by Nakajima and King (1990). This approach exploits the differing radiative properties of cloud droplets across the solar spectrum. A non-absorbing near-infrared band (0.86 µm) is used to obtain τ, as it is primarily sensitive to the cloud's total scattering cross section. For re, an absorbing shortwave infrared band (2.1 µm) is employed, due to the sensitivity of liquid water absorption to droplet radius.
The fixed veff assumption leads to a discrepancy between the scattering phase function assumed in the look-up-table generation and the true scattering behaviour of the observed cloud. The physical origin of this discrepancy lies in the calculation of the cloud's bulk scattering phase function, , where θ is the scattering angle and λ is the wavelength. This function is derived by integrating the single-droplet Mie scattering phase function, , over the entire cloud droplet size distribution, n(r), described in Eq. (1). The bulk scattering phase function is calculated as (Hansen and Travis, 1974):
where σscat is the scattering cross-section.
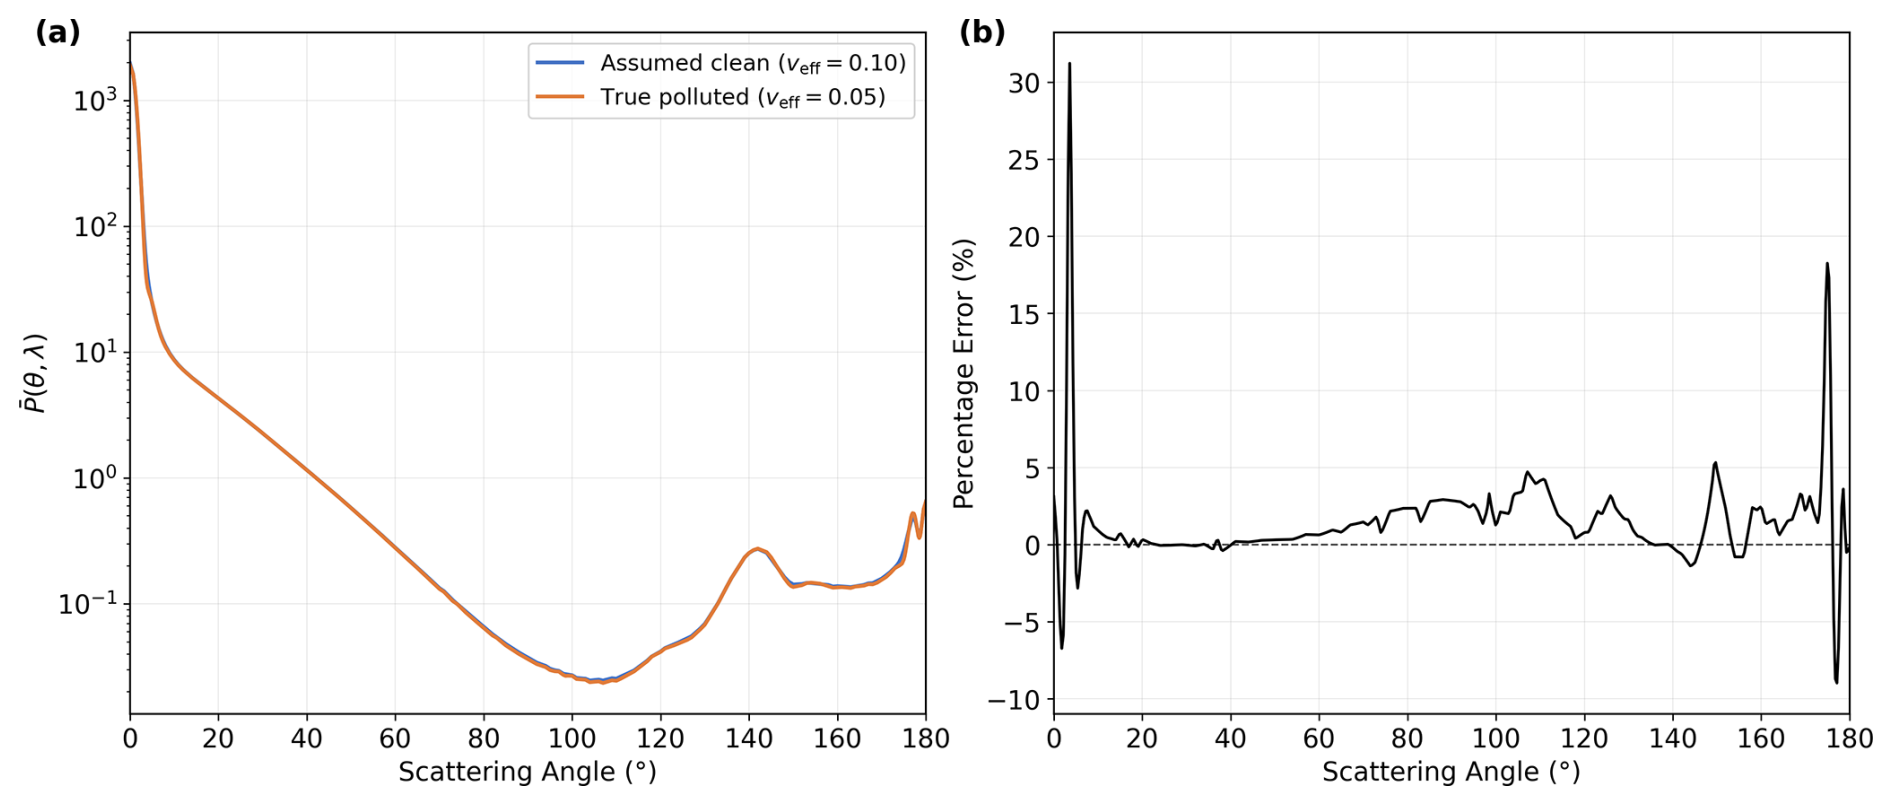
Figure 1(a) Comparison of the bulk scattering phase function, , evaluated at λ=0.86 µm for a droplet effective radius of 8 µm, for a true polluted cloud (veff=0.05) and the assumed clean cloud (veff=0.10). The y-axis is presented on a logarithmic scale. (b) The resulting percentage error in the phase function due to the fixed veff assumption.
As shown in Eq. (1), n(r) is a function of both re and veff, the resulting bulk scattering phase function, , is also dependent on both parameters. This is illustrated in Fig. 1, which compares the bulk scattering phase function calculated across the plausible range of assumed retrieval veff (0.10, shown here, and 0.13) against the true polluted veff=0.05; the discrepancy scales with the assumed–true mismatch, growing larger as the assumed value moves further from the true polluted state. Across most scattering angles (20–140°) the percentage error between the two phase functions remains below 5 %, but it grows sharply toward the forward-scattering and backscattering limits, reaching approximately +31 % near Θ≈5° and +18 % near Θ≈175°, where diffraction and glory features are most sensitive to the underlying droplet size distribution. This indicates that an algorithm with a fixed veff encountering a cloud with a different veff will assume a biased bulk phase function, thus misinterpreting the backscattered light intensity. This may lead to a systematic retrieval error.
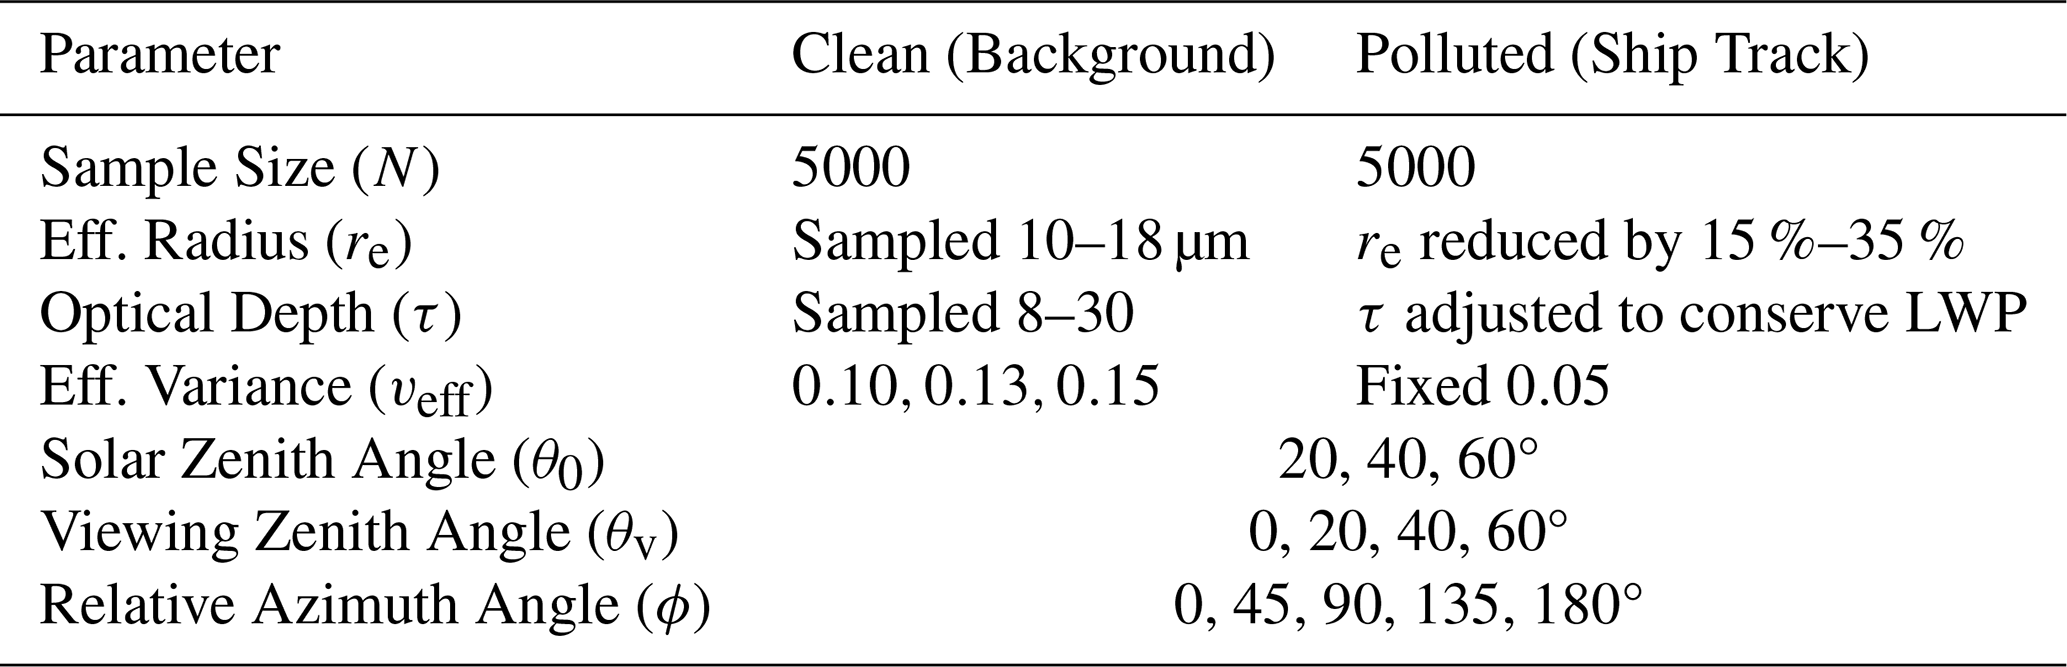
2.3 Data generation and forward simulation
A population of 5000 clean clouds is generated with properties randomly sampled from ranges of typical non-drizzling marine stratocumulus clouds (Wood, 2012), with re in the range 10–18 µm and τ in the range 8–30. This sample size ensures dense coverage of the operational lookup table (LUT) space. The veff for these clouds is assigned one of , a standard range for such clouds (Martin et al., 1994). For each clean case, a corresponding “polluted” case (representing a ship track) is generated by reducing re by a random factor between 15 %–35 % (Grosvenor et al., 2018) while adjusting τ in tandem to conserve LWP. This ensures that any change in radiative properties between the clean and polluted pair is due solely to the redistribution of water among a larger number of droplets. This is done to isolate the instantaneous Twomey effect from the adjustments. The polluted clouds are assigned a fixed veff=0.05 representing a strongly narrowed droplet size distribution as a lower bound to explore the maximum potential bias. While marine stratocumulus clouds generally exhibit broader distributions, the compilation of in-situ measurements by Miles et al. (2000) demonstrates that polluted air masses frequently produce highly narrowed distributions, including numerous recorded instances of the veff dropping below this bound. This choice is further supported by the empirical k-Nd relationship derived from aircraft observations by Lebsock and Witte (2023): at a typical ship-track droplet concentration of , their Combined Fit gives k≈0.84, which corresponds via Eq. (4) to veff≈0.05, with heavier pollution implying still narrower distributions.
Table 1Summary of microphysical properties and viewing geometries used to generate the synthetic cloud population. The polluted cases are derived directly from the clean control cases to conserve Liquid Water Path (LWP).
Radiative transfer simulations are run using the DISORT algorithm (Stamnes et al., 2000) in the libRadtran package (Emde et al., 2016) driven by the pyLRT python wrapper (Gryspeerdt and Driver, 2024) for the 5000 clean/polluted cloud pairs. For each case, the top-of-atmosphere (TOA) reflectance function R is calculated following the definition of Nakajima and King (1990):
where is the reflected intensity at the TOA, μ is the cosine of the viewing zenith angle, ϕ is the relative azimuth angle, μ0 is the cosine of the solar zenith angle, and F0 is the incident solar flux density. The simulations are performed for two standard MODIS bands centred at 0.86 and 2.1 µm, across a range of solar zenith angles (20, 40, 60°). Ranges of viewing zenith angle (0, 20, 40, 60°) and the relative azimuth angle (0, 45, 90, 135, 180°) are also chosen, to represent the full combination of observation geometries. The scattering angle, Θ, is related to the solar zenith angle (θ0), the viewing zenith angle (θv), and the relative azimuth angle (ϕ) by the spherical law of cosines:
The clouds are modelled as single, vertically homogeneous 1D plane-parallel slabs with a geometric thickness of 500 m, a reasonable value for marine stratocumulus (Wood, 2012). The microphysical properties are determined using pre-calculated lookup tables generated using the libRadtran Mie tool (Emde et al., 2016). For these calculations, the cloud droplet size distribution is modelled using the modified gamma distribution defined in Eq. (1). Within the libRadtran Mie tool, the shape of this distribution is dictated by the parameter α, which corresponds to the exponent of the r term in Eq. (1) and is related to veff by Hansen (1971):
Each lookup table contains the bulk optical properties required to solve the radiative transfer equation: the extinction efficiency, single scattering albedo and the angular scattering phase function over a grid of re and wavelengths. Table 1 summarises the microphysical properties and viewing geometries used to generate the synthetic cloud population.
2.4 Retrieval Simulation
The simulated retrieval of cloud properties from the simulated reflectances mimics MODIS retrievals in two spectral bands (King et al., 1997). This is achieved by mapping TOA reflectances to re and τ onto a Nakajima-King grid (Nakajima and King, 1990). For the simulated retrieval, the grid in Fig. 2 is generated using the assumed veff of 0.10. The retrieval LUT spans effective radii from 2.0 to 20.0 µm in steps of 0.1 µm, and optical depths from 0.5 to 61, with a finer spacing of 0.25 between τ=0.5 and τ=10 to resolve the non-linear curvature of the Nakajima–King retrieval surface and coarser steps of 1.0 for τ>10 where reflectance saturates, following the variable-resolution LUT design used operationally for other bi-spectral retrievals (Liu et al., 2023). The LUT covers the same angle grid used for the forward simulations (SZA: 20, 40, 60°; VZA: 0–60°; RAZ: 0–180°). Cloud properties are retrieved by trilinear interpolation across viewing geometry, followed by linear interpolation within the Delaunay triangulation of the two-dimensional reflectance grid at each geometry node. The fixed veff assumption creates a systematic physical inconsistency when the veff of clouds varies, especially in cases such as ship tracks where veff can undergo a dramatic reduction (Martin et al., 1994; Miles et al., 2000). The percentage bias is calculated as the relative difference between the properties retrieved using the assumed veff=0.10 and the true properties used to generate each synthetic cloud. This study adopts veff=0.10 as its central retrieval baseline, in line with the current MODIS Collection 6 algorithm, which was revised from a previous value of 0.13 to better align with multi-angle observations (Platnick et al., 2016). The legacy veff=0.13 assumption is retained throughout as a secondary sensitivity comparison, since it maximises the contrast between the assumed and true polluted state veff (0.05) and thus provides an upper-bound estimate for the retrieval bias relative to current operational algorithms. Importantly, this fixed-variance bias is bidirectional; while both the 0.10 and 0.13 baselines systematically bias the narrowed polluted clouds, tuning an algorithm to assume the narrowed 0.05 state would invert the problem, introducing a bias into the retrieval of the unpolluted background clouds.
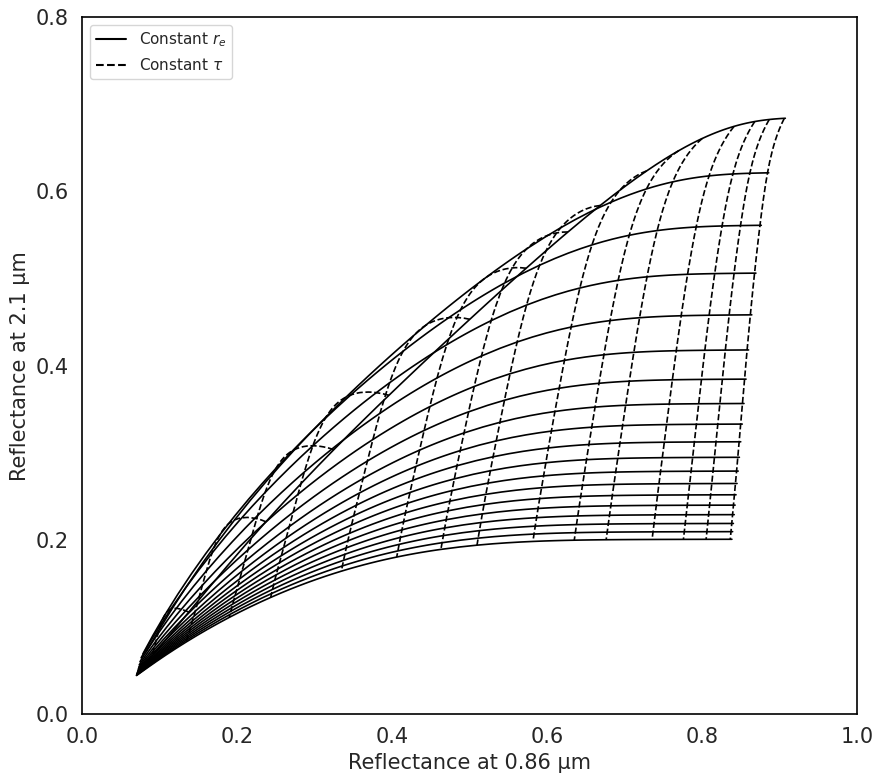
Figure 2Nakajima-King retrieval grid representing the central operational assumption (veff=0.10), evaluated at SZA =40°, VZA =0°, RAZ =0°. The grid maps the top-of-atmosphere reflectances at 0.86 and 2.1 µm to a unique solution for τ (dashed lines) and re (solid lines).
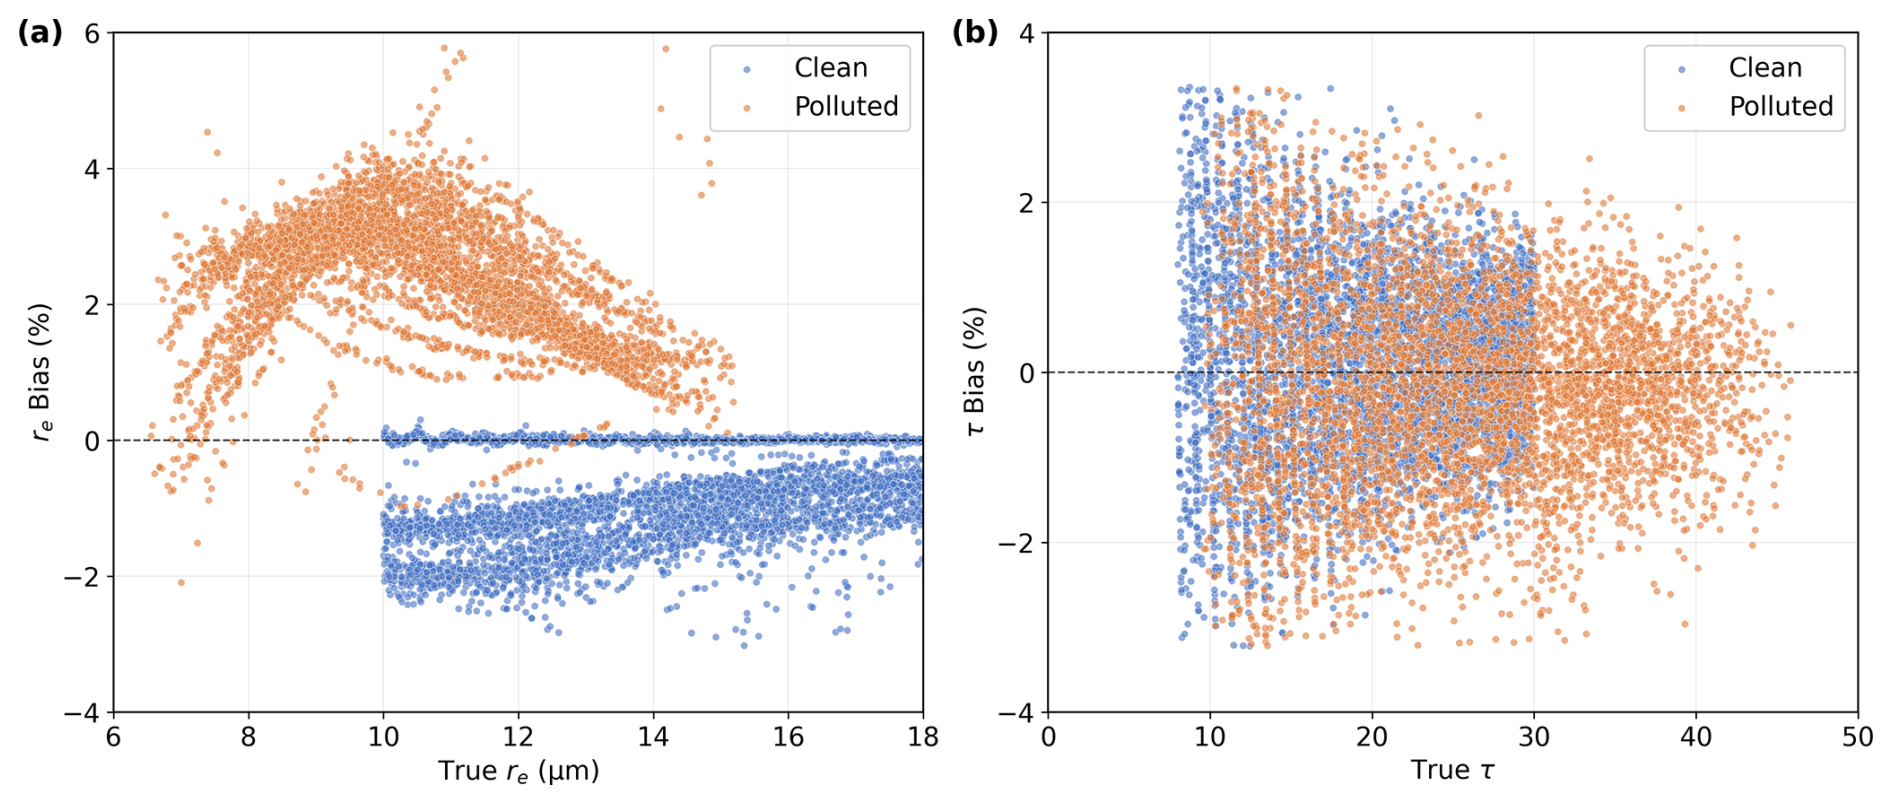
Figure 3The percentage bias in retrieved (a) re and (b) τ as a function of their true values, for clean (orange) and polluted (blue) clouds. All viewing geometries are included; for display clarity, points outside the 1st–99th percentile of each bias variable are omitted, while all statistics quoted in the text are computed on the unfiltered population.
3.1 Bias in Direct Retrieval Products (re, τ)
The retrieval bias is first quantified for the directly retrieved variables, re and τ, using the central veff=0.10 retrieval baseline. Figure 3 displays the percentage bias retrieved re and τ as a function of the true re and τ, respectively. The two regimes, clean and polluted, are clearly separated by bias magnitude in re, but negligible bias is shown for τ in both regimes. For τ, the mean percentage bias in clean clouds is 0.07 % and in polluted clouds −0.15 %. It is shown in Fig. 3 that optically thin clouds have a wider bias distribution in both regimes, with potentially compensating errors causing mean bias to be small. For re clean clouds, bias is negligible, with three distinct clusters.
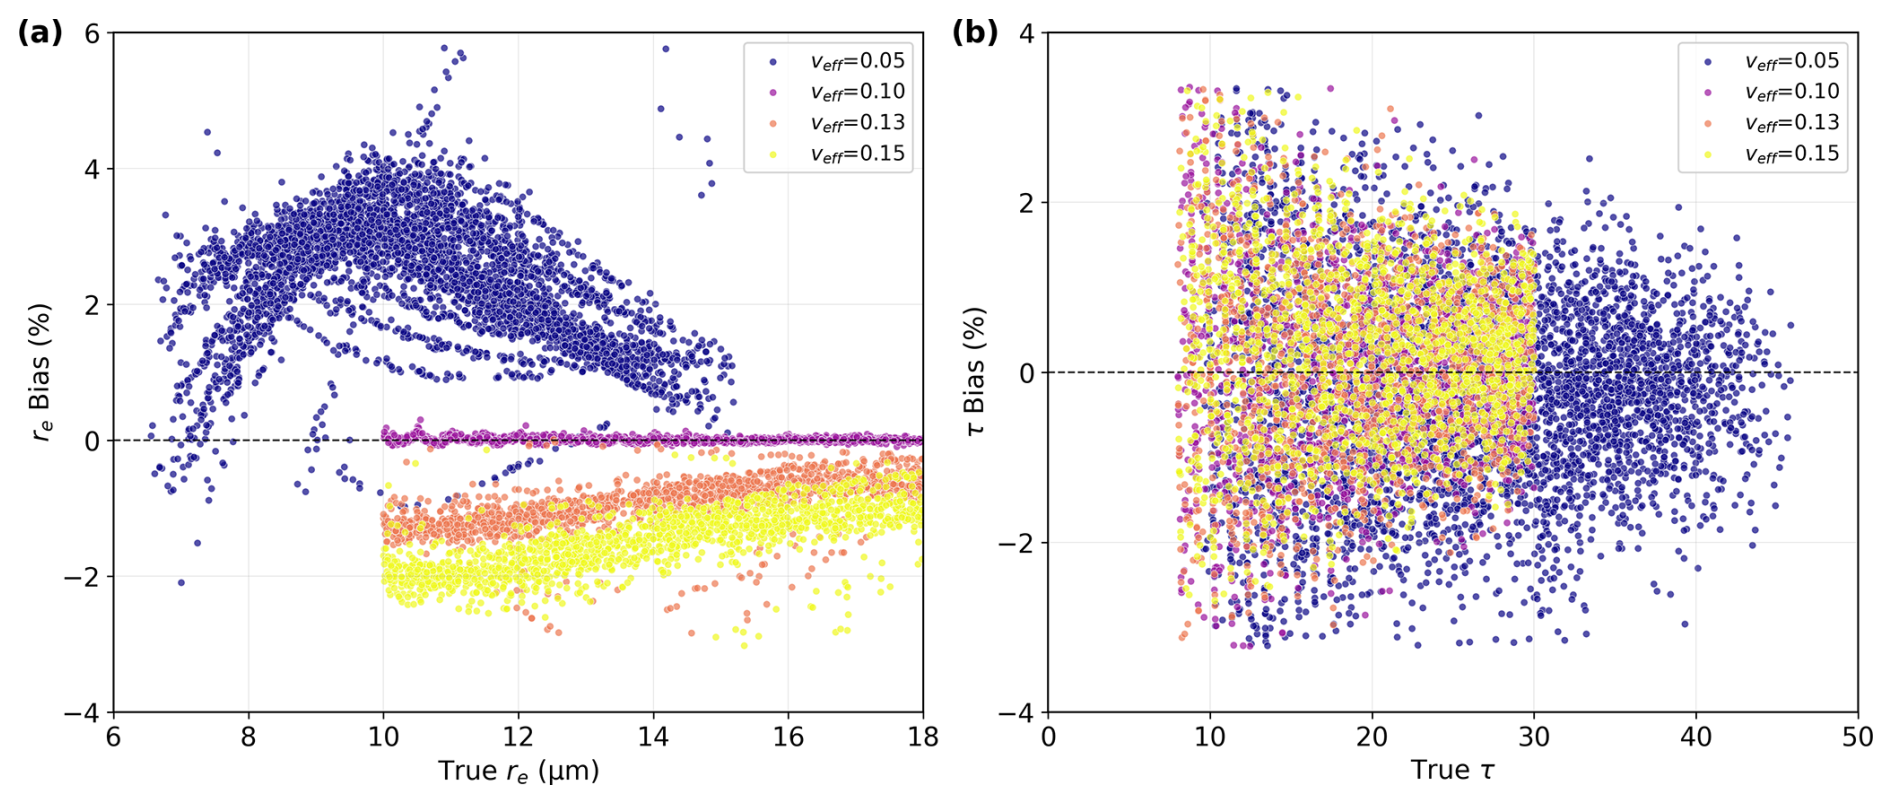
Figure 4The percentage bias in retrieved cloud properties as a function of their true values, coloured by effective variance (veff). (a) effective radius (re) and (b) optical thickness (τ). Note the distinct clustering of bias based on the underlying distribution width, with veff=0.10 (the retrieval assumption) centred on the zero-bias line. All viewing geometries are included; points outside the 1st–99th percentile of each bias variable are omitted for display clarity, while quoted statistics use the unfiltered population.
Figure 4 demonstrates that the data points are clustered by veff, with the retrieval baseline 0.10 clustered around the 0 % bias line and 0.13 and 0.15 biases calculated as −1.05 % and −1.56 %, respectively. Thus, the mean bias in the retrieved re of clean clouds is calculated to be −0.87 % (averaged over the synthetic population as defined in Sect. 2.3). Polluted clouds, however, show a more substantial bias percentage with a mean bias of 2.30 %. This occurs because a polluted cloud transition is assumed to involve a simultaneous increase in τ to maintain a constant LWP as re decreases. The discrepancy in the true veff state explains why the bias profiles for the clean and polluted regimes remain distinct, even when compared to the same re value. As a sensitivity comparison, adopting the legacy veff=0.13 baseline instead nearly doubles the polluted re bias to 3.43 %, since the contrast with the true polluted state (veff=0.05) is larger. It is shown in Fig. 4b that the specific veff value has little effect on τ bias, which is to be expected given τ is known to be insensitive to the shape of the droplet size distribution.
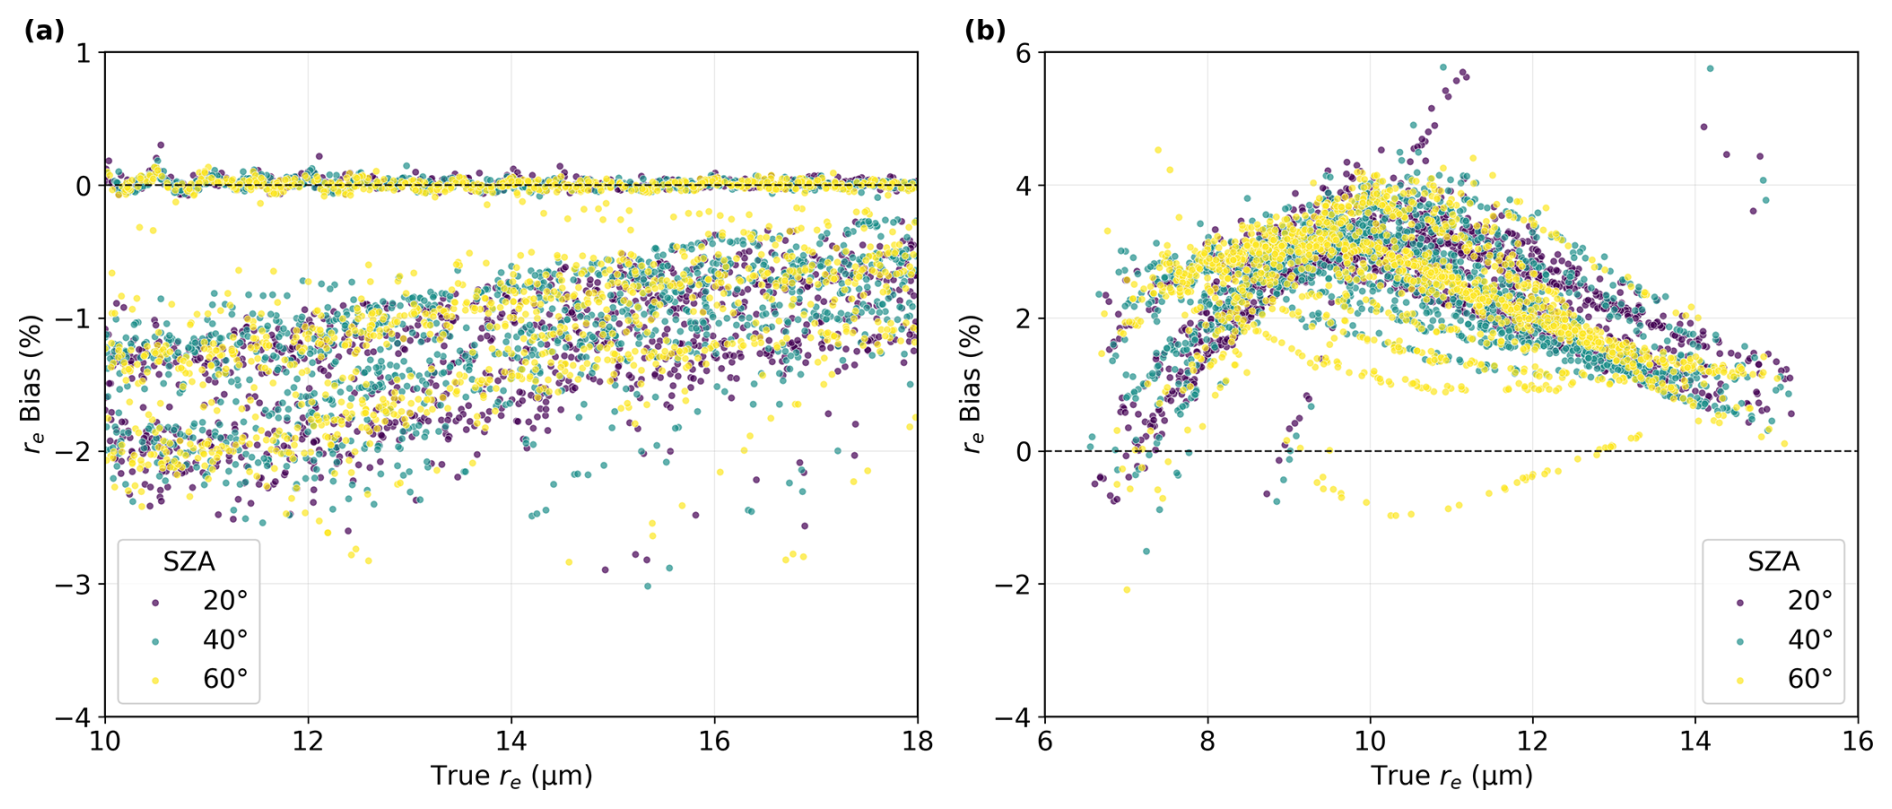
Figure 5The percentage bias in retrieved effective radius (re) coloured by Solar Zenith Angle (SZA). Clean clouds show negligible angular dependence. Polluted clouds show a secondary dependence on scattering geometry, with lower SZA exhibiting slightly higher bias than higher SZA. All viewing geometries are included; points outside the 1st–99th percentile of each bias variable are omitted for display clarity, while quoted statistics use the unfiltered population.
The sensitivity of the bias to SZA in the polluted re regime is further investigated, as shown in Fig. 5. In Fig. 5a the clean clouds are shown coloured by three chosen values of SZA, 20, 40, and 60°. The data shows that for clean clouds, the mean bias changes by 0.09 % as the sun moves from 20 to 60°. Thus, it is concluded that there is no significant contribution to the bias from SZA. Figure 5b, showing the polluted regime, however, displays more separation due to SZA. Analysing the contribution to the mean re of each SZA value shows this is a secondary contribution to the overall bias, with a mean bias of 2.47 %, 2.41 %, and 2.00 % for SZA values 20, 40, and 60° respectively. This small SZA dependence arises from the change in scattering angle observed by the satellite, changing the discrepancy between the assumed and true phase functions. This demonstrates that lower SZA have an increased bias over higher SZA, but the mean effect is quite small and can be ignored in the context of the veff bias.
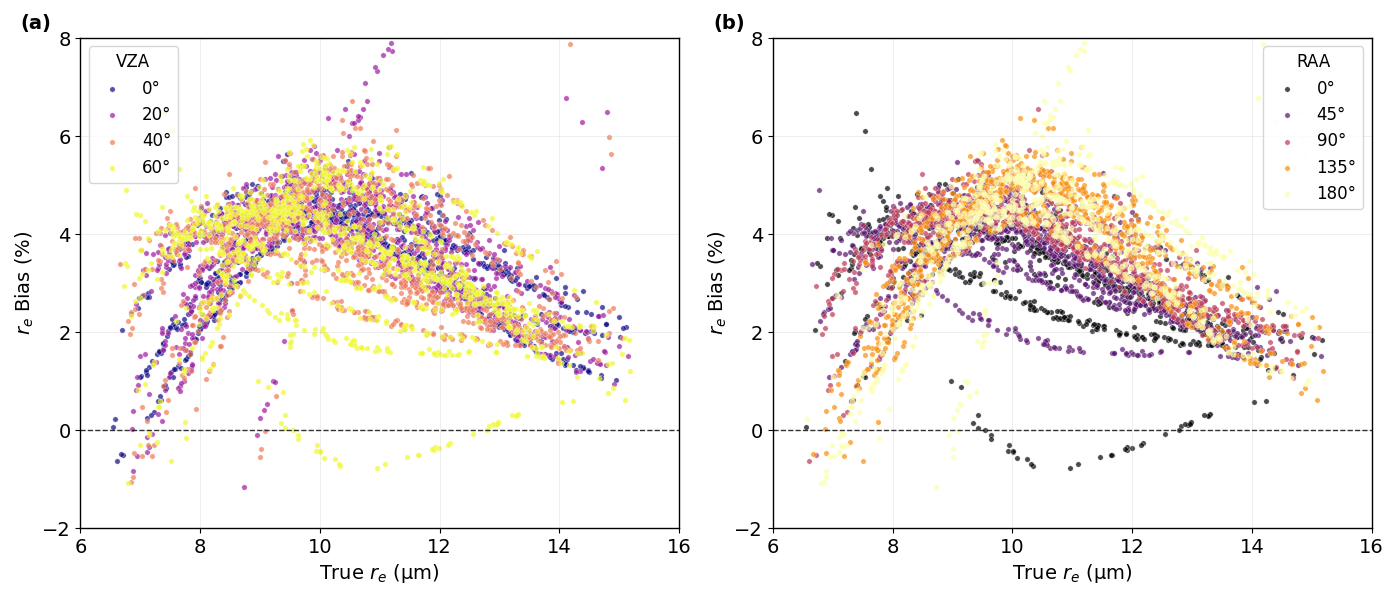
Figure 6The percentage bias in retrieved effective radius (re) coloured by Viewing Zenith Angle (a) and Relative Azimuth Angle (b). (a) Clouds show little angular dependence with VZA =60° showing higher variance than other angles. (b) Clouds show little mean dependence on RAA, though variance increases at RAA =180°. Polluted clouds only; points outside the 1st–99th percentile of each bias variable are omitted for display clarity, while quoted statistics use the unfiltered population.
The sensitivity of re to Viewing Zenith Angle (VZA) and Relative Azimuth Angle (RAA) in the polluted regime is demonstrated in Fig. 6. It is found that the overestimation of re is consistent at approximately 2.4 % at all VZA, aside from VZA =60° at 1.84 %. It is important to note that while the mean bias shows a small decrease at VZA =60° the precision degrades, with the standard deviation increasing to 4.97 % from 0.8 %–2.1 % for the other geometries. The bias shows a small dependence on RAA, ranging from 2.01 %–2.64 %. The precision of the retrievals is stable across most azimuths, although the standard deviation increases to 5.97 % at RAA =180°, coinciding with the backscatter geometries (Θ→180°) discussed further in Sect. 3.2; RAA remains a secondary driver of bias compared to the veff induced retrieval bias.
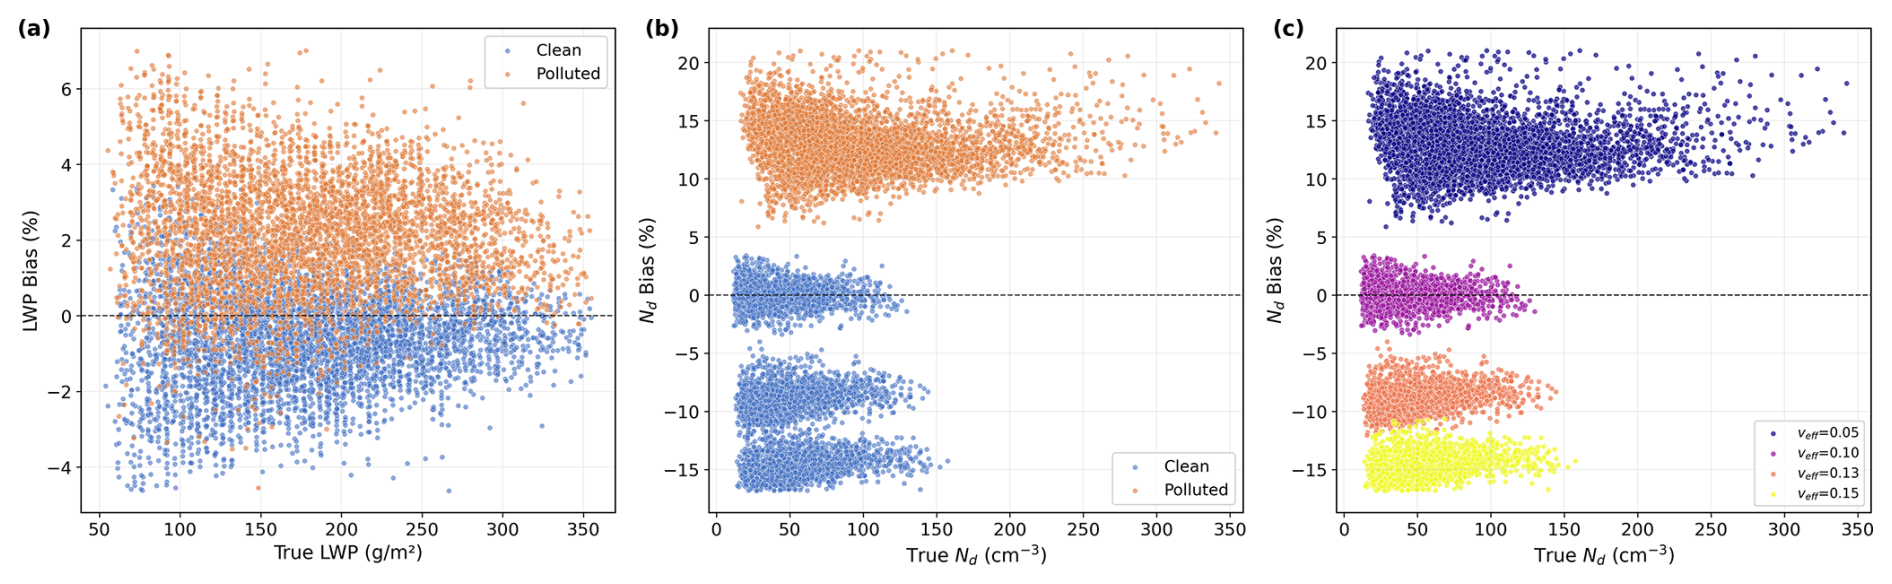
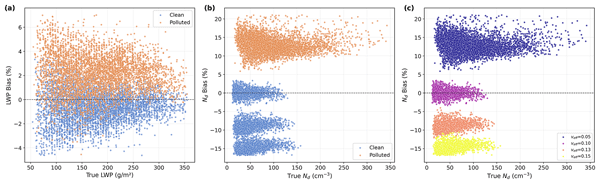
Figure 7The percentage bias in derived cloud products as a function of their true values for clean (orange) and polluted (blue) regimes. (a) Liquid Water Path (LWP) shows a small, unstructured bias. (b) Droplet Number Concentration (Nd) shows systematic overestimation in the polluted regime. (c) Percentage bias in retrieved Nd coloured by effective variance (veff). Deviations from the assumed veff=0.10 drive the error, with narrow distributions (veff=0.05, dark blue) causing significant overestimation, and broad distributions (veff=0.15, yellow) causing underestimation. All viewing geometries are included; points outside the 1st–99th percentile of each bias variable (including the Nd outliers exceeding 1200 % discussed in the text) are omitted for display clarity, while quoted statistics use the unfiltered population.
3.2 Bias in Derived Products (LWP, Nd)
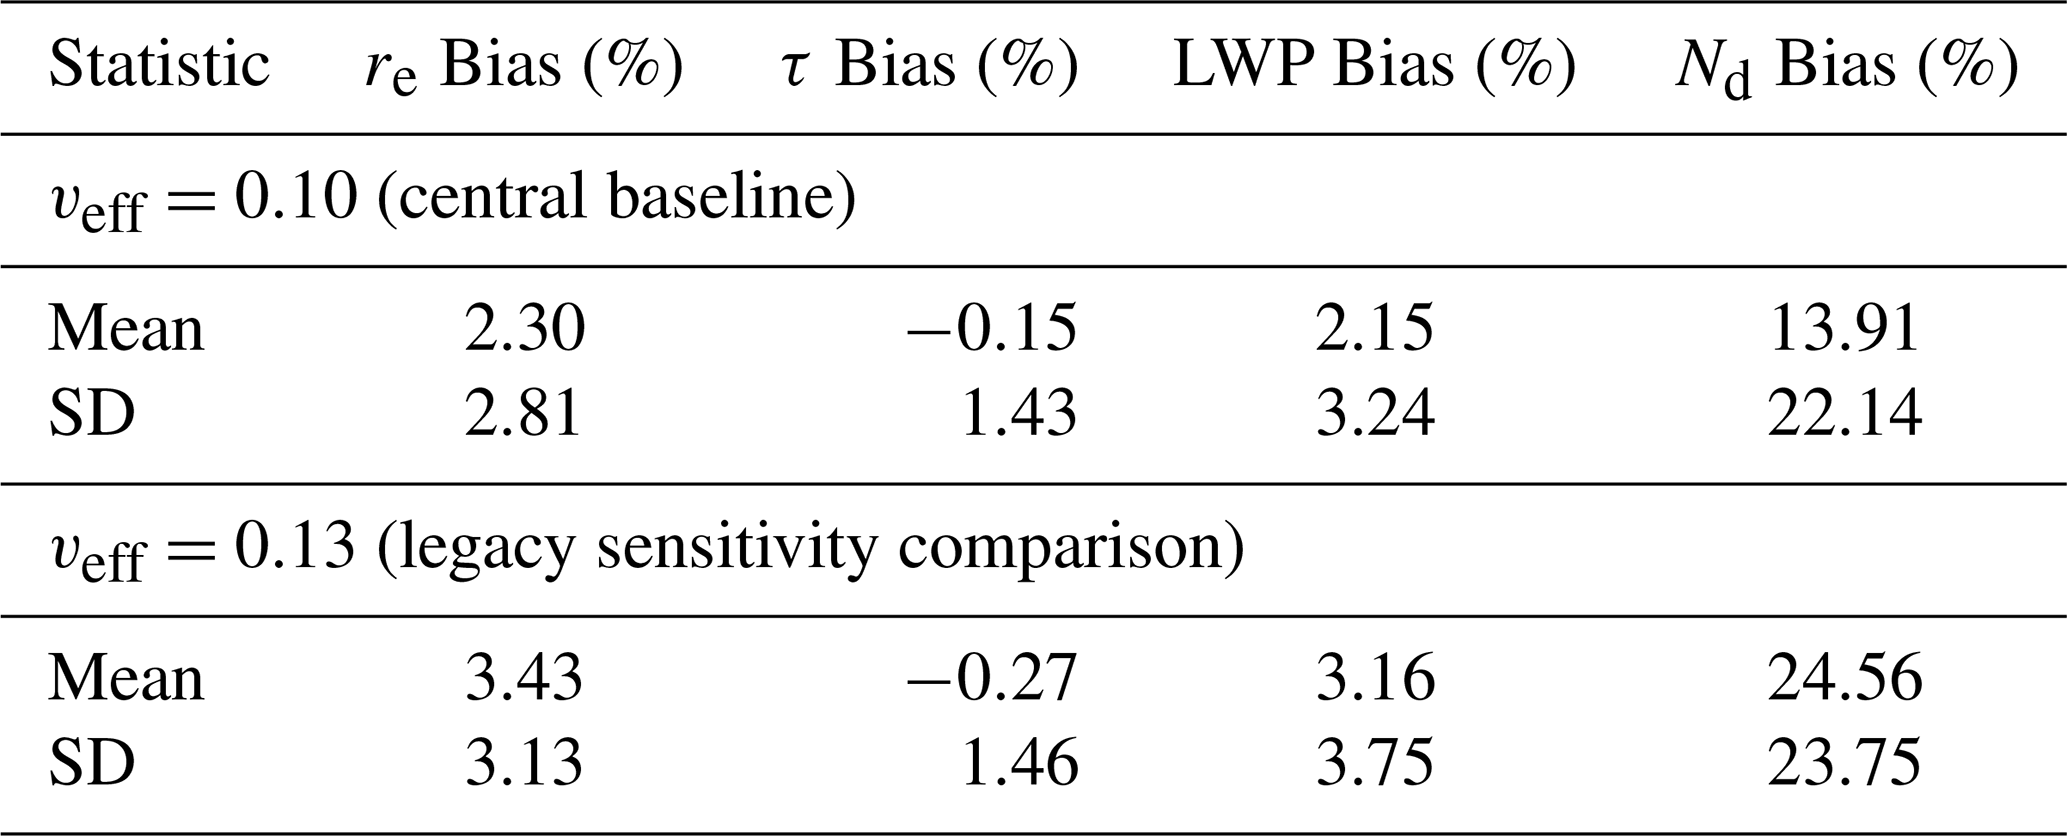
As discussed in Sect. 2.1, LWP and Nd products are derived from the directly retrieved products. The errors in re and τ propagate to the derived variables LWP and Nd and are amplified or dampened depending on their specific functional form. LWP is calculated using the linear relationship shown in Eq. (6). Due to the linear relationship between re and τ in LWP, the bias is of a similar magnitude to re but is slightly damped due to the small negative error in τ. Figure 7a illustrates the distribution of bias against the true LWP amount for clean and polluted clouds. The non-linearity in re seen in Fig. 3a is lost through the propagation, with the distribution appearing unstructured. The mean bias in the polluted regime is calculated to be 2.15 %, slightly less than the re bias due to the small compensating bias in τ. This indicates that LWP is relatively robustly retrieved with respect to uncertainties in veff, with the wrongly assumed droplet size distribution having a small effect on bulk water content. The response of Nd, however, is much more severe due to its direct dependence on k defined in Eq. (4), which is, in turn, a function of veff. Nd is proportional to , meaning that the overestimation of re exerts a negative pressure on the derived Nd, causing an underestimation of the concentration. Nd is inversely proportional to the k parameter. The baseline retrieval assumes a distribution of 0.10 corresponding to a lower value of k (kassumed≈0.72). However, the true polluted cloud has a narrower distribution, corresponding to a k value closer to unity (ktrue≈0.86). The artificially small kassumed causes the algorithm to overestimate the concentration of droplets due to the inverse dependence on k. This overestimation is illustrated in Fig. 7b. A clear separation is seen between the clean and the polluted regime, with a substantial overestimation being seen in the polluted cases. This overestimation is calculated to be a mean bias of 13.91 %, a large error. It is noted that the standard deviation of this bias is quite large at ±22.14, showing that the precision is relatively low, with the possibility of excessively high bias in some Nd retrievals. As a sensitivity comparison, adopting the legacy veff=0.13 baseline instead produces a substantially larger polluted Nd bias of 24.56 % (±23.75 %), since the contrast with the true polluted state (veff=0.05) is greater; the central veff=0.10 baseline therefore roughly halves, but does not eliminate, the Nd overestimation relative to the legacy assumption.
Separation can also be seen in the clean regime of Fig. 7b. Figure 7c displays Nd bias coloured by veff, and illustrates that there is not only substantive bias in the polluted regime, but also clean regime veff values that do not align with the algorithm assumption. Clouds with a veff of 0.13 have their droplet number concentration underestimated by an average of 8.26 %, whereas clouds with a veff of 0.15 are underestimated by 14.51 %. This not only shows that fresh ship tracks with a very narrow distribution have their Nd significantly overestimated, but that clean clouds broader than the assumed baseline have their Nd correspondingly underestimated. Evaluating this range of veff values allows for a bounding of the bias associated with the fixed veff assumption. Although this bias range is substantial, this indicates that Nd is highly sensitive to discrepancies between the assumed and true veff values.
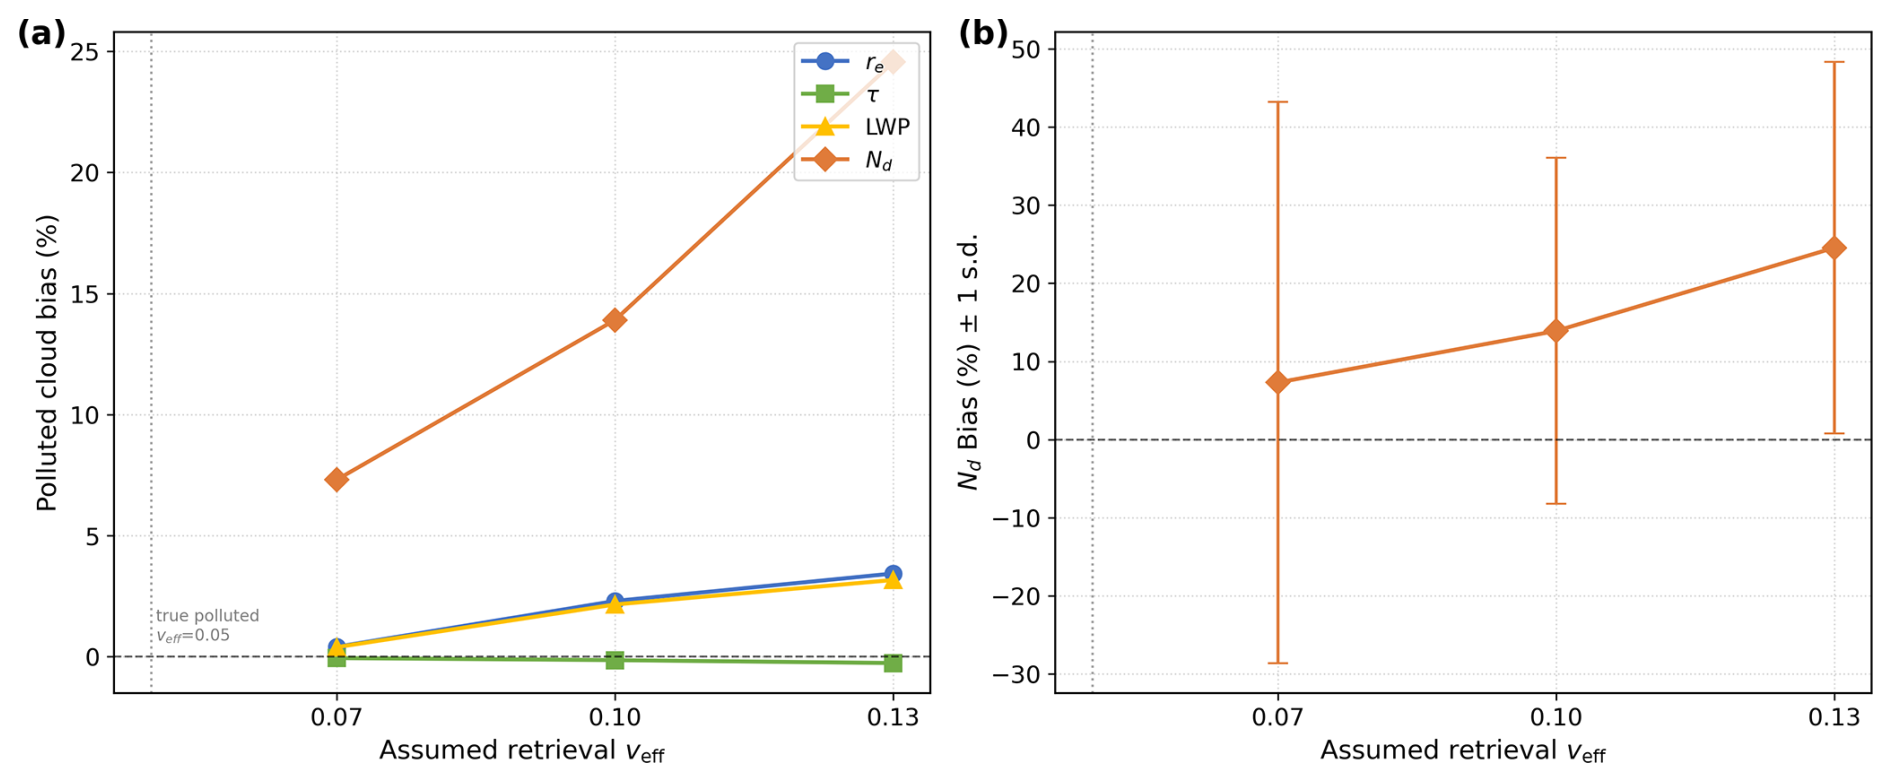
Figure 8Sensitivity of polluted-cloud retrieval bias to the assumed retrieval veff (0.07, 0.10, 0.13), relative to the fixed true polluted state veff=0.05 (dotted line). (a) Mean percentage bias in re, τ, LWP, and Nd. (b) Mean Nd bias ± one standard deviation. The raw standard deviation increases toward low assumed veff due to amplification of the extreme-geometry tail, while the 1st–99th percentile core of the distribution narrows (see text). Statistics are computed on the full unfiltered polluted population across all viewing geometries, including outliers.
Further analysis of the Nd retrieval bias reveals the scattering angle (Θ) has a strong influence on the bias variance. For the vast majority of the simulated polluted clouds, the Nd overestimation varies between a minimum of +11.8 % (Θ≈152°) and a maximum of +36.6 % at the backscatter peak (Θ=180°). At this geometry, the re bias drops to −0.30 %, removing the compensating bias effect of the term and maximising the error driven by k. Outlier analysis indicates that at extreme swath-edge geometries in the forward-scattering regime (e.g., SZA =60°, VZA =60°, Θ=60°), the retrieval algorithm becomes highly unstable. At these specific angles the algorithm occasionally underestimates re by over 70 %, which due to the inverse-cube dependence, yields overestimations of Nd exceeding 1200 %. These extreme outliers are rare: across the full synthetic population of ∼ 10 000 cases, approximately 0.01 % (one case) exceeds the 1200 % threshold, and excluding it shifts the mean polluted Nd bias by less than 0.3 percentage points (from 13.91 % to 13.63 %), confirming the mean estimate is robust to outlier removal. Nonetheless, the single outlier and the broader heavy tail drive the standard deviation to ±22.14 %. Standard quality-control filters on retrieved re and τ do not remove this case, as it falls within physically plausible retrieval bounds. Dedicated geometric filtering of extreme forward-scattering angles is required. These geometries are not confined to the synthetic experiment. MODIS views up to viewing zenith angles of approximately 60–67° at swath edge. Combined with solar zenith angles around 60°, common outside near-noon overpasses, this range includes the forward-scattering geometry identified here. A practical filter would flag retrievals with both high viewing zenith angle and low scattering angle, matching the specific combination shown above to produce the largest bias.
Table 2 summarises the bias statistics for each variable with their standard deviations, for both the central veff=0.10 baseline and the legacy veff=0.13 sensitivity comparison.
Table 2Mean and standard deviation of percentage bias for polluted clouds, under the central veff=0.10 retrieval baseline and the legacy veff=0.13 sensitivity comparison. Statistics are computed on the full unfiltered polluted population across all viewing geometries, including outliers.
3.3 Sensitivity to the Assumed Retrieval veff
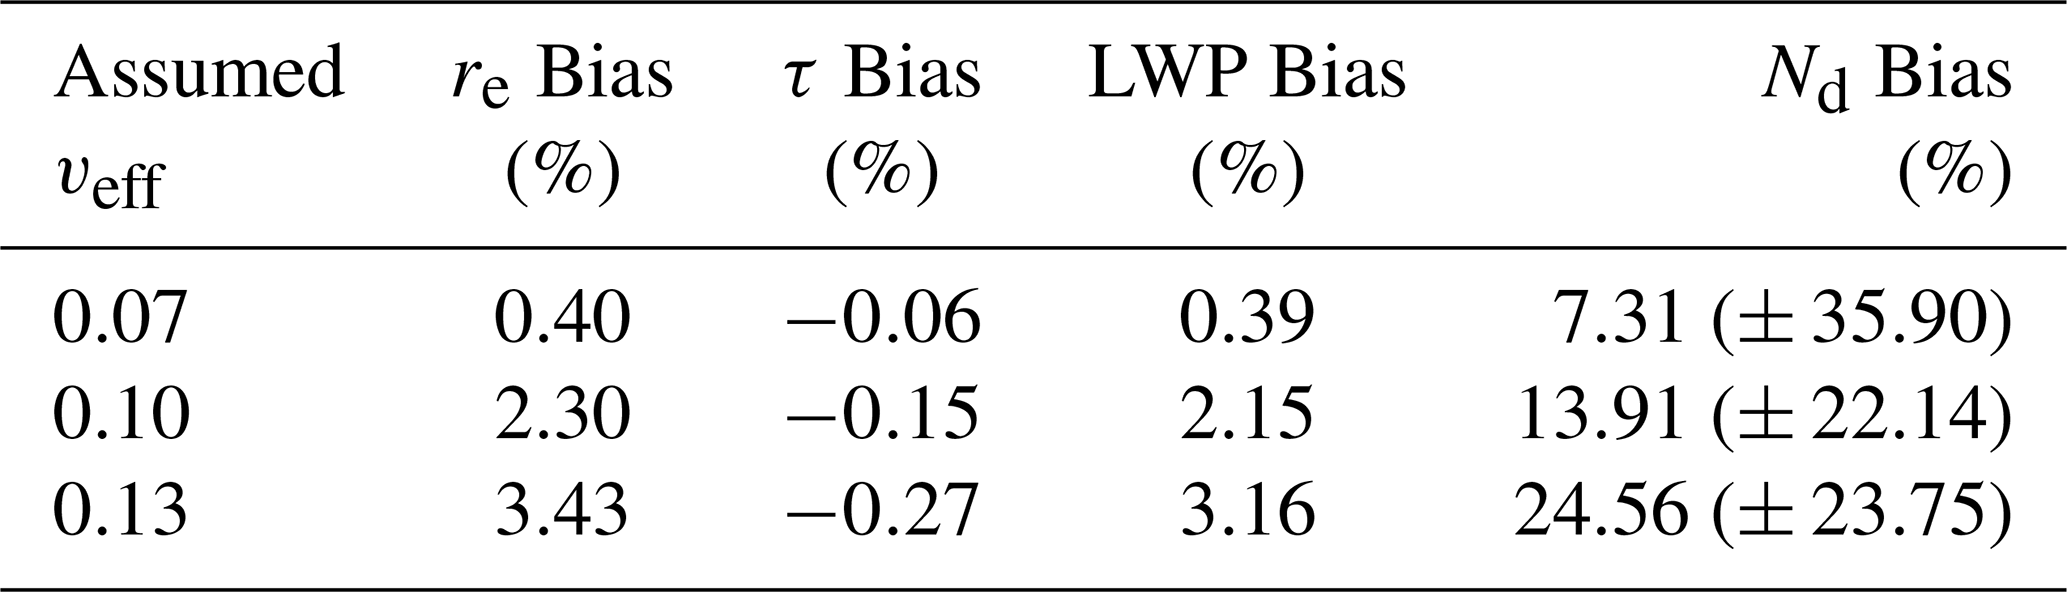
The results above compare only two discrete points on the assumed-veff axis: the current MODIS Collection 6 baseline (0.10) and the legacy pre-Collection 6 assumption (0.13). To characterise how the bias scales continuously as the assumed veff approaches the true polluted state (veff=0.05), the retrieval is repeated for an intermediate assumption of veff=0.07, using the same synthetic cloud population and viewing geometry as the 0.10 and 0.13 cases. Figure 8a shows that all four bias metrics decrease monotonically as the assumed veff is reduced toward the true polluted value: the polluted Nd bias falls from 24.56 % (veff=0.13) to 13.91 % (veff=0.10) to 7.31 % (veff=0.07), while re and LWP bias fall from approximately 3.4 % and 3.2 % to 0.4 % and 0.4 %, respectively, over the same range. This confirms that the magnitude of the fixed-veff bias scales with the discrepancy between the assumed and true polluted veff, rather than being an artefact specific to either baseline examined above. Notably, Fig. 8b shows that the raw standard deviation of the Nd bias does not fall monotonically alongside the mean: it increases from ±22.14 % (veff=0.10) to ±35.90 % (veff=0.07) despite the smaller mean bias. This increase is driven almost entirely by the heavy tail of extreme-geometry cases discussed in Sect. 3.2, rather than by a broad loss of precision: when the 1st–99th percentile core of the distribution is considered, the spread in fact narrows monotonically, with standard deviations of 1.7 %, 2.5 %, and 3.4 % for assumed veff of 0.07, 0.10, and 0.13, respectively. The amplification of the tail is consistent with k(veff) becoming increasingly steep at low veff (Eq. 4), such that the small number of severely biased re retrievals at extreme forward-scattering geometries translate into proportionally larger fluctuations in k, and hence Nd, as the assumed distribution narrows. Table 3 summarises the sweep.
Table 3Polluted-cloud bias statistics across the assumed retrieval veff sweep (true polluted veff=0.05 throughout). Statistics are computed on the full unfiltered polluted population across all viewing geometries, including outliers.
3.4 Sensitivity to Uncertainty in the True veff–Nd Relationship
The analyses above, in common with the polluted-cloud population as a whole, assign every polluted case a fixed true veff=0.05, regardless of its true Nd. This is a deliberate idealisation that isolates the retrieval bias from any assumption about how strongly droplet dispersion and concentration actually covary in nature, but it also means the reported bias magnitudes implicitly assume a perfect, noise-free correspondence between a cloud's true Nd and its true veff. Empirical k-Nd relationships derived from aircraft data, including the fit underlying Lebsock and Witte (2023), are subject to considerable scatter about their central curve, and the strength of this coupling may be weaker than the fitted relationship alone would suggest. It is therefore necessary to investigate how robust the reported bias magnitudes are if the true veff-Nd coupling is much noisier than the deterministic case assumed above. The strength of this coupling may also depend on scale. This study's paired ship-track construction implicitly assumes that factors other than the aerosol perturbation are held fixed between the clean and polluted cases. If this assumption does not hold in practice, for example if meteorology or background aerosol still varies somewhat within a pair, the weak aggregate k-Nd correlation seen in aircraft data may also be relevant at the individual ship-track scale, not only as a diluted, large-scale artifact. This motivates testing the weaker coupling case as a plausible scenario rather than only as a conservative bound.
To test this, the fixed true veff=0.05 assigned to each polluted case is replaced with a true k drawn from the Lebsock and Witte (2023) Combined Fit curve evaluated at that case's true Nd, plus Gaussian scatter calibrated so that the resulting correlation between true k and true Nd falls to r≈0.10. This value is chosen as a bounding case rather than derived from a specific dataset; the qualitative conclusion below is not sensitive to the precise value chosen, only to the fact that the coupling is much weaker than deterministic. The scatter is clipped to a physically plausible range for cloud droplet spectra (veff≲0.3) before recomputing the true Nd from the true re and τ. This procedure holds the retrieved quantities (re, τ, and hence Nd retrieved) fixed at their values from the original forward-simulated retrieval, since these depend on the true top-of-atmosphere reflectances, which were generated at veff=0.05 and are not recomputed here. The result below should therefore be read as a bound on how sensitive the reported bias magnitudes are to the assumed strength of the veff-Nd coupling, rather than as a fully independent re-simulation.
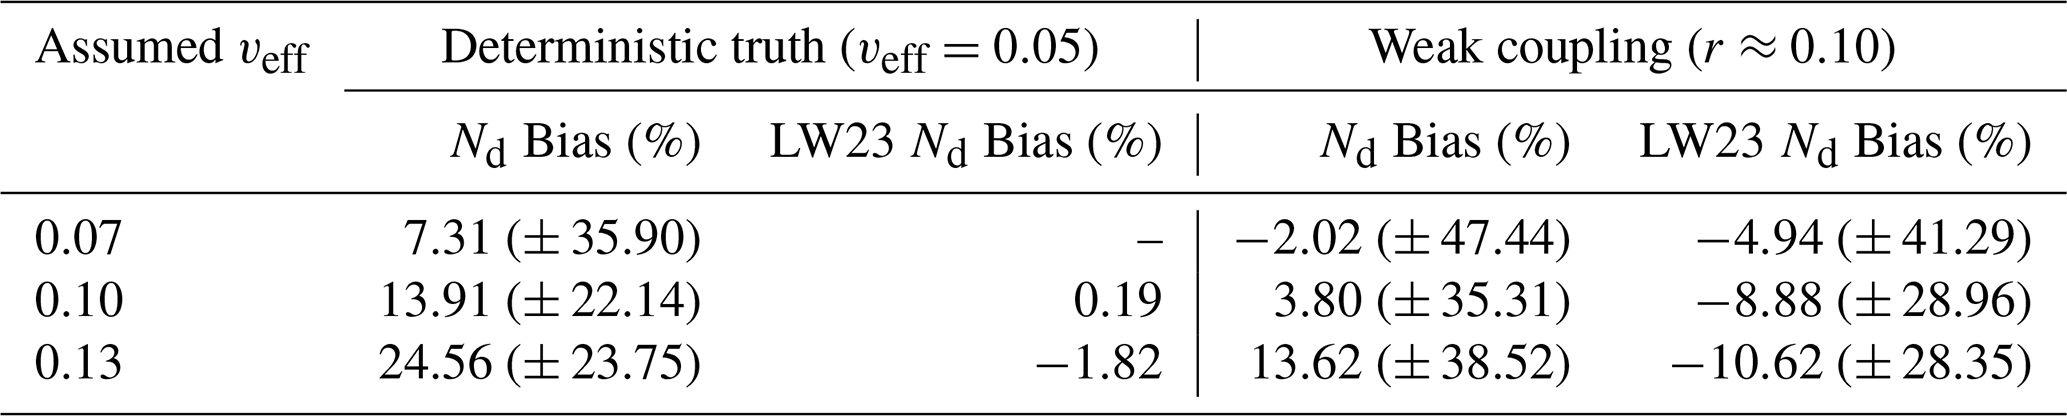
Table 4 compares the deterministic-truth bias statistics already reported in Table 3 against this weak-coupling case (r≈0.10, mean noisy true veff≈0.08, standard deviation ≈0.08). The mean polluted Nd bias falls substantially under the weaker coupling relative to the deterministic case at every retrieval baseline (13.91 % to 3.80 % at veff=0.10; 24.56 % to 13.62 % at veff=0.13), and the standard deviation increases by roughly 50 %–100 % at every baseline. The Lebsock and Witte (2023) correction, which reduced the deterministic-truth bias to near zero (Sect. 4), instead systematically overcorrects by 5–11 percentage points under the weaker coupling. The apparent success in the deterministic case follows, in part, from testing the correction against a truth constructed from the same curve it corrects toward. This indicates that the polluted Nd bias magnitudes reported throughout this study, and the apparent effectiveness of the Lebsock and Witte (2023) correction, are best interpreted as an upper bound that assumes a tight coupling between droplet dispersion and concentration. If the true coupling is closer to the weaker correlation tested here, both the bias and the benefit of correcting for it are smaller and less certain than the deterministic case alone would suggest.
Table 4Polluted-cloud Nd bias statistics under the deterministic true veff=0.05 assumption used throughout this study, compared against a weak-coupling case in which the true veff-Nd relationship is calibrated to r≈0.10 (see text). LW23 = after applying the Lebsock and Witte (2023) correction.
The results of this study identify a systematic retrieval bias relevant to the ongoing challenge of constraining aerosol-cloud radiative forcing. While Forster et al. (2021) and Gryspeerdt et al. (2020) report improved convergence between observation-based and model-based ERFaci estimates, the uncertainty range remains large and retrieval assumptions such as fixed veff represent a tractable source of systematic error in observation-based assessments (Bellouin et al., 2020; Quaas et al., 2008). While the sensitivity of Nd retrievals to assumptions about the droplet size distribution has been identified as a potential source of uncertainty (Grosvenor et al., 2018; Brenguier et al., 2000), its impact on highly polluted regimes, such as ship tracks, has remained poorly constrained. The finding that the standard retrieval may overestimate Nd by approximately 14 % in polluted regimes under the current MODIS Collection 6 veff=0.10 assumption, rising to in excess of 24 % under the legacy veff=0.13 assumption, suggests that, if the degree of spectral narrowing assumed here is representative, this bias could contribute to an overestimation of the microphysical sensitivity of clouds to aerosol perturbations in satellite derived datasets. Such a systematic bias would affect the interpretation of susceptibility metrics () used to constrain climate models (Quaas et al., 2009). This analysis suggests that in high-aerosol, narrow-variance regimes, this susceptibility could be artificially inflated by the fixed variance assumption used in standard operational algorithms (King et al., 1997). Correcting for this bias would be expected to flatten the derived susceptibility slope, potentially bringing observational constraints into closer alignment with more moderate estimates produced by models (Bellouin et al., 2020; Liu et al., 2008). As discussed previously, MODIS Collection 6 has transitioned from a veff value of 0.13 to 0.10, reducing the severity of this bias, but not eliminating it. As true droplet dispersion physically covaries with aerosol loading, applying any static veff assumption across a ship track would distort the derived cloud susceptibility.
If the coupling between droplet number and dispersion assumed in this study is representative of real ship tracks, an empirical correction of the kind proposed by Lebsock and Witte (2023) could in principle mitigate much of this bias. Lebsock and Witte derive a relationship between k and Nd from in-situ aircraft measurements, , which allows k to be estimated from the retrieved Nd itself rather than fixed a priori. Applying this correction (Combined Fit parameters, k1=0.562, k2=0.974, ) to the synthetic retrievals here reduces the polluted Nd bias from 13.91 % to 0.19 % under the central veff=0.10 baseline, and from 24.56 % to −1.82 % under the legacy veff=0.13 baseline, effectively removing the polluted bias identified above if the assumed k–Nd coupling holds. However, the same correction applied uniformly to the clean background population does not improve, and in most cases worsens, the retrieval: the mean clean Nd bias shifts from −7.65 % to −11.26 % (veff=0.10) and from +1.21 % to −12.83 % (veff=0.13), with the overcorrection most pronounced for clean clouds with the broadest true distributions (veff=0.15). This indicates that, at least under the idealised conditions considered here, a blanket application of the Lebsock and Witte (2023) correction is not appropriate; its benefit is conditional on correctly identifying which pixels are genuinely narrow-distribution (i.e. polluted) cases, for instance via independent ship-track detection, rather than applying it indiscriminately across a scene. These results suggest a targeted fix: apply the aircraft-derived k–Nd correction only within already-identified polluted regions, not scene-wide, and validate it against observational veff retrievals before wider adoption. Importantly, this estimate of the correction's benefit assumes a tight k–Nd coupling, and Sect. 3.4 shows both the bias and the benefit shrink if the true coupling is weaker.
Furthermore, the precision of the retrieval of Nd in the polluted regime is severely degraded, with a standard deviation of ±22.14 % under the central veff=0.10 baseline (±23.75 % under the legacy veff=0.13 comparison). This analysis indicates that this variance is largely driven by viewing geometry of re retrievals as illustrated by Figs. 5 and 6. Due to Nd scaling with the inverse cube of re the geometry dependent variance in re is amplified. While the vast majority of the bias is bounded between 12 %–37 %, at extreme geometries the retrieval algorithm can become unstable driving bias in Nd upwards of 1200 %. These breakdowns are a consequence of the 1D plane-parallel cloud assumption breaking down. As demonstrated by Maddux et al. (2010), highly oblique VZA values significantly increase the satellite pixel footprint and optical pathlength, leading to a higher probability of partly cloudy fields and the observation of cloud sides. While standard observational methodologies typically filter out these extreme cases, discarding them does not solve the underlying variance discussed above.
Conversely, by demonstrating that LWP is retrieved robustly despite these variance assumptions, the presented results lend methodological confidence to the weak LWP responses documented by Toll et al. (2019) and Tippett et al. (2024). This indicates that the weak LWP adjustments observed in ship tracks are not a result of retrieval bias associated with the fixed veff assumption. Consequently, the competing mechanisms of darkening due to entrainment and brightening due to precipitation suppression, discussed by Wood (2007) and Chen et al. (2012), must be resolved physically or through the correction of other known biases. This finding supports the hypothesis that non-monotonic LWP responses are driven by environmental state variables rather than measurement error (Glassmeier et al., 2021). However, because the retrieval bias does not significantly perturb the derived LWP, it fails to resolve the instantaneous LWP decrease observed by Gryspeerdt et al. (2021), suggesting that this may be an unresolved microphysical adjustment. Notably, the finding that retrieval artefacts systematically overestimate Nd in polluted regimes aligns with the observational assessments of Gryspeerdt et al. (2023), which similarly identified that satellite-derived droplet concentrations are artificially inflated under high-aerosol conditions.
The feasibility of Marine Cloud Brightening (MCB) relies on identifying susceptible cloud decks where the injection of sea salt aerosols will yield a significant increase in albedo (Latham et al., 2012). These findings suggest that, to the extent that the assumed spectral narrowing occurs in practice, the background susceptibility of these clouds could be overstated. If the ship tracks used to calibrate susceptibility estimates (Christensen and Stephens, 2011) are subject to overestimation in their microphysical response due to spectral narrowing, the efficacy of interventions such as MCB may be correspondingly lower. The geometric sensitivity identified in this study also presents an operational obstacle. The apparent microphysical response of a perturbed cloud will artificially fluctuate simply due to the varying orbital position of the satellite across subsequent overpasses. An operational MCB program monitored by satellite would risk interpreting a retrieval artefact as a successful intervention.
4.1 Limitations
The results presented here are derived from a controlled, idealised sensitivity experiment isolating the effect of the fixed veff assumption. Several simplifications constrain the extent to which the specific bias magnitudes can be generalised to operational retrievals. First, the clouds are modelled as single-layer, vertically homogeneous, plane-parallel slabs with a fixed geometric thickness of H=500 m. Real marine stratocumulus and ship-track clouds exhibit vertical structure in liquid water content and droplet size, as well as variable geometric thickness. Both are known to introduce additional retrieval biases beyond those considered here (Grosvenor et al., 2018). The sensitivity of the reported bias magnitudes to H has not been tested.
Second, this study does not reproduce the full operational MODIS retrieval chain, including cloud masking, multilayer and partly-cloudy pixel flags, and other quality-control logic. The experiment is deliberately restricted to the bias introduced by the veff assumption alone, isolated from these other sources of operational uncertainty.
Consequently, the reported bias magnitudes should be interpreted as a bound on the sensitivity to this one assumption under idealised conditions, rather than as a prediction of the net bias in any specific operational Nd product. In an operational setting this bias would act alongside other established uncertainty sources in bi-spectral retrievals, including three-dimensional radiative effects, sub-pixel heterogeneity, and instrument calibration (Grosvenor et al., 2018; Lai et al., 2019). A quantitative intercomparison of these contributions is beyond the scope of a single-assumption sensitivity test. The magnitude of the Nd biases reported here suggests that the fixed-veff assumption warrants consideration alongside these established sources, particularly in ship-track studies where the clean-to-polluted contrast in veff is largest. While no published study isolates the fixed-veff contribution to retrieval bias specifically for ship tracks, two recent aircraft-based evaluations provide broader context. Witte et al. (2018) find no significant bias in MODIS-retrieved re against in-situ measurements across nondrizzling-to-drizzling marine stratocumulus, consistent with the near-zero clean-regime re bias found here. Passer et al. (2025) report Nd discrepancies of ±50 % or more between MODIS and aircraft measurements in marine stratocumulus, indicating that the veff-driven Nd bias identified here (14 %–25 %) is plausibly a substantial, but not dominant, contributor to the total observed retrieval uncertainty.
Satellite observational records provide the primary dataset for assessing aerosol-cloud interactions on a global scale. Yet, the reliability of these susceptibility estimates is inherently tethered to the mathematical assumptions embedded within satellite retrieval algorithms. A vulnerability of standard bi-spectral retrievals is their reliance on a fixed assumption for the droplet size distribution's effective variance (veff), set at veff=0.1 for MODIS Collection 6 and veff=0.13 for previous MODIS Collections. However, in polluted regimes such as ship tracks, aerosol injection not only reduces droplet size but also narrows the distribution. This narrowing of the distribution, set at veff=0.05 in this study, contradicts the fixed veff assumption. This study uses a synthetic retrieval experiment to quantify the systematic bias introduced by this assumption.
The results demonstrate that, within the constraints of the synthetic framework, assuming an inaccurately broad distribution for polluted clouds leads to a systematic overestimation of re by 2.30 %–3.43 %, depending on the assumption (Fig. 4). While the retrieval LWP remains largely unaffected by the fixed assumption, due to the relative insensitivity of τ to the distribution shape, Nd exhibits a strong positive bias, of approximately 23 %–24 % when contrasted with the corresponding clean Nd (Fig. 7). The substantial inflation of Nd is driven by its inverse dependence on the spectral width parameter (k). As the droplet distribution narrows (increasing k), the retrieval systematically overestimates droplet number due to k being held at an artificially low value. The retrieval of Nd is also found to be imprecise with a standard deviation of ±22.14 %–23.75 %, mainly driven by viewing geometry (Figs. 5 and 6). These findings suggest that, if the aerosol-driven narrowing of the droplet size distribution assumed in this framework is representative of real ship tracks, the magnitude of the Twomey effect observed in ship track based observational studies may be overstated.
Under the same conditions, observational estimates of cloud susceptibility and the efficacy of marine cloud brightening could be exaggerated in current satellite products. Mitigation of these uncertainties will likely benefit from a combination of approaches. While global multi-angle and polarimetric datasets (e.g., POLDER, PACE) can constrain droplet size dispersion, their spatial resolutions are often insufficient to resolve fine-scale aerosol perturbations such as individual ship tracks. As high-resolution bi-spectral retrievals remain necessary for monitoring these localised interactions, future work should focus on computationally efficient correction strategies for these standard operational algorithms. This could include developing machine learning models capable of dynamically estimating veff from existing satellite radiances, or deploying adaptive algorithms that conditionally apply lower dispersion assumptions, or empirical k–Nd corrections of the kind proposed by Lebsock and Witte (2023), when specific features, such as ship tracks, are detected. The latter approach is supported by the finding here that the correction nearly eliminates the polluted-regime Nd bias when applied to identified ship-track pixels, but degrades the retrieval of the clean background when applied indiscriminately. This benefit itself depends on how tightly droplet dispersion and concentration are coupled in practice. Additional spectral channels may also help mitigate this bias. Liu and Teng (2026) show that shortwave-infrared channels beyond the standard bi-spectral pair can provide independent information about cloud microphysical structure not captured by current retrievals. Extending this principle to channels sensitive to the shape of the droplet size distribution could in principle allow veff to be constrained directly from the radiances. These findings indicate that the fixed effective-variance assumption is a relevant source of bias for ship-track-based estimates of aerosol-cloud interactions and climate intervention efficacy, and should be evaluated alongside other known retrieval uncertainties in future work.
Radiative transfer code uses libRadtran (Emde et al., 2016) and pyLRT (https://doi.org/10.5281/zenodo.11626012, Gryspeerdt and Driver, 2024). Analysis code is available at https://doi.org/10.5281/zenodo.20328197 (Boyce et al., 2026a).
The generated data used in analysis can be found at https://doi.org/10.5281/zenodo.19699485 (Boyce et al., 2026a).
All authors contributed to designing the study. IB performed the analysis and wrote the paper. EG and AC assisted in the interpretation of the results and commented on the paper.
The contact author has declared that none of the authors has any competing interests.
Publisher's note: Copernicus Publications remains neutral with regard to jurisdictional claims made in the text, published maps, institutional affiliations, or any other geographical representation in this paper. The authors bear the ultimate responsibility for providing appropriate place names. Views expressed in the text are those of the authors and do not necessarily reflect the views of the publisher.
This research has been supported by the Engineering and Physical Sciences Research Council Centre for Doctoral Training in Aerosol Science (grant no. EP/S023593/1), the University of Cambridge Centre for Climate Repair, the Horizon Europe programme (project CERTAINTY – Cloud-aERosol inTeractions & their impActs IN The earth sYstem; grant agreement no. 101137680), and a Royal Society University Research Fellowship (grant no. URF/R1/191602).
This paper was edited by Chao Liu and reviewed by Michael Diamond and two anonymous referees.
Ackerman, A. S., Kirkpatrick, M. P., Stevens, D. E., and Toon, O. B.: The impact of humidity above stratiform clouds on indirect aerosol climate forcing, Nature, 432, 1014–1017, 2004. a
Albrecht, B. A.: Aerosols, cloud microphysics, and fractional cloudiness, Science, 245, 1227–1230, 1989. a
Bellouin, N., Quaas, J., Gryspeerdt, E., Kinne, S., Stier, P., Watson-Parris, D., Boucher, O., Carslaw, K. S., Christensen, M., Daniau, A.-L., Dufresne, J.-L., Feingold, G., Fiedler, S., Forster, P., Gettelman, A., Haywood, J. M., Lohmann, U., Malavelle, F., Mauritsen, T., McCoy, D. T., Myhre, G., Mülmenstädt, J., Neubauer, D., Possner, A., Rugenstein, M., Sato, Y., Schulz, M., Schwartz, S. E., Sourdeval, O., Storelvmo, T., Toll, V., Winker, D., and Stevens, B.:: Bounding global aerosol radiative forcing of climate change, Rev. Geophys., 58, e2019RG000660, https://doi.org/10.1029/2019RG000660, 2020. a, b
Boyce, I., Gryspeerdt, E., and Cicirello, A.: Analysis code for: Sensitivity of bi-spectral cloud retrievals to the fixed effective variance assumption, Zenodo [software], https://doi.org/10.5281/zenodo.20328197, 2026a. a
Boyce, I., Gryspeerdt, E., and Cicirello, A.: Assessing retrieval biases in ship tracks, Zenodo [data set], https://doi.org/10.5281/zenodo.19699485, 2026b. a
Brenguier, J.-L., Pawlowska, H., Schüller, L., Preusker, R., Fischer, J., and Fouquart, Y.: Radiative properties of boundary layer clouds: Droplet effective radius versus number concentration, J. Atmos. Sci., 57, 803–821, 2000. a
Bretherton, C., Blossey, P. N., and Uchida, J.: Cloud droplet sedimentation, entrainment efficiency, and subtropical stratocumulus albedo, Geophys. Res. Lett., 34, L03813, https://doi.org/10.1029/2006GL027648, 2007. a
Chen, Y.-C., Christensen, M. W., Xue, L., Sorooshian, A., Stephens, G. L., Rasmussen, R. M., and Seinfeld, J. H.: Occurrence of lower cloud albedo in ship tracks, Atmos. Chem. Phys., 12, 8223–8235, https://doi.org/10.5194/acp-12-8223-2012, 2012. a, b
Christensen, M. W. and Stephens, G. L.: Microphysical and macrophysical responses of marine stratocumulus polluted by underlying ships: Evidence of cloud deepening, J. Geophys. Res.-Atmos., 116, D03201, https://doi.org/10.1029/2010JD014638, 2011. a
Christensen, M. W., Gettelman, A., Cermak, J., Dagan, G., Diamond, M., Douglas, A., Feingold, G., Glassmeier, F., Goren, T., Grosvenor, D. P., Gryspeerdt, E., Kahn, R., Li, Z., Ma, P.-L., Malavelle, F., McCoy, I. L., McCoy, D. T., McFarquhar, G., Mülmenstädt, J., Pal, S., Possner, A., Povey, A., Quaas, J., Rosenfeld, D., Schmidt, A., Schrödner, R., Sorooshian, A., Stier, P., Toll, V., Watson-Parris, D., Wood, R., Yang, M., and Yuan, T.: Opportunistic experiments to constrain aerosol effective radiative forcing, Atmos. Chem. Phys., 22, 641–674, https://doi.org/10.5194/acp-22-641-2022, 2022. a
Chun, J.-Y., Wood, R., Blossey, P., and Doherty, S. J.: Microphysical, macrophysical, and radiative responses of subtropical marine clouds to aerosol injections, Atmos. Chem. Phys., 23, 1345–1368, https://doi.org/10.5194/acp-23-1345-2023, 2023. a
Emde, C., Buras-Schnell, R., Kylling, A., Mayer, B., Gasteiger, J., Hamann, U., Kylling, J., Richter, B., Pause, C., Dowling, T., and Bugliaro, L.: The libRadtran software package for radiative transfer calculations (version 2.0.1), Geosci. Model Dev., 9, 1647–1672, https://doi.org/10.5194/gmd-9-1647-2016, 2016. a, b, c
Feingold, G., Ghate, V. P., Russell, L. M., Blossey, P., Cantrell, W., Christensen, M. W., Diamond, M. S., Gettelman, A., Glassmeier, F., Gryspeerdt, E., Haywood, J., Hoffmann, F., Kaul, C. M., Lebsock, M., McComiskey, A. C., McCoy, D. T., Ming, Y., Mülmenstädt, J., Possner, A., Prabhakaran, P., Quinn, P. K., Schmidt, K. S., Shaw, R. A., Singer, C. E., Sorooshian, A., Toll, V., Wan, J. S., Wood, R., Yang, F., Zhang, J., and Zheng, X.: Physical science research needed to evaluate the viability and risks of marine cloud brightening, Sci. Adv., 10, eadi8594, https://doi.org/10.1126/sciadv.adi8594, 2024. a
Forster, P. M., Storelvmo, T., Armour, K., Collins, W., Dufresne, J.-L., Frame, D., Lunt, D. J., Mauritsen, T., Palmer, M. D., Watanabe, M., Wild, M., and Zhang, H.: The Earth's Energy Budget, Climate Feedbacks, and Climate Sensitivity, in: Climate Change 2021: The Physical Science Basis. Contribution of Working Group I to the Sixth Assessment Report of the Intergovernmental Panel on Climate Change, 923–1054, Cambridge University Press, Cambridge, United Kingdom and New York, NY, USA, https://doi.org/10.1017/9781009157896.009, 2021. a
Glassmeier, F., Hoffmann, F., Johnson, J. S., Yamaguchi, T., Carslaw, K. S., and Feingold, G.: Aerosol-cloud-climate cooling overestimated by ship-track data, Science, 371, 485–489, 2021. a, b
Goren, T., Choudhury, G., Kretzschmar, J., and McCoy, I.: Co-variability drives the inverted-V sensitivity between liquid water path and droplet concentrations, Atmos. Chem. Phys., 25, 3413–3423, https://doi.org/10.5194/acp-25-3413-2025, 2025. a
Grosvenor, D. P., Sourdeval, O., Zuidema, P., Ackerman, A., Alexandrov, M. D., Bennartz, R., Boers, R., Cairns, B., Chiu, J. C., Christensen, M., Deneke, H., Diamond, M., Feingold, G., Fridlind, A., Hünerbein, A., Knist, C., Kollias, P., Marshak, A., McCoy, D., Merk, D., Painemal, D., Rausch, J., Rosenfeld, D., Russchenberg, H., Seifert, P., Sinclair, K., Stier, P., van Diedenhoven, B., Wendisch, M., Werner, F., Wood, R., Zhang, Z., and Quaas, J.: Remote sensing of droplet number concentration in warm clouds: A review of the current state of knowledge and perspectives, Rev. Geophys., 56, 409–453, 2018. a, b, c, d, e
Gryspeerdt, E. and Driver, O.: pyLRT, Zenodo [code], https://doi.org/10.5281/zenodo.11626012, 2024. a, b
Gryspeerdt, E., Mülmenstädt, J., Gettelman, A., Malavelle, F. F., Morrison, H., Neubauer, D., Partridge, D. G., Stier, P., Takemura, T., Wang, H., Wang, M., and Zhang, K.: Surprising similarities in model and observational aerosol radiative forcing estimates, Atmos. Chem. Phys., 20, 613–623, https://doi.org/10.5194/acp-20-613-2020, 2020. a
Gryspeerdt, E., Goren, T., and Smith, T. W. P.: Observing the timescales of aerosol–cloud interactions in snapshot satellite images, Atmos. Chem. Phys., 21, 6093–6109, https://doi.org/10.5194/acp-21-6093-2021, 2021. a, b, c, d
Gryspeerdt, E., Povey, A. C., Grainger, R. G., Hasekamp, O., Hsu, N. C., Mulcahy, J. P., Sayer, A. M., and Sorooshian, A.: Uncertainty in aerosol–cloud radiative forcing is driven by clean conditions, Atmos. Chem. Phys., 23, 4115–4122, https://doi.org/10.5194/acp-23-4115-2023, 2023. a
Hansen, J. E.: Multiple Scattering of Polarized Light in Planetary Atmospheres Part II. Sunlight Reflected by Terrestrial Water Clouds, J. Atmos. Sci., 28, 1400–1426, 1971. a
Hansen, J. E. and Travis, L. D.: Light scattering in planetary atmospheres, Space Sci. Rev., 16, 527–610, 1974. a, b
King, M. D., Tsay, S.-C., Platnick, S. E., Wang, M., and Liou, K.-N.: Cloud retrieval algorithms for MODIS: Optical thickness, effective particle radius, and thermodynamic phase, MODIS Algorithm Theoretical Basis Document, 440, https://modis.gsfc.nasa.gov/data/atbd/atbd_mod05.pdf (last access: 25 August 2026), 1997. a, b, c, d
Koch, D. and Del Genio, A. D.: Black carbon semi-direct effects on cloud cover: review and synthesis, Atmos. Chem. Phys., 10, 7685–7696, https://doi.org/10.5194/acp-10-7685-2010, 2010. a
Lai, R., Teng, S., Yi, B., Letu, H., Min, M., Tang, S., and Liu, C.: Comparison of cloud properties from Himawari-8 and FengYun-4A geostationary satellite radiometers with MODIS cloud retrievals, Remote Sens., 11, 1703, https://doi.org/10.3390/rs11141703, 2019. a
Latham, J., Bower, K., Choularton, T., Coe, H., Connolly, P., Cooper, G., Craft, T., Foster, J., Gadian, A., Galbraith, L., Iacovides, H., Johnston, D., Launder, B., Leslie, B., Meyer, J., Neukermans, A., Ormond, B., Parkes, B., Rasch, P., Rush, J., Salter, S., Stevenson, T., Wang, H., Wang, Q., and Wood, R.: Marine cloud brightening, Philos. T. R. Soc. A, 370, 4217, https://doi.org/10.1098/rsta.2012.0086, 2012. a
Lebsock, M. D. and Witte, M.: Quantifying the dependence of drop spectrum width on cloud drop number concentration for cloud remote sensing, Atmos. Chem. Phys., 23, 14293–14305, https://doi.org/10.5194/acp-23-14293-2023, 2023. a, b, c, d, e, f, g, h, i, j
Lim, J.-S. and Hoffmann, F.: Aging of droplet size distribution in stratocumulus clouds: regimes of droplet size distribution evolution, Atmos. Chem. Phys., 26, 5427–5446, https://doi.org/10.5194/acp-26-5427-2026, 2026. a
Liu, C. and Teng, S.: Enhancing global cloud property retrieval capabilities by optimizing satellite spectral channels, Science China Earth Sciences, 69, 1–5, https://doi.org/10.1007/s11430-026-1971-7, 2026. a
Liu, C., Song, Y., Zhou, G., Teng, S., Li, B., Xu, N., Lu, F., and Zhang, P.: A cloud optical and microphysical property product for the advanced geosynchronous radiation imager onboard China's Fengyun-4 satellites: The first version, Atmospheric and Oceanic Science Letters, 16, 100337, https://doi.org/10.1016/j.aosl.2023.100337, 2023. a
Liu, Y., Daum, P. H., Guo, H., and Peng, Y.: Dispersion bias, dispersion effect, and the aerosol–cloud conundrum, Environ. Res. Lett., 3, 045021, https://doi.org/10.1088/1748-9326/3/4/045021, 2008. a, b
Maddux, B., Ackerman, S., and Platnick, S.: Viewing geometry dependencies in MODIS cloud products, J. Atmos. Ocean. Tech., 27, 1519–1528, 2010. a
Martin, G. M., Johnson, D. W., and Spice, A.: The measurement and parameterization of effective radius of droplets in warm stratocumulus clouds, J. Atmos. Sci., 51, 1823–1842, 1994. a, b, c, d, e, f
Miles, N. L., Verlinde, J., and Clothiaux, E. E.: Cloud droplet size distributions in low-level stratiform clouds, J. Atmos. Sci., 57, 295–311, 2000. a, b, c
Nakajima, T. and King, M. D.: Determination of the Optical Thickness and Effective Particle Radius of Clouds from Reflected Solar Radiation Measurements. Part I: Theory, J. Atmos. Sci., 47, 1878–1893, 1990. a, b, c, d, e
Noone, K. J., Johnson, D. W., Taylor, J. P., Ferek, R. J., Garrett, T., Hobbs, P. V., Durkee, P. A., Nielsen, K., Öström, E., O'Dowd, C. D., Smith, M. H., Russell, L. M., Flagan, R. C., Seinfeld, J. H., De Bock, L., Van Grieken, R. E., Hudson, J. G., Brooks, I., Gasparovic, R. F., and Pockalny, R. A.: A case study of ship track formation in a polluted marine boundary layer, J. Atmos. Sci., 57, 2748–2764, 2000a. a
Noone, K. J., Öström, E., Ferek, R. J., Garrett, T., Hobbs, P. V., Johnson, D. W., Taylor, J. P., Russell, L. M., Flagan, R. C., Seinfeld, J. H., O’Dowd, C. D., Smith, M. H., Durkee, P. A., Nielsen, K., Hudson, J. G., Pockalny, R. A., De Bock, L., Van Grieken, R. E., Gasparovic, R. F., and Brooks, I.: A case study of ships forming and not forming tracks in moderately polluted clouds, J. Atmos. Sci., 57, 2729–2747, 2000b. a
Passer, S. R., Witte, M. K., and Chuang, P. Y.: Aircraft evaluation of MODIS cloud drop number concentration retrievals, Atmos. Meas. Tech., 18, 3819–3831, https://doi.org/10.5194/amt-18-3819-2025, 2025. a
Platnick, S., Meyer, K. G., King, M. D., Wind, G., Amarasinghe, N., Marchant, B., Arnold, G. T., Zhang, Z., Hubanks, P. A., Holz, R. E., Yang, P., Ridgway, W. L., and Riedi, J.: The MODIS cloud optical and microphysical products: Collection 6 updates and examples from Terra and Aqua, IEEE T. Geosci. Remote, 55, 502–525, 2016. a
Quaas, J., Boucher, O., Bellouin, N., and Kinne, S.: Satellite-based estimate of the direct and indirect aerosol climate forcing, J. Geophys. Res.-Atmos., 113, D05204, https://doi.org/10.1029/2007JD008962, 2008. a
Quaas, J., Ming, Y., Menon, S., Takemura, T., Wang, M., Penner, J. E., Gettelman, A., Lohmann, U., Bellouin, N., Boucher, O., Sayer, A. M., Thomas, G. E., McComiskey, A., Feingold, G., Hoose, C., Kristjánsson, J. E., Liu, X., Balkanski, Y., Donner, L. J., Ginoux, P. A., Stier, P., Grandey, B., Feichter, J., Sednev, I., Bauer, S. E., Koch, D., Grainger, R. G., Kirkevåg, A., Iversen, T., Seland, Ø., Easter, R., Ghan, S. J., Rasch, P. J., Morrison, H., Lamarque, J.-F., Iacono, M. J., Kinne, S., and Schulz, M.: Aerosol indirect effects – general circulation model intercomparison and evaluation with satellite data, Atmos. Chem. Phys., 9, 8697–8717, https://doi.org/10.5194/acp-9-8697-2009, 2009. a
Stamnes, K., Tsay, S.-C., Wiscombe, W., and Laszlo, I.: DISORT, a general-purpose Fortran program for discrete-ordinate-method radiative transfer in scattering and emitting layered media: documentation of methodology, Technical report, Stevens Institute of Technology, Hoboken, NJ, https://www.libradtran.org/lib/exe/fetch.php?media=disortreport1.1.pdf (last access: 25 August 2026), 2000. a
Stephens, G. L.: Radiation profiles in extended water clouds. II: Parameterization schemes, J. Atmos. Sci., 35, 2123–2132, 1978. a
Tippett, A., Gryspeerdt, E., Manshausen, P., Stier, P., and Smith, T. W. P.: Weak liquid water path response in ship tracks, Atmos. Chem. Phys., 24, 13269–13283, https://doi.org/10.5194/acp-24-13269-2024, 2024. a, b
Toll, V., Christensen, M., Quaas, J., and Bellouin, N.: Weak average liquid-cloud-water response to anthropogenic aerosols, Nature, 572, 51–55, 2019. a, b
Twomey, S.: Pollution and the planetary albedo, Atmos. Environ., 8, 1251–1256, 1974. a
Witte, M. K., Yuan, T., Chuang, P. Y., Platnick, S., Meyer, K. G., Wind, G., and Jonsson, H. H.: MODIS retrievals of cloud effective radius in marine stratocumulus exhibit no significant bias, Geophys. Res. Lett., 45, 10656–10664, https://doi.org/10.1029/2018GL079325, 2018. a
Wood, R.: Cancellation of aerosol indirect effects in marine stratocumulus through cloud thinning, J. Atmos. Sci., 64, 2657–2669, 2007. a, b
Wood, R.: Stratocumulus clouds, Mon. Weather Rev., 140, 2373–2423, 2012. a, b
Zhang, J. and Feingold, G.: Distinct regional meteorological influences on low-cloud albedo susceptibility over global marine stratocumulus regions, Atmos. Chem. Phys., 23, 1073–1090, https://doi.org/10.5194/acp-23-1073-2023, 2023. a