
the Creative Commons Attribution 4.0 License.
the Creative Commons Attribution 4.0 License.
 | 07 Sep 2026
CRUX-1.0: an automatic GHG and Ozone observation system for inland Antarctica Plateau
Biao Tian

Kongju Zhu
Xu Yao
Yixi Zhao
Wenqian Zhang
Diyi Yang
Weijun Sun
Yining Yu
Shoudong Zhao
Yige Cui
Chuanjin Li
Jie Tang
Cunde Xiao
Renhe Zhang
Antarctic inland regions, as critical hubs for global climate change monitoring, suffer from a lack of reliable long-term greenhouse gas (GHG) observation systems due to extremely low temperatures, strong winds, and limited logistical/energy support. To address this gap, the CRUX-1.0 automatic observation system was developed and deployed at Taishan Station (inland Antarctic Plateau) during the 39th and 40th CHINARE (Chinese National Antarctic Research Expedition), targeting simultaneous monitoring of CO2 and surface ozone (O3). Integrating four core subsystems – analysis, calibration, temperature control, and data communication – the system is specifically engineered for harsh polar environments with low power consumption (<350 W) and autonomous operation capability. The operational analysis based on a 1-month continuous field experiment showed its stable performance: CO2 measurements achieved a coefficient of variation (CV) <5.6 % (nearing 0 % post-calibration), while O3 measurements maintained a CV <5.6 %. The average mixing ratios (CO2: 420.7 ± 0.7 ppm; O3: 20.1 ± 0.8 ppb) closely aligned with regional background levels and South Pole Station data, confirming high reliability. As an unattended system with synchronous measurement, low-power temperature control and automatic calibration, CRUX-1.0 shows good potential for long-term deployment in data-scarce polar inland regions.
- Article
(6003 KB) - Full-text XML
-
Supplement
(9460 KB) - BibTeX
- EndNote


Observing atmospheric composition and greenhouse gases is a critical global issue, as it serves as a key benchmark for assessing global changes and formulating policies such as the Paris Agreement and Conference of the Parties (COP) negotiations. Currently, global atmospheric background stations provide a significant amount of observational data, but their distribution remains uneven. In fact, there are notable disparities in greenhouse gas mixing ratios across different regions.For example, high-latitude and polar regions, including Antarctica, suffer from a lack of observation stations, making it difficult to monitor the atmospheric composition in these areas (Das et al., 2016; Liu et al., 2024). The absence of sufficient observation capacity in these regions highlights the need for enhanced monitoring systems. In particular, the challenging environmental conditions and logistical difficulties in these regions necessitate advancements in observation technologies and improved support for maintaining such systems. Given these challenges, there is a growing demand for increasing the capacity of remote, unattended observation systems to better capture the atmospheric background in these critical areas (Köne and Büke, 2010).
Autonomous and unattended atmospheric observation technology has achieved initial applications across multiple global spheres. Its core technologies (low-power hardware, automated quality control, and remote data transmission) provide a feasible solution for long-term monitoring in remote/extreme regions.In the marine boundary layer, the autonomous ozone measurement system (equipped with PSI and 2B Technologies sensors) developed by the Woods Hole Oceanographic Institution has successfully operated for over one month in an unattended mode on Atlantic buoys and the Chesapeake Bay Lighthouse Tower, thanks to its waterproof packaging, automatic valve protection (to cope with high winds and sea fog), and fault self-correcting controller. Among them, the 2B sensor consumes less than 4 W of power, which is compatible with the energy constraints of marine platforms (Hintsa et al., 2004). In the atmospheric background monitoring at fixed terrestrial stations, the 300 m tall tower station in Bialystok, Poland, has implemented quasi-continuous observations of multiple species such as CO2, , and CH4 since 2005. By automatically calibrating the sensors every 40 h, the gas chromatography module every 5 d, and conducting weekly flask sampling for quality control, the station has ensured data continuity for more than 3 years. Additionally, multi-height sampling has enabled effective differentiation between local and regional GHG signals (Popa et al., 2010). In the field of mobile observation, the MPAL vehicle-mounted monitoring platform of the University of Michigan achieves 6.5 h of continuous operation of all instruments relying on LiFeMnPO4 battery packs. Through automatic PM sampling loss correction and weekly comparison with fixed stations, it completed 84 d of observations with over 260 000 1 s resolution data points in Detroit, verifying the spatiotemporal coverage advantages of mobile unattended platforms (Xia et al., 2023). Furthermore, the REA-FTIR flux system at the Shoalhaven Farm in Australia completed 3 weeks of unattended simultaneous flux observations of CO2, CH4, and N2O relying on 3G remote monitoring and automatic sampling bag switching, and also proposed an innovative method for estimating N2O background fluxes via CO2 tracer (Griffith et al., 2009).
The observation of greenhouse gases and other atmospheric components in Antarctica presents significant challenges, particularly regarding conducting unattended monitoring. The extreme environmental conditions, including low temperatures, strong winds, and long periods of darkness, pose technical difficulties for maintaining continuous observation systems (Griffiths et al., 2020). Moreover, logistical support in such a remote region is limited, making it hard to deploy and maintain equipment effectively. Over the years, targeted efforts have been made to address these challenges, with some advances in equipment adaptation, energy management, and data reliability:
- 1.
British Antarctic Survey (BAS) Autonomous Ozone Network (2007–present). BAS deployed a network of 2B Technologies ozone monitors (ultraviolet photometry, 5 min sampling interval, 11–13 W power consumption) across 8 sites, from the southeastern coast of the Weddell Sea to the Antarctic Plateau (Bauguitte et al., 2011). The system relied on “solar-wind hybrid power + lead-acid batteries” (10–14 d of backup) and passive insulation with intake heating to avoid icing. It delivered 5 years of continuous data (2007–2012), with spring ozone mixing ratios averaging 28 ± 3 ppb along the coast (vs. 35 ± 2 ppb on the plateau) and a data continuity rate of 85 %. This work first confirmed that ozone depletion rates were higher at polar vortex edges (0.8 ppb d−1) than inland (0.3 ppb d−1). However, limitations emerged: passive insulation failed at −60 °C (causing 15 % winter data loss), wind turbine blade icing halted power supply for 12 consecutive days in 2009, and the lack of automatic calibration required manual on-site zero-checks, increasing operational costs (Bauguitte et al., 2011).
- 2.
Chinese Kunlun Station (Dome A) Ozone Monitoring (2016). During the 2016 Chinese National Antarctic Research Expedition (CHINARE), Ding et al. (2020a) deployed a 2B Technologies Model 205 ozone monitor (10 min sampling interval, 5 W power consumption) at Dome A (80.25° S), leveraging the PLATO astronomical observatory module’s shared diesel generator and 50 kWh battery for power. The instrument operated continuously for 1 year, capturing the first annual ozone dataset for Antarctica’s highest-latitude inland region – with polar night mixing ratios averaging 32 ± 4 ppb and summer mixing ratios 29 ± 2 ppb (15 % lower than at Dome C). Data continuity reached 99.5 %, validating the Model 205’s suitability for extreme cold. Nevertheless, the system suffered from energy dependency (Ding et al., 2020a).
- 3.
Terra Nova Bay Station Stratospheric NO2 Monitoring (2000). Bortoli and Kostadinov (2002) deployed a GASCOD UV-Visible spectrometer (423–460 nm wavelength, 0.5 nm resolution) at Terra Nova Bay Station for unattended NO2 observations. Key adaptations included a 30° inclined quartz window to reduce snow accumulation, 24 h continuous measurement (with integration time auto-adjusted from 2–5 s at noon to 5–10 min at twilight), and a built-in mercury lamp for daily grating calibration (spectral accuracy <0.2 nm). Invalid data were screened via the “Flux Index (FI)” (values mV ms−1 rejected). The system yielded 1996 data showing NO2 slant column densities (sc) dropping from 1.2×10¹⁷ to 4×10¹⁶ in austral autumn and rebounding in spring – confirming coupling between photochemical loss and dynamic transport. It also quantified temperature-dependent errors: NO2 sc increased by 3.5 %–4 % for every 10 K rise in cross-section temperature. However, heavy snow in August 1996 covered the quartz window, causing a 7 d data gap, and mercury lamp intensity declined at −10 °C, leading to two failed calibrations.
The Antarctic inland plateau faces unique challenges including ultra-low temperatures (below −40 °C), polar night (over 3 months without effective illumination), and extremely low logistical accessibility. Existing global unattended monitoring schemes (such as solar-powered supply for marine platforms, mains-powered calibration for terrestrial tall towers, and 3G communication for farmland systems) cannot be directly adapted to this region. Therefore, developing a fully automated greenhouse gases and surface ozone observation system tailored to the Antarctic inland plateau, which fills the gap in unattended monitoring of the atmospheric background in the polar inland, is of crucial significance for understanding the polar feedback of the global climate system. Building on these experiences, a new system to monitor greenhouse gases and surface ozone was developed in 2022–2023 and deployed at the Antarctic inland Taishan Station. The preliminary system only operated for 3 d due to excessive power consumption: the temperature control module accounted for 70 % of the total power (peak 3 kW), which overloaded the power supply. The power allocation was 2.1 kW for temperature control and 0.9 kW for analysis/calibration/communication modules. As a result, an improved system named CRUX-1.0 (the name “CRUX” is inspired by constellation of Crux is one of the most prominent and easily recognizable constellations in the southern hemisphere sky) was developed with 350 W power limitation and tested at Tulihe, China, during cold season (−20 to −40 °C). Then in February 2024, it was deployed at Taishan Station on the Antarctic ice sheet. This system successfully operated for one month before the power supply broke down, providing valuable data on the atmospheric composition in this extreme environment. Here in this paper, we will introduce the detailed design of the system and its performance in Antarctica.
Atmospheric CO2 and O3 observational data in this study were obtained from one self-developed unattended monitoring system and four WMO-certified long-term monitoring stations with mature observation networks. The authoritative sources and verification channels for 2024 observational data are specified as follows: CO2 data were retrieved from the World Data Centre for Greenhouse Gases (WDCGG) of the World Meteorological Organization/Global Atmosphere Watch (WMO/GAW, https://gaw.kishou.go.jp/search/summary, last access: 14 December 2025), while surface ozone data were derived from the European Database for Atmospheric Sounding (EBAS, https://ebas-data.nilu.no/Pages/DataSetList.aspx, last access: 14 December 2025). All datasets were verified via the WMO/GAW quality control system to ensure cross-station consistency and comparability (Global Atmosphere Watch [GAW], 2001).
2.1 Taishan Station
Taishan Station (72.01° S, 92.08° E; 2621 m a.s.l.) is located on the Antarctic ice sheet (Fig. 1). It is situated on the high Antarctic Plateau, an area characterized by extreme environmental conditions. The station experiences strong katabatic winds and is positioned in a region with limited access to logistics and power resources, making it a challenging site for long-term atmospheric monitoring. The climate at Taishan Station is typical of the high Antarctic interior, where temperatures are consistently low throughout the year. The long-term data from September 2012 to July 2021 revealed an annual average air temperature of −35.4 °C, with a relative humidity of 67 %, an air pressure of 699 hPa, and an average wind speed of 10.9 m s−1 (Ding et al., 2022). The temperature exhibits significant seasonal variation, with a clear “coreless” winter, meaning that there is no distinct temperature minimum, which is common in the interior of Antarctica due to the unique seasonal sunlight patterns (Fig. 2). Furthermore, temperature variability is much greater during the austral winter (2.46 °C) than during the austral summer (1.67 °C), reflecting the greater frequency of weather events and atmospheric disturbances during the colder months (Ding et al., 2020b, 2022).
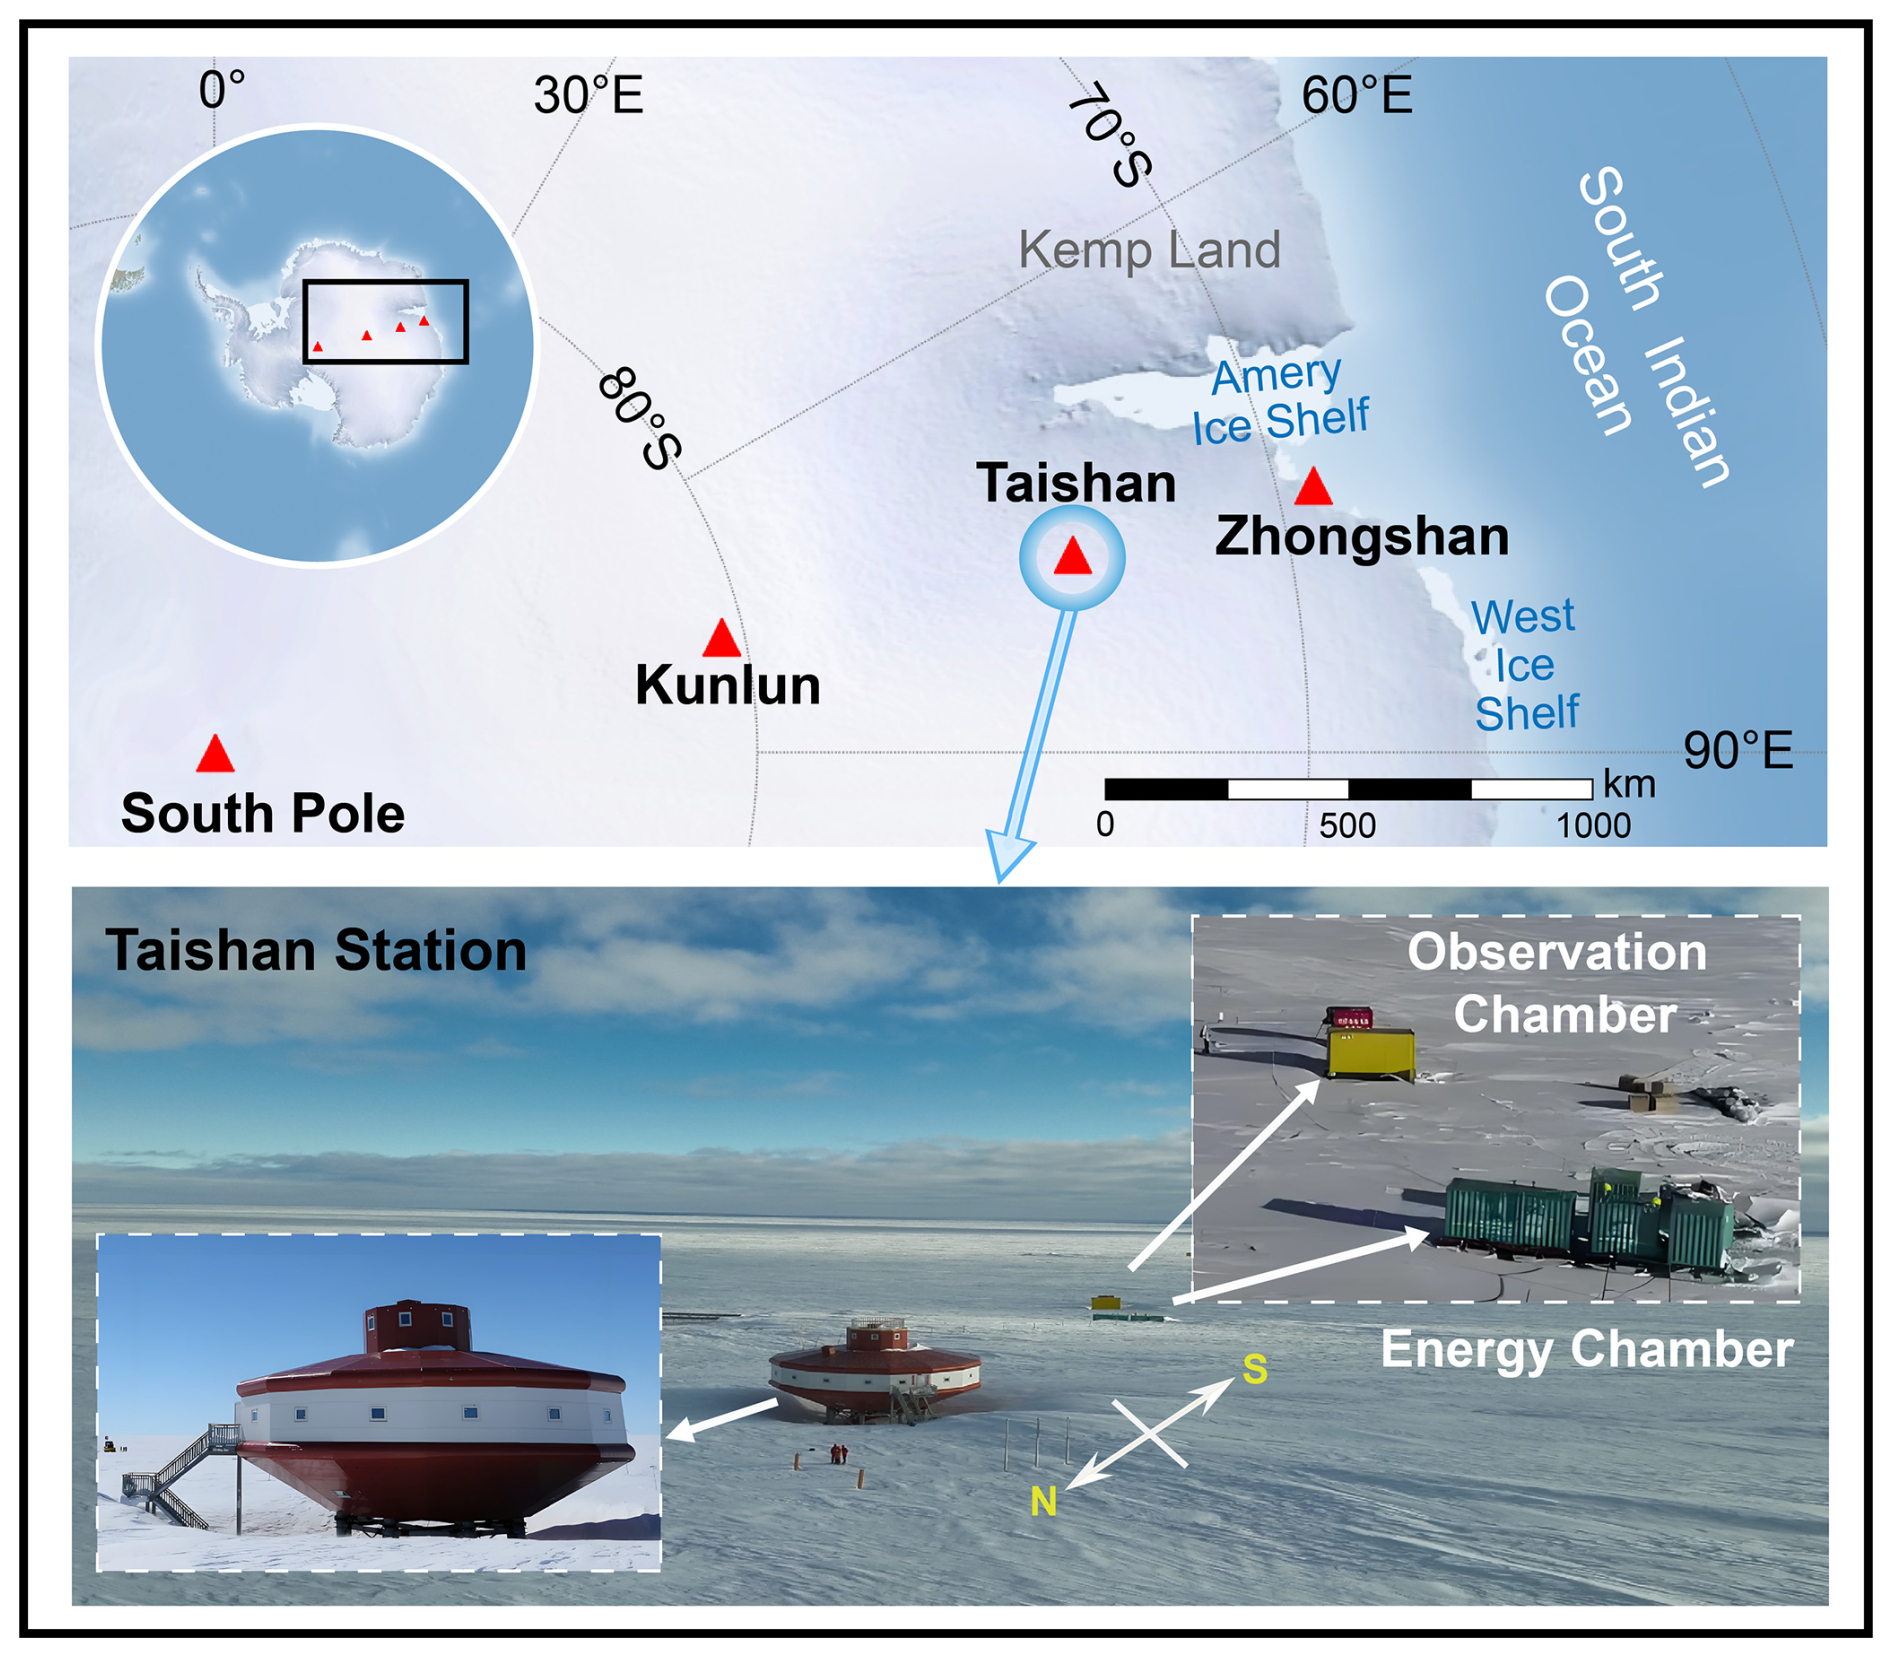
Figure 1Geographical distributions of Taishan station.

Figure 2Multiyear monthly average temperature (a), relative humidity (b), atmospheric pressure (c), wind speed, and wind direction (d, e) at Taishan Station.
The CRUX-1.0 fully automated unattended observation system was deployed at Taishan Station from 10 February to 9 March 2024. This system has achieved simultaneous monitoring of CO2 and O3 and obtained continuous observation data. Specifically, the CRUX-1.0 system is installed in a yellow observation cabin, which is located approximately 100 m to the southeast of the green-colored unattended generator cabin (Fig. 1). Given that easterly winds prevail at Taishan Station, the air inlet of the observation cabin is positioned on the upwind side of the generator cabin, which effectively minimizes the potential interference of the monitoring results from the exhaust emissions of the generator cabin. Detailed technical parameters and operational mechanisms of this system will be elaborated in Sect. 3.
2.2 Other Observation Stations
This study adopts four representative Global Atmosphere Watch (GAW) background stations covering polar, mid-latitude coastal and alpine regions for atmospheric comparative analysis. The Amundsen-Scott South Pole Station (SPO; 90° S, 24.8° W; 2837 m a.s.l.) is a NOAA-operated Antarctic background station, performing hourly in situ CO2 and O3 observations with biweekly flask sampling and weekly NOAA-2016 scale calibration (Mahesh et al., 2003). It maintains a 98.8 % data continuity rate and provides benchmark Antarctic atmospheric background data (Prinn et al., 2018). Barrow Station (BRW; 71.32° N, 156.61° W; 11 m a.s.l.), a key NOAA GMCC Arctic coastal station, conducts hourly CO2 and O3 monitoring and biweekly flask cross-validation. Influenced by North American emissions and Arctic atmospheric circulation, BRW captures both pristine Arctic background air masses and regional pollution episodes, with all data standardized to 10 min intervals via NOAA quality control protocols (Heintzenberg, 1989). The long-term NOAA-operated Mauna Loa Station (MLO; 19.54° N, 155.58° W; 3397 m a.s.l.), established in 1958, hosts the world’s longest continuous greenhouse gas observation records. It implements hourly WMO GAW-calibrated CO2 and O3 monitoring and daily flask sampling, and its remote marine location minimizes anthropogenic interference to ensure reliable mid-latitude baseline observations (Keeling, 1976). As a high-altitude alpine background station under the ACTRIS network, Jungfraujoch Station (JFJ; 46.54° N, 7.96° E; 3580 m a.s.l.) monitors CO2 and O3 at 6 min intervals, with weekly flask sampling and monthly systematic calibration, effectively reflecting mid-latitude European atmospheric trace gas variations. The station maintains a long-term data completeness of approximately 92 % under routine quality assurance (Sturm et al., 2012). Notably, systematic biases between NOAA and AGAGE datasets are less than 1 % for CO2 and 3 % for O3, which are sufficiently small to be negligible for regional and global comparative analyses (Prinn et al., 2018).
The preliminary version of the unmanned automatic observation system, CRUX-1.0, is designed with 4 main modules: a sampling and calibration module, an analysis module, a temperature control module and a data communication module.
3.1 Sampling and Calibration Module
3.1.1 Sampling
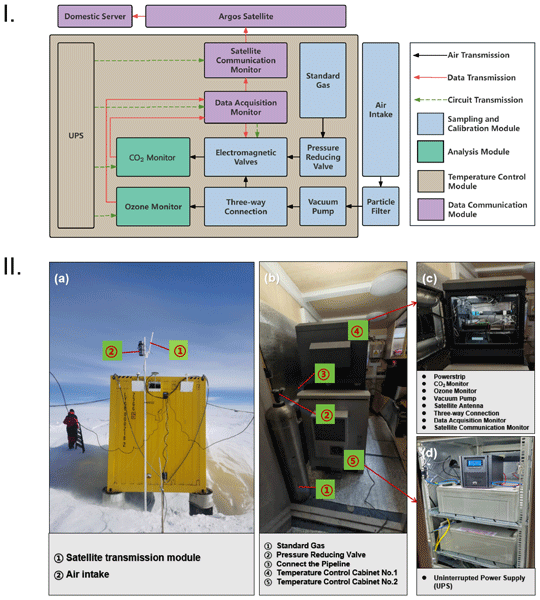
The sampling module is responsible for collecting atmospheric gas samples and ensuring their consistent flow into the analysis module for evaluation (see Fig. 3-I). It consists of several key components that work together to maintain a stable and reliable system. The intake port, positioned at a height of 2.9 m (see Fig. 3-IIa), ensures that the air samples are representative of the surrounding atmosphere and not influenced by local pollutants or snow. Furthermore, the inlet is installed with a Thermo-5030i pre-filter matched with a 47 mm-diameter, 5.0 µm MILLIPORE PTFE membrane filter. This filter can efficiently block blown snow particles and coarse dust, effectively avoiding pipeline clogging induced by frequent blowing snow in Antarctica and enhancing the environmental suitability of the sampling setup. This elevated position and filter are crucial for ensuring that the collected data are as accurate as possible.
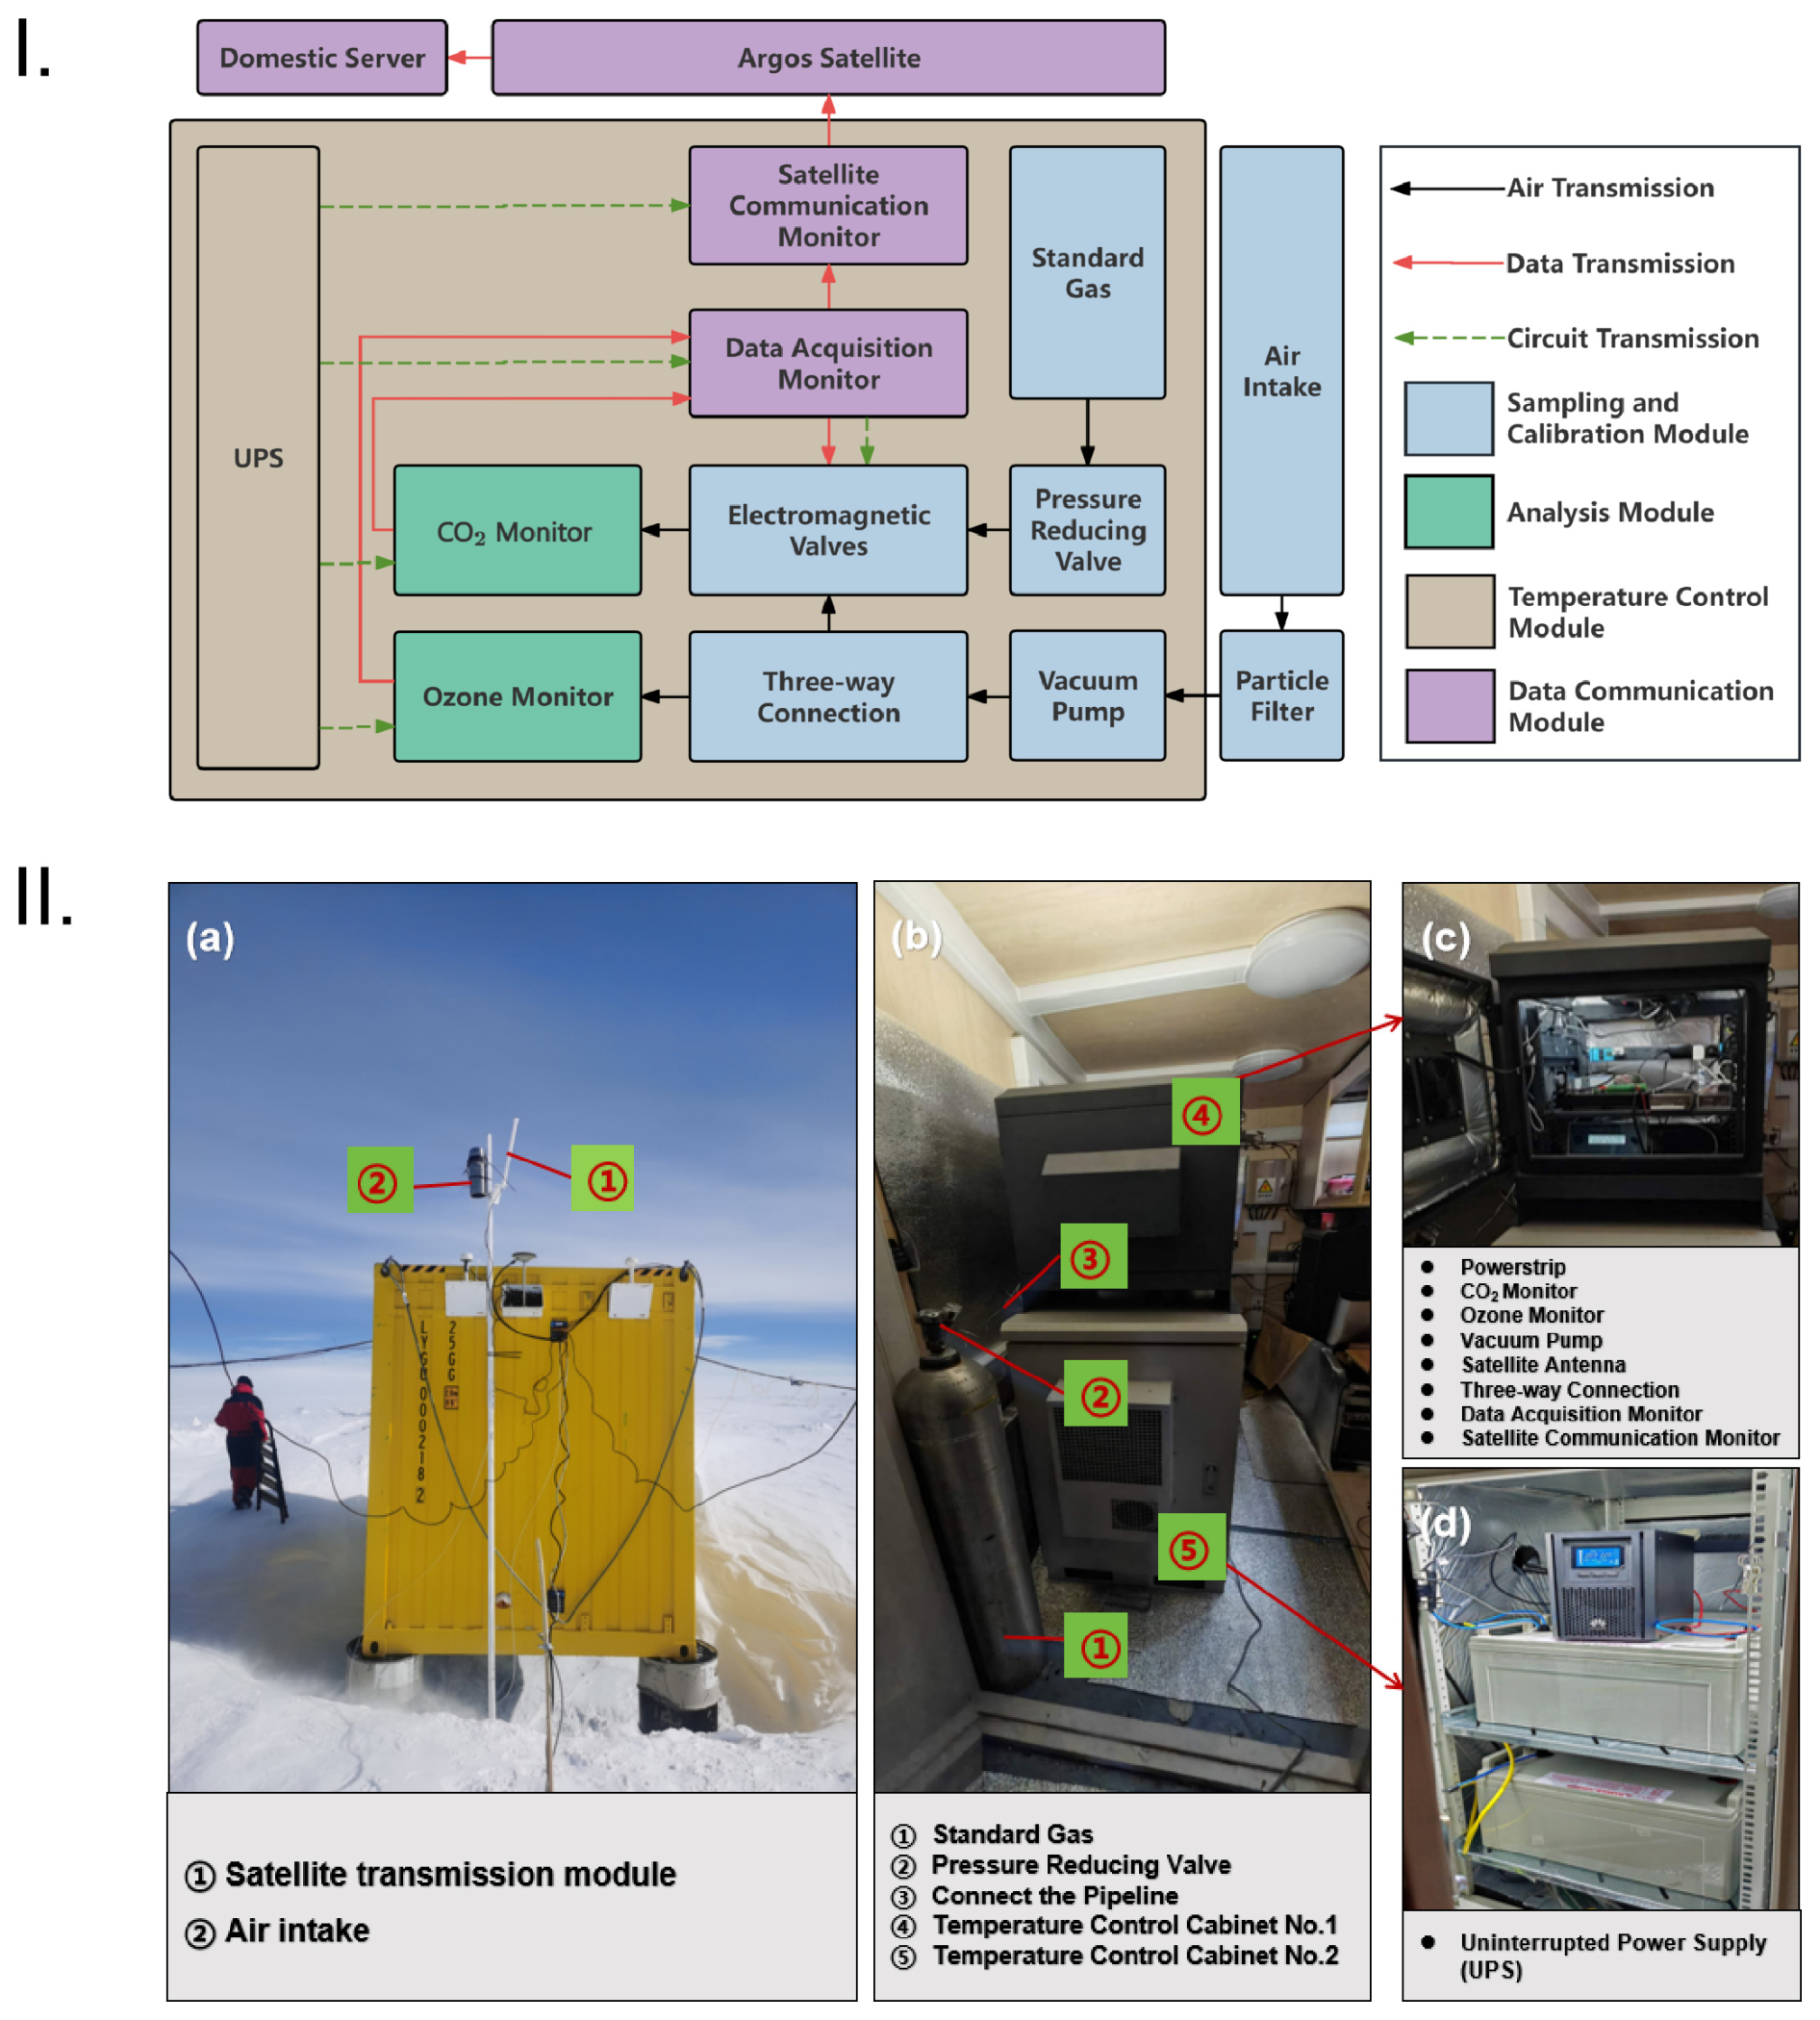
Figure 3Functional and structural layout (I) and onsite installation and layout (II) of the unmanned automated CO2 and surface ozone observation system at Taishan Station.
The gas flow controller, which includes a vacuum pump (Kamoer KZP-PE model: low rate ≥ 7 L min−1; power ≤ 12 W; positive pressure ≥ 0.2 MPa), standard gas cylinder pressure-reducing valve, and flow controller, ensures that the gas is drawn into the system at a constant rate (see Fig. 3-IIb and c). The vacuum pump helps maintain a positive pressure airflow, whereas the flow controller regulates the gas flow for consistent sampling. Additionally, the system incorporates three-way and electromagnetic valves to allow the sampling system to switch between different sampling points or introduce calibration gases as needed. The overall design of the sampling module considers the dominant wind direction at Taishan Station, with the intake positioned in the upwind direction of the energy bin to minimize contamination from emissions. This thoughtful design ensures that the sampling module operates efficiently, even in harsh Antarctic environments.
3.1.2 Calibration
The calibration module is designed to eliminate instrument drift through standard gas calibration, ensuring the accuracy and stability of the observation data. The standard gas cylinder pressure-reducing valve controls the output pressure of the standard air, with the secondary gauge set to 2 psi. This setting ensures that the instrument's intake pressure is met while conserving the standard air as much as possible, thereby extending its usage duration. Each standard gas cylinder is certified for high precision and traceability and is equipped with a single-stage pressure-reducing valve. The cylinders are connected to the electromagnetic valve via in. stainless steel tubing, ensuring the stability of the gas mixing ratios during transmission.
The electromagnetic valve is powered and controlled by the CR1000 data logger, which operates the valve at scheduled intervals through a prewritten control program. This program switches between external air and standard air intake, ensuring a consistent and controlled flow. To maintain a constant airflow through the instrument, a flow controller is installed downstream of the electromagnetic valve, preset to a constant flow rate. This ensures precise control over the gas flow entering the monitoring sensors, improving the accuracy of the measurements.
To prevent instrument drift from affecting the observation data, the system incorporates a standard gas calibration system, following the atmospheric background observation guidelines. The data logger sends instructions to the electromagnetic valve to allow standard air to flow into the system twice daily – every 11 h and 10 min for a 10 min period. This calibration process ensures that the sensor is calibrated and that any drift is corrected while considering the limitations of energy consumption and the unmanned operating conditions at Taishan Station.
3.2 Analysis Module
3.2.1 CO2 Monitor
To meet the energy consumption requirements at Taishan Station (where the atmospheric composition monitoring system needs to maintain a power consumption of less than 0.5 kW), a low-power LICOR-830 CO2 analyzer (see Fig. 3-IIc) is used in this experimental system. This device operates via the nondispersive infrared (NDIR) method, which consumes approximately 20 W of power. The NDIR method is considered one of the simplest yet effective technologies for gas detection because of its moderate sensitivity and fast response time. The LICOR-830 is widely used in various research fields, including agronomy, ecology, global carbon cycling, and climate change studies (Griffiths, 1983; Ekeberg et al., 2004; Chen et al., 2010).
The core components of the analyzer include an infrared light source, a light chamber, filters, and a detector. The working principle is as follows: infrared radiation emitted by the light source passes through the target gas in the light chamber. If the spectrum of the radiation overlaps with the absorption spectrum of the target gas, the gas absorbs photons at specific wavelengths according to the Beer–Lambert law (Kwon et al., 2009). After passing through the gas, the infrared radiation is filtered so that only the wavelengths absorbed by the gas are retained. These specific photons, which contain mixing ratio information, are detected by the sensor, and the signal is processed to display the mixing ratio of the greenhouse gas (Xu et al., 2022).
Prior to deployment at Taishan Station, a preexpedition laboratory experiment was conducted to quantify the precision differences between the LICOR-830 and the Picarro G2301 greenhouse gas analyzers. This experiment aimed to assess the performance of observation systems based on different principles for measuring greenhouse gases (Nan et al., 2024). Through repeatability tests, drift tests, and target gas calibration tests, it was found that the accuracy of the LICOR-830, after calibration, met the WMO requirement of less than 0.1 ppm and was comparable to the advanced international accuracy level of the Picarro G2301, demonstrating its significant application potential in greenhouse gas monitoring.
3.2.2 Ozone Monitor
For ozone monitoring, a Model 205 ozone monitor from 2B Technologies (see Fig. 3-IIc) was used in this experiment. This model was previously deployed in a year-long ground-based ozone observation experiment at Kunlun Station in Antarctica in 2016, where it successfully collected comprehensive observational data (Ding et al., 2022). Model 205 has demonstrated excellent applicability in ozone mixing ratio monitoring, both domestically and internationally. It is energy efficient, highly accurate, compact, and lightweight, making it an ideal tool for monitoring atmospheric ozone mixing ratios in outdoor or field environments (Ollison et al., 2013; DiGangi et al., 2018; Tian et al., 2022).
The Model 205 ozone monitor operates via ultraviolet photometry (Williams et al., 2006). The ozone mixing ratio was measured by detecting its maximum absorption at a UV wavelength of 253.7 nm. When an air sample enters the instrument's gas flow system at a constant flow rate, two electromagnetic valves alternate in directing the sample either into the absorption chamber or through an ozone filter before entering the absorption chamber. The absorption chamber concentrates stable UV light produced by the UV light source. Owing to the absorption characteristics of ozone at 254 nm, the intensity of transmitted light as the gas passes through the chamber is detected, providing accurate and stable measurements of the ozone mixing ratio. Instruments based on this method are widely used in pollution monitoring, including atmospheric and water pollution (Tanimoto et al., 2006).
Calibration of the ozone monitor requires an ozone calibration instrument that meets international traceability standards. Therefore, cross-mixing ratio calibrations are performed every three months according to observation protocols. However, the calibration procedures for Antarctic ice sheet instruments differ from those at manned stations. For instance, in 2011, after the BAS team retrieved all instruments from the observation network to Halley Station, they validated them using the newly calibrated TE-Model 49C. Upon returning to Cambridge, the instruments were re-calibrated using the NPL-certified TE-Model 49iPS, confirming that the calibration parameters of the 10 instruments remained stable throughout the year's deployment, with data deviations not exceeding the initial accuracy range of 2 % (Bauguitte et al., 2011). In 2016, testing at Antarctic Dome A confirmed the stable operation of the instrument in the field, and reliable observations can be obtained by conducting calibrations twice per year (Ding et al., 2020a). Owing to the overall energy consumption limitations and unattended conditions at Taishan Station, we conducted calibrations before deployment and after retrieval. This strategy is sufficient for the 1-month experiment, because the 2B Model 205 monitor features ultra-low intrinsic drift (<3 ppb yr−1 for baseline drift, <3 % yr−1 for sensitivity drift). The drift over one month was verified to be <2 % in laboratory tests and Antarctic field applications (Wang et al., 2017), meeting the WMO/GAW accuracy requirement.
3.3 Temperature Control Module
The temperature control module is designed to ensure the stable operation of the monitoring equipment under extreme Antarctic conditions, especially the freezing temperatures at Taishan Station. This module includes a temperature control cabinet, a gas flow controller, and an uninterruptible power supply (UPS) (see Fig. 3-IIb-➃, ➄). The temperature control cabinet is equipped with precise sensors and adjustment mechanisms that maintain a stable internal temperature range for the equipment, protecting it from extreme cold at the station.
To meet the appropriate temperature range for the operation of CO2 and ozone monitoring while reducing the energy consumption of temperature control, the temperature control accuracy is ±1.0 °C, and the heating response time is 5 min, and the minimum heating temperature of the temperature control cabinet is preset to 10 °C. When the internal temperature drops below 10 °C, the system begins to heat; when the temperature exceeds 15 °C, heating stops, ensuring that the equipment remains within a safe and optimal operating temperature range. This design ensures that the monitoring instruments are effectively protected in the extremely low-temperature environment of Taishan Station (which can reach as low as −40 °C). The environmental monitoring and control system, which includes temperature regulation, is the highest power-consuming component in the entire system, with a peak power consumption of 250 W. Given the power constraints at Taishan Station, energy efficiency is a crucial consideration in the design of the temperature control system. This is balanced with the need to maintain a stable environment for the equipment.
Since the experimental system is powered by Taishan Station's external energy cabin, an uninterruptible power supply (UPS) system is installed to prevent sudden power outages or voltage instability from negatively impacting the system's operation (Fig. 3-IId). The UPS provides stable and reliable power to the entire monitoring system (see Fig. 3-IId). In the event of an external power failure, the UPS can quickly switch to backup power. The battery backup can last up to 48 h, ensuring the continuous operation of the monitoring system and uninterrupted data collection. This design significantly enhances the system's reliability and fault tolerance, providing a safeguard against power disruptions in the remote environment.
3.4 Data Communication Module
The satellite communication system consists of a customized bracket (with a height of 3 m) and an integrated transmitting antenna (Fig. 3-IIa-➀), enabling high-speed and stable data transmission to a remote data center. This module uses ARGOS (full system: Argos Data Collection System, named after the all-seeing giant Argus from Greek mythology) satellite communication technology, with a data transmission interval of 1 h, ensuring the real-time transmission of monitored data processed by the data logger in the harsh Antarctic environment, which can avoid potential interruptions and delays that could arise with traditional ground communication methods. The stable applicability of this satellite communication module in Antarctica has been verified through testing at the Prydz Bay-Amery Ice Shelf-Dome A (PANDA) profile automatic weather station (Ding et al., 2022).
The data processing and storage system uses the CR1000X measurement and control data logger (see Fig. 3-IIc), a low-power device primarily used for sensor measurements, direct/remote communication connections, data analysis, external device control, and storage of data and programs. It features a sealed design to shield against radio frequency interference and a stainless steel housing. Equipped with a precise clock, it supports the BASIC-like programming language commonly used by Campbell Scientific data loggers, which includes data processing and analysis capabilities.
The CR1000X connection panel has two 12 V terminals, 16 analog measurement terminals, and detachable connectors. It is responsible for receiving raw data from two monitoring sensors, performing preprocessing, analysis, and storage. This module has powerful data processing capabilities, enabling it to filter out and correct anomalous data points in real time, ensuring the reliability of the data quality. Additionally, the module supports remote data access and download functions, allowing researchers to retrieve and analyze monitoring data at any time.
4.1 Observational results
From 10 February to 12 March 2024, the observation system at Taishan Station operated autonomously under unattended low-temperature conditions, with good performance, and satellite remote data transmission was normal. By analyzing the transmitted data, we found the following: in the environment at Taishan Station, where the average temperature was below −25 °C in February, the internal temperature of the equipment cabinet was able to be stably maintained at 13.9 ± 2.5 °C (Fig. 4a), meeting the environmental temperature requirements for both types of optical cavity equipment used in this experiment.
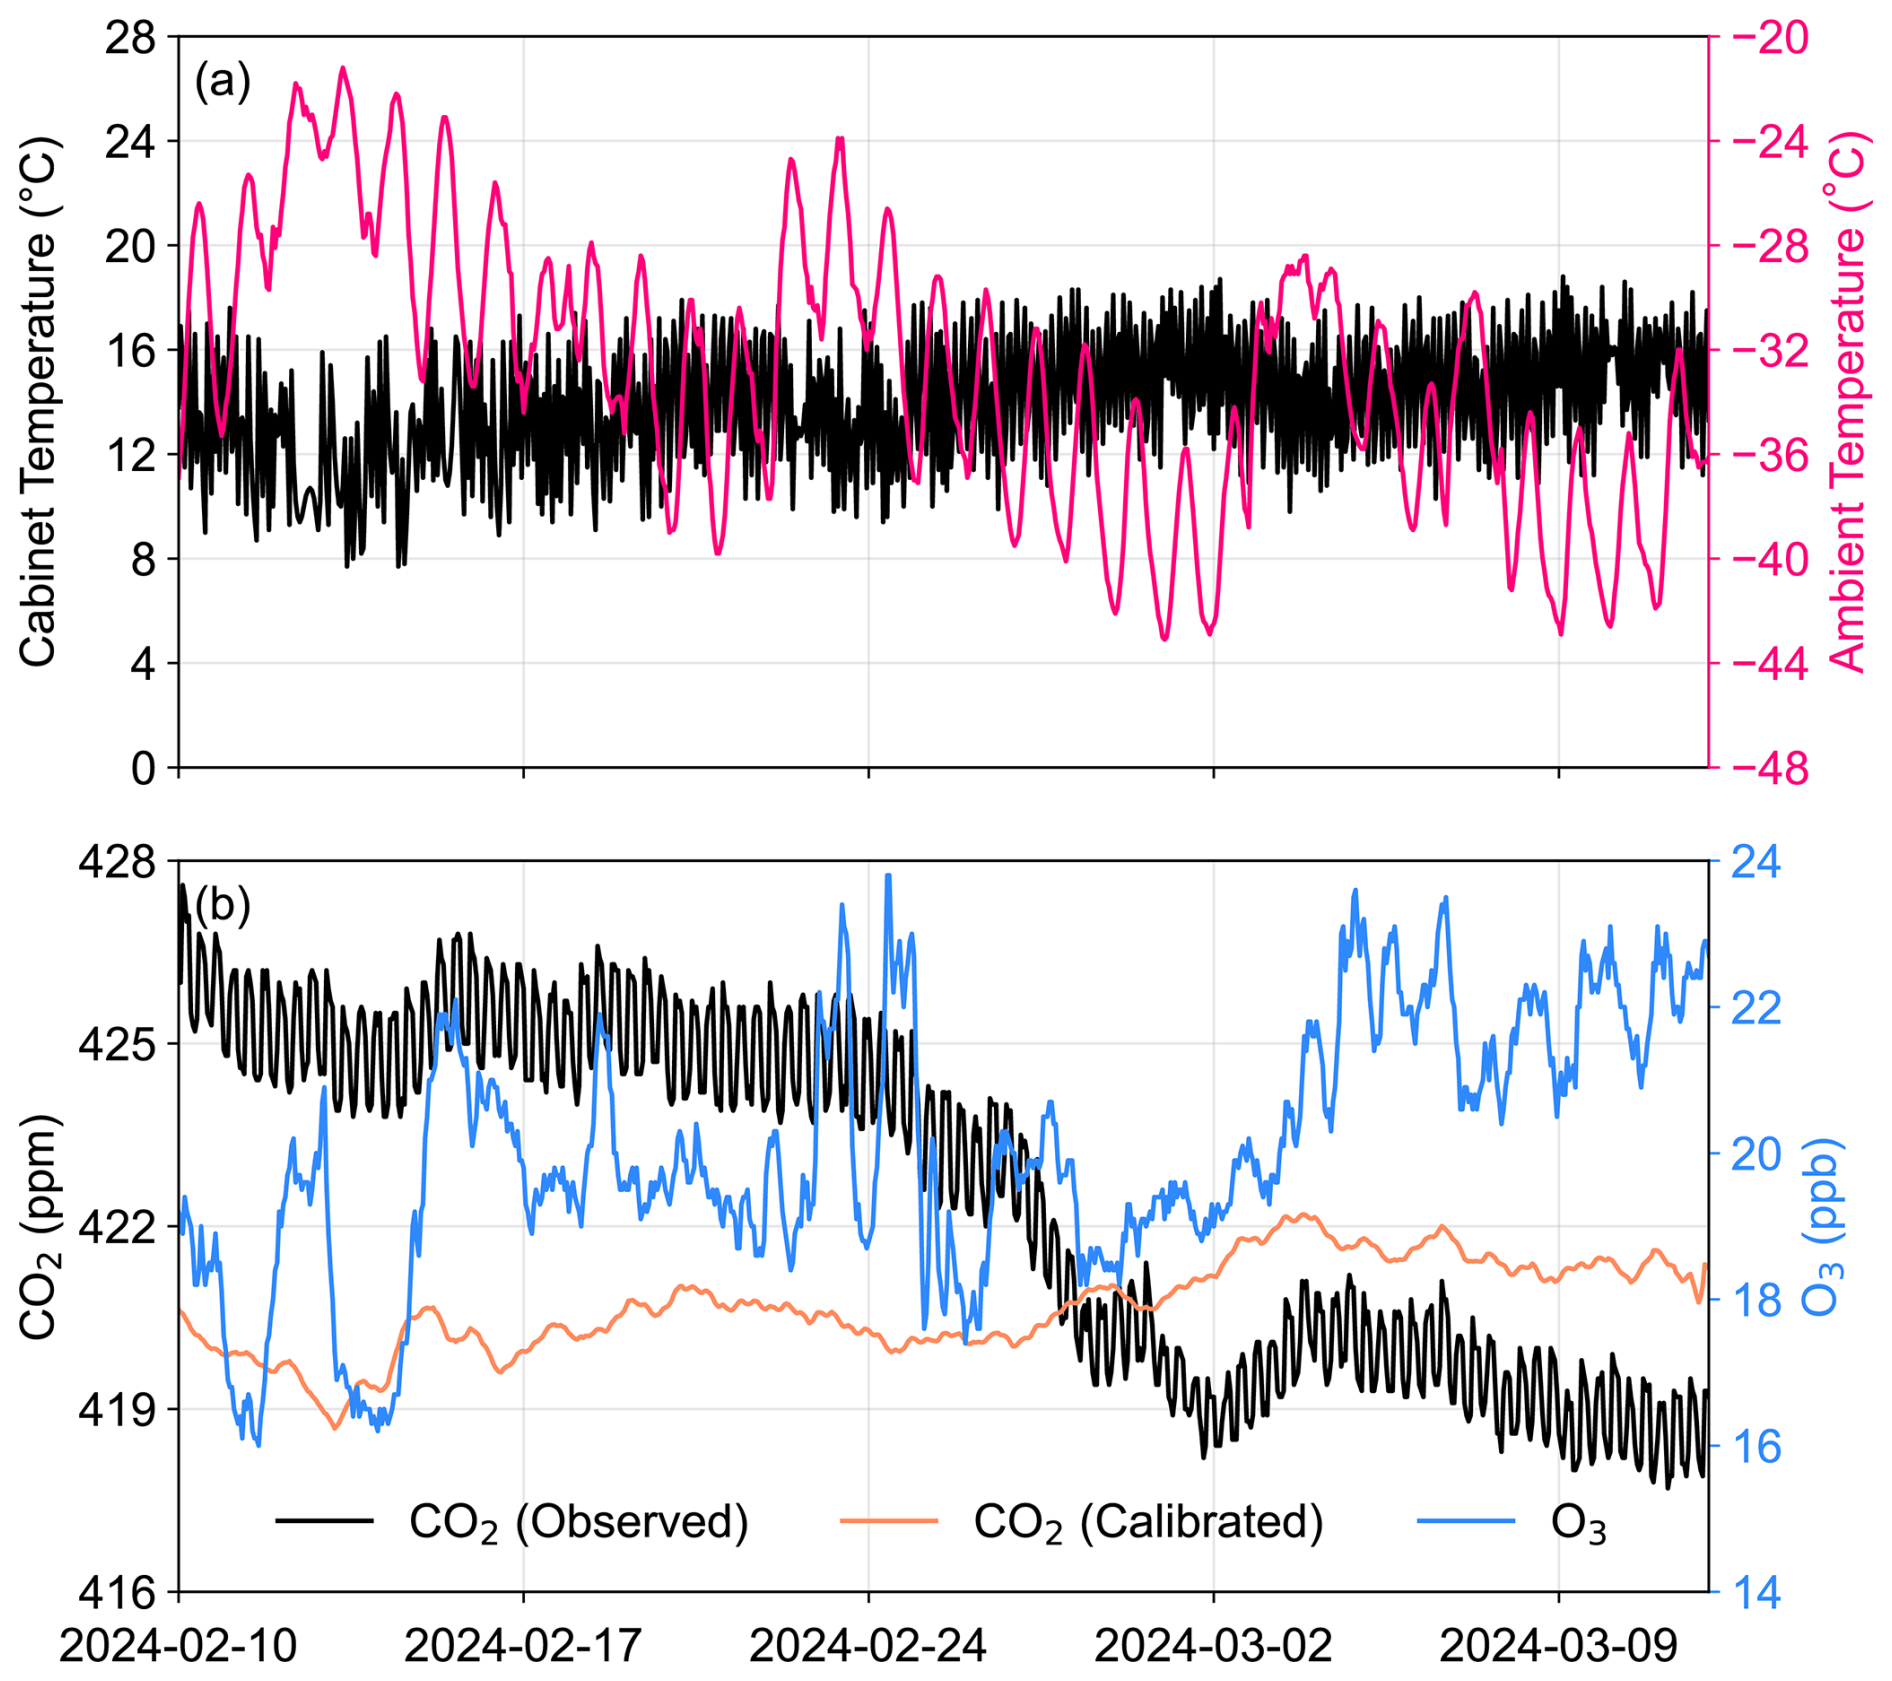
Figure 4Compares synchronous in-cabinet temperature (black, left axis) and outdoor ambient temperature (pink, right axis) (a), hourly average mixing ratio of observed CO2, hourly average mixing ratio of calibrated CO2 and O3 mixing ratio transmitted from the unattended automated observation system at Taishan Station (b).
The hourly average CO2 mixing ratio observed at Taishan Station was 422.6 ± 2.8 ppm (Fig. 4b). To ensure the accuracy of observational data, we first analyzed concurrent meteorological parameters including wind speed and wind direction, and verified that generator exhaust exerted no direct interference on the monitoring data (Fig. S1 in the Supplement). To constrain instrumental drift under unattended field conditions, the system executes an automatic 10 min standard gas calibration every 11 h; this customized calibration interval comprehensively balances drift correction efficiency, limited on-site power supply and automatic operation requirements. All CO2 raw datasets underwent standardized multi-step QA/QC procedures sequentially: exhaust interference exclusion based on sampling layout and field wind rose statistics, wind-speed-dependent pollution screening, quantitative mixing ratio calibration, and final 48 h moving average smoothing for noise reduction. The daily-averaged calibrated CO2 mixing ratio was determined as 420.7 ± 0.7 ppm. The ozone raw datasets were calibrated using the five-point cross-mixing ratio formula (, R2=0.9998). This calibration function was established in laboratory before instrument shipment via systematic calibration on the Model 205 ozone analyzer with a Thermo 49ips standard ozone calibrator. Upon completion of the QA/QC procedures, the daily-averaged calibrated surface ozone mixing ratio at Taishan Station was 20.1 ± 0.8 ppb. Full technical details of each QA/QC step are provided in the Supplement.
4.2 Accuracy evaluation
We evaluated system performance using WMO/GAW required indicators: CO2 (zero drift ≤0.1 ppm per month, span drift ≤0.2 % FS, accuracy ±1.5 ppm); O3 (zero drift ≤0.5 ppb per month, span drift ≤1 % FS, accuracy ±0.8 ppb), plus standard deviation and coefficient of variation (CV) (Global Atmosphere Watch [GAW], 2001). The standard deviation provides insight into the dispersion of measurement data, reflecting the precision and stability of the system. On the other hand, CV, which normalizes the standard deviation by the mean value, allows for a comparison of variability across different parameters and conditions, regardless of their magnitude. Using these two metrics, we evaluated the precision of O3 and CO2 mixing ratios, as well as the cabinet temperature, over time.
Prior to the Antarctic field campaign, we had been completed laboratory performance intercomparison between the LICOR-830 analyzer used in this work and Picarro G2301 by means of repeatability, long-term drift and three-point cross-mixing ratio calibration with traceable CO2 standard gases, with related test plots (Figs. S2–S5) attached in the Supplement. The test results indicated that LICOR-830 had a repeatability of 0.4 ppm versus 0.04 ppm for Picarro G2301, alongside drift biases of −4.22 % and 0.82 % respectively; after three-mixing ratio standard gas calibration for 1 h, LICOR-830’s precision was markedly optimized to 0.026 ppm (bias: −0.11 %), while Picarro G2301’s precision changed slightly to 0.0341 ppm with an accuracy of 0.03 %.
In addition, for the ozone measurement module equipped with a 2B Model 205 dual-beam UV analyzer, multi-point calibration conducted before and after field deployment meets the data quality requirement for 1-year Antarctic observation (Bauguitte et al., 2011; Ding et al., 2020a). The laboratory comparison test (Fig. S6) between Model 205 and WMO reference Thermo Model 49i proved excellent measurement consistency (R2=0.9998), with most absolute deviations below 4 ppb, and regular mixing ratio-dependent bias can be fully corrected by linear fitting using pre- and post-campaign calibration results. Laboratory aging experiments demonstrate the intrinsic monthly zero drift of Model 205 is less than 0.6 ppb; after adding extra thermal drift from periodic cabinet temperature fluctuation, the total monthly drift remains below 0.7 ppb, within the WMO/GAW allowed total uncertainty of ±0.8 ppb for O3.
The O3 mixing ratio (black line) consistently has a low standard deviation and minimal fluctuations, indicating high measurement stability. In contrast, the original CO2 mixing ratio (yellow line) displays substantial variation, with a peak standard deviation of 1.8, suggesting lower precision (Fig. 5a). The cabinet temperature (blue line) maintains a stable standard deviation, although a stepwise decrease over time suggests some control, albeit with potential for further improvement. In terms of the CV, the O3 mixing ratio remains low (<6 %) and continues to decrease over time, reflecting enhanced measurement consistency. As illustrated in Fig. 4, the ambient surface temperature at Taishan Station fluctuates widely between −45.0 and −20.5 °C with prominent diurnal cycles, whereas the active thermal cabinet limits internal instrument temperature within 8.0–19.0 °C with a CV of 16 %–20 % (±2.5 °C fluctuation). Comparative time-series analysis of CO2 and O3 in Fig. 4b confirms that such cabinet temperature variation only yields tiny measurement drift (≤0.2 ppm h−1 for CO2, ≤0.1 ppb h−1 for O3), with no significant impact on measurement results (Fig. 5b). Postcalibration, the CO2 mixing ratio (red line) significantly decreases in CV, approaching 0 %, demonstrating the effectiveness of calibration in improving measurement accuracy.
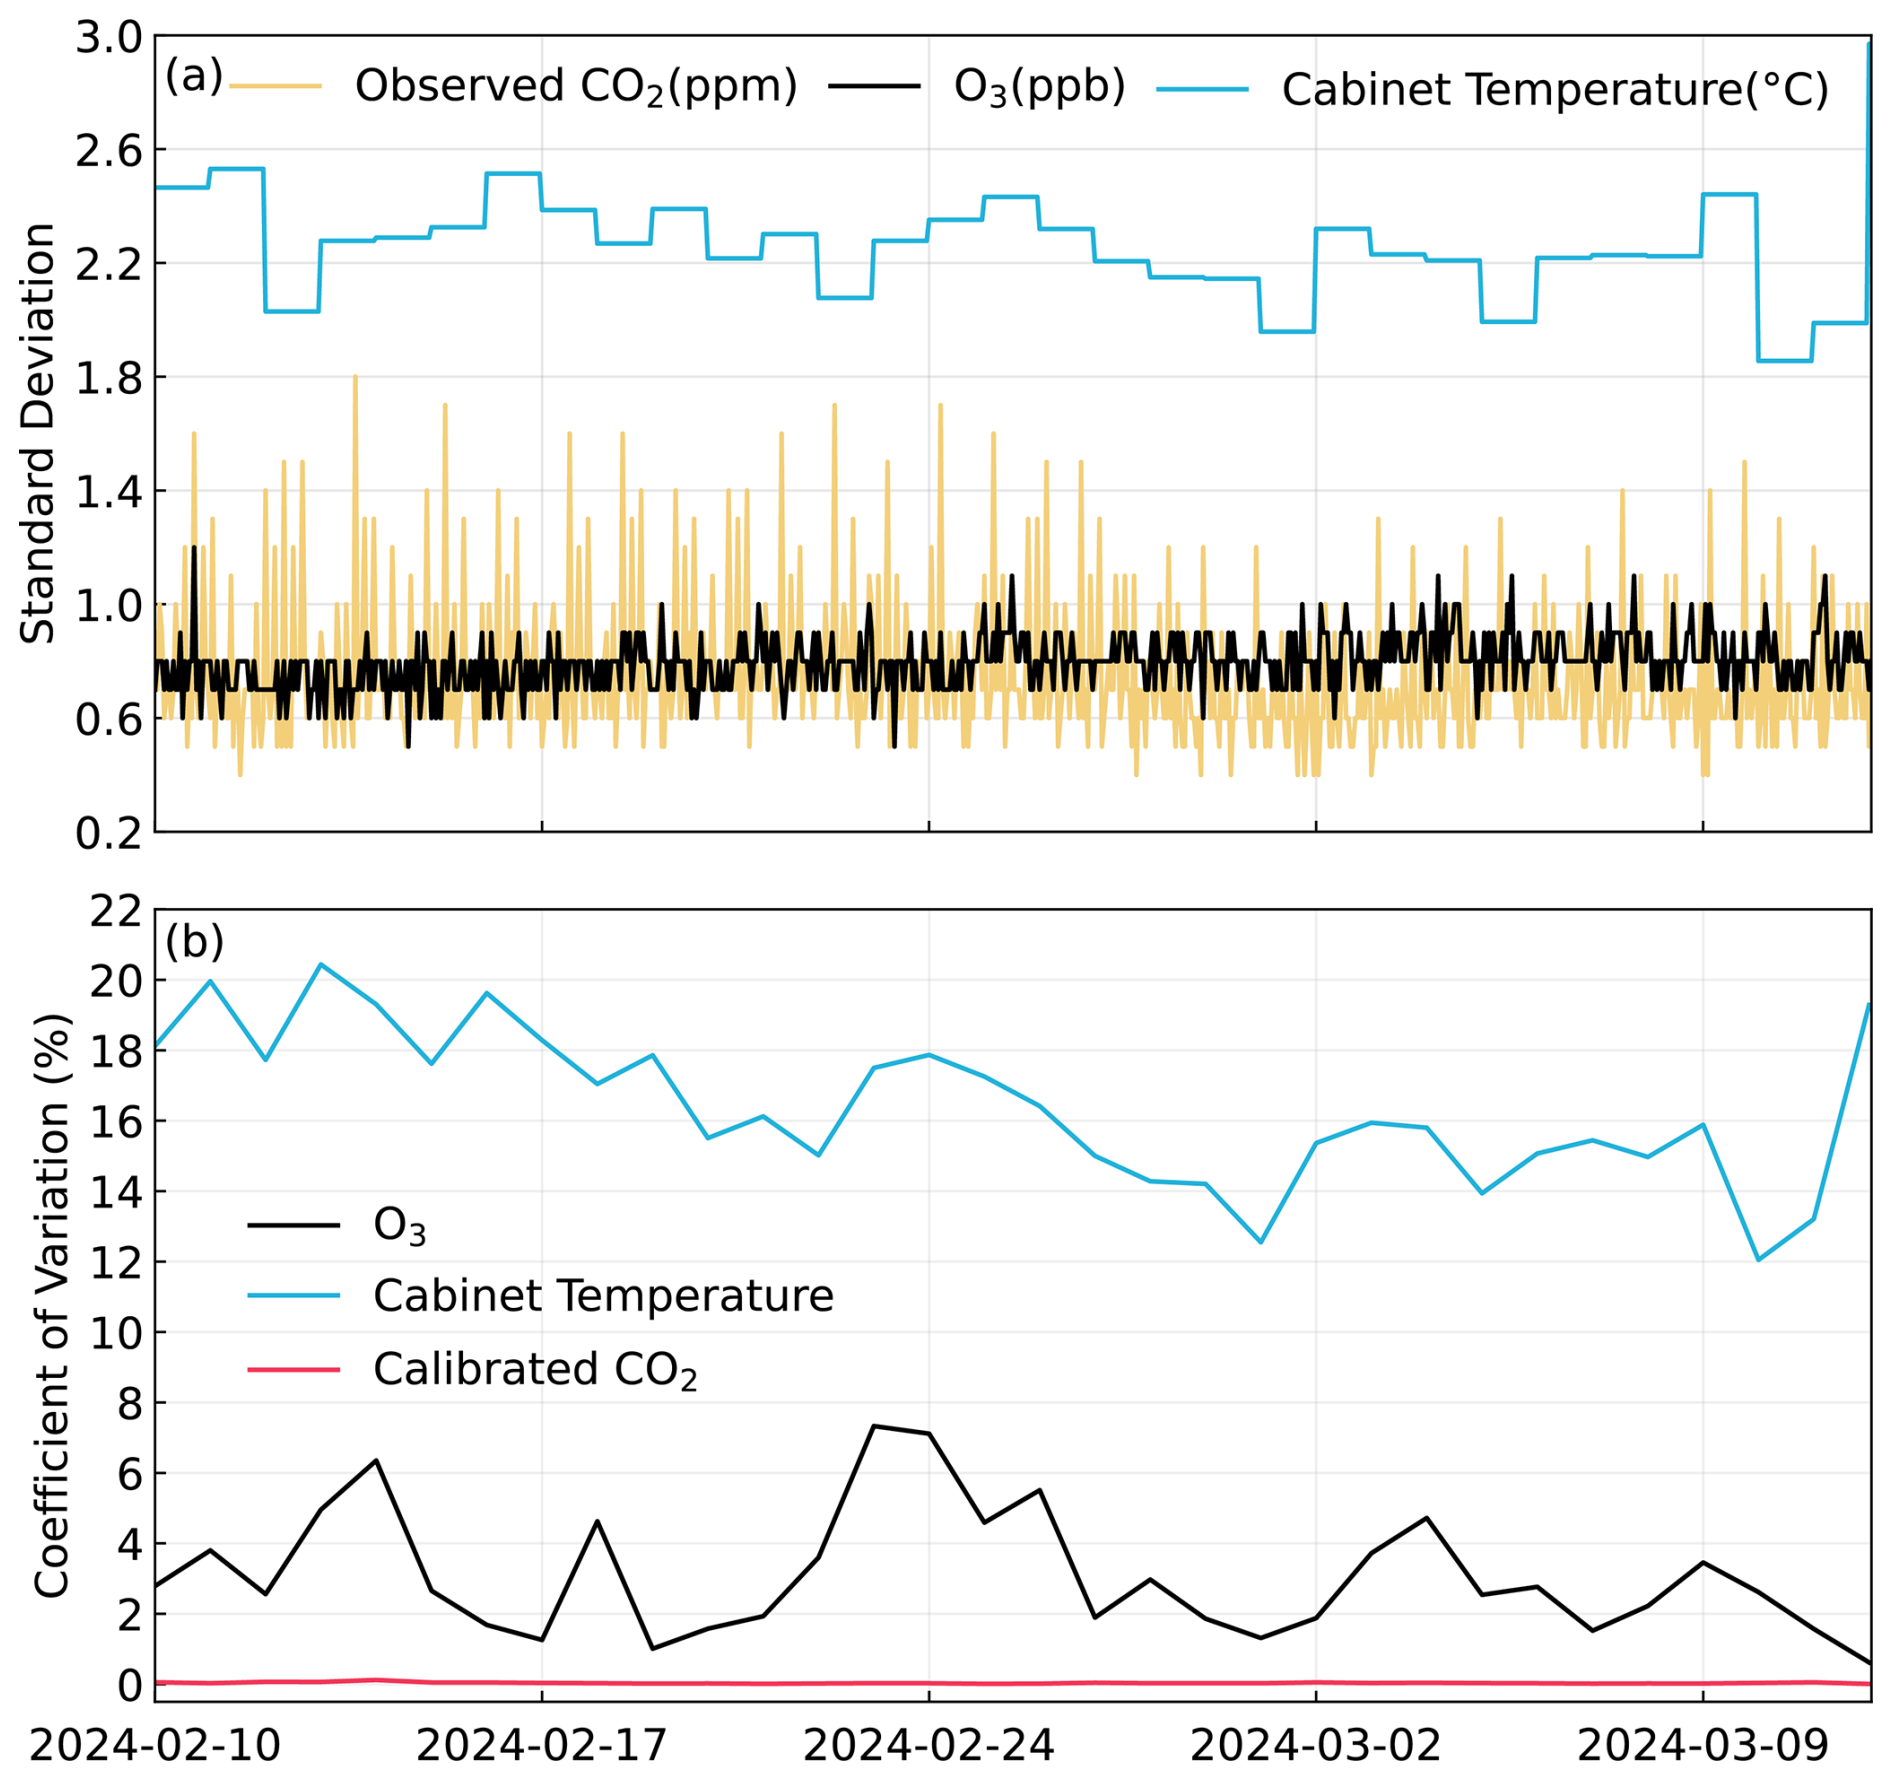
Figure 5Evaluation of the Precision of O3 and CO2 mixing ratios and Cabinet Temperatures through Standard Deviation and Coefficient of Variation Analysis Standard Deviation (a) Coefficient of Variation (b).
5.1 Performance Comparison
Traditional manned stations (e.g., South Pole Station) have irreplaceable advantages: real-time troubleshooting, flexible parameter adjustment, and weekly on-site calibration (measurement uncertainty <0.5 ppm, better than CRUX's ±1.0 ppm for CO2). However, manned observations face high logistics costs and data gaps due to extreme weather evacuations. CRUX compensates for these shortcomings: its unattended operation mode eliminates the need for resident staff and frequent resupply, substantially reducing routine logistical costs; its 48 h UPS backup also ensures data continuity during short-term power outages. The good consistency with South Pole Station data (CO2: 420.7 ppm vs. 418.2 ppm; O3: 20.1 ppb vs. 20.5 ppb) indicates reliable measurement quality under the current short-term stable deployment, providing supporting evidence for its potential to complement manned observations in the future.
As shown in Table 1, CRUX's strengths lie in integrated optimization for Antarctic inland conditions: (1) Balanced performance: it reduces power consumption by 92 % compared to the initial 3 kW version, achieving <350 W operation while maintaining multi-parameter detection, adapting to polar green energy constraints. (2) Extreme cold reliability: active temperature control isolates −25 to −40 °C external temperatures, and upwind intake with particle filters mitigates blowing snow interference. (3) High autonomy and accuracy: twice-daily auto-calibration reduces CO2 CV to near 0 %. Field tests revealed minor limitation flaws: (1) Temperature control lag: A 5 min heating response delay leads to 16 %–20 % cabinet temperature CV, potentially causing 0.2 ppm h−1 drift of the LICOR-830 analyzer. (2) Insufficient long-term power: 48 h UPS backup. (3) Limited adaptability: fixed-time calibration cannot respond to sudden sensor drift; only two parameters are monitored.
Table 1Comparison of the Polar Automatic GHG or Ozone Observation Systems.

5.2 Site Comparison
To verify the global representativeness of measurements from CRUX-1.0 at Taishan Station, quantify the regional differences in atmospheric CO2 and O3 between polar and mid-latitude background regions,
To present the latitudinal gradient of global atmospheric background concentrations and verify the reliability of CRUX-1.0 data against the same-region reference station, comparative analysis was conducted on concurrent CO2 and O3 datasets from five stations. It should be noted that stations with different latitudes and environments are not used to directly validate system performance, but to provide a global background context. The selected stations cover distinct geographical locations (polar vs. mid-latitude) and operational modes (unattended vs. manned), including Taishan Station (Antarctic inland, unattended), South Pole Station (Antarctic coastal, manned), Barrow Station (Arctic coastal, manned), Mauna Loa Station (mid-latitude marine, manned), and Jungfraujoch Station (mid-latitude alpine, manned) (Fig. 6a).

Figure 6(a) Global distribution of selected atmospheric background stations; (b) time series of hourly CO2 mixing ratios and (c) time series of hourly surface O3 mixing ratios observed at these stations during the concurrent period (10 February–12 March 2024). This figure aims to validate the reliability and global representativeness of CRUX-1.0 measurements at Antarctic Taishan Station, reveal the distinct regional differences in atmospheric CO2 and O3 between polar and mid-latitude background regions, and confirm the role of the unattended system in complementing the global atmospheric observation network.
Comparative results revealed distinct regional and operational differences in both CO2 and O3 observations. For CO2, polar stations (Taishan and South Pole; mean: 420.7 and 418.2 ppm; hereafter means) exhibited significantly lower baseline mixing ratios than mid-latitude counterparts (Mauna Loa: 424.9 ppm; Jungfraujoch: 427.6 ppm), primarily due to the absence of anthropogenic emissions in the Antarctic inland. Taishan Station also showed smaller fluctuation amplitude (±1.5 ppm), attributed to the homogeneous air masses in the Antarctic inland circulation and interference-free operation of the unattended system, whereas mid-latitude stations displayed larger fluctuations driven by regional emission transport and diurnal cycles. For O3, polar stations (Taishan: 20.1 ppb; South Pole: 20.5 ppb) had much lower mixing ratios than mid-latitude stations (Mauna Loa: 48.9 ppb; Jungfraujoch: 47.1 ppb), which was associated with weak photochemical activity in the Antarctic late summer., which was associated with the low mixing ratios of ozone precursors in Antarctica (due to the dual scarcity of natural and anthropogenic sources) impair the ozone formation potential, while the intense sunlight in summer, chemical depletion triggered by trace amounts of NO, and stable boundary layer conditions jointly lead to surface ozone in Antarctica being dominated by depletion during summer (Tian et al., 2022).
5.3 Long-term deployment challenges
The 1-month validation in this study only confirms the short-term feasibility of CRUX-1.0, which is a common constraint for proof-of-concept polar observation systems. From a broader perspective, long-term autonomous atmospheric observation in Antarctica generally faces three core common challenges: energy supply limitations under polar nights, long-term data quality assurance via autonomous calibration, and extreme environmental adaptability (e.g., blowing snow and ultra-low temperature).
For energy supply, CRUX-1.0 currently relies on Taishan Station’s diesel power infrastructure, which is limited by seasonal manual fuel replenishment. For long-term measurement accuracy, the single-point calibration of CRUX-1.0 is sufficient for short campaigns but has limited drift correction capacity over multi-month deployments.Targeting these challenges, we are conducting iterative upgrades of the CRUX-2.0 system, including a standalone PV-battery-methanol hybrid power system and autonomous multi-concentration calibration capability. The prototype is currently undergoing field validation at Saishiteng Mountain (Qinghai), with detailed parameters and test progress provided in the Supplement (Figs. S7 to S10).
To fill the gap in unattended multi-parameter atmospheric observation in the Antarctic inland plateau, this study developed the CRUX-1.0 fully automated observation system. It is the first system of its kind in this region to achieve synchronous CO2 and surface O3 monitoring with low-power design and automatic calibration. Integrating four core modules – sampling and calibration, analysis, temperature control, and data communication – the system is specifically optimized for polar conditions, featuring key characteristics such as total power consumption below 350 W, active cabinet temperature regulation maintaining 10–15 °C, twice-daily automatic single-point calibration for CO2, and a 48 h UPS backup, making it well suited for remote sites with limited logistic support.
Deployed and operated continuously at Taishan Station (72.01° S, 92.08° E) from 10 February to 9 March 2024, the system achieved outstanding operational stability with a 99.2 % data recovery rate. Observed calibrated CO2 and O3 mixing ratios (420.7 ± 0.7 ppm and 20.1 ± 0.8 ppb, respectively) show excellent consistency with synchronous reference measurements from South Pole Station; post-calibration CV values reach nearly 0 % for CO2 and below 5.6 % for O3, which validates the reliability of the CRUX-1.0 unattended observation framework under harsh Antarctic conditions. Compared with conventional manned observation platforms, CRUX-1.0 features an unattended operation mode that eliminates the need for resident staff and frequent resupply, substantially reducing routine logistical costs, offering a promising technical reference for filling observational gaps in the East Antarctic inland and supporting the construction of long-term polar monitoring networks.
Nevertheless, CRUX-1.0 still has limitations that restrict long-term year-round deployment in polar regions: continuous PTC heating results in relatively high power consumption; only single-point automatic calibration is available, with limited capacity to constrain span drift over multi-month operation; no reserved hardware interfaces for expanding additional gas species; and the current energy configuration cannot sustain prolonged polar-night operation. Targeting these four prominent bottlenecks (temperature control optimization, long-duration power supply, multi-parameter synchronous measurement, and dynamic calibration), we will carry out with targeted improvements:
- a.
Temperature control and power consumption optimization. Building on heating scheme comparisons in this study, follow-up upgrades will test a combination of self-limiting heating tapes and aerogel thermal wrapping to implement intermittent intelligent temperature control, cutting continuous heating power demand without compromising the thermal stability of internal instruments.
- b.
Long-term energy supply improvement. Future deployments will adopt an optimized PV-battery-methanol hybrid power configuration to alleviate power shortage risks during multi-month polar nights.
- c.
Multi-parameter coordinated monitoring. The next-generation CRUX-2.0 platform reserves modular expansion interfaces to sequentially add CH4, H2O and other trace gas sensors, enabling synchronous multi-component atmospheric observation.
- d.
Dynamic automatic calibration upgrade. Following laboratory intercomparison between the ABB GLA131-GGA analyzer and the Picarro G4301, we have selected the ABB GLA131-GGA configuration; paired with multi-channel solenoid valves, this design supports automatic multi-point standard gas calibration.
The CRUX-2.0 prototype is under field validation at Saishiteng Mountain (Lenghu, Qinghai), with completion scheduled for July 2026 to further enhance the sustainability and performance of polar autonomous atmospheric monitoring.
The in situ CO2 and surface ozone observation data collected at Taishan Station from 10 February to 12 March 2024 are archived and publicly available at the National Tibetan Plateau/Third Pole Environment Data Center (https://doi.org/10.11888/Atmos.tpdc.303486, Tian et al., 2026). The reference CO2 datasets for global background stations were retrieved from the World Data Centre for Greenhouse Gases (WDCGG) of WMO/GAW (https://gaw.kishou.go.jp/data/, last access: 14 December 2025), and the surface ozone datasets were obtained from the European Database for Atmospheric Sounding (EBAS, https://ebas-data.nilu.no/Pages/DataSetList.aspx, last access: 14 December 2025). Both public datasets are accessible in compliance with their respective official data policies.
The supplement related to this article is available online at https://doi.org/10.5194/amt-19-5683-2026-supplement.
Biao Tian was responsible for funding acquisition, field experiment, writing of the original draft, experimental design, and formal analysis. Minghu Ding was responsible for project administration, supervision, resources coordination, and review and editing. Kongju Zhu and Xu Yao were responsible for on-site field experiment. Yixi Zhao was responsible for formal analysis and data visualization. Wenqian Zhang was responsible for system software debugging and remote data acquisition. Diyi Yang, Weijun Sun, Yining Yu, Shoudong Zhao, Yige Cui, Chuanjin Li, Jie Tang, Cunde Xiao, Tong Zhu, and Renhe Zhang were responsible for review and editing.
The contact author has declared that none of the authors has any competing interests.
Publisher's note: Copernicus Publications remains neutral with regard to jurisdictional claims made in the text, published maps, institutional affiliations, or any other geographical representation in this paper. The authors bear the ultimate responsibility for providing appropriate place names. Views expressed in the text are those of the authors and do not necessarily reflect the views of the publisher.
This study was made possible with the support and assistance of the 39th and 40th Chinese National Antarctic Research Expeditions (CHINARE) team. We would like to express our heartfelt gratitude for their invaluable contributions during the data collection process.
This work is financially supported by the National Natural Science Foundation of China (42201151) and the Basic Research Fund of Chinese Academy of Meteorological Sciences (2023Z004, 2024Z007).
This paper was edited by Keding Lu and reviewed by three anonymous referees.
Bauguitte, S. J.-B., Brough, N., Frey, M. M., Jones, A. E., Maxfield, D. J., Roscoe, H. K., Rose, M. C., and Wolff, E. W.: A network of autonomous surface ozone monitors in Antarctica: technical description and first results, Atmos. Meas. Tech., 4, 645–658, https://doi.org/10.5194/amt-4-645-2011, 2011.
Bortoli, D. and Kostadinov, I. K.: Stratospheric ozone and nitrogen dioxide amount obtained with GASCOD-type DOAS spectrometer at Terra Nova Bay Station (Antarctica) during December 2000–January 2001, Proc. SPIE, 4544, 225–235, https://doi.org/10.1117/12.454255, 2002.
Chen, H., Winderlich, J., Gerbig, C., Hoefer, A., Rella, C. W., Crosson, E. R., Van Pelt, A. D., Steinbach, J., Kolle, O., Beck, V., Daube, B. C., Gottlieb, E. W., Chow, V. Y., Santoni, G. W., and Wofsy, S. C.: High-accuracy continuous airborne measurements of greenhouse gases (CO2 and CH4) using the cavity ring-down spectroscopy (CRDS) technique, Atmos. Meas. Tech., 3, 375–386, https://doi.org/10.5194/amt-3-375-2010, 2010.
Das, S. S., Ratnam, M. V., Uma, K. N., Subrahmanyam, K. V., Girach, I. A., Patra, A. K., Aneesh, S., Suneeth, K. V., Kumar, K. K., Kesarkar, A. P., Sijikumar, S., and Ramkumar, G.: Influence of tropical cyclones on tropospheric ozone: possible implications, Atmos. Chem. Phys., 16, 4837–4847, https://doi.org/10.5194/acp-16-4837-2016, 2016.
DiGangi, J., Choi, Y., Nowak, J., and Davis, K. J.: ACT-America: L2 In Situ Atmospheric CO2, CO, CH4, and O3 Concentrations, Eastern USA, ORNL DAAC, Oak Ridge, Tennessee, USA, https://doi.org/10.3334/ORNLDAAC/1679, 2018.
Ding, M., Tian, B., Ashley, M. C. B., Putero, D., Zhu, Z., Wang, L., Yang, S., Li, C., and Xiao, C.: Year-round record of near-surface ozone and O3 enhancement events (OEEs) at Dome A, East Antarctica, Earth Syst. Sci. Data, 12, 3529–3544, https://doi.org/10.5194/essd-12-3529-2020, 2020a.
Ding, M., Yang, D., van den Broeke, M. R., Allison, I., Xiao, C., Qin, D., and Huai, B.: The surface energy balance at Panda 1 Station, Princess Elizabeth Land: a typical katabatic wind region in East Antarctica, J. Geophys. Res.-Atmos., 125, e2019JD030378, https://doi.org/10.1029/2019JD030378, 2020b.
Ding, M., Zou, X., Sun, Q., Yang, D., Zhang, W., Bian, L., Lu, C., Allison, I., Heil, P., and Xiao, C.: The PANDA automatic weather station network between the coast and Dome A, East Antarctica, Earth Syst. Sci. Data, 14, 5019–5035, https://doi.org/10.5194/essd-14-5019-2022, 2022.
Ekeberg, D., Ogner, G., and Fongen, H.: Determination of CH4, CO2, and N2O in air samples and soil atmosphere by gas chromatography mass spectrometry, GC-MS, J. Environ. Monitor., 6, 621–623, https://doi.org/10.1039/B401315H, 2004.
Global Atmosphere Watch (GAW): Global Atmosphere Watch Measurements Guide, GAW Report No. 143, World Meteorological Organization (WMO), Geneva, https://library.wmo.int/idurl/4/41180 (last access: 14 December 2025), 2001.
Griffith, D., Petersen, A. K., Naylor, T., Harvey, M., and Smith, M.: Innovative techniques to measure greenhouse gas emissions from land systems, Report to the Australian Government Department of Climate Change, 0807, 1–35, https://www.researchgate.net/ profile/Mike-Harvey/publication/322406089_Innovative_Techni ques_to_Measure_Greenhouse_gases_emissions_from_land_ systems/links/5a57ef4d0f7e9bbacbdfad56/Innovative-Techniqu es-to-Measure-Greenhouse-gases-emissions-from-land-systems. pdf (last access: 14 December 2025), 2009.
Griffiths, P. R.: Fourier transform infrared spectrometry, Science, 222, 297–302, https://doi.org/10.1126/science.6623077, 1983.
Griffiths, P. T., Keeble, J., Shin, Y. M., Abraham, N. L., Archibald, A. T., and Pyle, J. A.: On the changing role of the stratosphere on the tropospheric ozone budget: 1979–2010, Geophys. Res. Lett., 47, e2019GL086901, https://doi.org/10.1029/2019gl086901, 2020.
Heintzenberg, J.: Arctic haze: air pollution in polar regions, Ambio, 18, 50–55, 1989.
Hintsa, E. J., Allsup, G. P., Eck, C. F., Hosom, D. S., Purcell, M. J., Roberts, A. A., Scott, D. R., Sholkovitz, E. R., Rawlins, W. T., Mulhall, P. A., Lightner, K., McMillan, W. W., Song, J., and Newchurch, M. J.: New ozone measurement systems for autonomous operation on ocean buoys and towers, J. Atmos. Ocean. Tech., 21, 1007–1016, 2004.
Keeling, C. D.: Atmospheric CO2 variations at Mauna Loa Observatory, Hawaii, Tellus, 28, 538–551, 1976.
Köne, A. Ç. and Büke, T.: Forecasting of CO2 emissions from fuel combustion using trend analysis, Renew. Sust. Energ. Rev., 14, 2906–2915, https://doi.org/10.1016/j.rser.2010.06.006, 2010.
Kwon, J., Ahn, G., Kim, G., Kim, J. C., and Kim, H.: A study on NDIR-based CO2 sensor to apply remote air quality monitoring system, 2009 ICCAS-SICE, 1683–1687, ISBN: 978-4-907764-34-0, 2009.
Liu, M., Song, Y., Matsui, H., Shang, F., Kang, L., Cai, X., Zhang, H., and Zhu, T.: Enhanced atmospheric oxidation toward carbon neutrality reduces methane's climate forcing, Nat. Commun., 15, 1362, https://doi.org/10.1038/s41467-024-47436-9, 2024.
Mahesh, A., Montzka, S. A., and Dutton, G. S.: Calibration of flask sampling systems for atmospheric trace gas measurements, J. Atmos. Ocean. Tech., 20, 1862–1872, 2003.
Nan, R. Q., Tian, B., Sun, W. J., Li, C. J., and Ding, M. H.: Comparative study on the precision of greenhouse gas analyzers based on LICOR-830 and Picarro G2301, J. Shandong Norm. Univ. Nat. Sci., 39, 52–61, https://doi.org/10.3969/j.issn.1001-4748.2024.01.005, 2024.
Ollison, W. M., Crow, W., and Spicer, C. W.: Field testing of new-technology ambient air ozone monitors, J. Air Waste Manage., 63, 855–863, https://doi.org/10.1080/10962247.2013.796898, 2013.
Popa, M. E., Gloor, M., Manning, A. C., Jordan, A., Schultz, U., Haensel, F., Seifert, T., and Heimann, M.: Measurements of greenhouse gases and related tracers at Bialystok tall tower station in Poland, Atmos. Meas. Tech., 3, 407–427, https://doi.org/10.5194/amt-3-407-2010, 2010.
Prinn, R. G., Weiss, R. F., Arduini, J., Arnold, T., DeWitt, H. L., Fraser, P. J., Ganesan, A. L., Gasore, J., Harth, C. M., Hermansen, O., Kim, J., Krummel, P. B., Li, S., Loh, Z. M., Lunder, C. R., Maione, M., Manning, A. J., Miller, B. R., Mitrevski, B., Mühle, J., O'Doherty, S., Park, S., Reimann, S., Rigby, M., Saito, T., Salameh, P. K., Schmidt, R., Simmonds, P. G., Steele, L. P., Vollmer, M. K., Wang, R. H., Yao, B., Yokouchi, Y., Young, D., and Zhou, L.: History of chemically and radiatively important atmospheric gases from the Advanced Global Atmospheric Gases Experiment (AGAGE), Earth Syst. Sci. Data, 10, 985-1018, https://doi.org/10.5194/essd-10-985-2018, 2018.
Sturm, P., Wanner, H., and Schwikowski, M.: Impact of extreme weather events on high-alpine atmospheric observations at Jungfraujoch, Atmos. Res., 116, 1–12, 2012.
Tanimoto, H., Mukai, H., Hashimoto, S., and Kajii, Y.: Intercomparison of ultraviolet photometry and gas-phase titration techniques for ozone reference standards at ambient levels, J. Geophys. Res.-Atmos., 111, D16305, https://doi.org/10.1029/2005JD006983, 2006.
Tian, B., Ding, M., Putero, D., Li, C., Zhang, D., Tang, J., Zheng, X., Bian, L., and Xiao, C.: Multi-year variation of near-surface ozone at Zhongshan Station, Antarctica, Environ. Res. Lett., 17, 044021, https://doi.org/10.1088/1748-9326/ac583c, 2022.
Tian, B., Zhao, Y., Zhu, K., and Ding, M.: Near-surface carbon dioxide and ozone observations at Chinese Taishan Station in Antarctica (2024.02.10–2024.03.12), National Tibetan Plateau/Third Pole Environment Data Center, https://doi.org/10.11888/Atmos.tpdc.303486, 2026.
Wang, S., Tian B., Ding M., Zhang D., Zhang T., and Sun W.: Usage and performance assessment of a novelanalyzer-Model 205, Optical Instruments, 39, 58–63, https://joi.usst.edu.cn/ch/reader/create_pdf.aspx?file_no=20170211&flag=1&journal_id=gxq&year_id=2017 (last access: 14 December 2025), 2017.
Williams, E. J., Fehsenfeld, F. C., Jobson, B. T., and Holloway, J. S.: Comparison of ultraviolet absorbance, chemiluminescence, and DOAS instruments for ambient ozone monitoring, Environ. Sci. Technol., 40, 5755–5762, https://doi.org/10.1021/es0523542, 2006.
Xia, T., Catalan, J., Hu, C., and Batterman, S.: Development of a mobile platform for monitoring gaseous, particulate, and greenhouse gas (GHG) pollutants, Environ. Monit. Assess., 193, 7, https://doi.org/10.1007/s10661-020-08769-2, 2023.
Xu, M., Peng, B., Zhu, X., and Guo, Y.: Multi-gas detection system based on non-dispersive infrared (NDIR) spectral technology, Sensors-Basel, 22, 836, https://doi.org/10.3390/s22030836, 2022.