
the Creative Commons Attribution 4.0 License.
the Creative Commons Attribution 4.0 License.
 | 10 Sep 2026
Characterization of Saharan and Middle Eastern dust aerosols and their associated shortwave direct radiative effects over Cyprus
Georgia Charalampous

Konstantinos Fragkos
Ilias Fountoulakis
Kyriakoula Papachristopoulou
Anna Moustaka
Franco Marenco
Yevgeny Derimian
Argyro Nisantzi
Rodanthi-Elisavet Mamouri
Diofantos Hadjimitsis
Stelios Kazadzis
Atmospheric mineral dust modulates surface solar radiation, with important implications for regional climate and solar energy production. In this study, we investigate dust aerosol typing and associated shortwave (SW) direct radiative effects (DREs) using radiative transfer simulations over Cyprus using a 7-year dataset (2015–2022) from the Agia Marina Xyliatou station. Dust events were identified using AERONET optical properties, LIDAR observations, MODIS imagery, and classified by origin (Sahara or Middle East) based on HYSPLIT back-trajectories analysis. Dust accounts for ∼ 28.3 % of aerosol cases during spring (MAM) and ∼ 12.7 % during autumn (SON), with 86 % of events originating from the Sahara and 14 % from the Middle East. The mean AOD at 440 nm for the period studied here is 0.34 ± 0.13 for Saharan events and 0.40 ± 0.13 for Middle Eastern events, while the SSA at 440 nm remains high for both sources (0.93 ± 0.04 and 0.93 ± 0.03, respectively), indicating predominantly scattering aerosols. Radiative transfer estimates of global horizontal irradiance (GHI) agree well with ground-based irradiance measurements, with ∼ 87 % of modelled GHI values within ±5 % and ∼ 96 % within ±10 % of observations. Monthly DREs were evaluated for observations acquired at a common solar zenith angle (SZA ≈ 60 ± 4°). Under these conditions, the strongest monthly mean surface cooling reached approximately −92 W m−2 for Saharan dust and −86 W m−2 for Middle Eastern dust, while atmospheric heating reached approximately +72 and +59 W m−2, respectively. The corresponding TOA cooling reached approximately −31 W m−2 for Saharan dust and −28 W m−2 for Middle Eastern dust. The mean surface SW DREs (for all SZAs) are −84 ± 49 W m−2 for Saharan dust in March and −79 ± 33 W m−2 for Middle Eastern dust in October. Although the Ångström exponent is slightly higher for Middle Eastern dust (0.37 vs. 0.30), suggesting enhanced fine-mode contribution due to aerosol mixing, radiative forcing efficiencies are comparable, indicating that aerosol loading primarily controls the magnitude of radiative perturbations.
- Article
(3174 KB) - Full-text XML
-
Supplement
(959 KB) - BibTeX
- EndNote


Atmospheric aerosols, tiny solid or liquid particles suspended in the air, play a major role in Earth's climate by modulating solar radiation and atmospheric composition (Boucher, 2015). Aerosols both directly and indirectly influence solar radiation levels. Direct effects include the absorption and scattering of solar radiation (Bellouin et al., 2020; Goudie and Middleton, 2001; Kok et al., 2023; Sokolik et al., 2001), while indirect effects relate to changes in cloud conditions (Gryspeerdt et al., 2022; Napoli et al., 2022; Sekiguchi et al., 2003). Among them, mineral dust is one of the most abundant globally and exhibits complex radiative behavior, contributing both to solar radiation scattering and absorption (Miller et al., 2014; Satheesh, 2002). As a result, mineral dust introduces substantial uncertainty in the magnitude and even the sign of its radiative impact, which depends on its size distribution, composition, mixing state, and vertical distribution (Adebiyi and Kok, 2020; Fountoulakis et al., 2021, 2024; Kok et al., 2023).
The role of mineral dust is especially pivotal in regions like Cyprus, located at the crossroads of two major dust sources: the Sahara Desert and the Arabian Peninsula, a transport pathway well-documented for the broader Mediterranean basin (Dayan et al., 1991; Gkikas et al., 2018; Logothetis et al., 2021; Meloni et al., 2018; Proestakis et al., 2024). The composition and size of dust particles from these regions differ, potentially leading to variations in their optical and radiative properties. Mineral dust layers originating from broader region of Saharan dust can generally present more variable percentage of iron oxides, which enhance light absorption, whereas layers from the Arabian Peninsula can contain higher proportions of carbonates and evaporitic minerals, leading to more reflective, scattering properties (Formenti et al., 2011; Nisantzi et al., 2015; Teri et al., 2025). As emphasized by Kok et al. (2023), there are still substantial uncertainties in whether dust aerosols exert a net cooling or warming effect on the atmosphere, depending on their physical and chemical characteristics.
The Mediterranean basin often experiences dust storms of varying intensity from the Sahara Desert and the Middle East with noticeable inter-annual and seasonal variations (Gkikas et al., 2016, 2018; Kaskaoutis et al., 2019; Logothetis et al., 2021; Papachristopoulou et al., 2022; Proestakis et al., 2024). Saharan dust storms are more frequent in the eastern Mediterranean during boreal spring (MAM) because of the favorable weather patterns (Barkan et al., 2005; Moulin et al., 1998). These storms are driven by deep depressions and thermal lows, which are responsible for most dust emissions from the Saharan Desert (Kaskaoutis et al., 2019). Climatological analysis has shown that MAM is the most active season for Saharan cyclogenesis, with significant dust transport to the eastern Mediterranean (Gkikas et al., 2018; Derimian et al., 2006). Cyclone-induced dust storms are prominent in this region, especially from February to April, contributing to extreme dust events (Flaounas et al., 2015).
Apart from their regional impacts, mineral dust aerosols play a significant role in the Earth's atmospheric system, by modulating the radiation field, influencing cloud formation, and affecting global temperature dynamics (Kok et al., 2023). Accurate climate modeling and prediction require a proper representation of the variability in aerosol composition and concentration, as these factors strongly control the magnitude and sign of aerosol radiative effects (Adebiyi and Kok, 2020; Mahowald et al., 2010). Previous studies (Dayan et al., 1991; Gkikas et al., 2018; Logothetis et al., 2021; Moustaka et al., 2024), revealed substantial differences in dust transport pathways, vertical structure, and residence time between the central and eastern Mediterranean regions. For example, according to Dayan et al. (1991) during the period from August 1988 to September 1989, seven dust events were traced using the Branching Atmospheric Trajectory (BAT) model. The analysis of these events showed that Saharan dust in the central Mediterranean is usually transported in deeper atmospheric layers and for longer durations (2–4 d) compared to the eastern Mediterranean, where dust during the autumn typically originates from the Arabian Desert and travels for shorter periods (approximately 1 d) in shallower layers with lower optical depth values.
The aerosol direct radiative effects (DREs) refer to the alteration in net radiation due to variations in the properties and concentration of atmospheric aerosols, resulting from their scattering and absorption of radiation (Bellouin et al., 2020; Mateos et al., 2014). It plays a crucial role in understanding climate change, as highlighted in numerous studies (e.g. Cuevas-Agulló et al., 2024; Gil-Díaz et al., 2025; Hansen et al., 1998; Kok et al., 2023). There are several studies that investigated the aerosol DREs across the full shortwave (SW) spectral range, encompassing ultraviolet (UV), visible, and near-infrared wavelengths, as well as within specific spectral sub-bands (Rajeev and Ramanathan, 2001; García et al., 2008; Mateos et al., 2014). Regarding the surface DREs, Di Biagio et al. (2010) reported an instantaneous daily maximum for desert dust aerosol in the central Mediterranean during the period 2004–2007, reaching −61 W m−2, indicating surface cooling. The DREat surfacecan significantly influence local atmospheric temperatures, usually by cooling the surface, and influence wider weather patterns (Gkikas et al., 2018). Additionally, dust aerosols can greatly affect energy production (Hansen et al., 1997; Kosmopoulos et al., 2017, 2018), particularly by decreasing the efficiency of solar panels (Boucher et al., 2014). Over Cyprus, Fountoulakis et al. (2021) quantified the combined effects of aerosols and clouds on surface solar radiation and showed that aerosols cause annual reductions of approximately 5 %–10 % in Global Horizontal Irradiance (GHI) and 15 %–35 % in Direct Normal Irradiance (DNI). These reductions are comparable to, and during certain periods exceed, cloud-induced attenuation (for example in March with 19 % for GHI and 26 % for DNI), underscoring the critical role of dust aerosols in shaping the island's solar energy resource. Cyprus's strategic location in the Eastern Mediterranean makes it a key region for studying aerosol effects, particularly the impact of mineral dust on atmospheric processes and solar energy potential. Previous studies have documented the region's exposure to dust transported from different areas (Achilleos et al., 2020), its relatively high dust aerosol load (Mamouri et al., 2016; Nisantzi et al., 2015), and the potential differences in dust optical properties between its two main source regions: the Sahara and the Middle East (Nisantzi et al., 2015).
However, the DREs of dust over Cyprus, as well as the influence of source-dependent dust properties, have not been fully quantified. Owing to its geographical location at the crossroads of the Sahara Desert and the Middle East, Cyprus provides a unique region for investigating the radiative impact of transported mineral dust and assessing potential source-related contrasts. This study combines a comprehensive climatological analysis of dust events with source attribution and radiative impact assessment using a seven-year dataset (2015–2022) from the Agia Marina Xyliatou station. Dust events are first identified and analysed to quantify their overall radiative effects and subsequently classified according to their source region (Saharan or Middle Eastern) using AERONET aerosol optical properties, back-trajectory analysis, and auxiliary satellite observations. The source-resolved aerosol optical properties are used as input to radiative transfer simulations to quantify the SW DREs of dust at the surface, within the atmosphere, and at the top of the atmosphere. Modelled GHI are validated against ground-based irradiance measurements. The manuscript is structured as follows: Sect. 2 describes the area, instrumentation and methodology; Sect. 3 presents the results, including the overall radiative impact and the source-based analysis; Sect. 4 discusses the findings in the context of previous studies; and Sect. 5 summarizes the main conclusions.
2.1 Description of the study area
Agia Marina Xyliatou station (AMX) (Peletidou et al., 2023; Pikridas et al., 2018), part of the Cyprus Atmospheric Observatory (CAO; https://cao.cyi.ac.cy/agia-marina-xyliatou/, last access: 3 March 2026), is located at a remote site in central Cyprus (35.04° N; 33.06° E; 535 m a.s.l.) near the villages of Agia Marina and Xyliatos, within the Forestry Department premises of “Agia Marina Xyliatou”. The surrounding landscape is primarily covered by vegetation, with agricultural activities occurring more than 4 km away and the nearest urban center at least 35 km away (Theocharidis et al., 2025). As a result, the site is not directly influenced by local pollution sources.
In respect to the weather conditions, AMX is characterized by hot, dry summers and mild, rainy winters. The average daily temperature is approximately 19 °C, ranging from 1 to 36 °C, and the relative humidity averages around 55 %, with values fluctuating between 13 % and 82 % (Baalbaki et al., 2021). The prevailing wind regime is dominated by northerly “Etesian” winds, occurring more than 65 % of the time, which transport air masses primarily from mainland Turkey and, to a lesser extent, Europe. Additionally, aerosol layers originating from North Africa, the Middle East, and the western Mediterranean, are often observed over the region, making the site well-suited for investigating transboundary pollution and natural aerosols such as desert dust (Baalbaki et al., 2021).
To characterize the meteorological conditions during the study period, 10 min measurements of air temperature, relative humidity, wind speed and direction at 10 m, were obtained from the nearby Xyliatos Dam (2 km away from AMX) meteorological station operated by the Cyprus Department of Meteorology. Seasonal statistics for the period September 2015–December 2022 are summarized in Table S1 of the Supplement. The warmest and driest conditions were observed during summer (JJA), with a mean air temperature of 26.9 ± 3.0 °C and a mean relative humidity of 43.9 ± 15.3 %, whereas winter (DJF) was characterized by cooler (10.1 ± 3.0 °C) and more humid (67.0 ± 10.6 %) conditions. Mean wind speeds remained relatively low throughout the year (1.07–1.49 m s−1), with southerly winds being the most frequently observed during DJF, MAM and SON, and north-north westerly winds during JJA.
AMX experiences clear seasonal fluctuations in particulate matter (PM) concentrations. Specifically, during MAM and JJA, PM10 levels, reaching a warm-season plateau of around 27 µg m−3, increase due to dust-influenced transported air masses and local dust re-suspension from croplands (Pikridas et al., 2018). From DJF to JJA, PM2.5 concentrations increase by approximately 50 %, rising from about 10 µg m−3 in winter to around 15 µg m−3 in summer. This seasonal increase has been attributed to enhanced photochemical activity, reduced precipitation that prolongs aerosol lifetime, and the transport of fine-mode pollutants from regional sources, including Turkey and, to a lesser extent, Europe (Pikridas et al., 2018).
To further support the analysis of aerosol conditions over Cyprus, observations from a second site, the Limassol CUT-TEPAK station, were used. The station is operated as part of the Cyprus Atmospheric Remote Sensing Observatory National Facility (CARO NF) of the Eratosthenes Centre of Excellence at Limassol (34.68° N, 33.04° E) (Ene et al., 2024). Limassol, with its subtropical Mediterranean climate, also exhibits complex aerosol dynamics driven by both local emissions (e.g., traffic, biomass burning, industry) and long-range dust transport from the Sahara and the Middle East (Nisantzi et al., 2015).
Both AMX and Limassol stations host sun/sky photometers that are part of the AERONET network. These instruments provide direct measurements of aerosol optical depth (AOD) and its spectral dependence, expressed through the Ångström exponent (Ångström, 1929). In parallel, broadband solar flux is monitored at AMX, since 2015, using Kipp & Zonen (K&Z) radiometers, which capture both direct and diffuse components of downwelling solar radiation at the surface. A detailed description for the different data and instruments used in the stations is presented in Sect. 2.2.
2.2 Data and Instruments
2.2.1 AERONET
As part of the global Aerosol Robotic Network (AERONET) (Holben et al., 1998, 2001), a Cimel Electronique Sun Photometer (model CE 348NE), has been operating continuously during the last 11 years at AMX station. The instrument performs direct-sun measurements nominally at minutes intervals during daylight, with each observation comprising a triplet of measurements. The effective sampling interval is nevertheless irregular because of cloud screening, sky-radiance measurement sequences, instrument operation and quality-control filtering. Since May 2015, it has been performing direct sun measurements at specific wavelengths of 340, 380, 440, 500, 675, 870, 1020, 1640 nm except 2017 with specific wavelengths of 440, 675, 870, 1020 nm, while also measuring the sky radiance in the solar almucantar and principal plane configurations at 440, 675, 870, and 1020 nm wavelengths. Correspondingly, Limassol station has been equipped with a sky/lunar sun photometer model CE 318 by Cimel Electronique since April 2010, measuring the direct solar and sky radiances at nine bands centred at 340, 380, 440, 500, 675, 870, 937, 1020, and 1640 nm (10 nm FWHM), with a field of view of 1.2°.
The direct sun measurements are used to derive the spectral aerosol optical depth (AOD) and the associated Ångström exponent (AE), while sky radiance data, combined with AOD, are used to retrieve various aerosol optical and microphysical properties through spectral inversion techniques (Dubovik and King, 2000). These properties, among others, include particle size distribution, single scattering albedo (SSA), asymmetry parameter (ASY), the fraction of non-spherical particles, and the fine-mode fraction (FMF).
AERONET data are categorized into three levels. Level 1.0 includes raw data, Level 1.5 consists of cloud-screened data, and Level 2.0 contains cloud-screened and quality-assured data. Level 2 data are only available after a post-calibration of the instrument has taken place, which could mean up to a year after the measurements. The retrievals used here were performed using Version 3 of the AERONET retrieval algorithm (Sinyuk et al., 2020), providing AOD, SSA, ASY, and total column water vapor (TCWV). It is important to note that Level 2.0 SSA and ASY data require an AOD (440 nm) > 0.4, significantly reducing the availability of the products. Therefore, in this study, to retain a noteworthy sample size, we use Level 1.5 SSA and ASY after applying additional quality-control criteria as introduced by Kazadzis et al. (2016), while Level 2.0 data are implemented for AOD, AE, FMF and TCWV. Because SSA and ASY are retrieved from less frequent almucantar observations than the direct-sun products, their values were temporally interpolated within each day to the timestamps of the corresponding Level 2.0 direct-sun observations. The interpolation was performed only for days with valid retrievals from both product types and was restricted to within-day observations.
2.2.2 Surface solar radiation measurements
Since June 2015, a solar flux monitoring station has been operational at the AMX station as part of the collaboration between the Laboratory of Atmospheric Optics (LOA), University of Lille, and the Cyprus Institute. The station is equipped with a Kipp & Zonen Solys 2 solar tracker, a Kipp & Zonen CM22 pyranometer for measuring diffuse horizontal irradiance (DHI), and a Kipp & Zonen CHP1 pyrheliometer for measuring direct normal irradiance (DNI). Global horizontal irradiance (GHI) is subsequently calculated as the sum of the diffuse component and the direct component projected onto the horizontal plane. The radiometric signals are sampled at 1 Hz, and 1 min mean values are calculated and recorded using a Campbell Scientific CR1000 datalogger. These 1 min data provide the basis for the cloud-screening procedure and the validation of the radiative transfer simulations presented in this study.
All sensors are inter-compared and calibrated on-site against LOA reference instruments every 2 years in accordance with the manufacturer recommendations, with the most recent calibration performed in June 2024. Differences relative to the reference instruments did not exceed 2 % throughout the measurement period, ensuring high measurement quality. Instruments are cleaned weekly, and quality control procedures include the removal of measurements affected by power outages or instrument malfunctions. Clear-sky conditions were identified using an irradiance variability filtering approach similar to the AERONET cloud-screening methodology. Specifically, the ratio of the standard deviation to the mean was calculated over three consecutive measurements, and thresholds, defined separately for ascending/descending solar zenith angle conditions and near-zenith observations, were applied using a reference clear-sky day.
2.2.3 PollyXT
The Light Detection and Ranging (LIDAR) profiling of atmospheric aerosol and cloud layers has become increasingly important for climate research during over the past decades, as it provides vertically resolved aerosol/cloud information (Ansmann et al., 2012; Ansmann and Müller, 2005; Engelmann et al., 2016). Driven by the critical need for advanced multiwavelength-Raman-polarization lidars that are user-friendly and capable of classifying aerosols, a compact LIDAR system known as PollyXT was developed over the past decade at the Leibniz Institute for Tropospheric Research (TROPOS) along with global partners (Baars et al., 2016). Specifically, PollyXT LIDAR is a fully automated instrument capable of 24/7 operation (Engelmann et al., 2016). It is equipped with:
- i.
Three (3) elastic backscatter channels, at 355, 532 and 1064 nm.
- ii.
Two (2) rotational-vibrational Raman channels, at 387 and 607 nm.
- iii.
Two (2) linear depolarization channels at 355 and 532 nm.
- iv.
One (1) water vapor detection channel at 407 nm.
- v.
Two (2) near field elastic backscatter channels, at 355 and 532 nm.
- vi.
Two (2) near field rotational-vibrational Raman channels, at 387 and 607 nm.
In the framework of CyCARE campaign, during 22 October 2016 to 26 March 2018, the PollyXT as part of the mobile Leipzig Cloudnet supersite LACROS (Leipzig Aerosol and Cloud Remote Observation System) (Bühl et al., 2013, 2016), was moved to Cyprus and specifically at Cyprus University of Technology (CUT) in the city center of Limassol (Ansmann et al., 2019). The CyCARE campaign is part of a long-term cooperation between TROPOS and CUT established in 2012. Additionally, since September 2020, a PollyXT LIDAR is also operated at the Cyprus Atmospheric Remote Sensing Observatory (CARO) of the Eratosthenes Centre of Excellence at Limassol (34.68° N, 33.04° E, 2.8 m a.s.l.). CARO is part of the ACTRIS (Aerosols, Clouds and Trace Gases Research InfraStructure) National Facility of the Republic of Cyprus for the remote sensing of aerosols and clouds (Mamouri et al., 2026). The LIDAR Depolarization (LD) classification used in this study is derived from the intensive optical properties retrieved by the PollyXT LIDAR and distinguishes between pure dust, dust mixtures, and other aerosol types. Polarization LIDAR measurements are widely used to identify mineral dust and aerosol mixtures through their depolarization characteristics and therefore provide valuable information on the vertical distribution and type of atmospheric aerosols.
2.2.4 MODIS
In addition to the ground-based observations, images from the Moderate Resolution Imaging Spectroradiometer (MODIS; https://modis.gsfc.nasa.gov, last access: 1 September 2026) were used to verify the presence of dust events. MODIS is a key instrument aboard the Terra and Aqua satellites, which provide near-global coverage every one to 2 d. Terra follows a north-to-south trajectory across the equator in the morning, while Aqua moves south-to-north in the afternoon. MODIS acquires data in 36 spectral bands spanning different wavelength ranges (Barnes et al., 2003). In this study, MODIS corrected reflectance (true-color) imagery from NASA EOSDIS LANCE (https://earthdata.nasa.gov/lance, last access: 3 March 2026) and GIBS/Worldview (https://worldview.earthdata.nasa.gov/, last access: 3 March 2026) platforms are used to visually confirm dust outbreaks.
2.3 Models
2.3.1 HYSPLIT trajectory model
The Hybrid Single-Particle Lagrangian Integrated Trajectory (HYSPLIT) model is widely used to calculate backward air mass trajectories from specified locations, particularly in dust transport studies (Rolph et al., 2017; Stein et al., 2015; Su et al., 2015). In this study, backward trajectories were driven using meteorological fields provided by the National Oceanic and Atmospheric Administration (NOAA). For the period up to June 2019, the Global Data Assimilation System (GDAS) dataset, with a spatial resolution of 0.5° × 0.5°, was used, while for the period from June 2019 to 2022, the Global Forecast System (GFS) dataset with a spatial resolution of 0.25° × 0.25° was employed (https://www.ready.noaa.gov/archives.php, last access: 11 July 2026). Accordingly, to verify the origin of dust layers transported over Cyprus, we run the HYSPLIT model in backward mode at specify altitudes based on dust layers' height identified from the PollyXT LIDAR system.
2.3.2 Radiative Transfer Model
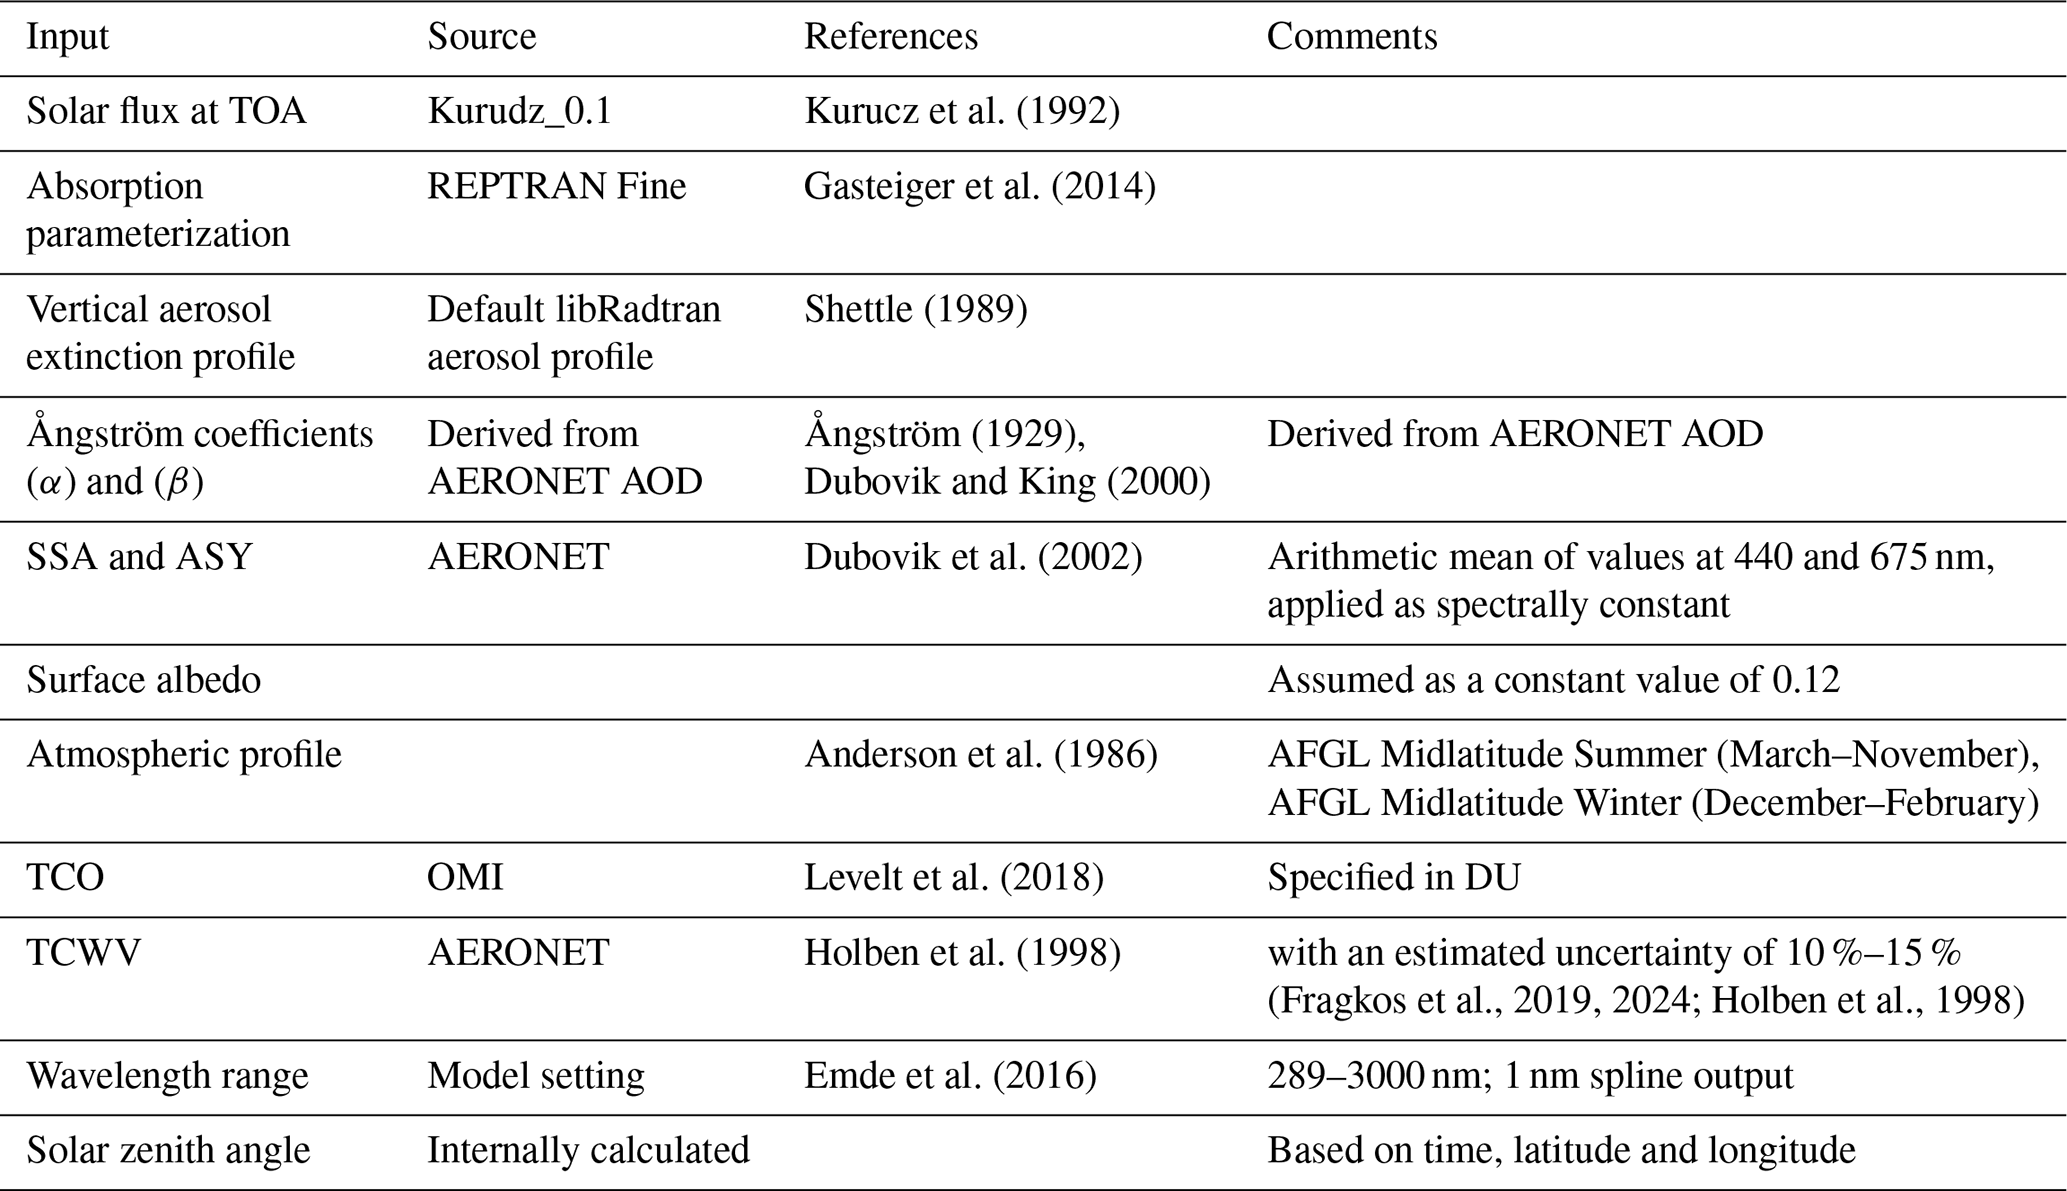
For the radiative transfer simulations, we used the UVSPEC model from libRadtran version 2.0.5 radiative transfer package (Emde et al., 2016; Mayer and Kylling, 2005) to simulate SW radiation for the identified dust cases over the period 2015–2022. Solar fluxes were simulated using the available DISORT solver (Stamnes et al., 1988, 2000) for both surface and top of the atmosphere to calculate the dust radiative effects as described in Sect. 2.4.3. Most of the input data were obtained from AERONET, while total column ozone (TCO) was retrieved from the Ozone Monitoring Instrument (OMI) aboard the Aura satellite, which among others provides daily TCO measurements at a spatial resolution of approximately 13 × 24 km since July 2004 (Levelt et al., 2018). Aerosol optical depth (AOD) at 440 and 675 nm was used to derive the Ångström coefficients (α) and (β) according to the Ångström power-law relationship. These two parameters were then supplied to libRadtran, which reconstructs the spectral variation of AOD at the model wavelength grid over the simulated wavelength range (289–3000 nm) through the relationship:
where λ is expressed in micrometres (Ångström, 1929). Thus, the spectral AOD was not prescribed at discrete wavelengths but represented using the fitted Ångström parameterization. Throughout the manuscript, aerosol optical properties (e.g., AOD and SSA) are reported at 440 nm for consistency with the aerosol classification methodology and previous dust characterization studies. AFGL Midlatitude Winter and AFGL Midlatitude Summer atmospheric profiles were adopted for December–February and March–November, respectively (Anderson et al., 1986). Table 1 provides the input parameters in the radiative transfer model, along with their respective sources and references.
Table 1Input parameters to the radiative transfer model, their sources, and corresponding references.
Radiative transfer simulations were performed for each individual AERONET observation using the corresponding observation time and geographical location. Consequently, the solar zenith angle (SZA) was calculated internally by libRadtran for every simulation. The simulated surface solar fluxes were validated against cloud-free ground-based measurements of GHI. For the validation analysis, each radiative transfer simulation was matched with the nearest cloud-free irradiance observation within a ±15 min time window. This comparison provides an independent assessment of the model's ability to reproduce the observed effects of aerosols on surface solar radiation. Only observations with SZA ≤ 65° were retained to reduce uncertainties associated with the angular response of the radiometer and to avoid the amplification of relative differences under low-irradiance conditions.
Model performance was evaluated using both the absolute and relative differences between simulated and measured GHI:
Negative values indicate model underestimation, whereas positive values indicate model overestimation. The percentages of simulations falling within ±20 and ±50 W m−2, and within ±5 % and ±10 % of the observations, were then calculated to assess the overall model–measurement agreement. This validation provides an independent assessment of the ability of the radiative transfer configuration to reproduce observed cloud-free surface irradiance under aerosol conditions.
2.4 Methodology
2.4.1 Aerosol Classification
The different aerosol species and dust events were initially identified using observations from the AMX AERONET station (35.04° N, 33.06° E). For the classification we follow the method of AERONET-Dubovik (AD; Dubovik et al., 2002) climatology, which establishes thresholds based on the relationship between AOD at 440 nm and the Ångström Exponent (AE) between 440–870 nm (AE440–870). This approach enables the separation of aerosol types into categories such as dust, mixed aerosols, marine particles, biomass burning/polluted aerosols, and continental particles.
Identifying the geographical origin of dust is essential for understanding its radiative effects. In this study, dust events were classified according to their source region, focusing on the Sahara Desert and the Middle East, which represent the two dominant dust sources influencing Cyprus. This distinction is relevant, as dust originating from these regions may exhibit differences in optical and radiative properties (Fountoulakis et al., 2021; Nisantzi et al., 2015), which are investigated in the subsequent analysis.
2.4.2 Identification of dust events
Dust events were identified under cloud-free conditions to minimize the influence of clouds on both aerosol and radiation measurements. Cloud-free periods at the AMX surface radiation station were determined using an irradiance-based variability filtering approach, consistent with the methodology applied in AERONET cloud screening. Specifically, the ratio of the standard deviation to the mean was calculated over three consecutive measurements of direct and diffuse solar irradiance. Thresholds, defined separately for ascending/descending solar zenith angle conditions and near-zenith observations, were applied based on a reference clear-sky day. Only time intervals satisfying these criteria were retained for further analysis. For the model–measurement validation (Sect. 3.4), AERONET data (Sect. 2.2.1) were temporally matched with the filtered clear-sky ground-based radiation measurements, retaining only observations within a ±15 min window. This strict temporal collocation was applied exclusively for the validation exercise, ensuring consistency between radiative transfer simulations and in situ radiation observations.
For the remainder of the analysis, AERONET data were used independently of the surface radiation measurements to maximize temporal coverage, as continuous ground-based radiation data were not available for the full study period. To characterize the vertical distribution of aerosol layers, LIDAR observations from the PollyXT system (Ene et al., 2024; Mamouri et al., 2023), located at the Cyprus University of Technology (∼ 40 km from the AMX site), were incorporated. Given the regional scale of dust transport over Cyprus, it is assumed that elevated dust layers typically extend over both sites. The high vertical resolution of the LIDAR measurements enables the detection of elevated dust layers above the boundary layer, which is essential for accurate source attribution.
LIDAR observations enable the classification and discrimination of dust particles based on their optical properties, particularly the particle linear depolarization ratio and backscatter signals, allowing for the distinction between mineral dust and other aerosol types (Mamouri and Ansmann, 2017). For days when LIDAR measurements were unavailable or inconclusive, HYSPLIT backward trajectories were initialized at fixed altitudes of 1000, 2000, 3000, and 4000 m above ground level to represent the potential vertical extent of the transported dust layers. MODIS true-colour imagery from the instruments aboard NASA's Terra and Aqua satellites, accessed via the NASA GIBS/Worldview platform, was used as an auxiliary tool to visually confirm the presence, spatial extent, and transport pathway of the dust plumes. To determine dust source regions, air-mass back trajectories were computed using the HYSPLIT model in backward mode (Draxler, 1998). Trajectories were initiated from the AMX station and calculated 72 h backward in time. When LIDAR data were available, trajectory starting altitudes corresponded to the observed dust layer heights. In the absence of LIDAR data, trajectories were initiated at fixed altitudes of 1000, 2000, 3000, and 4000 m above ground level to capture potential transport pathways at different atmospheric layers. Dust events were subsequently classified as Saharan, Middle Eastern, or mixed-source events through the combined analysis of HYSPLIT trajectories and MODIS imagery. It should be noted that MODIS is more effective in identifying moderate-to-strong dust events with sufficiently high aerosol optical depth and spatial extent, while weaker or more diffuse dust events (e.g., low AOD cases) may not always be clearly detectable. Therefore, MODIS observations were used as a complementary tool to support the source attribution. Finally, an additional filtering criterion based on the fine-mode fraction (FMF) was applied to refine the dataset used for radiative transfer analysis. The FMF, obtained from AERONET products, was used as an indicator of aerosol size distribution and mixing state. A threshold of FMF < 0.4 was adopted because it corresponds to the transition between the coarse-mode-dominated and mixed-aerosol populations in the FMF distribution, while also being consistent with thresholds commonly used in previous studies to identify predominantly mineral dust conditions (Gobbi et al., 2007; Logothetis et al., 2020; Rogozovsky et al., 2024). Only cases with FMF < 0.4 were retained, ensuring the dominance of coarse-mode particles and restricting the analysis to predominantly mineral dust conditions. This criterion also reduces the influence of mixed aerosol conditions, particularly dust–pollution mixtures frequently observed in air masses originating from the Middle East (Logothetis et al., 2020).
2.4.3 Estimation of dust direct radiative effects
Dust direct radiative effects (DREs) were estimated using radiative transfer simulations performed under cloud-free conditions for both aerosol and aerosol-free scenarios, while keeping all other atmospheric and surface input parameters identical. In the framework of this study, the libRadtran radiative transfer package (see Sect. 2.3.2), constrained by observationally derived aerosol optical properties, is employed to compute solar fluxes. Radiative transfer (RT) simulations were performed at the temporal resolution of the input observations, i.e. at the time of each available AERONET measurement. For each case, instantaneous shortwave fluxes were calculated at the surface and TOA under both aerosol and aerosol-free conditions. The corresponding instantaneous DREs were then derived and subsequently averaged to obtain monthly mean values. Monthly climatologies were derived using all quality-controlled observations (SZA ≤ 65°). To assess the influence of solar zenith angle on the monthly DRE climatology, the analysis was additionally repeated using only observations acquired within a common solar zenith angle interval (60 ± 4°), enabling a consistent comparison of monthly and seasonal DRE values under similar illumination conditions.
Following Gkikas et al. (2018) and Moustaka et al. (2023), the DREs are computed at the top of the atmosphere (TOA), within the atmosphere, and at the surface. The surface DRE presented in this study corresponds to the net shortwave radiation. Calculations are performed for the shortwave (SW) spectrum (300–3000 nm) radiation according to the following equations:
where F represents the SW fluxes (in W m−2), Fi,RADON and Fi,RADOFF represent the SW irradiances under the real and aerosol-free conditions, respectively, with arrows representing upwelling (↑) and downwelling (↓) radiative fluxes, respectively.
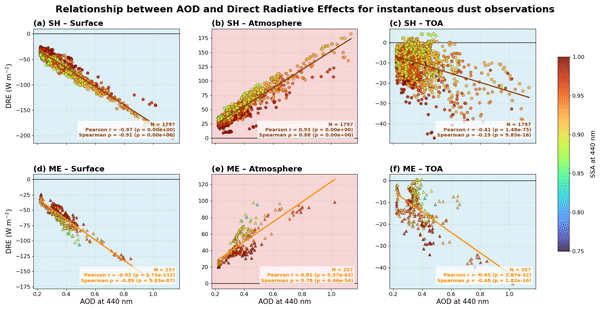
In addition to DREs, the aerosol direct radiative forcing efficiency (DRFE) is defined as the rate at which the radiative effect changes per unit of AOD (Di Biagio et al., 2009; Tian et al., 2021). In this study, DRFE is assumed as linear and determined as the slope of linear fits in the DREs vs. AOD at 440 nm. DRFE values are expressed in W m−2 per AOD440 nm-unit (W m−2 τ−1). In brief, DREs are directly related to both the aerosol loading (expressed through AOD) in the atmosphere and other aerosol optical properties, whereas DRFE is independent of the AOD and primarily reflects the influence of aerosol optical properties (such as SSA).
Following the dust identification methodology and source attribution process, we selected four representative dust case studies for detailed radiative analysis:
-
Two Saharan dust events, and
-
Two Middle Eastern dust events, chosen based on the highest AOD values observed during the 7-year study period.
This selection ensures that our radiative effect analysis focuses on the most intense and climatically relevant dust episodes affecting Cyprus.
Focusing solely on dust-dominated case studies, the above methodology allows us to quantitatively assess the influence of dust aerosols on the surface, TOA and within atmosphere SW radiation budget. The calculated DREs and DRFE metrics provide insight into both the magnitude of the radiative impact and its sensitivity to dust aerosol loading and properties. The overall workflow of the analysis is illustrated in Fig. 1.

3.1 Aerosol Classification
As an initial step in the identification of dust events, aerosol classification was carried out using measurements from the AMX AERONET station. Figure 2a illustrates the classification of aerosols at the AMX station for the period 2015–2022, based on the AD classification scheme, which utilizes the relationship between AOD at 440 nm and the Ångström exponent (440–870 nm). Distinct clusters corresponding to marine, biomass burning–polluted, dust, mixed, and continental aerosols are identified. All available observations were assigned to one of these five categories based on the applied AD thresholds. Figure 2b and c show that continental and marine aerosols are the most persistent types at the site, while dust, mixed, and biomass burning–polluted aerosols also appear frequently, highlighting the complex aerosol mixture over Cyprus. The seasonal distribution of aerosol types is further illustrated in Fig. 2b, providing a comprehensive overview of the temporal variability in aerosol composition. It should be noted that the overall statistics were calculated using all individual AERONET measurements collected during the study period. Detailed descriptive statistics for each aerosol class, including the number of observations, mean, median, standard deviation and interquartile range of AOD440 and AE440–870, are provided in Table S2 of the Supplement. Dust aerosols over Cyprus exhibit a clear seasonal pattern, with maximum occurrence during MAM comprising approximately 28.3 % of all aerosol measurements (Fig. 2b.i). During JJA, the frequency of dust events drops markedly to 5.6 % (Fig. 2b.ii), corresponding to the prevalence of a stable subtropical anticyclone over the eastern Mediterranean, which suppresses large-scale meridional transport and reduces dust advection from North Africa (Moulin et al., 1998). A secondary increase in dust occurrence is observed during SON (12.7 %) (Fig. 2b.iii), which is primarily due to the re-establishment of baroclinic activity and frequent passage of cyclonic systems, frontal disturbances, and synoptic-scale troughs over North Africa, which enhance the uplift and long-range transport of Saharan dust toward the eastern Mediterranean (Almazroui and Awad, 2016; Moulin et al., 1998; Gkikas et al., 2013). In addition, regional circulation patterns and the development of low-pressure systems over the central and eastern Mediterranean during this season can promote the advection of mineral dust from Middle Eastern sources toward the eastern Mediterranean, further contributing to the elevated dust frequency. During DJF, dust occurrence is low (5.4 %) (Fig. 2b.iv), likely due to both reduced dust source activations in North Africa, owing to increased soil moisture and lower surface temperatures, and the dominance of westerly flows that are less favorable for dust transport to the eastern Mediterranean (Gkikas et al., 2013). These seasonal fluctuations illustrate the great impact of climatic conditions on dust dynamics, therefore stressing the significance of MAM and SON as peak dust transport seasons, JJA and DJF are still less influenced by mineral dust occurrences. Figure 2b.iv includes a table summarizing this classification by presenting the median AOD440 for each aerosol type. Although dust and mixed aerosols are not the most frequent, they are associated with the highest median AOD values, indicating that these aerosol types correspond to periods of enhanced aerosol loading. In contrast, marine and continental aerosols exhibit much lower median AOD values, indicating lower aerosol loading. Nevertheless, their radiative effects also depend on intensive optical properties that govern aerosol scattering and absorption efficiency.
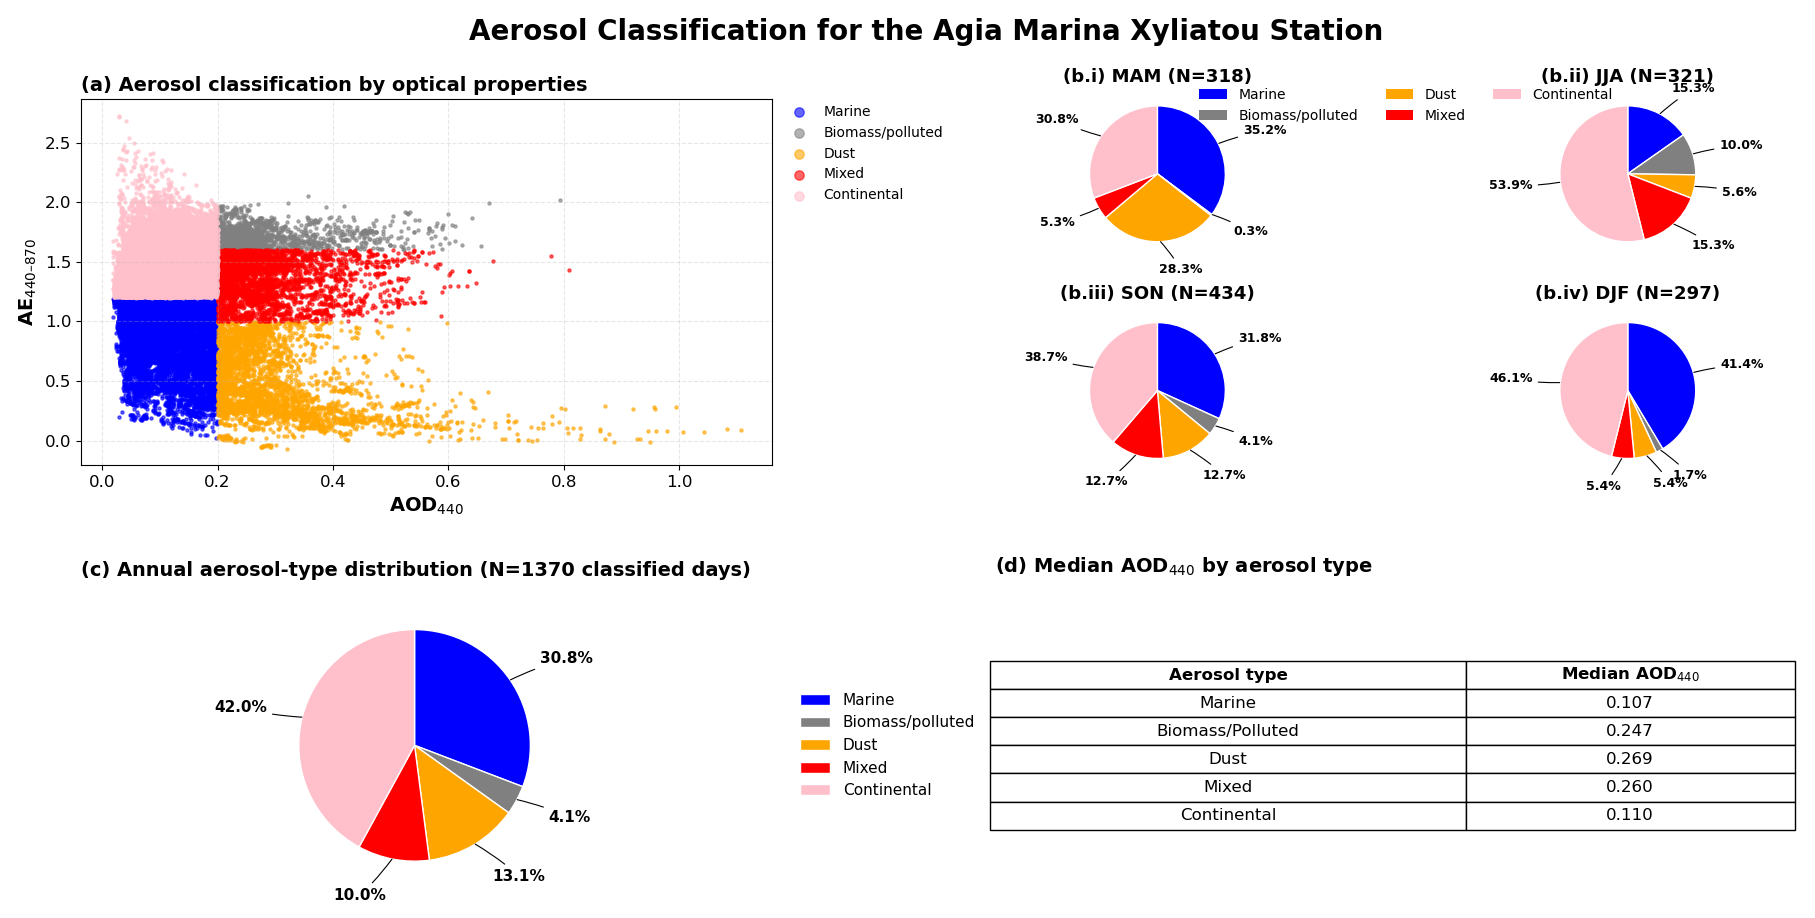
Figure 2(a) Aerosol classification by AERONET-Dubovik's climatology (Marine particles, Biomass Burning-Polluted particles, Dust, Mixed and Continental particles) of AMX station [blue: marine, gray: biomass/burning-polluted, orange: dust, red: mixed, pink: continental]. (b) Pie chart of the seasonal classification of Aerosols in “MAM”: March–April–May, “JJA”: June–July–August, “SON”: September–October–November, “DJF”: December–January–February. (c) Annual aerosol type distribution. (d) Summary table of the median AOD 440 nm by aerosol type.
3.2 Origin of dust layers
After classifying the different cases based on aerosol type using AERONET optical products, we further separated the identified dust events according to their source region. The initial dust classification derived from AERONET aerosol optical properties was verified using 72 h backward air mass trajectories computed with the HYSPLIT model, initialized from the AMX site at multiple altitudes (LIDAR-derived heights when available, or fixed levels between 1000–4000 m). Additional local confirmation was provided by LIDAR observations, which classify aerosol types based on fundamentally different physical principles, such as particle depolarization characteristics. A high level of agreement was found between the three independent approaches, with consistent classification in approximately 94.3 % of the cases, while discrepancies were observed in the remaining 5.7 %, primarily in situations involving mixed aerosol conditions or weak dust signals. These differences are expected given the distinct sensitivities of each method. Overall, the strong consistency between AERONET-based typing, HYSPLIT transport analysis, and LIDAR depolarization-based classification enhances confidence in the robustness of the dust event identification. The origin of each case was further cross-checked with MODIS satellite imagery (see Sect. 2.4.2 for the full methodology, Fig. 3 for representative examples). Overall, approximately 86 % of the dust events affecting Cyprus during 2015–2022 were traced back to North Africa by HYSPLIT, while the remaining 14 % originated from the Middle East, underscoring the dominant role of the Sahara as a dust source for the region. This corresponds to a total of 232 dust events, comprising 199 Saharan dust cases and 33 Middle Eastern dust cases, which formed the initial dataset for the subsequent analyses.
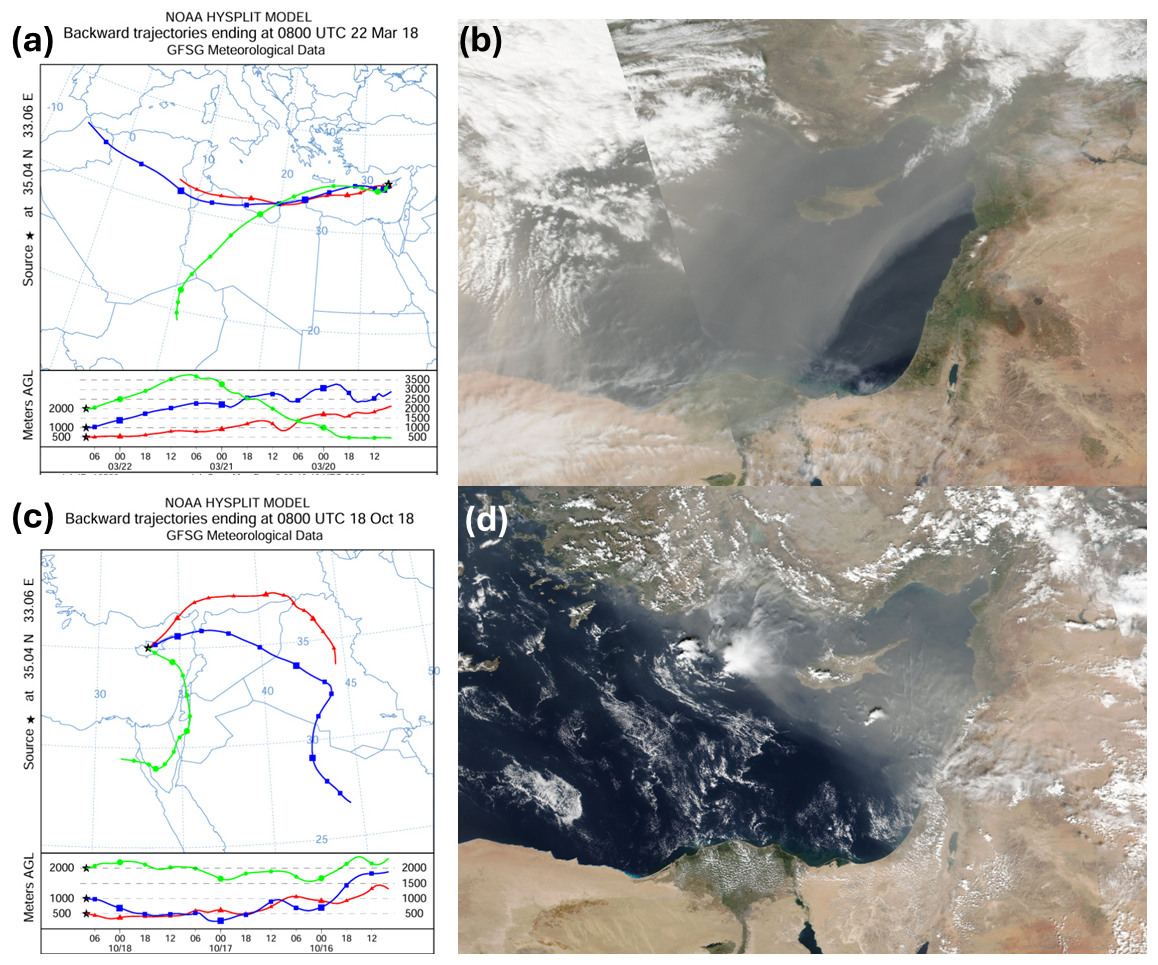
Figure 3(a–b) Saharan dust event on 22 March 2018 and (c–d) Middle Eastern dust event on 18 October 2018 over Cyprus. Panels (a) and (c) show 72 h backward air mass trajectories calculated using the NOAA Hybrid Single-Particle Lagrangian Integrated Trajectory (HYSPLIT) model with reanalysis meteorological data. Trajectories are presented for three arrival heights, indicated by red, green, and blue lines, revealing distinct source regions for each event. Panels (b) and (d) display corresponding MODIS satellite imagery (GIBS/Worldview), illustrating the spatial extent and transport of dust over the region during the two episodes.
A comparison between the LIDAR-based aerosol classification and the CIMEL-based dust origin classification was performed for this study using coincident measurements over the study period (Fig. 4). Each point in the figure represents 1 d for which simultaneous AERONET and LIDAR observations were available under cloud-free conditions. It should be noted that LIDAR measurements were not continuously available throughout the full study period, which limits the number of coincident cases. Each case is represented in the space of particle linear depolarization ratio and LIDAR ratio, as observed by LIDAR. The technique permits the discrimination of desert dust from other aerosols such as biomass-burning smoke, maritime particles, or urban haze as well as the separation of fine and coarse dust (Mamouri and Ansmann, 2014, 2017). The analysis of the LIDAR observations was based on the profiling of the optical properties and the aerosol type in the defined aerosol layers. More specifically, the identification of the source of aerosol particles was possible with the synergetic use of in situ and satellite measurements, as well as utilizing model estimations. Three-day backward trajectories (HYSPLIT-4) were calculated for the centre of the layer observed and for the time of the LIDAR measurement (Giannakaki et al., 2016). Each aerosol layer was classified into one of the four main aerosol types, i.e. marine, dust, continental (urban, european) and biomass burning. Furthermore, a distinguish between different desert sources from Africa (Saharan) and Middle East (Arabian) as well as mixed and polluted aerosol layers have been taken into consideration (Mamouri et al., 2026). In contrast, the AD classification is based on optical properties (AOD and Ångström exponent) and is used here to identify the dominant dust and with HYSPLIT model the source region (Sahara, Middle East, or mixed), without discriminating between pure and mixed dust conditions. For consistency in the comparison, all AD dust-origin classes were grouped under the single category “Dust”, and merged categories were used for visualization purposes. The LD methodology discriminates between Dust, Dust mixtures, and other aerosol types, accounting for aerosol mixing and local atmospheric influences. Consequently, all AD dust origin classes are grouped under the single category dust. Figure 4b presents the complete comparison, including the distinct aerosol categories and the detailed dust source attribution (Sahara, Middle East, or mixed), while Fig. 4a summarizes the overall agreement between the two classification approaches by grouping all AD dust-origin classes into a single Dust category.
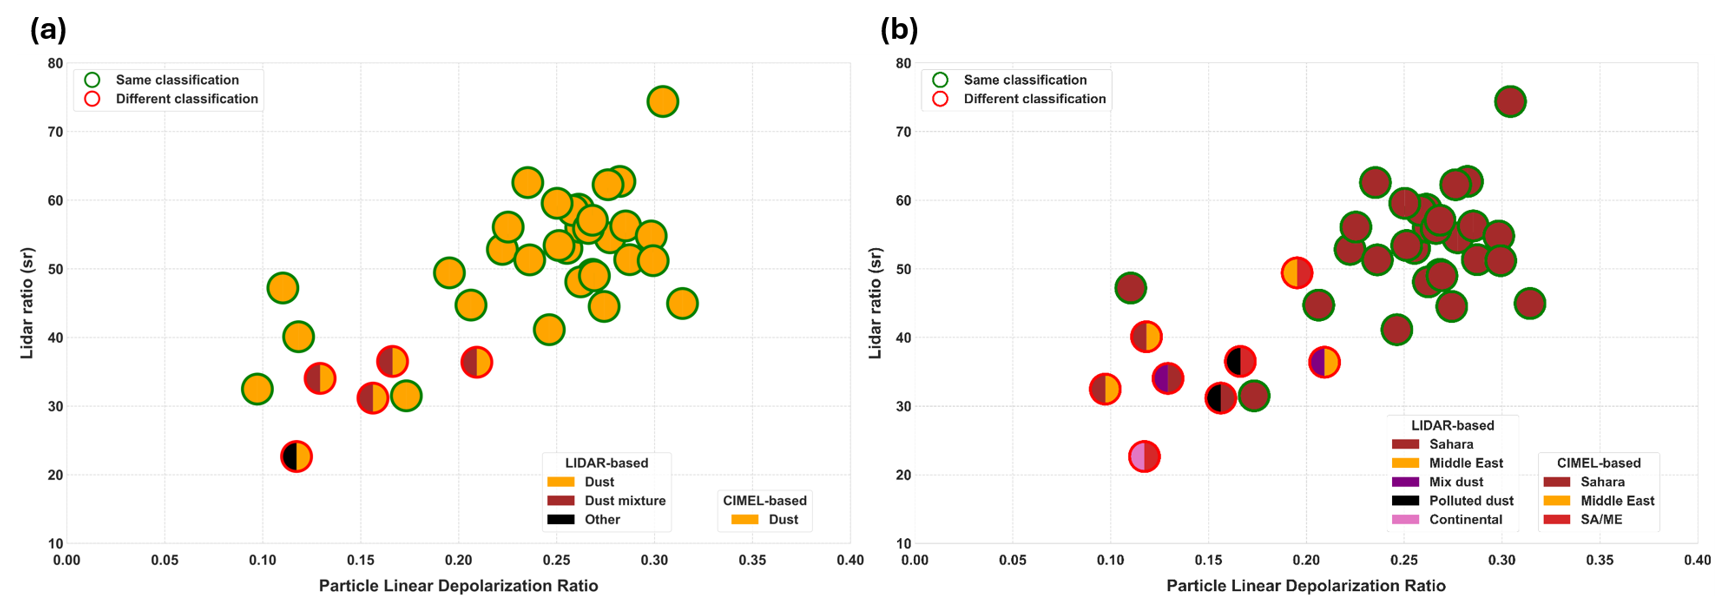
Figure 4Comparison of LIDAR Depolarization (LD)-based and AERONET-Dubovik (AD)-based aerosol classifications at the Agia Marina Xyliatou (AMX) and Limassol stations. Comparison between the LIDAR Depolarization (LD)-based and AERONET-Dubovik (AD)-based aerosol classifications using coincident cloud-free observations from the Agia Marina Xyliatou (AMX) and Limassol stations. Each case is displayed in particle linear depolarization ratio–LIDAR ratio space and represented by a pie marker, with the left half indicating the LD-based classification and the right half the AD-based classification. (a) Simplified comparison, in which all AD dust-origin classes (Sahara, Middle East, and mixed) are grouped into a single Dust category to illustrate the overall agreement between the two methods. Green and red marker outlines indicate agreement and disagreement between the LD and AD classifications, respectively. (b) Detailed comparison showing the individual LD aerosol classes (Saharan dust, Middle Eastern dust, mixed dust, polluted dust, and continental aerosol) together with the corresponding AD dust-origin classification. This panel highlights the source-dependent behaviour of the classified dust events and illustrates the differences between the optical-property-based (LD) and source-based (AD) classification approaches.
A total of 37 coincident LD and AD cases were analysed (Fig. 4a). Agreement between the two approaches was found for 32 cases (86.5 %), all corresponding to dust-dominated conditions consistently identified by both methods. The remaining five cases show disagreement. In four of these cases, the LD classification identifies Dust mixtures, while the AD classification attributes the aerosol to Dust (based solely on source origin). In one case, the LD method classifies the aerosol as Other (continental type), whereas the AD method still attributes a dust origin. These discrepancies arise from the different conceptual frameworks of the two approaches: the LD classification reflects aerosol optical properties and mixing state at the measurement site, while the AD classification provides large-scale source attribution without accounting for local mixing processes. Overall, the high agreement percentage confirms the robustness of the dust detection, while the disagreement cases highlight the complementary nature of optical-based typing and source-based attribution.
Based on Fig. 4b, a clear differentiation between Saharan and Middle Eastern dust can also be observed in the depolarization–LIDAR ratio space, in agreement with Floutsi et al. (2023). Saharan dust typically exhibits higher LIDAR ratios and particle linear depolarization values, consistent with its coarse-mode, non-spherical mineral particle composition. In contrast, Middle Eastern dust tends to display lower depolarization values and slightly reduced LIDAR ratios, likely reflecting the presence of finer particles and/or enhanced mixing with pollution during transport (Moustaka et al., 2026). Dust transport from the Middle East may involve a more complex aerosol mixture due to anthropogenic and natural contributions in the region (Ukhov et al., 2020). Unlike Saharan dust, which is predominantly mineral in composition, Middle Eastern dust events can be influenced by regional emissions, including industrial pollutants (Hatzianastassiou et al., 2009; Osipov et al., 2022). Both source regions may also experience mixing with marine aerosols during transport over the Mediterranean Sea. Figure 4b further shows that the agreement between the two approaches is considerably stronger for Saharan dust than for Middle Eastern dust. While Saharan dust cases are consistently classified by both methods, several cases attributed to Middle Eastern dust by the AD classification are identified by the LD classification as Dust mixtures or other aerosols. This behaviour reflects the different objectives of the two methodologies: the AD classification identifies the geographical source region of the transported dust, whereas the LD classification characterizes the optical properties and mixing state of the aerosol at the measurement site. Consequently, aerosol mixing during transport from the Middle East can modify the optical characteristics sufficiently for the arriving aerosol to be classified as Dust mixtures or Other, despite retaining a Middle Eastern dust origin.
The same methodology was applied using CIMEL measurements from both the AMX and Limassol TEPAK stations for the same set of coincident cases. Identical CIMEL classification results were obtained from both stations, leading to the same agreement and disagreement patterns with the LIDAR-based classification. This consistency confirms the spatial robustness of the AD derived dust origin classification over the region and indicates that the observed differences with the LD based results are not related to the choice of CIMEL station, but rather to inherent differences between source-based and optically based aerosol classification approaches. Subsequently, the fine-mode fraction was examined and only cases with FMF < 0.4 were selected to ensure dominance of coarse-mode particles and to restrict the analysis to predominantly pure dust conditions. This additional filtering step was applied after the initial dust identification and source attribution, as the earlier stages of the analysis aimed to capture the full climatology of dust occurrences over Cyprus, including events with potential mixing. The FMF criterion is introduced here to refine the dataset specifically for the radiative effect analysis, where the presence of fine-mode or mixed aerosols could bias the estimation of dust-specific radiative impacts. For Saharan dust, approximately 75.4 % of the cases exhibit FMF < 0.4, while the remaining 24.6 % show higher fine-mode contributions (FMF ≥ 0.4). In contrast, Middle Eastern dust shows a larger fraction of cases with enhanced fine-mode influence, with 57.6 % of the cases satisfying the FMF < 0.4 criterion and 42.4 % exceeding this threshold. Following the application of the FMF < 0.4 criterion, the number of retained dust cases decreased from 199 to 150 d for Saharan dust and from 33 to 19 d for Middle Eastern dust. This reduction indicates that Middle Eastern dust events are more frequently influenced by fine-mode particles and aerosol mixing, consistent with their transport over populated and industrialized regions. The retained cases therefore represent a more conservative but robust subset of dust events, suitable for isolating the radiative effects of mineral dust with minimal interference from non-dust aerosol components. Notably, after applying the FMF < 0.4 filtering criterion, all five disagreement cases shown in Fig. 4 were excluded from the dataset, suggesting that these discrepancies are primarily linked to mixed aerosol conditions and enhanced fine-mode contributions rather than pure dust events.
3.3 Intra-annual variability of dust optical properties
Analysis of AERONET observations for cloud-free days (based on Fig. 5 and Table 2), reveals seasonal patterns in both the origin and optical properties of dust over AMX. Table 2 summarizes the total number of dust days per month and shows that Saharan dust occurs consistently throughout the year with contributions recorded in almost every month of the seven-year period. The peak influence of Saharan dust is observed in April and May, with May registering a maximum of 50 dust days over the study period (approximately 7 dust days per year). In contrast, dust contributions from the Middle East are less frequent, distributed, but with a noticeable increase in November. Taken together, these observations provide a coherent picture of the dust climatology in the study area, with a well-defined seasonal cycle dominated by events during MAM. This pattern aligns with prevailing meteorological conditions that favour dust uplift and transport from North Africa towards the Eastern Mediterranean (Gkikas et al., 2016).
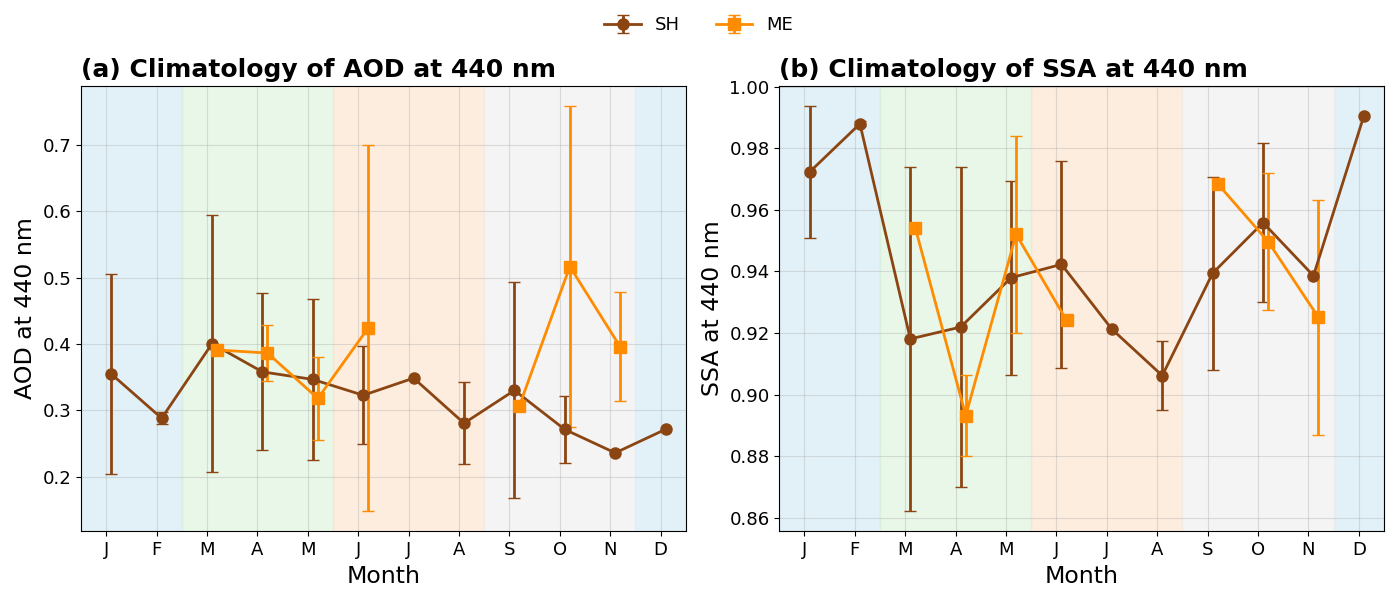
Figure 5The intra-annual variability of monthly average aerosol optical properties (a) AOD at 440 nm, and (b) SSA at 440 nm for different dust origins (SH-brown and ME-orange). Error bars represent ±1 standard deviation (±1σ). Seasons are indicated by background colours: light blue for DJF, light green for MAM, light orange for JJA, and light grey for SON.
Table 2Number of days of dust events for dust layers originating either from Sahara (SH) or the Middle East (ME).

Figure 5a presents the monthly climatology of AOD at 440 nm for Saharan and Middle Eastern dust events. Saharan dust occurs more frequently during MAM (see Table 2), resulting in elevated AOD values due to intensified dust transport from North Africa. However, during October and November, Middle Eastern dust exhibits higher mean AOD values than mean Saharan dust values, particularly in October, when it reaches its seasonal maximum AOD (0.5). For most of the remaining months, AOD values from the two source regions are comparable within their respective monthly variability. The relatively large standard deviations indicate substantial year-to-year variability, reflecting the fact that dust transport over Cyprus is dominated by episodic events rather than continuous background conditions.
Figure 5b shows the corresponding monthly climatology of SSA at 440 nm. SSA values remain generally high (≈ 0.92–0.98) for both source regions, indicating predominantly scattering dust aerosols. Although Saharan and Middle Eastern dust exhibits comparable AOD values during MAM (Fig. 5a), the SSA climatology for Middle Eastern dust displays a less regular monthly pattern. This should be interpreted with caution, as the Middle Eastern climatology during MAM is based on a very limited number of cases (one in March, two in April, and four in May, Table 2), making the monthly means more sensitive to individual events and their associated aerosol properties. Although some seasonal fluctuations are apparent, the differences between Saharan and Middle Eastern dust are within the range of the monthly standard deviation and the retrieval uncertainty of SSA. Therefore, no statistically robust evidence emerges that one dust source is systematically more absorbing than the other at 440 nm. It should be emphasized, however, that this comparison is based on the subset of events retained after the FMF < 0.4 filtering criterion, i.e. cases dominated by coarse-mode dust. Given that Middle Eastern dust events are more frequently associated with aerosol mixing, including fine-mode contributions from anthropogenic pollution and other sources, the applied filtering likely excludes a portion of these mixed. As a result, the retained Middle Eastern dust cases represent conditions with reduced aerosol mixing, making them more comparable to typical Saharan dust. This provides a plausible explanation for the observed similarity in SSA between the two source regions. Inclusion of more mixed or polluted cases could potentially lead to different optical characteristics, particularly with respect to absorption.
Long-term mean optical properties of Saharan and Middle Eastern dust derived from AERONET observations are summarized in Table 3. To complement the mean ± standard deviation, median values and interquartile ranges (IQRs) are also reported to assess the robustness of the statistics against a small number of intense dust events. The long-term daily mean AOD440 is 0.34 ± 0.12 (median 0.31, IQR 0.25–0.38) for Saharan dust and 0.38 ± 0.13 (median 0.39, IQR 0.34–0.43) for Middle Eastern dust. As shown in the monthly climatology (Fig. 5a), the slightly higher mean AOD for Middle Eastern dust is primarily influenced by enhanced aerosol loading during SON, while during MAM both sources exhibit comparable AOD levels.
Table 3Long-term daily mean aerosol optical properties at 440 nm for Saharan (SH) and Middle Eastern (ME) dust events derived from AERONET observations. Values are reported as mean ± standard deviation together with the median and interquartile range (Q1–Q3) to provide robust measures of the central tendency and variability.
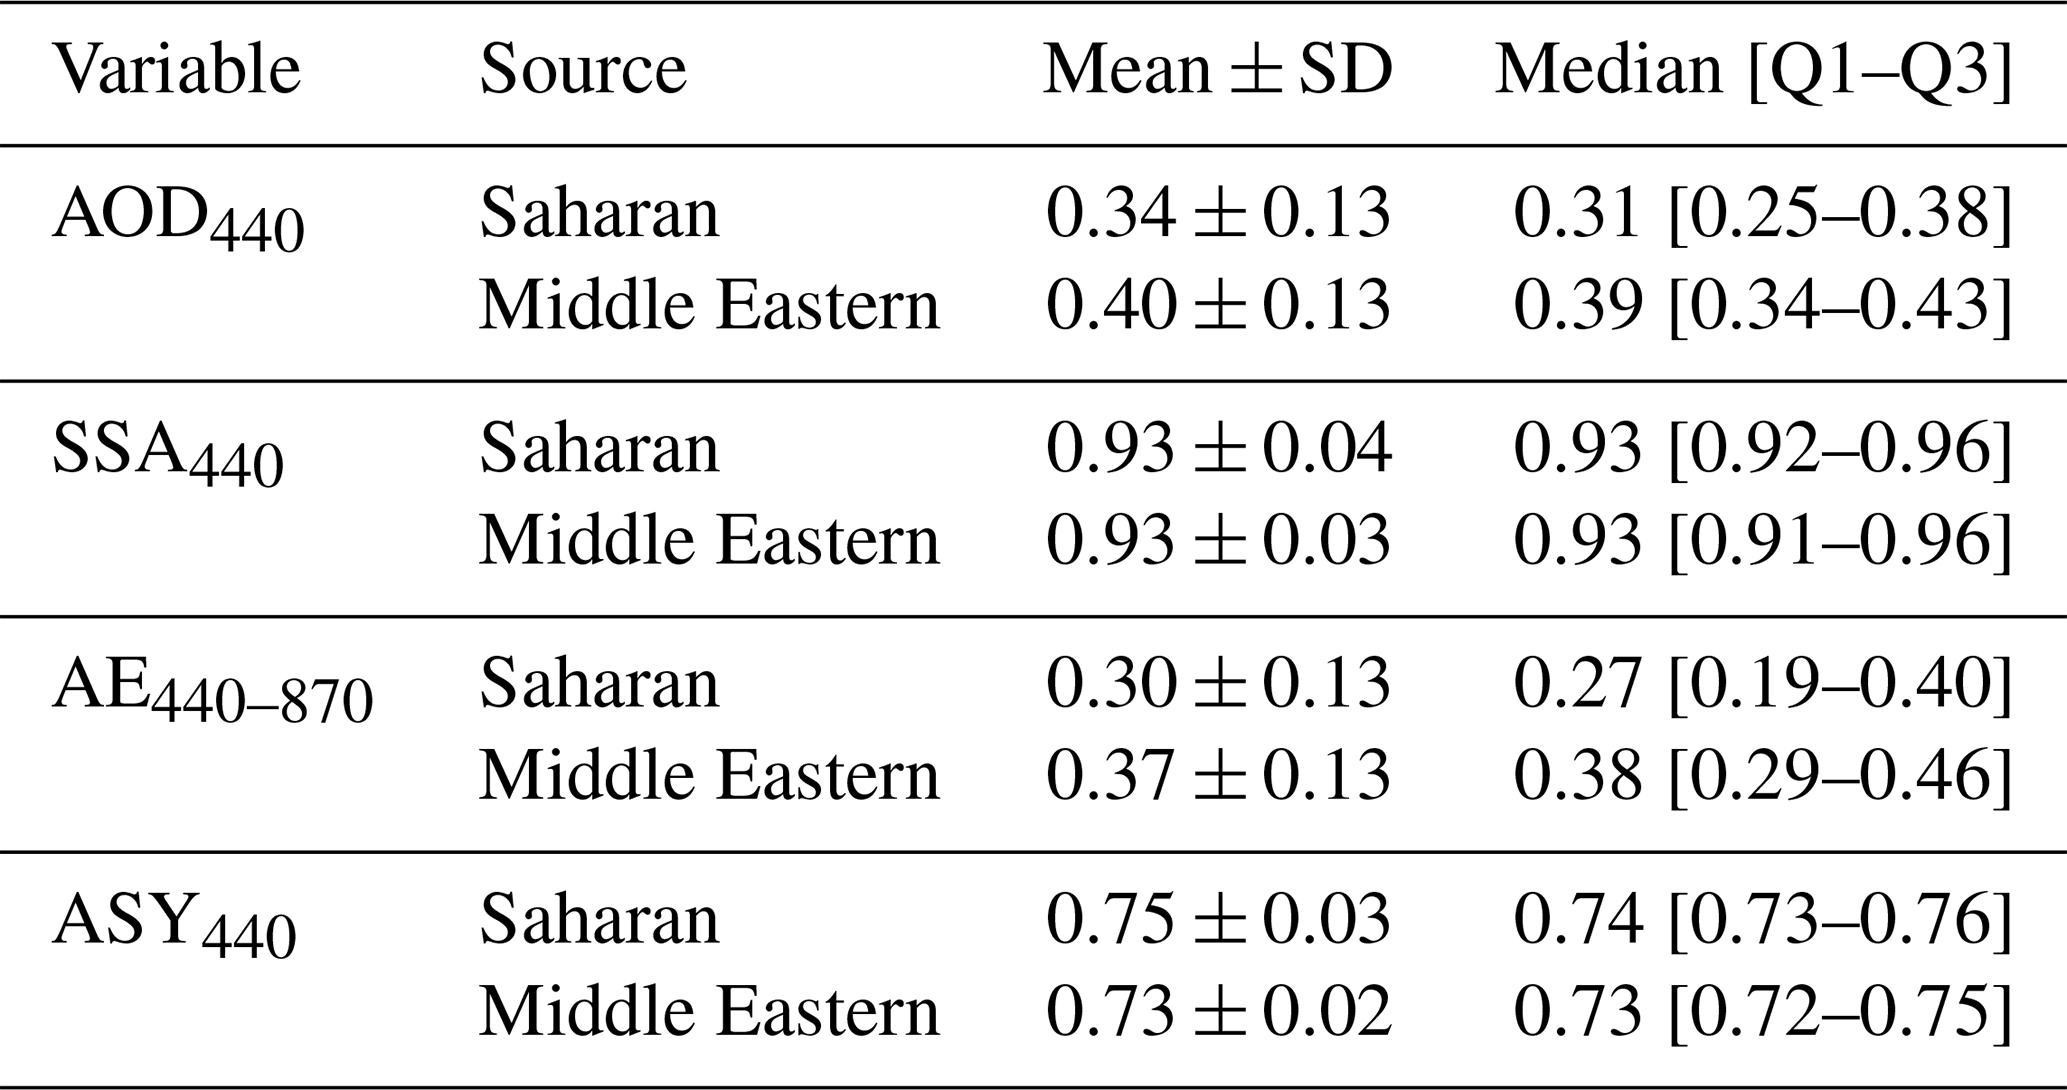
The long-term mean daily mean SSA440 is 0.93 ± 0.04 (median 0.93, IQR 0.92–0.96) for Saharan and 0.93 ± 0.03 (median 0.93, IQR 0.91–0.96) for Middle Eastern dust. In both cases, SSA values remain high, indicating predominantly scattering aerosols. Although Middle Eastern dust exhibits marginally higher mean SSA values, the differences relative to Saharan dust are small and fall within the retrieval uncertainty of SSA. The nearly identical mean and median values further demonstrate the robustness of the reported statistics. Although Middle Eastern dust exhibits marginally different SSA values, the differences relative to Saharan dust remain small and fall within the retrieval uncertainty of SSA. Therefore, no robust conclusion can be drawn regarding systematic differences in absorption characteristics between the two source regions at 440 nm. The long-term daily mean AE440-870 is 0.30 ± 0.13 (median 0.27, IQR 0.19–0.34) for Saharan dust and 0.37 ± 0.13 (median 0.38, IQR 0.29–0.46) for Middle Eastern dust. The slightly higher AE values for Middle Eastern dust suggest a relatively larger fine-mode contribution and thus smaller effective particle sizes compared to Saharan dust, which is consistent with its typically coarser mineral composition. However, the overlap in standard deviations indicates substantial variability within both source categories.
The ASY at 440 nm exhibits very similar values for the two dust source regions, with mean values of 0.75 ± 0.03 (median 0.74, IQR 0.73–0.76) for Saharan dust and 0.73 ± 0.02 (median 0.73, IQR 0.72–0.75) for Middle Eastern dust. These relatively high values are characteristic of coarse-mode mineral dust and indicate predominantly forward scattering. The similarity of the asymmetry parameter suggests that differences in the observed radiative effects between Saharan and Middle Eastern dust are primarily controlled by aerosol loading (AOD) and absorption properties (SSA), rather than by differences in the angular distribution of scattered radiation.
Overall, while small differences in AOD and particle size characteristics are observed between the two dust sources, the optical properties remain broadly comparable within their respective uncertainties. These findings highlight the importance of considering statistical variability and retrieval uncertainty when interpreting source-dependent differences in dust optical characteristics.
The AERONET-retrieved mean volume size distributions for Saharan and Middle Eastern dust during spring (MAM) and autumn (SON) are presented in Fig. S1. In both seasons, the distributions are dominated by a pronounced coarse-mode peak at radii of about 2 µm, typical of mineral dust size-distributions retrieved with this method.
During MAM, Saharan and Middle Eastern dust has very similar coarse-mode shapes, but the Middle Eastern cases show a slightly more evident fine-mode contribution (r ≤ 0.2 µm), consistent with some degree of aerosol processing and/or mixing during transport (Moustaka et al., 2026). Beyond roughly 2–3 µm, the Middle Eastern curve tends to remain comparable to, and in places slightly higher than, the Saharan curve, suggesting a relatively stronger contribution from larger coarse particles in those events.
During SON, the coarse-mode peak remains at similar radii, but the Middle Eastern distribution appears broader and its spread is larger, especially across the coarse tail which at half maximum is about ∼ 1 µm shifted to the right. The shaded envelopes (±1σ) indicate substantial interannual variability for both source regions, with stronger variability for Middle Eastern dust, consistent with the more episodic nature of these events and the likelihood of differing mixing states from case to case. For a more compact and quantitative comparison of particle size between the two source origins, the effective radius was also examined, as it summarizes the combined influence of the peak position and the coarse/fine partitioning.
3.4 Validation of incoming solar fluxes at the surface
The first step in ensuring the robustness of the calculated DREs is to assess the accuracy of the simulated solar fluxes in cloud-free conditions, in the presence of aerosols (AOD from AERONET used to quantify them). To this end, incoming surface solar fluxes, GHI estimated by the RT model were evaluated against ground-based measurements. To minimise angular-dependent errors associated with the instrument's azimuth response, and to avoid artefacts introduced by very low radiation values (which can artificially reduce relative differences), only observations with SZA ≤ 65° were considered for this evaluation. Table 4 summarizes the results, showing good agreement between RT model simulations and observations. Overall, ∼ 87 % of the instantaneous simulations fall within ±5 % of the observed GHI values and ∼ 96 % within ±10 %. In absolute terms, ∼ 75 % of the values are within ±20 W m−2 and ∼ 93 % within ±50 W m−2. These results demonstrate that the estimates of surface solar fluxes reproduce surface solar flux variability under clear-sky conditions.
Table 4Performance of simulated surface solar fluxes against ground-based observations (excluding case with SZA > 65°).
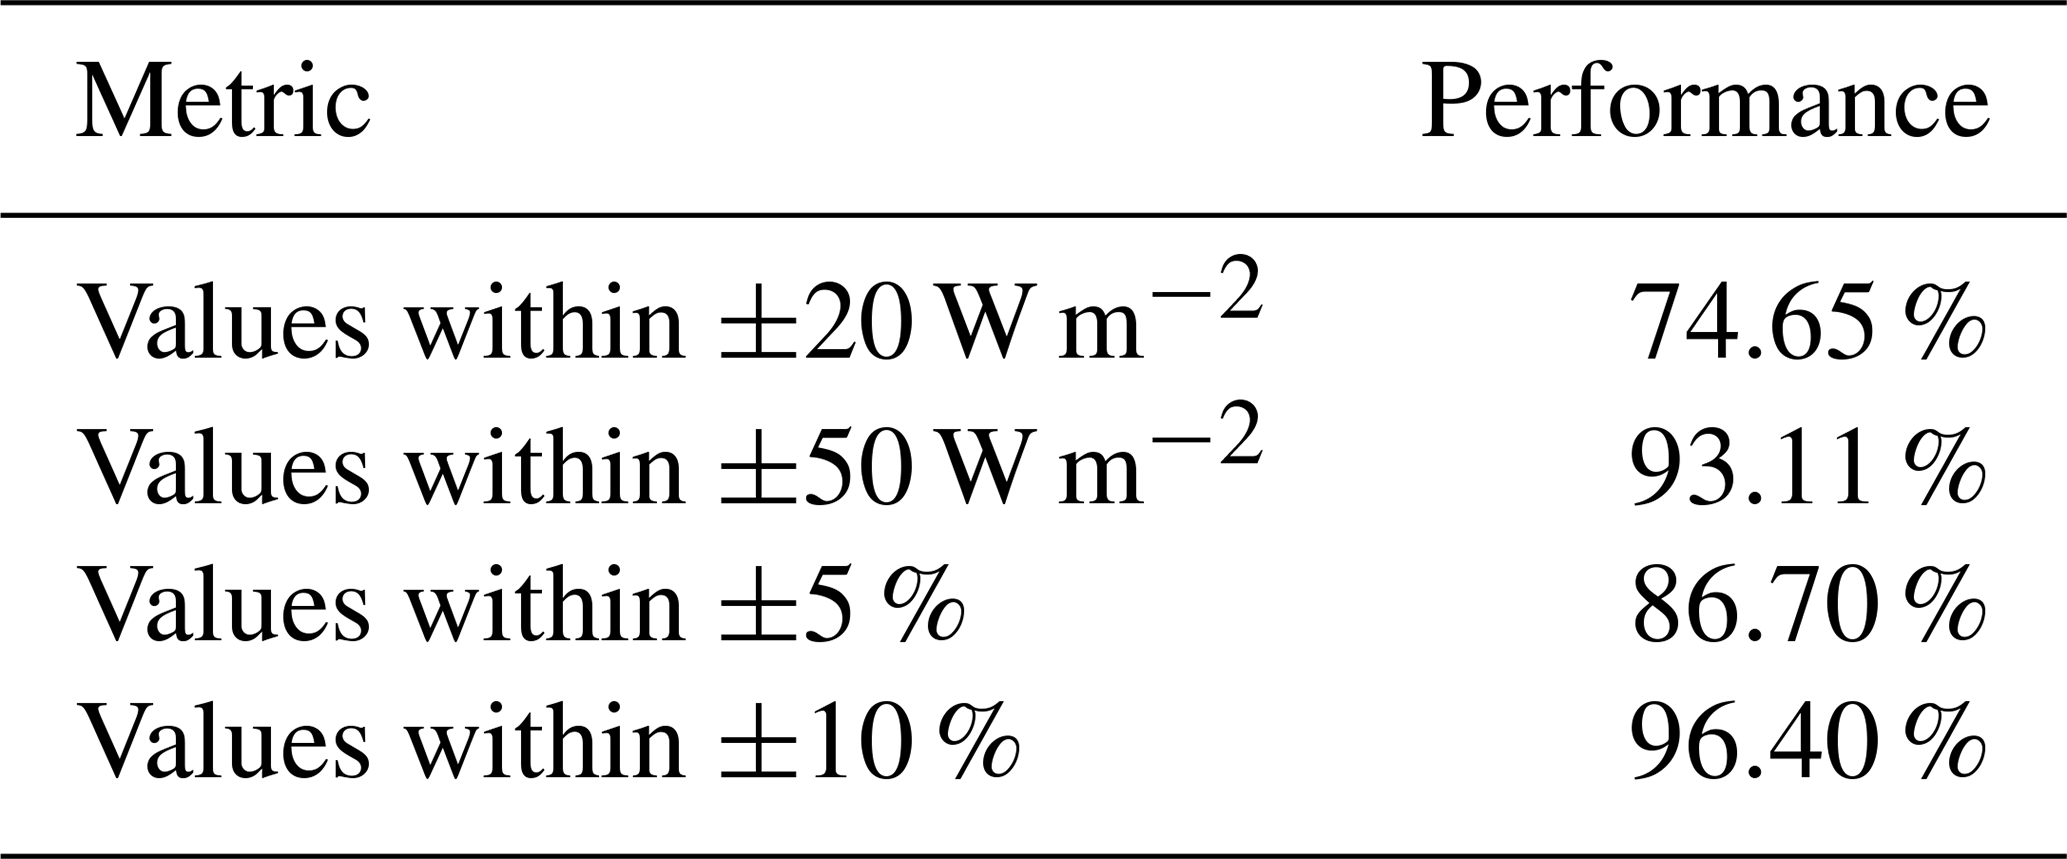
Figure 6 shows the distribution of percentage differences between RT estimates and ground-based observations. A slight tendency toward underestimation of surface SW irradiance by the RT model is observed in a limited number of cases, however, this bias remains small and within the overall uncertainty range of the aerosol optical inputs and measurement accuracy.
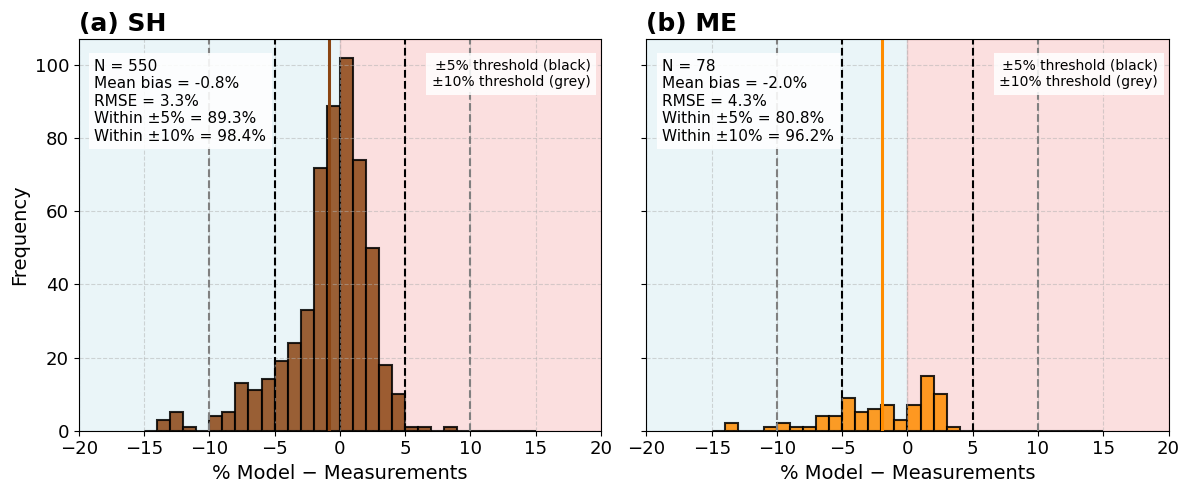
Figure 6Histograms of the percentage differences between modelled and measured global horizontal irradiance (GHI) for dust cases attributed to (a) Saharan (SH) and (b) Middle Eastern (ME) sources. The y-axis represents the absolute frequency of observations (SZA ≤ 65°) within each percentage-difference bin. Blue and red shaded regions indicate model underestimation and overestimation, respectively. Vertical dashed lines denote ±5 % (black) and ±10 % (grey) agreement thresholds between modelled and observed irradiance.
This validation step provides confidence that subsequent DRE estimates derived from the RT simulations are reliable and not significantly biased by model uncertainties. Part of the residual differences between simulations and observations can be attributed to the inherent uncertainty of the surface radiometric measurements. Intercomparison campaigns with reference instruments calibrated by the manufacturer (Kipp & Zonen) indicate an agreement within approximately ±2 %–3 % for solar irradiance measurements over the study period (2015–2022), which is consistent with the stated instrumental accuracy. Considering both measurement uncertainty and model-related uncertainties (e.g., input aerosol properties and radiative transfer assumptions), the combined uncertainty in the simulated shortwave fluxes is estimated to be on the order of ∼ 3 %–4 %. The fact that most of the simulated values fall within ±5 % of the observations suggests that no significant systematic bias is introduced by either the instrument calibration or the modelling approach. Additional inspection of low-AOD (near-clear) conditions does not indicate a consistent systematic offset, further supporting the robustness of the simulations. Given that the residual differences between simulations and observations falls within the inherent measurement uncertainty, we believe that the RT model approach can be used to estimate the shortwave radiation. Hereby, the validated RT model outputs are adopted for the event-based radiative effect analysis. The small systematic differences identified in the previous comparison are acknowledged and considered in the interpretation of the DRE magnitudes.
In addition to the agreement thresholds reported in Table 4, the radiative transfer simulations were evaluated using standard statistical performance metrics. For Saharan dust cases (N=550), the comparison between simulated and measured cloud-free GHI yielded an excellent agreement, with a coefficient of determination of R2 = 0.98 and a regression slope of 0.98. The mean bias error (MBE) was −4.0 W m−2, corresponding to a mean relative difference of −0.8 %, while the RMSE was 22.2 W m−2 (3.3 %). Similarly, for Middle Eastern dust cases (N=78), the model achieved R2 = 0.98 with a regression slope of 0.99, an MBE of −9.4 W m−2 (−2.0 %), and an RMSE of 24.5 W m−2 (4.3 %). These results indicate that the radiative transfer model accurately reproduces the observed cloud-free surface irradiance, exhibiting only a slight tendency to underestimate the measurements. Figure 6 illustrates the distribution of the relative differences between simulated and measured GHI, showing that most of the simulations fall within the ±5 % and ±10 % agreement thresholds, with only a slight tendency towards model underestimation.
The remaining differences between simulations and observations arise from several sources, including uncertainties in the retrieved aerosol optical properties used as model input, temporal matching between simulations and measurements, assumptions adopted in the radiative transfer calculations, and the inherent uncertainty of the ground-based irradiance measurements. According to the manufacturer specifications and radiometric intercomparison campaigns, the uncertainty of the pyranometer measurements is approximately ±2 %–3 %. Although a formal propagation of all model-input uncertainties was not performed, the small bias, low RMSE values, and high level of agreement between simulations and observations indicate that the adopted radiative transfer configuration reproduces cloud-free surface irradiance with sufficient accuracy for the subsequent estimation of dust direct radiative effects. Consequently, the validated model outputs were used throughout the DRE analysis, while the remaining uncertainties were considered when interpreting the calculated radiative effect magnitudes.
3.5 Direct Radiative Effects
In this Section we quantify the SW DREs at the surface, the TOA and within the atmospheric column under clear-sky conditions for dust-dominated aerosol cases, using the RT model results following the methodology described in Sect. 2.4.3. The DREs were calculated for each individual AERONET observation using the corresponding aerosol optical properties and solar geometry. To ensure consistency with the validation analysis presented in Sect. 3.4, only cases with SZA ≤ 65° were considered. Monthly mean DREs were then obtained by averaging the instantaneous values for each month. Although pyranometer measurements could also be used at the exact AERONET acquisition times, the modelling framework provides a systematic assessment of the sensitivity of DREs to aerosol optical properties, within an estimated uncertainty of approximately 5 %, based on the agreement between simulations and observations. Because DRE is inherently dependent on SZA, an additional sensitivity analysis was performed to evaluate the influence of changing solar geometry on the monthly climatology. First, the monthly DREs were recalculated separately for four SZA intervals (0–15, 15–30, 30–45, and 45–60°), and the results are presented in Fig. S2. Second, following the reviewer's recommendation, the monthly DRE climatology was recalculated using only observations acquired within a common solar zenith angle of 60 ± 4°, which is sampled throughout the year. This complementary analysis minimizes seasonal differences arising solely from changing solar geometry and provides a more consistent comparison of monthly radiative effects. The principal conclusions remain unchanged, demonstrating that the observed seasonal variability is primarily driven by aerosol characteristics rather than by differences in SZA.
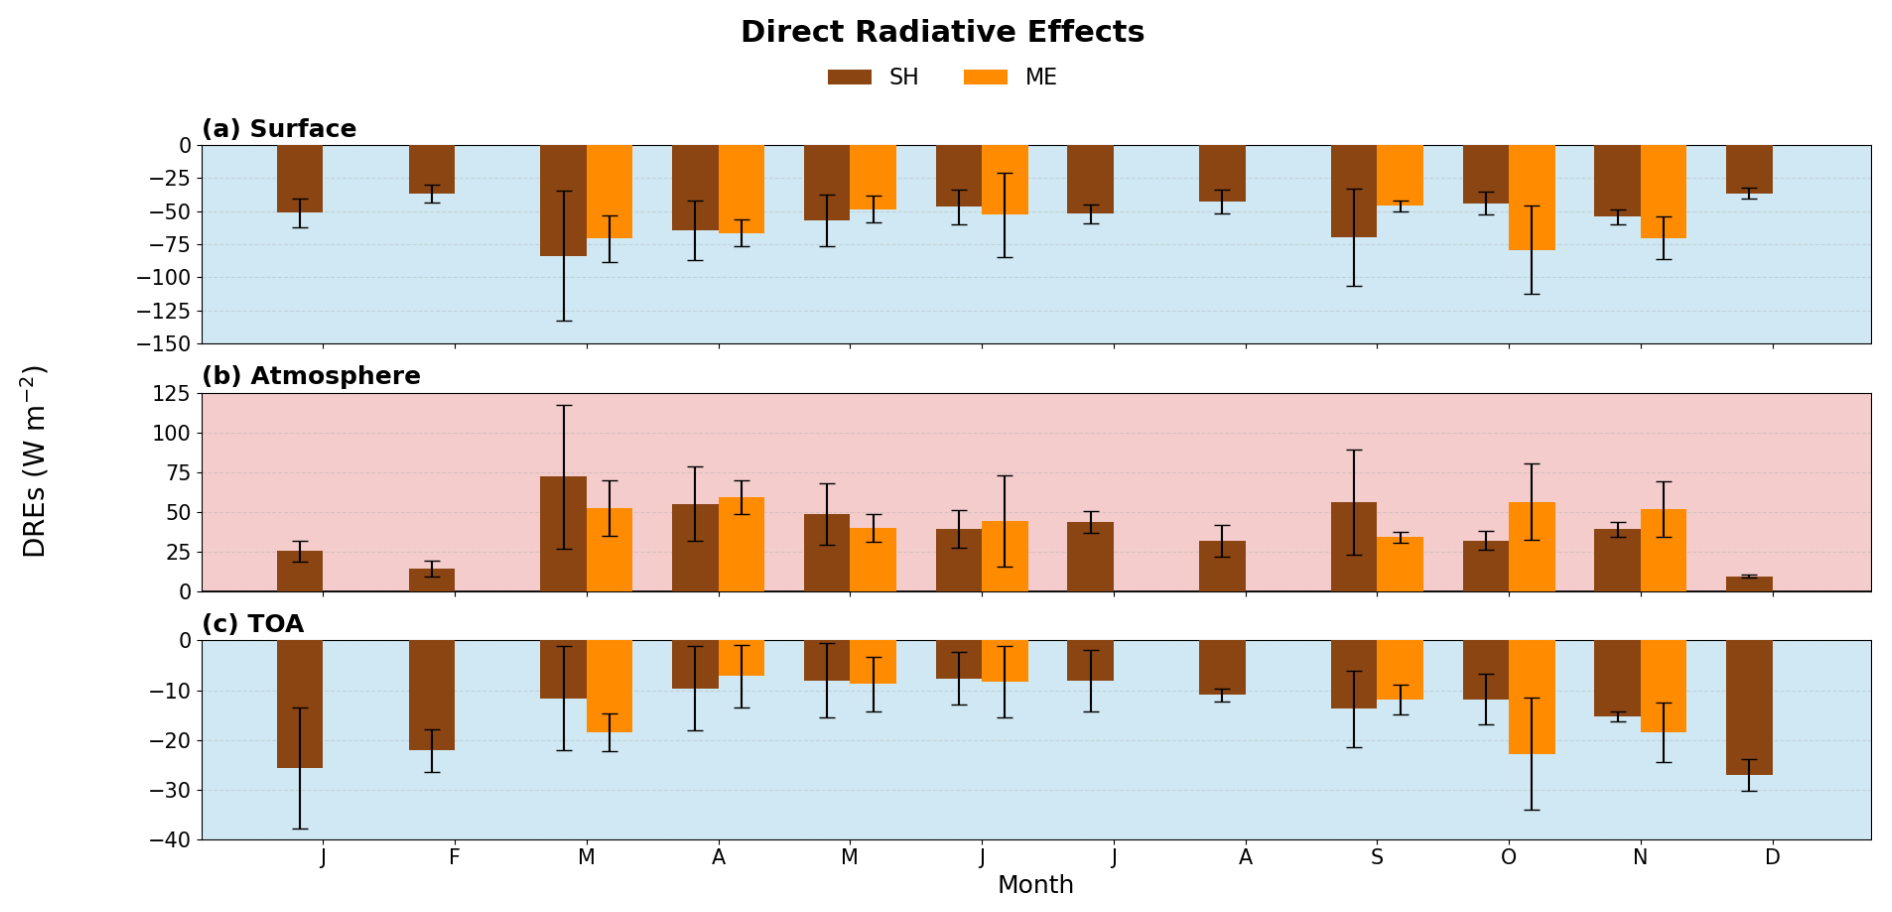
Figure 7Monthly mean DREs (in W m−2) over AMX (2015–2022) under clear-sky conditions for (a) surface, (b) TOA, and (c) within the atmosphere. Saharan dust events are shown in brown and Middle Eastern dust events in orange. Bars represent monthly mean values (W m−2), and error bars denote ±1 standard deviation, indicating the intra-month variability of radiative effects. Background colours denote cooling (blue) and warming (red) effects.
The monthly variation of the surface DRE for the complete dataset (SZA ≤ 65°) is shown in Fig. 7a, following the pattern of the optical properties presented in Fig. 5. Overall, the negative values indicate a net cooling effect on the surface, as mineral dust reduces incoming solar radiation through scattering and absorption. In March, Saharan dust produces the largest monthly mean cooling (−84 ± 49 W m−2) in line with the peak in its mean AOD (Fig. 5a), accompanied by the largest variability, in line with the presence of both moderate and extreme dust events (high variability for AOD) and the high variability of the corresponding SSA values for Sahara event in March (Fig. 5b). Enhanced cooling is also observed in September (−70 ± 37 W m−2), in line with the secondary peak of the mean AOD for Sahara dust events this month (Fig. 5), consistent with the enhanced aerosol loading observed during this period (see Sect. 3.3). In contrast, boreal winter months show weaker and less variable surface radiative effects (e.g. −37 ± 4 W m−2 in December), reflecting both the reduced incoming solar radiation during that period of the year and also the lower AODs over those months for Sahara events (Fig. 5).
Middle Eastern dust events occur less frequently and show a more episodic behaviour as we have shown in Sect. 3.3, however they can induce surface cooling comparable to Saharan dust during specific months (Fig. 5). In October the strongest Middle Eastern cooling is observed (−79 ± 33 W m−2) in line with the peak in Middle East events mean AOD (Fig. 5a), exceeding the contemporaneous Saharan mean (−44 ± 9 W m−2). Notably, this value is comparable in magnitude to the maximum surface cooling observed for Saharan dust in March (−84 ± 49 W m−2), indicating that, although less frequent, Middle Eastern dust outbreaks can produce radiative effects of similar intensity during high-loading events. In March and April, Middle Eastern dust yields mean DRE values at surface of −71 ± 17.8 and −66 ± 10 W m−2, respectively, which are comparable in magnitude to those associated with Saharan dust. These results indicate that, although less frequent, Middle Eastern dust outbreaks can exert a substantial surface radiative impact, particularly during SON.
Saharan dust events were substantially more frequent, with 152 identified dust days compared with 19 Middle Eastern dust days. However, the less frequent Middle Eastern events exhibited a slightly higher average daily aerosol loading, with a mean AOD440 of 0.40 ± 0.13 compared with 0.34 ± 0.13 for Saharan dust. The corresponding mean daily surface DRE was −66.2 ± 24.1 W m−2 for Middle Eastern dust and −57.5 ± 24.6 W m−2 for Saharan dust. Nevertheless, the most intense individual events were predominantly Saharan, including the largest daily mean AOD440 and the strongest surface cooling observed in the dataset.
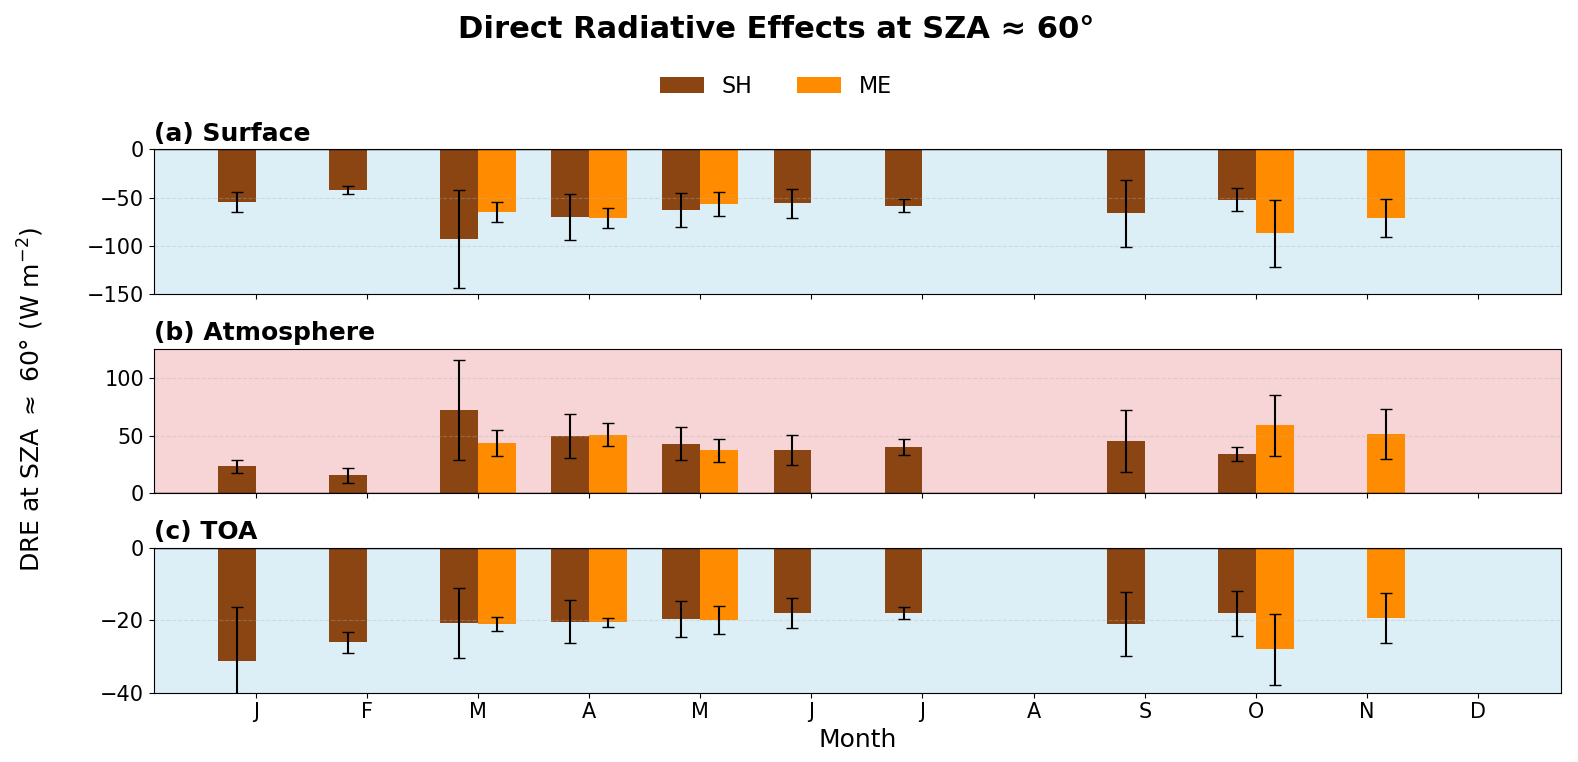
Figure 8Monthly mean shortwave direct radiative effects (DRE, W m−2) at SZA = 60 ± 4° over AMX (2015–2022) under clear-sky conditions for (a) surface, (b) atmosphere and (c) TOA. Saharan dust is shown in brown and Middle Eastern dust in orange. Bars represent monthly mean values and error bars denote ±1 standard deviation. Background colours denote cooling (blue) and warming (red) effects.
For Saharan dust, the strongest monthly mean surface cooling at the selected SZA (60 ± 4°) (Fig. 8) occurs in March, at approximately −92 W m−2, accompanied by large variability. Enhanced cooling is also observed in April (∼ −69 W m−2), May (∼ −61 W m−2), September (∼ −65 W m−2), and July (∼ −58 W m−2). Weaker surface effects are observed in February (∼ −40 W m−2) and October (∼ −51 W m−2). Middle Eastern dust produces surface cooling of approximately −63 W m−2 in March, −70 W m−2 in April, and −55 W m−2 in May. The strongest Middle Eastern surface cooling is observed in October (∼ −86 W m−2), followed by November (∼ −70 W m−2). The October Middle Eastern value is stronger than the contemporaneous Saharan value of approximately −51 W m−2. The magnitude of some monthly means changes after controlling for SZA, reflecting the removal of seasonal differences in solar geometry, but the overall conclusions regarding the relative behaviour of the two dust-source regions remain unchanged. This demonstrates that the main findings are robust and are primarily associated with differences in aerosol loading and optical properties rather than variations in solar zenith angle alone.
The black error bars in Figs. 7 and 8 show the variability in radiative effects for observed dust conditions across every month. MAM and SON show the clearest fluctuations since dust occurrences are most common in those seasons. This variability underscores the importance of accurately characterizing aerosol optical properties in order to reliably estimate dust radiative effects and their associated climate. The predominantly negative surface DRE highlights the potential implications of dust for regional climate and solar energy applications.
The positive values of the DRE in atmosphere shown in Fig. 7b indicate net atmospheric heating due to the absorption of solar radiation by dust aerosols. This heating reflects the conversion of absorbed shortwave radiation into thermal energy within the atmospheric column and highlights the important role of dust in modifying the vertical distribution of radiative energy. Because DRE with atmosphere is computed as the difference between DRE at TOA and DRE at surface (following Eq. 7), its seasonal behaviour naturally mirrors the patterns seen in Fig. 7a and c. Since the surface cooling magnitudes are larger than the TOA, the seasonal cycle of DRE in the atmosphere tends to follow the surface pattern, with stronger heating in months of enhanced dust loading.
For Saharan dust, wintertime heating is relatively modest (e.g., 25 ± 7 W m−2 in January and 14 ± 5 W m−2 in February), consistent with lower insolation and weaker dust influence. The strongest Saharan atmospheric heating occurs in March (72 ± 45 W m−2), followed by elevated values in April (55 ± 23 W m−2) and May (49 ± 19 W m−2). This peak coincides with the MAM maximum in dust activity and aerosol loading (Fig. 5a), while the large March spread reflects the coexistence of moderate and intense events. Later in the year, Saharan heating remains noticeable (e.g., September: 56 ± 33 W m−2), again consistent with enhanced dust occurrence and variability during the transition seasons.
Middle Eastern dust, although less frequent, can produce comparable column heating during specific months. In March (52 ± 18 W m−2) and April (59 ± 11 W m−2), the atmospheric response is strong, while the largest Middle Eastern heating appears in October (56 ± 24 W m−2), when Middle Eastern events also show elevated aerosol loading (Fig. 5a). Overall, the month-to-month variability in DRE in the atmosphere is therefore reflects the strength and frequency of dust episodes (linked to AOD).
Figure 7c shows the monthly variation of DRE at TOA, separated into contribution from Middle East (orange) and Saharan (brown). Overall, both Saharan and Middle Eastern dust events produce negative DRE at TOA, indicating a net cooling effect resulting from solar radiation scattering back-off to space. The magnitude of this effect varies seasonally and by source region.
For Saharan dust, the strongest TOA cooling is observed during winter months, particularly in December (−27 ± 3 W m−2), January (−26 ± 12 W m−2), and February (−22 ± 4 W m−2). This enhanced wintertime cooling occurs despite only moderate AOD values and is consistent with the elevated SSA observed during this season (Fig. 5b), a behaviour that is also reflected in the DRE efficiency. The high SSA values indicate a predominantly scattering aerosol, which increases the fraction of incoming solar radiation reflected back to space and strengthens the negative DRE at TOA. For Middle Eastern dust, the strongest TOA cooling occurs in October (−23 ± 11 W m−2), coinciding with the seasonal maximum in mean AOD (Fig. 5a). Secondary peaks are observed in March (−19 ± 4 W m−2) and November (−19 ± 6 W m−2). These months are characterized by relatively high AOD and elevated SSA values, with November also exhibiting increased SSA variability (Fig. 5b). The combined influence of AOD magnitude and scattering efficiency explains the enhanced TOA cooling during these periods. Overall, these results highlight the important role of SSA in accurately determining TOA DRE under clear-sky conditions, as the scattering–absorption balance strongly modulates the amount of solar radiation reflected to space.

Figure 9Relationship between aerosol optical depth at 440 nm (AOD440) and instantaneous shortwave direct radiative effects (DRE) at the surface, atmosphere, and top of the atmosphere (TOA) for Saharan (SH; a–c) and Middle Eastern (ME; d–f) dust observations. Symbols are coloured according to the single-scattering albedo (SSA) at 440 nm. Solid lines represent linear regression fits. Pearson and Spearman correlation coefficients (ρ), associated p-values, and the number of observations (N) are reported in each panel.
The dependence of DRE on the aerosol optical properties AOD and SSA was further investigated using the instantaneous dust observations (Fig. 9). AOD is the primary parameter controlling the magnitude of the surface and atmospheric DREs, as demonstrated by the strong and nearly linear relationships observed for both dust sources. For Saharan dust, AOD is strongly negatively correlated with surface DRE (Pearson r = −0.97; Spearman ρ = −0.91) and positively correlated with atmospheric DRE (r = 0.93; ρ = 0.88). Similarly, for Middle Eastern dust, strong relationships are found at the surface (r = −0.93; ρ = −0.89) and within the atmosphere (r = 0.81; ρ = 0.78). Increasing AOD440 is therefore associated with progressively stronger surface cooling and atmospheric heating. For Saharan dust, surface cooling reaches approximately −204 W m−2, atmospheric warming reaches approximately 182 W m−2, and TOA cooling reaches approximately −47 W m−2. For Middle Eastern dust, the corresponding effects reach approximately −150 W m−2 at the surface, +100 W m−2 within the atmosphere, and −40 W m−2 at the TOA.
The relationship between AOD and TOA DRE is weaker and shows greater scatter, particularly for Saharan dust (r = −0.41; ρ = −0.19), while a moderate negative relationship is observed for Middle Eastern dust (r = −0.65; ρ = −0.48). This indicates that TOA DRE is controlled not only by aerosol loading but also strongly by the balance between scattering and absorption. The colour-coded SSA values further demonstrate this influence. Lower SSA values, corresponding to more absorbing dust, are generally associated with enhanced surface attenuation and atmospheric heating. In contrast, higher SSA values favour greater scattering of solar radiation back to space and therefore a stronger negative TOA DRE. This relationship is examined further in Sect. 3.6 (Fig. 11).
We should note that a constant surface albedo was assumed in the radiative transfer simulations, as presented in Table 1. However, since the computations refer to a fixed ground-based station rather than a spatially heterogeneous region, large deviations in surface reflectivity are not expected. Therefore, the use of a representative constant albedo introduces only limited uncertainty in the estimation of DRE at TOA under clear-sky conditions.
3.6 Direct Radiative Forcing Efficiency
Figure 10 presents the monthly DRFE, defined as DREs normalized by AOD (W m−2 τ−1), thereby removing the first-order dependence on aerosol loading and isolating the intrinsic radiative response of the aerosol layer. At the surface (Fig. 10a), both Saharan and Middle Eastern dust generally exhibit negative DRFE values throughout the year, ranging approximately between −170 and −240 W m−2 τ−1 for Sahara dust and between −160 and −300 W m−2 τ−1 for Middle Eastern dust. The strongest cooling efficiencies occur mainly during MAM and SON, while JJA values are slightly weaker and DJF months are based on fewer cases. Differences between the two dust sources are generally small and mostly within the associated standard deviations, consistent with the relatively similar SSA values reported in Sect. 3.3. This indicates that surface forcing efficiency is primarily controlled by aerosol absorptivity (i.e., SSA), with only minor source-dependent contrasts. The DRFE within the atmosphere (Fig. 10b) remains generally positive throughout the year as DRE is also positive, generally between ∼ 70 and 250 W m−2 τ−1. Differences between Saharan and Middle Eastern dust are again modest and mostly within uncertainties. At the TOA (Fig. 10c), DRFE values are also negative for both sources, typically ranging between −20 and −120 W m−2 τ−1. A few isolated positive values (e.g., September for Middle Eastern dust) are associated with very limited sampling and large uncertainties and therefore should not be interpreted as systematic behaviour. Although some months (e.g., March) show larger apparent contrasts, these differences remain largely within statistical variability and should not be over-interpreted. The overall seasonal pattern is moderate, reflecting the combined influence of SSA and asymmetry parameter rather than AOD magnitude, which has been normalized out. Overall, once normalized by AOD, the radiative efficiencies of the two dust sources appear broadly comparable, suggesting that the larger differences observed in absolute DRE are primarily driven by variations in aerosol loading rather than intrinsic optical efficiency.
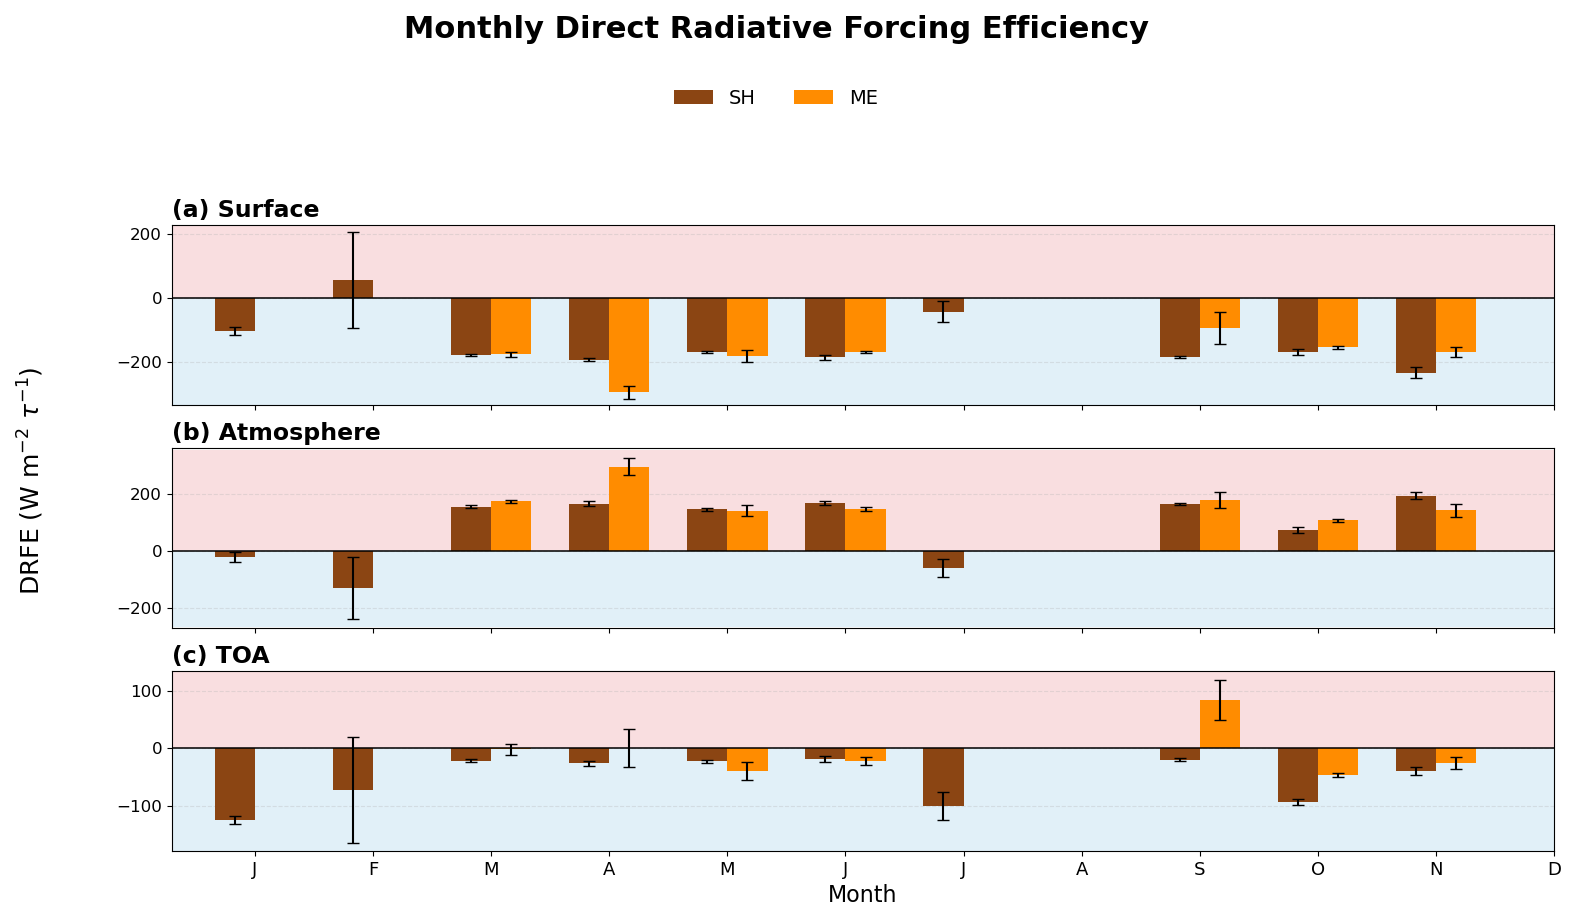
Figure 10Monthly mean dust DRFE (in W m−2 τ−1) over AMX (2015–2022) under clear-sky conditions for (a) surface, (b) within the atmosphere, and (c) TOA. Saharan dust events are shown in brown and Middle Eastern dust events in orange. Bars represent monthly mean values (W m−2), and error bars denote ±1 standard deviation, indicating the intra-month variability of dust radiative effects. Background colors denote cooling (blue) and warming (red) effects.
To further examine the role of aerosol optical properties, the DRFE was analysed as a function of the SSA at 440 nm using only observations within the common solar zenith angle interval of 56–64° (Fig. S3), thereby minimizing the influence of changing solar geometry. The SSA values were grouped into four equal-width intervals (0.05) spanning the observed range (0.80–1.00), providing a balance between resolving variations in aerosol absorption and maintaining a sufficient number of cases within each class for robust statistics. At the surface (Fig. S3a), both dust source regions exhibit negative DRFE values for all SSA bins, confirming that increasing aerosol loading consistently enhances surface cooling. For Middle Eastern dust, the magnitude of the surface cooling efficiency decreases with increasing SSA, indicating weaker surface attenuation for more scattering aerosols. Saharan dust exhibits a less systematic dependence, although the strongest cooling efficiencies are also found under relatively low-SSA conditions. Overall, the differences between the two source regions remain within the associated uncertainties. Within the atmosphere (Fig. S3b), remains positive for all SSA classes, reflecting enhanced atmospheric absorption with increasing aerosol loading. For both dust sources, the atmospheric heating efficiency generally decreases as SSA increases, consistent with the reduced absorption expected for more scattering aerosols. The decline is particularly evident for Middle Eastern dust, although the uncertainties remain relatively large in the lowest SSA interval because of the limited number of observations. At TOA (Fig. S3c), the magnitude of the cooling efficiency generally increases with SSA, consistent with more scattering aerosols enhancing planetary albedo. Overall, these patterns reflect the expected radiative response of absorbing aerosols, which preferentially reduce surface irradiance and enhance energy deposition within the atmosphere, while more scattering aerosols strengthen TOA cooling. Middle Eastern dust exhibits slightly larger variability across SSA bins (notably at the surface and TOA), although the two source regions show broadly consistent behaviour within the uncertainty ranges.
3.7 Analysis of dust events
Four dust events were analysed in depth and were intentionally chosen to represent the two distinct dust source regions, Saharan and Middle East, and to capture the influence of source-dependent optical properties on the resulting radiative effects. The selection was restricted to days exhibiting (i) among the highest daily mean AOD values in the 7-year record, and (ii) at least seven cloud-screened Level 2.0 AERONET direct sun measurements for 1 d, ensuring high-quality retrievals of spectral AOD, SSA, and AE throughout the day. This yielded two Saharan cases (22 March and 5 June 2018) and two Middle Eastern cases (18 October 2018 and 9 June 2019) two of these 4 d are shown in Fig. 3. The corresponding daily mean DREs are illustrated in Fig. 11, while the DRE and DRFE values are summarized in Table 5. The temporal evolution of the aerosol optical properties during the four events is presented in the Supplement (Fig. S4).
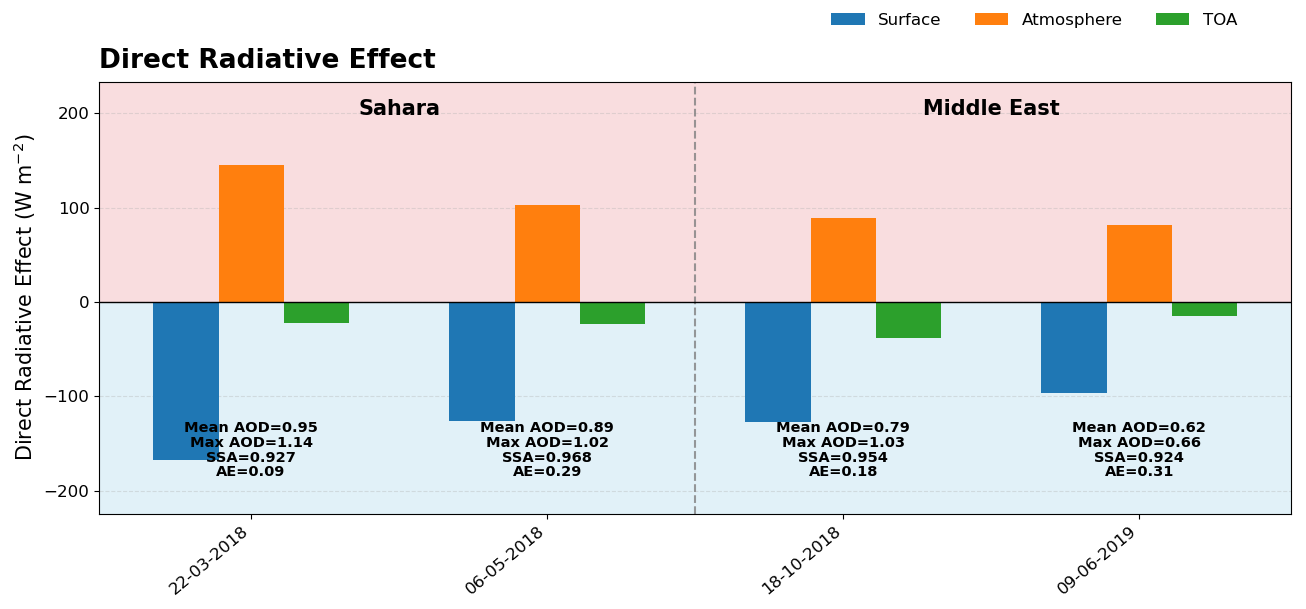
Figure 11Daily mean DREs at the surface, within the atmosphere, and at the TOA for four selected dust events (22 March 2018, 6 May 2018, 18 October 2018, and 9 June 2019). Negative values indicate cooling (surface and TOA), while positive values represent atmospheric heating. Shaded regions highlight cooling (blue) and heating (red) regimes. Annotations provide mean and maximum AOD at 440 nm, along with SSA and Ångström exponent (AE) values for each case.
Table 5Mean aerosol optical properties and corresponding radiative effects for the four selected dust events analysed in this study. Daily mean AOD440, Ångström exponent between 440 and 870 nm, SSA440, and the corresponding daily mean DREs and DRFE at the surface, within the atmosphere, and at the TOA. Values are given as mean ± standard deviation calculated from all available cloud-screened observations during each event.

The two selected Saharan dust cases exhibit the highest dust loadings, with mean AOD440 values of 0.95 ± 0.11 and 0.89 ± 0.15, compared to 0.79 ± 0.08 and 0.62 ± 0.04 for the selected ME dust cases. The SSA ranges for the two source regions are comparable, with Saharan events spanning 0.93–0.97 and ME events 0.92–0.95, indicating substantial overlap. However, the selected Saharan cases are characterised by lower Ångström exponent values (Fig. S5), reflecting the dominance of coarse-mode mineral particles.
At the surface, the selected Saharan dust events produce the strongest cooling, with DRE at surface values ranging from −167 to −126 W m−2, compared to −127 to −96 W m−2 for the selected ME cases. This enhanced surface dimming is primarily driven by the higher aerosol loading, which efficiently attenuate incoming solar radiation. Within the atmosphere, the radiative effect, reveals enhanced atmospheric heating for Saharan dust (+103 to +146 W m−2), compared to +82 to +89 W m−2 for the ME case. At the TOA, the response differs between the two source regions. The Saharan events exhibit relatively weak TOA cooling (around −22 W m−2), suggesting a partial compensation between scattering and absorption processes. In contrast, the Middle Eastern cases show stronger TOA cooling (−15 to −38 W m−2).
The forcing efficiencies (Fig. S4) further reinforce these patterns. Saharan dust exhibits the strongest surface cooling efficiency (−178 to −141 W m−2 τ−1) and the highest atmospheric heating efficiency (154 W m−2 τ−1), whereas Middle Eastern dust shows weaker but more variable efficiencies.
The temporal evolution of AOD and its relationship with particle size are further illustrated in Fig. S5. The AOD440 time series (Fig. S5a) shows distinct temporal patterns among the four selected events. The Saharan cases exhibit higher and more variable AOD values, reaching peaks above 1.1, whereas the Middle Eastern cases are characterised by lower AOD levels and smoother temporal evolution, particularly on 9 June 2019. The AOD–AE relationship (Fig. S5b) provides further insight into the microphysical properties of dust. The Saharan events cluster at lower AE values (0.07–0.29), indicating the dominance of coarse-mode particles, while the Middle Eastern events extend toward higher AE values (0.15–0.35), reflecting a relatively larger contribution of finer particles. Despite some overlap in AOD ranges, the separation in AE highlights clear differences in particle size distributions between the two source regions.
3.8 Attenuation of Global Horizontal Irradiance for Solar Energy Production
To assess the implications of mineral dust for solar energy applications, this section examines the attenuation of incoming solar radiation at the surface, expressed as the reduction in global horizontal irradiance (GHI) during dust events. In contrast to the DRE discussed in Sect. 3.5, which represents the net radiative balance at the surface and top of the atmosphere, the analysis presented here focuses exclusively on the attenuation of the downward shortwave flux, which is the quantity directly relevant for photovoltaic energy production.
The attenuation is derived from the difference between modelled clear-sky irradiance and ground-based GHI measurements and therefore requires the availability of both datasets. In periods where no valid GHI measurements are available, attenuation cannot be calculated and such cases are excluded from the analysis. Consequently, the absence of certain months in the climatology does not necessarily indicate a lack of dust events, but rather reflects data availability limitations, particularly the lack of coincident high-quality irradiance measurements under dust conditions.
To enable meaningful comparison across seasons and minimise the influence of SZA, attenuation is expressed both in absolute units (W m−2) and as a percentage relative to clear-sky conditions. The percentage representation effectively normalises the attenuation by the incoming solar radiation, allowing a more consistent assessment of dust impacts independent of monthly variations in solar elevation. The analysis is further constrained to dust condition, consistent with the filtering criteria applied throughout this study (Sect. 3.2–3.4). These thresholds ensure that the results represent well-defined dust events but also contribute to reduced temporal coverage in some months.
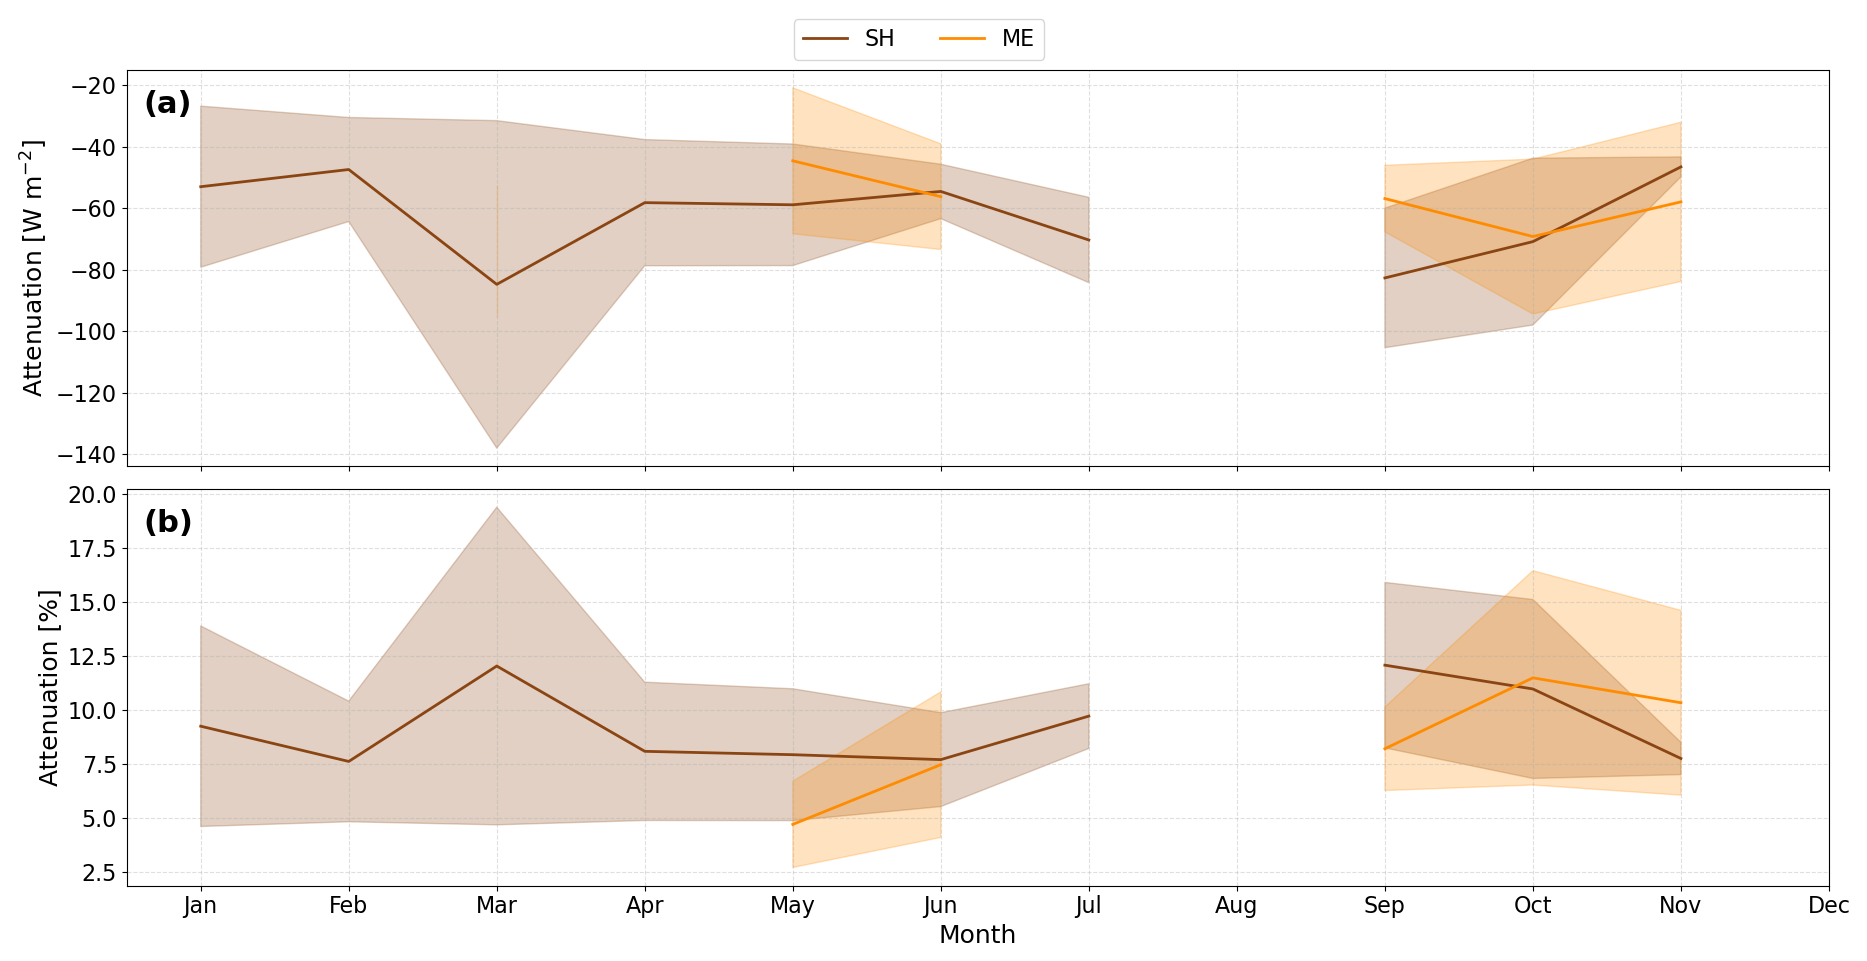
Figure 12Seasonal variation in aerosol-induced attenuation of global horizontal irradiance (GHI) for Saharan (brown) and Middle Eastern (orange) dust events over Cyprus. (a) Monthly mean attenuation in absolute terms (W m−2). (b) Monthly mean attenuation (%). Shaded areas represent ±1 standard deviation, indicating interannual variability.
The seasonal variation in aerosol-induced attenuation of GHI is presented in Fig. 12 for SH and ME dust events. In absolute terms (Fig. 12a), both dust sources lead to a reduction in surface solar radiation throughout the year, with monthly mean attenuation values typically ranging between −40 and −80 W m−2.
SH exhibits the strongest attenuation during MAM, with a pronounced maximum in March, where mean attenuation reaches approximately −85 W m−2 and is accompanied by substantial interannual variability. This behaviour is consistent with the seasonal peak in dust loading and the dominance of coarse-mode particles during this period, as shown in Fig. 5, which enhance the extinction of solar radiation through both scattering and absorption.
ME dust displays a more episodic pattern, with fewer months contributing to the climatology but comparable attenuation magnitudes when events occur. The strongest attenuation is observed in autumn, particularly in September and October, with values around −60 to −70 W m−2. These periods coincide with increased transport of finer particles from the Middle East (Fig. 5), which, despite generally lower AOD compared to Saharan dust, can produce comparable attenuation due to their enhanced scattering efficiency.
In relative terms (Fig. 12b), monthly mean GHI attenuation generally ranges between approximately 5 % and 15 % for both dust sources. Saharan dust dominates during spring, with the largest fractional reductions observed in March (≈ 12 %), consistent with both elevated aerosol loading and favourable solar conditions. During SON, Middle Eastern dust exhibits comparable or slightly higher fractional attenuation than Saharan dust, with values around 10 %–12 % in September and October. This reflects the combined influence of aerosol loading and particle size, with finer particles contributing efficiently to the scattering of incoming radiation.
January and February show weaker relative attenuation, reflecting both reduced dust activity and the lower incoming solar radiation associated with winter conditions. In contrast, the relatively weak attenuation observed during June and July is primarily related to the low frequency of dust events and the generally lower aerosol loading during summer. The shaded areas in Fig. 12 represent ±1 standard deviation and indicate substantial interannual variability, particularly for Saharan dust in spring and Middle Eastern dust during SON. This variability highlights the episodic nature of intense dust outbreaks and differences in aerosol loading, transport pathways, and optical properties between years.
Overall, although both dust sources can produce comparable attenuation magnitudes during their respective peak seasons, Saharan dust leads to more consistent and sustained attenuation during MAM, whereas ME dust is characterised by greater variability and more episodic impacts during SON. These differences are directly linked to the source-dependent aerosol properties discussed in Fig. 5, particularly variations in particle size distribution and aerosol loading.
From a solar energy perspective, these findings indicate that SH dust represents a systematic and predictable reduction in solar irradiance, while ME dust introduces short-term variability that may be more challenging to account for in solar power forecasting and management. This highlights the importance of source-resolved analyses for accurately quantifying the impact of mineral dust on surface solar radiation in the Eastern Mediterranean. The interannual variability of dust-day frequency, aerosol loading (AOD440), and the associated surface radiative attenuation for both dust source regions is presented in Fig. S6 of the Supplement.
The source-dependent differences in dust optical properties inferred in the present study are broadly consistent with recent evidence that mixing with pollution can modify dust intensive optical properties, including SSA and other parameters, and can sometimes mask intrinsic differences between Arabian and Saharan dust. Aircraft observations over the eastern Mediterranean show that variations in intensive aerosol properties are mainly driven by pollution content within dust layers, whereas differences between Arabian and Saharan dust remain relatively small across most intensive properties, with only minor differences reported for SSA (Teri et al., 2025). Our irradiance attenuation results are also consistent with previous studies over Cyprus. For example, analyses of extreme dust events over the eastern Mediterranean show that Cyprus is among the most affected regions, with mean reductions during identified extreme dust-event days in GHI of up to ∼ 6.5 % and DNI of up to ∼ 24 % during intense dust episodes (Papachristopoulou et al., 2022). Event-based analysis over Limassol further shows that daily mean shortwave attenuation during strong dust outbreaks can exceed −100 W m−2 at peak intensity (Charalampous et al., 2025). Although direct numerical comparisons require careful consideration of differences in temporal representativeness and methodology. In the present study, attenuation values correspond to monthly mean reductions in GHI under dust conditions, derived from cloud-free observations and model–measurement comparisons, and are associated with AOD440 values typically ranging from ∼ 0.3 to 1.0 for Saharan dust and ∼ 0.3 to 0.8 for Middle Eastern dust. Under these conditions, the monthly mean attenuation (Fig. 12) is found to range between approximately 5 % and 15 %. Fountoulakis et al. (2021) quantified the impacts of aerosols, dust, and clouds on surface solar radiation and solar energy across multiple stations in Cyprus, reporting annual mean aerosol-driven reductions of roughly 5 %–10 % for GHI and 15 %–35 % for DNI, with dust responsible for a substantial fraction of aerosol-related attenuation.
Similarly, Gkikas et al. (2018) analysed intense Mediterranean dust outbreaks using a regional modelling framework and reported instantaneous surface radiative effects exceeding −300 W m−2 during extreme high-AOD events. These values correspond to instantaneous or event-scale conditions, typically associated with very high aerosol loadings (AOD440 > 1.5–2.0), and are therefore not directly comparable to the monthly mean attenuation values presented here. Nevertheless, both studies reflect the same underlying physical processes, namely enhanced extinction of solar radiation at the surface and increased atmospheric absorption during dust events.
Several previous studies have also reported a wide range of aerosol forcing efficiencies, depending on region, aerosol properties, and methodology. For example, values in the Eastern and Central Mediterranean range between −55 and −69 W m−2 τ−1 (Derimian et al., 2006; Di Biagio et al., 2010; Di Sarra et al., 2011), derived from daily average or 24hour mean radiative effects during dust events, while studies in Spain and the Canary Islands report values around −59 to −70 W m−2 τ−1 (García et al., 2012; Valenzuela et al., 2012). These values are generally derived from event-based or short-term observations under moderate-to-high aerosol loading conditions (AOD440 ≈ 0.3–0.8). Lower forcing efficiencies have been reported closer to source regions, such as an instantaneous TOA forcing efficiency of −39 to −49 W m−2 τ−1 by Tian et al. (2021), likely reflecting differences in surface albedo, aerosol vertical distribution, and particle properties. Notably, extreme values up to −125 W m−2 τ−1 have been reported during intense dust events in the Arabian Peninsula (García et al., 2012), representing instantaneous forcing efficiencies, corresponding to high-AOD conditions and strong absorption.
Within this context, the attenuation and forcing efficiency values derived in this study are consistent with previously reported ranges, while also providing a source-resolved, observation-based perspective under well-defined dust conditions. Importantly, by focusing on monthly mean values under cloud-free conditions, the present analysis reduces the influence of SZA variability and ensures a more consistent comparison of dust radiative impacts across seasons.
This study presents a comprehensive seven-year (2015–2022) assessment of the SW direct radiative effects (DREs) of mineral dust at Agia Marina Xyliatou, Cyprus, combining AERONET aerosol observations, back-trajectory source attribution, and radiative transfer simulations under cloud-free conditions. The modeled GHI was evaluated against ground-based irradiance measurements, showing strong agreement when restricting the analysis to solar zenith angles ≤ 65°, with ∼ 87 % of simulated GHI values within ±5 % and ∼ 96 % within ±10 % of observations, providing confidence in the derived radiative effect estimates.
Dust occurrence exhibits a clear seasonal cycle, with a maximum frequency during spring (∼ 28 % of aerosol cases during MAM) and a secondary peak during SON. Approximately 86 % of dust events originate from the Sahara, while ∼ 14 % are attributed to the Middle East. Long-term mean AOD440 values are 0.34 ± 0.13 for Saharan dust and 0.40 ± 0.13 for Middle Eastern dust. SSA440 remains high for both sources (0.93 ± 0.04 and 0.93 ± 0.03, respectively), indicating predominantly scattering aerosols, while the slightly higher Ångström exponent for Middle Eastern dust suggests a relatively enhanced fine-mode contribution, likely associated with aerosol mixing during transport. The use of radiative transfer simulations, rather than direct radiometric measurements alone, was primarily motivated by the need to ensure consistency with collocated AERONET aerosol optical properties (AOD and SSA), allowing for a more controlled isolation of aerosol radiative effects.
The identification of pure dust conditions remains uncertain, particularly in the eastern Mediterranean, where aerosol mixing with pollution during transport is likely. Therefore, while strict selection criteria based on low Ångström exponent and fine mode fraction were applied to isolate dominant dust cases, the presence of minor non-dust contributions cannot be fully excluded. Across the atmospheric column, DREs display the expected dust radiative signature. At the surface, dust induces persistent cooling, with monthly mean values reaching −84 ± 49 W m−2 during intense spring (MAM) Saharan events and −79 ± 33 W m−2 during autumn (SON) Middle Eastern outbreaks. At the top of the atmosphere, radiative effects are predominantly negative (up to −27 W m−2), indicating enhanced backscattering to space. Within the atmosphere, DREs are positive, with heating exceeding 70 W m−2 during high-AOD episodes, reflecting absorption of solar radiation and vertical redistribution of energy.
The DRFE analysis further demonstrates that radiative efficiency strongly depends on aerosol absorption properties: lower SSA values enhance both surface cooling efficiency and atmospheric heating efficiency. While source-dependent differences in optical characteristics are identified, the magnitude of radiative perturbations is primarily governed by aerosol loading and event intensity. In months with limited sample size, monthly mean DRE values largely reflect the strength of individual dust outbreaks rather than systematic source-related contrasts. Therefore, the source attribution analysis provides physical context and insight into variability, rather than implying a strict climatological separation between Saharan and Middle Eastern radiative impacts.
Dust-induced attenuation of global horizontal irradiance (GHI) under clear-sky conditions typically ranges between ∼ 5 %–15 % on a monthly mean basis, with stronger and more variable reductions during intense spring episodes. These findings highlight the dominant role of transported mineral dust in modulating the regional radiation budget and underscore the importance of accurately representing dust optical properties, absorption characteristics, vertical distribution, and variability in both regional climate assessments and solar energy forecasting for the eastern Mediterranean.
| AD | AERONET-Dubovik classification |
| AE | Ångström exponent |
| AERONET | Aerosol Robotic Network |
| AMX | Agia Marina Xyliatou |
| AOD | Aerosol optical depth |
| ASY | Asymmetry parameter |
| CARO | Cyprus Atmospheric Remote Sensing Observatory |
| CUT | Cyprus University of Technology |
| DHI | Diffuse horizontal irradiance |
| DISORT | Discrete Ordinate Radiative Transfer |
| DJF | December–January–February |
| DNI | Direct normal irradiance |
| DRE | Direct radiative effect |
| DRFE | Direct radiative forcing efficiency |
| DU | Dobson unit |
| EOSDIS | Earth Observing System Data and Information System |
| FMF | Fine-mode fraction |
| FWHM | Full width at half maximum |
| GDAS | Global Data Assimilation System |
| GFS | Global Forecast System |
| GHI | Global horizontal irradiance |
| GIBS | Global Imagery Browse Services |
| HYSPLIT | Hybrid Single-Particle Lagrangian Integrated Trajectory |
| JJA | June–July–August |
| K&Z | Kipp & Zonen |
| LACROS | Leipzig Aerosol and Cloud Remote Observations System |
| LD | Lidar Depolarization classification |
| LOA | Laboratory of Atmospheric Optics |
| MAM | March–April–May |
| ME | Middle Eastern dust |
| MODIS | Moderate Resolution Imaging Spectroradiometer |
| NF | National Facility |
| NOAA | National Oceanic and Atmospheric Administration |
| OMI | Ozone Monitoring Instrument |
| PM | Particulate matter |
| PM2.5 | Particulate matter with aerodynamic diameter ≤ 2.5 µm |
| PM10 | Particulate matter with aerodynamic diameter ≤ 10 µm |
| RT | Radiative transfer |
| SH/SA | Saharan dust |
| SON | September–October–November |
| SSA | Single-scattering albedo |
| SW | Shortwave |
| SZA | Solar zenith angle |
| TCO | Total column ozone |
| TCWV | Total column water vapour |
| TOA | Top of the atmosphere |
| TROPOS | Leibniz Institute for Tropospheric Research |
AERONET data are publicly available online (https://aeronet.gsfc.nasa.gov/, last access: 1 September 2026). Ground-based pyranometric and pyrheliometric measurements are available upon request from Franco Marenco (f.marenco@cyi.ac.cy) or Yevgeny Derimian (yevgeny.derimian@univ-lille.fr). Ground-based meteorological measurements are available upon request from the Department of Meteorology of Cyprus (metservice@dom.moa.gov.cy).
The supplement related to this article is available online at https://doi.org/10.5194/amt-19-5753-2026-supplement.
Conceptualization: G.C., S.K., K.F., F.M., I.F.; Methodology: G.C., K.F.; Formal analysis: G.C., K.F., I.F., K.P., A.M., A.N., S.K.; Software: G.C., K.F., I.F., K.P., A.M. and S.K.; Validation: S.K., K.F., K.P., I.F., A.M., F.M., A.N., Y.D., R.-E.M.; Investigation: G.C., K.F.; Resources: K.P., S.K.; Data curation: G.C., K.F., F.M., Y.D., A.N., R.-E.M., D.H.; Visualization: G.C., K.F., A.M., S.K.; Writing (original draft preparation): G.C.; Supervision: S.K., K.F., I.F., H.D.; Writing (review and editing): all authors. All authors gave final approval for publication.
At least one of the (co-)authors is a guest member of the editorial board of Atmospheric Measurement Techniques for the special issue “Sun-photometric measurements of aerosols: harmonization, comparisons, synergies, effects, and applications”. The peer-review process was guided by an independent editor, and the authors also have no other competing interests to declare.
Publisher's note: Copernicus Publications remains neutral with regard to jurisdictional claims made in the text, published maps, institutional affiliations, or any other geographical representation in this paper. The authors bear the ultimate responsibility for providing appropriate place names. Views expressed in the text are those of the authors and do not necessarily reflect the views of the publisher.
This article is part of the special issue “Sun-photometric measurements of aerosols: harmonization, comparisons, synergies, effects, and applications”. It is not associated with a conference.
The authors acknowledge the EXCELSIOR: ERATOSTHENES: Excellence Research Centre for Earth Surveillance and Space-Based Monitoring of the Environment H2020 Widespread Teaming project (https://www.excelsior2020.eu, last access: 13 March 2023). The EXCELSIOR project has received funding from the European Union's Horizon 2020 Research and Innovation Programme under Grant Agreement no. 857510, from the Government of the Republic of Cyprus through the Directorate General for the European Programmes, Coordination and Development and the Cyprus University of Technology. All authors would like to acknowledge the Action Harmonia CA21119 supported by COST (European Cooperation in Science and Technology). G.C., K.P., A.M., A.N. and R.-E.M. acknowledge: ATARRI: This project has received funding from the European Union's Horizon Europe Twinning Call (HORIZON-WIDERA-2023-ACCESS-02) under the grant agreement no. 101160258. S.K. would like to acknowledge the ACTRIS CH 2025–2028 grant (Swiss contribution to the ACTRIS ERIC) funded by the Swiss State Secretariat for Education and Research and Innovation (SERI) K.F., F.M. and S.K. would like to acknowledge: Dust-DN: Doctoral Network on Atmospheric Dust. Dust-DN has received funding from the European Union's Horizon Europe Research and Innovation Programme under the Marie Skłodowska-Curie grant agreement no. 101168425. A.M. would like to acknowledge the project 24GRD04 SOLiD-PV funded by the European Partnership on Metrology, co-financed by the European Union's Horizon Europe Research and Innovation Programme and by the Participating States. The authors also gratefully acknowledge the Department of Meteorology of Cyprus for providing the meteorological data used in this study.
This research has been supported by the European Cooperation in Science and Technology (COST Action HARMONIA, grant no. CA21119), the European Union's Horizon 2020 Research and Innovation Programme through the EXCELSIOR project (grant no. 857510), and the European Union's Horizon Europe Research and Innovation Programme through the ATARRI project (grant no. 101160258).
This paper was edited by Lionel Doppler and reviewed by two anonymous referees.
Achilleos, S., Mouzourides, P., Kalivitis, N., Katra, I., Kloog, I., Kouis, P., Middleton, N., Mihalopoulos, N., Neophytou, M., Panayiotou, A., Papatheodorou, S., Savvides, C., Tymvios, F., Vasiliadou, E., Yiallouros, P., and Koutrakis, P.: Spatio-temporal variability of desert dust storms in Eastern Mediterranean (Crete, Cyprus, Israel) between 2006 and 2017 using a uniform methodology, Sci. Total Environ., 714, 136693, https://doi.org/10.1016/j.scitotenv.2020.136693, 2020.
Adebiyi, A. A. and Kok, J. F.: Climate models miss most of the coarse dust in the atmosphere, Sci. Adv., 6, https://doi.org/10.1126/sciadv.aaz9507, 2020.
Almazroui, M. and Awad, A. M.: Synoptic regimes associated with the eastern Mediterranean wet season cyclone tracks, Atmos. Res., 180, 92–118, https://doi.org/10.1016/j.atmosres.2016.05.015, 2016.
Anderson, G., Clough, S., Kneizys, F., Chetwynd, J., and Shettle, E.: AFGL atmospheric constituent profiles (0–120km), Tech. Rep. AFGL-TR-86-0110, Air Force Geophys. Lab., Hanscom Air Force Base, Bedford, Mass., https://www.researchgate.net/publication/235054307_AFGL_Atmospheric_Constituent_Profiles_0120km (last access: 1 September 2026), 1986.
Ångström, A.: On the atmospheric transmission of sun radiation and on dust in the air, Geogr. Ann., 11, 156–166, https://doi.org/10.2307/519399, 1929.
Ansmann, A. and Müller, D.: Lidar and Atmospheric Aerosol Particles, in: Lidar, Springer-Verlag, 105–141, https://doi.org/10.1007/0-387-25101-4_4, 2005.
Ansmann, A., Seifert, P., Tesche, M., and Wandinger, U.: Profiling of fine and coarse particle mass: case studies of Saharan dust and Eyjafjallajökull/Grimsvötn volcanic plumes, Atmos. Chem. Phys., 12, 9399–9415, https://doi.org/10.5194/acp-12-9399-2012, 2012.
Ansmann, A., Mamouri, R.-E., Bühl, J., Seifert, P., Engelmann, R., Hofer, J., Nisantzi, A., Atkinson, J. D., Kanji, Z. A., Sierau, B., Vrekoussis, M., and Sciare, J.: Ice-nucleating particle versus ice crystal number concentrationin altocumulus and cirrus layers embedded in Saharan dust:a closure study, Atmos. Chem. Phys., 19, 15087–15115, https://doi.org/10.5194/acp-19-15087-2019, 2019.
Baalbaki, R., Pikridas, M., Jokinen, T., Laurila, T., Dada, L., Bezantakos, S., Ahonen, L., Neitola, K., Maisser, A., Bimenyimana, E., Christodoulou, A., Unga, F., Savvides, C., Lehtipalo, K., Kangasluoma, J., Biskos, G., Petäjä, T., Kerminen, V.-M., Sciare, J., and Kulmala, M.: Towards understanding the characteristics of new particle formation in the Eastern Mediterranean, Atmos. Chem. Phys., 21, 9223–9251, https://doi.org/10.5194/acp-21-9223-2021, 2021.
Baars, H., Kanitz, T., Engelmann, R., Althausen, D., Heese, B., Komppula, M., Preißler, J., Tesche, M., Ansmann, A., Wandinger, U., Lim, J.-H., Ahn, J. Y., Stachlewska, I. S., Amiridis, V., Marinou, E., Seifert, P., Hofer, J., Skupin, A., Schneider, F., Bohlmann, S., Foth, A., Bley, S., Pfüller, A., Giannakaki, E., Lihavainen, H., Viisanen, Y., Hooda, R. K., Pereira, S. N., Bortoli, D., Wagner, F., Mattis, I., Janicka, L., Markowicz, K. M., Achtert, P., Artaxo, P., Pauliquevis, T., Souza, R. A. F., Sharma, V. P., van Zyl, P. G., Beukes, J. P., Sun, J., Rohwer, E. G., Deng, R., Mamouri, R.-E., and Zamorano, F.: An overview of the first decade of PollyNET: an emerging network of automated Raman-polarization lidars for continuous aerosol profiling, Atmos. Chem. Phys., 16, 5111–5137, https://doi.org/10.5194/acp-16-5111-2016, 2016.
Barkan, J., Alpert, P., Kutiel, H., and Kishcha, P.: Synoptics of dust transportation days from Africa toward Italy and central Europe, J. Geophys. Res.-Atmos., 110, https://doi.org/10.1029/2004JD005222, 2005.
Barnes, W. L., Xiong, X., and Salomonson, V. V.: Status of terra MODIS and aqua modis, Adv. Space Res., 32, 2099–2106, https://doi.org/10.1016/S0273-1177(03)90529-1, 2003.
Bellouin, N., Davies, W., Shine, K. P., Quaas, J., Mülmenstädt, J., Forster, P. M., Smith, C., Lee, L., Regayre, L., Brasseur, G., Sudarchikova, N., Bouarar, I., Boucher, O., and Myhre, G.: Radiative forcing of climate change from the Copernicus reanalysis of atmospheric composition, Earth Syst. Sci. Data, 12, 1649–1677, https://doi.org/10.5194/essd-12-1649-2020, 2020.
Boucher, O.: Atmospheric Aerosols, in: Atmospheric Aerosols, Springer Netherlands, 9–24, https://doi.org/10.1007/978-94-017-9649-1_2, 2015.
Boucher, O. D., Randall, P., Artaxo, C., Bretherton, G., Feingold, P., Forster, V.-M., Kerminen, Y., Kondo, H., Liao, U., Lohmann, P., Rasch, S. K., Satheesh, S., Sherwood, B., Stevens B., and Zhang, X. Y.: Clouds and Aerosols, in: Climate Change 2013 – The Physical Science Basis, Cambridge University Press, 571–658, https://doi.org/10.1017/CBO9781107415324.016, 2014.
Bühl, J., Seifert, P., Wandinger, U., Baars, H., Kanitz, T., Schmidt, J., Myagkov, A., Engelmann, R., Skupin, A., Heese, B., Klepel, A., Althausen, D., and Ansmann, A.: LACROS: the Leipzig Aerosol and Cloud Remote Observations System, edited by: Comeron, A., Kassianov, E. I., Schäfer, K., Stein, K., and Gonglewski, J. D., P. SPIE, 8890, 889002, https://doi.org/10.1117/12.2030911, 2013.
Bühl, J., Seifert, P., Myagkov, A., and Ansmann, A.: Measuring ice- and liquid-water properties in mixed-phase cloud layers at the Leipzig Cloudnet station, Atmos. Chem. Phys., 16, 10609–10620, https://doi.org/10.5194/acp-16-10609-2016, 2016.
Charalampous, G., Fragkos, K., Fountoulakis, I., Papachristopoulou, K., Nisantzi, A., Mamouri, R.-E., Hadjimitsis, D., and Kazadzis, S.: Direct Radiative Effects of Dust Events over Limassol, Cyprus in 2024 Using Ground-Based Measurements and Modelling, COMECAP 2025, 77, https://doi.org/10.3390/eesp2025035077, 2025.
Cuevas-Agulló, E., Barriopedro, D., García, R. D., Alonso-Pérez, S., González-Alemán, J. J., Werner, E., Suárez, D., Bustos, J. J., García-Castrillo, G., García, O., Barreto, Á., and Basart, S.: Sharp increase in Saharan dust intrusions over the western Euro-Mediterranean in February–March 2020–2022 and associated atmospheric circulation, Atmos. Chem. Phys., 24, 4083–4104, https://doi.org/10.5194/acp-24-4083-2024, 2024.
Dayan, U., Heffter, J., Miller, J., and Gutman, G.: Dust Intrusion Events into the Mediterranean Basin, J. Appl. Meteorol., 30, 1185–1199, https://doi.org/10.1175/1520-0450(1991)030<1185:DIEITM>2.0.CO;2, 1991.
Derimian, Y., Karnieli, A., Kaufman, Y. J., Andreae, M. O., Andreae, T. W., Dubovik, O., Maenhaut, W., Koren, I., and Holben, B. N.: Dust and pollution aerosols over the Negev desert, Israel: Properties, transport, and radiative effect, J. Geophys. Res.-Atmos., 111, https://doi.org/10.1029/2005JD006549, 2006.
Di Biagio, C., di Sarra, A., Meloni, D., Monteleone, F., Piacentino, S., and Sferlazzo, D.: Measurements of Mediterranean aerosol radiative forcing and influence of the single scattering albedo, J. Geophys. Res.-Atmos., 114, https://doi.org/10.1029/2008JD011037, 2009.
Di Biagio, C., di Sarra, A., and Meloni, D.: Large atmospheric shortwave radiative forcing by Mediterranean aerosols derived from simultaneous ground-based and spaceborne observations and dependence on the aerosol type and single scattering albedo, J. Geophys. Res.-Atmos., 115, https://doi.org/10.1029/2009JD012697, 2010.
Di Sarra, A., di Biagio, C., Meloni, D., Monteleone, F., Pace, G., Pugnaghi, S., and Sferlazzo, D.: Shortwave and longwave radiative effects of the intense Saharan dust event of 25–26 March 2010 at Lampedusa (Mediterranean Sea), J. Geophys. Res.-Atmos., 116, https://doi.org/10.1029/2011JD016238, 2011.
Draxler, R. R.: An Overview of the HYSPLIT_4 Modelling System for Trajectories, Dispersion, and Deposition, Australian Meteorological Magazine 47, https://api.semanticscholar.org/CorpusID:42834712 (last access: 1 September 2026), 1998.
Dubovik, O. and King, M. D.: A flexible inversion algorithm for retrieval of aerosol optical properties from Sun and sky radiance measurements, J. Geophys. Res.-Atmos., 105, 20673–20696, https://doi.org/10.1029/2000JD900282, 2000.
Dubovik, O., Holben, B., Eck, T. F., Smirnov, A., Kaufman, Y. J., King, M. D., Tanré, D., and Slutsker, I.: Variability of Absorption and Optical Properties of Key Aerosol Types Observed in Worldwide Locations, J. Atmos. Sci., 59, 590–608, https://doi.org/10.1175/1520-0469(2002)059<0590:VOAAOP>2.0.CO;2, 2002.
Emde, C., Buras-Schnell, R., Kylling, A., Mayer, B., Gasteiger, J., Hamann, U., Kylling, J., Richter, B., Pause, C., Dowling, T., and Bugliaro, L.: The libRadtran software package for radiative transfer calculations (version 2.0.1), Geosci. Model Dev., 9, 1647–1672, https://doi.org/10.5194/gmd-9-1647-2016, 2016.
Ene, D., Poutli, M., Mettas, C., Michaelides, S., Mamouri, R.-E., Nisantzi, A., Papoutsa, C., Hadjimitsis, D., Bühl, J., Seifert, P., Baars, H., and Ansmann, A.: Aerosol and Cloud Remote Sensing Observation in Limassol, Cyprus, IGARSS 2024 – 2024 IEEE International Geoscience and Remote Sensing Symposium, 3111–3114, https://doi.org/10.1109/IGARSS53475.2024.10641486, 2024.
Engelmann, R., Kanitz, T., Baars, H., Heese, B., Althausen, D., Skupin, A., Wandinger, U., Komppula, M., Stachlewska, I. S., Amiridis, V., Marinou, E., Mattis, I., Linné, H., and Ansmann, A.: The automated multiwavelength Raman polarization and water-vapor lidar PollyXT: the neXT generation, Atmos. Meas. Tech., 9, 1767–1784, https://doi.org/10.5194/amt-9-1767-2016, 2016.
Flaounas, E., Kotroni, V., Lagouvardos, K., Kazadzis, S., Gkikas, A., and Hatzianastassiou, N.: Cyclone contribution to dust transport over the Mediterranean region, Atmos. Sci. Lett., 16, 473–478, https://doi.org/10.1002/asl.584, 2015.
Floutsi, A. A., Baars, H., Engelmann, R., Althausen, D., Ansmann, A., Bohlmann, S., Heese, B., Hofer, J., Kanitz, T., Haarig, M., Ohneiser, K., Radenz, M., Seifert, P., Skupin, A., Yin, Z., Abdullaev, S. F., Komppula, M., Filioglou, M., Giannakaki, E., Stachlewska, I. S., Janicka, L., Bortoli, D., Marinou, E., Amiridis, V., Gialitaki, A., Mamouri, R.-E., Barja, B., and Wandinger, U.: DeLiAn – a growing collection of depolarization ratio, lidar ratio and Ångström exponent for different aerosol types and mixtures from ground-based lidar observations, Atmos. Meas. Tech., 16, 2353–2379, https://doi.org/10.5194/amt-16-2353-2023, 2023.
Formenti, P., Schütz, L., Balkanski, Y., Desboeufs, K., Ebert, M., Kandler, K., Petzold, A., Scheuvens, D., Weinbruch, S., and Zhang, D.: Recent progress in understanding physical and chemical properties of African and Asian mineral dust, Atmos. Chem. Phys., 11, 8231–8256, https://doi.org/10.5194/acp-11-8231-2011, 2011.
Fountoulakis, I., Kosmopoulos, P., Papachristopoulou, K., Raptis, I.-P., Mamouri, R.-E., Nisantzi, A., Gkikas, A., Witthuhn, J., Bley, S., Moustaka, A., Buehl, J., Seifert, P., Hadjimitsis, D. G., Kontoes, C., and Kazadzis, S.: Effects of Aerosols and Clouds on the Levels of Surface Solar Radiation and Solar Energy in Cyprus, Remote Sens., 13, 2319, https://doi.org/10.3390/rs13122319, 2021.
Fountoulakis, I., Tsekeri, A., Kazadzis, S., Amiridis, V., Nersesian, A., Tsichla, M., Proestakis, E., Gkikas, A., Papachristopoulou, K., Barlakas, V., Emde, C., and Mayer, B.: A sensitivity study on radiative effects due to the parameterization of dust optical properties in models, Atmos. Chem. Phys., 24, 4915–4948, https://doi.org/10.5194/acp-24-4915-2024, 2024.
Fragkos, K., Antonescu, B., Giles, D. M., Ene, D., Boldeanu, M., Efstathiou, G. A., Belegante, L., and Nicolae, D.: Assessment of the total precipitable water from a sun photometer, microwave radiometer and radiosondes at a continental site in southeastern Europe, Atmos. Meas. Tech., 12, 1979–1997, https://doi.org/10.5194/amt-12-1979-2019, 2019.
Fragkos, K., Fountoulakis, I., Charalampous, G., Papachristopoulou, K., Nisantzi, A., Hadjimitsis, D., and Kazadzis, S.: Twenty-Year Climatology of Solar UV and PAR in Cyprus: Integrating Satellite Earth Observations with Radiative Transfer Modeling, Remote Sens., 16, 1878, https://doi.org/10.3390/rs16111878, 2024.
García, O. E., Díaz, A. M., Expósito, F. J., Díaz, J. P., Dubovik, O., Dubuisson, P., Roger, J.-C., Eck, T. F., Sinyuk, A., Derimian, Y., Dutton, E. G., Schafer, J. S., Holben, B. N., and García, C. A.: Validation of AERONET estimates of atmospheric solar fluxes and aerosol radiative forcing by ground-based broadband measurements, J. Geophys. Res.-Atmos., 113, https://doi.org/10.1029/2008JD010211, 2008.
García, O. E., Díaz, J. P., Expósito, F. J., Díaz, A. M., Dubovik, O., Derimian, Y., Dubuisson, P., and Roger, J.-C.: Shortwave radiative forcing and efficiency of key aerosol types using AERONET data, Atmos. Chem. Phys., 12, 5129–5145, https://doi.org/10.5194/acp-12-5129-2012, 2012.
Gasteiger, J., Emde, C., Mayer, B., Buras, R., Buehler, S. A., and Lemke, O.: Representative wavelengths absorption parameterization applied to satellite channels and spectral bands, J. Quant. Spectrosc. Ra., 148, 99–115, https://doi.org/10.1016/j.jqsrt.2014.06.024, 2014.
Giannakaki, E., van Zyl, P. G., Müller, D., Balis, D., and Komppula, M.: Optical and microphysical characterization of aerosol layers over South Africa by means of multi-wavelength depolarization and Raman lidar measurements, Atmos. Chem. Phys., 16, 8109–8123, https://doi.org/10.5194/acp-16-8109-2016, 2016.
Gil-Díaz, C., Sicard, M., Sourdeval, O., Saiprakash, A., Muñoz-Porcar, C., Comerón, A., Rodríguez-Gómez, A., and Oliveira, D. C. F. D. S.: Study of optical scattering properties and direct radiative effects of high-altitude cirrus clouds in Barcelona, Spain, with 4 years of lidar measurements, Atmos. Chem. Phys., 25, 3445–3464, https://doi.org/10.5194/acp-25-3445-2025, 2025.
Gkikas, A., Hatzianastassiou, N., Mihalopoulos, N., Katsoulis, V., Kazadzis, S., Pey, J., Querol, X., and Torres, O.: The regime of intense desert dust episodes in the Mediterranean based on contemporary satellite observations and ground measurements, Atmos. Chem. Phys., 13, 12135–12154, https://doi.org/10.5194/acp-13-12135-2013, 2013.
Gkikas, A., Basart, S., Hatzianastassiou, N., Marinou, E., Amiridis, V., Kazadzis, S., Pey, J., Querol, X., Jorba, O., Gassó, S., and Baldasano, J. M.: Mediterranean intense desert dust outbreaks and their vertical structure based on remote sensing data, Atmos. Chem. Phys., 16, 8609–8642, https://doi.org/10.5194/acp-16-8609-2016, 2016.
Gkikas, A., Obiso, V., Pérez García-Pando, C., Jorba, O., Hatzianastassiou, N., Vendrell, L., Basart, S., Solomos, S., Gassó, S., and Baldasano, J. M.: Direct radiative effects during intense Mediterranean desert dust outbreaks, Atmos. Chem. Phys., 18, 8757–8787, https://doi.org/10.5194/acp-18-8757-2018, 2018.
Gobbi, G. P., Kaufman, Y. J., Koren, I., and Eck, T. F.: Classification of aerosol properties derived from AERONET direct sun data, Atmos. Chem. Phys., 7, 453–458, https://doi.org/10.5194/acp-7-453-2007, 2007.
Goudie, A. S. and Middleton, N. J.: Saharan dust storms: nature and consequences, Earth-Sci. Rev., 56, 179–204, https://doi.org/10.1016/S0012-8252(01)00067-8, 2001.
Gryspeerdt, E., Glassmeier, F., Feingold, G., Hoffmann, F., and Murray-Watson, R. J.: Observing short-timescale cloud development to constrain aerosol–cloud interactions, Atmos. Chem. Phys., 22, 11727–11738, https://doi.org/10.5194/acp-22-11727-2022, 2022.
Hansen, J., Sato, M., and Ruedy, R.: Radiative forcing and climate response, J. Geophys. Res.-Atmos., 102, 6831–6864, https://doi.org/10.1029/96JD03436, 1997.
Hansen, J. E., Sato, M., Lacis, A., Ruedy, R., Tegen, I., and Matthews, E.: Climate forcings in the Industrial era, P. Natl. Acad. Sci. USA, 95, 12753–12758, https://doi.org/10.1073/pnas.95.22.12753, 1998.
Hatzianastassiou, N., Gkikas, A., Mihalopoulos, N., Torres, O., and Katsoulis, B. D.: Natural versus anthropogenic aerosols in the eastern Mediterranean basin derived from multiyear TOMS and MODIS satellite data, J. Geophys. Res.-Atmos., 114, https://doi.org/10.1029/2009JD011982, 2009.
Holben, B. N., Eck, T. F., Slutsker, I., Tanré, D., Buis, J. P., Setzer, A., Vermote, E., Reagan, J. A., Kaufman, Y. J., Nakajima, T., Lavenu, F., Jankowiak, I., and Smirnov, A.: AERONET – A Federated Instrument Network and Data Archive for Aerosol Characterization, Remote Sens. Environ., 66, 1–16, https://doi.org/10.1016/S0034-4257(98)00031-5, 1998.
Holben, B. N., Tanre, D., Smirnov, A., Eck, T. F., Slutsker, I., Abuhassan, N., Newcomb, W. W., Schafer, J., Chatenet, B., Lavenue, F., Kaufman, Y., Vande Castle, J., Setzer, A., Markham, B., Clark, D., Frouin, R., Halthore, R., Karnieli, A., O'Neill, N. T., Pietras, C., Pinker, R. T., Voss, K., and Zibordi, G.: An emerging ground-based aerosol climatology: Aerosol optical depth from AERONET, J. Geophys. Res., 106, 12067–12097, https://doi.org/10.1029/2001JD900014, 2001.
Kaskaoutis, D. G., Dumka, U. C., Rashki, A., Psiloglou, B. E., Gavriil, A., Mofidi, A., Petrinoli, K., Karagiannis, D., and Kambezidis, H. D.: Analysis of intense dust storms over the eastern Mediterranean in March 2018: Impact on radiative forcing and Athens air quality, Atmos. Environ., 209, 23–39, https://doi.org/10.1016/j.atmosenv.2019.04.025, 2019.
Kazadzis, S., Raptis, P., Kouremeti, N., Amiridis, V., Arola, A., Gerasopoulos, E., and Schuster, G. L.: Aerosol absorption retrieval at ultraviolet wavelengths in a complex environment, Atmos. Meas. Tech., 9, 5997–6011, https://doi.org/10.5194/amt-9-5997-2016, 2016.
Kok, J. F., Storelvmo, T., Karydis, V. A., Adebiyi, A. A., Mahowald, N. M., Evan, A. T., He, C., and Leung, D. M.: Mineral dust aerosol impacts on global climate and climate change, Nat. Rev. Earth Environ., 4, 71–86, https://doi.org/10.1038/s43017-022-00379-5, 2023.
Kosmopoulos, P., Kazadzis, S., El-Askary, H., Taylor, M., Gkikas, A., Proestakis, E., Kontoes, C., and El-Khayat, M.: Earth-Observation-Based Estimation and Forecasting of Particulate Matter Impact on Solar Energy in Egypt, Remote Sens., 10, 1870, https://doi.org/10.3390/rs10121870, 2018.
Kosmopoulos, P. G., Kazadzis, S., Taylor, M., Athanasopoulou, E., Speyer, O., Raptis, P. I., Marinou, E., Proestakis, E., Solomos, S., Gerasopoulos, E., Amiridis, V., Bais, A., and Kontoes, C.: Dust impact on surface solar irradiance assessed with model simulations, satellite observations and ground-based measurements, Atmos. Meas. Tech., 10, 2435–2453, https://doi.org/10.5194/amt-10-2435-2017, 2017.
Kurucz, R. L., Rabin, D. M., and Jefferies, J. T.: Synthetic infrared spectra, in: Proceedings of the IAU Symposium on Infrared Solar Physics, Norwell, MA, USA, 2–5 March 1992, Kluwer Academic, ISBN 9789401119269, 1992.
Levelt, P. F., Joiner, J., Tamminen, J., Veefkind, J. P., Bhartia, P. K., Stein Zweers, D. C., Duncan, B. N., Streets, D. G., Eskes, H., van der A, R., McLinden, C., Fioletov, V., Carn, S., de Laat, J., DeLand, M., Marchenko, S., McPeters, R., Ziemke, J., Fu, D., Liu, X., Pickering, K., Apituley, A., González Abad, G., Arola, A., Boersma, F., Chan Miller, C., Chance, K., de Graaf, M., Hakkarainen, J., Hassinen, S., Ialongo, I., Kleipool, Q., Krotkov, N., Li, C., Lamsal, L., Newman, P., Nowlan, C., Suleiman, R., Tilstra, L. G., Torres, O., Wang, H., and Wargan, K.: The Ozone Monitoring Instrument: overview of 14 years in space, Atmos. Chem. Phys., 18, 5699–5745, https://doi.org/10.5194/acp-18-5699-2018, 2018.
Logothetis, S.-A., Salamalikis, V., and Kazantzidis, A.: Aerosol classification in Europe, Middle East, North Africa and Arabian Peninsula based on AERONET Version 3, Atmos. Res., 239, 104893, https://doi.org/10.1016/j.atmosres.2020.104893, 2020.
Logothetis, S.-A., Salamalikis, V., Gkikas, A., Kazadzis, S., Amiridis, V., and Kazantzidis, A.: 15-year variability of desert dust optical depth on global and regional scales, Atmos. Chem. Phys., 21, 16499–16529, https://doi.org/10.5194/acp-21-16499-2021, 2021.
Mahowald, N. M., Kloster, S., Engelstaedter, S., Moore, J. K., Mukhopadhyay, S., McConnell, J. R., Albani, S., Doney, S. C., Bhattacharya, A., Curran, M. A. J., Flanner, M. G., Hoffman, F. M., Lawrence, D. M., Lindsay, K., Mayewski, P. A., Neff, J., Rothenberg, D., Thomas, E., Thornton, P. E., and Zender, C. S.: Observed 20th century desert dust variability: impact on climate and biogeochemistry, Atmos. Chem. Phys., 10, 10875–10893, https://doi.org/10.5194/acp-10-10875-2010, 2010.
Mamouri, R. E. and Ansmann, A.: Fine and coarse dust separation with polarization lidar, Atmos. Meas. Tech., 7, 3717–3735, https://doi.org/10.5194/amt-7-3717-2014, 2014.
Mamouri, R.-E. and Ansmann, A.: Potential of polarization/Raman lidar to separate fine dust, coarse dust, maritime, and anthropogenic aerosol profiles, Atmos. Meas. Tech., 10, 3403–3427, https://doi.org/10.5194/amt-10-3403-2017, 2017.
Mamouri, R.-E., Ansmann, A., Nisantzi, A., Solomos, S., Kallos, G., and Hadjimitsis, D. G.: Extreme dust storm over the eastern Mediterranean in September 2015: satellite, lidar, and surface observations in the Cyprus region, Atmos. Chem. Phys., 16, 13711–13724, https://doi.org/10.5194/acp-16-13711-2016, 2016.
Mamouri, R.-E., Ansmann, A., Ohneiser, K., Knopf, D. A., Nisantzi, A., Bühl, J., Engelmann, R., Skupin, A., Seifert, P., Baars, H., Ene, D., Wandinger, U., and Hadjimitsis, D.: Wildfire smoke triggers cirrus formation: lidar observations over the eastern Mediterranean, Atmos. Chem. Phys., 23, 14097–14114, https://doi.org/10.5194/acp-23-14097-2023, 2023.
Mamouri, R.-E., Nisantzi, A., Savva, A., Poutli, M., Baars, H., Ansmann, A., Ene, D., and Hadjimitsis, D.: Aerosol layers characterization in the Eastern Mediterranean: Long-term lidar observations over Limassol, Cyprus, EPJ Web Conf., 362, 02016, https://doi.org/10.1051/epjconf/202636202016, 2026.
Mateos, D., Antón, M., Toledano, C., Cachorro, V. E., Alados-Arboledas, L., Sorribas, M., Costa, M. J., and Baldasano, J. M.: Aerosol radiative effects in the ultraviolet, visible, and near-infrared spectral ranges using long-term aerosol data series over the Iberian Peninsula, Atmos. Chem. Phys., 14, 13497–13514, https://doi.org/10.5194/acp-14-13497-2014, 2014.
Mayer, B. and Kylling, A.: Technical note: The libRadtran software package for radiative transfer calculations – description and examples of use, Atmos. Chem. Phys., 5, 1855–1877, https://doi.org/10.5194/acp-5-1855-2005, 2005.
Meloni, D., di Sarra, A., Brogniez, G., Denjean, C., De Silvestri, L., Di Iorio, T., Formenti, P., Gómez-Amo, J. L., Gröbner, J., Kouremeti, N., Liuzzi, G., Mallet, M., Pace, G., and Sferlazzo, D. M.: Determining the infrared radiative effects of Saharan dust: a radiative transfer modelling study based on vertically resolved measurements at Lampedusa, Atmos. Chem. Phys., 18, 4377–4401, https://doi.org/10.5194/acp-18-4377-2018, 2018.
Miller, R. L., Knippertz, P., Pérez García-Pando, C., Perlwitz, J. P., and Tegen, I.: Impact of Dust Radiative Forcing upon Climate, in: Mineral Dust, Springer Netherlands, 327–357, https://doi.org/10.1007/978-94-017-8978-3_13, 2014.
Moulin, C., Lambert, C. E., Dayan, U., Masson, V., Ramonet, M., Bousquet, P., Legrand, M., Balkanski, Y. J., Guelle, W., Marticorena, B., Bergametti, G., and Dulac, F.: Satellite climatology of African dust transport in the Mediterranean atmosphere, J. Geophys. Res.-Atmos., 103, 13137–13144, https://doi.org/10.1029/98JD00171, 1998.
Moustaka, A., Korras-Carraca, M.-B., Papachristopoulou, K., Fountoulakis, I., Kazadzis, S., Proestakis, E., Amiridis, V., Tourpali, K., and Gkikas, A.: Assessment of Cloud-Aerosol Lidar with Orthogonal Polarization–Cloud-Aerosol Lidar and Infrared Pathfinder Satellite Observations Retrievals towards Estimating the Aerosol Direct Impact on the Shortwave Radiation Budgets in North Africa, Europe, and the Middle East, 16th International Conference on Meteorology, Climatology and Atmospheric Physics – COMECAP 2023, 139, https://doi.org/10.3390/environsciproc2023026139, 2023.
Moustaka, A., Korras-Carraca, M.-B., Papachristopoulou, K., Stamatis, M., Fountoulakis, I., Kazadzis, S., Proestakis, E., Amiridis, V., Tourpali, K., Georgiou, T., Solomos, S., Spyrou, C., Zerefos, C., and Gkikas, A.: Assessing Lidar Ratio Impact on CALIPSO Retrievals Utilized for the Estimation of Aerosol SW Radiative Effects across North Africa, the Middle East, and Europe, Remote Sens., 16, 1689, https://doi.org/10.3390/rs16101689, 2024.
Moustaka, A., Siomos, N., Kazadzis, S., Proestakis, E., Voudouri, K. A., Lopatin, A., Dubovik, O., Tourpali, K., Zerefos, C., Amiridis, V., and Gkikas, A.: Enhancing dust aerosols monitoring capabilities across North Africa and the Middle East using the A-Train satellite constellation, Atmos. Meas. Tech., 19, 1201–1225, https://doi.org/10.5194/amt-19-1201-2026, 2026.
Napoli, A., Desbiolles, F., Parodi, A., and Pasquero, C.: Aerosol indirect effects in complex-orography areas: a numerical study over the Great Alpine Region, Atmos. Chem. Phys., 22, 3901–3909, https://doi.org/10.5194/acp-22-3901-2022, 2022.
Nisantzi, A., Mamouri, R. E., Ansmann, A., Schuster, G. L., and Hadjimitsis, D. G.: Middle East versus Saharan dust extinction-to-backscatter ratios, Atmos. Chem. Phys., 15, 7071–7084, https://doi.org/10.5194/acp-15-7071-2015, 2015.
Osipov, S., Chowdhury, S., Crowley, J. N., Tadic, I., Drewnick, F., Borrmann, S., Eger, P., Fachinger, F., Fischer, H., Predybaylo, E., Fnais, M., Harder, H., Pikridas, M., Vouterakos, P., Pozzer, A., Sciare, J., Ukhov, A., Stenchikov, G. L., Williams, J., and Lelieveld, J.: Severe atmospheric pollution in the Middle East is attributable to anthropogenic sources, Commun. Earth Environ., 3, 203, https://doi.org/10.1038/s43247-022-00514-6, 2022.
Papachristopoulou, K., Fountoulakis, I., Gkikas, A., Kosmopoulos, P. G., Nastos, P. T., Hatzaki, M., and Kazadzis, S.: 15-Year Analysis of Direct Effects of Total and Dust Aerosols in Solar Radiation/Energy over the Mediterranean Basin, Remote Sens., 14, 1535, https://doi.org/10.3390/rs14071535, 2022.
Peletidou, G., Papetta, A., Kezoudi, M., Alvanou, P., Balis, D., and Marenco, F.: Lidar, Ceilometer and Drone-Borne Aerosol Profiling during the EVIAN 2022 Campaign in Cyprus, COMECAP 2023, 38, https://doi.org/10.3390/environsciproc2023026038, 2023.
Pikridas, M., Vrekoussis, M., Sciare, J., Kleanthous, S., Vasiliadou, E., Kizas, C., Savvides, C., and Mihalopoulos, N.: Spatial and temporal (short and long-term) variability of submicron, fine and sub-10 µm particulate matter (PM1, PM2.5, PM10) in Cyprus, Atmos. Environ., 191, 79–93, https://doi.org/10.1016/j.atmosenv.2018.07.048, 2018.
Proestakis, E., Gkikas, A., Georgiou, T., Kampouri, A., Drakaki, E., Ryder, C. L., Marenco, F., Marinou, E., and Amiridis, V.: A near-global multiyear climate data record of the fine-mode and coarse-mode components of atmospheric pure dust, Atmos. Meas. Tech., 17, 3625–3667, https://doi.org/10.5194/amt-17-3625-2024, 2024.
Rajeev, K. and Ramanathan, V.: Direct observations of clear-sky aerosol radiative forcing from space during the Indian Ocean Experiment, J. Geophys. Res.-Atmos., 106, 17221–17235, https://doi.org/10.1029/2000JD900723, 2001.
Rogozovsky, I., Ansmann, A., Baars, H., Engelmann, R., and Chudnovsky, A.: The challenge of identifying dust events in a highly polluted Eastern Mediterranean region, Sci. Total Environ., 953, 175920, https://doi.org/10.1016/j.scitotenv.2024.175920, 2024.
Rolph, G., Stein, A., and Stunder, B.: Real-time Environmental Applications and Display sYstem: READY, Environ. Model. Softw., 95, 210–228, https://doi.org/10.1016/j.envsoft.2017.06.025, 2017.
Satheesh, S. K.: Letter to the Editor – Aerosol radiative forcing over land: effect of surface and cloud reflection, Ann. Geophys., 20, 2105–2109, https://doi.org/10.5194/angeo-20-2105-2002, 2002.
Sekiguchi, M., Nakajima, T., Suzuki, K., Kawamoto, K., Higurashi, A., Rosenfeld, D., Sano, I., and Mukai, S.: A study of the direct and indirect effects of aerosols using global satellite data sets of aerosol and cloud parameters, J. Geophys. Res.-Atmos., 108, https://doi.org/10.1029/2002JD003359, 2003.
Shettle, E. P.: Models of aerosols, clouds and precipitation for atmospheric propagation studies, paper presented at Conference on Atmospheric Propagation in the UV, Visible, IR and MM-Region and Related System Aspects, NATOAdv. Group for Aerosp. Res. and Dev., Copenhagen, https://www.researchgate.net/publication/234312286_Models_of_aerosols_clouds_and_precipitation_for_atmospheric_propagation_studies (last access 1 September 2026), 1989.
Sinyuk, A., Holben, B. N., Eck, T. F., Giles, D. M., Slutsker, I., Korkin, S., Schafer, J. S., Smirnov, A., Sorokin, M., and Lyapustin, A.: The AERONET Version 3 aerosol retrieval algorithm, associated uncertainties and comparisons to Version 2, Atmos. Meas. Tech., 13, 3375–3411, https://doi.org/10.5194/amt-13-3375-2020, 2020.
Sokolik, I. N., Winker, D. M., Bergametti, G., Gillette, D. A., Carmichael, G., Kaufman, Y. J., Gomes, L., Schuetz, L., and Penner, J. E.: Introduction to special section: Outstanding problems in quantifying the radiative impacts of mineral dust, J. Geophys. Res.-Atmos., 106, 18015–18027, https://doi.org/10.1029/2000JD900498, 2001.
Stamnes, K., Tsay, S.-C., Wiscombe, W., and Jayaweera, K.: Numerically stable algorithm for discrete-ordinate-method radiative transfer in multiple scattering and emitting layered media, Appl. Optics, 27, 2502, https://doi.org/10.1364/AO.27.002502, 1988.
Stamnes, K., Tsay, S.-C., Wiscombe, W., and Laszlo, I.: DISORT, a General-Purpose Fortran Program for Discrete-Ordinate-Method Radiative Transfer in Scattering and Emitting Layered Media, in: Documentation of Methodology, Tech. rep., Dept. of Physics and Engineering Physics, Stevens Institute of Technology, Hoboken, NJ 07030, https://www.libradtran.org/lib/exe/fetch.php?media=disortreport1.1.pdf (last access: 1 September 2026), 2000.
Stein, A. F., Draxler, R. R., Rolph, G. D., Stunder, B. J. B., Cohen, M. D., and Ngan, F.: NOAA's HYSPLIT Atmospheric Transport and Dispersion Modeling System, B. Am. Meteorol. Soc., 96, 2059–2077, https://doi.org/10.1175/BAMS-D-14-00110.1, 2015.
Su, L., Yuan, Z., Fung, J. C. H., and Lau, A. K. H.: A comparison of HYSPLIT backward trajectories generated from two GDAS datasets, Sci. Total Environ., 506–507, 527–537, https://doi.org/10.1016/j.scitotenv.2014.11.072, 2015.
Teri, M., Gasteiger, J., Heimerl, K., Dollner, M., Schöberl, M., Seibert, P., Tipka, A., Müller, T., Aryasree, S., Kandler, K., and Weinzierl, B.: Pollution affects Arabian and Saharan dust optical properties in the eastern Mediterranean, Atmos. Chem. Phys., 25, 6633–6662, https://doi.org/10.5194/acp-25-6633-2025, 2025.
Theocharidis, C., Eliades, M., Kolokoussis, P., Miltiadou, M., Danezis, C., Gitas, I., Kontoes, C., and Hadjimitsis, D.: Exploring Sentinel-1 Radar Polarisation and Landsat Series Data to Detect Forest Disturbance from Dust Events: A Case Study of the Paphos Forest in Cyprus, Remote Sens., 17, 876, https://doi.org/10.3390/rs17050876, 2025.
Tian, L., Chen, L., Zhang, P., and Bi, L.: Estimating radiative forcing efficiency of dust aerosol based on direct satellite observations: case studies over the Sahara and Taklimakan Desert, Atmos. Chem. Phys., 21, 11669–11687, https://doi.org/10.5194/acp-21-11669-2021, 2021.
Ukhov, A., Mostamandi, S., da Silva, A., Flemming, J., Alshehri, Y., Shevchenko, I., and Stenchikov, G.: Assessment of natural and anthropogenic aerosol air pollution in the Middle East using MERRA-2, CAMS data assimilation products, and high-resolution WRF-Chem model simulations, Atmos. Chem. Phys., 20, 9281–9310, https://doi.org/10.5194/acp-20-9281-2020, 2020.
Valenzuela, A., Olmo, F. J., Lyamani, H., Antón, M., Quirantes, A., and Alados-Arboledas, L.: Aerosol radiative forcing during African desert dust events (2005–2010) over Southeastern Spain, Atmos. Chem. Phys., 12, 10331–10351, https://doi.org/10.5194/acp-12-10331-2012, 2012.
- Abstract
- Introduction
- Area, Instrumentation and Methodology
- Results and Discussion
- Comparison with other studies
- Conclusions
- Appendix A: Glossary Table
- Data availability
- Author contributions
- Competing interests
- Disclaimer
- Special issue statement
- Acknowledgements
- Financial support
- Review statement
- References
- Supplement
- Abstract
- Introduction
- Area, Instrumentation and Methodology
- Results and Discussion
- Comparison with other studies
- Conclusions
- Appendix A: Glossary Table
- Data availability
- Author contributions
- Competing interests
- Disclaimer
- Special issue statement
- Acknowledgements
- Financial support
- Review statement
- References
- Supplement